Highlights
- What are the main findings?
- Standard emissivity algorithms are inaccurate over low-emissivity surfaces such as metal roofs.
- Applying actual emissivity values for metal roofs in Land Surface Tempera-ture (LST) retrieval yields significantly higher land surface temperature esti-mates.
- What is the implication of the main finding?
- Landsat and ECOSTRESS LST products for indigenous cities with extensive metallic roofing appear misleadingly low.
- There is a need to adjust satellite LST algorithms to properly account for metal roof emissivity.
Abstract
The increased reliance on thermal satellite images for urban climatic analysis requires robust temperature retrievals for urban surfaces. As the emissivity of any surface type determines the amount of thermal radiation received by a sensor, accurate emissivity values of reflecting surfaces are important in Land Surface Temperature (LST) computations. It is known that the commonly used Temperature Emissivity Separation (TES) algorithm is inaccurate over low-emissivity surfaces such as desert sand and metallic surfaces. However, in indigenous cities, much of the satellite ‘seen’ surface consists of metallic roofing materials like corrugated iron or aluminum. This study uses 853 ECOSTRESS images to examine the diurnal and seasonal pattern of LST for five indigenous cities in sub-Saharan Africa. Surface Urban Cool Islands (SUCIs) were observed in all five cities during both summer and winter, which were more pronounced during daytime than at night. This conflicts with air temperature data and published reports, as well as the dominant low-rise urban morphology, which would suggest the occurrence of Surface Urban Heat Islands (SUHIs). The influence of emissivity on urban LST was examined by allocating more realistic emissivity values to metallic surfaces. For a Landsat image, LST values for the urban area increased from 41 °C to 44, 46, and 49 °C when metallic surfaces were allocated emissivity values of 0.96, 0.83, 0.74, and 0.63, respectively, and SUHIs, rather than SUCIs, were observed. Similar results were obtained for an ECOSTRESS image. As increasing summer temperatures cause significant morbidity and mortality in the populations of these cities, accurate urban climatic data are essential.
1. Introduction
Due to accelerated urbanization worldwide, the need to include urban areas in global climate models (GCMs) has been recognized by the Intergovernmental Panel on Climate Change (IPCC) in its Sixth Assessment Report [1]. GCMs often rely on a combination of in situ ground station data and satellite data, including thermal infrared satellite sensors, such as the Advanced Spaceborne Thermal Emission and Reflection Radiometer (ASTER), Landsat, Moderate Resolution Imaging Spectrometer (MODIS), and, more recently, the ECOsystem Spaceborne Thermal Radiometer Experiment on Space Station (ECOSTRESS). However, many indigenous cities are located in parts of the world where ground-based climate monitoring stations are usually either non-existent or grossly inadequate. Therefore, in these areas of the world, outputs from climate reanalysis models tend to be less reliable [2] and thermal infrared satellite sensors have become the main source for urban climatic assessment. Retrieving accurate Land Surface Temperature (LST) values is dependent on the realistic calibration of the upwelling radiance values received at the top of the atmosphere in conjunction with accurate atmospheric and emissivity corrections. Emissivity is important because the amount of thermal radiation emitted from an object depends on the emissivity of the object’s surface. Emissivity is defined as the ratio of the energy radiated from a material’s surface to that radiated from a perfect emitter known as a blackbody at the same temperature and wavelength and under the same viewing conditions. It is a dimensionless number between 0 (for a perfect reflector) and 1 (for a perfect emitter). The emissivity of a surface depends not only on the material but also on the condition of the surface. For example, a clean and polished metal surface will have a low emissivity, whereas a roughened and oxidized metal surface will have a higher emissivity. When viewing more reflective surfaces, which have a lower emissivity, less radiation will be received by the sensor than from a blackbody at the same temperature; so, the surface will appear colder than it actually is, unless the thermometer reading is adjusted to account for the surface emissivity of the material.
The most commonly used thermal infrared satellite sensors derive surface emissivity values from the ASTER Temperature Emissivity Separation (TES) algorithm [3,4], which ratios the five thermal bands of ASTER. The values are available in the ASTER Global Emissivity Database (GED) at 100 m resolution. When emissivity values are missing, the sensor is unable to retrieve the LST, indeed the Landsat Level 2 LST product has few retrievals for the central Sahara Desert due to a lack of emissivity data. Zhou et al. [5] indicate that MODIS emissivities over desert surfaces are too high, leading to a cold bias in MODIS LST. This is because the TES algorithm is said to be inaccurate for low-emissivity surfaces below 0.9 [3]. Quartz in desert sand grains is similar to metal surfaces in terms of their low emissivity values. Although the TES algorithm has undergone rigorous testing [6,7], test sites do not include man-made metallic surfaces, as they are generally below the resolution of the sensors.
There have been several reports in the literature that emissivity values of urban surfaces have been under- or over-estimated, leading to inaccurate urban surface temperature derivations from thermal infrared satellite sensors. The Community Earth System Model (CESM), one of the few global climate models that incorporate urban areas, has reported large underestimation of surface emissivities by building energy models when compared to MODIS LST [8]. Thus, CESM model LST outputs show high bias compared to MODIS. On the other hand, in the case of high-rise cities, true temperatures are actually lower than satellite LSTs because satellites view the surface from above; therefore, the extra emitted radiation from ‘hidden’ vertical surfaces is missed [9]. The complete radiating urban surface includes both ‘mostly seen’ horizontal and ‘mostly hidden’ vertical surfaces, but radiation is emitted from both. However, in indigenous cities, which are mainly low-rise and spatially extensive [10], most of the radiating urban surface can be ‘seen’ from a satellite viewpoint.
In the few climate studies of indigenous cities available in the literature, Offerele et al. [11], using ‘in situ’ surface temperatures in Ougadougou, observed a large daytime urban heat island (UHI), which increased with increasing urbanization. The authors noted that the observed daytime UHI did not support thermal satellite data, which indicated a daytime Urban Cool Island (UCI). In Kano, Usman et al. [12] reported a summer daytime UHI based on ground station air temperatures while observing a UCI based on MODIS and ASTER LST data. In Khartoum, air temperatures indicate a daytime UHI for all seasons [13], but Lazzarini et al. [14] reported a daytime UCI in Khartoum based on MODIS images. In high-rise cities with deep urban canyons, which are shaded during the day, daytime UCIs are explained by the low sky view factor [9,15,16,17] or by areas of managed urban vegetation in planned cities [14]. However, these indigenous cities of Africa are generally low-rise and sparsely vegetated within the densely packed network of the informal settlements; thus, UCIs may not be expected.
A possible explanation for the apparent mismatch between satellite-derived LSTs, on the one hand, and both model and local climatic data, on the other hand, is the emissivity correction step in LST products. While the average emissivity values of most urban surfaces are relatively high, with values above 0.9 [18,19], domestic homes in many developing countries use metallic sheeting as the roofing material, which has low emissivity. Metal roofing performs well in hot climates as it is reflective; therefore, it can deflect a significant portion of the sun’s rays, keeping homes cooler. In Nigeria, for example, the most common roofing material for residential homes is corrugated iron or steel sheet, followed by aluminum, which is often galvanized or anodized [20]. Industrial buildings and warehouses typically use galvanized sheets of aluminum or steel. In Ougadougou and Mali, roofs are almost exclusively corrugated steel [11]. Emissivity values for metallic surfaces vary according to the level of oxidation and weathering, as well as dust, which increase the surface roughness, thereby reducing reflectance and increasing the emissivity. Galvanizing, which makes the metal less shiny, also decreases the reflectivity, thereby increasing the emissivity, but only up to approximately 0.74, which is similar to that of oxidized iron. Therefore, even after treatment, the emissivity of these materials is low, compared to other man-made or natural surfaces. Table 1 gives the emissivity values, derived from various sources, for the most common roofing materials used in residential and industrial buildings in many developing countries and includes some consideration of the treatment and condition of the materials.
Therefore, this study examines the apparent daytime surface cool islands of five indigenous cities in the semi-arid zone of Africa as case studies by:
- (1)
- Examining the diurnal and seasonal characteristics of LST values between urban and rural areas in five African cities using ECOSTRESS images,
- (2)
- Evaluating the allocated emissivity values in LST retrieval of the urban areas by varying the emissivity values of the main types of metallic roofing materials used, and
- (3)
- Comparing the mean urban LST values resulting from each varied emissivity level with rural values.
This study is especially important given that high summer temperatures in these cities can cause significant morbidity and mortality in the population [21,22], and in view of the paucity of local climatic data, it is essential to ensure accurate LST estimates.

Table 1.
Emissivity values for metallic surfaces from different sources.
Table 1.
Emissivity values for metallic surfaces from different sources.
| Source | ECOSTRESS | OMEGA | ET | Average |
|---|---|---|---|---|
| Iron | 0.05 | |||
| Oxidized Iron | 0.74 | |||
| Rusted Iron | 0.65 | |||
| Aluminum | 0.05 | 0.04 | 0.05 | |
| Oxidized Aluminum | 0.19 | |||
| Anodized Aluminum | 0.77 | |||
| Steel | 0.08 | |||
| Galvanized Steel | 0.88, 0.95, 0.63 | 0.83 | ||
| Oxidized Steel | 0.82, 0.88 | 0.80 | 0.83 |
Sources: ECOSTRESS Spectral Library [18], OMEGA Materials Inc. [23], and Engineering Toolbox (ET) [24].
2. Materials and Methods
2.1. Study Area
This study examines the urban climates of five cities in the semi-arid zone of Africa: Kano (Nigeria), Ougadougou (Burkina Faso), Khartoum (Sudan), Niamey (Niger), and Bamako (Mali) (Figure 1). Four of these are capital cities, and Kano is the second largest city in Nigeria. Khartoum falls within the Koppen/Geiger climatic classification of hot arid desert, and the others fall within the classification of hot arid steppe. All are characterized by a seasonal climate, with distinct hot moist summers and cool dry winters. Access to electricity in all five cities is low, with frequent power outages during hot weather, especially during heat waves, which are expected to increase [25]. The International Panel on Climate Change (IPCC), in its Sixth Assessment Report [1], predicts that under mid- and high-emission scenarios, summer temperatures in West Africa will increase by 2 °C and 5 °C, respectively, by the end of the century. In East Africa, under the lowest warming scenario of +1.5 °C, children born in 2020 are likely to be exposed to 3–5 times more heat waves in their lifetimes compared to those born in 1960. The greatest impacts of these projections are expected in densely urbanized cities, such as those covered in this study.
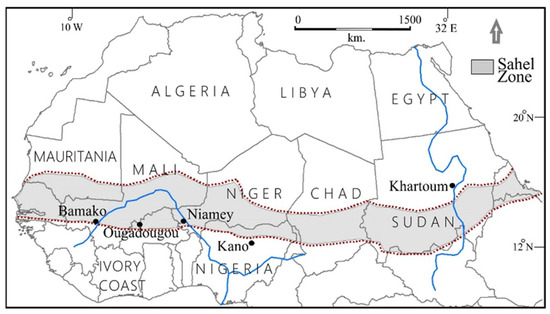
Figure 1.
Location of five cities in the semi-arid zone of Africa. Blue line indicates major rivers.
All five cities have undergone dramatic population growth and urbanization in recent decades, which is expected to continue (Table 2), in line with trends across Africa [26,27]. Kano and Khartoum, in particular, are expected to approach 7 and 10 million people, respectively, by 2035. The large physical size and compact near-circular shape of all five cities may subject them to amplified heat island intensity, as reported for cities in North America [28] and Europe [29]. In Kano, during the hot season of March 2024, Northern Nigeria experienced a temperature anomaly above +10 °C, and in May 2024, air temperatures of 43–45 °C were reported in Kano [30]. During the same period, Nigeria’s national electricity grid collapsed several times, resulting in a total blackout [31]. The same heat wave across the African Sahel saw a surge in hospital admissions and deaths in Bamako, and a similar situation was experienced in Ougadougou [32]. The most spatially extensive land use type in these five cities is residential, consisting of sprawling unplanned and high-density dwellings, narrow unsurfaced streets, and few street trees or other vegetation. Figure 2 shows a typical residential scene from Google Earth, where 91% of the area is occupied by residential buildings, and the roofing materials are almost exclusively metallic.
Table 2.
Population data for the five studied cities and summer daytime temperatures.
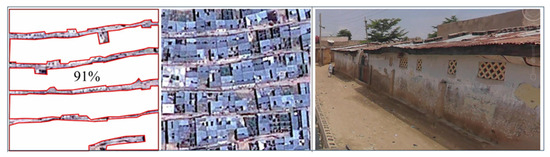
Figure 2.
Typical satellite view of residential suburbs in urban Kano, showing approximately 91% of the satellite ‘seen’ area occupied by metallic roofing, and a typical street view (Source: Google Earth).
2.2. Data
This study used imagery from the ECOsystem Spaceborne Thermal Radiometer on the International Space Station (ECOSTRESS). The mission by NASA-JPL was initiated on 3 July 2018, on the International Space Station (ISS) [7]. It includes five thermal infrared (TIR) bands ranging from 8 to 12 µm, centered around 8.29, 8.78, 9.20, 10.49, and 12.09 µm and an additional band at 1.6 µm for geolocation and cloud detection [34]. ECOSTRESS is a multispectral whiskbroom scanner, which scans at ±25° with a swath width of 384 km on the ground. Its original spatial resolution (69 × 38 m; 2 pixels in cross track and 1 pixel in down track) and revisit time of about 4–5 days delivers the highest spatiotemporal–spectral resolution thermal infrared (TIR) data from space, with significant improvements over existing thermal infrared missions from MODIS (1 km), Landsat (100 m), and ASTER (90 m) [35]. After calibration and resampling, the pixels are aggregated to square pixels of 70 × 70 m for the Level-1B radiance and higher-level products [36]. For this study, the ECOSTRESS Level 2 science product was downloaded from https://appeears.earthdatacloud.nasa.gov/ (accessed on 20 May 2025). It includes a Land Surface Temperature layer, five spectral emissivity bands, a broadband emissivity band with corresponding error bands, and a quality control layer for the LST and emissivity for masking high-quality LST data. For emissivity retrieval and correction, the L2 ECOSTRESS algorithm uses a physical Temperature Emissivity Separation (TES) algorithm, similar to that of the ASTER Global Emissivity Database (GED) [3,6,36], to retrieve the LST and emissivity bands simultaneously. A comprehensive evaluation of the accuracies of Level 1 and Level 2 ECOSTRESS LST and emissivities is given by Zhang et al. [37].
The ECOSTRESS LST images used in this study were selected after masking the cloudy pixels of each LST image with their corresponding cloud mask and quality control layers. Only the filtered LST images that covered more than 80% of the study area with good-quality pixels were considered, and LST images that covered a small of portion of the study area due to high cloud contamination and poor-quality pixels were removed. Further selection was made for images representing summer and winter, as well as day and night. Thus, to satisfy the objectives of this study, summer was recognized as the three hottest months, namely, March, April, and May, and winter was represented by the coldest months, namely, December and January. Nighttime and daytime were represented as 1 a.m. to 6 a.m. and 1 p.m. to 5 p.m., respectively. These criteria were established to coincide as much as possible with the sparse air temperature data available for these cities, consisting of only daily minima and maxima. Also, it was necessary to avoid the thermal crossover times between urban and rural areas, which most often occur a few hours after sunrise and a few hours after sunset. Given these considerations, other thermal sensors, such as ASTER, Landsat, and MODIS, would have been unable to provide enough images for statistical analysis. In total, the number of ECOSTRESS images used were 66 for Bamako, 182 for Kano, 157 for Khartoum, 229 for Niamey, and 219 for Ougadougou. Training areas representing ‘urban’ and ‘rural’ land cover were selected using Google Earth to extract the average value of LST for the subsequent calculation of urban heat island intensity for each city. Due to the distinctive low-rise and dense morphology of sub-Saharan cities, the urban–rural boundary in all five cities was distinct. Rural training areas were selected as being at least 1 km from any built structures, and at least 10 km from the urban boundary.
2.3. Emissivity Evaluation
LST values were examined for two thermal image end products: Landsat LST and ECOSTRESS LST. As emissivity values vary for different surface types, it was necessary to first obtain an accurate land cover map. Therefore, a PlanetScope image with 8 spectral bands and 3 m spatial resolution was used to obtain a land cover classification to identify metallic surfaces separately from other ‘urban’ types. A Planet image of Kano on 21st January 2024 was selected as a case study for the classification of land cover at different levels. For accurate mapping of metallic surfaces at the building scale in Kano city, polygons of building footprints from Google Open Buildings V3 data [38] and building heights from the Open Buildings 2.5D Temporal dataset [39] were used for the segmentation of building blocks in the PlanetScope image. In addition, the brightness values of 8 spectral bands of PlanetScope, different indices, such as the Blue Normalized Index (BNI) [40] (Equation (1)), Blueness Index (BI) [41] (Equation (2)), Normalized Difference Blue Building Index (NDBBI) (Equation (3)), and theEnhanced Blue Building Index (EBBI) [42] (Equation (4)), were calculated at the object level for the classification of blue and white metallic surfaces in the Random Forest classifier.
Blue, Green, and Red are spectral bands of PlanetScope.
For the other classes, a Random Forest classification was performed at a different hierarchical level in the classification process. Finally, six land cover classes, including two main types of metallic surface, i.e., blue metal and white metal, along with road/urban areas, vegetation, water, and bare ground, were obtained. For validation, 600 randomly selected accuracy points were overlaid on Google Earth, as the spatial resolution of both datasets was similar.
The Planet Scope land cover classified image was then used to examine different emissivity settings for a Landsat image of 25 September 2022 at 09.43 a.m. and a summer daytime ECOSTRESS image of 19 May 2024 at 2.46 p.m. For Landsat, as atmospheric and radiance data were available, Level 1 LST was used to obtain the Black Body Temperature (BBT) in Equations (5) and (6), followed by emissivity correction using corrected values for metallic surfaces (Table 1).
The Landsat Top-of-Atmosphere Level 1 image was processed to obtain LST using more realistic emissivity values for only the metallic surface cover type. The processing steps were as follows:
The Landsat Level 1 Top-of-Atmosphere Radiance (Lƛ) was converted to Surface-Leaving Radiance (SLR) by atmospheric correction using Equation (5).
where Lƛ is the Thermal Radiance received by the sensor, L↑ is the atmospheric upwelling radiance, L↓ is the atmospheric downwelling radiance, Ɛ represents the surface emissivity, and τ represents the atmospheric transmittance. These variables were downloaded as tif files, along with the Landsat Level 2 LST image.
Next, the SLR was converted to Brightness Temperature (Tb) using the Planck Function and constants K1 and K2 from the image metadata file, as follows:
Then, Tb was converted to LST (Ts) by correcting for surface emissivity using Equation (7), which was derived from the Stefan–Bolzmann Law, originally applicable to the radiant flux of blackbodies, but which can be modified to pertain to the total radiant flux of real materials that are grey bodies:
The final step of emissivity correction was performed by allocating the same emissivity values used in the Landsat LST product to all classes, except Metal Roofs, for which emissivity values were varied according to the values in Table 1. Therefore, the emissivity values allocated to the two main types of roofing materials were Ɛ = 0.65 and 0.74 for blue metal surfaces, based on the values of rusted iron and oxidized iron, and the emissivity value of 0.83 for white metal surfaces was based on the given values for galvanized/anodized aluminum (Table 1). These are thought to be conservatively high values as non-weathered iron and non-anodized or galvanized aluminum have much lower values. Also, conservatively high values of emissivity (Ɛ) were used due to the inability to collect ‘in situ’ emissivity measurements.
Finally, the average LST of the whole urban area was obtained for each emissivity setting. The urban boundary was digitized based on the Global Urban Polygons and Points Dataset (GUPPD) [43], with a spatial resolution of 1 km, and refined using Google Earth. The procedure of emissivity testing was also conducted for an ECOSTRESS LST image. However, as atmospheric and radiance data were unavailable but the emissivity band was available for ECOSTRESS, Equation (7) was inverted to obtain the Black Body Temperature (Tb) from LST (Ts), followed by allocating the experimental emissivity values, as shown in Equation (7), to obtain the corrected LST.
The methodology of this study is described in Figure 3.
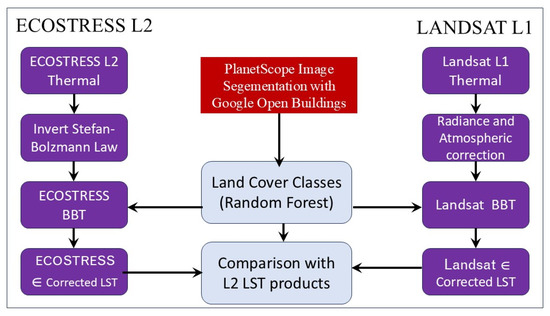
Figure 3.
Methodology of this study.
3. Results
3.1. Surface Urban Heat Islands and Cool Islands from ECOSTRESS LST
Table 3 shows the average daytime and nighttime Surface Urban Heat Island/Cool Island Intensity (SUHII)/(SUCII) for the five studied cities annually and seasonally. The number of images used in each case is given in brackets. All five cities exhibit daytime cool islands during both summer and winter, which is especially marked in summer, with a UCII of −7.2 °C for Bamako and −5.0 °C for Khartoum. In Kano, where a less pronounced summer daytime UCI of −2.5 °C is observed, only 3 out of 16 images examined showed UHIs. The nighttime SUCII is less intense than in the daytime, except for Niamey (with a nighttime SUCII of −5.1 °C in summer). The observed summertime daytime cool islands in all five cities suggest that urbanites are better protected during heat waves than ruralites during the daytime and also at night, except for Kano and Ougadougou, which exhibit a weak summer nighttime SUHI of 2.0 °C and 1.3 °C, respectively. However, the small amount of local air temperature data available from ground stations, as well as in published literature, indicate significant urban heat islands. For example, Table 4 compares daily maximum air temperatures for an urban and a rural station in Kano and shows that urban air temperatures are 9 °C higher than rural ones on average. Daytime air temperature heat islands have also been reported in Ougadougou [11] and Khartoum [13].
Table 3.
Mean and standard deviation of Heat Island/Cool Island Intensity (°C) annually and seasonally and for daytime (1–5 p.m.) and nighttime (1–6 a.m.). (n) Number of available ECOSTRESS images used.
Table 4.
Summer daily maximum air temperatures at rural (International Institute of Tropical Agriculture) and urban (Institute of Agricultural Research) Kano stations.
Figure 4a,b show ECOSTRESS images of Kano city during night and day, showing the typical spatial distribution of the nighttime heat island and daytime cool island, which generally decrease outward from the center. Figure 4c shows the emissivity values used in the ECOSTRESS LST computation of the daytime image (Figure 4b), where values of 0.95–0.98 were used for most of the urban area. As these values are much higher than given emissivity values for metallic surfaces (Table 1), which constitute the major roofing type in indigenous cities, the effects of varying the emissivity values are given in Section 3.2.
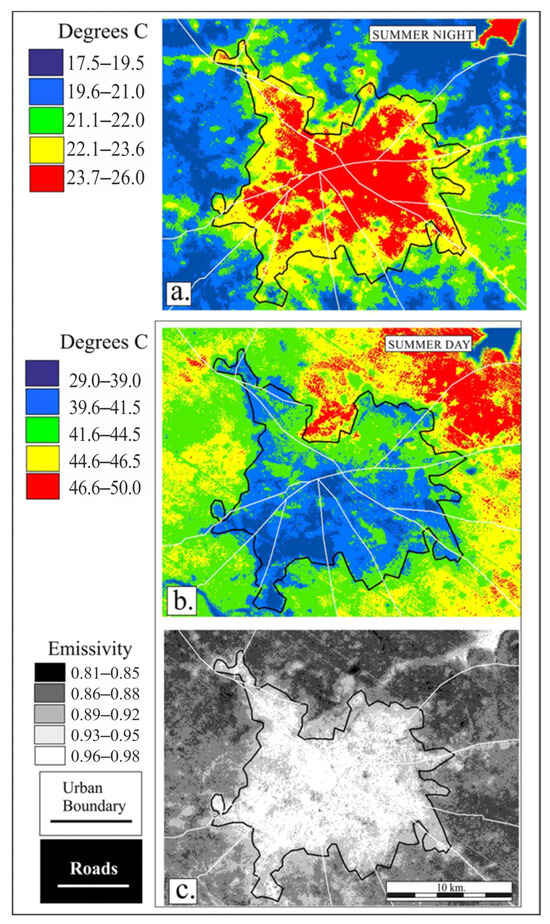
Figure 4.
ECOSTRESS images showing LST over the Kano urban area: (a) summer night (20 April 2024, 2.40 a.m.), (b) summer day (19 May 2024, 2.46 p.m.), and (c) ECOSTRESS emissivity band for (b).
3.2. Emissivity Evaluation
Figure 5 shows the classified PlanetScope image at 3 m resolution, showing the distribution of white and blue metallic surfaces across the city. The overall accuracy from 600 checkpoints generated by stratified random sampling was 83%. The user and consumer accuracies for each class are given in Table 5. For blue and white metallic surfaces, the consumer accuracies, i.e., errors of omission were 92.5 and 77.1% respectively, meaning that 7.5% of blue metallic surfaces and 22.9% of white metallic surfaces were not identified as such. Therefore, in the subsequent emissivity corrections in this study according to surface type, under-correction will have occurred for these surfaces.
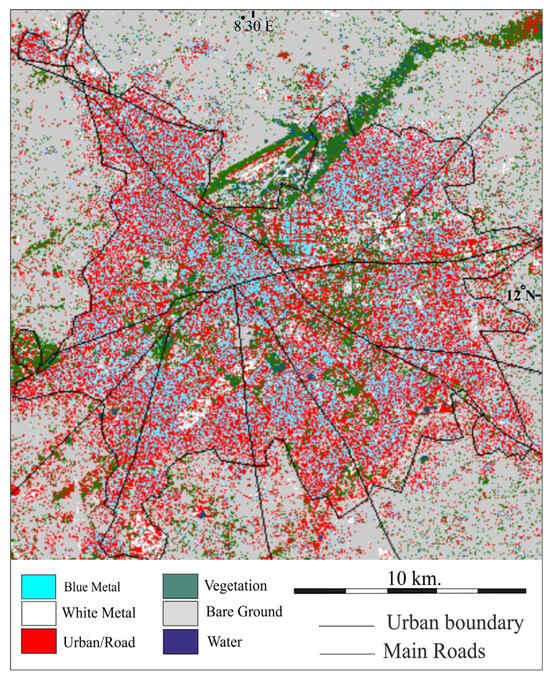
Figure 5.
Random Forest-classified land cover image of Kano city at 3 m resolution.
Table 5.
User and producer accuracies and percentage of area for 6 land cover/surface types.
Figure 6 shows the corresponding Landsat LST images using three different emissivity values in the emissivity correction step. Table 6 gives the corresponding mean LST for the whole urban area at each different emissivity setting. Using the emissivity value of 0.96 (Figure 6a) gave the same result as the Landsat Level 2 LST product, with a mean LST for the whole urban area of 40.3 °C and a similar value (39.8) for the Metal Roof class. The LST values for the urban area of 40.3 °C for the original Landsat LST increased to 44.5 °C, 47.3 °C, and 50.5 °C for the metallic surface emissivity settings of Ɛ = 0.83, 0.74, and 0.65, respectively (Figure 6b–d). Average temperatures of metallic surfaces increased from 40 °C to 59.5 °C from the lowest to the highest setting, with the average temperature of blue metal, which is the most widespread, reaching 63 °C. The three adjusted lower emissivity settings for metallic surfaces resulted in strong surface urban heat islands (Table 6) compared to the original Landsat LST product, where only a weak SUHI was observed, although the Landsat image time of 09.43 a.m. was well before the peak of daytime temperature.
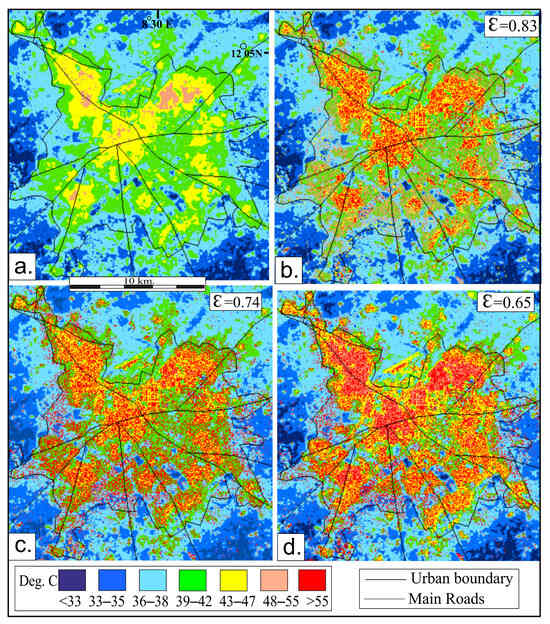
Figure 6.
Results for the Landsat thermal infrared image (LST in °C) which was used to allocate different emissivity values to the blue and white metal classes. (a) Same emissivity values as in Landsat LST product: (b) Ɛ = 0.83, (c) Ɛ = 0.74, and (d) Ɛ = 0.65. Image date: 25 September 2022. Image time: 09.43 a.m. The urban area is outlined in black polygon boundary.
Table 6.
Emissivity values allocated to metallic surfaces in the Landsat image and the resulting Landsat LST for the whole urban area of Kano city, as well as the resulting average LST values of metallic surfaces.
Figure 7 shows a summer daytime ECOSTRESS LST image of 18 May 2024 at 2.46 p.m., which is approximately the hottest time of day during the hot season. Varied emissivity values were applied. Figure 7a is the original ECOSTRESS LST product, which used an emissivity value of 0.96 for metallic surfaces, for which a weak SUHI of 0.1 °C was observed (Table 7). Figure 7b–d, represent ECOSTRESS LST values computed using emissivity values of Ɛ = 0.83, 0.74, and 0.65, respectively. The LST value of 39.4 °C for the urban area in the original ECOSTRESS LST increased to 43.7 °C, 46.5 °C, and 49.7 °C for the lower emissivity settings of Ɛ = 0.83, 0.74, and 0.65, respectively. This means that SUHIs of 4 °C, 7 °C, and 10 °C were observed with Ɛ = 0.83, 0.74, and 0.65, respectively, for metallic surfaces (Table 7).
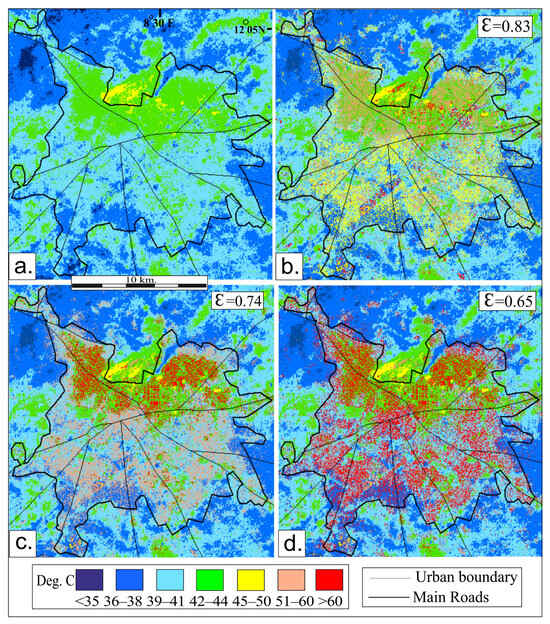
Figure 7.
ECOSTRESS LST image of 18 May 2024 at 2.46 p.m. with different emissivity settings for the blue and white metal classes: (a) Ɛ = 0.96, (b) Ɛ = 0.83, (c) Ɛ = 0.74, and (d) Ɛ = 0.65.
Table 7.
Emissivity values allocated to metallic surfaces in ECOSTRESS image and the resulting ECOSTRESS LST values for the whole urban area of Kano city, as well as the resulting average values for metallic surfaces.
Industrial areas with a large expanse of metallic roofing usually stand out as cool areas on satellite LST product images (Figure 8). This is surprising as they correspond to LCZ Type 6 (Open Low-Rise), which usually constitutes urban hotspots during the day [9,44] due to the lack of shading and a high sky view factor.
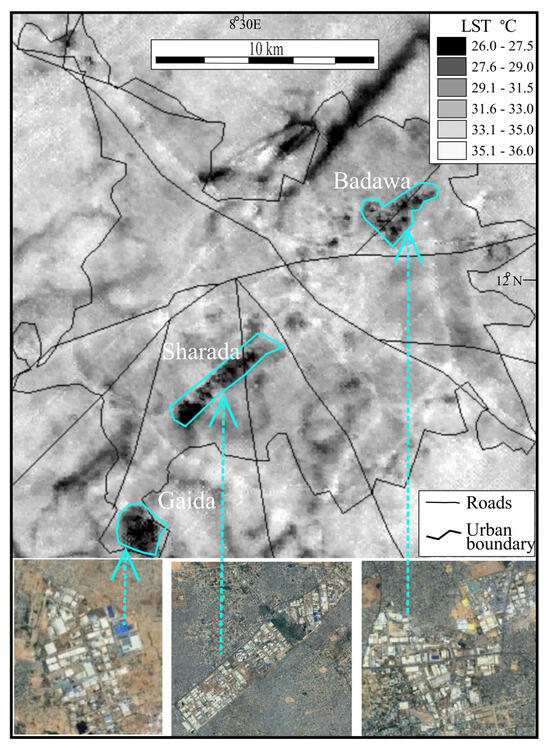
Figure 8.
ECOSTRESS daytime LST image of Kano city on 13 April 2021 at 5.26 p.m., showing Sharada, Gaida, and Badawa industrial areas within Kano residential districts, and the corresponding Google Earth images.
Figure 8 is an ECOSTRESS thermal image showing three major industrial estates in Kano city, which show lower LST values (average of 27.5 °C) than in the rest of the urban area (average of 32.5 °C). These industrial areas have large and consolidated expanses of metal roofing. The average ECOSTRESS emissivity value for these areas is 0.96, which is substantially higher than the values recognized for metal surfaces. This means that the actual LST for these areas may be much higher, i.e., the image LST for the industrial areas is unrepresentatively low.
4. Discussion
The ECOSTRESS images evaluated here suggest that the five studied cities in sub-Saharan Africa experience daytime SUCIs during both summer and winter, and they either have less pronounced SUCIs or weak UHIs at night. However, the sparse air temperature data available, as well as the few studies using air temperature, suggest that there are UHIs during both day and night. Furthermore, the basic low-rise morphology of these cities, providing little daytime shade, coupled with few street trees, would not be conducive to strong UCI development. As emissivity determines the amount of thermal energy released back to the atmosphere, it determines the temperature of surfaces; therefore, an accurate measurement is vitally important in LST computations. The land cover classification indicated that approximately 33% of the urban area comprised metallic surfaces (Table 5). When the LST was calculated using known emissivity values for metals and metal roofing types, average LST values of the urban area were significantly higher. In the case of the Landsat image of 25th September 2022, all three experimental settings resulted in pronounced SUHIs, compared with a weak UHI of 1.5 °C for the Landsat Level 2 LST product. However, it should be noted that the Landsat overpass time of approximately 10 a.m. is well before the peak daytime temperature. For the ECOSTRESS image of 18 May 2024, which is closer to the peak of daytime heating, all three lower emissivity settings gave pronounced SUHIs (of 4.4 °C, 7.2 °C, and 10.4 °C), compared with no significant difference (i.e., +0.1 °C) between urban and rural temperatures for the ECOSTRESS LST product.
For an ECOSTRESS Level 2 LST product image at midday during the hot season, industrial areas with large expanses of metallic roofing showed average LST values that were 5 °C lower than other parts of the urban area. However, it is well known that metallic surfaces on hot days can reach 80 °C or more [45,46]. The likely explanation is that ECOSTRESS Level 2 emissivity bands show mean emissivity values of approximately 0.95 for these areas, which is much higher than the given value of 0.77 for galvanized aluminum (white metallic surfaces) of industrial buildings. The oxidized and rusted iron and steel (blue metallic surfaces) of residential buildings have a mean emissivity value in the ECOSTRESS Level 2 LST product of 0.96. Overall, a decrease of 0.1 in emissivity for metallic surfaces was seen to increase the surface temperature by approximately 0.75 °C. For example, blue metallic surfaces showed an LST value of 38.6 °C in the ECOSTRESS Level 2 LST product, compared to 47.1–60.9 °C in the emissivity-corrected images. For white metallic surfaces, an LST value of 39.6 in the original LST product increased to 56.4 °C in the emissivity-corrected images. Given that 22.5% of the white metal roofs of industrial areas and 7.5% of blue metallic surfaces were not identified in the classified image and that conservative emissivity values were used in the LST computations, the LST values derived in this study for the whole urban area are thought to be lower than actual, and significantly higher values are likely. The emissivity values allocated in this study resulted in LST values for the whole urban area, which are 10.2 °C and 10.3 °C higher than those in the original Landsat and ECOSTRESS Level 2 products. Also, very strong summer daytime SUHIs of up to +11.5 °C were observed.
The main weaknesses of this study include the lack of air temperature data to confirm heat island or cool island situations corresponding to the ECOSTRESS images. While airports in major cities record daily maximum and minimum Ta, data from nearby rural stations for evaluating the urban–rural difference were unavailable. This study also lacked ‘in situ’ LST data corresponding to the image times as well as the temperatures and emissivity values of metallic surfaces at different stages of weathering and oxidation. To mitigate this weakness, conservatively high emissivity values were allocated to metallic surfaces in the computation of LST values. Although Kano was the only city for which emissivity values were tested, the other four cities in the semi-arid zone of Africa were selected for their similarity in urban morphology and types of urban building materials.
5. Conclusions
Evaluating the urban climate of indigenous cities is hindered by the lack of ‘in situ’ temperature measurements in many developing countries, as well as the consequent inaccuracy of climate models. This places more importance on remotely sensed LSTs for urban climate monitoring. The ECOSTRESS project, originally conceived for agricultural and drought monitoring, provides the most detailed thermal images ever acquired from space and has been approved for operation until 2029. Its frequent revisit time of 4–5 days coverage enables new opportunities for urban climate monitoring, including the capture of major heat waves and a high probability of image acquisition, even in cloud-prone regions. Its variable timing of overpass during both day and night means that images can be obtained closer to the diurnal maxima and minima than those of existing thermal satellite sensors.
This study suggests that satellite-based LST values of urban areas in indigenous cities may be unrealistically low due to the inability of the TES algorithm to estimate these values for low-emissivity surfaces. This means that satellite LSTs may not reliably predict heat island or cool island conditions in these cities. Due to the ubiquitous nature of metallic roofing materials, which constitute a large proportion of the satellite ‘seen’ surface, observation-based emissivity of urban surfaces in indigenous cities could better represent the effective urban emissivity than modeled values. More research is therefore needed, requiring ‘in situ’ surveys of emissivity values of roofing material types and conditions across a city, coupled with more detailed image identification and classification of roofing types using high-resolution and hyperspectral sensors. This would enable more realistic urban parameters to improve the overall precision of urban climate models that use remotely sensed LST values as inputs.
Author Contributions
Conceptualization, J.E.N.; methodology, J.E.N. and M.U.; software, J.E.N. and M.U.; validation, J.E.N., M.U., O.G.F. and R.S.; formal analysis, J.E.N., M.U. and O.G.F.; writing—original draft preparation, J.E.N.; writing—review and editing, J.E.N., M.U., O.G.F. and R.S. All authors have read and agreed to the published version of the manuscript.
Funding
This research received no external funding.
Data Availability Statement
The ECOSTRESS images used are freely available from https://appeears.earthdatacloud.nasa.gov/ (accessed on 15 April 2025). The Landsat image used is freely available from https://earthexplorer.usgs.gov/ (accessed on 17 June 2025).
Acknowledgments
The authors have reviewed and edited the output and take full responsibility for the content of this publication.
Conflicts of Interest
The authors declare no conflicts of interest.
References
- Pörtner, H.O.; Roberts, D.; Tignor, M.; Poloczanska, E.; Mintenbeck, K.; Alegría, A.; Craig, M.; Langsdorf, S.; Löschke, S.; Möller, V.; et al. Climate Change 2022: Impacts, Adaptation and Vulnerability Working Group II Contribution to the Sixth Assessment Report of the Intergovernmental Panel on Climate Change; IPCC: Geneva, Switzerland, 2022. [Google Scholar]
- Morakinyo, T.E.; Ishola, K.A.; Eresanya, E.O.; Daramola, M.T.; Balogun, I.A. Spatio-Temporal Characteristics of Heat Stress over Nigeria Using Evaluated ERA5-HEAT Reanalysis Data. Weather. Clim. Extrem. 2024, 45, 100704. [Google Scholar] [CrossRef]
- Gillespie, A.R.; Rokugawa, S.; Hook, S.J.; Matsunaga, T.; Kahle, A.B. Temperature/Emissivity Separation Algorithm Theoretical Basis Document (Version 2.4); NASA’s Earth Observing System Project Science: Greenbelt, Maryland, 1999. [Google Scholar]
- Payan, V.; Royer, A. Analysis of Temperature Emissivity Separation (TES) algorithm applicability and sensitivity. Int. J. Remote Sens. 2004, 25, 15–37. [Google Scholar] [CrossRef]
- Zhou, L.; Dickinson, R.E.; Tian, Y.; Jin, M.; Ogawa, K.; Yu, H.; Schmugge, T. A sensitivity study of climate and energy balance simulations with use of satellite-derived emissivity data over Northern Africa and the Arabian Peninsula: EMISSIVITY AND CLIMATE MODELS. J. Geophys. Res. 2003, 108, 4795. [Google Scholar] [CrossRef]
- Hulley, G.C.; Hook, S.J.; Abbott, E.; Malakar, N.; Islam, T.; Abrams, M. The ASTER Global Emissivity Dataset (ASTER GED): Mapping Earth’s emissivity at 100 m spatial scale. Geophys. Res. Lett. 2015, 42, 7966–7976. [Google Scholar] [CrossRef]
- Hulley, G.C.; Göttsche, F.M.; Rivera, G.; Hook, S.J.; Freepartner, R.J.; Martin, M.A.; Cawse-Nicholson, K.; Johnson, W.R. Validation and Quality Assessment of the ECOSTRESS Level-2 Land Surface Temperature and Emissivity Product. IEEE Trans. Geosci. Remote Sens. 2021, 60, 21518764. [Google Scholar] [CrossRef]
- Fang, B.; Chakraborty, T.C.; Oleson, K.W.; Zhao, L. Large underestimation of urban surface emissivities in an Earth system model. In Proceedings of the AGU Fall Meeting, San Francisco, CA, USA, 11–15 December 2023. [Google Scholar]
- Yang, J.; Menenti, M.; Wu, Z.; Wong, M.S.; Abbas, S.; Xu, Y.; Shi, Q. Assessing the impact of urban geometry on surface urban heat island using complete and nadir temperatures. Int. J. Climatol. 2021, 41, E3219–E3238. [Google Scholar] [CrossRef]
- Prieto-Curiel, R.; Patino, J.E.; Anderson, B. Scaling of the morphology of African cities. Proc. Natl. Acad. Sci. USA 2023, 120, e2214254120. [Google Scholar] [CrossRef]
- Offerle, B.; Jonsson, P.; Eliasson, I.; Grimmond, C.S.B. Urban Modification of the Surface Energy Balance in the West African Sahel: Ouagadougou, Burkina Faso. J. Clim. 2005, 18, 3983–3995. [Google Scholar] [CrossRef]
- Usman, M.; Nichol, J.E.; Abdallah, A.M.; Bilal, M. Characterising the Urban Heat Island in a Low-Rise Indigenous City Using Remote Sensing. Urban Clim. 2025, 61, 102433. [Google Scholar] [CrossRef]
- Elagib, N.A. Evolution of Urban Heat Island in Khartoum. Int. J. Climatol. 2011, 31, 1377–1388. [Google Scholar] [CrossRef]
- Lazzarini, M.; Molini, A.; Marpu, P.R.; Ouarda, T.B.M.J.; Ghedira, H. Urban Climate Modifications in Hot Desert Cities: The Role of Land Cover, Local Climate, and Seasonality. Geophys. Res. Lett. 2015, 42, 9980–9989. [Google Scholar] [CrossRef]
- Al Blooshi, L.S.; Abuelgasim, A.; Nassar, A.; Ksiksi, T. Impact of Desert Urbanization on Urban Heat Islands Effect. Open J. Geol. 2020, 10, 760–770. [Google Scholar] [CrossRef]
- Chang, Y.; Xiao, J.; Li, X.; Middel, A.; Zhang, Y.; Gu, Z.; Wu, Y.; He, S. Exploring Diurnal Thermal Variations in Urban Local Climate Zones with ECOSTRESS Land Surface Temperature Data. Remote Sens. Environ. 2021, 263, 112544. [Google Scholar] [CrossRef]
- Nichol, J. Remote Sensing of Urban Heat Islands by Day and Night. Photogramm. Eng. Remote Sens. 2005, 71, 613–621. [Google Scholar] [CrossRef]
- Meerdink, S.K.; Hook, S.J.; Roberts, D.A.; Abbott, E.A. The ECOSTRESS Spectral Library Version 1.0. Remote Sens. Environ. 2019, 230, 111196. [Google Scholar] [CrossRef]
- Zhong, X.; Zhao, L.; Wang, J.; Zheng, H.; Yan, J.; Jin, R.; Ren, P. Empirical Models on Urban Surface Emissivity Retrieval Based on Different Spectral Response Functions: A Field Study. Build. Environ. 2021, 197, 107882. [Google Scholar] [CrossRef]
- Obia, A.E.; Okon, H.E.; Ekum, S.A.; Onuegbu, A.E.; Ekeng, P.O. The Role of Sulphur Dioxide and Gas Flare Particulates on the Corrosion of Galvanized Iron Roof Sheets in South-South Region of Nigeria. Sci. Res. Essays 2011, 6, 5734–5740. [Google Scholar] [CrossRef]
- Ncongwane, K.P.; Botai, J.O.; Sivakumar, V.; Botai, C.M. A Literature Review of the Impacts of Heat Stress on Human Health across Africa. Sustainability 2021, 13, 5312. [Google Scholar] [CrossRef]
- Parkes, B.; Cronin, J.; Dessens, O.; Sultan, B. Climate Change in Africa: Costs of Mitigating Heat Stress. Clim. Chang. 2019, 154, 461–476. [Google Scholar] [CrossRef]
- Omega Materials Inc. Table of Total Emissivity. P.Z58, Omega Technical Reference. 2025. Available online: https://assets.omega.com/pdf/tables_and_graphs/emissivity-table.pdf (accessed on 31 March 2025).
- The Engineering Toolbox, Emissivity Coefficients of Common Materials: Data & Reference Guide. Available online: https://www.engineeringtoolbox.com/emissivity-coefficients-d_447.html (accessed on 31 March 2025).
- Abubakar, I.R.; Alola, A.A.; Bekun, F.V.; Onifade, S.T. Investigating the Determinants of Household Energy Consumption in Nigeria: Insights and Implications. Energy. Sustain. Soc. 2024, 14, 29. [Google Scholar] [CrossRef]
- UNDESA. World Population Prospects, 2017 Revisions; United Nations Department of Economic and Social Affairs: New York, NY, USA, 2017. [Google Scholar]
- UNDESA. World Urbanization Prospects, 2018 Revisions; United Nations Department of Economic and Social Affairs: New York, NY, USA, 2018. [Google Scholar]
- Ramamurthy, P.; González, J.; Ortiz, L.; Arend, M.; Moshary, F. Erratum: Impact of Heatwave on a Megacity: An Observational Analysis of New York City during July 2016. Environ. Res. Lett. 2017, 12, 054011, Erratum in Environ. Res. Lett. 2023, 18, 049502. https://doi.org/10.1088/1748-9326/acc541. [Google Scholar] [CrossRef]
- Zhou, B.; Rybski, D.; Kropp, J.P. The Role of City Size and Urban Form in the Surface Urban Heat Island. Sci. Rep. 2017, 7, 4791. [Google Scholar] [CrossRef] [PubMed]
- Punch Newspaper. Heat Wave Sweeps Through North: Residents Fear Disease Outbreak. Punch Newspaper, 3 May 2024.
- Elusoji, S. How Nigeria is reeling from extreme heat due to climate change. Carbon Brief 2024, 8, 4. [Google Scholar]
- Guardian Newspaper. Lethal Heatwave in Sahel Worsened by Fossil Fuel Burning, Study Finds. The Guardian, 18 April 2024.
- World Bank. Population Stat, World Statistical Data. 2017–2025. 2025. Available online: https://populationstat.com/ (accessed on 31 March 2025).
- Fisher, J.B.; Lee, B.; Purdy, A.J.; Halverson, G.H.; Dohlen, M.B.; Cawse-Nicholson, K.; Wang, A.; Anderson, R.G.; Aragon, B.; Arain, M.A.; et al. ECOSTRESS: NASA’s next Generation Mission to Measure Evapotranspiration from the International Space Station. Water Resour. Res. 2020, 56, e2019WR026058. [Google Scholar] [CrossRef]
- Silvestri, M.; Romaniello, V.; Hook, S.; Musacchio, M.; Teggi, S.; Buongiorno, M.F. First Comparisons of Surface Temperature Estimations between ECOSTRESS, ASTER and Landsat 8 over Italian Volcanic and Geothermal Areas. Remote Sens. 2020, 12, 184. [Google Scholar] [CrossRef]
- Hu, T.; Hulley, G.C.; Mallick, K.; Szantoi, Z.; Hook, S. Comparison between the ASTER and ECOSTRESS Global Emissivity Datasets. Int. J. Appl. Earth Obs. Geoinf. 2023, 118, 103227. [Google Scholar] [CrossRef]
- Zhang, H.A.; Mahmood, A.N.; Hu, T.; Mallick, K.; Didry, Y.; Hitzelberger, P.; Szantoi, Z.; Perez-Panells, L.; Göttsche, F.M.; Hulley, G.C.; et al. Global evaluation of high-resolution ECOSTRESS land surface temperature and emissivity products: Collection 1 versus Collection 2. Remote Sens. Environ. 2025, 326, 114799. [Google Scholar] [CrossRef]
- Sirko, W.; Kashubin, S.; Ritter, M.; Annkah, A.; Salah, Y.; Bouchareb, E.; Dauphin, Y.; Keysers, D.; Neumann, M.; Cisse, M.; et al. Continental-Scale Building Detection from High Resolution Satellite Imagery. arXiv 2021, arXiv:2107.12283. [Google Scholar] [CrossRef]
- Sirko, W.; Brempong, E.A.; Marcos, J.T.C.; Korme, A.A.A.; Hassen, M.A.; Sapkota, K.; Shekel, T.; Diack, A.; Nevo, S.; Hickey, J.; et al. High-resolution building and road detection from Sentinel-2. arXiv 2024, arXiv:2310.11622. [Google Scholar]
- Zhao, C.; Pan, Y. A novel spectral index for mapping blue colour-coated steel roofs (BCCSRs) in urban areas using Sentinel-2 data. Int. J. Digit. Earth 2023, 16, 2862–2884. [Google Scholar] [CrossRef]
- Rossel, R.A.V.; Minasny, B.; Roudier, P.; McBratney, A.B. Colour space models for soil science. Geoderma 2006, 133, 320–337. [Google Scholar] [CrossRef]
- Samat, A.; Gamba, P.; Wang, W.; Luo, J.; Li, E.; Liu, S.; Du, P.; Abuduwaili, J. Mapping Blue and Red Color-Coated Steel Sheet Roof Buildings over China Using Sentinel-2A/B MSIL2A Images. Remote Sens. 2022, 14, 230. [Google Scholar] [CrossRef]
- Sola-Caraballo, J.; Serrano-Jiménez, A.; Rivera-Gomez, C.; Galan-Marin, C. Multi-Criteria Assessment of Urban Thermal Hotspots: A GIS-Based Remote Sensing Approach in a Mediterranean Climate City. Remote Sens. 2025, 17, 231. [Google Scholar] [CrossRef]
- Global Urban Polygons and Points Dataset (GUPPD), Version 1. Available online: https://www.earthdata.nasa.gov/data/catalog/esdis-ciesin-sedac-uspat-guppd-v1-1.00 (accessed on 31 March 2025).
- Chiu, T.; Wong, P.; Lam, S.; Burd, A.; Nichol, J.E. Urban temperatures in Hong Kong: Thermal environmental safety and implications for urban planning. J. Burn. Care Res. 2009, 30, 735–739. [Google Scholar] [CrossRef] [PubMed]
- Chestovich, P.J.; Saroukhanov, R.Z.; Moujaes, S.M.; Flores, C.E.; Carroll, J.T.; Saqib, S.F. Temperature Profiles of Sunlight-Exposed Surfaces in a Desert Climate: Determining the Risk for Pavement Burns. J. Burn. Care Res. 2022, 44, 438–445. [Google Scholar] [CrossRef] [PubMed]
Disclaimer/Publisher’s Note: The statements, opinions and data contained in all publications are solely those of the individual author(s) and contributor(s) and not of MDPI and/or the editor(s). MDPI and/or the editor(s) disclaim responsibility for any injury to people or property resulting from any ideas, methods, instructions or products referred to in the content. |
© 2025 by the authors. Licensee MDPI, Basel, Switzerland. This article is an open access article distributed under the terms and conditions of the Creative Commons Attribution (CC BY) license (https://creativecommons.org/licenses/by/4.0/).