
Impacts of Future Climate Change and Xiamen’s Territorial Spatial Planning on Carbon Storage and Sequestration


Abstract

1. Introduction
2. Materials and Methods
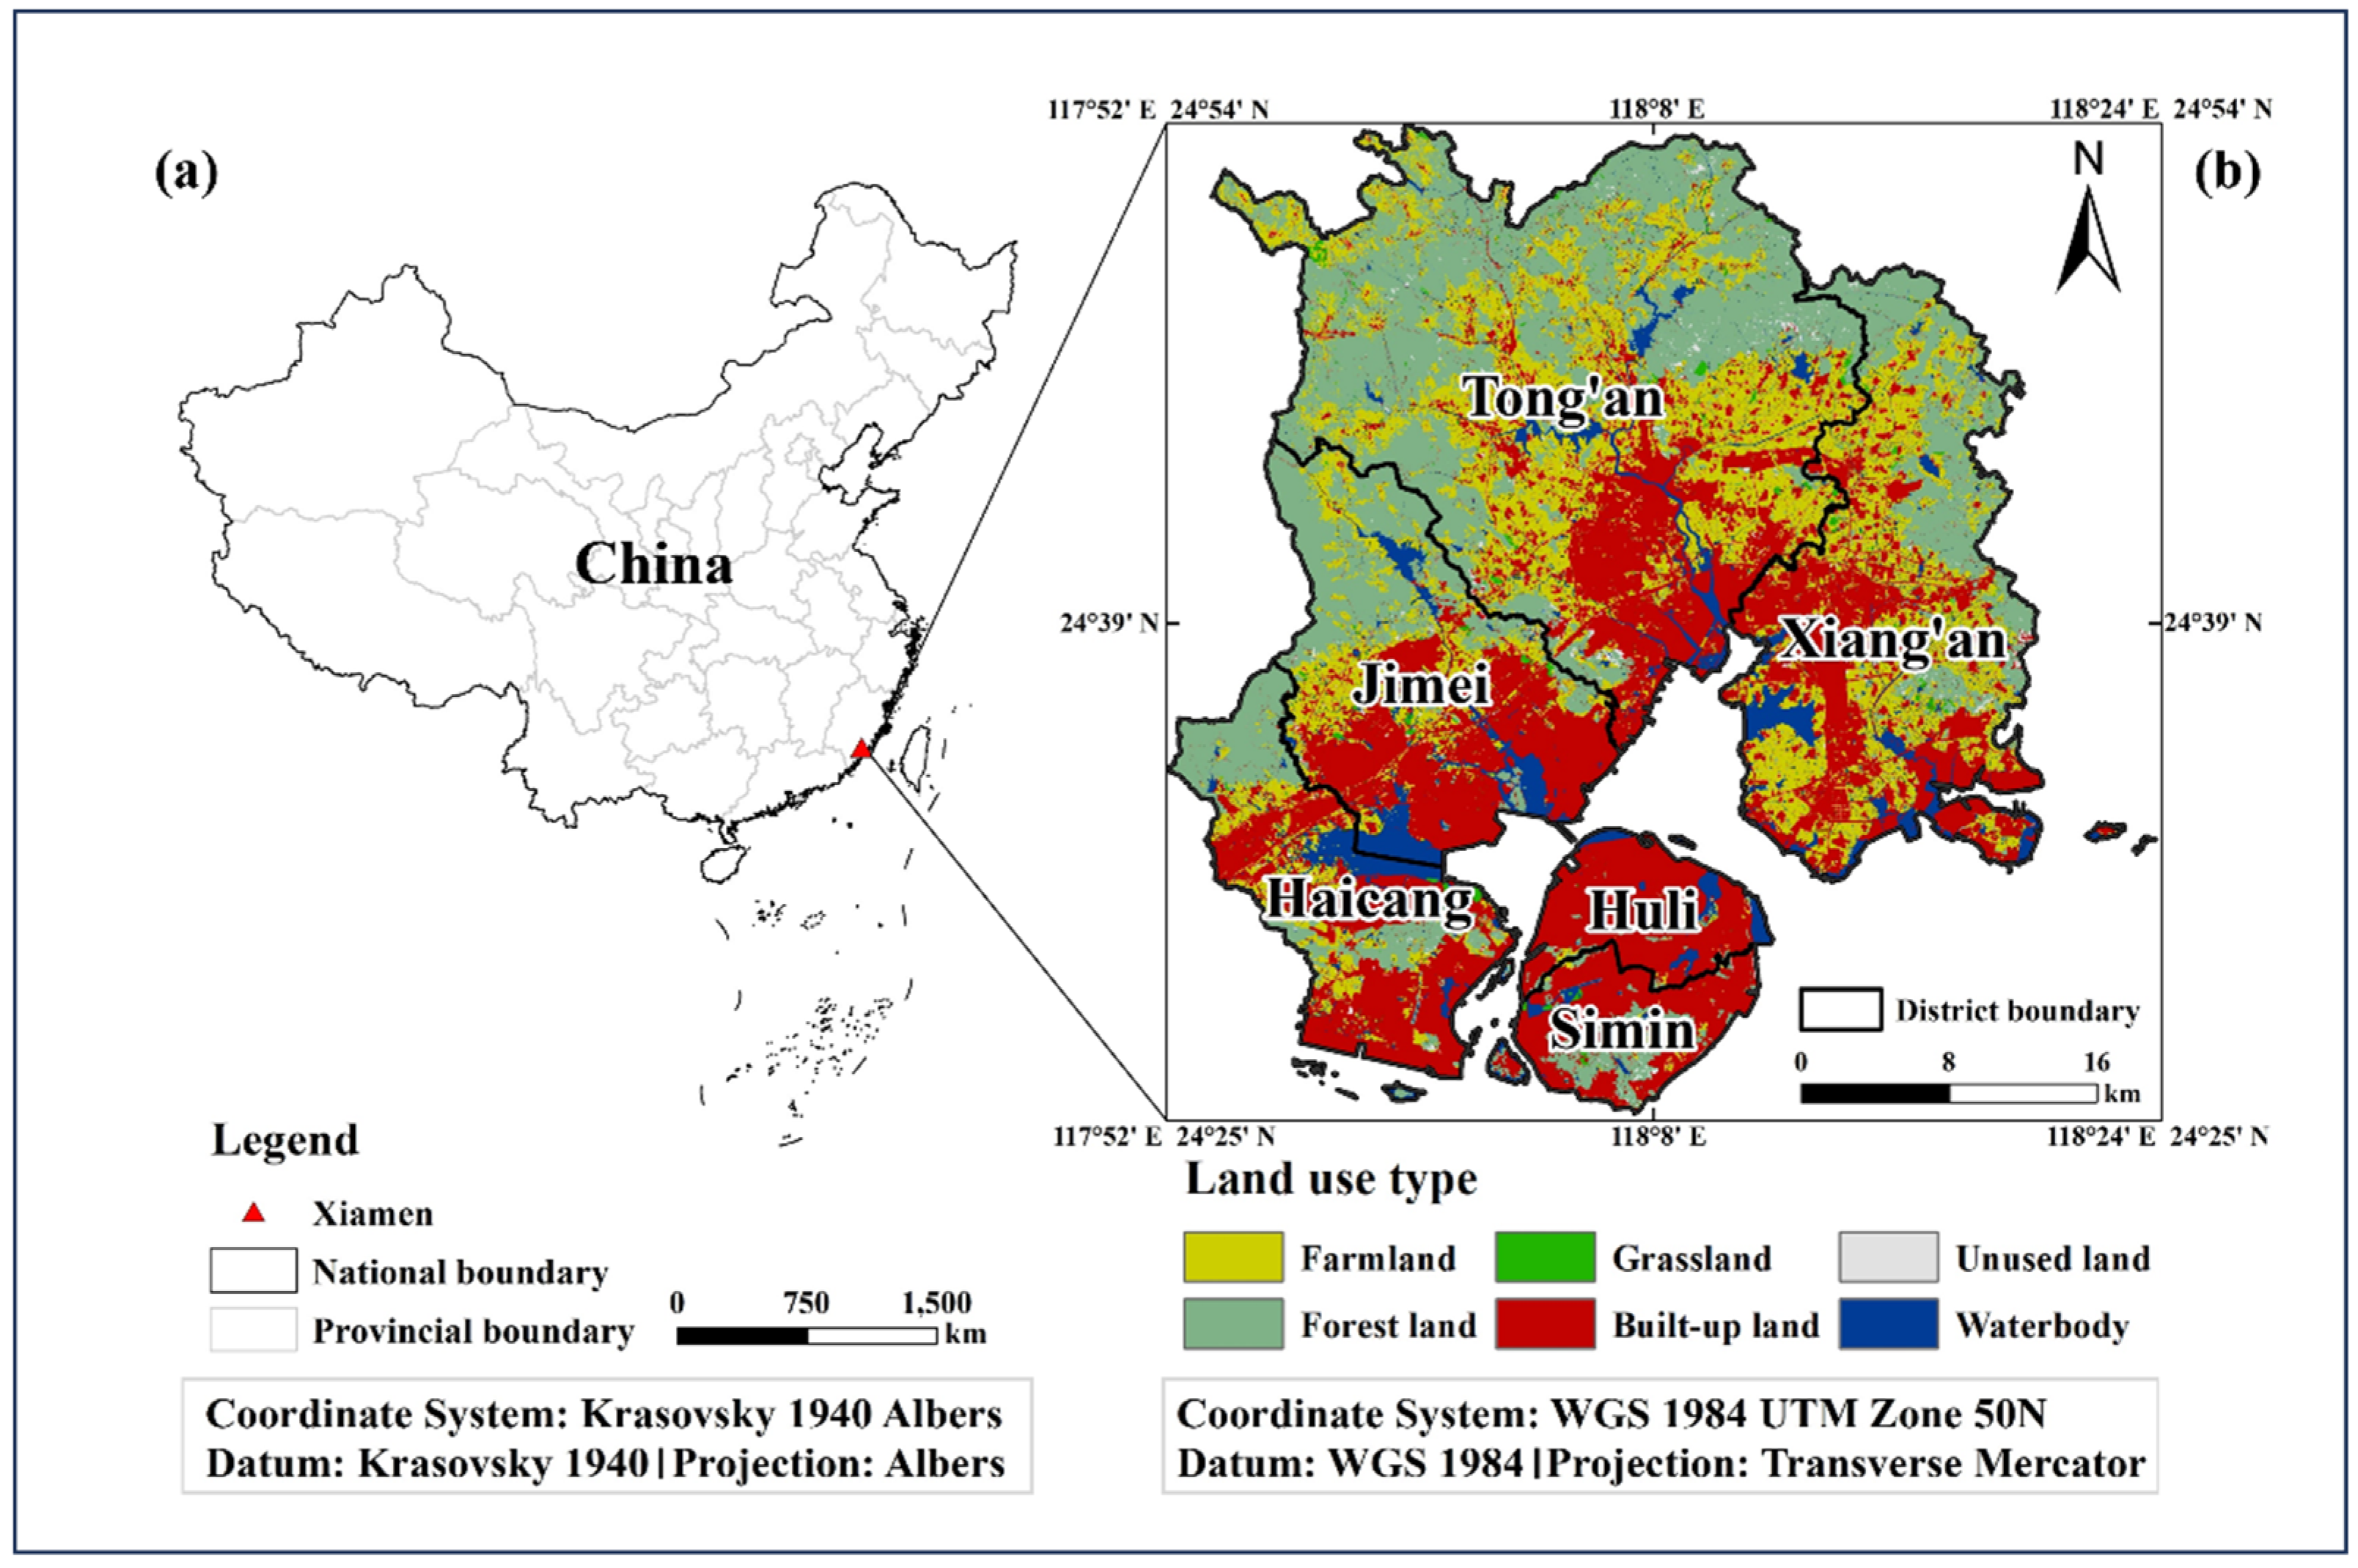
2.1. Study Area
2.2. Data Sources
- (1)
- Land use data. This study utilized remote sensing data from the Landsat-8 Operational Land Imager (OLI) sensor, selecting images from 2015 and 2020 with cloud cover below 5% and a resolution of 30 m. We performed radiometric calibration, atmospheric correction, cropping, supervised classification, and post-classification processing in ENVI 5.1. The supervised classification was conducted using the random forest classification method, categorizing the images into six land use types: farmland, forest land, grassland, built-up land, unused land, and water body (Figure 1). During the classification process, 50 region of interest (ROI) samples were selected for each land use type. To ensure the accuracy of the results, post-classification processing was carried out. The classification results were corrected through visual interpretation in conjunction with high-resolution Google imagery and remote sensing data from Landsat 8. Finally, we validated the classified results in ENVI, achieving an overall accuracy exceeding 90% (Table S1).
- (2)
- Driving factors. The driving factors for land use prediction are divided into natural and socioeconomic factors. The natural factors include slope and elevation, which derive from the digital elevation model (DEM), as well as climate data. The socioeconomic factors include gross domestic product (GDP) distribution data, population distribution data, and distance from railways, roads, built-up areas, and water bodies. Using ArcGIS 10.5’s resampling function, the resolution of the driving factor data is uniformly adjusted to 30 m × 30 m.
3. Methodology
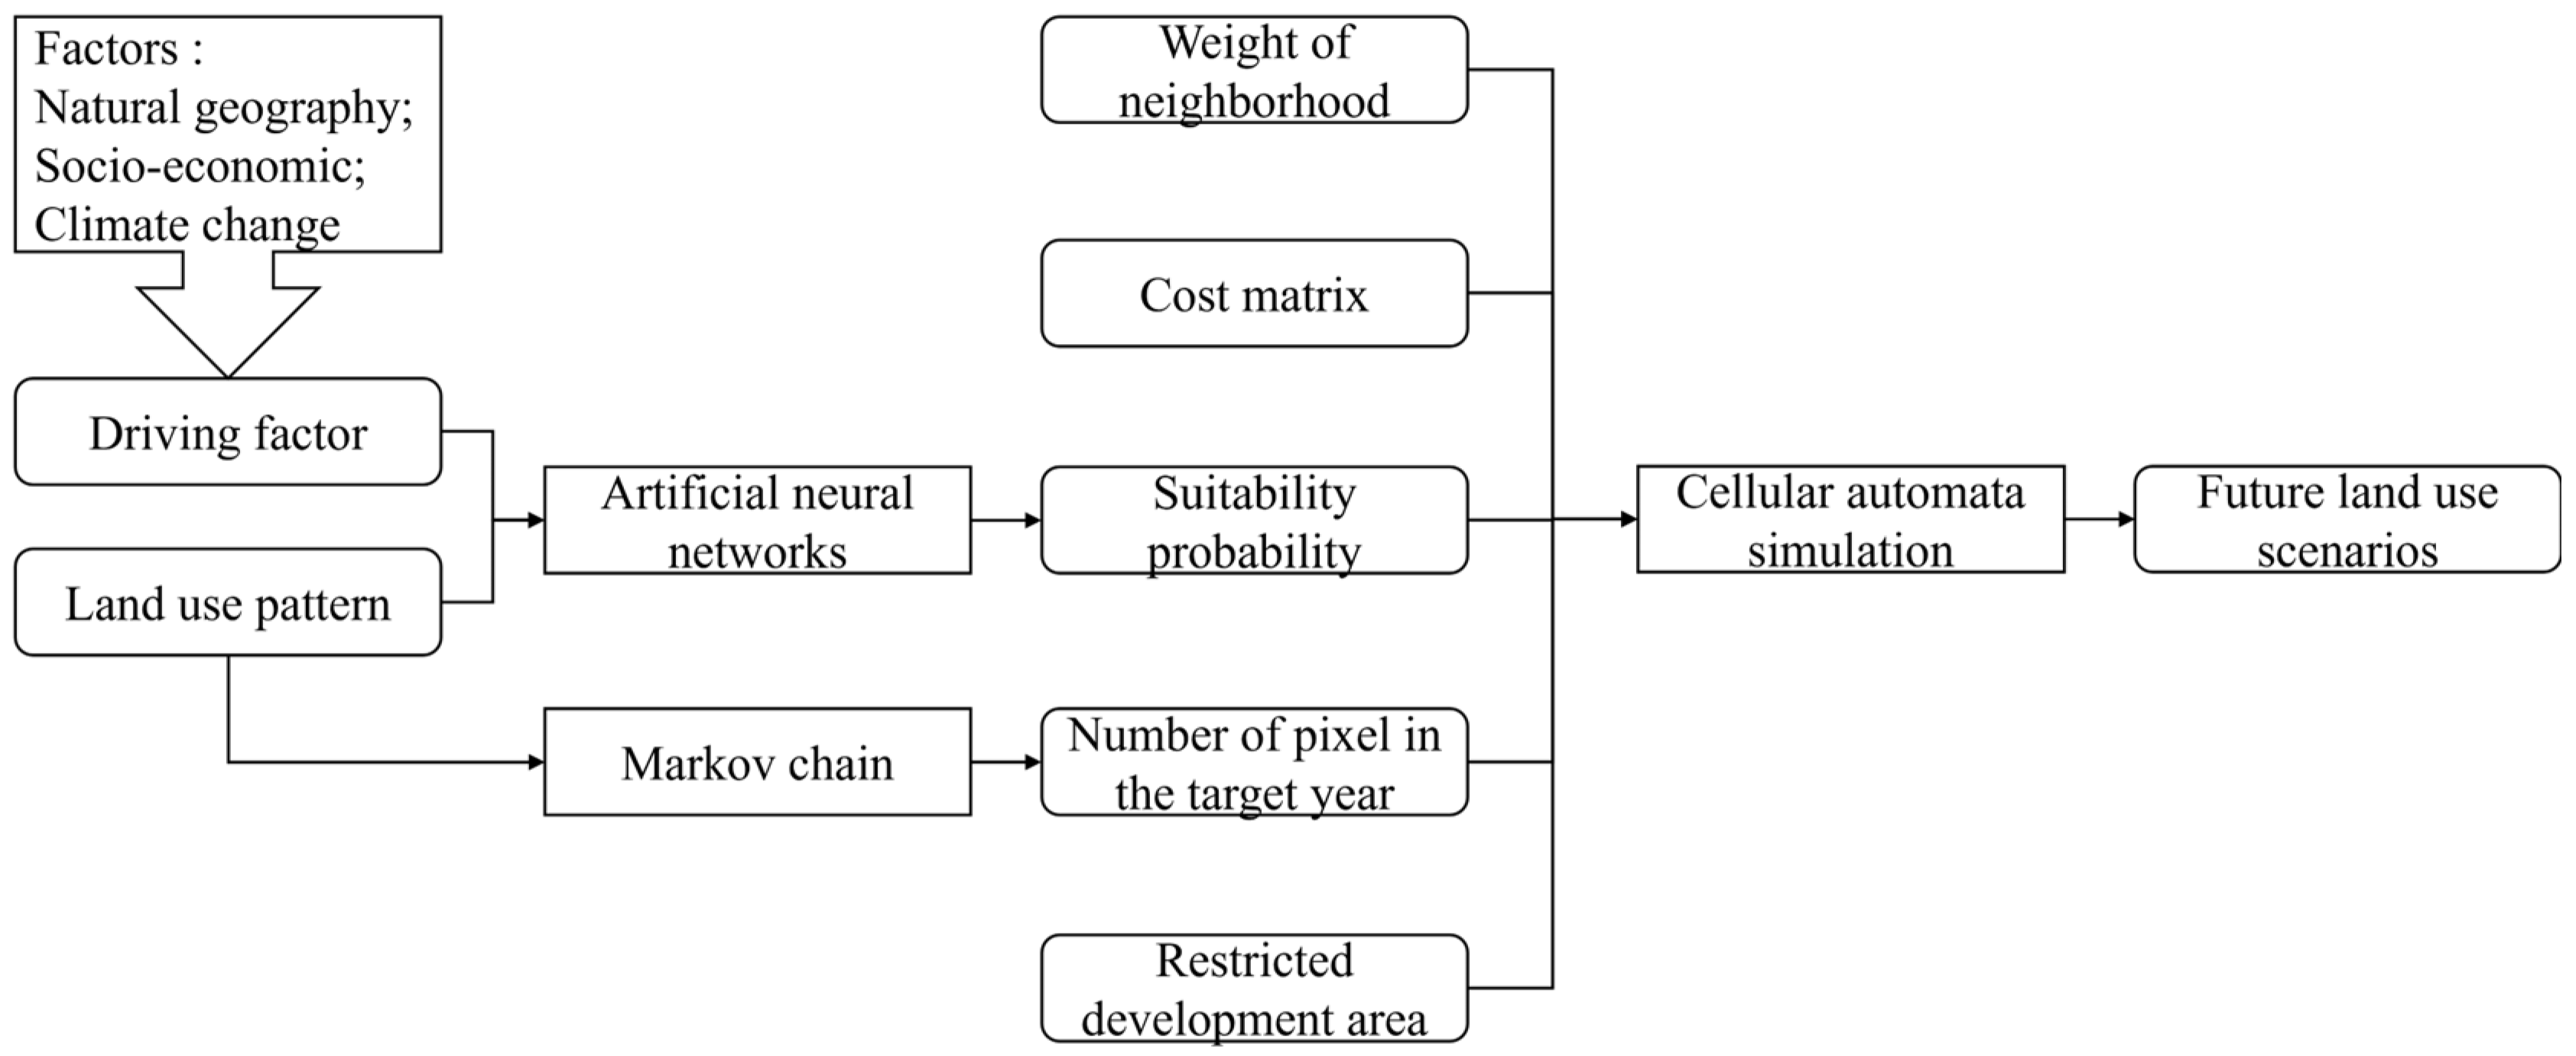
3.1. FLUS Model
3.2. LULC Change Scenarios
- (1)
- No restriction (NR): a business-as-usual development scenario reflecting the historical trend of land use, with no policy planning to restrict the future development of land use.
- (2)
- Ecological conservation red line (EC): areas with crucial ecological functions that require strict protection. Xiamen has designated 303.69 km2 as ecological conservation red lines, including 216.01 km2 of terrestrial areas, encompassing key ecological areas like nature reserves, water source conservation areas, and forests. Under the EC scenario, the addition of new farmland and built-up land in these areas is forbidden.
- (3)
- Permanent basic farmland conservation red line (BF): farmland boundaries that cannot be occupied or developed, which require permanent protection. Xiamen has designated 68.87 km2 of permanent basic farmland. The BF scenario restricts the conversion of farmland to other uses.
- (4)
- Urban development boundary red line (UB): the boundary of areas designated for urban development and construction within a certain period, including both existing built-up areas and reserved space for future urban construction. Xiamen has designated 734.06 km2 for urban development. Under the UB scenario, new built-up land is prohibited outside the urban development boundary to prevent uncontrolled urban sprawl.
- (5)
- Integrated three control line scenarios (ITL): a comprehensive scenario that combines all three control lines (EC, BF, and UB). It reflects Xiamen’s territorial planning, integrating ecological protection, farmland preservation, and orderly urban development.
3.3. InVEST Model
3.4. Variation Partitioning Analysis
3.5. Hot Spot Analysis
4. Results
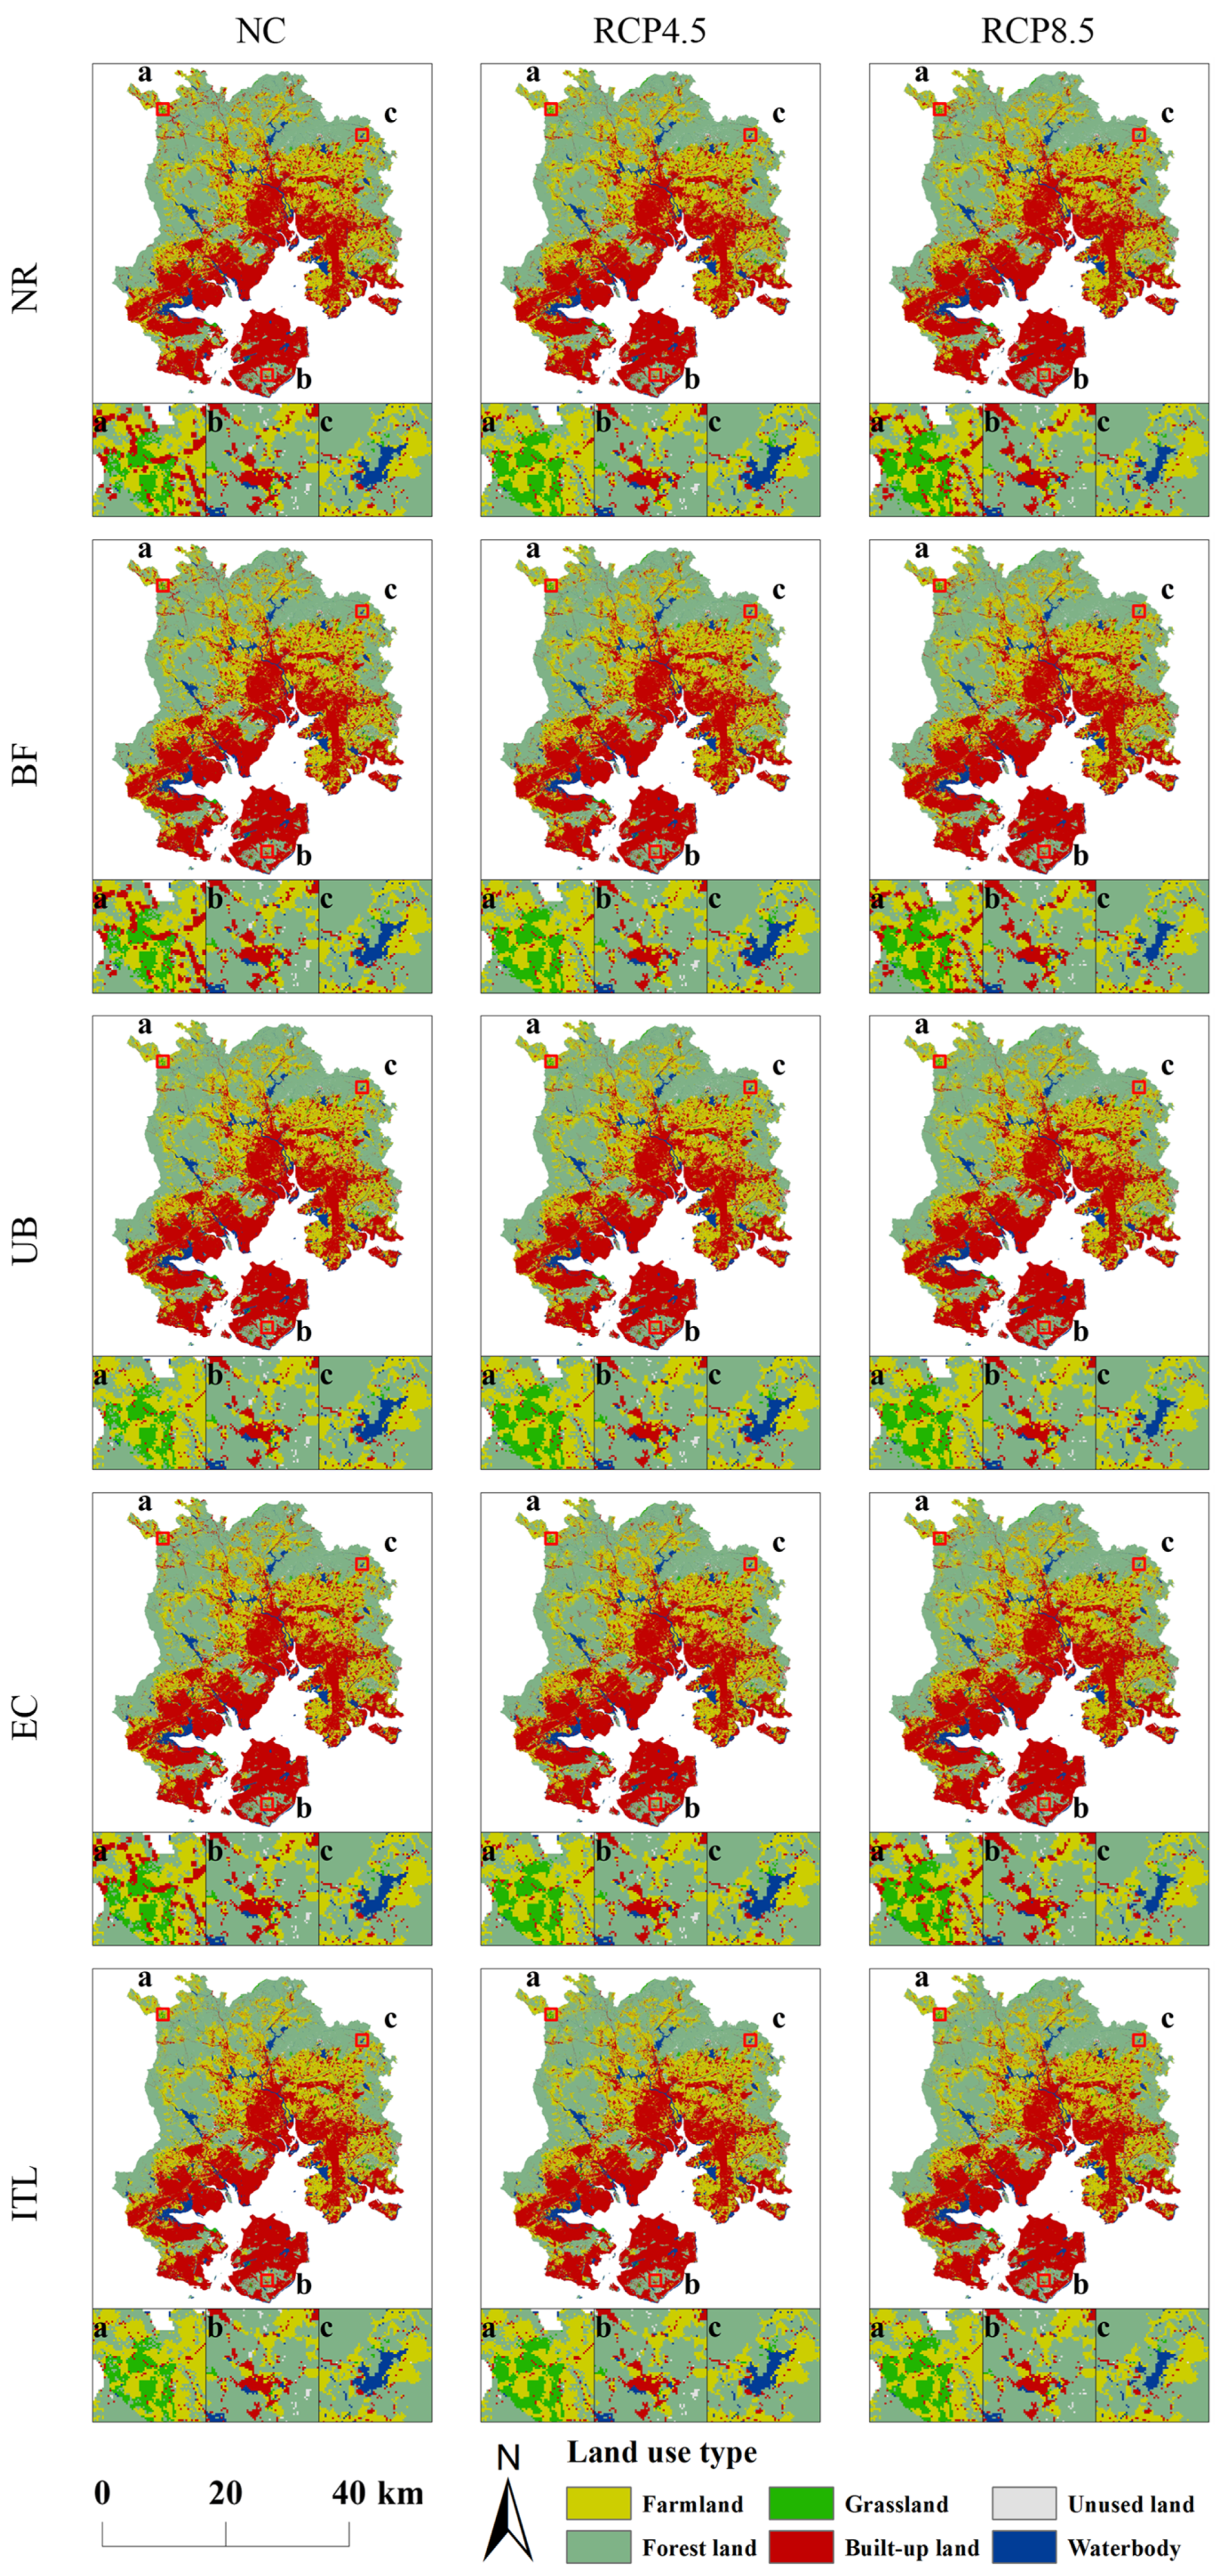
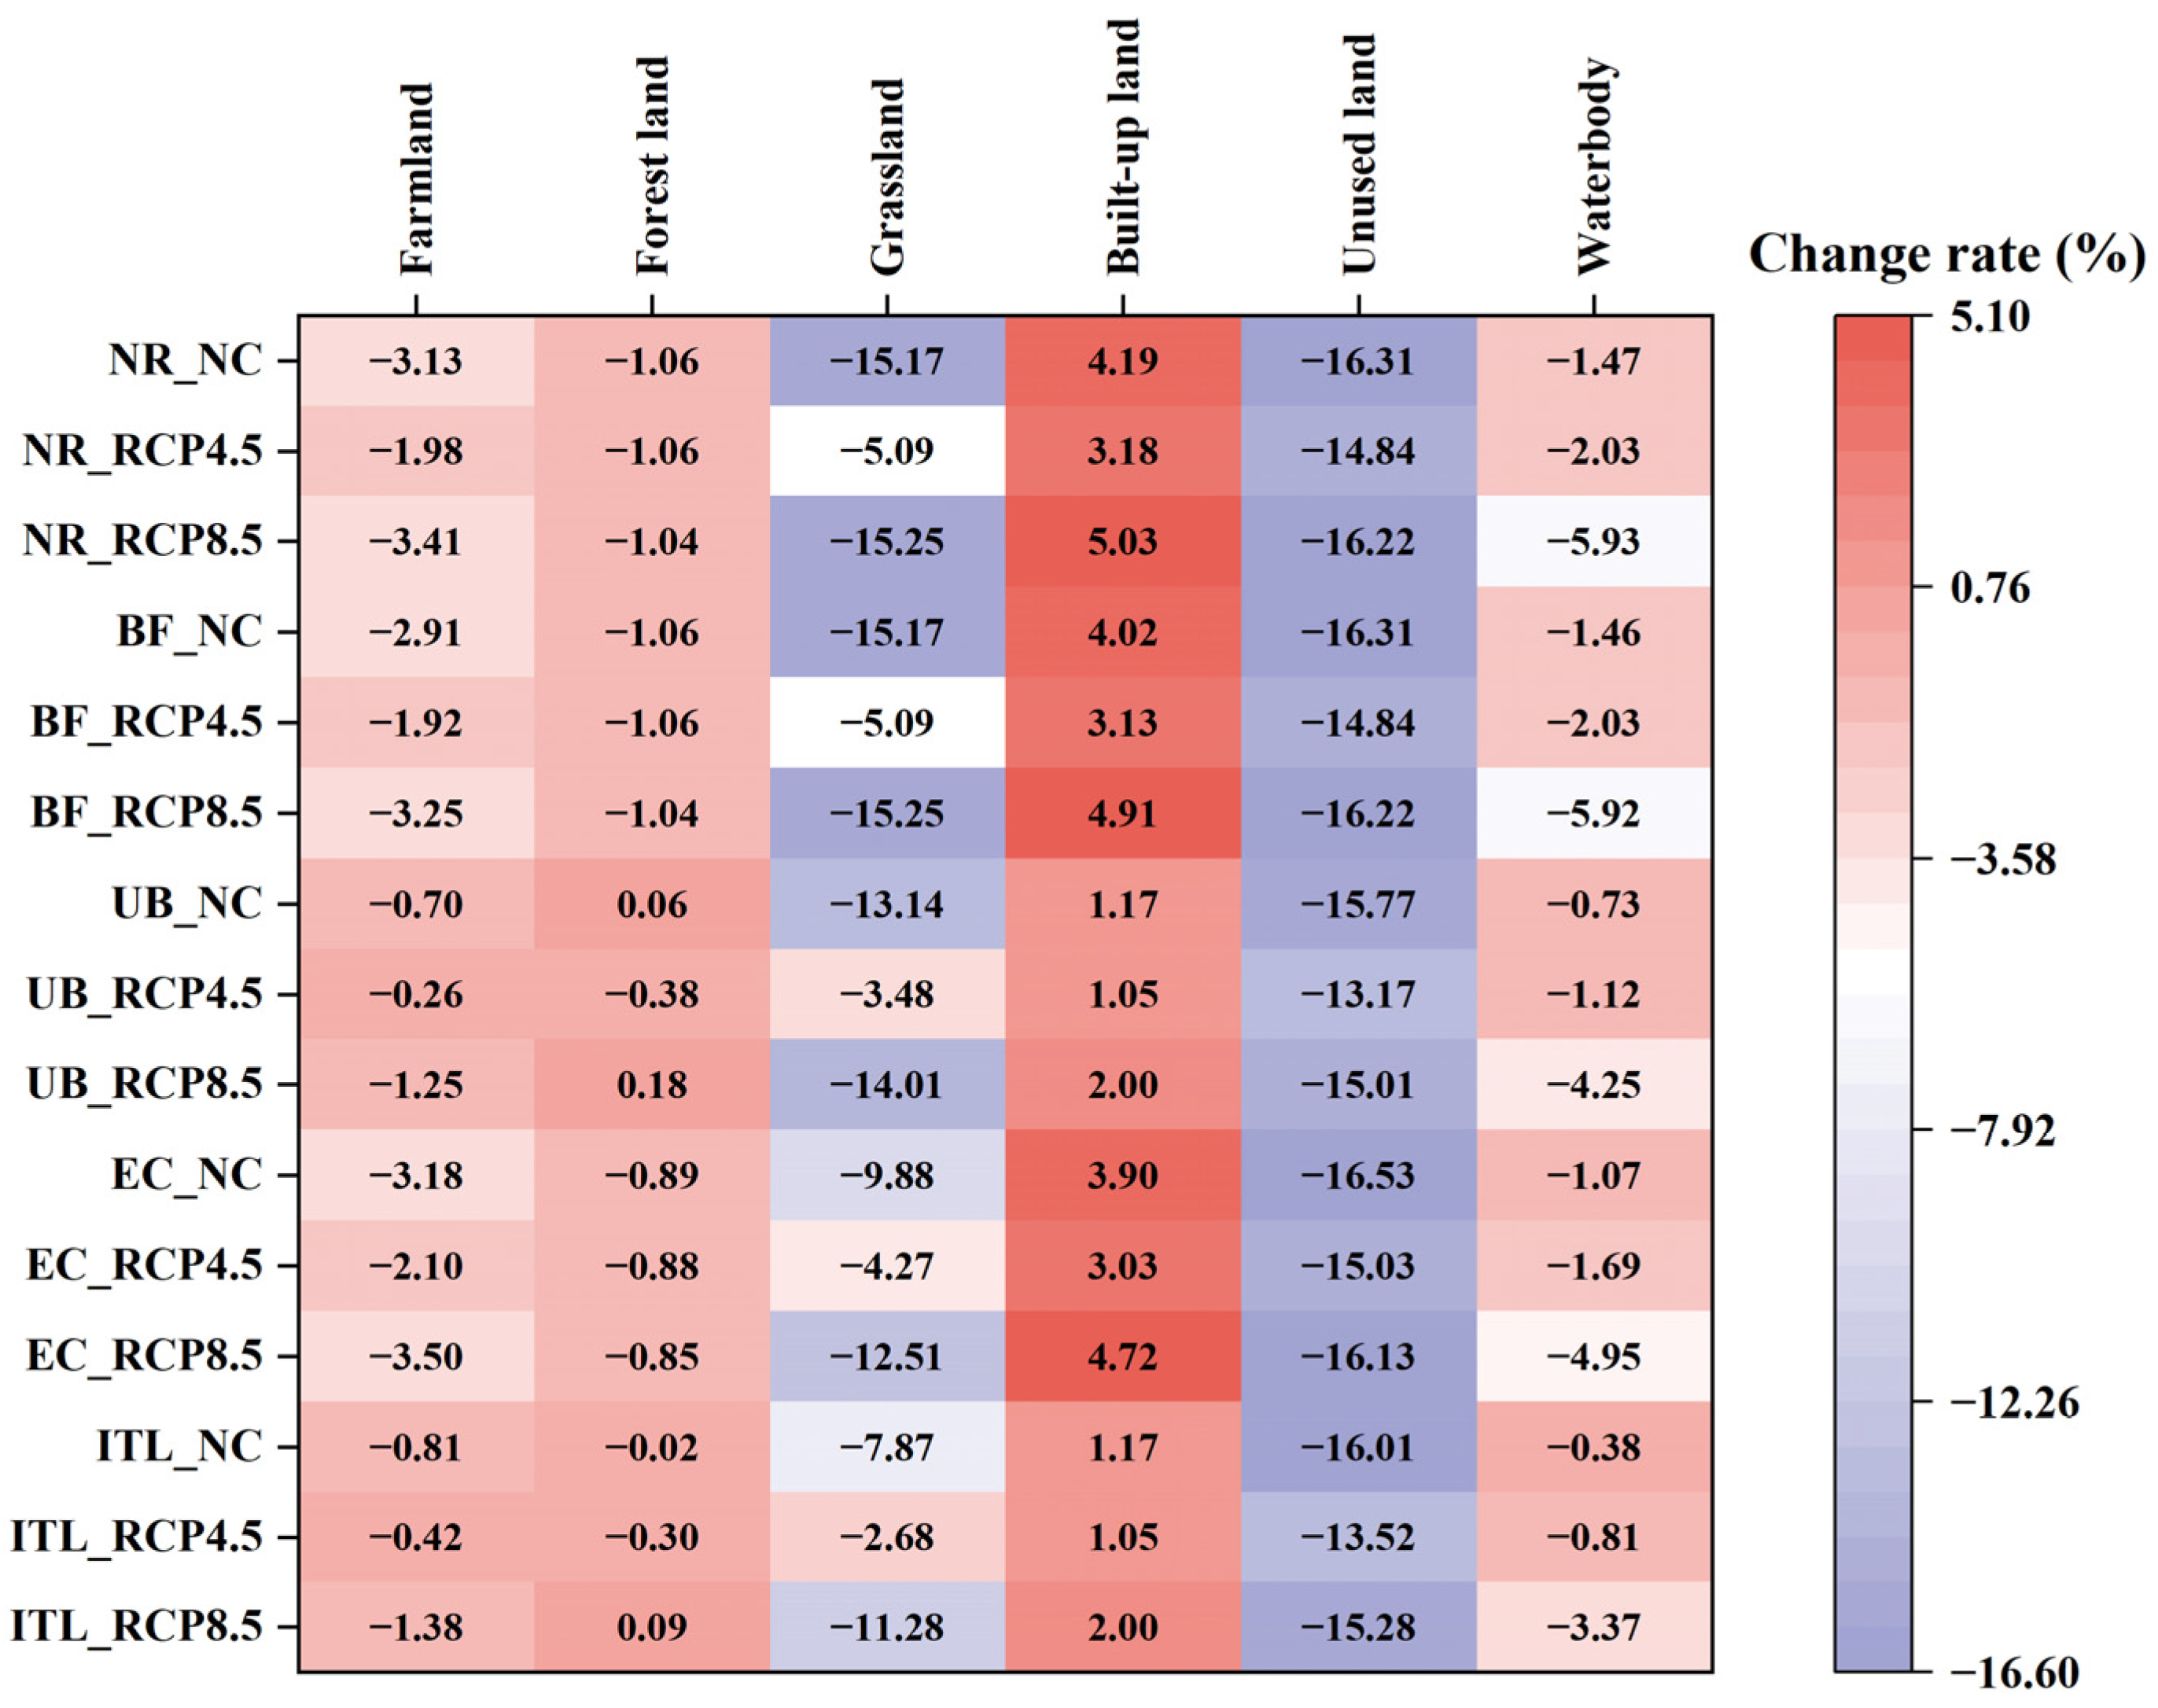
4.1. Future Land Use in Multi-Scenario
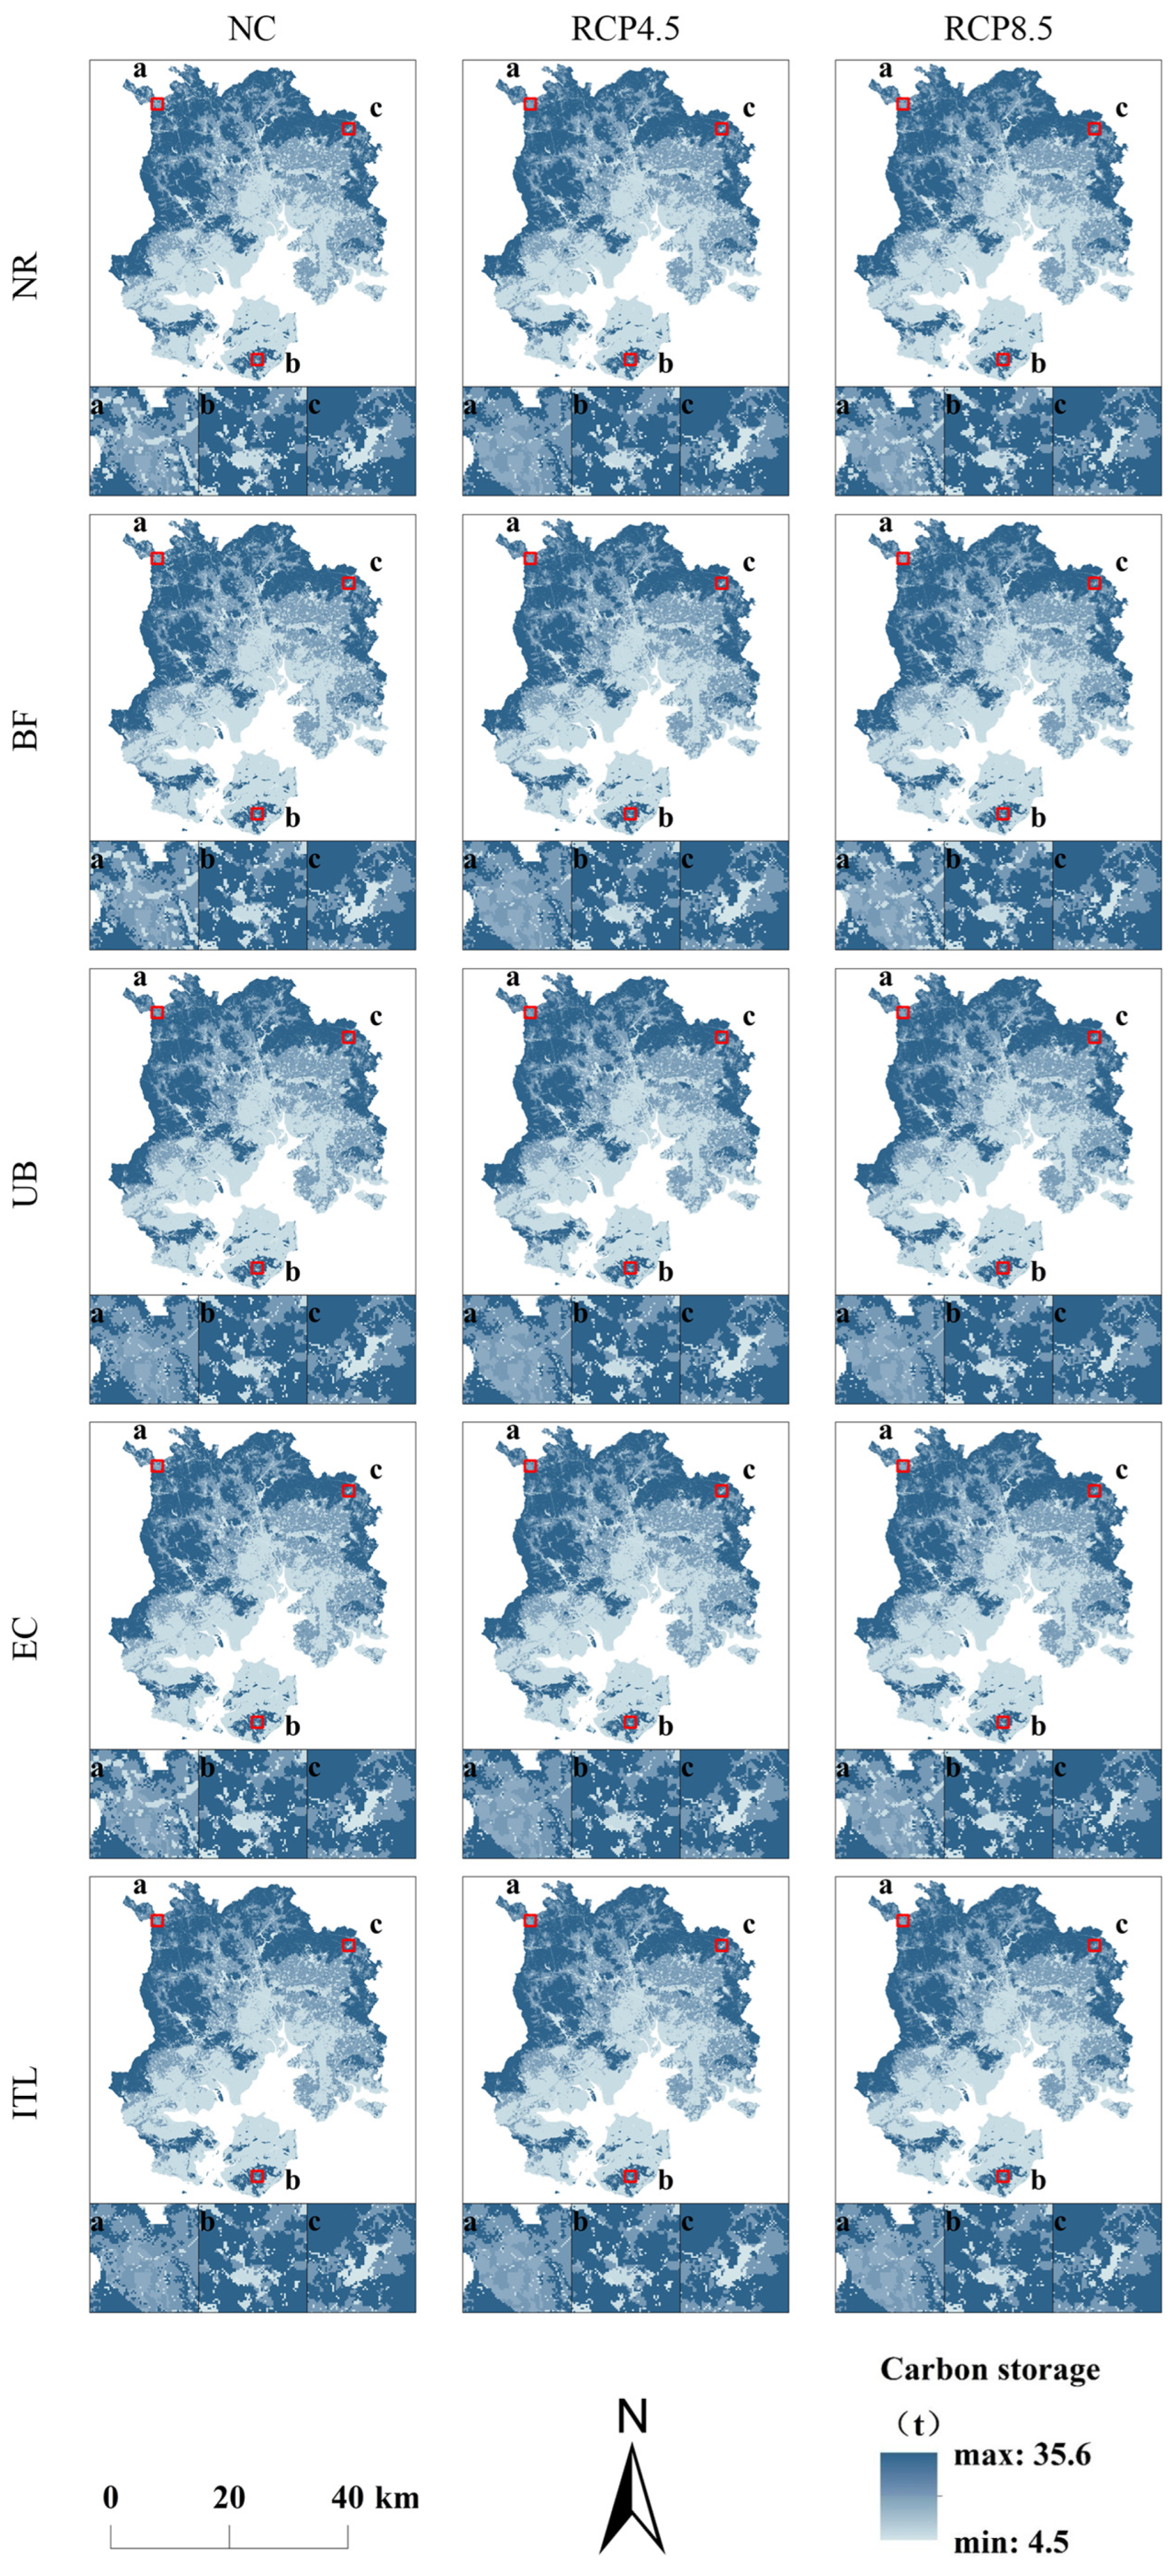
4.2. Carbon Storage Under Various Scenarios
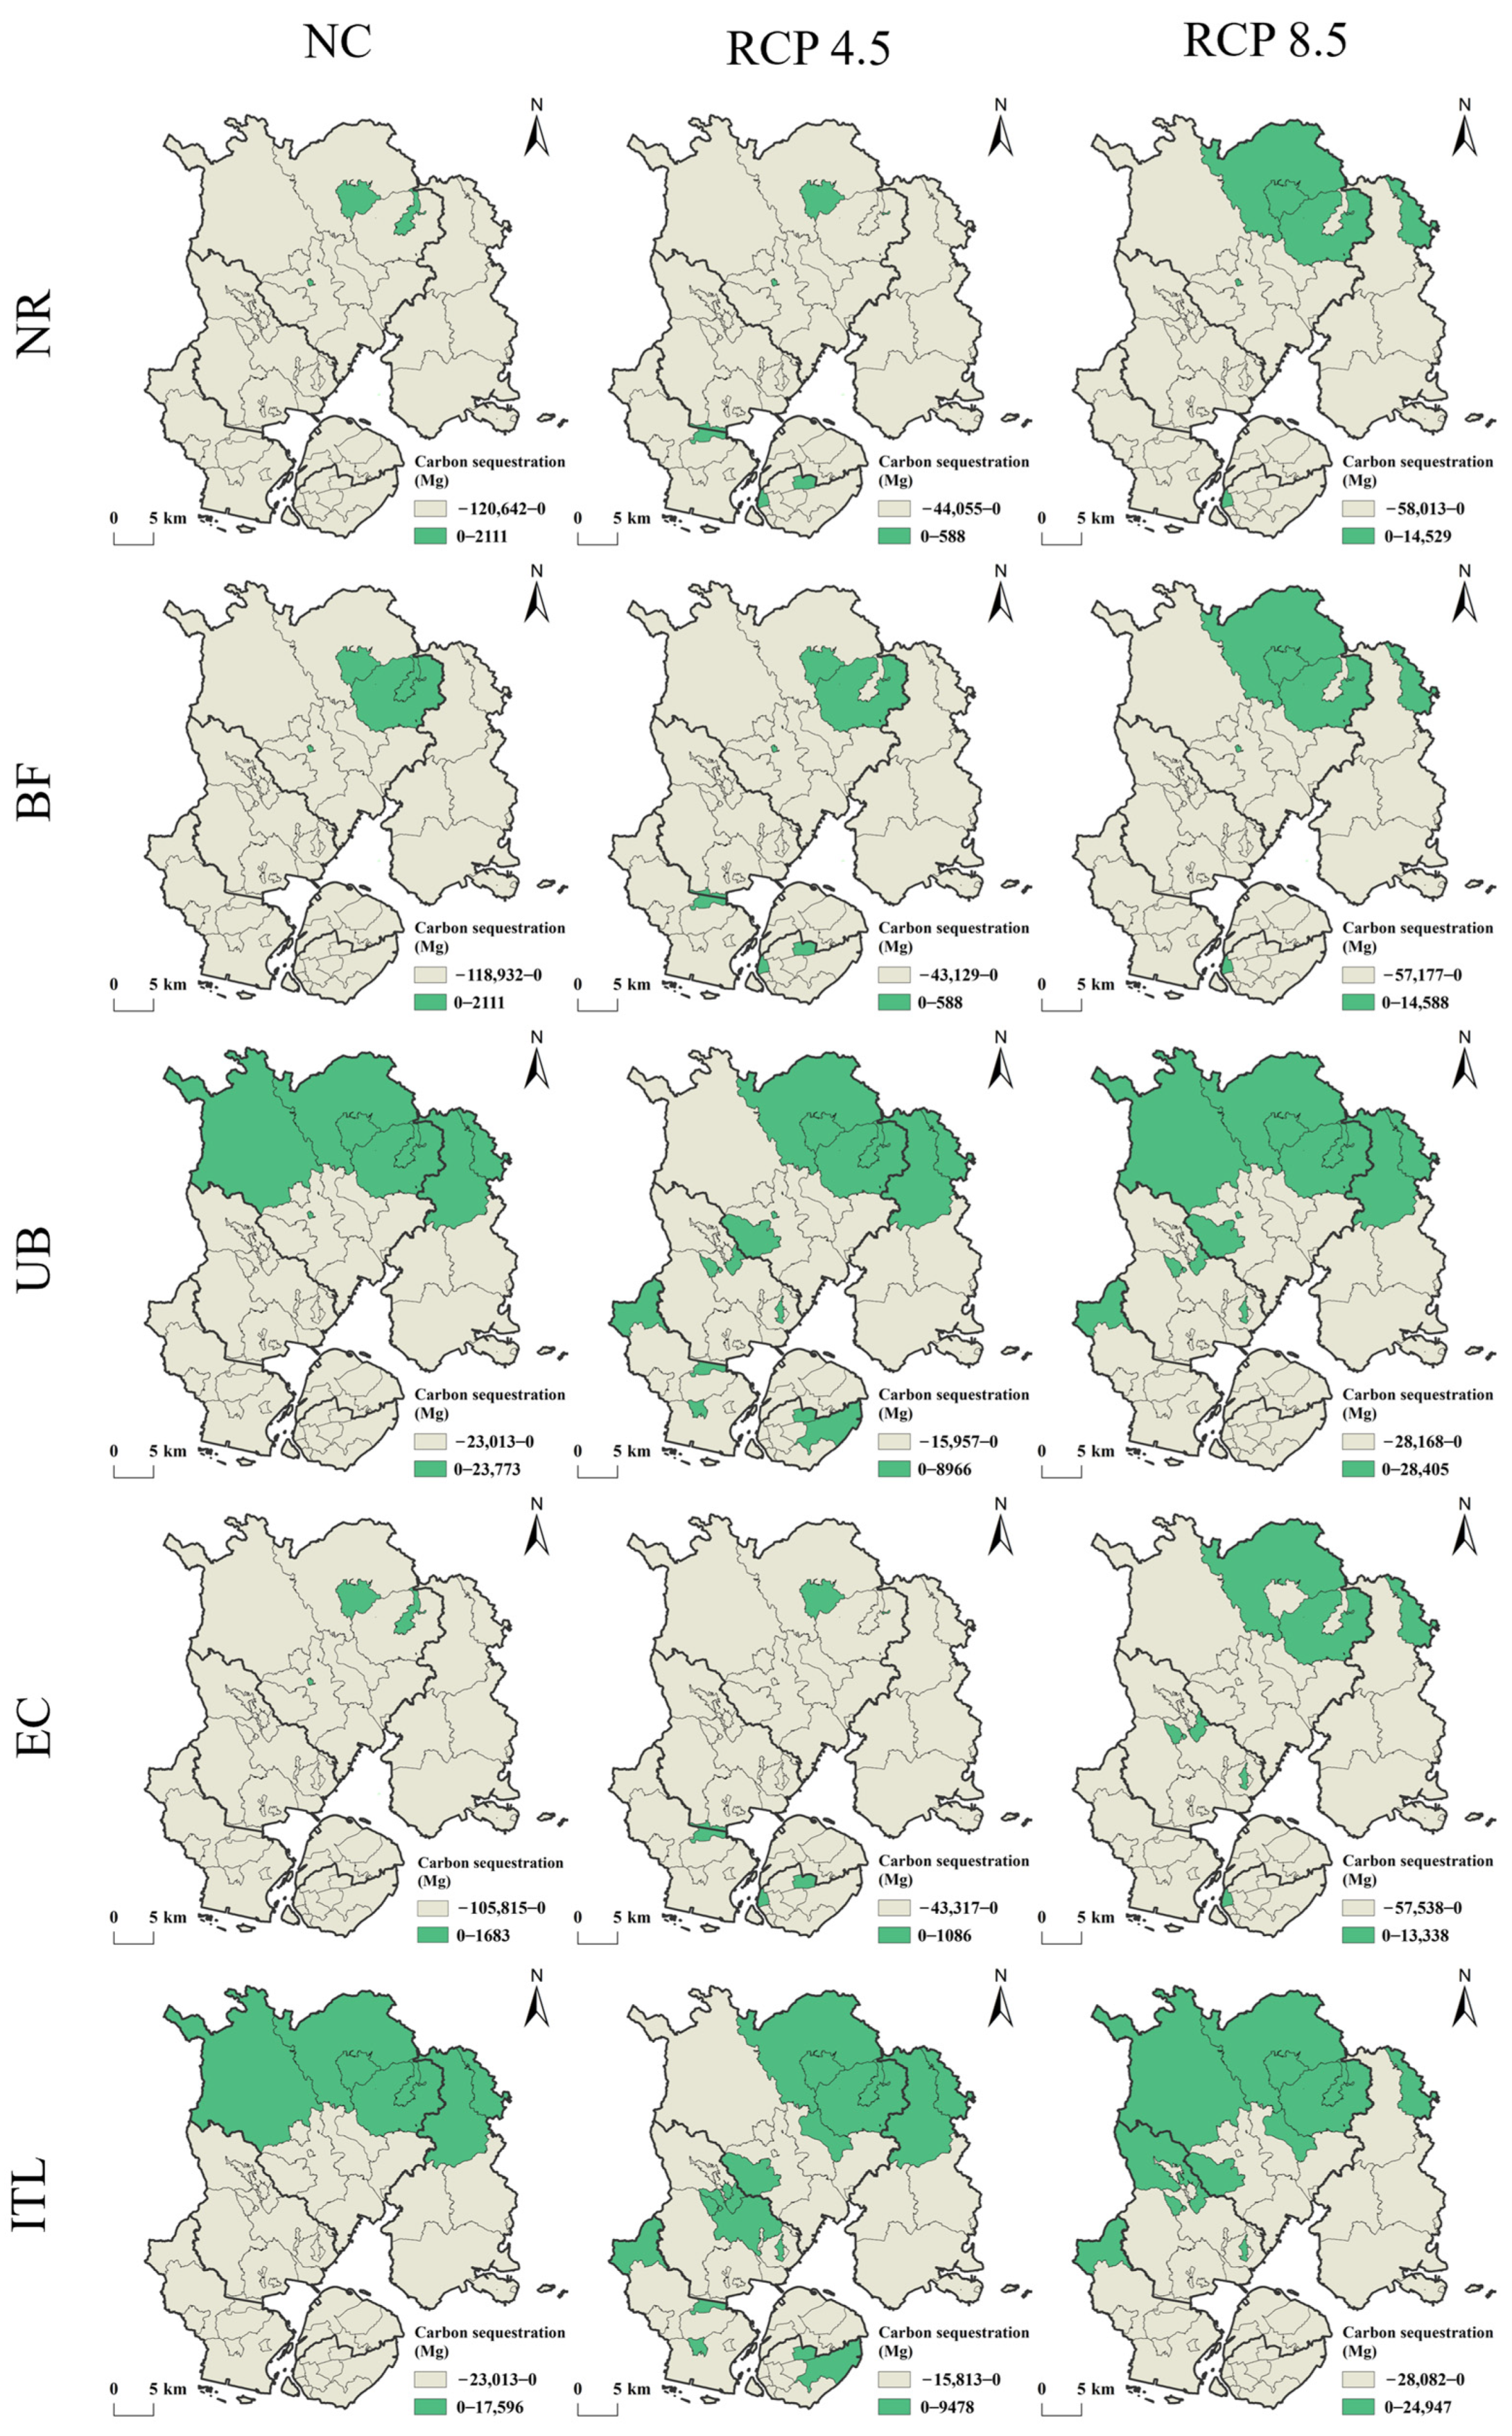
4.3. Carbon Sequestration Under Various Scenarios
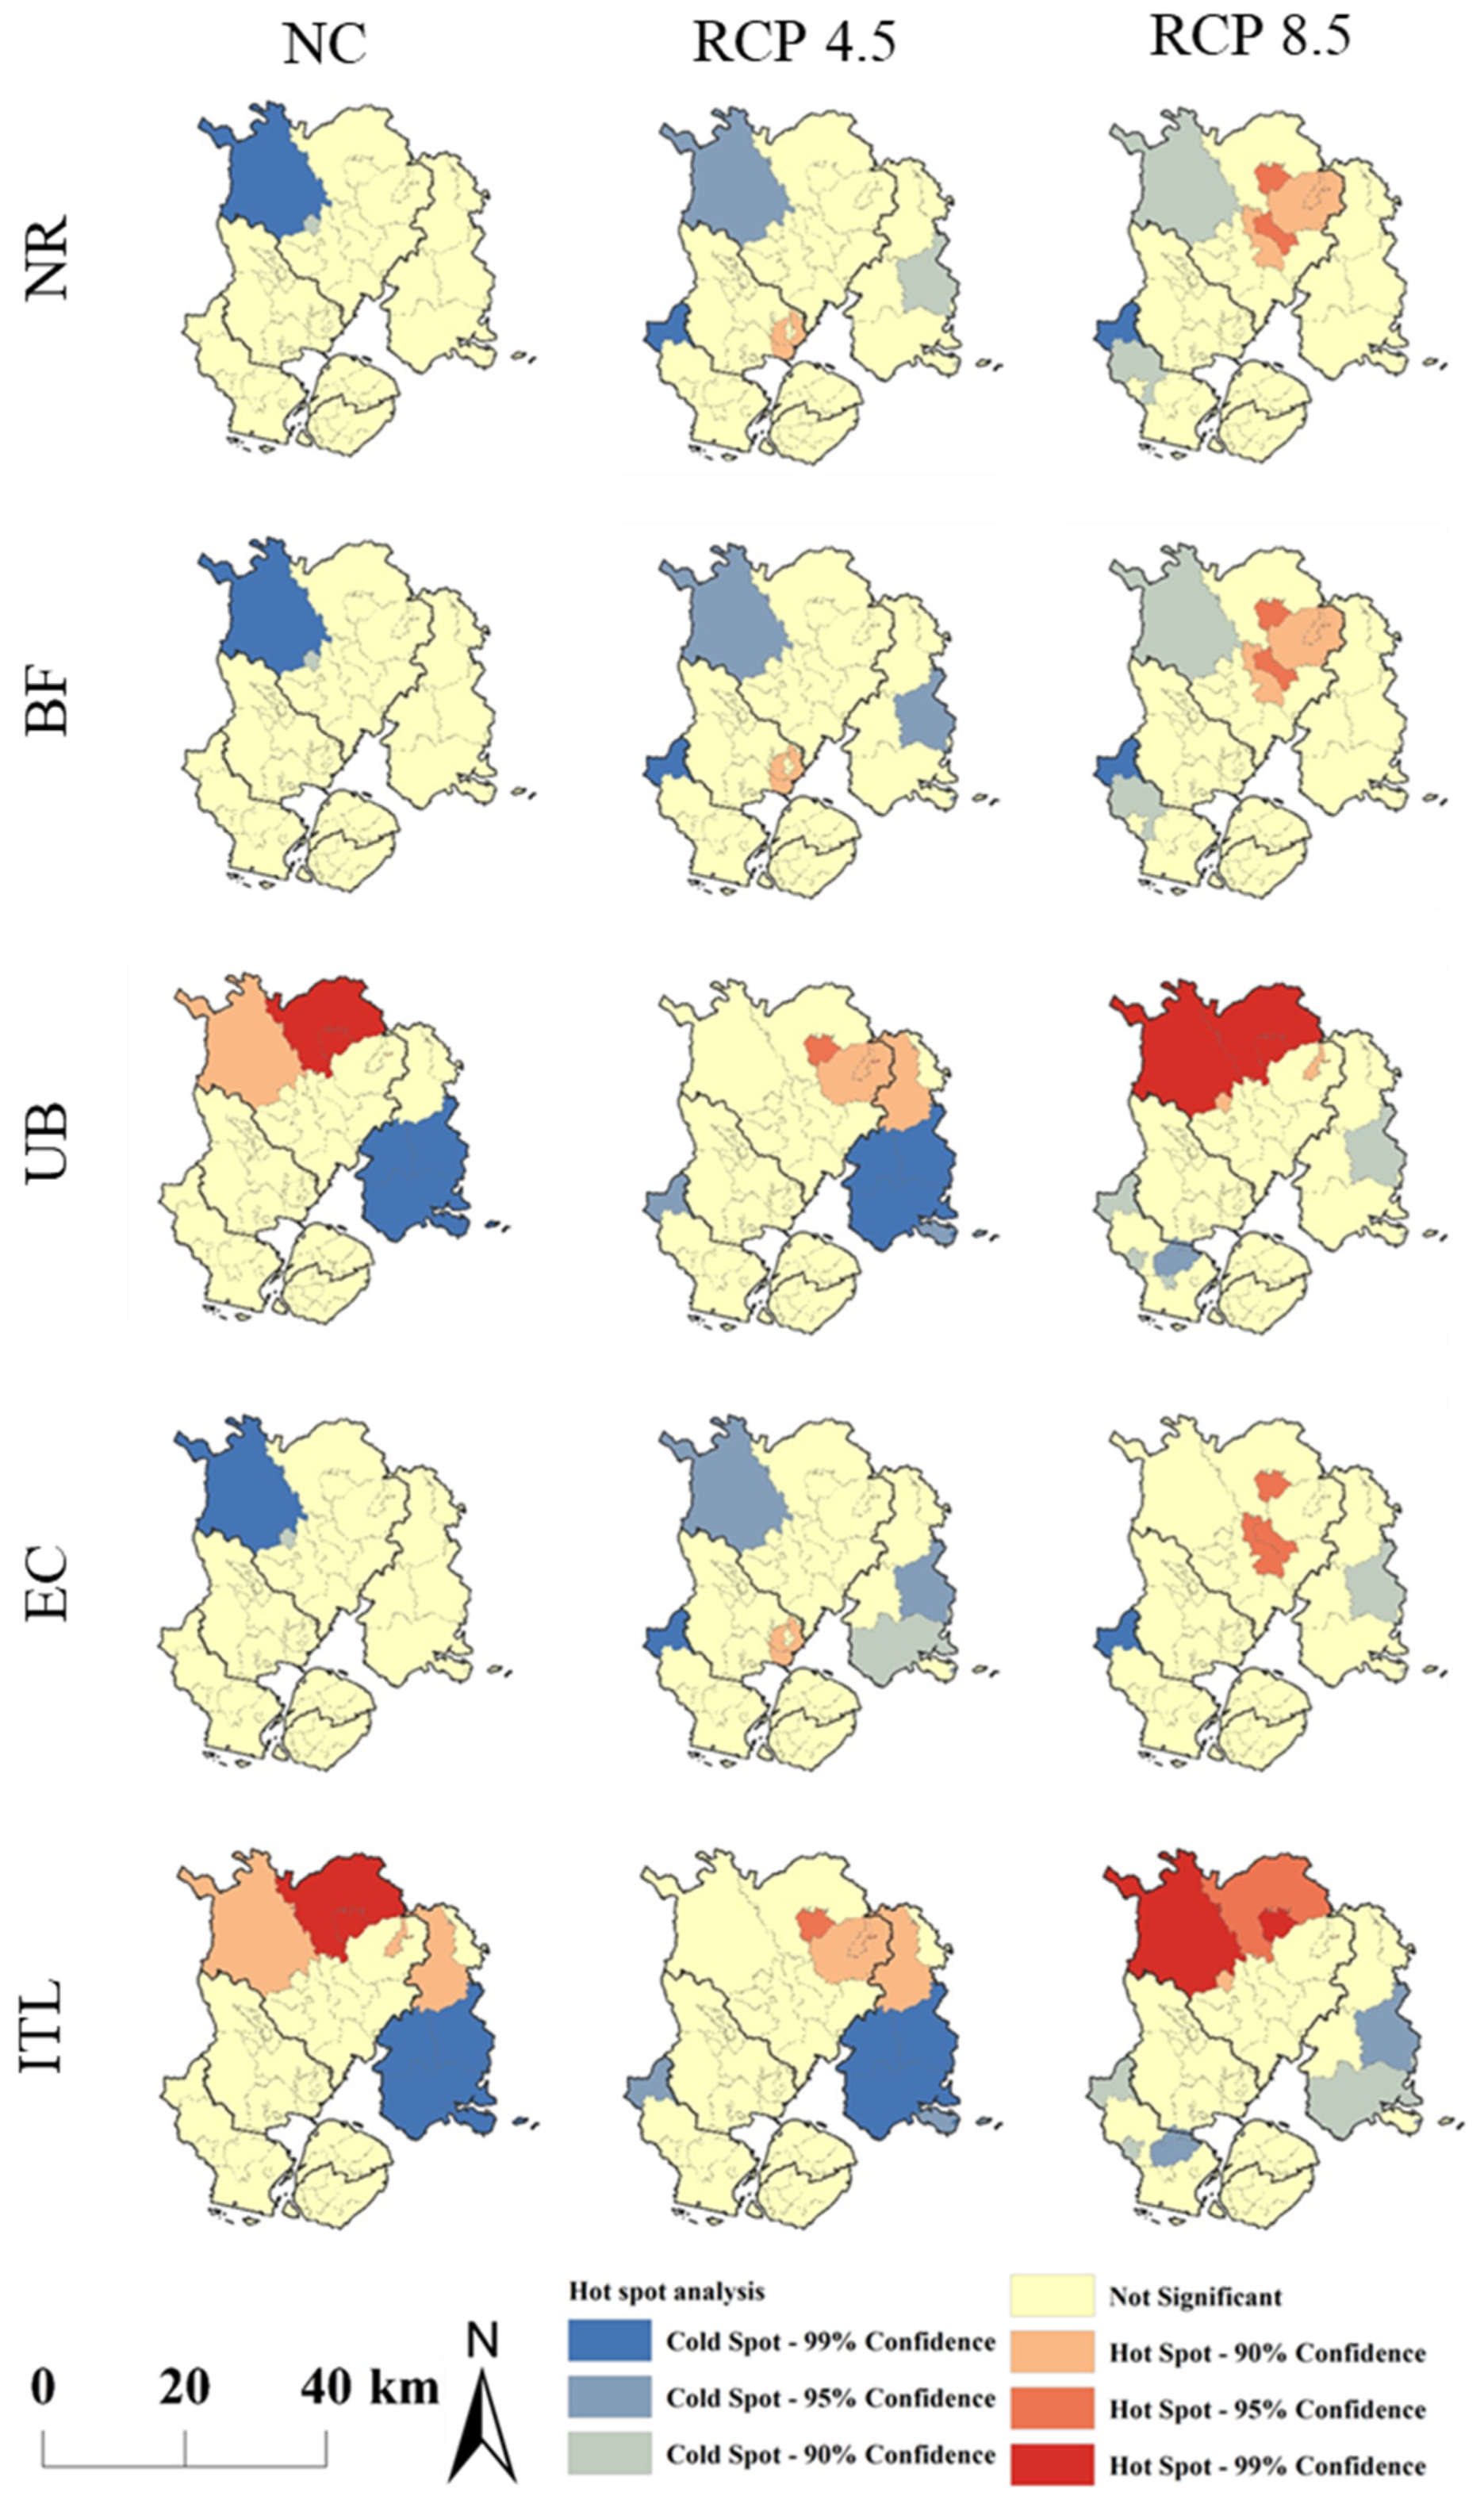
4.4. Spatial Patterns of Carbon Sequestration Hot/Cold Spots
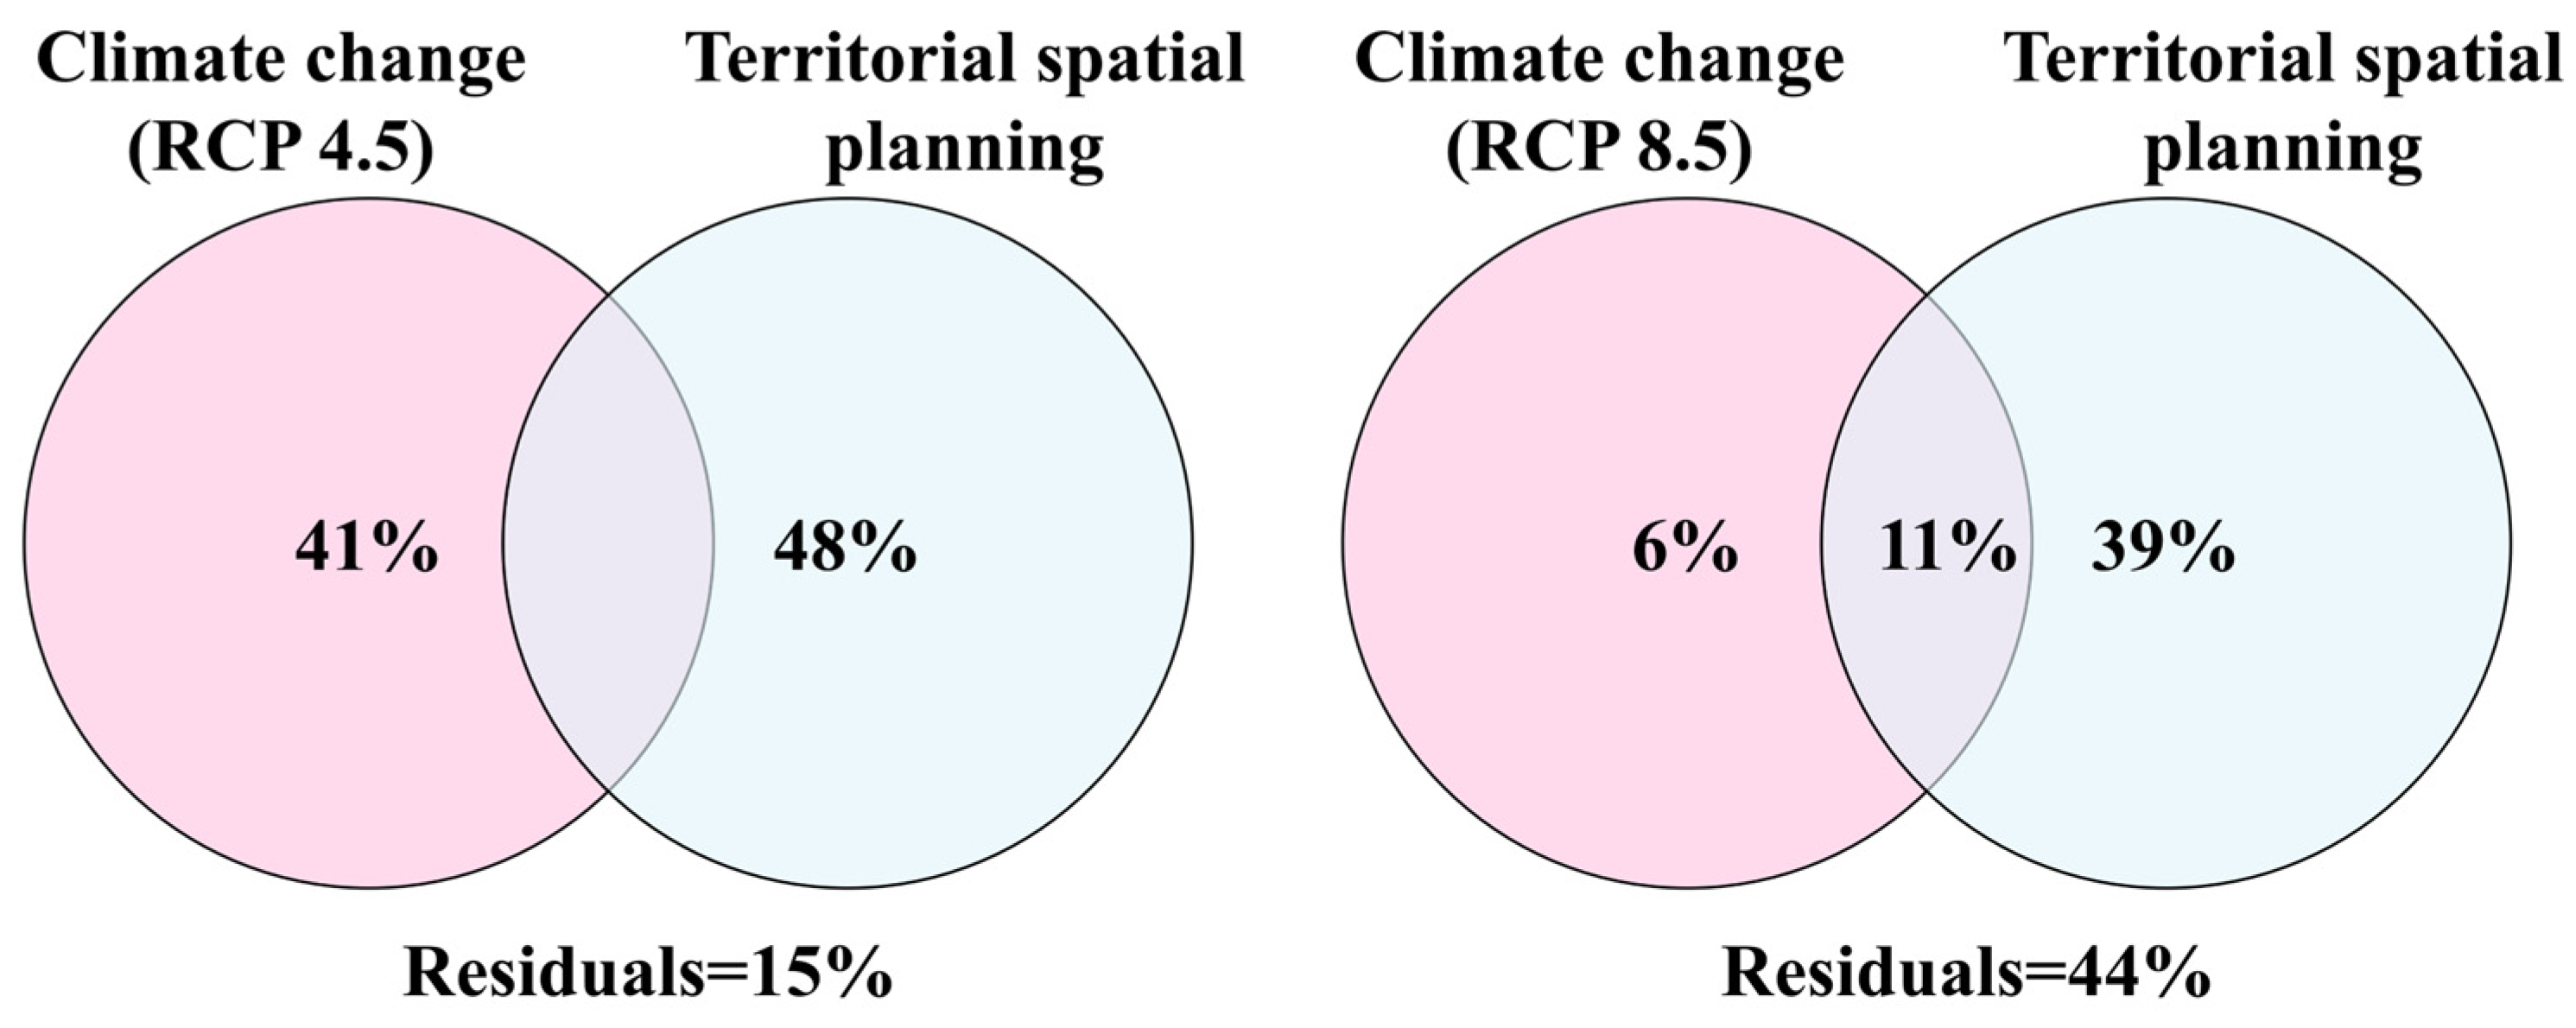
4.5. Impact of Territorial Spatial Planning and Climate Change on Carbon Sequestration
5. Discussion
5.1. The Impact of Territorial Spatial Planning on Carbon Storage
5.2. The Impact of Climate Change on Carbon Storage
5.3. The Impact of Territorial Spatial Planning and Climate Change on Carbon Storage
5.4. Constructing Territorial Spatial Planning for Climate Change Adaptation
5.5. Limitations
6. Conclusions
Supplementary Materials
Author Contributions
Funding
Data Availability Statement
Acknowledgments
Conflicts of Interest
References
- Hoegh-Guldberg, O.; Jacob, D.; Taylor, M.; Guillén Bolaños, T.; Bindi, M.; Brown, S.; Camilloni, I.A.; Diedhiou, A.; Djalante, R.; Ebi, K.; et al. The human imperative of stabilizing global climate change at 1.5 °C. Science 2019, 365, eaaw6974. [Google Scholar] [CrossRef]
- Kumar, A.; Nagar, S.; Anand, S. 1—Climate change and existential threats. In Global Climate Change; Singh, S., Singh, P., Rangabhashiyam, S., Srivastava, K.K., Eds.; Elsevier: Amsterdam, The Netherlands, 2021; pp. 1–31. [Google Scholar]
- Wang, Z. Estimating of terrestrial carbon storage and its internal carbon exchange under equilibrium state. Ecol. Model. 2019, 401, 94–110. [Google Scholar] [CrossRef]
- Wang, Z.; Li, X.; Mao, Y.; Li, L.; Wang, X.; Lin, Q. Dynamic simulation of land use change and assessment of carbon storage based on climate change scenarios at the city level: A case study of Bortala, China. Ecol. Indic. 2022, 134, 108499. [Google Scholar] [CrossRef]
- Zhu, L.; Song, R.; Sun, S.; Li, Y.; Hu, K. Land use/land cover change and its impact on ecosystem carbon storage in coastal areas of China from 1980 to 2050. Ecol. Indic. 2022, 142, 109178. [Google Scholar] [CrossRef]
- Li, G.; Cheng, G.; Liu, G.; Chen, C.; He, Y. Simulating the Land Use and Carbon Storage for Nature-Based Solutions (NbS) under Multi-Scenarios in the Three Gorges Reservoir Area: Integration of Remote Sensing Data and the RF–Markov–CA–InVEST Model. Remote Sensing 2023, 15, 5100. [Google Scholar] [CrossRef]
- Guo, M.; Ma, S.; Wang, L.-J.; Lin, C. Impacts of future climate change and different management scenarios on water-related ecosystem services: A case study in the Jianghuai ecological economic Zone, China. Ecol. Indic. 2021, 127, 107732. [Google Scholar] [CrossRef]
- Zaehle, S.; Bondeau, A.; Carter, T.R.; Cramer, W.; Erhard, M.; Prentice, I.C.; Reginster, I.; Rounsevell, M.D.A.; Sitch, S.; Smith, B.; et al. Projected Changes in Terrestrial Carbon Storage in Europe under Climate and Land-use Change, 1990–2100. Ecosystems 2007, 10, 380–401. [Google Scholar] [CrossRef]
- Arneth, A.; Sitch, S.; Pongratz, J.; Stocker, B.D.; Ciais, P.; Poulter, B.; Bayer, A.D.; Bondeau, A.; Calle, L.; Chini, L.P.; et al. Historical carbon dioxide emissions caused by land-use changes are possibly larger than assumed. Nat. Geosci. 2017, 10, 79–84. [Google Scholar] [CrossRef]
- Eggleston, H.S.; Buendia, L.; Miwa, K.; Ngara, T.; Tanabe, K. 2006 IPCC Guidelines for National Greenhouse Gas Inventories; Institute for Global Environmental Strategies: Hayama, Japan, 2006. [Google Scholar]
- Yue, C.; Ciais, P.; Houghton, R.A.; Nassikas, A.A. Contribution of land use to the interannual variability of the land carbon cycle. Nat. Commun. 2020, 11, 3170. [Google Scholar] [CrossRef] [PubMed]
- Seto, K.C.; Dhakal, S.; Bigio, A.; Blanco, H.; Carlo Delgado, G.; Dewar, D.; Huang, L.; Inaba, A.; Kansal, A.; Lwasa, S. Human Settlements, Infrastructure, and Spatial Planning; Cambridge University Press: Cambridge, UK; New York, NY, USA, 2014. [Google Scholar]
- Intergovernmental Panel on Climate Change (Ed.) Climate Change 2022—Mitigation of Climate Change: Working Group III Contribution to the Sixth Assessment Report of the Intergovernmental Panel on Climate Change; Cambridge University Press: Cambridge, UK, 2023. [Google Scholar]
- Zhang, H.; Peng, J.; Wang, R.; Zhang, J.; Yu, D. Spatial planning factors that influence CO2 emissions: A systematic literature review. Urban Clim. 2021, 36, 100809. [Google Scholar] [CrossRef]
- Yanbo, Q.; Shilei, W.; Yaya, T.; Guanghui, J.; Tao, Z.; Liang, M. Territorial spatial planning for regional high-quality development—An analytical framework for the identification, mediation and transmission of potential land utilization conflicts in the Yellow River Delta. Land Use Policy 2023, 125, 106462. [Google Scholar] [CrossRef]
- Xiang, S.; Wang, Y.; Deng, H.; Yang, C.; Wang, Z.; Gao, M. Response and multi-scenario prediction of carbon storage to land use/cover change in the main urban area of Chongqing, China. Ecol. Indic. 2022, 142, 109205. [Google Scholar] [CrossRef]
- Parmesan, C.; Yohe, G. A globally coherent fingerprint of climate change impacts across natural systems. Nature 2003, 421, 37–42. [Google Scholar] [CrossRef] [PubMed]
- Ballantyne, A.á.; Alden, C.á.; Miller, J.á.; Tans, P.á.; White, J.J.N. Increase in observed net carbon dioxide uptake by land and oceans during the past 50 years. Nature 2012, 488, 70–72. [Google Scholar] [CrossRef] [PubMed]
- Jiao, K.; Liu, Z.; Wang, W.; Yu, K.; McGrath, M.J.; Xu, W. Carbon cycle responses to climate change across China’s terrestrial ecosystem: Sensitivity and driving process. Sci. Total Environ. 2024, 915, 170053. [Google Scholar] [CrossRef] [PubMed]
- Kirkland, M.; Atkinson, P.W.; Pearce-Higgins, J.W.; de Jong, M.C.; Dowling, T.P.F.; Grummo, D.; Critchley, M.; Ashton-Butt, A. Landscape fires disproportionally affect high conservation value temperate peatlands, meadows, and deciduous forests, but only under low moisture conditions. Sci. Total Environ. 2023, 884, 163849. [Google Scholar] [CrossRef] [PubMed]
- Chen, B.; Wu, S.; Jin, Y.; Song, Y.; Wu, C.; Venevsky, S.; Xu, B.; Webster, C.; Gong, P. Wildfire risk for global wildland–urban interface areas. Nat. Sustain. 2024, 7, 474–484. [Google Scholar] [CrossRef]
- Tang, X.; Zhao, X.; Bai, Y.; Tang, Z.; Wang, W.; Zhao, Y.; Wan, H.; Xie, Z.; Shi, X.; Wu, B.; et al. Carbon pools in China’s terrestrial ecosystems: New estimates based on an intensive field survey. Proc. Natl. Acad. Sci. USA 2018, 115, 4021–4026. [Google Scholar] [CrossRef]
- Zhou, J.; Zhao, Y.; Huang, P.; Zhao, X.; Feng, W.; Li, Q.; Xue, D.; Dou, J.; Shi, W.; Wei, W.; et al. Impacts of ecological restoration projects on the ecosystem carbon storage of inland river basin in arid area, China. Ecol. Indic. 2020, 118, 106803. [Google Scholar] [CrossRef]
- Song, J.; Wan, S.; Piao, S.; Knapp, A.K.; Classen, A.T.; Vicca, S.; Ciais, P.; Hovenden, M.J.; Leuzinger, S.; Beier, C.; et al. A meta-analysis of 1,119 manipulative experiments on terrestrial carbon-cycling responses to global change. Nat. Ecol. Evol. 2019, 3, 1309–1320. [Google Scholar] [CrossRef] [PubMed]
- Pechanec, V.; Purkyt, J.; Benc, A.; Nwaogu, C.; Štěrbová, L.; Cudlín, P. Modelling of the carbon sequestration and its prediction under climate change. Ecol. Inform. 2018, 47, 50–54. [Google Scholar] [CrossRef]
- Wang, W.; Yu, H.; Tong, X.; Jia, Q. Estimating terrestrial ecosystem carbon storage change in the YREB caused by land-use change under SSP-RCPs scenarios. J. Clean. Prod. 2024, 469, 143205. [Google Scholar] [CrossRef]
- Guo, W.; Teng, Y.; Li, J.; Yan, Y.; Zhao, C.; Li, Y.; Li, X. A new assessment framework to forecast land use and carbon storage under different SSP-RCP scenarios in China. Sci. Total Environ. 2024, 912, 169088. [Google Scholar] [CrossRef]
- Yang, X.; Chen, R.; Zheng, X.Q. Simulating land use change by integrating ANN-CA model and landscape pattern indices. Geomat. Nat. Hazards Risk 2016, 7, 918–932. [Google Scholar] [CrossRef]
- He, Y.; Ma, J.; Zhang, C.; Yang, H. Spatio-Temporal Evolution and Prediction of Carbon Storage in Guilin Based on FLUS and InVEST Models. Remote Sens. 2023, 15, 1445. [Google Scholar] [CrossRef]
- Babbar, D.; Areendran, G.; Sahana, M.; Sarma, K.; Raj, K.; Sivadas, A. Assessment and prediction of carbon sequestration using Markov chain and InVEST model in Sariska Tiger Reserve, India. J. Clean. Prod. 2021, 278, 123333. [Google Scholar] [CrossRef]
- Yan, X.; Li, M.; Guo, D.; Yang, D.; Zhan, D. Spatial-temporal evolution and prediction of carbon storage in Mohe city by linking the logistic-CA-Markov and InVEST models. Front. Earth Sci. 2024, 12, 1383237. [Google Scholar] [CrossRef]
- Verburg, P.H.; Soepboer, W.; Veldkamp, A.; Limpiada, R.; Espaldon, V.; Mastura, S.S.A. Modeling the Spatial Dynamics of Regional Land Use: The CLUE-S Model. Environ. Manag. 2002, 30, 391–405. [Google Scholar] [CrossRef]
- Li, J.; Gong, J.; Guldmann, J.-M.; Li, S.; Zhu, J. Carbon Dynamics in the Northeastern Qinghai–Tibetan Plateau from 1990 to 2030 Using Landsat Land Use/Cover Change Data. Remote Sens. 2020, 12, 528. [Google Scholar] [CrossRef]
- Liu, X.; Liang, X.; Li, X.; Xu, X.; Ou, J.; Chen, Y.; Li, S.; Wang, S.; Pei, F. A future land use simulation model (FLUS) for simulating multiple land use scenarios by coupling human and natural effects. Landsc. Urban Plan. 2017, 168, 94–116. [Google Scholar] [CrossRef]
- Ministry of Ecology and Environment of the People’s Republic of China. Notice on the Issuance of the National Climate Change Adaptation Strategy 2035. Available online: https://www.gov.cn/zhengce/zhengceku/2022-06/14/content_5695555.htm (accessed on 9 November 2024).
- Lin, J.; Jacoby, J.; Cui, S.; Liu, Y.; Lin, T. A model for developing a target integrated low carbon city indicator system: The case of Xiamen, China. Ecol. Indic. 2014, 40, 51–57. [Google Scholar] [CrossRef]
- Qian, L.; Huang, Z.; Yang, S.; Cao, W. Study on spatial conservation priority pattern of key protected plants in Xiamen. Acta Ecol. Sin. 2021, 41, 4367–4378. (In Chinese) [Google Scholar]
- Xiamen Municipal People’s Government. Population. Available online: https://www.xm.gov.cn/zjxm/qhhrk/202212/t20221215_2709954.htm (accessed on 27 December 2024).
- Lin, J.; He, P.; Yang, L.; He, X.; Lu, S.; Liu, D. Predicting future urban waterlogging-prone areas by coupling the maximum entropy and FLUS model. Sustain. Cities Soc. 2022, 80, 103812. [Google Scholar] [CrossRef]
- Chen, Z.; Huang, M.; Zhu, D.; Altan, O. Integrating Remote Sensing and a Markov-FLUS Model to Simulate Future Land Use Changes in Hokkaido, Japan. Remote Sens. 2021, 13, 2621. [Google Scholar] [CrossRef]
- Liu, P.; Hu, Y.; Jia, W. Land use optimization research based on FLUS model and ecosystem services–setting Jinan City as an example. Urban Clim. 2021, 40, 100984. [Google Scholar] [CrossRef]
- Moss, R.H.; Edmonds, J.A.; Hibbard, K.A.; Manning, M.R.; Rose, S.K.; van Vuuren, D.P.; Carter, T.R.; Emori, S.; Kainuma, M.; Kram, T.; et al. The next generation of scenarios for climate change research and assessment. Nature 2010, 463, 747–756. [Google Scholar] [CrossRef] [PubMed]
- Xinhua Agency. Opinions of the CPC Central Committee and the State Council on the Establishment and Supervision of Territorial Space Planning System. 2019. Available online: http://www.xinhuanet.com/politics/2019-05/23/c_1124534206.htm (accessed on 20 November 2024).
- Adelisardou, F.; Zhao, W.; Chow, R.; Mederly, P.; Minkina, T.; Schou, J.S. Spatiotemporal change detection of carbon storage and sequestration in an arid ecosystem by integrating Google Earth Engine and InVEST (the Jiroft plain, Iran). Int. J. Environ. Sci. Technol. 2022, 19, 5929–5944. [Google Scholar] [CrossRef]
- Sharp, R.; Chaplin-Kramer, R.; Wood, S.; Guerry, A.; Tallis, H.; Ricketts, T.; Nelson, E.; Ennaanay, D.; Wolny, S.; Olwero, N.; et al. InVEST User’s Guide; The Natural Capital Project: Stanford, CA, USA, 2018. [Google Scholar]
- Hua, Y.; Yan, D.; Liu, X. Assessing synergies and trade-offs between ecosystem services in highly urbanized area under different scenarios of future land use change. Environ. Sustain. Indic. 2024, 22, 100350. [Google Scholar] [CrossRef]
- Truchy, A.; Göthe, E.; Angeler, D.G.; Ecke, F.; Sponseller, R.A.; Bundschuh, M.; Johnson, R.K.; McKie, B.G. Partitioning spatial, environmental, and community drivers of ecosystem functioning. Landsc. Ecol. 2019, 34, 2371–2384. [Google Scholar] [CrossRef]
- Oksanen, J.; Blanchet, F.G.; Kindt, R.; Legendre, P.; Minchin, P.; O’Hara, R.B.; Simpson, G.; Solymos, P.; Stevens, M.H.H.; Wagner, H. Vegan: Community Ecology Package. R Package Vegan, Vers. 2.2-1. 2015. Available online: https://cran.r-project.org/package=vegan (accessed on 20 July 2024).
- Huang, Y.; Lin, T.; Zhang, G.; Zhu, Y.; Zeng, Z.; Ye, H. Spatial patterns of urban green space and its actual utilization status in China based on big data analysis. Big Earth Data 2021, 5, 391–409. [Google Scholar] [CrossRef]
- Shao, G.; Tang, L.; Zhang, H. Introducing Image Classification Efficacies. IEEE Access 2021, 9, 134809–134816. [Google Scholar] [CrossRef]
- Zhang, B.; Li, L.; Xia, Q.Y.; Dong, J. Land use change and its impact on carbon storage under the constraints of “three lines”: A case study of Wuhan City circle. Acta Ecol. Sin. 2022, 42, 2265–2280. [Google Scholar] [CrossRef]
- Huang, W.; Guo, L.; Zhang, T.; Chen, T.; Chen, L.; Li, L.; Zhang, X. The Impact of Territorial Spatial Transformation on Carbon Storage: A Case Study of Suqian, East China. Land 2024, 13, 348. [Google Scholar] [CrossRef]
- Lu, F.; Hu, H.; Sun, W.; Zhu, J.; Liu, G.; Zhou, W.; Zhang, Q.; Shi, P.; Liu, X.; Wu, X.; et al. Effects of national ecological restoration projects on carbon sequestration in China from 2001 to 2010. Proc. Natl. Acad. Sci. USA 2018, 115, 4039–4044. [Google Scholar] [CrossRef] [PubMed]
- Liu, W.; Yan, Y.; Wang, D.; Ma, W. Integrate carbon dynamics models for assessing the impact of land use intervention on carbon sequestration ecosystem service. Ecol. Indic. 2018, 91, 268–277. [Google Scholar] [CrossRef]
- Gu, F.; Zhang, Y.; Huang, M.; Yu, L.; Yan, H.; Guo, R.; Zhang, L.; Zhong, X.; Yan, C. Climate-induced increase in terrestrial carbon storage in the Yangtze River Economic Belt. Ecol. Evol. 2021, 11, 7211–7225. [Google Scholar] [CrossRef] [PubMed]
- Ito, A.; Nishina, K.; Noda, H.M. Impacts of future climate change on the carbon budget of northern high-latitude terrestrial ecosystems: An analysis using ISI-MIP data. Polar Sci. 2016, 10, 346–355. [Google Scholar] [CrossRef]
- Riahi, K.; Rao, S.; Krey, V.; Cho, C.; Chirkov, V.; Fischer, G.; Kindermann, G.; Nakicenovic, N.; Rafaj, P. RCP 8.5—A scenario of comparatively high greenhouse gas emissions. Clim. Chang. 2011, 109, 33. [Google Scholar] [CrossRef]
- Sarofim, M.C.; Smith, C.J.; Malek, P.; McDuffie, E.E.; Hartin, C.A.; Lay, C.R.; McGrath, S. High radiative forcing climate scenario relevance analyzed with a ten-million-member ensemble. Nat. Commun. 2024, 15, 8185. [Google Scholar] [CrossRef] [PubMed]
- Yin, Y.; Ma, D.; Wu, S. Climate change risk to forests in China associated with warming. Sci. Rep. 2018, 8, 493. [Google Scholar] [CrossRef] [PubMed]
- Zhou, K.; Wang, S.; Feng, Y. How Is Spatial Planning Adapting to Climate Change? A Textual Analysis Based on the Territorial and Spatial Plans of 368 Chinese Cities. Land 2023, 12, 1993. [Google Scholar] [CrossRef]
- Intergovernmental Panel on Climate Change [IPCC]. Summary for Policymakers. In Climate Change 2014: Mitigation of Climate Change; Edenhofer, O., Madruga, R.P., Sokona, Y., Farahani, E., Kadner, S., Seyboth, K., Adler, A., Baum, I., Brunner, S., Eickemeier, P., et al., Eds.; Contribution of Working Group III to the Fifth Assessment Report of the Intergovernmental Panel on Climate Change; Cambridge University Press: Cambridge, UK, 2014. [Google Scholar]
- Ministry of Ecology and Environment of the People’s Republic of China. Notice on Deepening Pilot Work on the Construction of Climate-Resilient Cities. Available online: https://www.mee.gov.cn/xxgk2018/xxgk/xxgk05/202308/t20230825_1039387.html (accessed on 23 November 2024).


| Data | Source | Year | Resolution |
|---|---|---|---|
| Landsat 8 OLI/TIRS | Geospatial Data Cloud (https://www.gscloud.cn/ (accessed on 6 July 2024)) | 2015, 2020 | 30 m |
| DEM | Geospatial Data Cloud (https://www.gscloud.cn/ (accessed on 7 July 2024)) | 2009 | 30 m |
| Slope | Calculated from DEM data | 2009 | 30 m |
| Elevation | Calculated from DEM data | 2009 | 30 m |
| Railway and road data | National Catalogue Service For Geographic Information (https://www.webmap.cn/ (accessed on 12 July 2024)) | 2022 | − |
| GDP | Resource and Environment Science and Data Center (https://www.resdc.cn/ (accessed on 19 July 2024)) | 2020 | 1 km |
| Population | Resource and Environment Science and Data Center (https://www.resdc.cn/ (accessed on 19 July 2024)) | 2020 | 1 km |
| RCP 4.5, RCP 8.5 | WorldClim Data Website (https://www.worldclim.org/ (accessed on 16 September 2021)) | − | 900 m |
| The territorial spatial planning three control lines data | Xiamen Municipal Bureau of Natural Resources and Planning | 2019 | − |
| NR | EC | BF | UB | ITL | |
|---|---|---|---|---|---|
| NC | NR_NC | EC_NC | BF_NC | UB_NC | ITL_NC |
| RCP 4.5 | NR_RCP 4.5 | EC_RCP 4.5 | BF_RCP 4.5 | UB_RCP 4.5 | ITL_RCP 4.5 |
| RCP 8.5 | NR_RCP 8.5 | EC_RCP 8.5 | BF_RCP 8.5 | UB_RCP 8.5 | ITL_RCP 8.5 |
| Land Use Type | C_above | C_below | C_soil | C_dead |
|---|---|---|---|---|
| Farmland | 46.5 | 80.7 | 108.4 | 0 |
| Forest land | 42.4 | 115.9 | 236.9 | 0 |
| Grassland | 4.3 | 86.5 | 99.9 | 0 |
| Built-up land | 1.2 | 0 | 71 | 0 |
| Unused land | 0 | 0 | 50 | 0 |
| Waterbody | 0 | 0 | 0 | 0 |
Disclaimer/Publisher’s Note: The statements, opinions and data contained in all publications are solely those of the individual author(s) and contributor(s) and not of MDPI and/or the editor(s). MDPI and/or the editor(s) disclaim responsibility for any injury to people or property resulting from any ideas, methods, instructions or products referred to in the content. |
© 2025 by the authors. Licensee MDPI, Basel, Switzerland. This article is an open access article distributed under the terms and conditions of the Creative Commons Attribution (CC BY) license (https://creativecommons.org/licenses/by/4.0/).
Share and Cite
Zhu, W.; Lan, T.; Tang, L. Impacts of Future Climate Change and Xiamen’s Territorial Spatial Planning on Carbon Storage and Sequestration. Remote Sens. 2025, 17, 273. https://doi.org/10.3390/rs17020273
Zhu W, Lan T, Tang L. Impacts of Future Climate Change and Xiamen’s Territorial Spatial Planning on Carbon Storage and Sequestration. Remote Sensing. 2025; 17(2):273. https://doi.org/10.3390/rs17020273
Chicago/Turabian StyleZhu, Wei, Ting Lan, and Lina Tang. 2025. "Impacts of Future Climate Change and Xiamen’s Territorial Spatial Planning on Carbon Storage and Sequestration" Remote Sensing 17, no. 2: 273. https://doi.org/10.3390/rs17020273
APA StyleZhu, W., Lan, T., & Tang, L. (2025). Impacts of Future Climate Change and Xiamen’s Territorial Spatial Planning on Carbon Storage and Sequestration. Remote Sensing, 17(2), 273. https://doi.org/10.3390/rs17020273