Article

Projected Spatiotemporal Evolution of Urban Form Using the SLEUTH Model with Urban Master Plan Scenarios

by
Yuhan Liu
1,
Caiyan Wu
2,3,*,
Jiong Wu
2,
Yangcen Zhang
2,
Xing Bi
2,
Meng Wang
2,
Enrong Yan
1,4,
Conghe Song
5 and
Junxiang Li
2
1
School of Ecological and Environmental Sciences, East China Normal University, Shanghai 200241, China
2
Department of Landscape Architecture, School of Design, Shanghai Jiao Tong University, Shanghai 200240, China
3
Department of Geography, Humboldt-Universität zu Berlin, 12489 Berlin, Germany
4
Shanghai Key Laboratory of Urban Ecological Processes and Eco-Restoration, East China Normal University, Shanghai 200241, China
5
Department of Geography and Environment, University of North Carolina at Chapel Hill, Chapel Hill, NC 27599, USA
*
Author to whom correspondence should be addressed.
Remote Sens. 2025, 17(2), 270; https://doi.org/10.3390/rs17020270
Submission received: 9 November 2024 / Revised: 9 January 2025 / Accepted: 11 January 2025 / Published: 14 January 2025
(This article belongs to the Special Issue Urban Planning Supported by Remote Sensing Technology II)

Abstract

:
Urban growth, a pivotal characteristic of economic development, brings many environmental and ecological challenges. Modeling urban growth is essential for understanding its spatial dynamics and projecting future trends, providing insights for effective urban planning and sustainable development. This study aims to assess the spatiotemporal patterns of urban growth and morphological evolution in mainland Shanghai from 2016 to 2060 using the SLEUTH model under multiple growth scenarios based on the Shanghai Urban Master Plan (2017–2035). A comprehensive set of urban growth metrics and quadrant analysis were employed to quantify the magnitude, rate, intensity, and direction of urban growth, as well as morphological evolution, over time. We found that (1) significant urban growth was observed across most scenarios, with the exception of stringent land protection. The most substantial growth occurred prior to 2045 with an obvious north–south disparity, where southern regions demonstrated more pronounced increases in urban land area and urbanization rates. (2) The spatiotemporal patterns of the rate and intensity of urban growth exhibited similar characteristics. The spatial pattern followed a “concave shape” pattern and displayed anisotropic behavior, with the high values for these indicators primarily observed before 2025. (3) The urban form followed a diffusion–coalescence process, with patch areas dominated by the infilling mode and patch numbers dominated by the edge-expansion mode. This resulted in significant alternating urban growth models in the infilling, edge-expansion, and leapfrog modes over time, influenced by varying protection intensities. These findings provide valuable insights for forward-looking urban planning, land use optimization, and the support of sustainable urban development.

Graphical Abstract

1. Introduction

Urbanization is a dynamic process that reshapes the built environment, converting rural areas into urban areas and relocating populations [1]. This transformation is evident in the evolution of urban forms [2], including the spatial arrangement of land use and urban landscapes, as well as their changes [3]. Meanwhile, urbanization is influenced by urban planning and a variety of factors, such as infrastructure investments from both the public and private sectors [1]. The interplay between top-down management or investments and bottom-up processes creates the urban development dynamic [4]. Understanding the evolution of urban forms is crucial for enhancing urban planning and identifying effective urban development solutions [5]. While historical urban forms offer valuable insights into past urbanization processes [6], our understanding of future urban forms, especially in urban planning contexts, remains limited. This knowledge is crucial for predicting the trajectory of urbanization and supporting sustainable urban development strategies.
Land use change (LUC) models are powerful tools for simulating and predicting the spatiotemporal dynamics of urban areas, capturing the complex interactions between natural and anthropogenic factors [7]. Urban growth is a key aspect of LUC, which can be modeled with various approaches, including statistical models (e.g., linear and logistic regression) [8], machine learning models (e.g., artificial neural networks, ANNs), tree-based models (e.g., decision trees), and cellular automaton (CA) models [9]. CA-based models are widely used to simulate urban growth dynamics at city, national, and global scales [10]. The SLEUTH model, a CA model [11], estimates two-dimensional urban growth [12]. A unique advantage of the SLEUTH model is its ability for self-modification and adjustment to shifting conditions in urban growth modeling [13]. Scenarios are essential for urban growth modeling to inform planning policies, environmental protection measures, and economic growth expectations [14]. Previous studies using the SLEUTH model have often employed binary or more abstract scenarios like business-as-usual [13,15]. Research in Shanghai has similarly relied on two to four predefined scenarios, mainly focusing on short-term urban growth projections [16,17]. However, such scenarios may not adequately capture the complexities of future urban development, underscoring the need for improved scenario design [18,19]. Recent studies have incorporated objectives like maximizing economic benefits and ecological benefits or balancing both ecological and economic outcomes into scenario analysis [20,21]. Furthermore, landscape ecology principles [22] or habitat quality [23] have been incorporated into the SLEUTH model, serving as exclusion layers to regulate the development boundaries of new urban areas and prevent violations of ecological redlines [23]. Despite these advancements, there remains a significant opportunity to further enhance the model’s comprehensiveness by explicitly integrating urban planning strategies. Such an integration would ensure that predictions of urban growth not only reflect growth dynamics but also align with sustainability objectives and urban planning goals, ultimately contributing to long-term urban sustainability.
Understanding the evolution of urban form deepens our insights into its spatiotemporal layouts and structure changes within cities, which is essential for informed urban planning [24]. Previous studies have demonstrated that different urban growth mechanisms significantly influence urban forms [5,25,26]. Three primary urban growth mechanisms, i.e., infilling, edge-expansion, and leapfrog/outlying, lead to distinct urban morphologies [27,28]. Edge-expansion and leapfrog/outlying generally drive cities outward, resulting in a diffusion process characterized by outward urban growth. In contrast, infilling signifies an inward growth, leading to urban coalescence [5,6]. The diffusion–coalescence hypothesis underlying this process has been widely tested at city, regional, national, and global scales [6,27,29,30,31], providing vital insights for urban planning, policymaking, and sustainability efforts [30,32]. Despite these insights, future changes in urban forms remain uncertain as urbanization processes continue to evolve, necessitating further investigation, particularly concerning the ongoing validity of the diffusion–coalescence hypothesis [24,33,34]. During the urbanization process, newly grown urban patches emerge in various directions at different rates, intensities, and patterns, resulting in anisotropic urban expansion [35,36]. Urban growth patterns are often driven by factors such as urban planning, policy decisions, and economic development [35]. To effectively examine the directional dynamics of urbanization, spatial analysis techniques, such as quadrant analysis, are essential [37,38,39]. By mapping and examining the spatial patterns of future urban growth across different directions, we can achieve a clearer understanding of the magnitude and trajectory of these changes. These insights will improve urbanization dynamic monitoring and land use management, helping policymakers and planners better mitigate the impacts of future land use and land cover changes on urban ecosystem functions [13].
Shanghai, as a metropolis with a distinct central city–satellite structure [40], has experienced rapid urbanization and significant spatiotemporal changes in urban form over recent decades [6,41]. Its urban evolution has been proven to follow the spiraling diffusion–coalescence hypothesis [6]. However, despite extensive research on urban form, accurately predicting its future evolution remains an issue. To project the spatiotemporal patterns of urban growth in Shanghai in the future, we innovatively integrated the SLEUTH model with the Shanghai Urban Master Plan into urban growth scenarios to simulate urban land changes from 2016 to 2060. We further predict the urbanization rate (i.e., the proportion of urban land area) and urban growth rate and intensity while testing the applicability of the diffusion–coalescence hypothesis under varying land use protection scenarios. The following questions are addressed: (1) What are the spatial patterns of urban growth in Shanghai from 2016 to 2060 under the Shanghai urban planning scenarios? (2) What are the spatial dynamics of urban growth in terms of rate, intensity, and directionality, and do these patterns exhibit anisotropy? (3) Does the projected urban form evolution follow the diffusion–coalescence process? Understanding these dynamics will provide valuable insights for urban planners and decision makers in developing effective strategies for sustainable urban development.

2. Materials and Methods
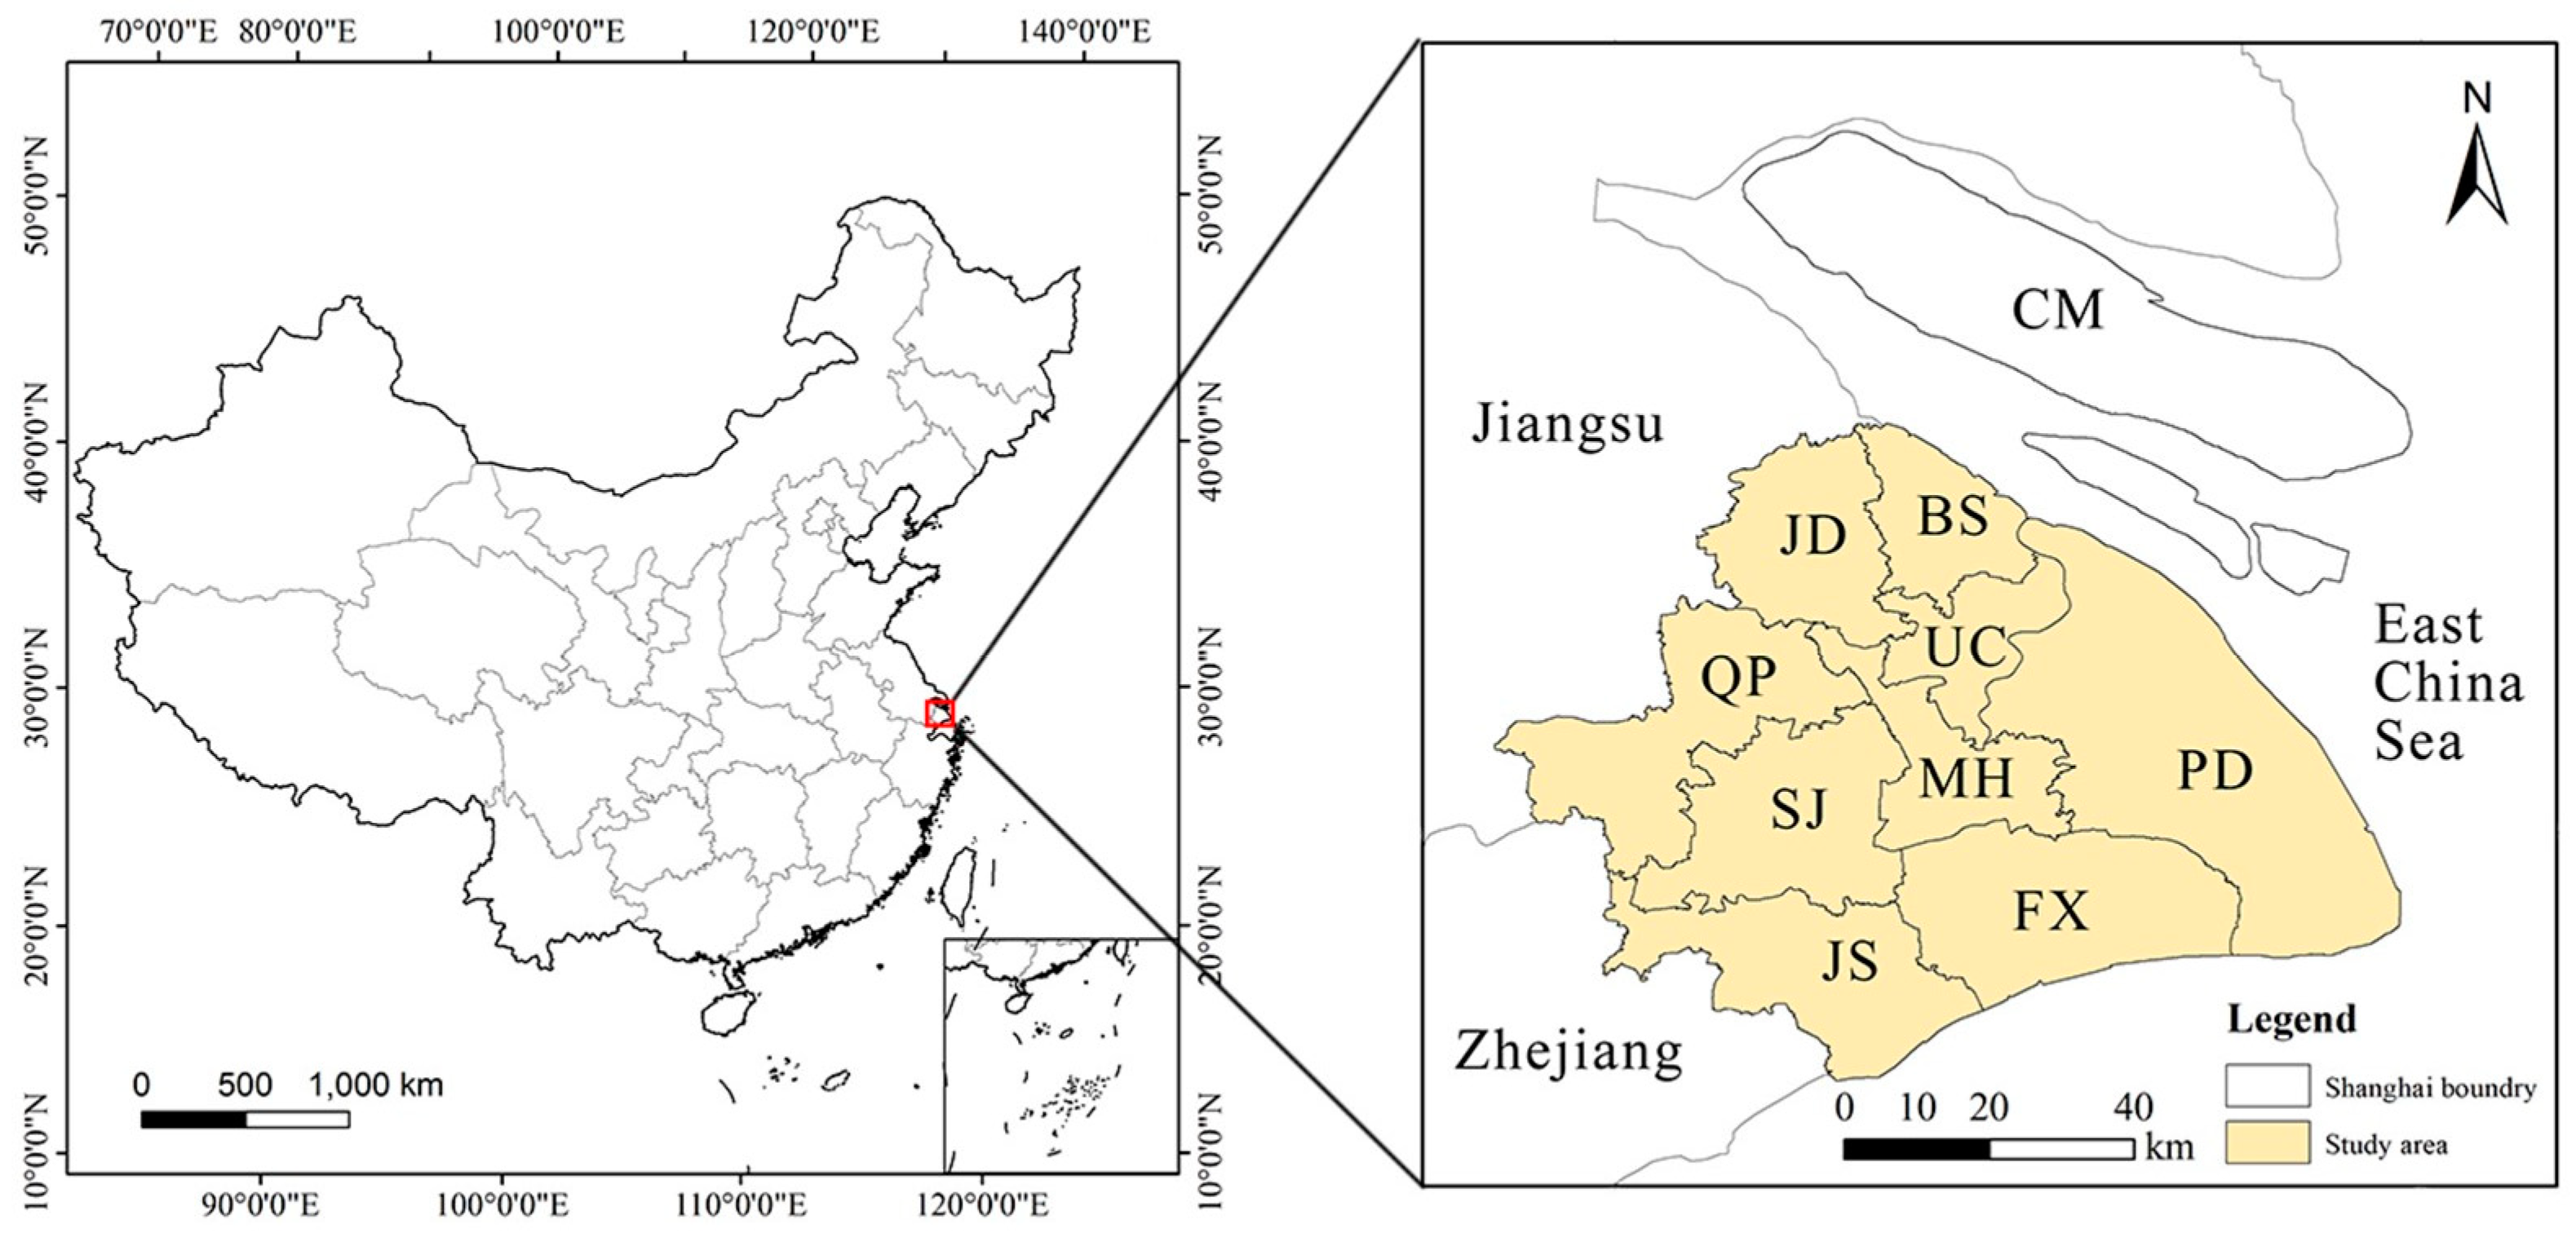
2.1. Study Area

Shanghai, situated in the Yangtze River Delta of East China, spans a total land area of 6340.5 km2. The city is flanked by the East China Sea to the east and the mouth of the Yangtze River to the north and is bordered by the Zhejiang and Jiangsu provinces to the west. It rests on an alluvial plain that features a dense network of waterways, which amounts to a density of 3.38 km/km2 [42]. The region is approximately 2.19 m above sea level on average and is characterized by several low hills. Over the past decades, Shanghai has undergone significant urbanization, leading to substantial alterations in its landscape and a marked increase in total urban land area [6,27,43]. The rapid growth has been accompanied by a marked increase in population and a GDP of almost CNY 4.47 trillion (nearly US $620.23 billion) [44]. Thus, quantifying the future spatiotemporal dynamics of urban development in Shanghai is crucial for understanding the impacts of urbanization, informing effective urban planning, and guiding policy decisions. This research focuses on the mainland of Shanghai, excluding Chongming island (CM), and encompasses seven districts within the urban center (UC) area and eight districts in the suburban and exurban regions: Minhang (MH), Baoshan (BS), Jiading (JD), Pudong New Area (PD), Fengxian (FX), Jinshan (JS), Qingpu (QP), and Songjiang (SJ) (Figure 1).

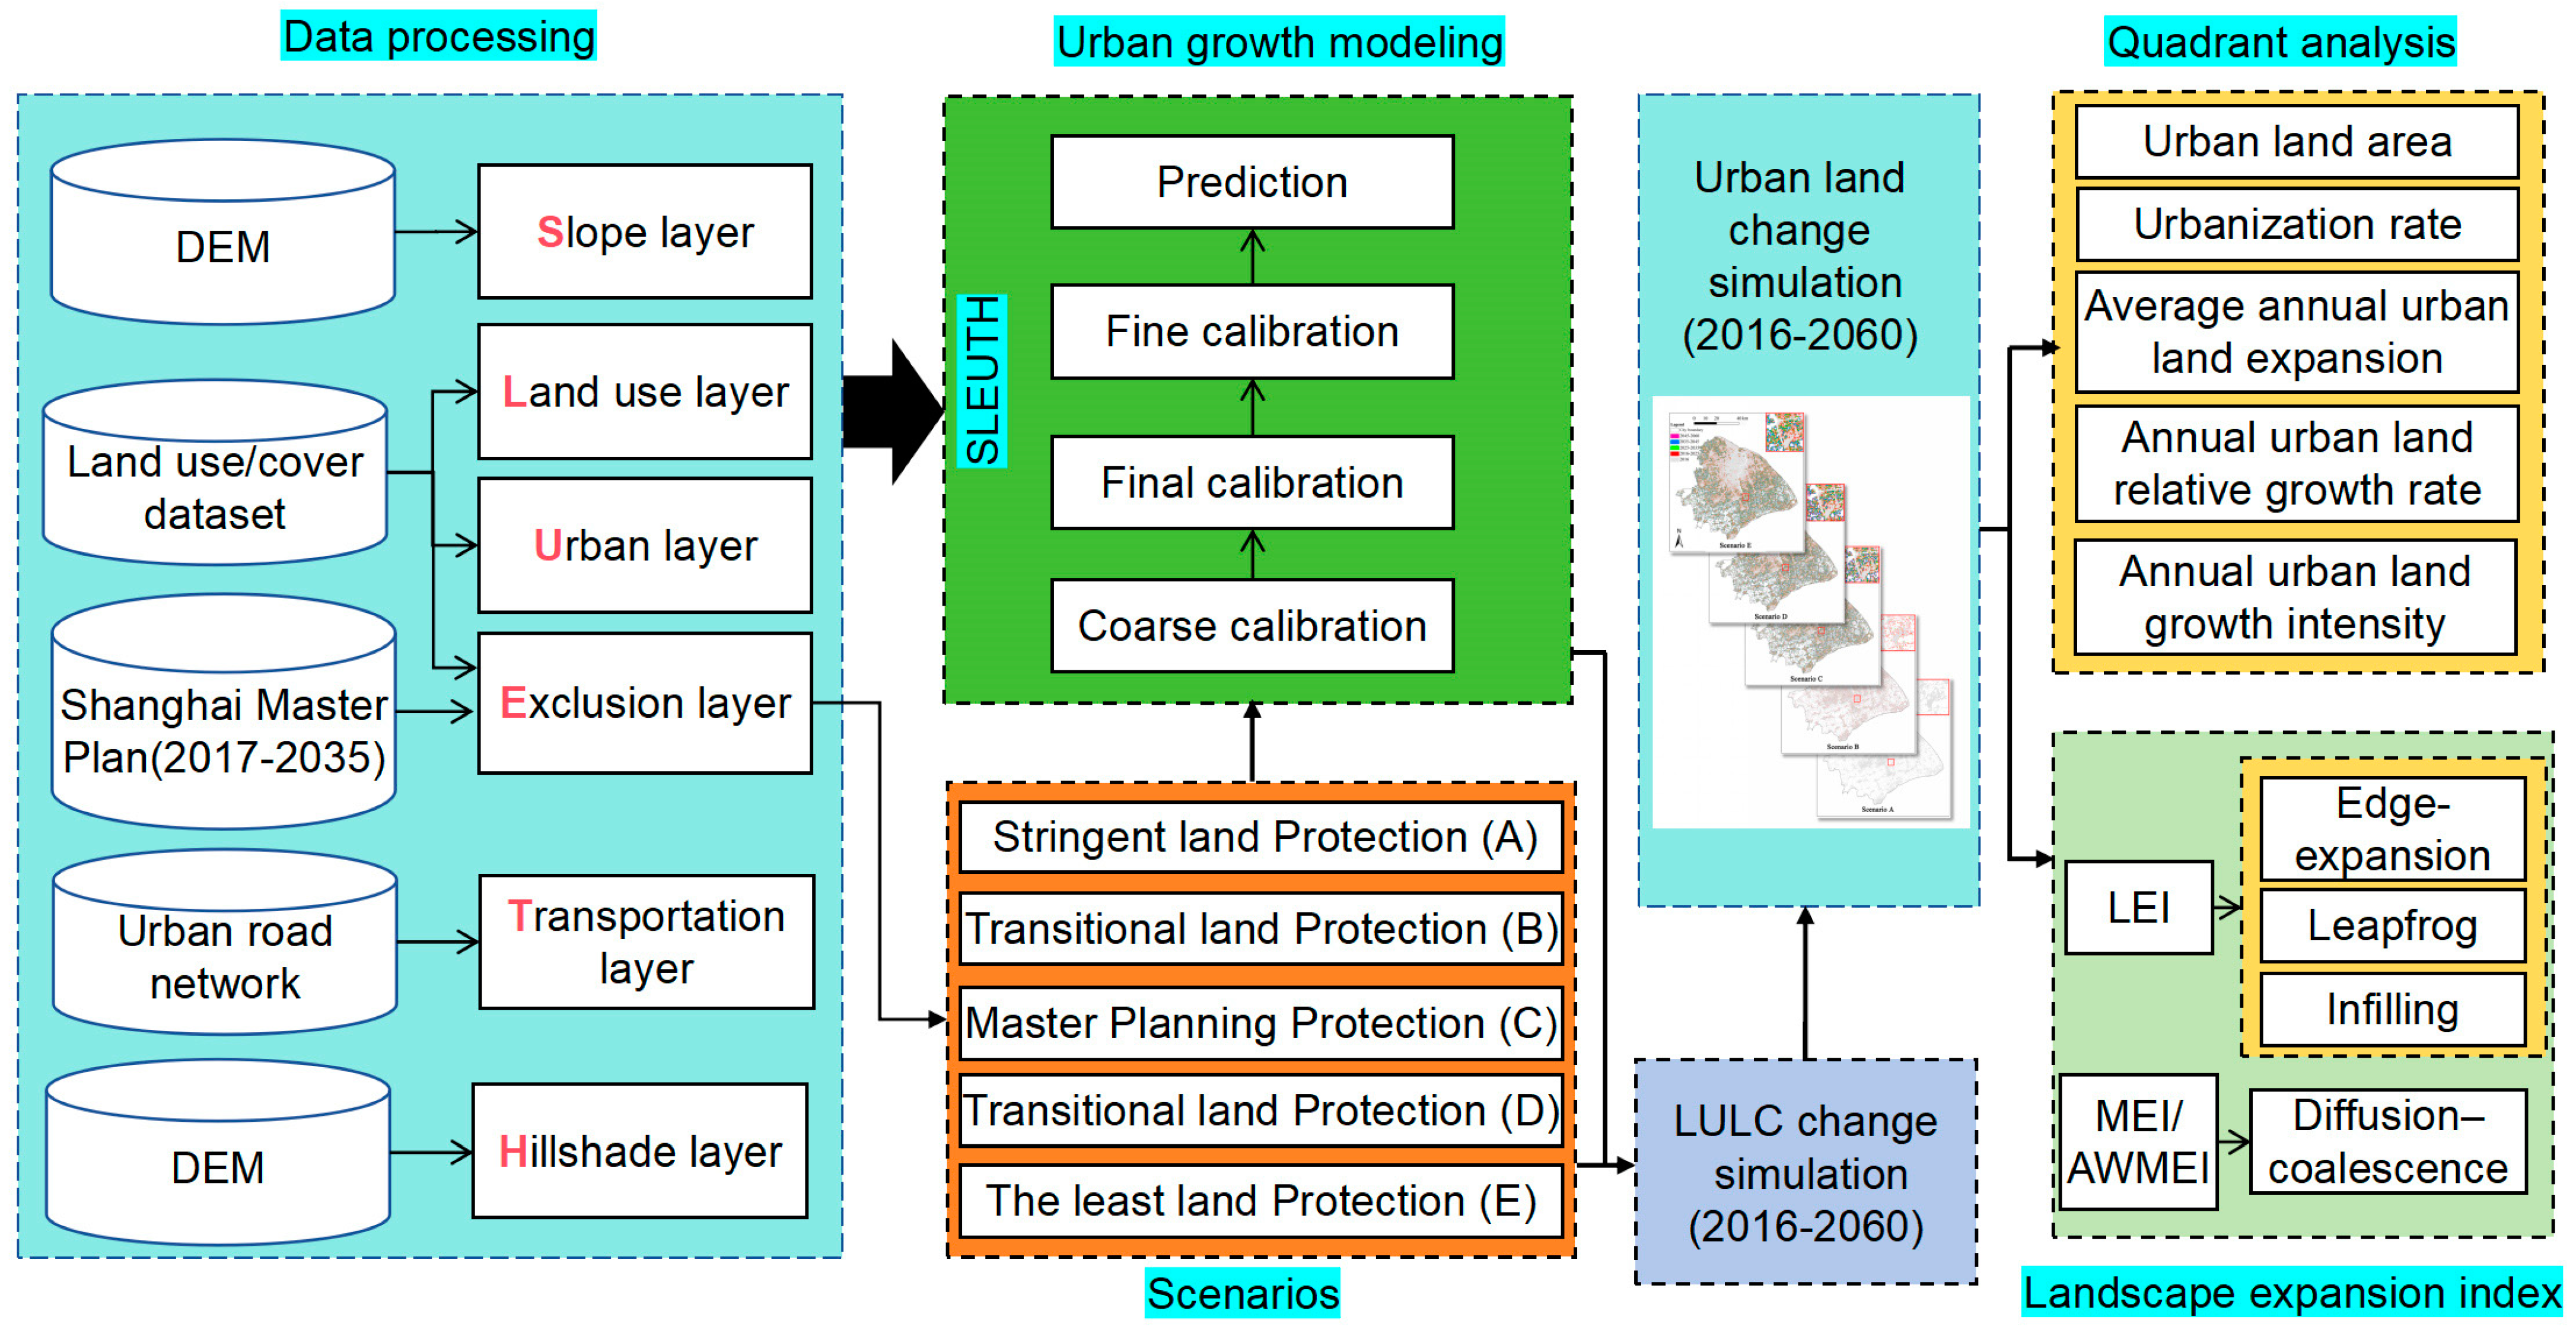
2.2. Research Framework

This research is organized into three key stages: data preprocessing, scenario-based simulation, and analysis of the spatiotemporal patterns in urban form. The SLEUTH model (version 3.0_beta) was used to stimulate urban land change in Shanghai over a 45-year period from 2016 to 2060. This timeframe corresponds to both short-term (2016–2035) and long-term (2036–2060) urban development strategies for Shanghai, aiming to achieve “carbon neutrality” by 2060. Achieving the carbon neutrality goal requires more stringent urban planning criteria and constraints on urban growth [45]. Additionally, the Shanghai Urban Master Plan outlines land use requirements, which essentially prescribe urban growth scenarios for the city. To analyze the spatiotemporal changes in urban form, quadrant analysis and urban land expansion indicators are utilized. Figure 2 provides an overview of the main steps in this research framework.

2.3. The SLEUTH Model

2.3.1. Input Dataset of the SLEUTH Model

SLEUTH, an acronym representing slope, land use, exclusion, urban extent, transportation, and hillshade, is the model developed by Dr. Keith C. Clark at the University of California, Santa Barbara. It serves as a forecasting model for urban growth modeling and land use modeling [46].
The SLEUTH model requires six input layer datasets: urban, land use, transportation, exclusion, slope, and hillshade. All layers, except for hillshade, are essential for the model’s functionality. The hillshade layer is used primarily for visualization purposes. The land use data were derived from the China Landcover dataset (CLCD) with a resolution of 30 m [47], which has an accuracy ranging from 76.5% to 82.5% for the years from 1990 to 2019 [47]. The dataset is publicly accessible (https://zenodo.org/records/8176941, accessed on 28 August 2021). The original CLCD categories include cropland, forest, shrub, grassland, water, snow/ice, barren, impervious, and wetland. To simplify this study and align with the land use requirements in the Shanghai Urban Master Plan, we reclassified the CLCD data into four types: urban land, farmland, water, and green land. The urban layer and land use layer were extracted from the reclassified CLCD data. The road network data were derived from the LULC dataset of Shanghai [48], which was initially classified using 2.5 m resolution images and then resampled to a 30 m resolution. Additionally, DEM data used for the slope and hillshade layers were obtained from the Shuttle Radar Topography Mission (SRTM) with a resolution of 30 m.

2.3.2. Scenario Settings for the SLEUTH Model

The SLEUTH model provides users with the flexibility to integrate planning strategies tailored to their specific goals [49,50]. In this study, we incorporated the Shanghai Urban Master Plan (2017–2035), which outlines specific land use requirements for green land, water bodies, and farmland [51] into the SLEUTH model to simulate future urban growth in Shanghai. To implement these strategies within the SLEUTH model, we assigned protection intensities to each land use category. These intensities determine the level of protection for each land use type, thus influencing their resistance to urban growth. For instance, urban planning Scenario C is designed to preserve 1200 km2 of farmland and achieve 23% forest coverage in accordance with the Shanghai Urban Master Plan. In keeping with the requirement that green land in Shanghai should “only increase, not decrease”, the protection intensity for green land is set at 100%. Similarly, water bodies are governed by the Ecological Protection Redline and are assigned a protection intensity of 100%, ensuring stringent protection. The assigned protection intensity values for each target land use type in the model are outlined in Table 1.
We define five scenarios: A, B, C, D, and E, each representing distinct levels of protection intensity for the different land use categories. Scenarios A and E indicate two extreme scenarios: Scenario A applies the most stringent protection measure with no change allowed for the protected land use types, water body and green land. Scenario E represents the least stringent protection measure, mirroring a business-as-usual scenario. For the analysis, we employed the average historical growth rate of each land use category from 1985 to 2015 as the baseline derived from the CLCD. The standard deviation (SD) of these growth rates serves as the threshold value for the potential changes. The upper and lower limits of change rates for all land use types in mainland Shanghai were defined by the average growth rate adjusted by one standard deviation. The upper limit (+SD) corresponds to Scenario A, while the lower limit (−SD) corresponds to Scenario E. The specific algorithm for implementing Scenarios A and E is as follows:
r = a ¯ ± S D
where r represents the protection intensity, a ¯ denotes the average historical growth rate of the corresponding land type, and SD indicates the standard deviation of the historical growth rate. SD reflects the variability in historical growth rates across all land use types in Shanghai. r ranges from 0 to 100%, and any values exceeding 100% are capped at the SLEUTH model’s maximum limit of 100%.
Scenario C is formulated according to the area restrictions for different land types in the Shanghai Urban Master Plan (2017–2035). The equation below is utilized to calculate the protection intensity level in this scenario:
r = S S 0 n 1 a ¯
where r and a ¯ are the same as Equation (1), S is the area of the corresponding land type specified in the Shanghai Urban Master Plan (2017–2035), while S0 denotes the area of the corresponding land type in the predicted starting year, and n is the difference between the predicted starting year and 2035. For example, when the forecast starting year is 2015, the value of n is 20. Once the starting year is set, n becomes a unique value used to calculate r. This scenario quantified the probability that each land type would be protected during the process of urbanization in alignment with the planning goal.
Scenarios B and D were designed as transitional scenarios between A and C and between C and E, respectively. Both Scenarios B and D aimed to enhance the effectiveness of urban growth modeling.

2.3.3. SLEUTH Model Calibration and Parameter Determination

Model calibration is an essential step in using the SLEUTH model to predict urban growth and consists of three steps: coarse calibration, fine calibration, and final calibration. A “brute force” method is applied across the three calibration steps, progressively narrowing the range of parameter values to identify the set that best matches the historical data [23]. Each stage generates a dataset using the Lee–Salee method to establish the parameter ranges and step sizes for subsequent calibrations. The results of the final calibration are then used to determine the optimal parameters.
In this study, the CLCD data from 1985, 1995, 2005, and 2015 were used for calibration. After calibration, the finalized parameters of diffusion, breed, spread, slope, and road were determined for the SLEUTH model and presented in Table 2. These parameters govern the simulation of the urban growth process.

2.4. Accuracy Assessment for the Projected LULC Results

The stability and reliability of the SLEUTH model are evaluated through an accuracy assessment of the projected LULC results, specifically urban land, water bodies, farmland, and green land, using historical data from Yang and Huang [47]. Allocation disagreement and quantity disagreement indices, as proposed by Pontius and Millones [52], are used to evaluate the model’s performance. The accuracy assessment results, presented in Table 3, reveal that the allocation disagreement ranges from 8% to 20%, while the quantity disagreement falls between 2% and 11%. Additionally, for all scenarios, the standard kappa coefficient exceeds 0.83, indicating a high level of accuracy. These results validate the reliability of the SLEUTH model, integrated with urban planning scenarios, to accurately simulate land use and land cover changes.

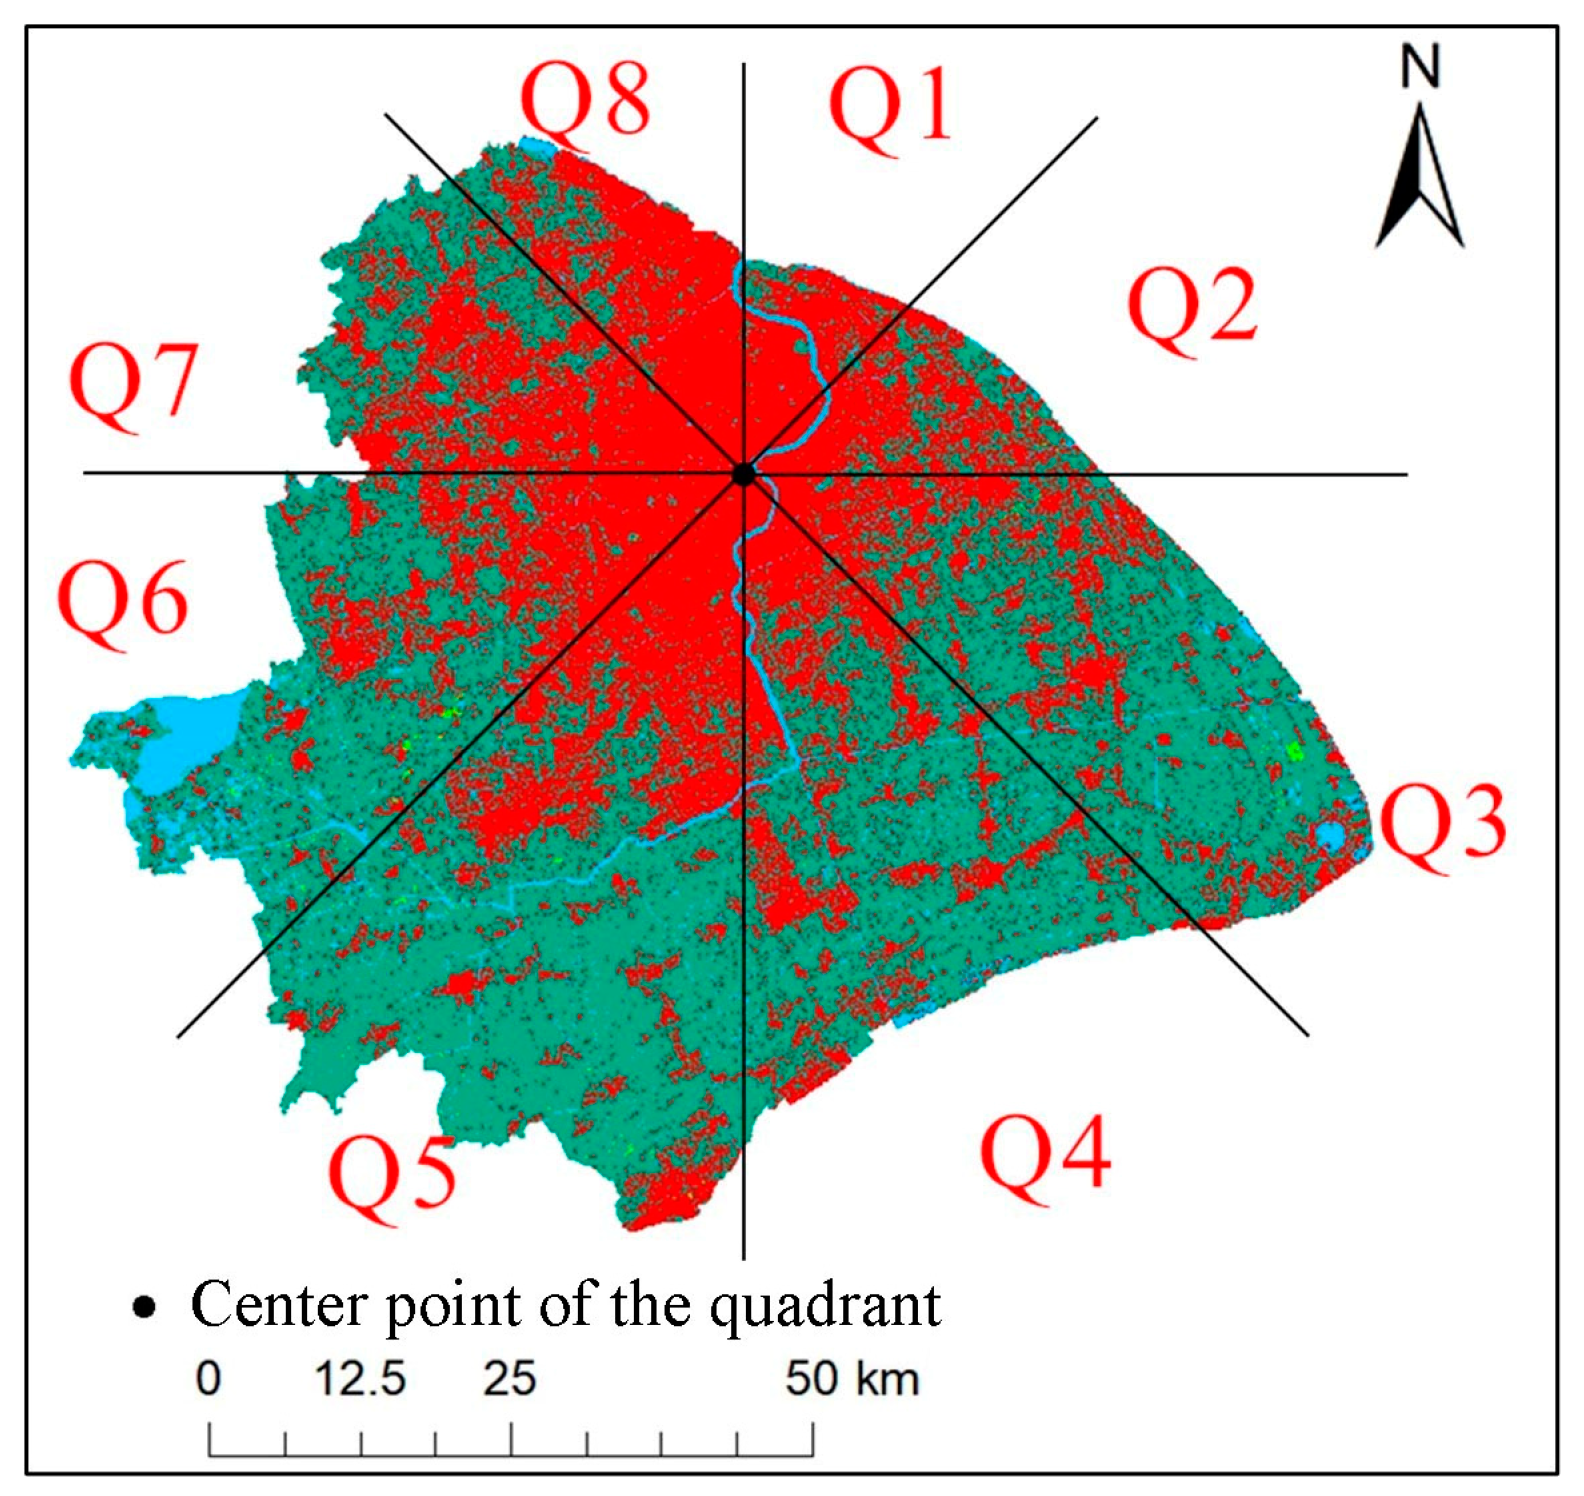
2.5. Quantification of the Spatiotemporal Dynamics of Urban Growth

To assess the spatiotemporal dynamics of urban growth under the five scenarios, a set of urban growth indicators was established, including annual urban land area expansion, annual urban land area relative growth rate, and annual urban land growth intensity [53,54]. We quantify the urban growth dynamics for approximately every 10-year interval during the study period from 2016 to 2060: 2016–2025, 2025–2035, 2035–2045, and 2045–2060. These intervals provide a detailed view of the urban growth patterns at different stages of the urbanization process.
The average annual urban land expansion (R), which describes the annual urban land area increase over the evaluation period, is calculated using the following formula:
R = U L A b U L A a T
The annual urban land relative growth rate (K), which quantifies the average percentage increase in urban land area relative to the base year urban land area over the evaluation period, is calculated as follows:
K = U L A b U L A a U L A a × 1 T × 100 %
The annual urban land growth intensity (Q), which measures the percentage increase of urban land growth over the total land area of the city in an evaluation period, is computed as follows:
Q = U L A b U L A a T L A × 1 T × 100 %
where ULAa and ULAb are the urban land area at the start year of 2016 and the end year of 2060, respectively. TLA is the total land area of the study area, and T represents the duration of each study period.
The quadrant analysis is used for analyzing the anisotropy of urban growth. Mainland Shanghai is divided into eight 45° angle quadrants (Figure 3), with the origin of Shanghai’s local coordinate system (121°28′12″E, 31°13′48″N) serving as the focal point for the analysis (Figure 3). The east–west axis was taken as the reference for the horizontal direction, while the north–south axis was designated as the vertical reference for the quadrant analysis. We calculate the indicators, including urban land area expansion (R), urban land area relative growth rate (K), and annual urban land growth intensity (Q) across the eight quadrants, visualized with radar charts to effectively visualize the spatial variations in urban growth across directions under various scenarios.

2.6. Quantification of the Changes in Urban Form

The landscape expansion index (LEI) is widely used to identify urban growth patterns [28]. Based on previous studies, urban growth modes are typically classified into three categories according to LEI values: infilling, edge-expansion, and leapfrog expansion [28]. The LEI is computed as follows:
L E I = 100 × A 0 A 0 + A v
where A0 is the area of the intersection between the buffer zone of newly developed urban patches and the existing urban patches; Av is the intersection of the buffer of newly developed urban patches with the non-urban areas. The buffer is set at 1 m, following the approach used in previous studies [28]. The LEI value ranges from 0 to 100, with different values reflecting various urban growth patterns. A value of 0 represents the leapfrog expansion mode, while an LEI between 0 and 50 indicates the edge-expansion mode. An LEI greater than 50 represents the infilling mode.
The mean expansion index (MEI) is calculated using the LEI, providing a detailed quantitative analysis of urban morphological evolution [28]. The MEI is calculated as follows:
M E I = i = 1 N L E I i N
where LEIi is the LEI for patch i, and N is the total number of newly grown patches. A larger MEI indicates a more pronounced aggregation of the landscape, reflecting a higher compact of urban growth.
The area-weighted mean expansion index (AWMEI) is computed as follows:
A W M E I = i = 1 N L E I i × ( a i A )
where ai is the area of patch i, and A is the total area of all new patches. A larger AWMEI indicates a higher degree of aggregation in urban growth.

3. Results

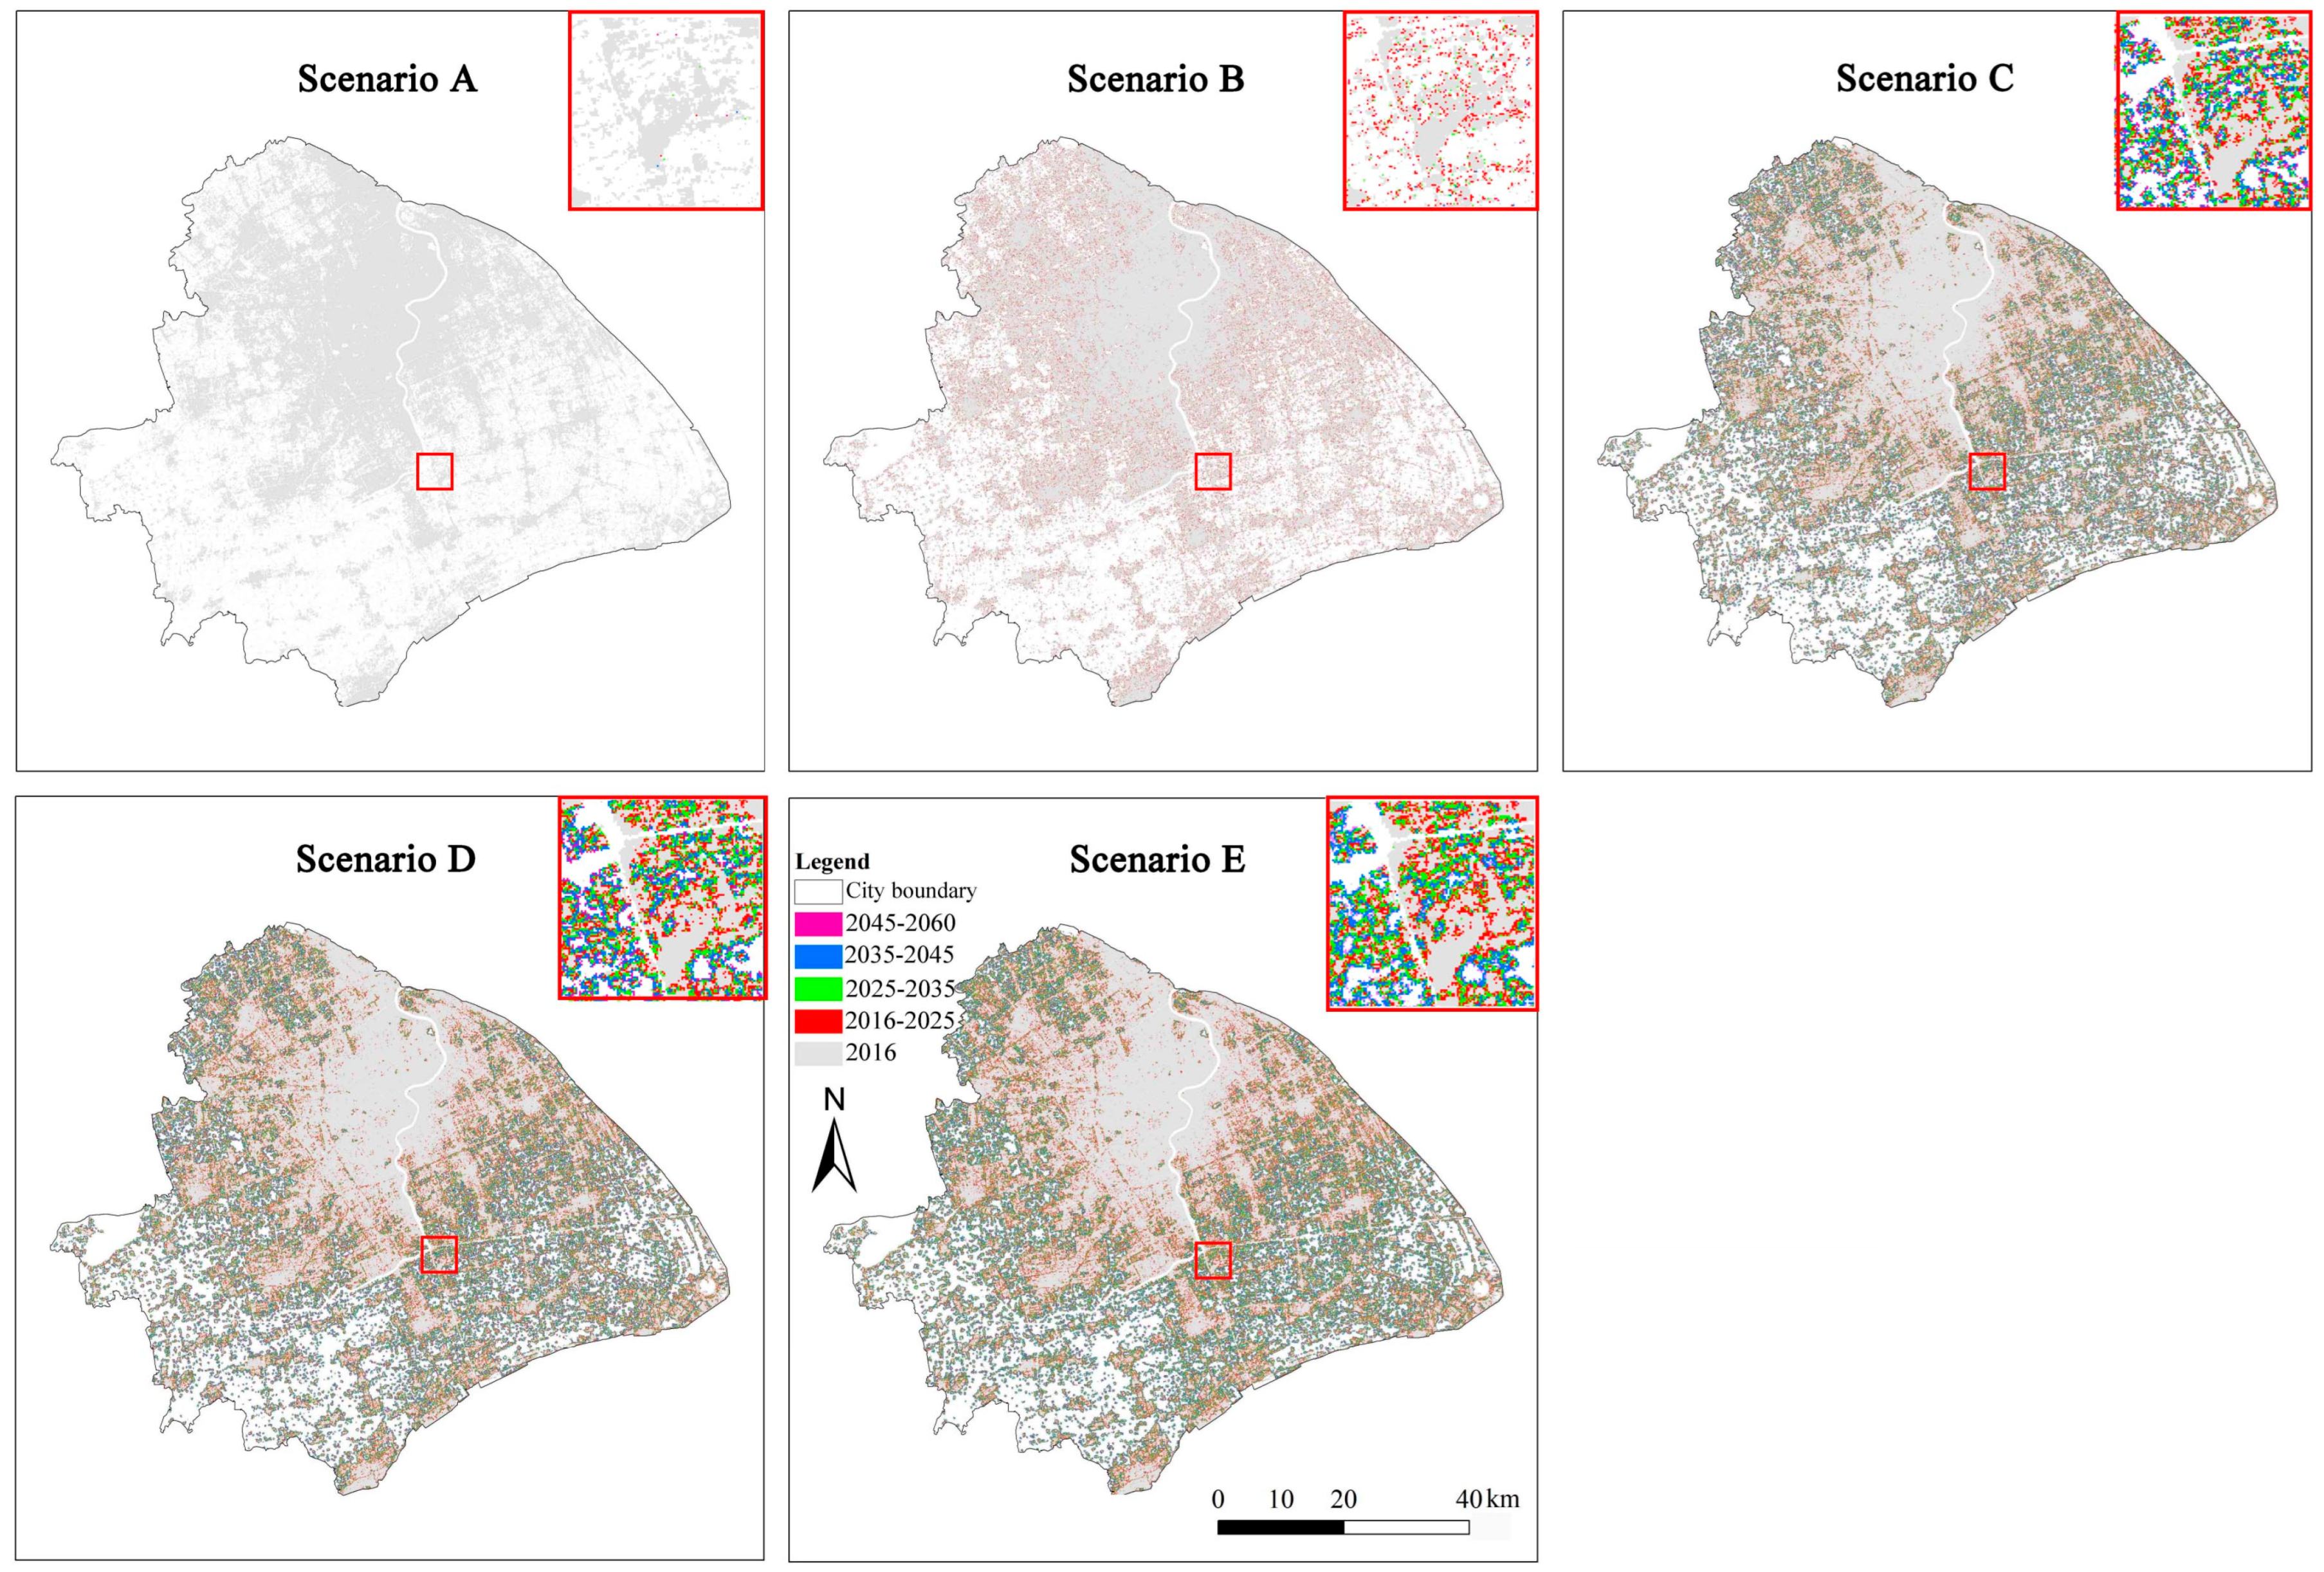
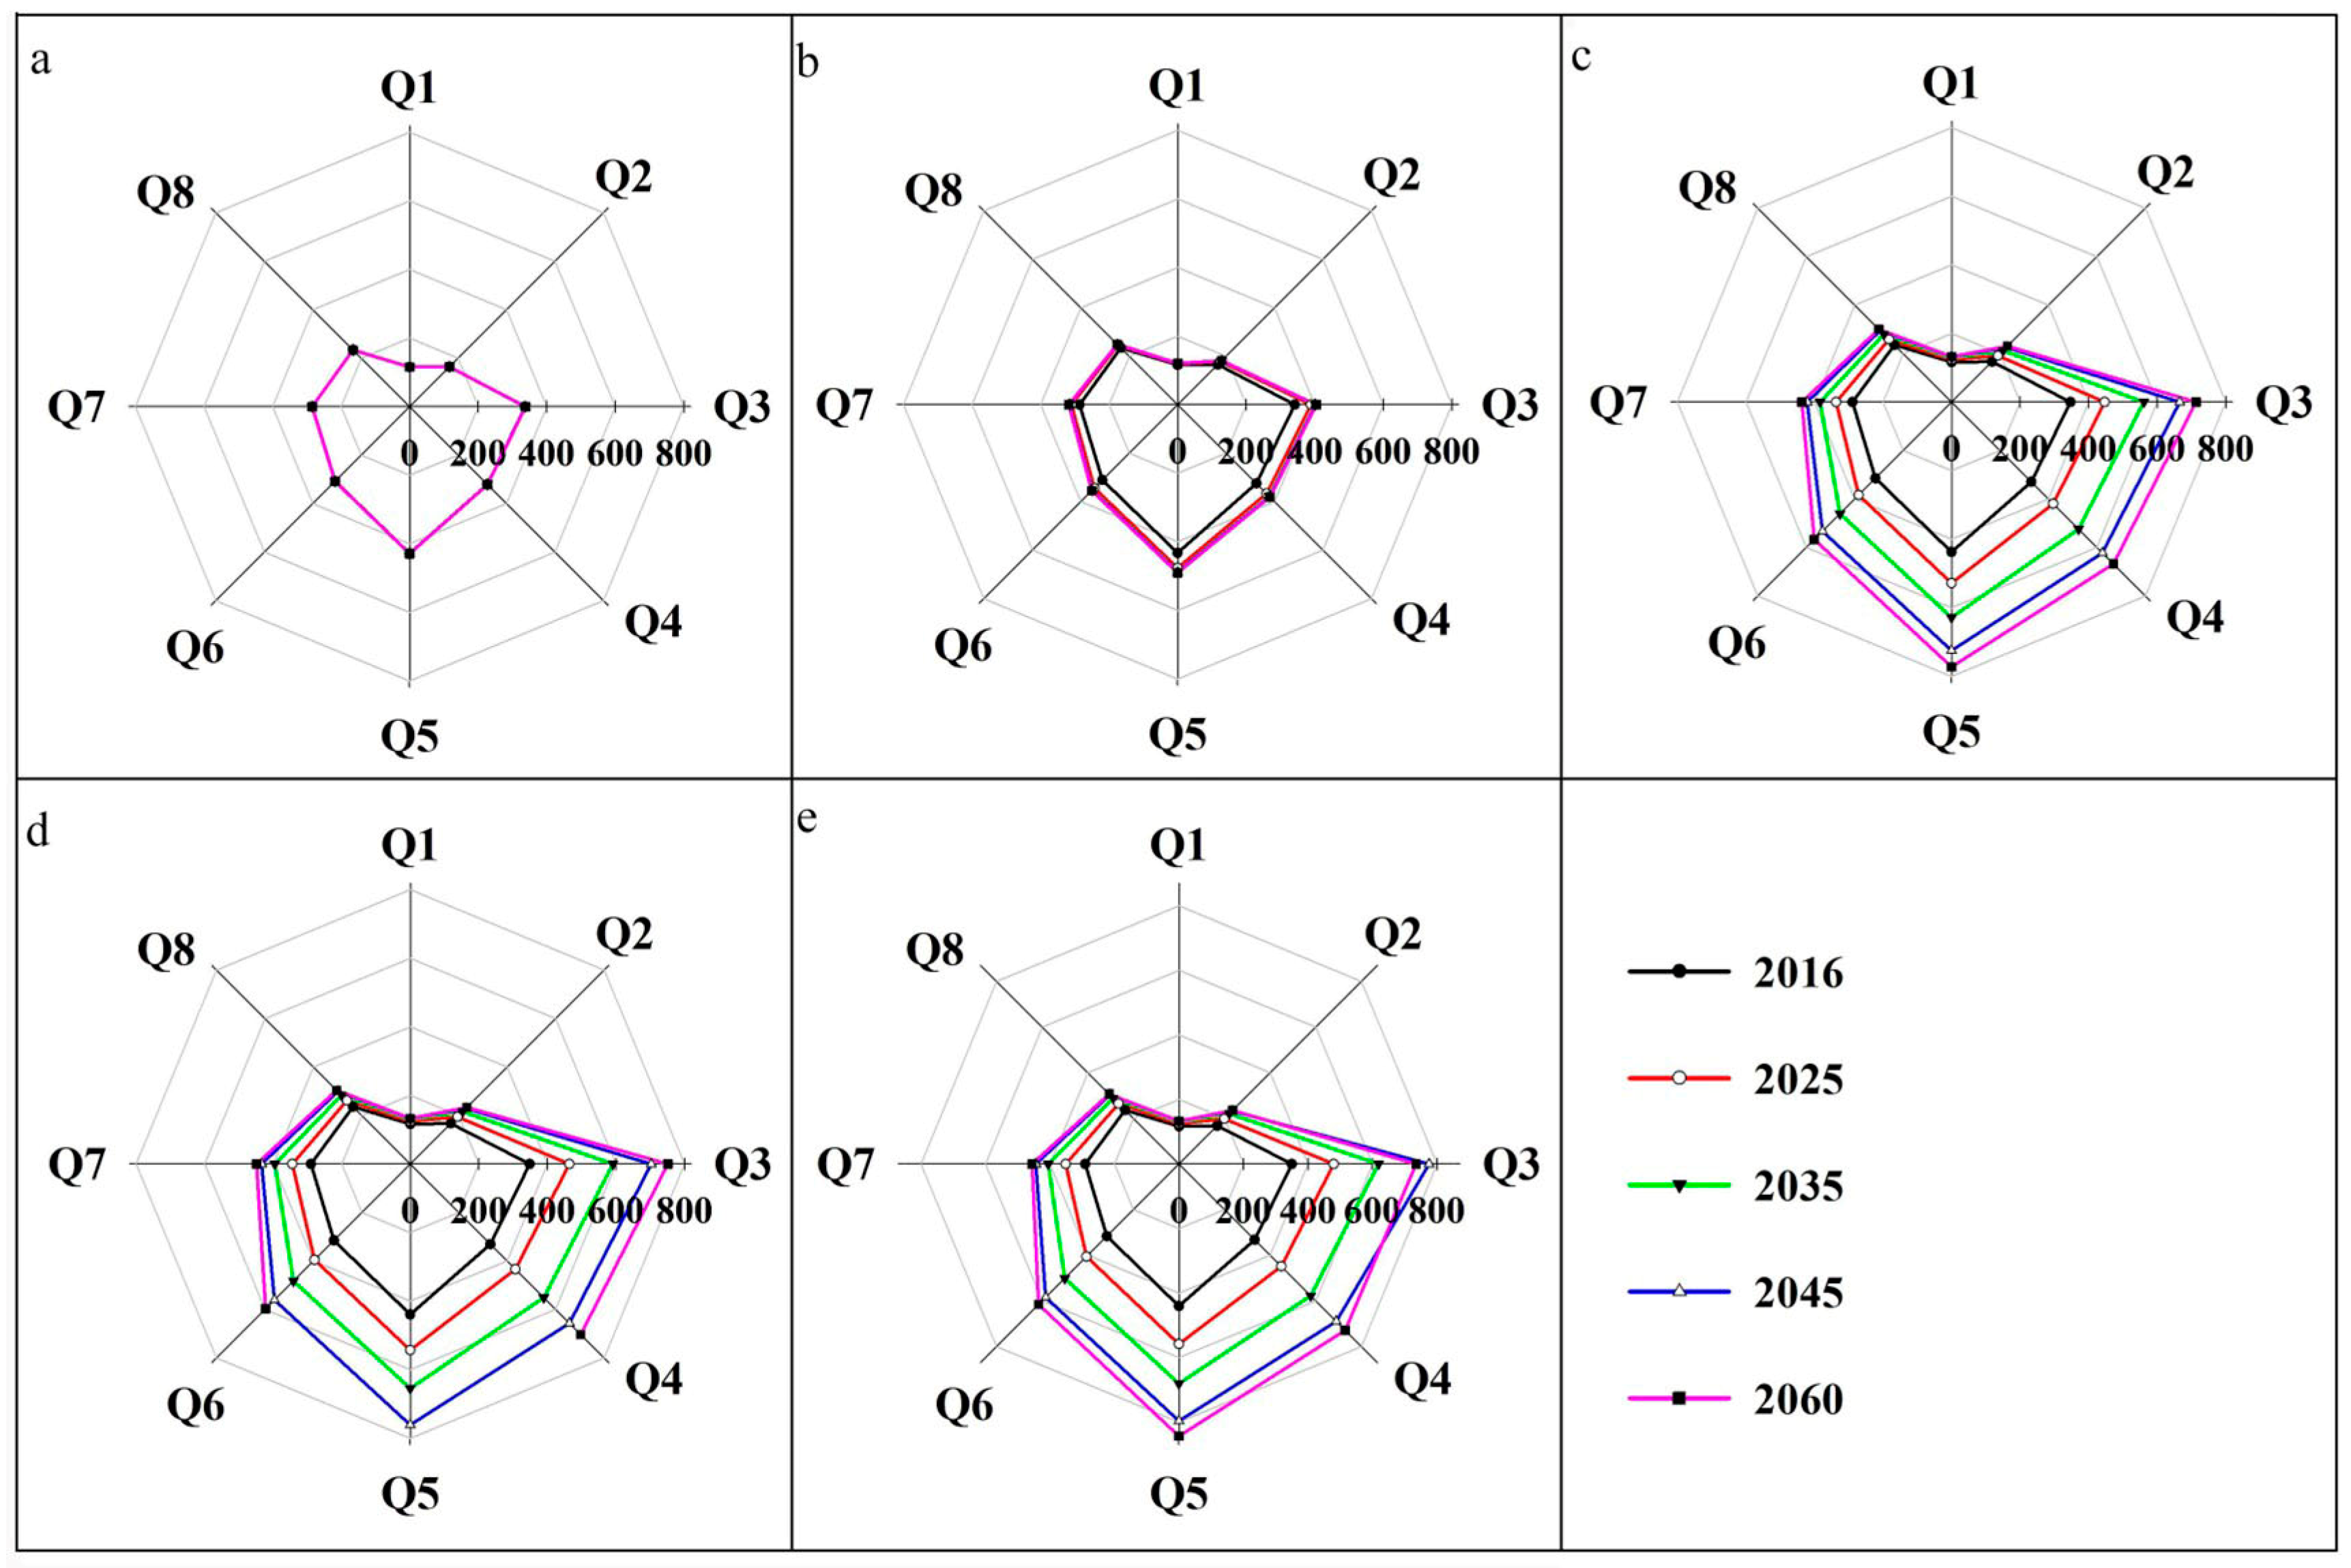
3.1. Spatiotemporal Dynamics of the Projected Urban Land

Spatially, the projected urban land growth from 2016 to 2060 varied significantly across four out of the five scenarios, except Scenario A (Figure 4). In Scenario A, there was minimal growth and change in urban land. Scenario B saw moderate urban expansion to the north. Scenarios C, D, and E displayed more extensive urban growth, with urbanization spreading in all directions across Shanghai. The net increase in urban land areas for each scenario was as follows: 8.6 km2 for Scenario A, 316.0 km2 for Scenario B, 1616.2 km2 for Scenario C, 1773.8 km2 for Scenario D, and 1876.1 km2 for Scenario E. These results demonstrated that the looser the protection measures, the greater the increase in urban land area.
Urban land area and urbanization rate changes were used to assess spatial heterogeneity across different directions from 2016 to 2060 (Figure 5 and Figure 6). Rapid urban growth occurred before 2045, with the southern region, particularly the southwest, experiencing the highest increase in urban land (Figure 5), while the northern region saw slower growth due to already high urbanization rates (Figure 6). Throughout the study period, the northern region consistently exhibited higher urbanization rates than the southern region.

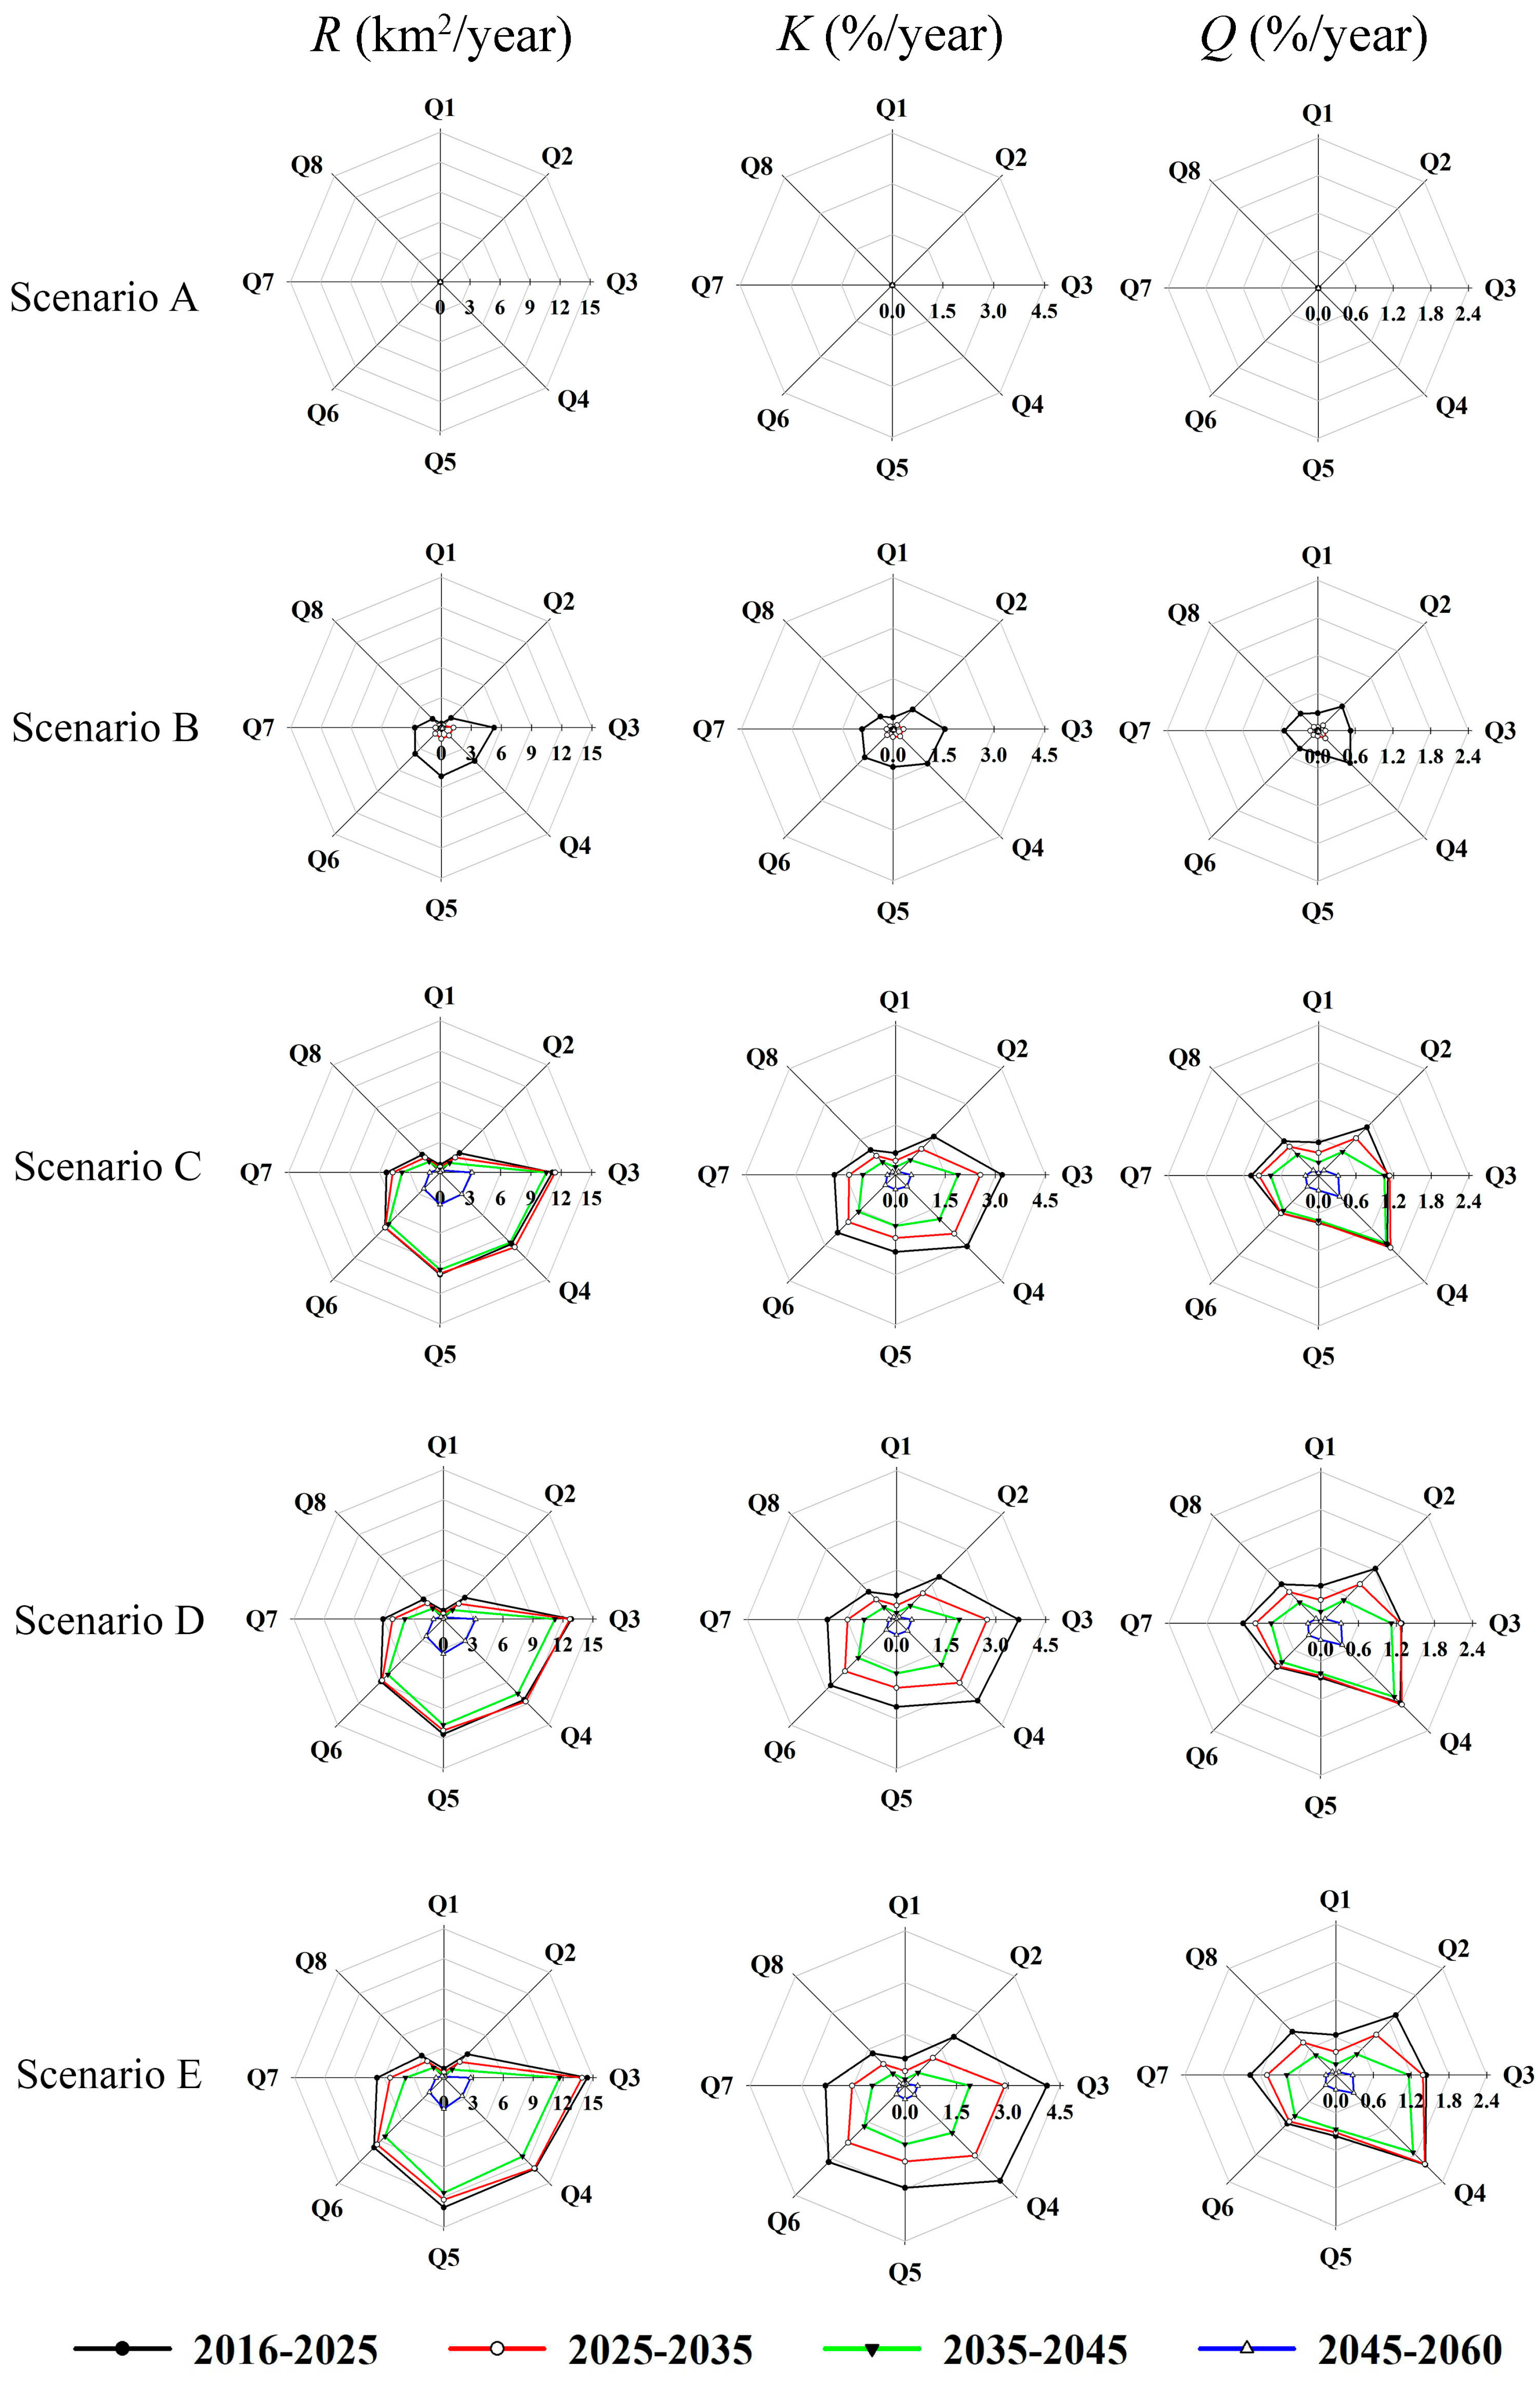
3.2. Spatiotemporal Patterns of Projected Urban Growth

The indicators of R, K, and Q showed significant temporal variations, except in Scenario A (Table 4). The trends of these indicators were similar, showing high values before 2025, followed by a decline after 2025, reflecting rapid growth in the early phase of the prediction.
As the land protection intensity increased, the average annual urban land expansion (R) decreased. In Scenario B, R values decreased from 14.02 km2/year during 2016–2025 to 0.67 km2/a during 2025–2035, stabilizing thereafter. In contrast, Scenarios C, D, and E showed much higher rates, with values of 49.65 km2/year, 55.91 km2/year, and 61.71 km2/year, respectively, from 2016 to 2025.
The annual urban land relative growth rate (K) consistently declined over time, with higher protection intensities leading to lower K values. From 2016 to 2025, K values were 0.01% for Scenario A, 0.63% for Scenario B, 0.22% for Scenario C, 0.49% for Scenario D, and 2.74% for Scenario E. After 2025, K values continued to decrease, remaining low and stable after 2035.
The annual urban land growth intensity (Q) increased as protection intensities decreased. From 2016 to 2025, Q values ranged from 0.02% in Scenario A to 13.43% in Scenario E. During 2025–2035, Q values remained relatively high in Scenarios C, D, and E, while other scenarios exhibited lower values. After 2035, Q values remained stable.
The spatiotemporal patterns of the urban land expansion, urban land growth rate, and urban land growth intensity followed a similar “concave shape” across different scenarios, except in Scenario A (Figure 7). The first (Q1) and eighth quadrants (Q8) had lower values for these indicators, although they had higher values in the early years of the study period and gradually decreased over time. A reduction in protection intensity from Scenario B to E resulted in a significant increase in these indicators.

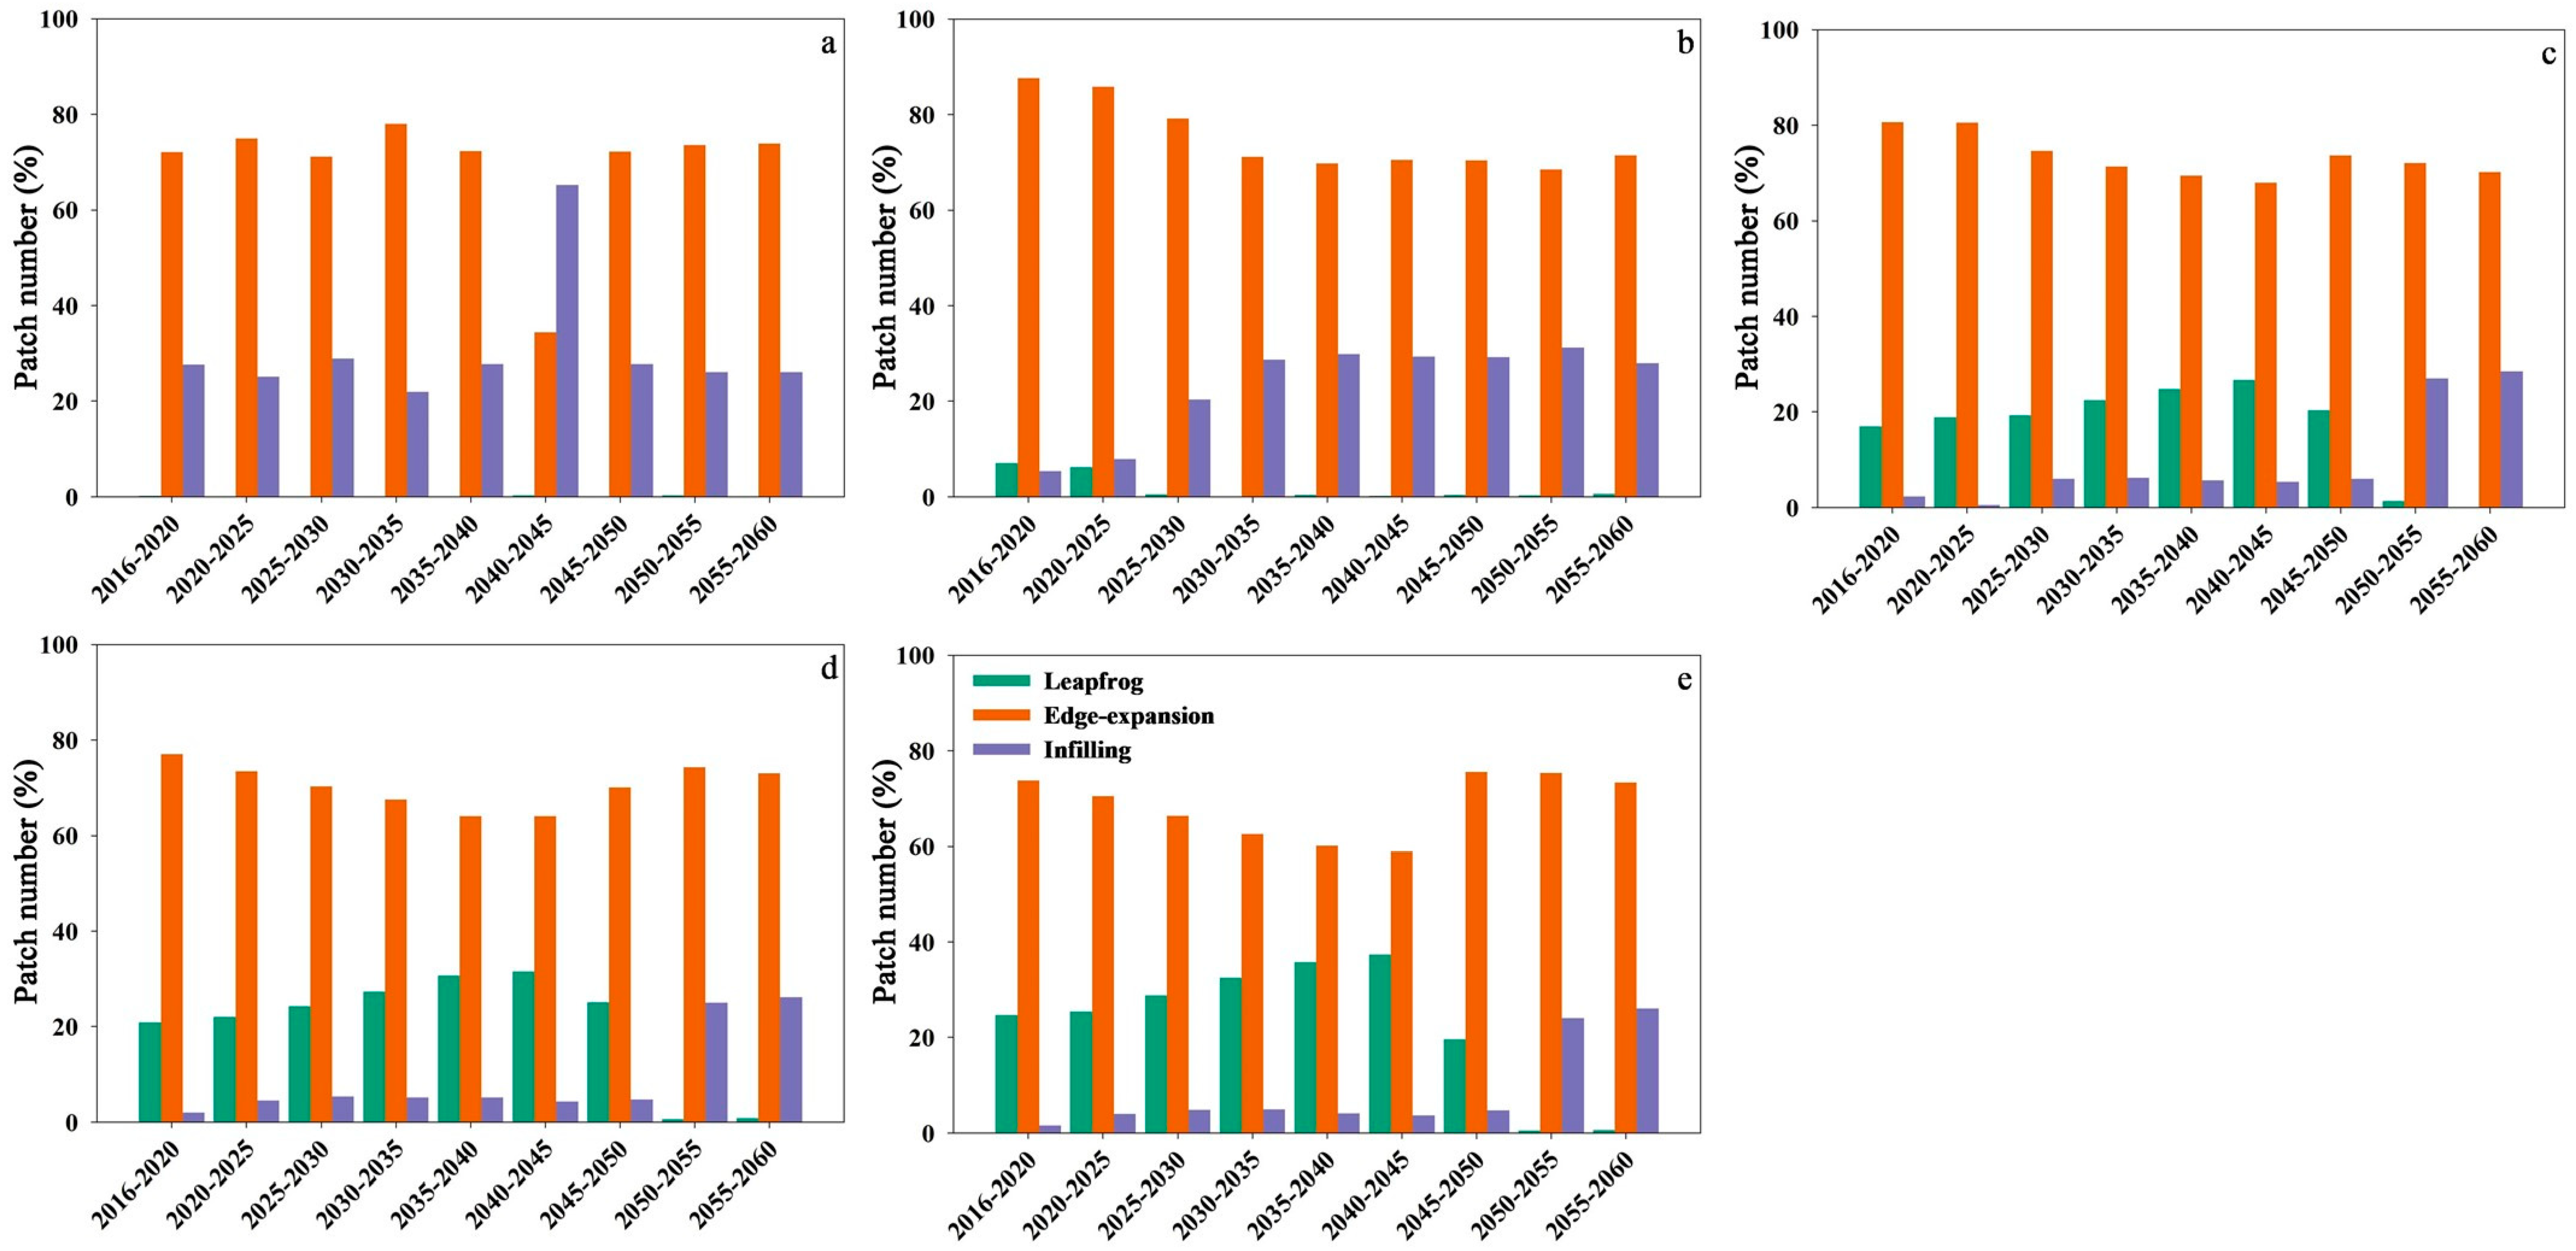
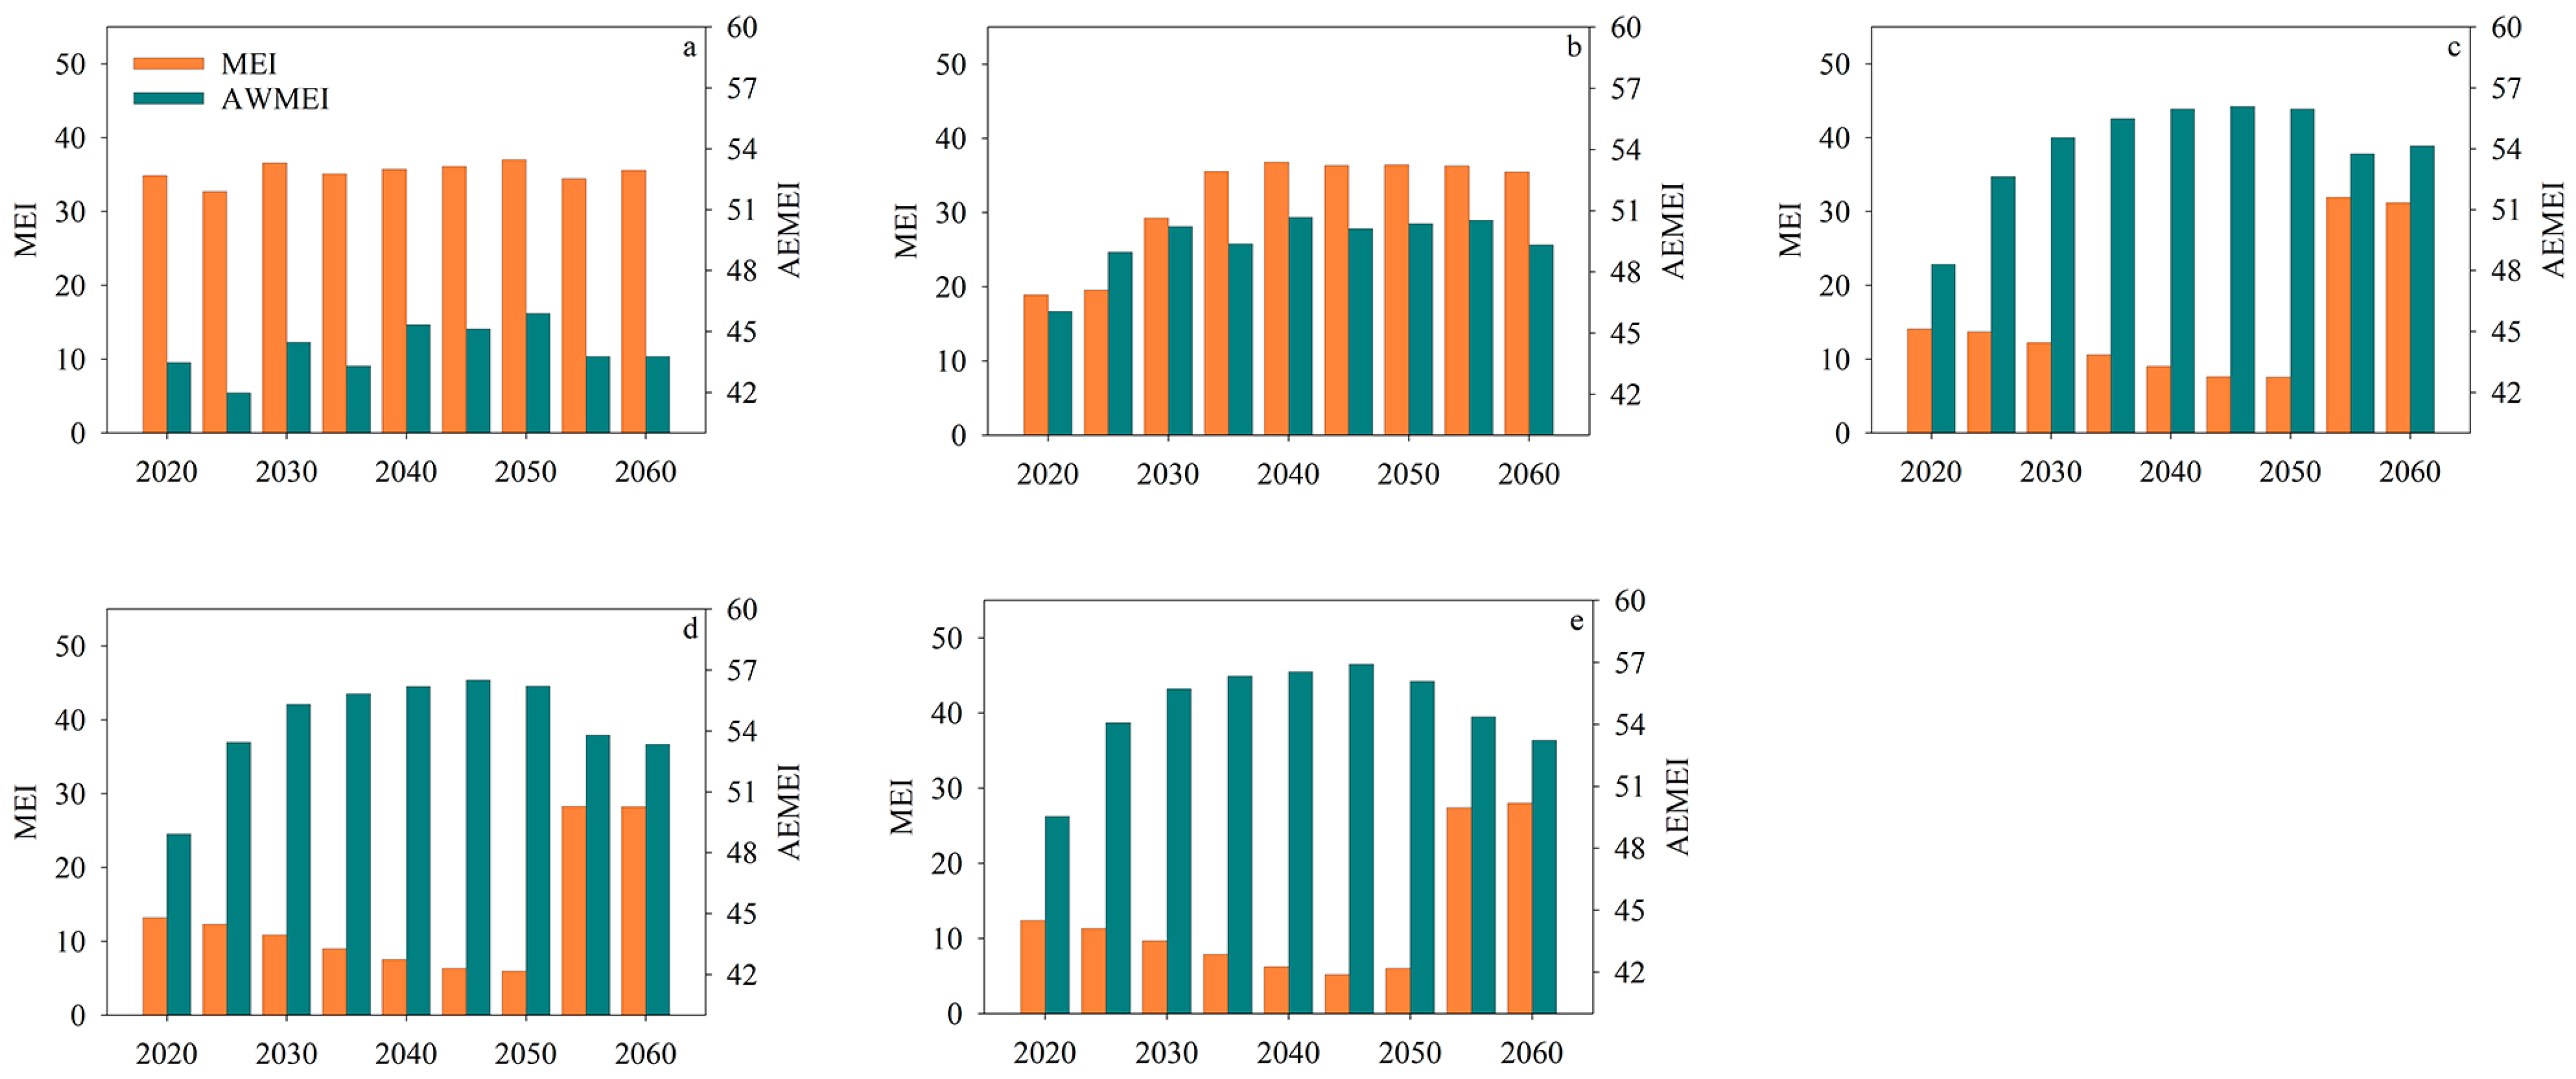
3.3. Characteristics of Urban Form Changes

The infilling, edge-expansion, and leapfrog modes revealed wave-like patterns of change from 2016 to 2060. Edge-expansion dominated the number of newly developed urban patches, while the leapfrog and infilling modes fluctuated. Reduced protection intensity (from Scenarios A to E) led to an increase in leapfrog expansion and a decrease in infilling expansion, particularly before 2050 (Figure 8). In terms of patch area proportion, the infilling mode dominated the newly developed urban patches, followed by edge-expansion, with leapfrog expansion contributing minimally (Figure 9). As protection intensities increased (Scenarios E to A), infilling and edge-expansion became the two major modes of nearly balanced development.
The MEI and AWMEI indices revealed the changes in urban form over time. In Scenario A, the MEI remained relatively stable with small fluctuations. In Scenario B, the MEI exhibited an initial rise followed by a slight downward trend. In Scenarios C, D, and E, the MEI showed a trend of continuous decline to a small value, followed by a sudden increase. The AWMEI displayed a dynamic pattern of decline followed by an increase in Scenario A. In Scenario B, AWMEI exhibited multiple cycles of rise and fall. In Scenarios C, D, and E, the AWMEI showed a slight increase until around 2050, suggesting a phase of urban coalescence. This was followed by a gradual decline, reflecting the subsequent shift toward urban diffusion. As protection intensity decreased from Scenarios C to E, there were no significant changes in the MEI and AWMEI (Figure 10).

4. Discussion

4.1. The Patterns of Urban Land Growth

Modeling urban growth and projecting future scenarios are crucial for guiding urban planning and promoting sustainable development amid urbanization challenges [55,56]. Previous studies had developed scenarios by defining extreme case gradients [57,58,59,60,61], incorporating local factors as exclusion layers [23], or applying baseline urban development strategies [62]. In this study, we developed multiple scenarios by integrating the Shanghai Urban Master Plan (2017–2035) into the SLEUTH model. The effectiveness of this approach was validated by an accuracy assessment of the predictive result (Table 3). Our findings revealed that urban growth would experience significant changes, especially under Scenarios C, D, and E (Figure 4). These results highlighted the varying impacts of protection measures on urban growth and form changes, suggesting that urban planning strategies, particularly land use regulations, were crucial in shaping the trajectory of urban development. A previous study on urban predictions for Shanghai indicated that by 2035, the city’s urban land would expand nearly 13-fold over 50 years [41]. Another study forecasted a 33.9% increase in urban area by 2030, within just 15 years [63]. Our projected results suggested that under Scenario C (planning scenario), the urban area would expand by about 1616.2 km2 by 2060. This suggested that Shanghai’s urban development was expected to experience rapid growth. By 2035, the urban land area was projected to reach 3179.7 km2, closely approaching the 3200 km2 target outlined in the Shanghai Urban Master Plan. This indicated that to meet the target, effective control of urban growth would be necessary.
This study highlighted significant spatiotemporal dynamics in urban growth across the different directions of mainland Shanghai, with variations in urban land area and urbanization rates (Figure 5 and Figure 6). Notably, urban land growth was expected to expand significantly in most directions (Figure 5), particularly in southern Shanghai, with limited growth in the north. This disparity can be attributed to the earlier urbanization in the north, where the old urban districts were located, leaving less room for further growth [64]. Previous studies identified Shanghai’s early urbanization process: from 1979 to 2000, growth occurred primarily along the north–south axis. After 2000, urban growth spread more evenly in all directions [65]. Another study also revealed a significant shift in the geographical center of urban growth in Shanghai over the past five decades, moving from the northeast to the southwest [41]. These changes reflected a shift in Shanghai’s development strategy, with urban planners intentionally directing growth toward the north to achieve more balanced urban development [66]. The urbanization rate was expected to continue growing from 2016 to 2060, such as in the second (Q2), third (Q3), fifth (Q7), and sixth (Q8) quadrants (Figure 6). In Scenarios C, D, and E, the eighth quadrant (Q8) showed the highest urbanization rates in mainland Shanghai during the late simulation period (2045–2060). This may be attributed to government-driven urban transformation, along with significant real estate and foreign investments, which stimulated urbanization in these areas [64].

4.2. Characteristics of the Spatiotemporal Changes in Urban Growth

The analysis of the spatiotemporal dynamics of urban growth is crucial for understanding urban morphological evolution. Spatial indicators play a key role in quantifying these dynamics [53,67]. Our results showed that the spatiotemporal patterns of the average annual urban land expansion, annual urban land relative growth rate, and annual urban land growth intensity highlighted the future changes in urban land from 2016 to 2060 under various scenarios. These patterns exhibited similar temporal trends and spatial distribution (Table 4 and Figure 7), with notable differences between the early (pre-2025) and late (post-2025) periods of urban growth (Table 4). A study of urban growth in 18 cities in China from 1980 to 2008 found that Shanghai’s historical urban growth dynamics followed a fluctuating trend, with the growth intensity initially declining until 2000, before increasing again after 2000 [53]. Other studies demonstrated that urban land growth rates also fluctuated, alternating with increasing and decreasing trends [6,68]. For example, a study of Shanghai from 1978 to 2015 showed an initial increase in growth followed by a decline, with a peak annual area increase of 118.22 km2 and annual growth rate of 7.56% during 2005–2010 [68]. Our projections suggested that the peak annual rate and intensity of urban growth would occur between 2016 and 2025, followed by a decline in the later stages of future urbanization. The decline in urban growth rates after 2025 could be attributed to two primary reasons. First, urban area growth followed a logistic pattern, which showed that urban growth rate reached a peak before gradually declining to a stable state [6]. Our modeling of urban growth trajectories under different scenarios corroborated this phenomenon. Second, during the early stage of the projection period, there was ample land available for development. However, as land availability became increasingly constrained, opportunity for expansion diminished, resulting in a deceleration of the growth rate, as evidenced by the decreasing growth rates observed after 2025.
Spatially, the anisotropy of urban growth, characterized by a “concave shape”, was clearly shown in Figure 7, particularly under Scenarios C, D, and E. Specifically, the average annual urban land expansion (R), annual urban land relative growth rate (K), and annual urban land growth intensity (Q) exhibited significant variations across all areas except the first (Q1) and eighth (Q8) quadrants, with differing degrees of change across the quadrants. The southern and eastern regions experienced greater changes, surpassing the northern region, which aligned with previous findings. Previous studies showed that during the later stages of growth (2020–2035), urban development in Shanghai shifted from the northeast to the southwest regions [41]. In each period, differences in average annual urban land expansion (R) were not significant, but considerable differences in annual urban land relative growth rate (K) were observed (Figure 7). These anisotropic patterns may be influenced by factors such as policies, socioeconomic/natural conditions (e.g., topography and environmental factors), and the evolutionary dynamics of each quadrant [69]. Since Shanghai is predominantly flat with few mountainous regions and using the geographic center as the center for quadrant analysis, we mitigated the potential bias from irregular land distribution or density variations. As a result, Shanghai’s anisotropic urban dynamics may be greatly shaped by policy and socioeconomic influences. Recent studies have provided evidence that urban development in Shanghai was largely driven by top-down government regulations and policies, including central government-led suburban industrial zone construction and local government initiatives for developing new urban areas and towns [40].

4.3. The Evolution of the Urban Form

Urban morphological changes are shaped by geographical factors and the level of economic development [70]. As cities evolve, urban areas can undergo either scattered or compact growth patterns [71]. The diffusion–coalescence hypothesis of urban morphology has been widely tested through historical urban land use data across multiple scales [6,27,29]. In this research, the landscape expansion index (LEI) was used to reveal changes in urban growth patterns. Unlike previous studies that observed the alternating dominance of infilling, edge-expansion, and leapfrog modes [6,29], the results of this study showed that under different scenarios, urban growth would be dominated by edge-expansion in terms of patch number proportion and by infilling in terms of patch area proportion (Figure 8 and Figure 9). In Scenarios C, D, and E, however, infilling and leapfrog processes emerged as the secondary modes, exhibiting alternating patterns. This may be attributed to variations in economic development, planning, policies, or land use strategies [6]. Such changes indicated the complexity and non-linearity of the urban growth process.
The changes in MEI and AWMEI provided more detailed evidence regarding urbanization form changes (Figure 10). In Scenarios B, C, D, and E, the overall trends of MEI and AWMEI showed opposite patterns. This discrepancy was likely due to the emergence of a larger, more aggregated urban patch. As urban growth progresses, larger urban areas influenced the changes in AWMEI, causing an initial increase followed by a decline. It revealed a shift from coalescence to diffusion in urban growth. This trend reflected the dominance of the infilling mode, resulting in more of a coalescence urban form. In later stages, increased edge-expansion led to a diffusion form. Similar patterns were observed in previous studies [29,41]. The existing research has identified a spiraling diffusion–coalescence process in urbanization [6,27], which marked two distinct rounds of urbanization. In this study, we found a gradual rise and decline pattern in AWMEI, suggesting that urban form followed a coalescence to diffusion pattern characterized by a single round of urbanization. This was likely due to the comparatively strong land protection policies, which constrained the extensive expansion of urban land. Consequently, each diffusion or coalescence phase lasted longer.

4.4. Limitations and Implications

Urban growth models have been developed and widely utilized to forecast urban development [56]. In this study, we utilized the SLEUTH model to simulate urban growth. However, there are still some limitations in its application. First, the SLEUTH model simulates urban growth but cannot capture processes such as urban renewal [64] or green infrastructure regeneration [72], which may reduce its accuracy in reflecting real-world urban dynamics and trends. This limitation could potentially lead to biases in the projected urban growth patterns, particularly in areas where regeneration and redevelopment play significant roles in shaping urban form. Second, previous studies have incorporated principles such as landscape ecology principles [22] and habitat quality [23] as exclusion layers to restrict development in specific areas. In this study, we primarily focused on the land use requirements outlined in the Shanghai Urban Master Plan to define development scenarios, excluding those based on specific environmental or ecological constraints. This approach allowed us to assess urban growth dynamics within the framework of planned development but may not fully account for potential limitations imposed by specific habitat protections, ecological redlines, and other environmental constraints. Therefore, future work could integrate these factors to provide a more comprehensive and realistic simulation of urban growth. Third, we used only four land use types, i.e., farmland, green land, water bodies, and urban land, in the simulation. However, the Shanghai Urban Master Plan outlines more detailed land use requirements for various categories by 2035, such as public infrastructure and transportation facilities. Therefore, incorporating high-resolution imagery to obtain more detailed land use classifications could provide more precise information on the development of different land use types, enabling more refined urban planning.
This study employs urban growth models to predict future urban growth under various scenarios, providing insights into urban growth dynamics and the evolution of different growth modes such as edge-expansion, infilling, and leapfrog modes, as well as the associated urban form changes. By integrating urban planning strategies, the model facilitates the clearer identification of urban land use distributions and growth patterns, helping planners to assess the long-term impacts under different development scenarios. The planning targets used to create the scenarios can, in fact, be substituted with other relevant sources, such as ecological protection guidelines, provided they contain specific data on the targeted land use restrictions. This flexibility allows the model to be tailored to various contexts while maintaining its applicability. Thus, the framework developed for predicting future urban growth and urban form is highly transferable and can be effectively applied to various urban settings, offering decision makers valuable tools for planning, monitoring, and addressing future urban challenges.

5. Conclusions

This study simulated the spatiotemporal dynamics of urban growth and form evolution in mainland Shanghai from 2016 to 2060 under five urbanization scenarios, using the SLEUTH model integrated with the Shanghai Urban Master Plan (2017–2035). The results revealed significant variations in urban growth across different scenarios, with the southern region experiencing the most growth and clear anisotropy. As protection intensity decreased, both the rate and intensity of urban growth increased. Urban growth indicators, including the average annual urban land expansion, annual urban land relative growth rate, and annual urban land growth intensity fluctuated significantly over time, exhibiting a “concave shape” pattern. Rapid growth occurred before 2025, followed by a decline. Growth patterns exhibited wave-like patterns, with edge-expansion dominating the number of newly developed patches, while leapfrog and infilling modes fluctuated. As protection intensity decreased, leapfrog expansion increased and infilling decreased, particularly before 2050. In terms of the patch area, the infilling mode was dominant, followed by edge-expansion. These shifts indicated that the urban form followed a diffusion–coalescence process. The findings provide valuable insights into the future dynamics of urban form evolution in Shanghai, offering valuable information for urban planning and land management policies, particularly in the context of rapid urbanization and ecological constraints.

Author Contributions

Conceptualization, J.L., C.W. and Y.L.; methodology, Y.L., C.W. and J.L.; software, Y.L., C.W. and J.W.; validation, Y.L., J.W., Y.Z., X.B. and M.W.; formal analysis, Y.L. and J.W.; investigation, Y.L., J.W., Y.Z., X.B. and M.W.; resources, Y.L. and J.L.; data curation, Y.L. and J.W.; writing—original draft preparation, Y.L.; writing—review and editing, C.W., J.L., C.S. and E.Y.; visualization, Y.L. and J.W.; supervision, J.L. and E.Y.; project administration, J.L. and C.W.; funding acquisition, J.L. and C.W. All authors have read and agreed to the published version of the manuscript.

Funding

This study was partly supported by the National Key R&D Project of China (Grant No. 2022YFF1301105 to J. Li), the Natural Science Foundation of China (Grant No. 31971485 to J. Li, Grant No. 32001162 to C. Wu), the China Postdoctoral Science Foundation (2021M702131 to C. Wu), and the Joint-PhD project of Shanghai Jiao Tong University and The University of Melbourne to J. Li and A. Hahs.

Data Availability Statement

The data presented in this study are available on request from the author.

Conflicts of Interest

The authors declare no conflicts of interest.

References

  1. United Nations (UN). World Urbanization Prospects 2018; United Nations (UN): New York, NY, USA, 2019. [Google Scholar]
  2. Wentz, E.A.; York, A.M.; Alberti, M.; Conrow, L.; Fischer, H.; Inostroza, L.; Jantz, C.; Pickett, S.T.A.; Seto, K.C.; Taubenböck, H. Six fundamental aspects for conceptualizing multidimensional urban form: A spatial mapping perspective. Landsc. Urban Plan. 2018, 179, 55–62. [Google Scholar] [CrossRef]
  3. Cai, Z.; Demuzere, M.; Tang, Y.; Wan, Y. The characteristic and transformation of 3D urban morphology in three Chinese mega-cities. Cities 2022, 131, 103988. [Google Scholar] [CrossRef]
  4. Krueger, E.H.; Constantino, S.M.; Centeno, M.A.; Elmqvist, T.; Weber, E.U.; Levin, S.A. Governing sustainable transformations of urban social-ecological-technological systems. npj Urban Sustain. 2022, 2, 10. [Google Scholar] [CrossRef]
  5. He, X.; Zhou, Y. Urban spatial growth and driving mechanisms under different urban morphologies: An empirical analysis of 287 Chinese cities. Landsc. Urban Plan. 2024, 248, 105096. [Google Scholar] [CrossRef]
  6. Wu, C.; Li, C.; Ouyang, L.; Xiao, H.; Wu, J.; Zhuang, M.; Bi, X.; Li, J.; Wang, C.; Song, C.; et al. Spatiotemporal evolution of urbanization and its implications to urban planning of the megacity, Shanghai, China. Landsc. Ecol. 2023, 38, 1105–1124. [Google Scholar] [CrossRef]
  7. Liu, Y.; He, Q.; Tan, R.; Liu, Y.; Yin, C. Modeling different urban growth patterns based on the evolution of urban form: A case study from Huangpi, Central China. Appl. Geogr. 2016, 66, 109–118. [Google Scholar] [CrossRef]
  8. Wang, Q.; Guan, Q.; Lin, J.; Luo, H.; Tan, Z.; Ma, Y. Simulating land use/land cover change in an arid region with the coupling models. Ecol. Indic. 2021, 122, 107231. [Google Scholar] [CrossRef]
  9. Shafizadeh-Moghadam, H.; Asghari, A.; Tayyebi, A.; Taleai, M. Coupling machine learning, tree-based and statistical models with cellular automata to simulate urban growth. Comput. Environ. Urban Syst. 2017, 64, 297–308. [Google Scholar] [CrossRef]
  10. Yeh, A.G.O.; Li, X.; Xia, C. Cellular Automata Modeling for Urban and Regional Planning. In Urban Informatics; Shi, W., Goodchild, M.F., Batty, M., Kwan, M.-P., Zhang, A., Eds.; Springer: Singapore, 2021; pp. 865–883. [Google Scholar]
  11. Clarke, K.C.; Hoppen, S.; Gaydos, L. A self-modifying cellular automaton model of historical urbanization in the San Francisco Bay area. Environ. Plan. B Plan. Des. 1997, 24, 247–261. [Google Scholar] [CrossRef]
  12. Zhou, Y.; Varquez, A.C.G.; Kanda, M. High-resolution global urban growth projection based on multiple applications of the SLEUTH urban growth model. Sci. Data 2019, 6, 34. [Google Scholar] [CrossRef]
  13. Liu, D.; Clarke, K.C.; Chen, N. Integrating spatial nonstationarity into SLEUTH for urban growth modeling: A case study in the Wuhan metropolitan area. Comput. Environ. Urban Syst. 2020, 84, 101545. [Google Scholar] [CrossRef]
  14. Dietzel, C.; Clarke, K. The effect of disaggregating land use categories in cellular automata during model calibration and forecasting. Comput. Environ. Urban Syst. 2006, 30, 78–101. [Google Scholar] [CrossRef]
  15. Varquez, A.C.G.; Dong, S.; Hanaoka, S.; Kanda, M. Evaluating future railway-induced urban growth of twelve cities using multiple SLEUTH models with open-source geospatial inputs. Sustain. Cities Soc. 2023, 91, 104442. [Google Scholar] [CrossRef]
  16. Cui, L.; Shi, J. Urbanization and its environmental effects in Shanghai, China. Urban Clim. 2012, 2, 1–15. [Google Scholar] [CrossRef]
  17. Zheng, K.; Xu, X.; Zhang, X.; Liu, L. Spatial-temporal characteristics and future prediction of urban expansion in Shanghai. J. Geo-Inf. Sci. 2012, 14, 490–496. [Google Scholar] [CrossRef]
  18. Chandan, M.C.; Nimish, G.; Bharath, H.A. Analysing spatial patterns and trend of future urban expansion using SLEUTH. Spat. Inf. Res. 2020, 28, 11–23. [Google Scholar] [CrossRef]
  19. Liang, Y.; Liu, L. Spatiotemporal Dynamics of Rapid Urban Growth on the Loess Plateau from 1995 to 2050. J. Resour. Ecol. 2023, 14, 567–580. [Google Scholar] [CrossRef]
  20. Gao, L.; Tao, F.; Liu, R.; Wang, Z.; Leng, H.; Zhou, T. Multi-scenario simulation and ecological risk analysis of land use based on the PLUS model: A case study of Nanjing. Sustain. Cities Soc. 2022, 85, 104055. [Google Scholar] [CrossRef]
  21. Chen, Y.; Wang, J.; Xiong, N.; Sun, L.; Xu, J. Impacts of Land Use Changes on Net Primary Productivity in Urban Agglomerations under Multi-Scenarios Simulation. Remote Sens. 2022, 14, 1755. [Google Scholar] [CrossRef]
  22. Akyol Alay, M.; Tunçay, H.E.; Clarke, K.C. SLEUTH modeling informed by landscape ecology principles: Case study using scenario-based planning in Sariyer, Istanbul, Turkey. J. Urban Plan. Dev. 2021, 147, 05021043. [Google Scholar] [CrossRef]
  23. Li, F.; Wang, L.; Chen, Z.; Clarke, K.C.; Li, M.; Jiang, P. Extending the SLEUTH model to integrate habitat quality into urban growth simulation. J. Environ. Manag. 2018, 217, 486–498. [Google Scholar] [CrossRef] [PubMed]
  24. Choudhury, U.; Kanga, S.; Singh, S.K.; Kumar, A.; Meraj, G.; Kumar, P.; Singh, S. Projecting Urban Expansion by Analyzing Growth Patterns and Sustainable Planning Strategies—A Case Study of Kamrup Metropolitan, Assam, North-East India. Earth 2024, 5, 169–194. [Google Scholar] [CrossRef]
  25. Rao, Y.; Dai, J.; Dai, D.; He, Q.; Wang, H. Effect of Compactness of Urban Growth on Regional Landscape Ecological Security. Land 2021, 10, 848. [Google Scholar] [CrossRef]
  26. He, Q.; He, W.; Song, Y.; Wu, J.; Yin, C.; Mou, Y. The impact of urban growth patterns on urban vitality in newly built-up areas based on an association rules analysis using geographical ‘big data’. Land Use Policy 2018, 78, 726–738. [Google Scholar] [CrossRef]
  27. Li, C.; Li, J.; Wu, J. Quantifying the speed, growth modes, and landscape pattern changes of urbanization: A hierarchical patch dynamics approach. Landsc. Ecol. 2013, 28, 1875–1888. [Google Scholar] [CrossRef]
  28. Liu, X.; Li, X.; Chen, Y.; Tan, Z.; Li, S.; Ai, B. A new landscape index for quantifying urban expansion using multi-temporal remotely sensed data. Landsc. Ecol. 2010, 25, 671–682. [Google Scholar] [CrossRef]
  29. Wu, J.; Wu, C.; Zhang, Q.; Zhuang, M.; Xiao, H.; Wu, H.; Ouyang, L.; Liu, Y.; Meng, C.; Song, C.; et al. Spatiotemporal Evolution of Urban Agglomeration and Its Impact on Landscape Patterns in the Pearl River Delta, China. Remote Sens. 2023, 15, 2520. [Google Scholar] [CrossRef]
  30. He, Q.; Song, Y.; Liu, Y.; Yin, C. Diffusion or coalescence? Urban growth pattern and change in 363 Chinese cities from 1995 to 2015. Sustain. Cities Soc. 2017, 35, 729–739. [Google Scholar] [CrossRef]
  31. Chakraborty, S.; Maity, I.; Dadashpoor, H.; Novotnẏ, J.; Banerji, S. Building in or out? Examining urban expansion patterns and land use efficiency across the global sample of 466 cities with million+ inhabitants. Habitat Int. 2022, 120, 102503. [Google Scholar] [CrossRef]
  32. Rybski, D.; Li, Y.; Born, S.; Kropp, J.P. Modeling urban morphology by unifying diffusion-limited aggregation and stochastic gravitation. Findings 2021. [Google Scholar] [CrossRef]
  33. Jatayu, A.; Saizen, I.; Rustiadi, E.; Pribadi, D.O.; Juanda, B. Urban Form Dynamics and Modelling towards Sustainable Hinterland Development in North Cianjur, Jakarta–Bandung Mega-Urban Region. Sustainability 2022, 14, 907. [Google Scholar] [CrossRef]
  34. Haselsteiner, E.; Smetschka, B.; Remesch, A.; Gaube, V. Time-Use Patterns and Sustainable Urban Form: A Case Study to Explore Potential Links. Sustainability 2015, 7, 8022–8050. [Google Scholar] [CrossRef]
  35. Peng, W.; Wang, G.; Zhou, J.; Zhao, J.; Yang, C. Studies on the temporal and spatial variations of urban expansion in Chengdu, western China, from 1978 to 2010. Sustain. Cities Soc. 2015, 17, 141–150. [Google Scholar] [CrossRef]
  36. Yang, Y.; Liu, Y.; Li, Y.; Du, G. Quantifying spatio-temporal patterns of urban expansion in Beijing during 1985–2013 with rural-urban development transformation. Land Use Policy 2018, 74, 220–230. [Google Scholar] [CrossRef]
  37. Miles, L.S.; Carlen, E.J.; Winchell, K.M.; Johnson, M.T.J. Urban evolution comes into its own: Emerging themes and future directions of a burgeoning field. Evol. Appl. 2021, 14, 3–11. [Google Scholar] [CrossRef]
  38. Monteiro, J.; Sousa, N.; Coutinho-Rodrigues, J.; Natividade-Jesus, E. Challenges Ahead for Sustainable Cities: An Urban Form and Transport System Review. Energies 2024, 17, 409. [Google Scholar] [CrossRef]
  39. Woldesemayat, E.M.; Genovese, P.V. Monitoring Urban Expansion and Urban Green Spaces Change in Addis Ababa: Directional and Zonal Analysis Integrated with Landscape Expansion Index. Forests 2021, 12, 389. [Google Scholar] [CrossRef]
  40. Wang, S.; Luo, X. The evolution of government behaviors and urban expansion in Shanghai. Land Use Policy 2022, 114, 105973. [Google Scholar] [CrossRef]
  41. Gao, C.; Feng, Y.; Wang, R.; Lei, Z.; Chen, S.; Tang, X.; Xi, M. 50-Year Urban Expansion Patterns in Shanghai: Analysis Using Impervious Surface Data and Simulation Models. Land 2023, 12, 2065. [Google Scholar] [CrossRef]
  42. Li, J.; Wang, Y.; Song, Y.; Wang, H. GIS-based analysis of spatial characteristics of watercourse and its water pollution in Shanghai City. China Environ. Sci. 2004, 24, 632–635, (In Chinese with English abstract). [Google Scholar]
  43. Li, J.; Li, C.; Zhu, F.; Song, C.; Wu, J. Spatiotemporal pattern of urbanization in Shanghai, China between 1989 and 2005. Landsc. Ecol. 2013, 28, 1545–1565. [Google Scholar] [CrossRef]
  44. SMBS (Shanghai Municipal Bureau of Statistics). Shanghai Statistical Yearbook 2023; SMBS: Shanghai, China, 2023.
  45. SMBS (Shanghai Municipal Bureau of Statistics). Shanghai Statistical Yearbook 2022; SMBS: Shanghai, China, 2022.
  46. Silva, E.A.; Clarke, K.C. Calibration of the SLEUTH urban growth model for Lisbon and Porto, Portugal. Comput. Environ. Urban Syst. 2002, 26, 525–552. [Google Scholar] [CrossRef]
  47. Yang, J.; Huang, X. The 30 m annual land cover dataset and its dynamics in China from 1990 to 2019. Earth Syst. Sci. Data 2021, 13, 3907–3925. [Google Scholar] [CrossRef]
  48. Li, J.; Song, C.; Cao, L.; Zhu, F.; Meng, X.; Wu, J. Impacts of landscape structure on surface urban heat islands: A case study of Shanghai, China. Remote Sens. Environ. 2011, 115, 3249–3263. [Google Scholar] [CrossRef]
  49. Xiang, W.; Clarke, K.C. The use of scenarios in land-use planning. Environ. Plan. B Plan. Des. 2003, 30, 885–909. [Google Scholar] [CrossRef]
  50. Jantz, C.A.; Goetz, S.J.; Shelley, M.K. Using the SLEUTH urban growth model to simulate the impacts of future policy scenarios on urban land use in the Baltimore-Washington metropolitan area. Environ. Plan. B Plan. Des. 2004, 31, 251–271. [Google Scholar] [CrossRef]
  51. SMPG (Shanghai Municipal People’s Government). Shanghai Urban Master Plan (2017–2035); SMPG: Shanghai, China, 2018.
  52. Pontius, R.G.; Millones, M. Death to Kappa: Birth of quantity disagreement and allocation disagreement for accuracy assessment. Int. J. Remote Sens. 2011, 32, 4407–4429. [Google Scholar] [CrossRef]
  53. Xu, X.; Min, X. Quantifying spatiotemporal patterns of urban expansion in China using remote sensing data. Cities 2013, 35, 104–113. [Google Scholar] [CrossRef]
  54. Chen, Y.; Li, Z.; Li, P.; Zhang, Y.; Liu, H.; Pan, J. Impacts and Projections of Land Use and Demographic Changes on Ecosystem Services: A Case Study in the Guanzhong Region, China. Sustainability 2022, 14, 3003. [Google Scholar] [CrossRef]
  55. Kii, M. Projecting future populations of urban agglomerations around the world and through the 21st century. npj Urban Sustain. 2021, 1, 10. [Google Scholar] [CrossRef]
  56. Li, X.; Gong, P. Urban growth models: Progress and perspective. Sci. Bull. 2016, 61, 1637–1650. [Google Scholar] [CrossRef]
  57. Xi, F.; Hu, Y.; He, H.; Shi, T.; Bu, R.; Wu, X.; Zhu, J. Urban planning based on SLEUTH model in Shenyang-Fushun metropolitan area. J. Univ. Chin. Acad. Sci. 2009, 26, 765–773. [Google Scholar] [CrossRef]
  58. Liu, Y.; Liu, X. Applying SLEUTH for simulating urban expansion of Hangzhou. In Proceedings of the Second International Conference on Earth Observation for Global Changes, Chengdu, China, 25–29 May 2009; pp. 42–49. [Google Scholar]
  59. Liu, X.; Sun, R.; Yang, Q.; Su, G.; Qi, W. Simulating urban expansion using an improved SLEUTH model. J. Appl. Remote Sens. 2012, 6, 061709. [Google Scholar] [CrossRef]
  60. Hua, L.; Tang, L.; Cui, S.; Yin, K. Simulating urban growth using the SLEUTH model in a coastal peri-urban district in China. Sustainability 2014, 6, 3899–3914. [Google Scholar] [CrossRef]
  61. Zheng, L.; Zhang, D.; Zhou, Y.; Zhang, X.; Shi, R.; Chen, M. Simulation of land use/cover change in Shanghai based on SLEUTH model. In Proceedings of the Remote Sensing and Modeling of Ecosystems for Sustainability XV, San Diego, CA, USA, 22 August 2018; pp. 208–216. [Google Scholar]
  62. Zhang, Q.; Ban, Y.; Liu, J.; Hu, Y. Simulation and analysis of urban growth scenarios for the Greater Shanghai Area, China. Comput. Environ. Urban Syst. 2011, 35, 126–139. [Google Scholar] [CrossRef]
  63. Zhou, L.; Dang, X.; Sun, Q.; Wang, S. Multi-scenario simulation of urban land change in Shanghai by random forest and CA-Markov model. Sustain. Cities Soc. 2020, 55, 102045. [Google Scholar] [CrossRef]
  64. Yue, W.; Fan, P.; Wei, Y.D.; Qi, J. Economic development, urban expansion, and sustainable development in Shanghai. Stoch. Environ. Res. Risk Assess. 2014, 28, 783–799. [Google Scholar] [CrossRef]
  65. Yin, J.; Yin, Z.; Zhong, H.; Xu, S.; Hu, X.; Wang, J.; Wu, J. Monitoring urban expansion and land use/land cover changes of Shanghai metropolitan area during the transitional economy (1979–2009) in China. Environ. Monit. Assess. 2011, 177, 609–621. [Google Scholar] [CrossRef]
  66. Hu, Y.n.; Connor, D.S.; Stuhlmacher, M.; Peng, J.; Turner Ii, B.L. More urbanization, more polarization: Evidence from two decades of urban expansion in China. npj Urban Sustain. 2024, 4, 33. [Google Scholar] [CrossRef]
  67. Ma, Y.; Xu, R. Remote sensing monitoring and driving force analysis of urban expansion in Guangzhou City, China. Habitat Int. 2010, 34, 228–235. [Google Scholar] [CrossRef]
  68. Fei, W.; Zhao, S. Urban land expansion in China’s six megacities from 1978 to 2015. Sci. Total Environ. 2019, 664, 60–71. [Google Scholar] [CrossRef] [PubMed]
  69. Zhang, J.; Ling, Y.; Zhu, A.X.; Zeng, H.; Song, J.; Zhu, Y.; Qian, L. Incorporation of spatial anisotropy in urban expansion modelling with cellular automata. Int. J. Geogr. Inf. Sci. 2022, 36, 86–113. [Google Scholar] [CrossRef]
  70. Schneider, A.; Woodcock, C.E. Compact, dispersed, fragmented, extensive? A comparison of urban growth in twenty-five global cities using remotely sensed data, pattern metrics and census information. Urban Stud. 2008, 45, 659–692. [Google Scholar] [CrossRef]
  71. Deng, H.; Zhang, K.; Wang, F.; Dang, A. Compact or disperse? Evolution patterns and coupling of urban land expansion and population distribution evolution of major cities in China, 1998–2018. Habitat Int. 2021, 108, 102324. [Google Scholar] [CrossRef]
  72. Lin, B.; Meyers, J.; Barnett, G. Understanding the potential loss and inequities of green space distribution with urban densification. Urban For. Urban Green. 2015, 14, 952–958. [Google Scholar] [CrossRef]
Figure 1. The location of the study area.
Remotesensing 17 00270 g001
Figure 2. The flowchart of the research framework.
Remotesensing 17 00270 g002
Figure 3. Quadrant subdivision of the study area, with Q1–Q8 representing each equal-angle quadrant (Q1 corresponds to the first quadrant, Q2 to the second, and so on through to Q8).
Remotesensing 17 00270 g003
Figure 4. Spatial changes in the urban land area of mainland Shanghai from 2016 to 2060.
Remotesensing 17 00270 g004
Figure 5. Urban land area changes across the eight quadrants of mainland Shanghai from 2016 to 2060 (a, b, c, d, and e represent the changes in Scenarios A, B, C, D, and E, respectively). Q1 to Q8 represent the quadrants in numerical order.
Remotesensing 17 00270 g005
Figure 6. Urbanization rate changes across the eight quadrants of mainland Shanghai from 2016 to 2060 (a, b, c, d, and e represent the changes in Scenarios A, B, C, D, and E, respectively). Q1 to Q8 represent the quadrants in numerical order.
Remotesensing 17 00270 g006
Figure 7. Spatiotemporal dynamics of urban land growth in the eight quadrants of mainland Shanghai from 2016 to 2060. Q1 to Q8 represent the quadrants in numerical order.
Remotesensing 17 00270 g007
Figure 8. The proportions of newly grown patch numbers for the three urban growth modes in mainland Shanghai from 2016 to 2060 (a, b, c, d, and e represent the changes in Scenarios A, B, C, D, and E, respectively).
Remotesensing 17 00270 g008
Figure 9. The proportions of newly grown patch area for the three urban growth modes in mainland Shanghai from 2016 to 2060 (a, b, c, d, and e represent the changes in Scenarios A, B, C, D, and E, respectively).
Remotesensing 17 00270 g009
Figure 10. Temporal changes in the MEI and AWMEI of mainland Shanghai from 2016 to 2060 (a, b, c, d, and e represent the changes in Scenarios A, B, C, D, and E, respectively).
Remotesensing 17 00270 g010
Table 1. Protection intensity values for target land use types under different scenarios in the SLEUTH model.
ScenariosGreen Land (%)Water Body (%)Farmland (%)
A10010086
B10010051
C10010017
D6310010
E271004
Table 2. The parameters determined by the SLEUTH model calibration.
Finalized ParametersEND
DIFFUSION4
BREED1
SPREAD39
SLOPE56
ROAD24
Table 3. Accuracy assessment of the projected LULC under five scenarios.
Year ScenariosAllocation
Disagreement (%)
Quantity
Disagreement (%)
Standard Kappa
Coefficient
2016A840.98
B830.98
C940.98
D950.95
E840.94
2017A1150.94
B1250.96
C1260.97
D1270.94
E1380.93
2018A1040.92
B1120.94
C1330.92
D1290.92
E13100.90
2019A1150.91
B1050.92
C1270.88
D1660.88
E1550.87
2020A1570.89
B1520.91
C1980.86
D1890.86
E20110.83
Table 4. The dynamics of the urban growth indicators from 2016 to 2060.
IndicatorsYearScenario AScenario BScenario CScenario DScenario E
Urban land
expansion (R)
(km2/year)
2016–20250.1114.0249.6555.9161.71
2025–20350.100.6731.9933.7733.35
2035–20450.100.670.790.820.85
2045–20600.100.670.780.810.83
Urban land
growth rate (K) (%/year)
2016–20250.010.632.222.492.74
2025–203500.031.011.020.97
2035–204500.030.020.020.02
2045–206000.030.020.020.02
Urban land growth intensity (Q) (%/year)2016–20250.023.0510.8112.1713.43
2025–20350.020.156.967.357.26
2035–20450.020.150.170.180.18
2045–20600.020.150.170.180.18
Disclaimer/Publisher’s Note: The statements, opinions and data contained in all publications are solely those of the individual author(s) and contributor(s) and not of MDPI and/or the editor(s). MDPI and/or the editor(s) disclaim responsibility for any injury to people or property resulting from any ideas, methods, instructions or products referred to in the content.

