Abstract
In the active–passive fusion-based bathymetry inversion method using single-temporal images, image data often suffer from errors due to inadequate atmospheric correction and interference from neighboring land and water pixels. This results in the generation of noise, making high-quality data difficult to obtain. To address this problem, this paper introduces a multi-temporal image fusion method. First, a median filter is applied to separate land and water pixels, eliminating the influence of adjacent land and water pixels. Next, multiple images captured at different times are fused to remove noise caused by water surface fluctuations and surface vessels. Finally, ICESat-2 laser altimeter data are fused with multi-temporal Sentinel-2 satellite data to construct a machine learning framework for coastal bathymetry. The bathymetric control points are extracted from ICESat-2 ATL03 products rather than from field measurements. A backpropagation (BP) neural network model is then used to incorporate the initial multispectral information of Sentinel-2 data at each bathymetric point and its surrounding area during the training process. Bathymetric maps of the study areas are generated based on the trained model. In the three study areas selected in the South China Sea (SCS), the validation is performed by comparing with the measurement data obtained using shipborne single-beam or multi-beam and airborne laser bathymetry systems. The root mean square errors (RMSEs) of the model using the band information after image fusion and median filter processing are better than 1.82 m, and the mean absolute errors (MAEs) are better than 1.63 m. The results show that the proposed method achieves good performance and can be applied for shallow-water terrain inversion.
1. Introduction
Bathymetric data are a basic geophysical parameter, and the accurate measurement of shallow-water bathymetry is crucial for the management of island coasts and the construction of marine projects. As a strategic resource, shallow-water geospatial data provide an important basis for marine science, engineering, and military operations. Traditional bathymetry methods, such as shipborne sonar and airborne light detection and ranging (LiDAR) surveying, offer high precision. However, these methods are costly, time-consuming, labor-intensive, and limited to areas that can be reached by aircraft or ships, making it difficult to carry out large-scale continuous surveying [1,2,3]. The development of remote sensing technology has introduced new approaches to bathymetry. Unlike active bathymetry methods, optical remote sensing bathymetry retrieval involves passive bathymetry based on the radiative transfer model. Due to its cost-effectiveness, global coverage, and timely data availability, remote sensing imagery has been widely used in coastal bathymetry. To obtain accurate and efficient bathymetry data from coastal and open shallow-water areas, a satellite-derived bathymetry (SDB) method using ICESat-2 data combined with multispectral imagery is proposed [4]. Studies have shown that spaceborne LiDAR can obtain bathymetric points with sufficient accuracy through processing to meet the accuracy requirements for use as SDB control points and compensate for the deficiency of field measurements to some extent. Spaceborne LiDAR can overcome the problem of inaccessibility [5]. However, it is difficult to ensure the accuracy of bathymetric measurement by spaceborne LiDAR, since the pulse signals emitted by spaceborne LiDAR are subjected to more interferences over long distances and complex paths. Therefore, it is very important to extract accurate bathymetric information from the ICESat-2 satellite.
With the development of optical remote sensing-derived bathymetry technology, theoretical analytical models, empirical models, and semitheoretical and semiempirical models have been developed [6,7,8,9,10]. Based on the theoretical analytical model, a semitheoretical and semiempirical model is built by using the attenuation characteristics of radiant energy transmission in water and a certain amount of actual bathymetry measurements as prior values [11,12,13]. This method reduces the quantization process of the intermediate parameters and has been widely applied to remote sensing image bathymetry inversion. For example, Hsu et al. measured the shallow-water bathymetries of six islands and reefs in the SCS on the basis of ICESat-2 and Sentinel-2 data [4]. Zhang et al. trained four typical models using ICESat-2 bathymetry points and multispectral imagery and produced bathymetric maps of Coral Island, Ganquan Island, and Lingyang Reef in the Xisha Islands; the average RMSE of the generated SDB was 0.16 and the average R2 was 0.90 [14]. Babbel et al. proposed using each pixel of the atmospherically corrected image data through a log-linear model combined with each pixel of the ICESat-2 data for the regression of bathymetry data [15]. To fuse the ICESat-2 LiDAR data and the Sentinel-2 optical images, an improved cloud mask was developed. In each region, the 20th percentile of the Sentinel-2 reflectance data obscured by clouds was used to derive the mosaic map. The data were correlated with relatively dark values over the entire reflectance range to ensure that the relatively bright common natural interference in the satellite imagery of coastal areas was reduced [16]. Chen et al. proposed a dual-band bathymetry method without bathymetric control points [17]. However, this method is difficult to implement and suffers from low inversion accuracy. Ma et al. proposed a complex mathematical model for bathymetry inversion [18]. However, most semitheoretical and semiempirical models do not consider the spatial correlation between the bathymetric point and surrounding pixels, and the traditional linear models are too simple and thus not suitable for complex environments [19].
With the advancement of computer technology, neural networks have become a powerful means for accurate bathymetry inversion. Neural networks do not need to consider the physical mechanism of remote sensing-derived bathymetry. Instead, these networks learn the statistical relationships between water depth and image pixel radiance values to build a model. Owing to their advantages in solving multivariable, nonlinear, and complex problems, neural networks are introduced into a statistical model for bathymetry inversion. For example, Ai et al. proposed combining the local connectivity of a convolutional neural network (CNN) and the local spatial correlation of pixels of bathymetry inversion images to construct models using remote sensing images and airborne LiDAR data [20]. Sandidge et al. proposed to use the backpropagation (BP) neural network model for bathymetry inversion [21]. The proposed model was better than the traditional linear regression model. Zhou et al. used a statistical model and a semiempirical and semianalytical model to combine multispectral remote sensing image data with ICESat-2 data [22]. The results revealed that the accuracy of the statistical model was relatively high, and the combination of the extreme gradient boosting model and Sentinel-2 data was the optimal choice. To avoid the problems caused by atmospheric correction failure, the Rayleigh corrected top-of-atmosphere reflectance (ρRC) was used as the input for bathymetry inversion via a multilayer perceptron (MLP) model [23]. A deep learning framework for coastal bathymetry was constructed based on machine learning approaches. With the help of a 2D CNN, a deep learning framework for nearshore bathymetry (DL-NB) can make full use of the initial multispectral information of Sentinel-2 data at each bathymetry point and its adjacent area during the training process [10]. The results showed that the universality of the DL-NB model was poor. The Sentinel-2 image time series were synthesized and used to perform coastal bathymetry inversion via four empirical models [24], and the comparison confirmed that the neural network methods had better performance than the traditional methods. Neural network-based bathymetric inversion methods usually use single-temporal images for bathymetric inversion. Due to the noise and reflectivity anomalies in single-time-phase images, it is difficult to obtain good bathymetric inversion results based on single-temporal images.
To address the image data quality issue in the remote sensing-derived bathymetry inversion using single-temporal images, this paper introduces an active and passive fusion method for shallow-water bathymetry using multi-temporal images. First, the ICESat-2 satellite can provide high-quality a priori bathymetric data. Next, Sentinel-2 images with cloud obstruction rates less than 10% are selected, a new image is generated from a single image via pixel median filtering and pixel-level fusion, and the BP neural network model is trained by fully utilizing the corresponding multispectral information of Sentinel-2 data at each bathymetry point. Finally, a bathymetry map of the study area, including Ganquan Island, Dong Island, and Wuzhizhou Island, is generated. To evaluate the bathymetry accuracy of the proposed method, the performance of the models trained with different inversion factors are compared with field survey data.
The innovations of this paper are as follows:
- (1)
- The DPC algorithm is first applied to ICESat-2 seafloor photon signal extraction to provide accurate bathymetric control points for SDB.
- (2)
- The bathymetric inversion of active and passive satellite remote sensing data based on multi-temporal fusion is proposed to eliminate the effects of image noise and reflectivity anomalies on the bathymetric inversion results.
- (3)
- Shallow bathymetric inversion results can be accurately obtained for different water depths and seafloor topography.
The remainder of this paper is organized as follows: in Section 2, the used data in this study are described, including the ICESat-2 ATL03 product and the Sentinel-2A spectral images. Section 3 presents the procedure and data processing methods used in this paper, and the performance of water depth estimation in three selected study areas in the SCS is demonstrated to validate the feasibility of the proposed method. In Section 4, the performance of the method is demonstrated in terms of topographic feature trends, different water depth accuracies, and relative measurement errors. Section 5 discusses and analyzes the performance of the proposed method. Section 6 summarizes the experimental results and presents conclusions.
2. Study Area and Data
2.1. Sentinel-2 Data
With the advancement of satellite technology, various satellite imagery methods have shown potential to compensate for the limitations of traditional methods. In particular, many optical remote sensing data sources, such as Landsat, Sentinel-2, and Worldview data, have been widely used in shallow-water depth estimation [25]. The main data sources used in this study were Sentinel-2A multispectral imagery. Sentinel-2A data were chosen for their main characteristics; they contain 12 spectral bands, with spatial resolutions of red, green, blue, and near-infrared up to 10 m and include bottom-of-atmosphere corrected reflectance data. In this study, Ganquan Island, Dong Island, and Wuzhizhou Island were selected as the study areas. These islands are representative of islands in the deep sea and shallow water. Wuzhizhou Island is located southeast of Hainan Island and is an island close to the mainland. The remote sensing image information used is listed in Table 1. The distribution of the three islands is shown in Figure 1.

Table 1.
Information on remote sensing imagery used in the three study areas.
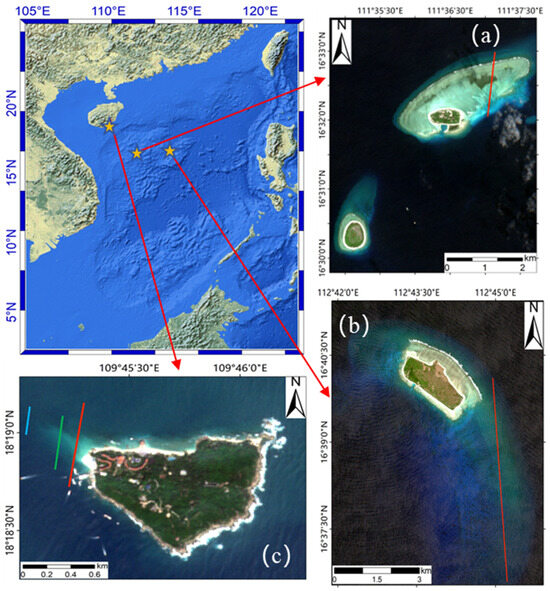
Figure 1.
The bottom image shows the Sentinel-2 true-color image of the study areas. The three study areas are (a) Ganquan Island, (b) Dong Island, and (c) Wuzhizhou Island. The colored bands in the figure are the surveying line trajectories of the ICESat-2 satellite, and the ATL03 bathymetric data used in this study are obtained from the ICESat-2 satellite data.
2.2. ICESat-2 Data
In this study, the bathymetry points extracted from ICESat-2 LiDAR data are used as the bathymetric control point for model training. The LiDAR onboard the ICESat-2 satellite provides active remote sensing detection technology and is equipped with the 532 nm advanced topographic laser altimeter system (ATLAS) [26], which has greater flexibility and underwater penetration capability. The diameter of each pulse is 17 m, and the spacing along the trajectory is 0.7 m, which represents the spatial resolution of ICESat-2. After eliminating noise errors and calibrating bathymetric and other errors, spaceborne photon-counting LiDAR has the potential to achieve high-precision bathymetry up to 38 m in shallow water and clean water to obtain shallow water depths [27]. The coastal bathymetry points are extracted from ICESat-2 for model training. The ATL03 data are a product of ICESat-2, which contains photon longitude, latitude, elevation, and confidence. The Earth reference system is the WGS-84 ellipsoid. The ATLAS has a laser that emits six laser beams divided into three pairs (gt1L, gt1R, gt2L, gt2R, gt3L, and gt3R, from left to right, along the ground trajectory of the satellite), and each pair contains one strong and one weak laser beam [28]. In this study, only the orbital data from the strong beam in each pair are used for water depth extraction.
To obtain the bathymetry control points, the ATL03 data from Ganquan Island, Dong Island, and Wuzhizhou Island are selected. The distribution of ATL03 data is shown in Figure 1. Water depth may be obtained from ATL03 data up to approximately 38 m [29]. Since it is difficult to collect passing survey lines on Ganquan Island, in this study, ATL03 laser point cloud data (2019/02/22) from the Coral Island area are used to derive parameters for the optical inversion model. The trained model is then used for bathymetry inversion in the Ganquan Island region. The depth of the laser point cloud data of the coral islands is up to 21 m, and data in the shallow water area (<1 m) are obtained. For Dong Island (2020/02/23), the shallowest point recorded was 5 m deep. Wuzhizhou Island data were collected from three survey lines (2020/09/30, 2021/06/29, 2022/09/30), with the shallowest water depth reaching 2 m. Laser point cloud data are free and easy to process, and the obtained bathymetric data are reliable.
2.3. In Situ Bathymetry Data
In the paper, shipboard single-beam or multi-beam and airborne laser bathymetry data are used to test and validate the bathymetric inversion results. The in situ data for Ganquan Island and Dong Island were obtained by the First Institute of Oceanography of the Ministry of Natural Resources using airborne laser and single-beam bathymetric systems, respectively, during a marine scientific survey conducted in 2012. The in situ data of the Wuzhizhou Island was obtained by Shandong University of Science and Technology using a multi-beam depth measurement system during a marine scientific survey. Shipboard single-beam or multi-beam and airborne laser bathymetry data have centimeter-level measurement errors and are well suited for testing and validating bathymetric inversion results.
3. Methods
In this study, ICESat-2 laser altimetry data were fused with multi-temporal Sentinel-2 satellite data after median filtering, and the BP neural network method was used for bathymetry inversion. The flowchart of the proposed method is shown in Figure 2.
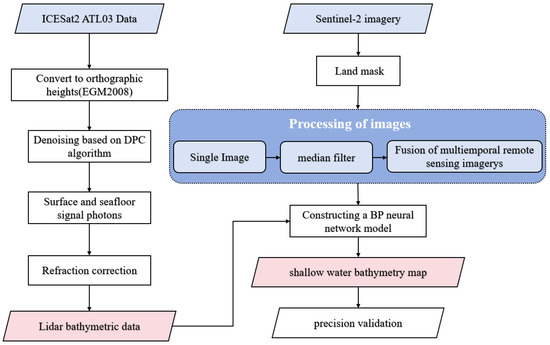
Figure 2.
Flowchart of data processing and methods.
First, isobath points were extracted from ATL03 data from the ICESat-2 satellite as control point data [30]. For the processed Sentinel-2A images, the empirical models for different inputs were built sequentially. First, a single image was used as input. Second, median filtering (3 × 3) was applied to the pixel value of a single image. Third, the median-filtered image was synthesized by superimposing the images together through the “medfilt2” function in MATLAB. To eliminate the influence of adjacent land and water pixels, the normalized difference water index (NDWI) was used to mask land and extract shallow water areas, followed by median filtering. Finally, the preprocessed spectral bands (band 2 (red), band 3 (green), and band 4 (blue)) were input into the BP neural network model for training. To validate the inversion accuracy and evaluate the performance of the three models trained with different inputs, the trained models were compared and analyzed.
3.1. Extraction of Bathymetry Control Points from the ICESat-2 Satellite
In this study, bathymetry control points were extracted from the ATL03 data product of the ICESat-2 satellite, and the process included the following steps: for the point cloud data, the WGS84 ellipsoidal height needed to be converted to a height referring to a mean sea level or geoid model. Therefore, the ellipsoidal heights of the photons were converted to orthometric heights using the EGM2008 geopotential and thus referred to the EGM2008 geoid. To address noisy data interference in the dataset, the improved DPC algorithm was used for signal photon extraction [31]. Since the DPC algorithm does not consider the distribution of the entire dataset, it cannot be applied to datasets with large differences in density. To improve the applicability of this algorithm, a method to calculate the data field potential energy is proposed that continuously optimizes the extraction of the optimal truncation threshold through information entropy. The potential energy formula is as follows:
where represents the Euclidean distance between the sample points and is the impact factor, which determined the optimal truncation distance. represents the initial truncation distance. The potential energy values in dataset X are {, , …, }. The uncertainty of the dataset is described by the Gini index, and the formula is as follows:
where is the sum of the potential energies of all the data in the dataset. As varies, the Gini index initially decreases until it reaches a minimum, after which it increases rapidly and finally stabilizes. By incorporating two optimal local density threshold parameters, which correspond to the daytime and nighttime data with different signal-to-noise ratios (SNRs), clustering is performed on the basis of the local density of each dataset.
Currently, ICESat-2 products do not consider reflection at the air–water interface and the corresponding change in light speed [29]. Because it is assumed that photons only propagate in the air, the depth of the seabed is overestimated. [32]. Therefore, reflection correction is necessary to obtain more realistic underwater terrain changes. The use of the kernel density function to separate sea surface photons from seafloor photons is based on the two following rules: (1) the point density at sea level is relatively high near sea level and (2) the sea level is higher than the seafloor. The first local minimum of the kernel density curve is used as the threshold for separating photons from the seafloor, and photons smaller than the threshold are considered seafloor photons [33]. The median sea surface photon elevation is used as the MSL. The sea surface is considered a horizontal surface, and the difference between the seafloor photon elevation and the MSL is calculated as the initial water depth. The reflection model is derived on the basis of the reflection law and combined with the vertical angle information corresponding to each photon provided by the ATL03 data in /gtx/geolocation/ref_elev. Reflection correction is performed on the seafloor photons to obtain more accurate bathymetric information [34].
3.2. Sentinel-2 Data Processing
The proximity effect is one of the main satellite image distortions and is caused mainly by the scattering atmosphere between the surface and the sensor; that is, a photon interacts with surface objects around the target pixel, is scattered by the atmosphere, and enters the sensor [35]. At the water–land boundary, owing to the optical complexity of seawater and disturbances from nearby land, the proximity effect is significantly increased [36]; therefore, the effective removal of adjacent land and water pixels is important for optical remote sensing-driven bathymetry [37]. To calculate the NDWI, land masking and deep and shallow water area separation are performed by adjusting the threshold, and the obtained shallow water area is used for the subsequent studies. The spatial resolution of the red, green, and blue bands of the Sentinel-2A image is 10 m, whereas the data interval of the ICESat-2 satellite is 0.7 m; therefore, when matching the same point from the two data sources, one pixel value of Sentinel-2A corresponds to multiple bathymetry points. Considering that the resolution of the remote sensing band is 10 m, median filter processing is performed on the image pixels and different window sizes are used. The experimental results show that when the window size is 3 × 3 pixels, the bathymetric inversion model based on the BP neural network can achieve high accuracy. Therefore, a window size of 3 × 3 pixels is chosen. Figure 3a shows a schematic diagram of the filtering principle.
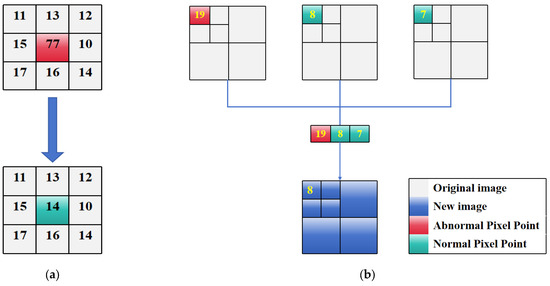
Figure 3.
Schematic diagram of image processing. (a) The median filtering window is 3 × 3 pixels. (b) Image fusion.
The median filter is a nonlinear digital filtering method that is often used to remove noise from images or other signals. The basic principle of median filtering is to select a neighborhood window of a pixel in the image, sort the values of all the signal points in that window by size, and replace the value of the current pixel with the median, which depends on the size of the filter window. The goal of median filtering is to make the pixel value closer to the true value. The median filtering formula is as follows:
where represents the original image. represents the processed image. m and n are the horizontal and vertical coordinates of the points in the neighborhood range of the point (x, y).
The Sentinel-2 images used in this paper were all downloaded from the European Space Agency (ESA). The Sentinel-2 images are Level-1C products. After geometrical correction and radiometric correction of the apparent top-of-atmosphere reflectance, each Level-1C image product consists of an orthographic image of 100 km2 (UTM/WGS84). The map coordinates of the image are corrected via a digital elevation model (DEM), and land, water, and cloud mask data are included. The Level-2A product is obtained by processing the Level-1C products using the Sen2Cor processor. Previous studies have shown that Sentinel-2A data with a longer time span may exhibit higher synthesis quality [38]. The ICEsat-2 satellite was launched in 2018. To avoid the influence of terrain changes caused by the long time span between the image data and the ICESat-2 acquisition time, 3 recent Sentinel-2A images with a cloud pixel percentage < 10% were stacked together with ICESat-2 data acquisition time as the reference. The median-filtered multi-temporal image was median-fused to generate a new high-quality image for subsequent bathymetric inversion. As shown in Figure 3b, this method can effectively mask the errors caused by the atmosphere or water quality in each satellite image.
3.3. Construction of the BP Neural Network Model
Machine learning methods can effectively learn and express the complex mapping mechanism between different variables. The BP neural network model is the most studied and widely used feedforward neural network [38]. The classic BP neural network is composed of three parts, namely the input layer, the hidden layer, and the output layer. The structure diagram of the BP neural network is shown in Figure 4. In this paper, the BP neural network contains input, hidden, and output layers. The input, hidden, and output layers contain 3 neurons, 10 neurons, and 1 neuron, respectively. Each neuron in the input layer is responsible for receiving information and then transmitting it to the intermediate neurons. The function of the neurons is information processing. The training process is completed through two processes, forward propagation and backward feedback. By adjusting the connections of internal nodes, information processing is achieved until the predicted result and the actual result converge. When the target output is known, the difference between the actual output of the neural network and the known true value is usually used as the loss function. The smaller the difference between the two values are, the better the performance of the neural network. The mean square error (MSE) function is often used as the loss function, and its formula is as follows:
where represents the number of training samples, is the number of outputs, is the predicted value of the j-th output of the i-th sample, and represents the corresponding true value.
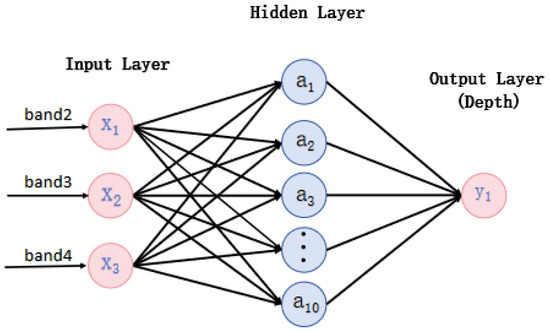
Figure 4.
Schematic diagram of the BP neural network.
The surface reflectance and water depths of the red, green, and blue bands containing the remote sensing reflectance from the joint training set were used as inputs. The ICESat-2 bathymetric data and the pixel values of the images of the same point were used to train the model, and a regression relationship was established with the bottom-of-atmosphere reflectance data of the Sentinel-2A image for bathymetry inversion. For the training model, 80% of samples was selected to train the model, and 20% of the samples was used as the validation set to evaluate the model accuracy. The network was trained to converge after 1000 epochs. The water depth of the corresponding sampling point was used as the output layer variable to continuously optimize the model. The training function was used as the transfer function of the hidden layer, and the purelin activation function was used in the output layer.
3.4. Quantitative Evaluation Indicators
To weigh the bias or difference between the estimated and measured water depths, the coefficient of determination (R2) between the two groups of data is used to evaluate the correlation, and the mean absolute error (MAE) and the RMSE between the obtained and measured water depths are used to evaluate the obtained water depths. When the MAE cannot be used to compare the reliability of different measured depths, the relative difference (RD) of the statistical data can better reflect the reliability of the estimated water depth. The formula of each indicator is as follows:
where represents the total number of pairs included in the bathymetric accuracy assessment, represents the obtained water depth, represents the collected actual bathymetric data, and represents the mean of the true values.
The MAE visually reflects the absolute error between the obtained and measured water depths, and the RMSE reflects the fluctuation in the bathymetric measurement error. The smaller the MAE and RMSE values are, the greater the measurement accuracy. The R2 reflects the correlation between the experimentally measured water depth and the actual water depth. The closer to 1 the R2 value is, the greater the goodness of fit. The RD reflects the magnitude between the absolute error and the true value.
4. Results and Analysis
4.1. Bathymetric Inversion for Ganquan Island
4.1.1. Bathymetric Result Map for Ganquan Island
Ganquan Island, a typical island in the open sea, is characterized by clear water quality and flat underwater topography. Figure 5a–c shows the results of bathymetric inversion for single-time, median filtering, and image fusion, respectively. As in the three generated bathymetric maps, in the shallow area less than 5 m, the obtained bathymetric results in Figure 5a,b are affected by the limitation of a single image. The images have local noise, and the water depth in some areas changes irregularly. Figure 5c shows the inversion result of the fusion image after the median filter is applied. The terrain is described in more detail, and the locally abnormal water depth is corrected, indicating that this method effectively overcomes the limitations of single-temporal images and can solve noise problems in images, such as the local turbidity of water quality or cloud obstruction.
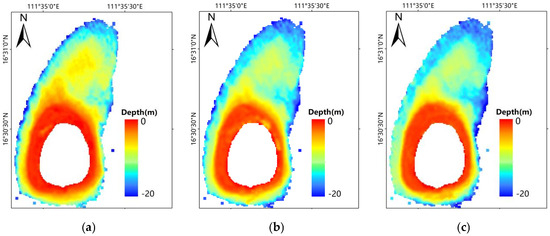
Figure 5.
(a–c) The results of Ganquan Island bathymetric inversions for single-time, median filtering, and image fusion, respectively.
4.1.2. Quantitative Evaluation for Ganquan Island
A scatter plot of the field measurement data and active and passive inversion results for the three study areas is created. Figure 6 shows the scatter plot of Ganquan Island, in which the 1:1 line is indicated by a dotted red line. When sample points are above the solid line, the estimated values are greater than the actual measurements. Otherwise, the estimated value is lower than the actual measurement. The closer to the 1:1 line the sample points are, the smaller the gap between the estimated value and the water depth. In the machine learning method, the water depth is often underestimated when comparing with the measured data in deep water areas, but the errors are not significantly different, indicating a strong correlation.
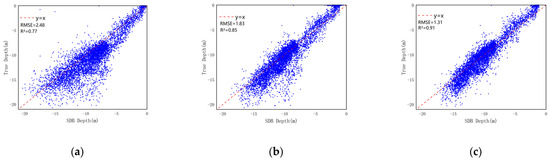
Figure 6.
Accuracy validation (a–c) for Ganquan Island.
The scatter plot of the Ganquan Island area with depths of 10–15 m (Figure 6a) shows a clear divergence. After median filtering, some bathymetric points converge, as shown in Figure 6b. Finally, the three median-filtered images are fused for inversion. Compared with the data points in Figure 6a,b, the data points in Figure 6c are closer to the 1:1 line, indicating a stronger correlation. The three images processed by the median filter are fused. The improvement effect on Ganquan Island is obvious, as the sample points are close to the 1:1 line. To further evaluate the accuracy of the obtained water depths for the three study areas, the R2, MAE and RMSE are calculated, as shown in Table 2.
Table 2.
Ganquan Island accuracy indicators.
The bathymetric inversion results of the BP neural network model can be acceptable using a single image. In the Ganquan Island area, the R2 reaches 0.77, with an RMSE of 2.48 m and an MAE of 2.48 m, respectively. A median filter is applied to a single image, and the R2 of Ganquan Island is 0.85, the MAE is 1.31 m, and the RMSE is 1.83 m. In particular, the R2 increases by 0.08, and the MAE and RMSE increase by 0.61 m and 0.65 m, respectively. Based on the median filter, the images are fused, and results are compared with those before image fusion. The performance on Ganquan Island is satisfactory, with an R2 of 0.91, an MAE of 1.11 m, and an RMSE of 1.31 m. Therefore, in general, bathymetric inversion via a machine learning model combined with multispectral imagery is reliable, the quality of the image data has a significant effect on the inversion results, and the median filtering and image fusion methods can effectively improve the accuracy of the inversion results.
4.1.3. Relative Difference for Ganquan Island
In bathymetric estimation, the RD among the statistical indicators refers to the value in which the ratio of the absolute error between the inverted and measured water depth to the true value is multiplied by 100% so that it is expressed as a percentage. In general, the RD better reflects the reliability of the measurement.
The RD histograms in Figure 7a–c show that the overall RD is skewed toward higher accuracy, with more data points on the left (lower values) than the right. This finding suggests that the majority of the bathymetric estimates closely match the measured data. In Figure 7a, an average of 150 water depth values are distributed in the 40–60% RD range, and 100 bathymetric points are distributed in the 60–100% range. Figure 7b,c shows that the RDs of the water depths are distributed mainly within 40%, indicating much higher reliability compared to that in Figure 7a.
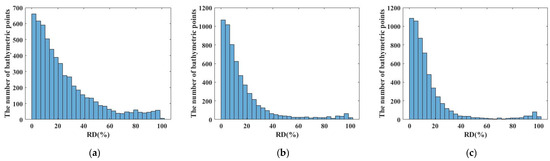
Figure 7.
(a–c) The RD distribution of the bathymetric inversion results for Ganquan Island by the three methods, respectively.
4.2. Bathymetric Inversion for Dong Island
4.2.1. Bathymetric Result Map for Dong Island
Dong Island is a typical island in the open sea, with clear water quality and great advantages in the acquisition of bathymetry control points and the quality of remote sensing imagery. As shown in Figure 8, among the three bathymetric maps, Figure 8a shows the inversion result of a single image. There are obvious abnormal water depths in the map, and the water depth is overestimated in some areas. A comparison with image analysis and field survey data reveals that the inversion results of the abnormal area do not match the actual topographic trend. Figure 8b,c shows the inversion results after median filtering and image fusion, respectively. The comparison shows that the water depths of the abnormal area in Figure 8a are corrected. There is a local turbid area in the single image, which causes the abnormal area in Figure 8a. The issue in the Dong Island area is improved after being processed by the proposed method.
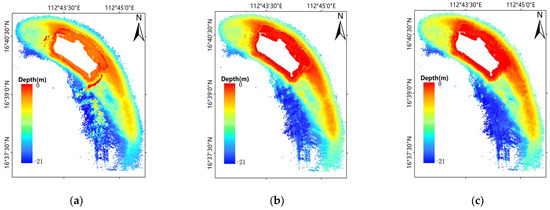
Figure 8.
(a–c) The results of Dong Island bathymetric inversion for single-time, median filtering, and image fusion, respectively.
4.2.2. Quantitative Evaluation for Dong Island
The scatter plots of field measurement data and active and passive inversion results for Dong Island are generated. As shown in Figure 9, the 1:1 line is indicated by a dotted red line. When sample points are above the solid line, the estimated values are greater than the actual measurements. Otherwise, the estimated values are lower than the actual measurements. The closer to the 1:1 line the sample point is, the smaller the gap between the estimated and measured water depths. The survey data used for validation of the Dong Island area are mainly distributed in the sea area with a water depth of 10–15 m, those with a depth < 5 m are insufficient, and those with a depth of more than 15 m deviate far from the 1:1 line. In the scatter plot of Dong Island after filtering, convergences occur to some extent. For Dong Island, the comparison with the actual survey data indicates that the improvement is not significant. Figure 9c shows that for Dong Island, convergence occurs at depths less than 15 m. To further evaluate the accuracy of the obtained water depth of Dong Island, the R2, MAE, and RMSE are calculated, as shown in Table 3.
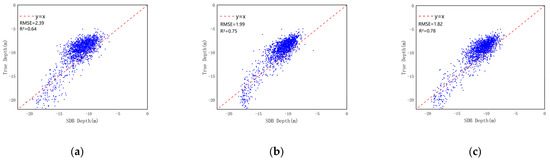
Figure 9.
Accuracy validation (a–c) for Dong Island.
Table 3.
Dong Island accuracy indicators.
For Dong Island, the inversion accuracy R2 of the BP neural network model trained on a single image is 0.64, and the RMSE and MAE are 2.39 m and 2.04 m, respectively, which are slightly worse than those for Ganquan Island. After performing median filtering on a single image, the R2 of Dong Island is 0.75, the MAE is 1.71 m, and the RMSE is 1.99 m. In particular, the R2 increases by 0.11, and the MAE and RMSE increase by 0.33 m and 0.4 m, respectively. After performing median filtering, the images are fused and results are compared with those before fusion. The bathymetric inversion results from the image fusion processing of Dong Island show a slight improvement in accuracy relative to the experimental results described above. The reasons for the lack of improvement in the Dong Island region are as follows: (1) the measured data are limited, i.e., no measured data at a depth < 5 m, and (2) the single image in the region involved in the accuracy assessment is less affected by median filtering and image fusion.
4.2.3. Relative Difference for Dong Island
The statistical histograms of RD in Figure 10a–c show that the overall RD trend is not obvious, but the RDs of the three methods are mainly distributed within 50%. In Figure 10a, the distribution of data for each column is relatively even, with approximately 20 data points with an RD over 40%. In Figure 10b, the RDs are mainly distributed within 30%, and data points with an RD over 40% can be ignored. In Figure 10c, there are no data with an RD greater than 45%. The RDs for the Dong Island area are uniform as a whole, and the main reason for the absence of extreme data is that the measured data involved in the accuracy evaluation are at a depth of no more than 5 m.
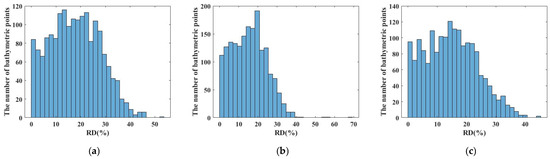
Figure 10.
(a–c) The RD distribution of the bathymetric inversion results for Dong Island by the three methods, respectively.
4.3. Bathymetric Inversion for Wuzhizhou Island
4.3.1. Bathymetric Result Map for Wuzhizhou Island
Wuzhizhou Island is an offshore island. A comparison of multiple multispectral Sentinel-2 images reveals that the image quality is poor because of the influence of ships and water surface fluctuations, and noise points due to multiple ships and water surface ripple disturbances cause the abnormal bottom-of-atmosphere reflectance. Figure 11 shows the inversion result map for Wuzhizhou Island. In the bathymetric maps generated by the method proposed in this paper (Figure 11b,c), the irregular fluctuations in water depth in deep sea areas with a depth below 5 m are improved. The selection of high-quality images is very important for bathymetric inversion, especially when human activities in coastal areas have a considerable impact. In coastal areas, the NDWI threshold combined with manual masking is used for processing, and the problems of ships and water surface fluctuations could be effectively improved by median filtering and image fusion.
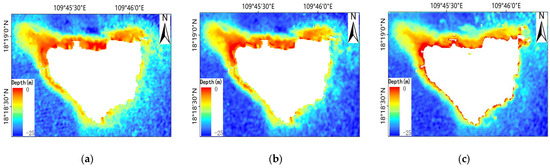
Figure 11.
(a–c) The results of Wuzhizhou Island bathymetric inversion for single-time, median filtering, and image fusion, respectively.
4.3.2. Quantitative Evaluation for Wuzhizhou Island
The scatter plots of field measurement data and active and passive inversion results for the Wuzhizhou Island study area are generated. As shown in Figure 12, the results at depths greater than 10 m on Wuzhizhou Island are underestimated compared with the actual measurements. After median filtering is performed on the same image, a new model is trained with the same three bands for bathymetric inversion. The scatter plot of Wuzhizhou Island is relatively concentrated. The three images subjected to a median filter are fused, and the scatter data are close to the 1:1 line. To further evaluate the bathymetric inversion accuracy of Wuzhizhou Island, the R2, MAE, and RMSE are calculated, as shown in Table 4.
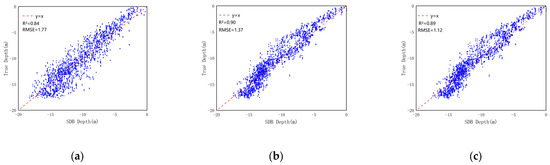
Figure 12.
Accuracy validation (a–c) for Wuzhizhou Island.
Table 4.
Wuzhizhou Island accuracy indicators.
For Wuzhizhou Island, the inversion accuracy of a single image is 0.84, the R2 is 0.84, the MAE is 1.41 m, and the RMSE is 1.77 m. A median filter is applied to a single image, and the R2 of Wuzhizhou Island is 0.90, the MAE is 1.11 m, and the RMSE is 1.37 m. In particular, the R2 increases by 0.06, and the MAE and RMSE increase by 0.3 m and 0.4 m, respectively. After median filtering, the images are fused and results are compared with those before fusion. The accuracy of the results for Wuzhizhou Island before and after fusion are not significantly different. In addition, the inversion accuracy after median filtering is only slightly higher, indicating that the sharpness of the three selected images is not different. Therefore, in general, the machine learning model combined with multispectral imagery is reliable for bathymetric inversion, and median filtering can effectively improve the inversion accuracy. Under the condition that the inversion using single-temporal image data is limited, the image fusion method can overcome this limitation.
4.3.3. Relative Difference for Wuzhizhou Island
The statistical histograms of RD in Figure 13a–c show that the overall RD distribution is high on the left and low on the right, indicating that the accuracy of the RD between most of the bathymetric data and the measured data is high. The RDs of the three methods are mainly distributed within 40%. In Figure 13a, the average number of data points with an RD of 30–40% per column is 70, and there are approximately 50 data points with an RD higher than 40%. In Figure 13b,c, the RDs are mainly distributed within 20%, and the number of data points with an RD over 40% is significantly lower than that in Figure 13a.
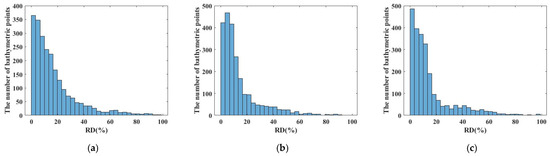
Figure 13.
(a–c) The RD distribution of the bathymetric inversion results for Wuzhizhou Island by the three methods, respectively.
5. Discussion
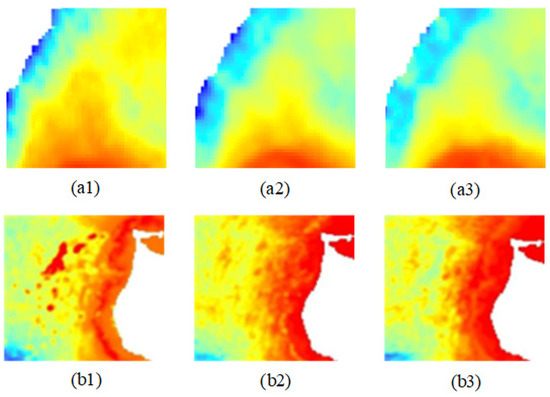
Figure 14a–c shows the original images of Ganquan Island, Dong Island, and Wuzhizhou Island, respectively. Within the red rectangular area of Figure 14a, there is a thin cloud cover. In the green rectangular region of Figure 14b, there is an image reflectivity anomaly. Figure 14c shows better image quality compared to Figure 14a,b. Figure 15(a1–a3) shows the bathymetric inversion results of the red rectangular area in Figure 14a using three algorithms, respectively. It can be seen that there are obvious anomalies in the bathymetry inversion results based on a single-temporal image due to the influence of thin cloud cover. The median filter can effectively alleviate the influence of thin cloud cover on the bathymetric inversion. Multi-temporal image fusion can further eliminate the influence of thin cloud cover on the bathymetric inversion results. Figure 15(b1–b3) shows the bathymetric inversion results of the green rectangular area in Figure 14b using three algorithms, respectively. It can be seen that due to the image reflectivity anomaly, the bathymetric inversion results based on the single-temporal have obvious errors. The median filter can alleviate the effect of image reflectivity anomalies on the bathymetric inversion. Multi-temporal fusion can further alleviate the effect of image reflectivity anomalies on the bathymetric inversion.
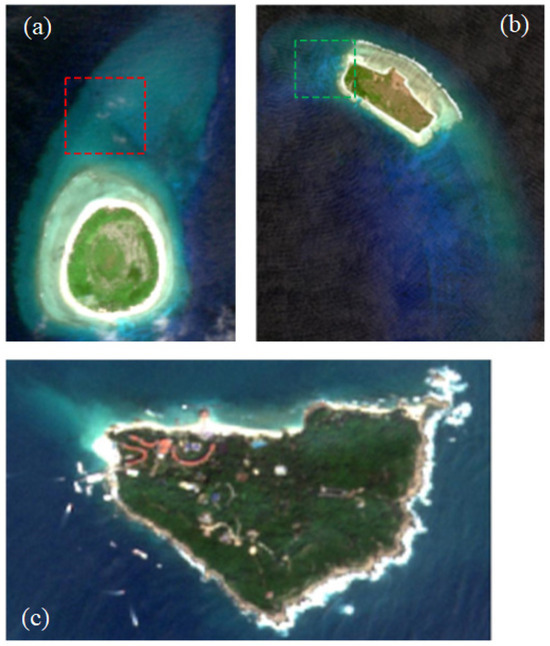
Figure 14.
(a–c) The original images of Ganquan Island, Dong Island, and Wuzhizhou Island, respectively. The areas within the red and green rectangles are the areas that need to be focused on.
In Table 2, for Ganquan Island, the RMSE of median filtering and multi-temporal fusion is improved by 0.65 m and 1.17 m, respectively, compared to the single-temporal image. In Table 3, for Dong Island, the RMSE of median filtering and multi-temporal fusion is improved by 0.4 m and 0.57 m, respectively, compared to the single-temporal image. In Table 4, for Wuzhizhou Island, the RMSE of median filtering and multi-temporal fusion is improved by 0.4 m and 0.36 m, respectively, compared to the single-temporal image. The above analysis shows that when there is thin cloud contamination and image reflectivity anomalies in the image, the bathymetric inversion results of the multi-temporal fusion are significantly better than the other two methods. When the original image quality is high, multi-temporal fusion and median filtering achieve bathymetric inversion results with similar accuracy. Overall, the optimal bathymetric inversion results can be obtained by multi-temporal fusion in three algorithms for different types of images.
6. Conclusions
In summary, to address the limitation of bathymetric inversion from single-temporal images, this paper introduces the use of Sentinel-2A image data and ICESat-2 satellite data from typical islands to construct a BP neural network model based on a machine learning algorithm. A method of combining median filtering and image fusion is proposed, and a bathymetric inversion study is conducted on Ganquan Island, Dong Island, and Wuzhizhou Island. Different bathymetric inversion maps show that the method in this paper can yield richer details and the continuity of topographic change. To evaluate the performance of the different processing methods, the inversion results are compared with field survey data for validation. The Sentinel-2A image data used in this study include mainly the bottom-of-atmosphere reflectance data, and an atmospheric correction step is not needed. The bathymetry points are extracted from the ICESat-2 lidar as a priori control points, overcoming the limitation that field data are difficult to obtain. The results show that the machine learning inversion method that combines the processed images with ICESat-2 data as depth prior information can achieve higher accuracy, and the RMSEs of the three study areas are 1.31 m, 1.82 m, and 1.41 m.
Specifically, the results of this study show that the performance of traditional machine learning methods for water depth estimation is reliable. Thus, these methods can fit the nonlinear relationship very well. The improvement in the inversion accuracy varies in different areas, indicating that different water qualities and complexities of the environment affect the universality of the method. A comparison of different water depths reveals that the inversion accuracy for areas shallower than 10 m is better than that for areas deeper than 10 m. In the future, the processed image data can be divided into different parts according to the water depth, and each part can be studied independently by modeling. In this study, ICESat-2 satellite and Sentinel-2A remote sensing images are used to obtain relatively accurate large-scale shallow-water surveys and seafloor topography data, providing a simple and reliable method for analyzing areas without field surveys or airborne LiDAR surveys. In the next step, the method introduced in this paper will be applied to different islands, reefs, and shallow waters for validation.
Author Contributions
J.L. was responsible for conceptualizing research goals and objectives, participating in the experimental design and data collection, and verifying the reproducibility of research results. As the corresponding author, Z.D. led the formulation of research objectives, conducted data analysis using statistical and computational techniques, provided supervision for the planning and execution of research activities, and was responsible for reviewing and editing manuscripts. L.C. managed the annotation, cleaning, and maintenance of data, including necessary software code, participated in the development of research methods and model creation, and provided the materials and tools required for the study. Q.T. successfully obtained funding support for the project and was responsible for managing and coordinating research activities. Y.Z. participated in the experiment and data collection and provided research resources such as laboratory samples. J.H. applied mathematics and formal techniques for data analysis and is responsible for the preliminary writing of articles and visualization of data presentation. All authors have read and agreed to the published version of the manuscript.
Funding
This research was funded by the National Key Research and Development Program of China under grant [no. 2023YFC3107601]; the National Natural Science Foundation of China under grant [nos. 42404056, 42376185, and 41876111]; the Key Laboratory of Ocean Geomatics, Ministry of Natural Resources, China, under grant [no. 2024B01]; the Open Fund of Shandong Provincial Key Laboratory of Marine Ecology and Environment and Disaster Prevention and Mitigation under grant [no. 202304]; the Natural Science Foundation of Shandong Province under grant [no. ZR2023QD113]; and the Natural Science Foundation of Qingdao Municipality under grant [no. 23-2-1-73-zyyd-jch].
Data Availability Statement
Data underlying the results presented in this paper are not publicly available at this time but may be obtained from the authors upon reasonable request.
Acknowledgments
The authors are grateful to the National Oceanic and Atmospheric Administration (NOAA) for distributing ICESat-2 lidar data and the European Space Agency (ESA) for distributing the Sentinel-2 imagery. The authors also thank the editor and anonymous reviewers for reviewing the paper.
Conflicts of Interest
The authors declare no conflicts of interest.
References
- Coleman, J.B.; Yao, X.; Jordan, T.R.; Madden, M. Holes in the ocean: Filling voids in bathymetric lidar data. Comput. Geosci. 2011, 37, 474–484. [Google Scholar] [CrossRef]
- Collin, A.; Archambault, P.; Long, B. Mapping the shallow water seabed habitat with the SHOALS. IEEE Trans. Geosci. Remote Sens. 2008, 46, 2947–2955. [Google Scholar] [CrossRef]
- Khazaei, B.; Read, L.K.; Casali, M.; Sampson, K.M.; Yates, D.N. GLOBathy, the global lakes bathymetry dataset. Sci. Data 2022, 9, 36. [Google Scholar] [CrossRef] [PubMed]
- Hsu, H.J.; Huang, C.Y.; Jasinski, M.; Li, Y.; Gao, H.L.; Yamanokuchi, T.; Wang, C.G.; Chang, T.M.; Ren, H.; Kuo, C.Y.; et al. A semi-empirical scheme for bathymetric map in shallow water by ICESat-2 and Sentinel-2: A case study in the South China Sea. ISPRS J. Photogramm. Remote Sens. 2021, 178, 1–19. [Google Scholar] [CrossRef]
- Albright, A.; Glennie, C. Nearshore bathymetry from fusion of Sentinel-2 and ICESat-2 observations. IEEE Geosci. Remote Sens. Lett. 2020, 18, 900–904. [Google Scholar] [CrossRef]
- Lyzenga, D.R. Passive remote sensing techniques for mapping water depth and bottom features. Appl. Opt. 1978, 17, 379–383. [Google Scholar] [CrossRef]
- Lee, Z.; Carder, K.L.; Mobley, C.D.; Steward, R.G.; Patch, J.S. Hyperspectral remote sensing for shallow waters. 2. deriving bottom depths and water properties by optimization. Appl. Opt. 1999, 38, 3831–3843. [Google Scholar] [CrossRef]
- Eugenio, F.; Marcello, J.; Martin, J. High-resolution maps of bathymetry and benthic habitats in shallow-water environments using multispectral remote sensing imagery. IEEE Trans. Geosci. Remote Sens. 2015, 53, 3539–3549. [Google Scholar] [CrossRef]
- Kanno, A.; Koibuchi, Y.; Isobe, M. Statistical combination of spatial interpolation and multispectral remote sensing for shallow water bathymetry. IEEE Geosci. Remote Sens. Lett. 2011, 8, 64–67. [Google Scholar] [CrossRef]
- Zhong, J.; Sun, J.; Lai, Z.L.; Song, Y. Nearshore bathymetry from ICESat-2 LiDAR and Sentinel-2 imagery datasets using deep learning approach. Remote Sens. 2022, 14, 4229. [Google Scholar] [CrossRef]
- Philpot, W.D. Bathymetric mapping with passive multispectral imagery. Appl. Opt. 1989, 28, 1569–1578. [Google Scholar] [CrossRef] [PubMed]
- Stumpf, R.P.; Holderied, K.; Sinclair, M. Determination of water depth with high-resolution satellite imagery over variable bottom types. Limnol. Oceanogr. 2003, 48, 547–556. [Google Scholar] [CrossRef]
- Wu, Z.Q.; Mao, Z.H.; Shen, W.; Yuan, D.P.; Zhang, X.L.; Huang, H.Q. Satellite-derived bathymetry based on machine learning models and an updated quasi-analytical algorithm approach. Opt. Express. 2022, 30, 16773–16793. [Google Scholar] [CrossRef] [PubMed]
- Zhang, X.; Chen, Y.; Le, Y.; Zhang, D.; Yan, Q.; Dong, Y. Nearshore Bathymetry Based on ICESat–2 and Multispectral Images: Comparison Between Sentinel–2, Landsat–8, and Testing Gaofen–2. IEEE J. Sel. Top. Appl. Earth Obs. Remote Sens. 2022, 15, 2449–2462. [Google Scholar] [CrossRef]
- Babbel, B.J.; Parrish, C.E.; Magruder, L.A. ICESat-2 elevation retrievals in support of satellite-derived bathymetry for global science applications. Geophys. Res. Lett. 2021, 48, e2020GL090629. [Google Scholar] [CrossRef]
- Thomas, N.; Pertiwi, A.P.; Traganos, D.; Lagomasino, D.; Poursanidis, D.; Moreno, S.; Fatoyinbo, L. Space-borne cloud-native satellite-derived bathymetry (SDB) models using ICESat-2 and Sentinel-2. Geophys. Res. Lett. 2021, 48, e2020GL092170. [Google Scholar] [CrossRef]
- Chen, B.Q.; Yang, Y.M.; Xu, D.; Huang, E.H. A dual band algorithm for shallow water depth retrieval from high spatial resolution imagery with no ground truth. ISPRS J. Photogramm. Remote Sens. 2019, 151, 1–13. [Google Scholar] [CrossRef]
- Ma, Y.; Zhang, J.; Zhang, Z.; Zhang, J.Y. Bathymetry Retrieval Method of LiDAR Waveform Based on Multi-Gaussian Functions. J. Coast. Res. 2019, 90, 324–331. [Google Scholar] [CrossRef]
- Tremeau, A.; Colantoni, P. Regions adjacency graph applied to color image segmentation. IEEE Trans. Image Process. 2000, 9, 735–744. [Google Scholar] [CrossRef]
- Ai, B.; Wen, Z.; Wang, Z.; Wang, R.; Yang, F. Convolutional Neural Network to Retrieve Water Depth in Marine Shallow Water Area From Remote Sensing Images. IEEE J. Sel. Top. Appl. Earth Obs. Remote Sens. 2020, 13, 2888–2898. [Google Scholar] [CrossRef]
- Sandidge, J.C.; Holyer, R.J. Coastal bathymetry from hyperspectral observations of water radiance. Remote Sens. Environ. 1998, 65, 341–352. [Google Scholar] [CrossRef]
- Zhou, Y.; Chen, J.; Chen, X.H.; Cao, X.; Zhu, X.L. Two important indicators with potential to identify Caragana microphylla in xilin gol grassland from temporal MODIS data. Ecol. Indic. 2013, 34, 520–527. [Google Scholar] [CrossRef]
- Lai, W.; Lee, Z.; Wang, J.; Wang, Y.; Garcia, R.A.; Zhang, H. A portable algorithm to retrieve bottom depth of optically shallow waters from top-of-atmosphere measurements. J. Remote Sens. 2022, 14, 4229. [Google Scholar] [CrossRef]
- Xu, N.; Wang, L.; Zhang, H.S.; Tang, S.L.; Mo, F.; Ma, X. Machine learning based estimation of coastal bathymetry from ICESat-2 and Sentinel-2 data. IEEE J. Sel. Top. Appl. Earth Obs. Remote Sens. 2024, 74, 1748–1755. [Google Scholar] [CrossRef]
- Neumann, T.A.; Brenner, A.; Hancock, D.; Robbins, J.; Saba, J.; Harbeck, K.; Gibbons, A.; Lee, J.; Luthcke, S.B.; Rebold, T. ATLAS/ICESat-2 L2A Global Geolocated Photon Data, Version3. ATL03; NASA National Snow and Ice Data Center Distributed Active Archive Center (NSIDCDAAC): Boulder, CO, USA, 2020. [Google Scholar] [CrossRef]
- Markus, T.; Neumann, T.; Martino, A.; Abdalati, W.; Brunt, K.; Csatho, B. The Ice, Cloud, and land Elevation Satellite-2 (ICESat-2): Science requirements, concept, and implementation. Remote Sens. Environ. 2017, 190, 260–273. [Google Scholar] [CrossRef]
- Wang, B.K.; Ma, Y.; Zhang, J.Y.; Zhang, H.W.; Zhu, H.T.; Leng, X.C.; Cui, A.J. A noise removal algorithm based on adaptive elevation difference thresholding for icesat-2 photon-counting data. Int. J. Appl. Earth Obs. Geoinf. 2023, 117, 103207. [Google Scholar] [CrossRef]
- Neumann, T.A.; Brenner, A.; Hancock, D.; Robbins, J.; Saba, J.; Harbeck, K.; Gibbons, A.; Lee, J.; Luthcke, S.B.; Rebold, T. ATLAS/ICESat-2 L2A Global Geolocated Photon Data, Version5. ATL03; NASA National Snow and Ice Data Center Distributed Active Archive Center (NSIDCDAAC): Boulder, CO, USA, 2021. [Google Scholar] [CrossRef]
- Parrish, C.E.; Magruder, L.A.; Neuenschwander, A.L.; Forfinski-Sarkozi, N.; Jasinski, M. Validation of ICESat-2 ATLAS Bathymetry and Analysis of ATLAS’s Bathymetric Mapping Performance. Remote Sens. 2019, 11, 1634. [Google Scholar] [CrossRef]
- Ma, Y.; Xu, N.; Liu, Z.; Yang, B.; Li, S. Satellite-derived bathymetry using the ICESat-2 lidar and Sentinel-2 imagery datasets. Remote Sens. Environ. 2020, 250, 112047. [Google Scholar] [CrossRef]
- Hayashida, K.; Murakami, G.; Matsuda, S.; Fushimi, K. History and profile of diagnosis procedure combination (DPC): Development of a real data collection system for acute inpatient care in Japan. J. Epidemiol. 2021, 31, 1–11. [Google Scholar] [CrossRef]
- Ranndal, H.; Christiansen, P.S.; Kliving, P.; Andersen, O.B.; Nielsen, K. Evaluation of a statistical approach for extracting shallow water bathymetry signals from ICESat-2 ATL03 photon data. Remote Sens. 2021, 13, 3548. [Google Scholar] [CrossRef]
- Leng, Z.; Zhang, J.; Ma, Y.; Zhang, J.; Zhu, H. A novel bathymetry signal photon extraction algorithm for photon-counting LiDAR based on adaptive elliptical neighborhood. Int. J. Appl. Earth Obs. Geoinf. 2022, 115, 103080. [Google Scholar] [CrossRef]
- Traganos, D.; Poursanidis, D.; Aggarwal, B.; Chrysoulakis, N.; Reinartz, P. Estimating satellite-derived bathymetry (SDB) with the google earth engine and sentinel-2. Remote Sens. 2018, 10, 859. [Google Scholar] [CrossRef]
- Vermote, E.F.; Tanré, D.; Deuze, J.L.; Herman, M.; Morcrette, J.J. Second simulation of the satellite signal in the solar spectrum, 6S: An overview. IEEE Trans. Geosci. Remote Sens. 1997, 35, 675–686. [Google Scholar] [CrossRef]
- Bulgarelli, B.; Zibordi, G. On the detectability of adjacency effects in ocean color remote sensing of mid-latitude coastal environments by SeaWiFS, MODIS-A, MERIS, OLCI, OLI and MSI. Remote Sens. Environ. 2018, 209, 423–438. [Google Scholar] [CrossRef]
- Li, J.W.; Knapp, D.E.; Lyons, M.; Roelfsema, C.; Phinn, S.; Schill, S.R.; Asner, G.P. Automated global shallow water bathymetry map using Google Earth Engine. Remote Sens. 2021, 13, 1469. [Google Scholar] [CrossRef]
- Li, J.; Cheng, J.H.; Shi, J.Y.; Huang, F. Brief introduction of back propagation (BP) neural network algorithm and its improvement. In Advances in Computer Science and Information Engineering; Jin, D., Lin, S., Eds.; Springer: Berlin/Heidelberg, Germany, 2012; Volume 2, pp. 553–558. [Google Scholar] [CrossRef]
Disclaimer/Publisher’s Note: The statements, opinions and data contained in all publications are solely those of the individual author(s) and contributor(s) and not of MDPI and/or the editor(s). MDPI and/or the editor(s) disclaim responsibility for any injury to people or property resulting from any ideas, methods, instructions or products referred to in the content. |
© 2025 by the authors. Licensee MDPI, Basel, Switzerland. This article is an open access article distributed under the terms and conditions of the Creative Commons Attribution (CC BY) license (https://creativecommons.org/licenses/by/4.0/).