Article

Extending Satellite Predictions of Coral Disease Outbreak Risk to Non-Seasonal Coral Reef Regions

by
Momoe Yoshida
1 and
Scott F. Heron
1,2,*
1
Physical Sciences, College of Science and Engineering, James Cook University, Townsville, QLD 4811, Australia
2
Marine Geophysics Laboratory, James Cook University, Townsville, QLD 4811, Australia
*
Author to whom correspondence should be addressed.
Remote Sens. 2025, 17(2), 262; https://doi.org/10.3390/rs17020262
Submission received: 30 September 2024 / Revised: 6 December 2024 / Accepted: 7 January 2025 / Published: 13 January 2025
(This article belongs to the Section Coral Reefs Remote Sensing)

Abstract

:
Coral disease outbreaks have increased in frequency and extent worldwide since the 1970s, coinciding with the rapid increase in ocean warming. Summer and winter temperature-based metrics have proven effective in predicting coral disease outbreaks in seasonal coral reef regions. However, their utility is unknown in non-seasonal coral reef areas. Here, a new methodology, independent of seasonal patterns, is developed for application in both seasonal and non-seasonal coral reef regions. Percentile-based metric thresholds were defined from seasonal equivalents in the Great Barrier Reef (GBR) and tested in seasonal and non-seasonal coral reef regions of the tropical Pacific Ocean. Between new and existing methodologies, median differences of 0.00 °C (thresholds) and 0.00 °C-weeks (metrics) for Hot Snap and Cold Snap; and 0.01 °C (threshold) and −0.17 °C-weeks (metric) for Winter Condition were observed among reef pixels of the GBR. The new methodology shows strong consistency with the existing tools used for seasonal regions (e.g., R2 = 0.811–0.903; GBR case studies). Comparisons of the new metrics with disease observations were constrained by the limited availability of disease data; however, the comparisons undertaken suggest predictive capability in non-seasonal regions. To establish robust correlations, further direct comparisons of the new metrics with disease data across various non-seasonal regions and timeframes are essential. With ocean warming projected to persist in the coming decades, improving the predictive tools used to assess ecological impacts is necessary to support effective coral reef management.

Graphical Abstract

1. Introduction

Coral reefs are one of the most diverse and economically and ecologically valuable ecosystems on earth [1]. Driven by ocean warming as a result of climate change, the increasing frequency of coral disease outbreaks has been a global concern since the 1970s [2,3,4]. Effectively predicting and managing these outbreaks is important for coral reef conservation. In recent years, explicit correlations between temperature anomalies and their impact on coral hosts and pathogens, which subsequently contribute to the occurrence of coral diseases, have been demonstrated by numerous studies [3,5,6,7,8,9,10,11,12,13,14,15,16,17,18]. Due to the diversity of coral reefs and responses to disease, further investigations into the complex relationship between thermal anomalies and disease prevalence must include diverse time frames and geographical regions.
High-quality, long-term global satellite-derived sea surface temperature (SST) datasets allow the examination of links between temperature anomalies and coral disease dynamics across broad spatial scales. Six previous studies have developed or applied remotely-sensed SST thermal stress metrics to examine their potential as predictors of coral disease outbreaks in seasonal regions [5,7,8,10,12,14]. However, non-seasonal areas remain understudied, considering past analyses. Here, a “seasonal” region is defined as a region predominated by intra-annual variations in SST, with distinct summer and winter seasons, typical of temperate latitudes; conversely, a “non-seasonal” region exhibits dominant interannual SST variations with minimal or indistinct seasonal variability, typical of areas closer to the Equator [19].
Hot Snap, Cold Snap and Winter Condition metrics (°C-weeks), first developed by Heron et al. (2010) [5], have been successful in predicting white syndrome (WS) outbreak risk in the following two seasonal regions: the Great Barrier Reef (GBR) and the Hawaiian archipelago [5,8]. The three metrics incorporate the magnitude and duration of SST anomalies above or below defined seasonal average (AV)- and standard deviation (SD)-based thresholds, which were linked to disease risk [5]. Intense Hot Snaps were posited to diminish host immunity and elevate pathogen loads, while severe Cold Snaps were related to pathogen mortality [5]. Warm Winter Conditions were associated with enhanced host resistance, while mild Winter Conditions (neither anomalously cool nor warm) were associated with an increased chance of pathogen survival throughout the winter [5]. The balance between these elements determines the risk of coral disease outbreaks [5].
However, this algorithm had limited success in predicting WS outbreak risk in Guam, a region with a weak seasonality [10]. This may have been due to the metrics’ inherent link with seasonal SST variations, upon which the methodology relies, thus limiting its application in non-seasonal regions.
To address this limitation, a new methodology, which does not rely on consistent periods of summer and winter between years but rather depends on SST distribution, is proposed as an alternative to the existing methodology. Percentile-based thresholds [20] were developed as an alternative to AV- and SD-based thresholds to derive risk metrics and test their applicability in both seasonal and non-seasonal locations. If successful, this study could inform the development of new predictive tools for coral disease outbreaks using percentile-based Hot Snap, Cold Snap and Winter Condition metrics that are broadly applicable across seasonal and non-seasonal coral reef regions.

2. Materials and Methods

The study sites were within the specific coral reef regions of a NASA-funded project led by the University of Hawaii (FORE-C: Forecasting coral disease outbreaks across the tropical Pacific Ocean using satellite-derived data). Twelve reef areas (Figure 1) were assessed for this as follows: the Great Barrier Reef (GBR; Figure 1.1); Guam and the Northern Mariana Islands (NMI; Figure 1.2); Howland (Figure 1.3a) and Baker Islands; Jarvis Island (Figure 1.3b); Wake Atoll; the Hawaiian archipelago and Johnston Atoll; Palmyra Atoll and Kingman Reef; and American Samoa (including Swains Island). Here, we focus on four of those sites (GBR, Guam, Howland and Jarvis Islands) for the following reasons. The GBR (Figure 1.1) is the reef area where the existing AV- and SD-based metrics were originally developed [5], thus becoming the foundation for the new percentile-based approach. Guam (Figure 1.2) was included as a focus area to build upon previous work that revealed the limitations of the existing metrics in this weakly-seasonal region [10], benefiting from available disease data. Howland and Jarvis Islands (Figure 1.3) were chosen because they are located within a non-seasonal region, with some disease observation data available. To augment the analyses for the four focal regions, outcomes from other sites are available in Supplementary Materials.
SST data were extracted from the Coral Reef Watch (CRW) daily global 5-km satellite SST dataset, known as CoralTemp v3.1 [21]. This is a publicly available product of consistent gap-free daily global data at a 5-km (i.e., 0.05°) resolution, spanning 1 January 1985 to the present [22]. SST values within the dataset are presented with 0.01 °C precision (e.g., 28.13 °C); they represent nighttime conditions, when sea temperature anomalies at and near the surface are more representative of conditions at depth, avoiding the effects of diurnal heating [23]. The numbers of reef-containing pixels within each of the regions are as follows: GBR, 4412 pixels; Guam and NMI, 155 pixels; Howland and Baker Islands, 12 pixels; Jarvis Island, 2 pixels; Wake Atoll, 6 pixels; Hawaiian archipelago, 630 pixels; Johnston Atoll, 23 pixels; Palmyra Atoll and Kingman Reef, 18 pixels; and American Samoa, 56 pixels.
Hot Snap, Cold Snap and Winter Condition (units: °C-weeks) are the accumulations of daily SST anomalies with respect to location-specific, seasonal thresholds (Figure 2), initially developed by Heron et al. (2010) [5] and briefly described here. The summer [or winter] average (AV) is the mean of daily SST from the three consecutive warmest (i.e., summer) [or coldest (i.e., winter)] months in a 21-year climatological period (i.e., 1985–2005), calculated with its corresponding standard deviation (SD). The Hot Snap metric accumulates when daily SST exceeds the summer AV plus one summer SD (AV+SD), and the Cold Snap metric accumulates when daily SST is below the winter AV minus one winter SD (AV–SD; Figure 2). The Winter Condition metric accumulates (i) within the three winter months, specific to each pixel; and/or (ii) when daily SST is equal to or below the winter AV plus one winter SD (AV+SD; to include winter-like conditions outside the defined winter period). Metrics assessed in winter are used in combination with that from the subsequent summer to predict disease outbreak risk [5]. Each metric is initialised to 0 °C-weeks annually in its defined (pixel-specific) reset month; the Hot Snap reset month is three months prior to the start of the summer months, and the Cold Snap and Winter Condition reset month is two months prior to the start of the winter months. Metric calculations are illustrated for the SST time-series from a reef-containing pixel from the offshore, southern GBR region (Figure 2).

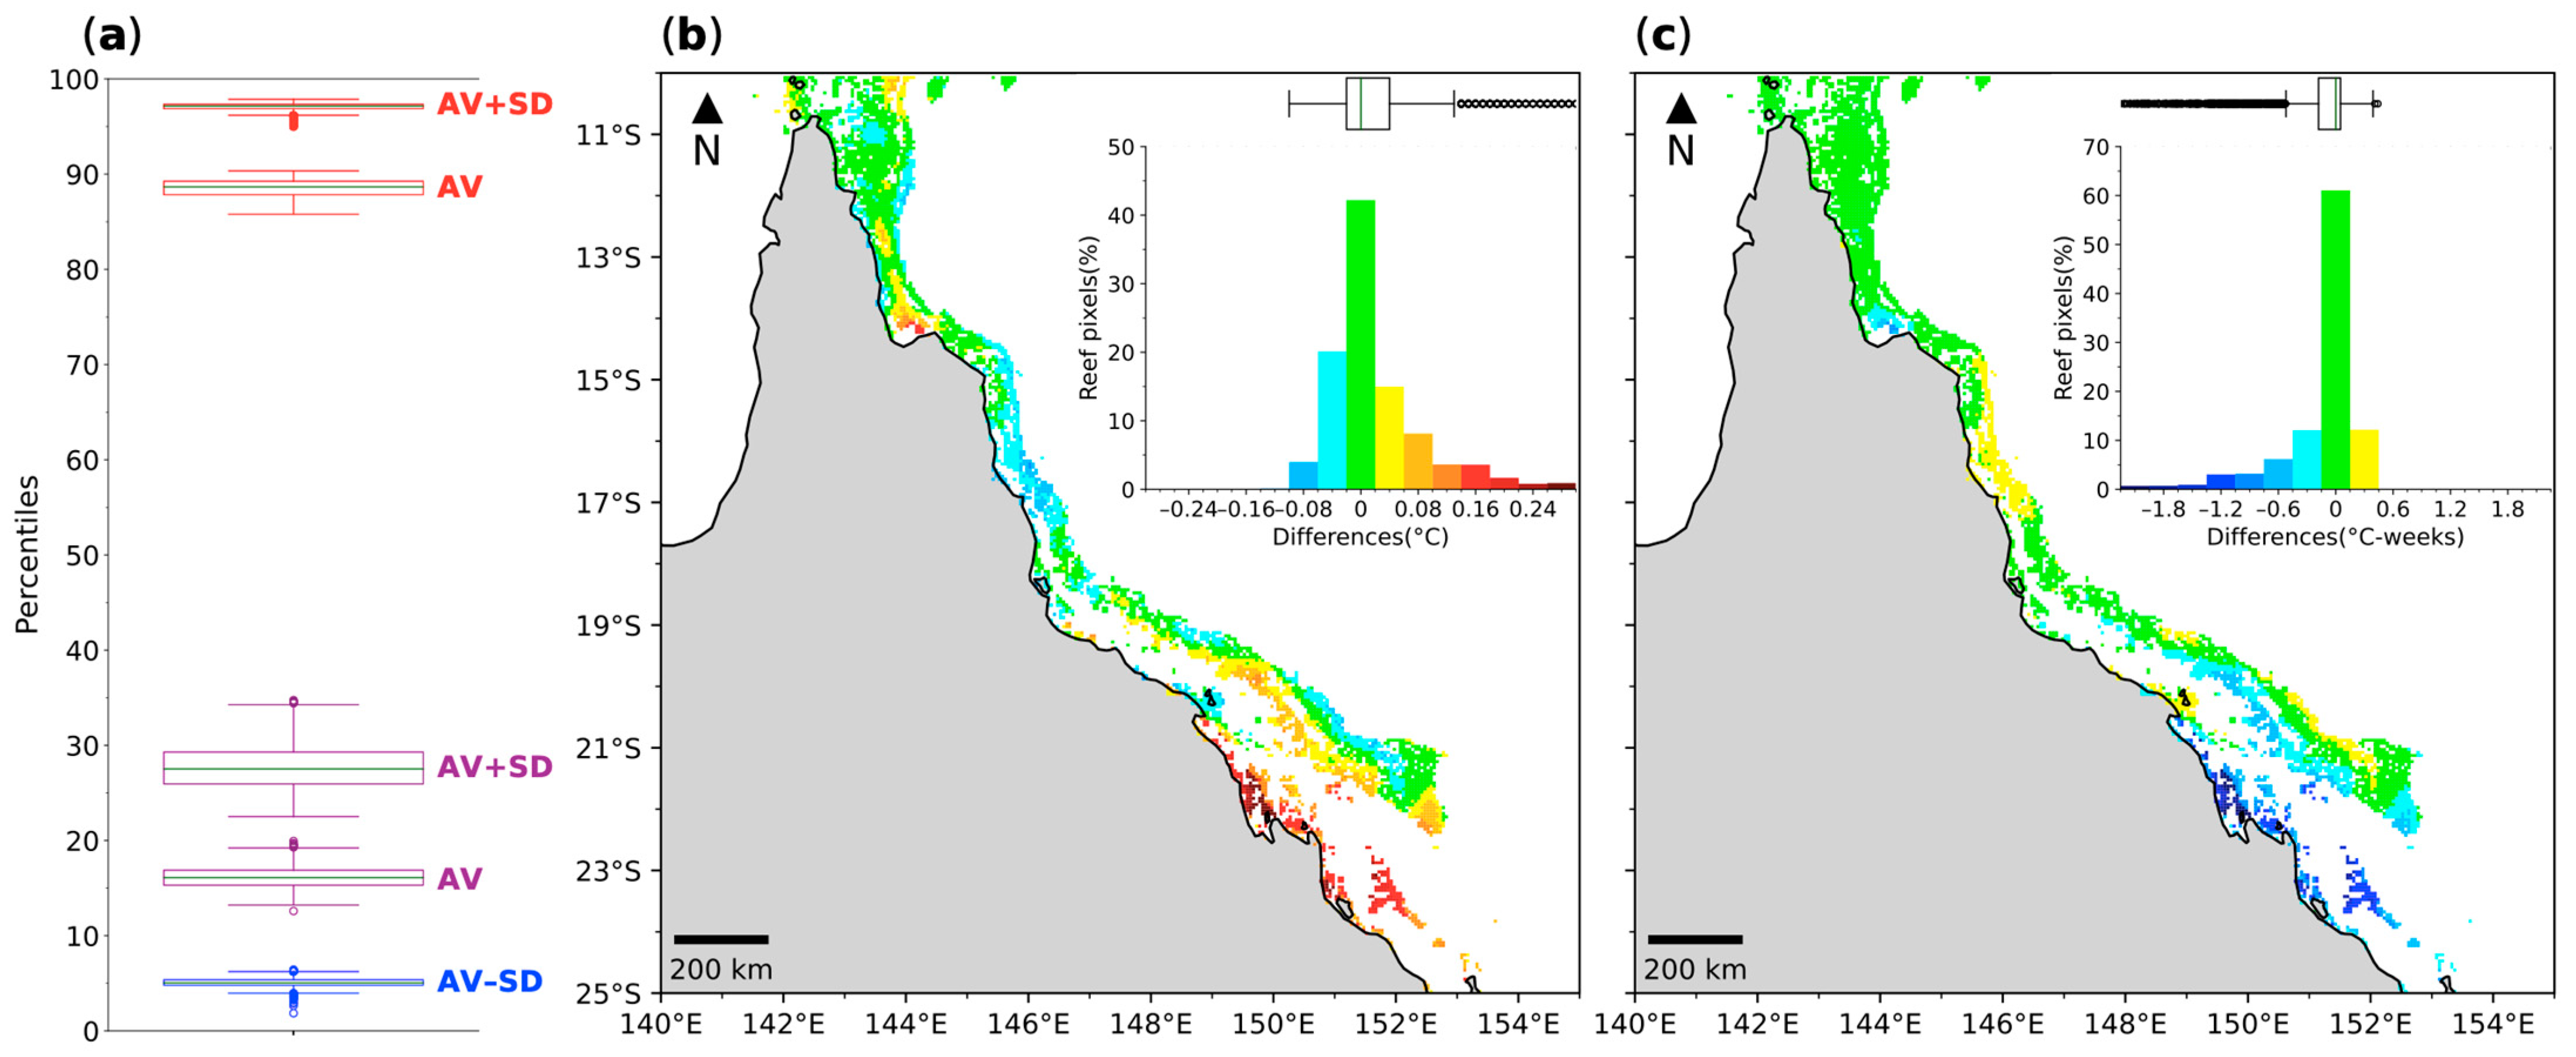
2.1. Development of Percentile-Based Thresholds in the Great Barrier Reef

A new percentile-based method for defining the thresholds of the three metrics consistently for both seasonal and non-seasonal regions was developed by analysing data in the GBR. The percentile values corresponding to the five seasonally-based thresholds (Figure 2) were determined within the distribution of SST values across the climatology period (1985–2005) for each of the 4412 reef pixels of the GBR (light grey in Figure 1.1). This baseline climatology period (1985–2005) is consistent with that of the existing method.
The median percentile from the 4412 GBR pixels was calculated for each of the five thresholds, to be tested as a new threshold definition. To investigate how the use of the percentile-based thresholds altered the metrics, the Hot Snap and Winter Condition were calculated for 2001/2002 (a period of observed disease). Cold Snap was derived for 2000/2001 as there were no Cold Snap events (i.e., below 0 °C-weeks) in 2001/2002 across the GBR pixels. Differences between the new percentile-based and the existing AV- and SD-based thresholds and metrics were calculated. The existing (seasonally-based) method used to define the annual reset timing for each metric was used for this analysis to first examine the influence of changes in thresholds and metrics.

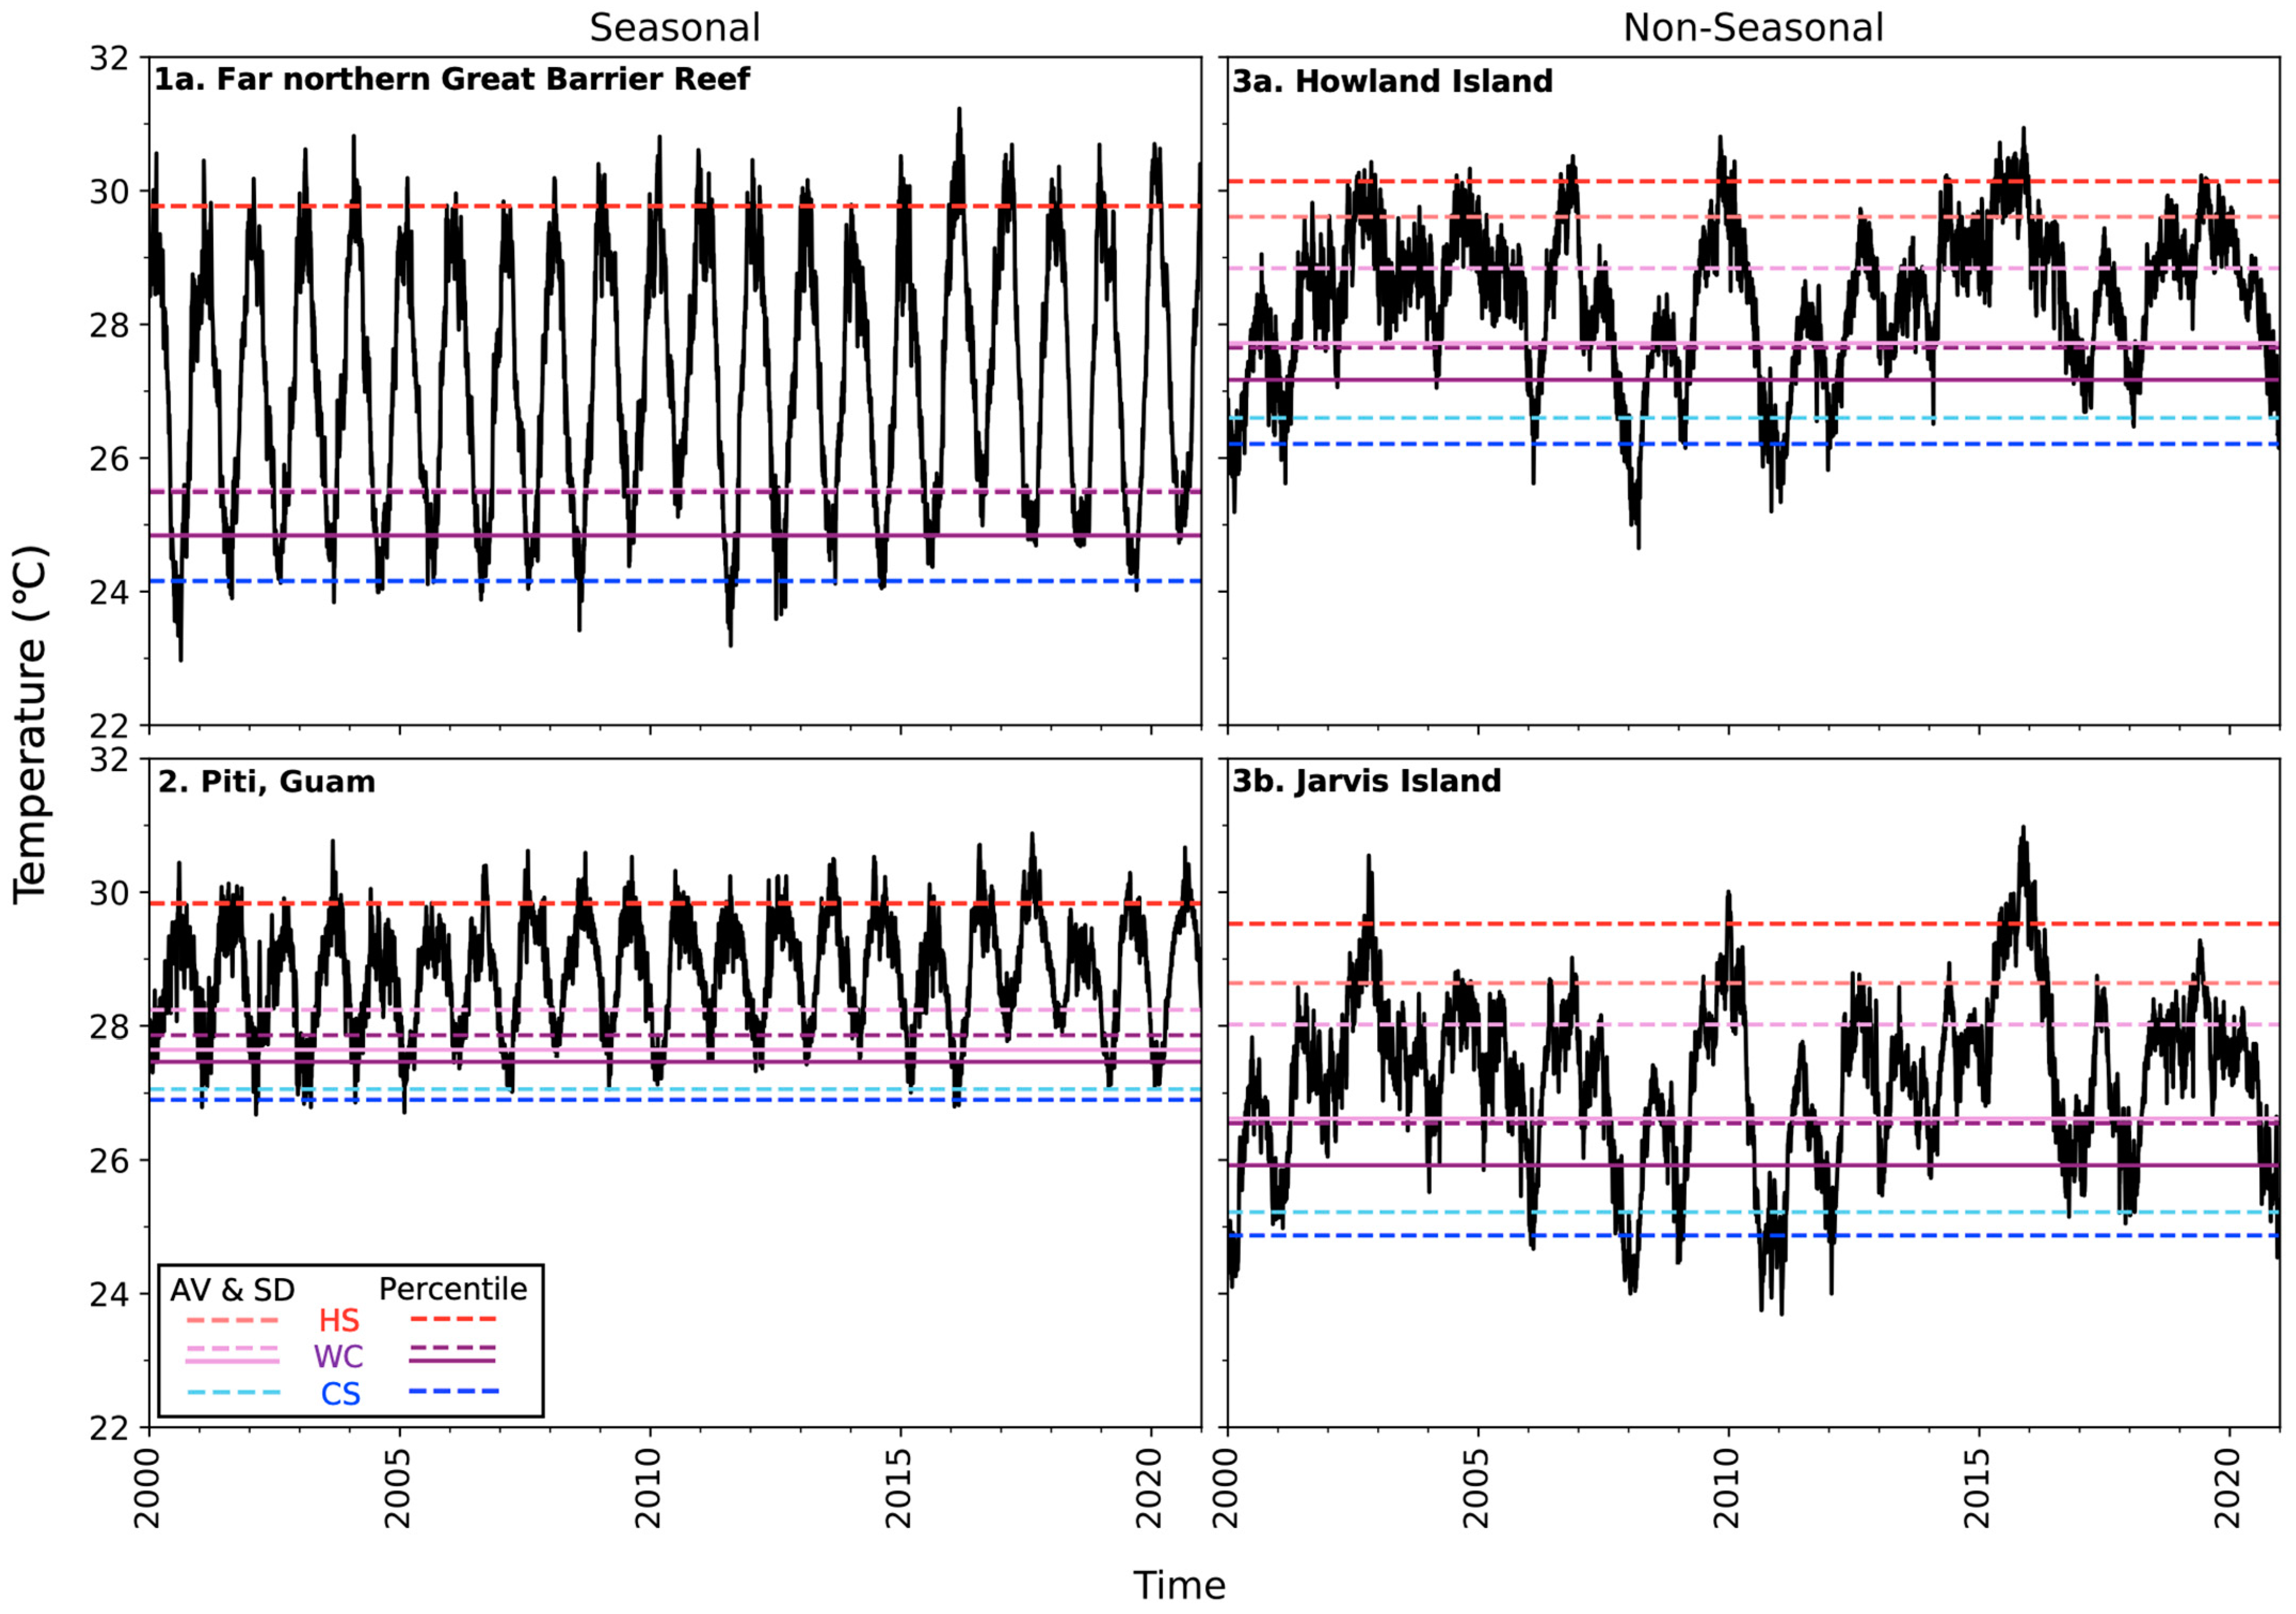
2.2. Application of the Percentile-Based Methodology to Seasonal and Non-Seasonal Regions

Comparison of the new percentile-based thresholds with the existing AV- and SD-based thresholds was expanded to other seasonal and non-seasonal regions in the tropical Pacific Ocean. This required the development of a new, non-seasonally-based definition of the timings used to annually reset the three metrics. The existing AV- and SD-based methodology relies upon identifying three consecutive winter or summer months and setting the annual reset timing for each metric based on that [5]. However, in non-seasonal coral reef regions, intra-annual SST temporal patterns can vary between years (i.e., interannually). Thus, it was necessary to depart from the existing seasonal approach and develop the new approach as follows:
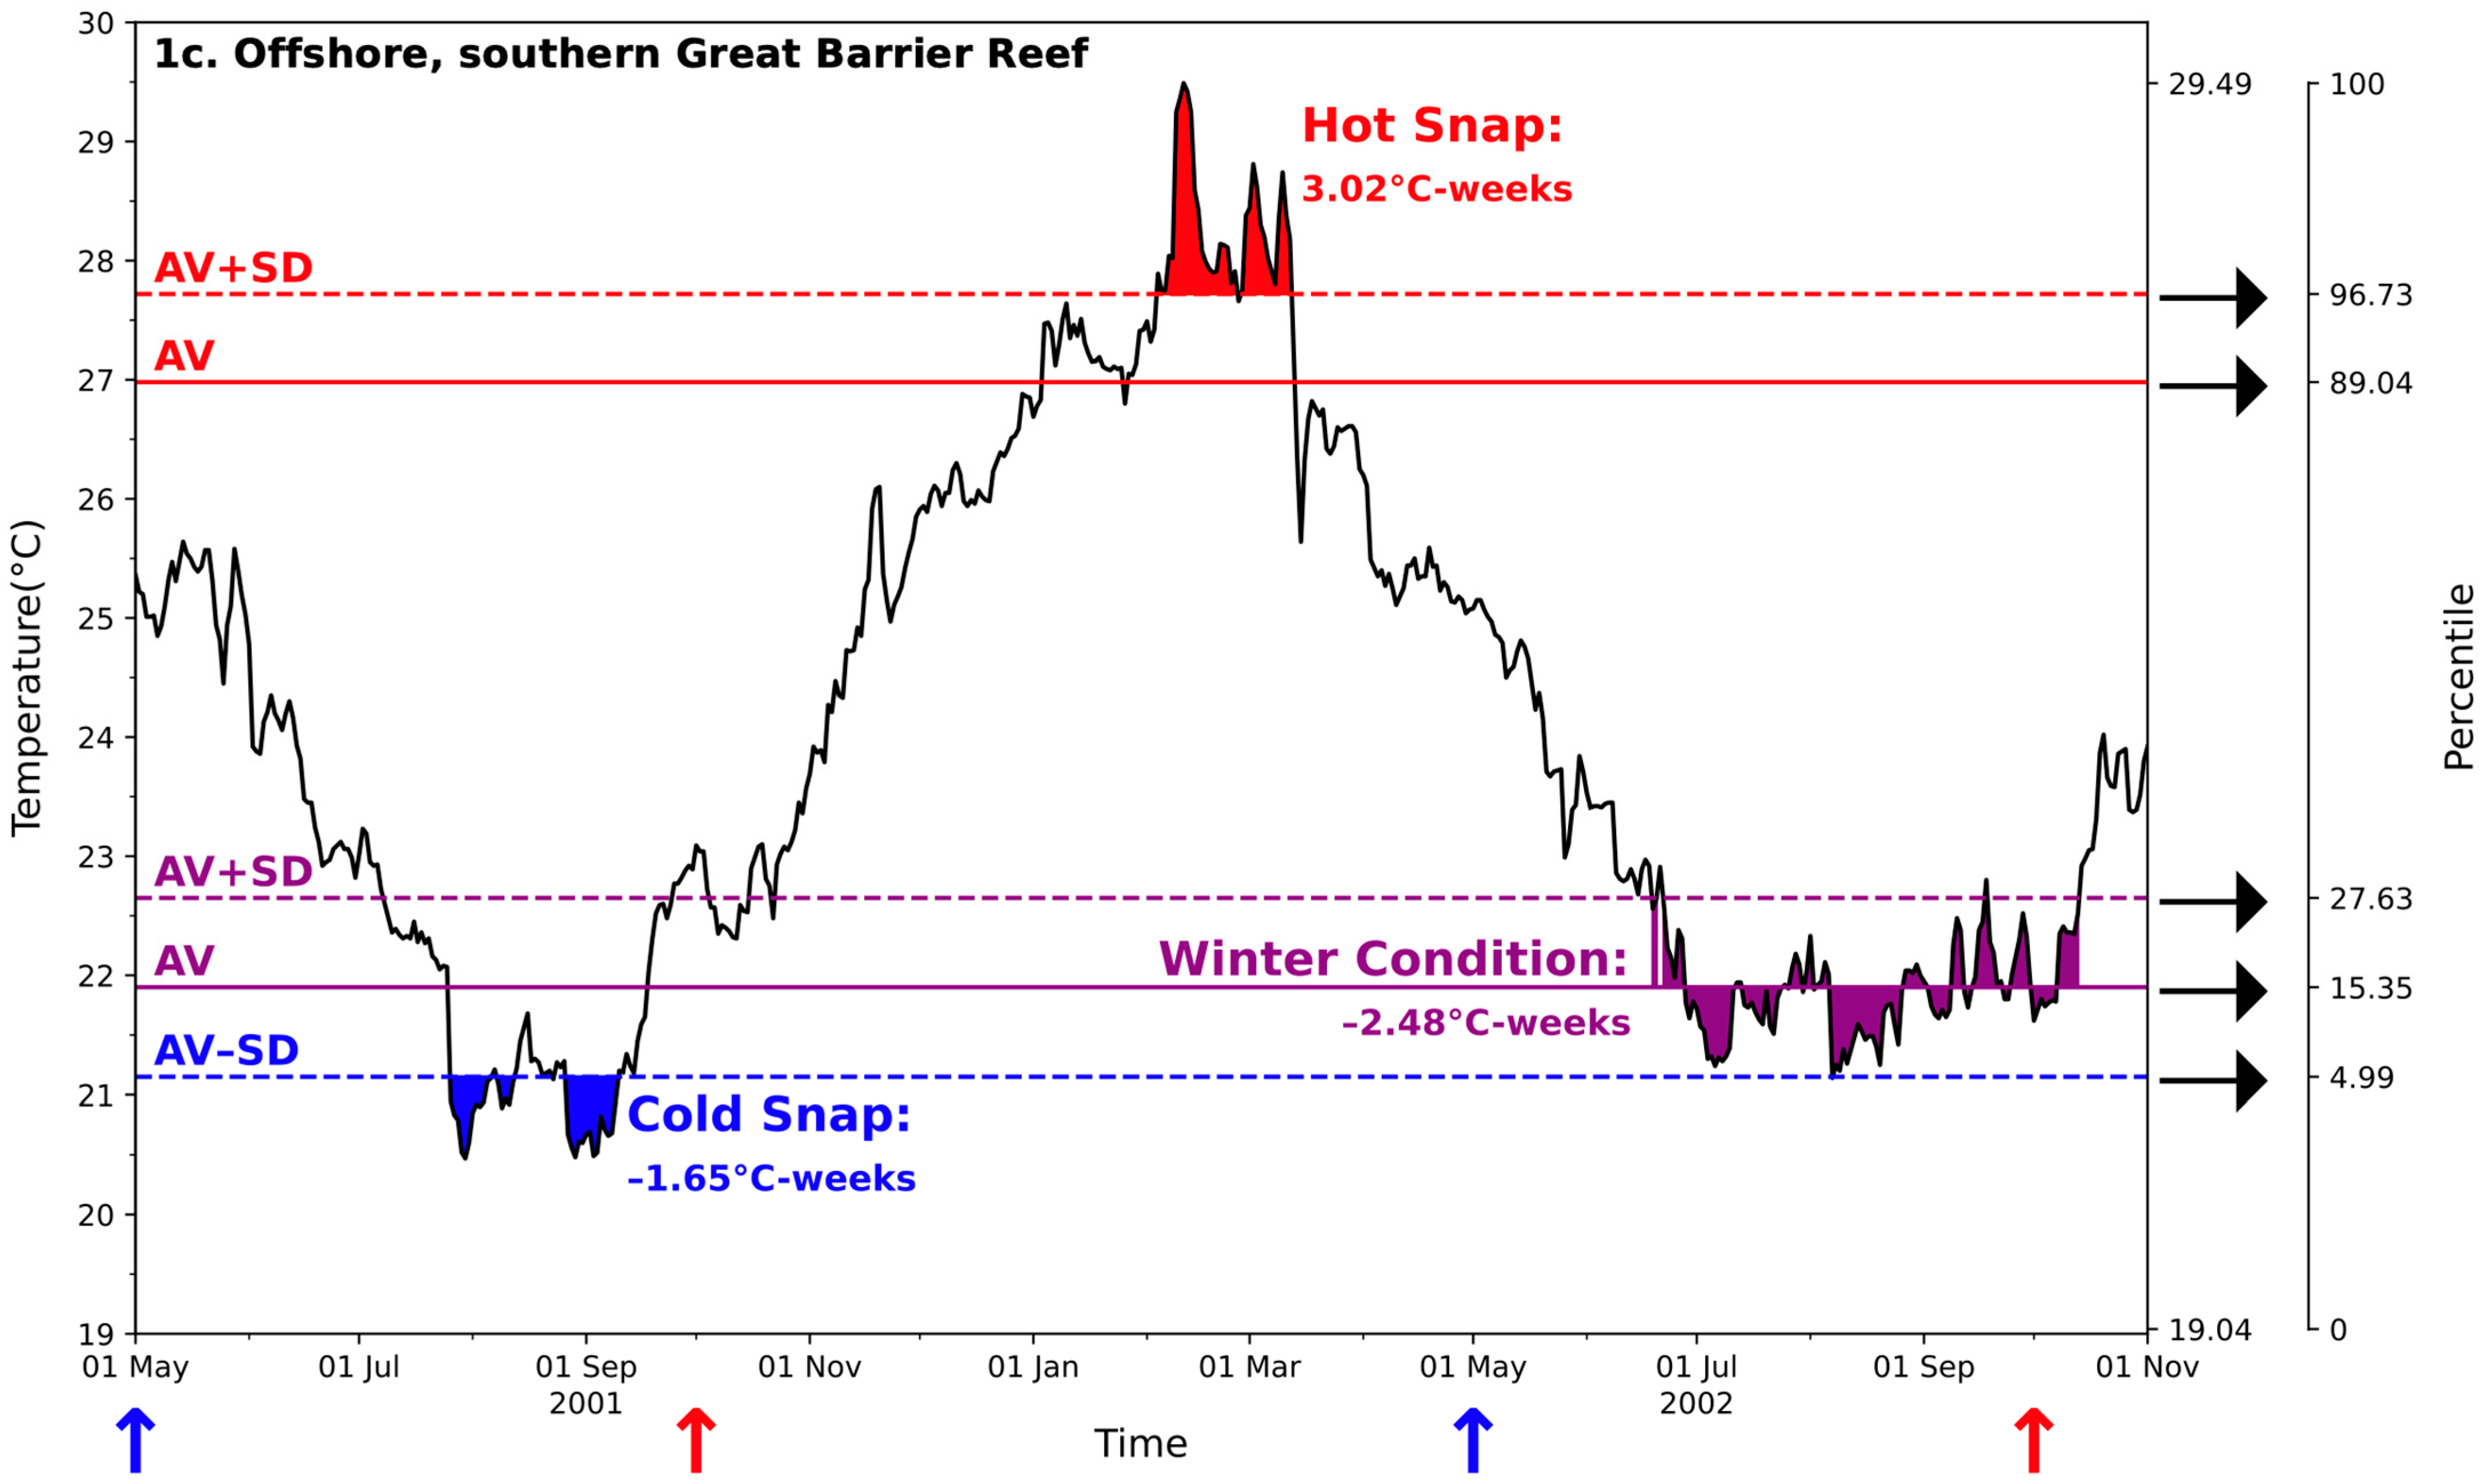
  • Calculating rolling averages: A 91-day (i.e., 3-month) rolling average SST time-series was generated with each value assigned to the centre of the 91-day window. This smoothing technique was used to identify the broad shape of cold and hot periods in SST and to filter high-frequency variability. As there were no data for late-1984 in CoralTemp (to contribute to the initial 45 days of the rolling average calculation in January and February 1985), for the purpose of calculating the 91-day average in early-1985, the last 45 days of the year 1985 were used as a proxy for the last 45 days of the year 1984.
  • Determining the coldest and hottest months: The number of days was counted for each calendar month during which the smoothed SST was equal to or below the percentile value corresponding to the winter AV during 1985–2005. Similarly, the days during which the smoothed SST was equal to or exceeded the percentile threshold corresponding to the summer AV were counted for 1985–2005. The month with the greatest counts (i.e., highest occurrence frequency) for each was designated as the coldest and hottest month, respectively. The start months of the three-month coldest and hottest periods were set to be one month prior to the designated coldest and hottest months, respectively.
  • Setting the reset time: The definition for when accumulations are reset to zero each year was chosen in the same way as the existing seasonal method: three months prior to the start of the three-month hottest period for the Hot Snap metric; and two months prior to the start of the coldest period for the Cold Snap and Winter Condition metrics.
Metrics derived from the percentile-based thresholds and reset months were applied to seasonal and non-seasonal coral reef regions in the tropical Pacific Ocean and compared with those derived using the existing seasonally-based methodology.

2.3. Comparison of the Percentile-Based Metrics with Coral Disease Data in the Howland and Baker Islands and Guam

The performance of the new percentile-based metrics for predicting disease outbreaks in non-seasonal and weakly-seasonal coral reef regions was also evaluated through direct comparison with disease observations. The three percentile-based metrics were compared with WS disease data from Howland and Baker Islands (non-seasonal) and Guam (weakly-seasonal) regions. WS is the most prevalent coral disease worldwide [24] and five previous studies specifically compared WS prevalence with thermal stress metrics (including the seasonally-based metrics described here) [5,7,8,10,12].

2.3.1. Howland Island and Baker Island

Two remote islands, Howland Island and Baker Island, have been infrequently surveyed within the NOAA National Coral Reef Monitoring Program (NCRMP) [25]. The remoteness of the U.S. Pacific Remote Island Areas (Johnston, Wake and Palmyra Atolls; Kingman Reef; Howland, Baker and Jarvis Islands) limits the capacity for disease observation, in terms of both access to the locations and timing visits to coincide with outbreaks. A stratified random sampling design was conducted along a 10 m × 1 m belt transect (10 m2) at each site. In summary, data on colony density (i.e., the number of colonies per square metre) and disease prevalence (i.e., the percentage of the total number of colonies with at least one lesion among those surveyed) were collected at randomly selected reef sites (in terms of depth, longitude and latitude) in February 2015 and June 2018. A total of 55 sites were surveyed (21 and 15 sites in Howland Island and Baker Island in February 2015, respectively; 9 and 10 sites in Howland Island and Baker Island in June 2015, respectively).
The 55 individual surveys were aggregated into four data points—two times (February 2015 and June 2018) for each of Howland Island and Baker Island—for comparison with satellite metrics. Firstly, the 55 surveys were sorted by depth category (Deep, Mid, Shallow) for each island (Howland and Baker), as well as by observation year (2015 and 2018). Colony density and disease density within each depth category were combined for each island and observation year, resulting in 12 data points for each variable. Total acute (i.e., white syndrome and tissue loss syndrome) disease prevalence for each of these was calculated by dividing the cumulative disease density by the cumulative colony density. Finally, the mean acute disease prevalence for each island and observation year was computed by averaging the disease prevalence values across the three depth categories. These data enable the comparison between locations for each observation year, as well as any changes at each location during the three-year period from 2015 to 2018.
Mean acute (i.e., white syndrome and tissue loss syndrome) disease prevalence was compared with the new percentile-based metrics. The new percentile-based Hot Snap, Cold Snap and Winter Condition metrics were computed for a pixel adjacent to each island for the period 2012–2018. Noting the three-year period between surveys at each location, the three metrics were calculated from 2012 to provide a comparable examination (i.e., a three-year period) with the first survey from 2015 and between the two survey times.

2.3.2. Guam

Field survey data from six sites situated on shallow (1–3 m) coral reef flats along the northwestern coast of Guam (Haputo, Tanguisson, Tumon, West Agana, Piti and Luminao) were analysed, five of which (all except Haputo) had been strategically selected to examine a spectrum of water quality and anthropogenic stress along the western coastline of Guam [10]. In summary, at each of the six sites, three belt transects measuring 20 m × 1 m were established within 500 m of the shoreline, at which point information about the coral communities was recorded. At each of the transects, colony-scale coral health data were surveyed (near-)quarterly from 2009 to 2018 (subject to weather conditions). The collected data included various benthic descriptors (e.g., colony counts) and the impact on coral colonies (e.g., disease counts) for each site, date and transect. Disease data included black band, bleaching, bleaching mortality, brown band, endolithic fungal infection, grey death and white syndrome [10].
The initial dataset consisted of the observations of 99,081 individual colonies across the six sites and for all time points. For each date, the WS disease prevalence was calculated for each transect (at each site) as the ratio of the number of WS diseased colonies divided by the total number of colonies. The mean WS disease prevalence was computed for each date and site by averaging the values across the three transects. This resulted in 161 data points.
The mean prevalence of white syndrome was compared with the three percentile-based metrics. The Hot Snap, Cold Snap and Winter Condition between 2006 and 2018 were computed using SST data from the pixel closest to each site. Metrics were calculated from 2006, three years before the first survey in 2009, to allow for the consideration of the influence of prior metric values on disease prevalence.

3. Results

3.1. Development of Percentile-Based Thresholds in the Great Barrier Reef

Percentiles corresponding to the existing AV- and SD-based thresholds over a baseline climatology period (1985–2005) were highly consistent across reef-containing pixels in the GBR (Figure 3a). The median percentile values that corresponded to the summer AV+SD, summer AV, winter AV+SD, winter AV, and winter AV–SD were 97.16%, 88.66%, 27.52%, 16.10% and 5.05%, respectively (cf. percentile values for the single pixel shown in Figure 2). The interquartile range of the percentile distribution for the five thresholds spanned 0.47 to 3.35%. Due to the high degree of consistency, the median percentiles were selected to define each of the new percentile-based thresholds.
Differences between the new percentile-based and existing AV- and SD-based thresholds (Figure 3b and Figure S1a,c) and the resultant metrics (Figure 3c and Figure S1b,d) are negligible for most of the GBR-containing pixels. The median differences (percentile—AV±SD) for the Hot Snap and Cold Snap thresholds were 0.00 °C, and for the Winter Condition threshold this was 0.01 °C. These led to correspondingly small differences in the median change to analysed metric values as follows: 0.00 °C-weeks for the 2001/2002 Hot Snap (R2 = 0.903; two-tailed paired t-test) and 2000/2001 Cold Snap (R2 = 0.862); −0.17 °C-weeks for the 2001/2002 Winter Condition (R2 = 0.811). For these events, 85% of the Hot Snap and 84% of the Cold Snap differences were in the range −0.45 to 0.45 °C-weeks, representing ±7.5% of the 6 °C-weeks range of values reported by Heron et al., 2010 [5]. For Winter Condition in that year, the differences were within −1.05 to 1.05 °C-weeks for 88% of reef pixels, which is ±3.3% of the previously reported range (32 °C-weeks [5]; see also Section 4.1).
Even though most of the reef pixels on the GBR showed little differences in the three thresholds and corresponding metrics, there were some areas with larger differences (dark red and dark blue pixels in Figure 3b,c and Figure S1 panels). The reasons for the differences between percentile-based thresholds and AV- and SD-based thresholds were examined by considering the characteristics of the SST distributions within the 21-year period (1985–2005; see Section 4.1 and Figure S2).

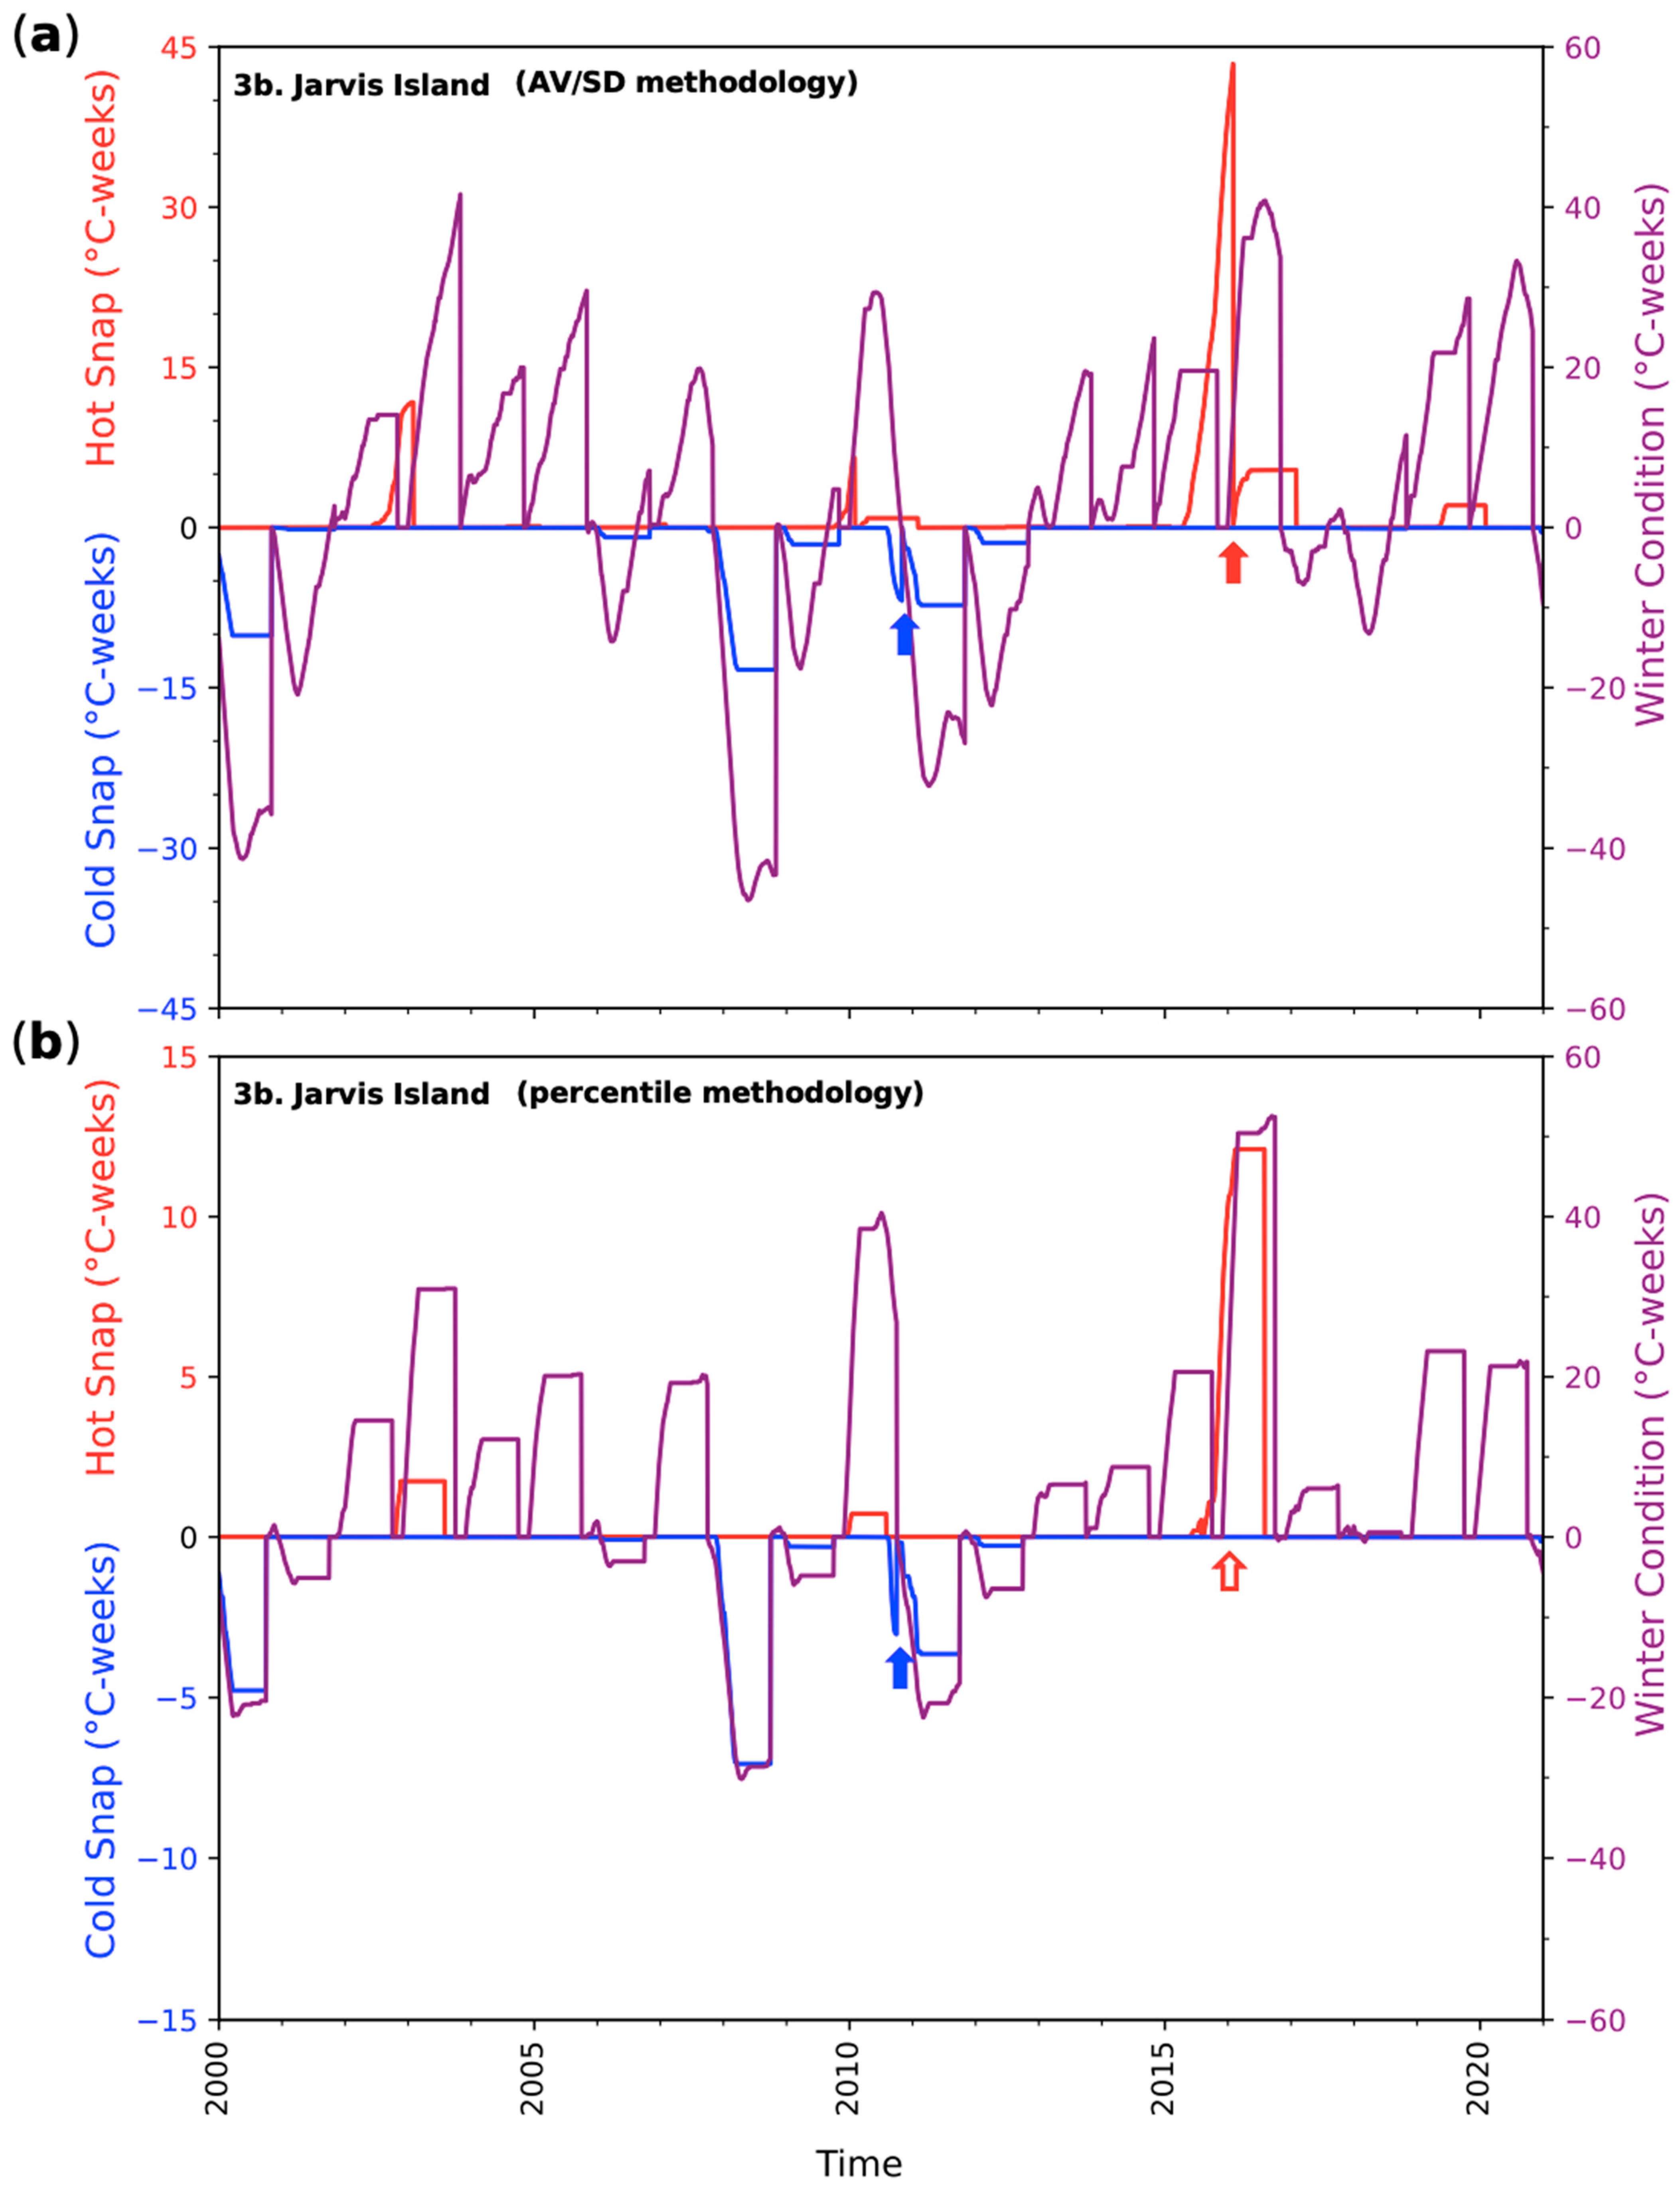
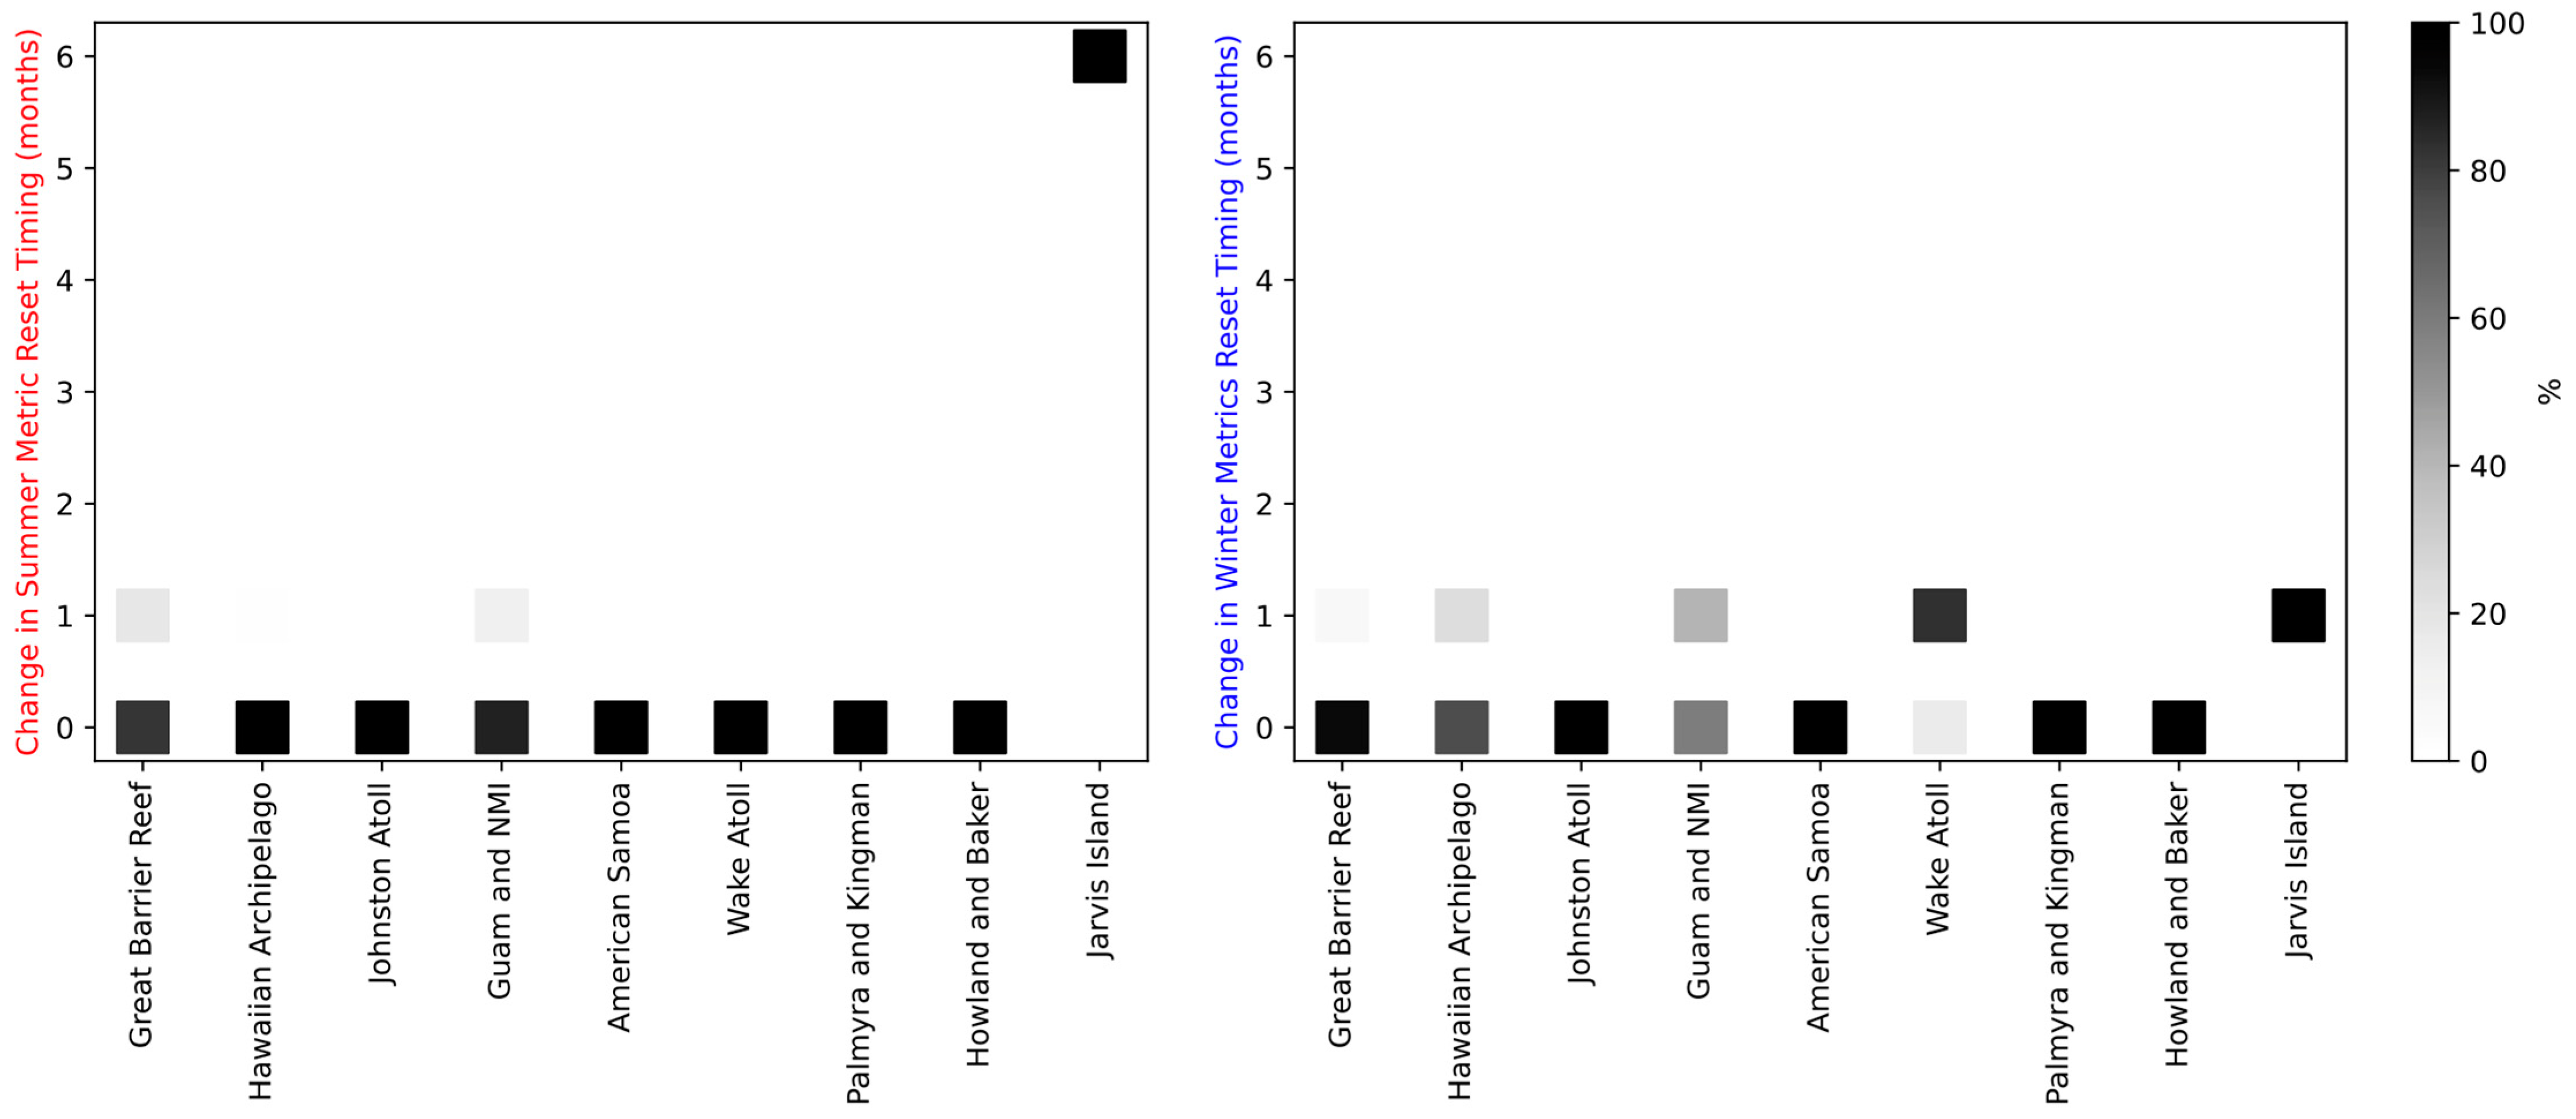
3.2. Application of the Percentile-Based Methodology to Seasonal and Non-Seasonal Regions

Six out of the twelve study sites show seasonal (i.e., intra-annual) temperature variability, with a clear winter trough and summer crest each year; these sites are the GBR (Figure 4.1a), NMI, Wake Atoll, the Hawaiian archipelago, Johnston Atoll and American Samoa (Figure S3). In contrast, five non-seasonal locations are located within 10° latitude of the equator and predominated by interannual variability (greater than the annual variation); these sites are Howland Island (Figure 4.3a), Jarvis Island (Figure 4.3b), Baker Island, Palmyra Atoll and Kingman Reef (Figure S3). The last FORE-C location, Guam (Figure 4.2), is characterised as a weakly-seasonal region, with less distinction between inter- and intra-annual variation. Exemplar pixels from the four focal regions illustrate characteristically seasonal, weakly-seasonal and non-seasonal variations (Figure 4; see Supplementary Materials Figure S3 for the other five seasonal sites and the three non-seasonal sites).
Changes to thresholds from the AV- and SD-based (pale red, pale purple and light blue lines in Figure 4 and Figure S3) to percentile-based (red, purple and blue lines) methodology were relatively small at the seven seasonal locations but substantial at the five non-seasonal locations. The 97th percentile temperatures were higher than the summer AV+SD values at the non-seasonal sites, with the biggest shift observed at Jarvis Island (Figure 4.3b). Like the changes in the summer metric threshold, the changes in winter metric thresholds were most pronounced at the five non-seasonal locations (Figure 4 and Figure S3).
Changes to the thresholds led to changes in the metric values. In the five non-seasonal sites, the positive shifts in the Hot Snap thresholds from the AV- and SD-based to percentile-based methodologies (Figure 4 and Figure S3) led to lower magnitude accumulations of Hot Snap (smaller positive values). Similarly, negative shifts in thresholds for Cold Snap and Winter Condition led to lower magnitude Cold Snaps (smaller negative values) and higher Winter Condition values (more positive or less negative) when using the new percentile-based method. For example, at Jarvis Island in 2016, the maximum percentile-based Hot Snap was approximately one-quarter of the AV- and SD-based value, while the positive Winter Condition was higher (Figure 5; see Figure S5 for the other four sites).
The new percentile-based reset months were generally consistent with those from the existing AV- and SD-based method in the studied regions, with the exception of a 6-month difference in the Hot Snap reset month for Jarvis Island (Figure 6). Unlike the GBR, for which there are distinct hot and cold periods (Figure S4.1a), Jarvis Island experienced hot conditions across all 12 months, ranging 30–90 hot days per month (red bars in Figure S4.3b). In contrast, the highest frequency of cold conditions occurred in December, January and February (blue bars in Figure S4.3b). The change in reset month between the percentile-based and AV- and SD-based approaches for Cold Snap and Winter Condition was either 0 or 1 month for all pixels in all regions (Figure 6).
At four of the non-seasonal sites (all except Kingman Reef), the Cold Snap in 2010 was reset after it had begun accumulating when using both the new and existing methodologies (blue arrows in Figure 5 and Figure S5). At Kingman Reef in that year, the Cold Snap had accumulated and was reset using the AV/SD methodology, whereas for the percentile-based method, the accumulation began one month later, so no accumulation of the metric had occurred before the reset.
Similar metric resets occurred after the accumulation of the Hot Snap had begun when using the existing AV- and SD-based methodology in 2016 at Jarvis Island (red arrow in Figure 5a with the reset month of February) and in 2015 at Howland Island and Baker Island (red arrows in Figure S5). In each case, the issue of resetting a Hot Snap during an accumulation was improved or no longer apparent when using the new percentile-based methodology. At Jarvis Island, the improvement was due to the change in reset month (unfilled red arrow in Figure 5b with the reset month of August), while at Howland Island and Baker Island, higher percentile-based thresholds resulted in only a small accumulation of Hot Snap before the revised reset month (red arrows in Figure S5).

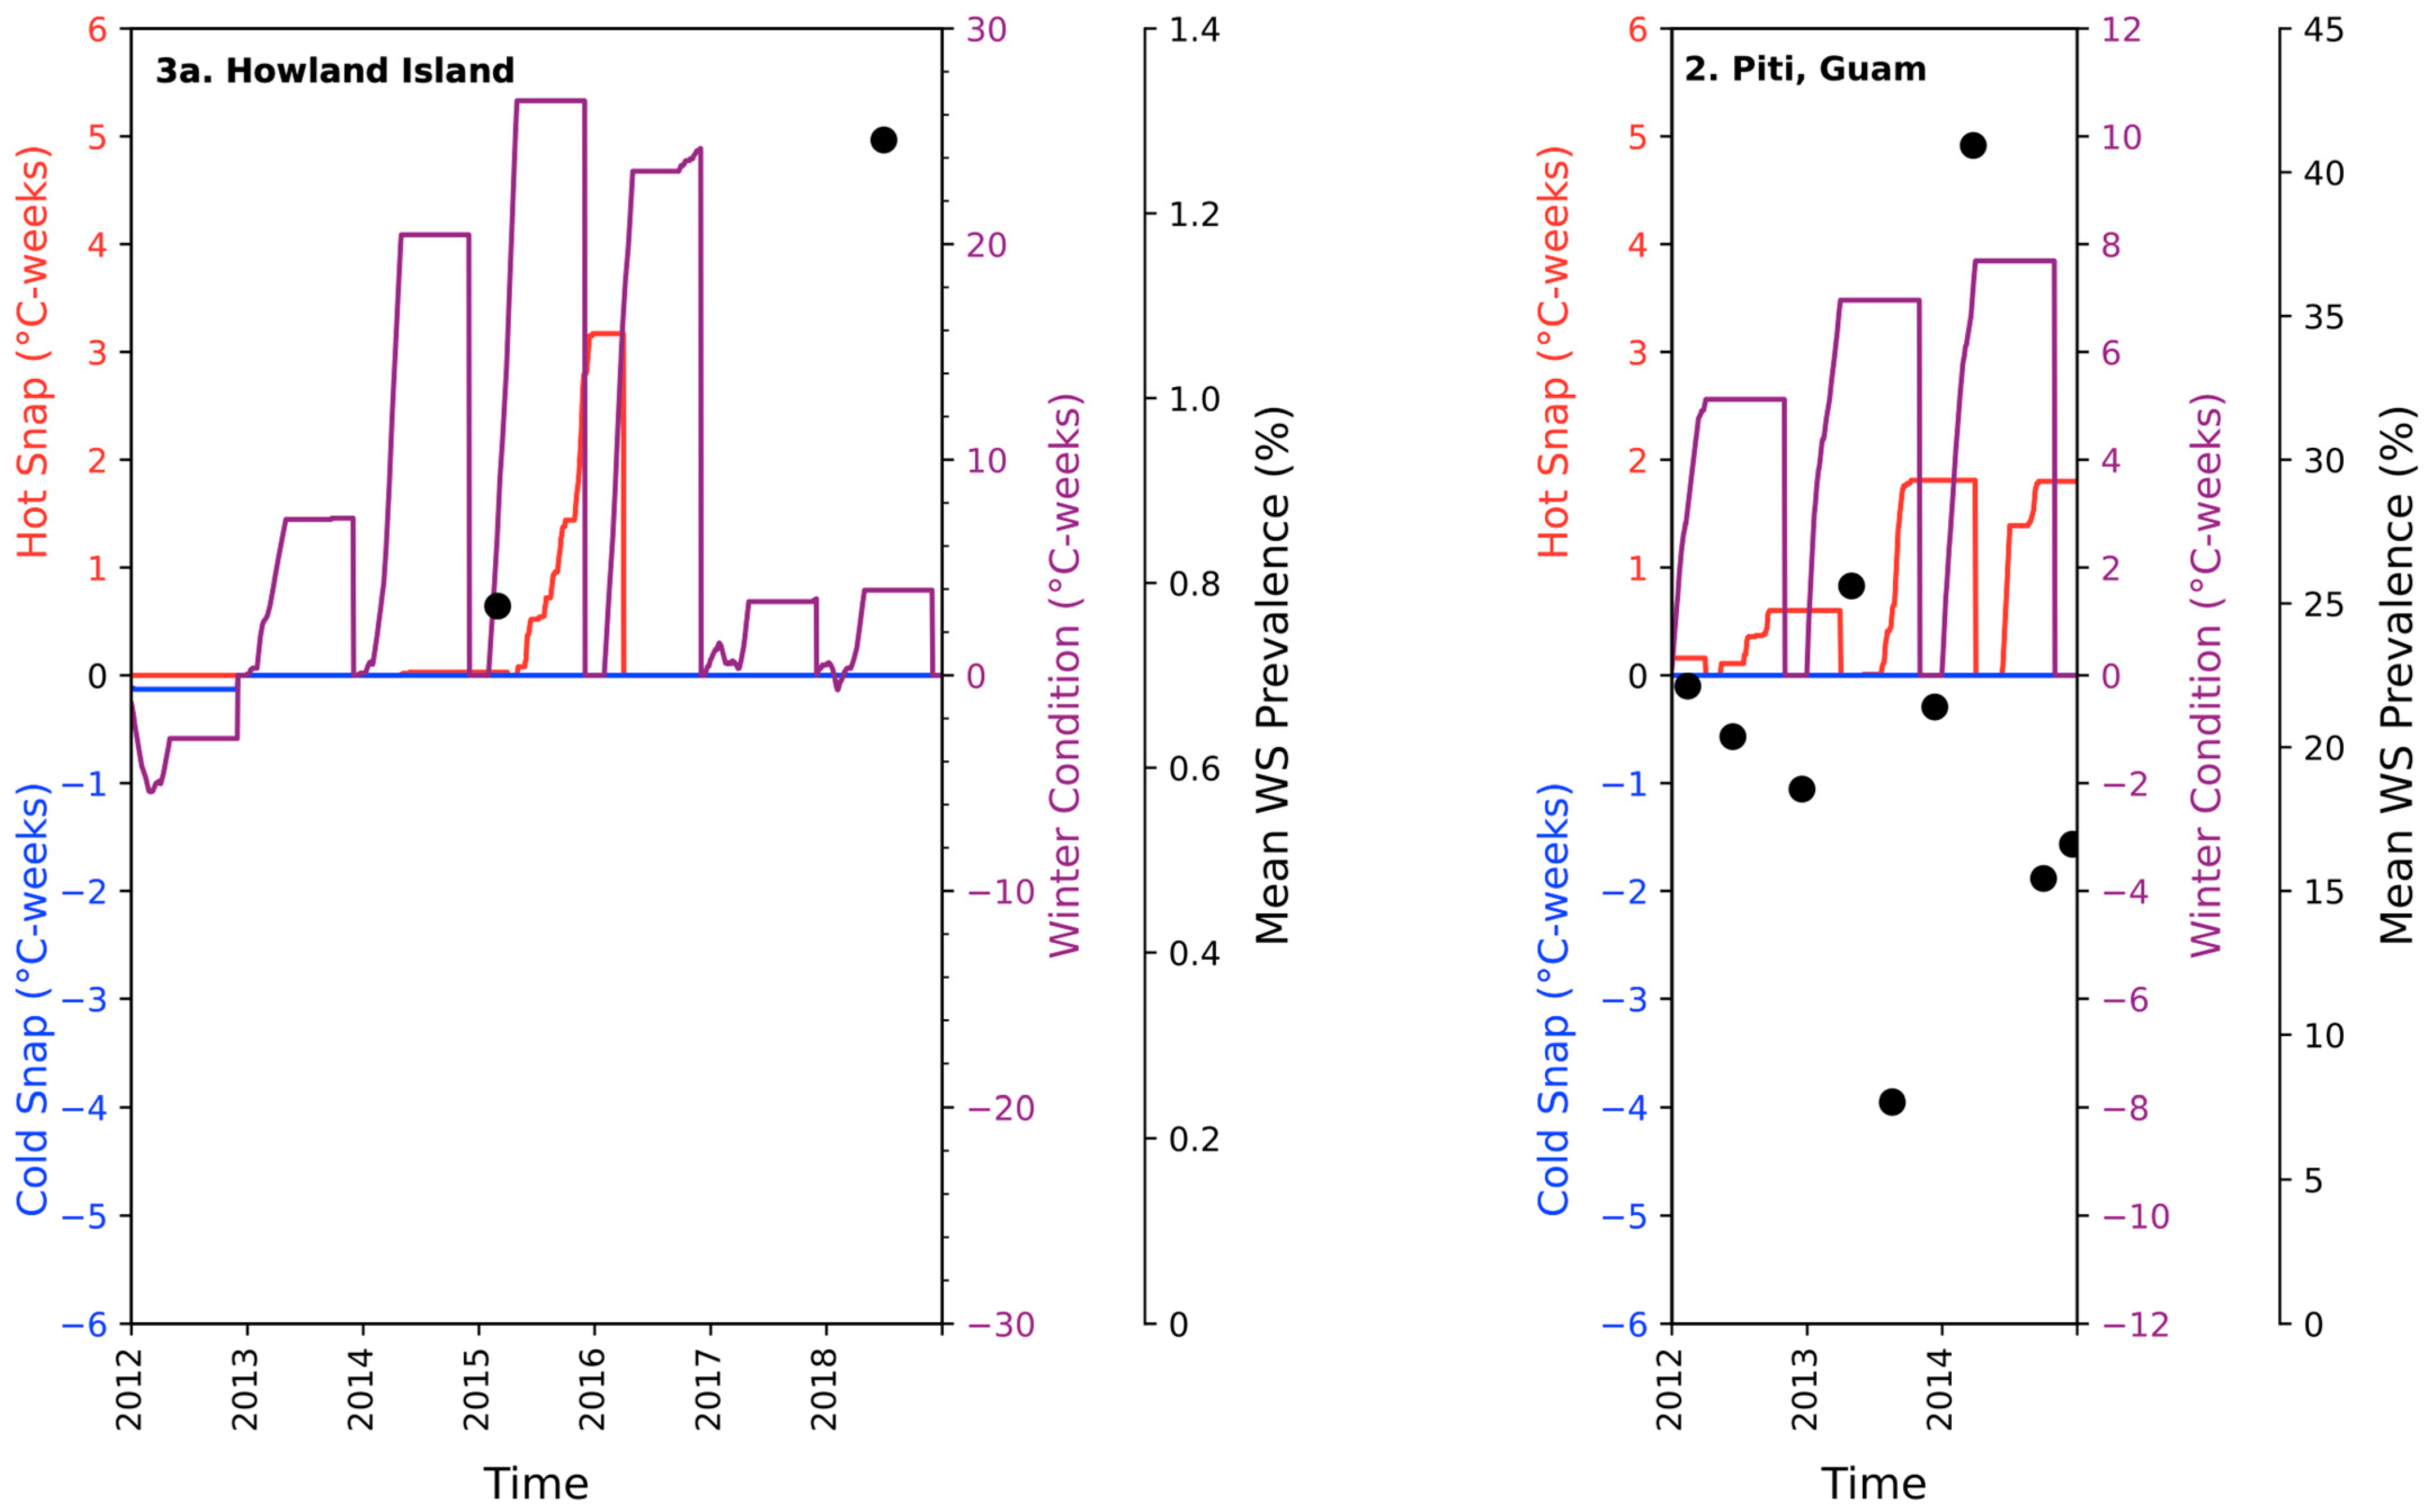
3.3. Comparison of the Percentile-Based Metrics with Coral Disease Data in Howland and Baker Islands and Guam

WS disease prevalence was low at both surveyed times in both Howland and Baker Islands, with a small increase noted from February 2015 to June 2018 (Figure 7-left, site 3a in Figure 1). A prolonged period of Hot Snap accumulation, reaching 3.17 °C-weeks in Howland Island (Figure 7-left) and 4.63 °C-weeks in Baker Island, occurred in 2015 after the surveys. These represent the highest Hot Snap values recorded at these locations between 2000 and 2020. In addition, Winter Condition values changed from over 20 °C-weeks in 2014–2016 to around 3–5 °C-weeks in 2017 (3.49 °C-weeks in Howland Island and 4.79 °C-weeks in Baker Island). No Cold Snaps were recorded after 2012.
In Guam, there were no clear, discernible patterns or relationships between WS prevalence and the new percentile-based metrics. The prevalence of WS showed local variation between sites, despite similar metrics across these locations, with the largest increase in prevalence for each site occurring in different periods. In Piti (Figure 7-right, site 2 in Figure 1), WS prevalence showed a rapid increase from 7.7% in August 2013 to 40.9% in March 2014, coinciding with a 2013 Hot Snap accumulation of 1.81 °C-weeks, and that was preceded and followed by Winter Condition accumulations of around 7 °C-weeks. Increases in prevalence associated with Hot Snap and Winter Condition accumulation were also found in West Agana in 2011 and Luminao in 2014.
The limited size of the disease observation datasets prohibits further analysis at this time; however, such an additional investigation is essential for more extensively testing the suitability of the percentile-based thresholds and metrics as predictors for coral disease outbreak.

4. Discussion

4.1. Comparing Methodologies for Thresholds and Metrics

Using the new percentile-based metrics did not cause significant changes to predictions in the risk of coral disease outbreaks at the majority of GBR pixels. The metric difference ranges (−0.45 to 0.45 °C-weeks in Hot Snap and Cold Snap; and −1.05 to 1.05 °C-weeks in Winter Condition) were relatively small compared with the range of the metrics values across multiple years, reported by Heron et al. (2010) [5]—±0.45 °C-weeks (±7.5% of the 6 °C-weeks ranges; Figure 3c) for Hot Snap and Cold Snap (Figure S1b); and ±1.05 °C-weeks (±3.3% of the 32 °C-weeks range) for Winter Condition (Figure S1d). Moreover, these three spatial variation maps are examples from years in which there were strong Hot Snaps (2001–2002), Cold Snaps (2000–2001) and Winter Conditions (2001–2002). Metric-difference maps for years without strong Hot Snaps, Cold Snaps and Winter Conditions show fewer differences (i.e., more green pixels with differences close to zero).
The largest observed differences between the existing AV- and SD-based and the new percentile-based thresholds (Figure 3b and Figure S1a,c) can be attributed to distinctive sea surface temperature distributions over the 21-year period analysed (1985–2005; Figure S2), which are related to oceanic features. For the Hot Snap threshold, strong positive differences (dark red in Figure 3b) were apparent in the southern GBR coastline and Capricorn Group, where SST distributions may be influenced by atypical tidal variations (e.g., in Broad Sound [26]) or oceanographic features (e.g., the Capricorn Eddy [27]). For the Cold Snap threshold, the differences were less extreme compared with the Hot Snap; positive differences occurred in the southern GBR coastline (Figure S1a), whilst negative differences occurred in offshore reefs near 18°S (which may be influenced by the bifurcation of the South Equatorial Current; see [28] and the references therein).
Changed thresholds led to altered SST anomalies that, when accumulated, potentially become large differences in the corresponding metrics, which can influence the prediction of outbreak risk. For example, at an inshore location in the southern GBR, the existing Hot Snap threshold (summer AV+SD) was 28.19 °C, while the percentile-based threshold was 28.36 °C (Figure S2.1b). For SST values leading to observed disease in 2002, this increased threshold led to a decrease in the Hot Snap metric from 2.25 °C-weeks (AV/SD-based) to 1.56 °C-weeks (percentile-based). Similarly, the percentile-based thresholds corresponding to the Cold Snap and Winter Condition metrics were higher by 0.21 °C and 0.19 °C, respectively, compared with the results derived using the winter AV/SD methodology (Figure S2.1b). The calculated Cold Snap metrics were −0.23 °C-weeks (percentile) and −0.11 °C-weeks (AV/SD), while the Winter Condition values were 1.97 °C-weeks and 3.69 °C-weeks, respectively. Using the predictive decision tree [5], the percentile-based metrics produced a lower risk of coral disease outbreak than the AV- and SD-based methodology, based on the lower Hot Snap value of 1.56 °C-weeks.
The new percentile-based thresholds (three vertical black lines indicative of the 97th, 16th and 5th percentile thresholds) were determined from the entire SST distribution across the 21 years (grey area in Figure S2). In contrast, the existing AV- and SD-based thresholds were derived from the summertime- or wintertime-only SST values across the 21 years (i.e., only SST values within the three consecutive summer or winter months; red or blue, respectively, in Figure S2). At site ‘a’ in the far northern GBR (Figure 1.1a), all three thresholds were unchanged between the percentile-based and AV- and SD-based methodologies (Figure S2; green pixels in Figure 3b and Figure S1a,c). At site ‘b’, in the southern GBR (Figure 1.1b), all three thresholds increased significantly (Figure S2; red pixels in Figure 3b and Figure S1a,c). These increases in the thresholds led to reduced Hot Snap and Winter Condition values, and a more negative Cold Snap was observed when using the percentile-based thresholds (blue pixels in Figure 3c and Figure S1b,d). The range of observed SST values increased from less than 10 °C at site ‘a’ to around 14 °C at site ‘b’; and the distinction of the summer and winter peaks in the distribution diminished (Figure S2). These exemplar sites demonstrate how differences in the SST distributions can influence threshold (and therefore metric) calculations.

4.2. Application of the Percentile-Based Methodology to Seasonal and Non-Seasonal Regions

4.2.1. The Effect of Percentile-Based Thresholds and Reset Months on the Metrics

For non-seasonal sites, where shifts in thresholds occurred, expected changes in metric values were apparent. The 97th percentile threshold for Jarvis Island was 29.53 °C, considerably warmer than the summer AV+SD value of 28.64 °C (Figure 4.3b), which substantially reduced the accumulated Hot Snap (Figure 5). Conversely, cooler percentile-based thresholds (Figure 4.3a,b and Figure S3) reduced the (negative) magnitude of Cold Snaps and increased the value of the Winter Condition metric (Figure 5 and Figure S5).
The three-month summer [winter] identified using the existing AV- and SD-based methodology overlapped with the hot [cold] period defined using the new percentile-based methodology for all locations except Jarvis Island (Figure 6). This suggests that the prior approach was generally adequate to characterise the threshold for and timing of the warmest [coolest] conditions in seasonal locations. The general consistency of the new methodology with that of the existing process for both seasonal and non-seasonal locations supports the use of the new method. In terms of the metric accumulations, 0- or 1-month differences in the Winter Condition reset months between the two methodologies, as determined for all pixels in all regions (Figure 6), had only a small effect on the Winter Condition values. The inclusion of winter-like temperatures means that a small variation in the Winter Condition metric values could result from small changes to the reset timings, as metric accumulations typically start two or three months after the reset months.
Noting the infrequent occurrence of a Cold Snap reset after accumulations began at four of the non-seasonal sites (during 2010 in Figure 5 and Figure S5), an option could be to revise the reset month from two months prior to the identified cold period to three months prior. This would align with the timing in the Hot Snap methodology. However, additional investigations are warranted.
Hot Snap accumulation using the new percentile-based threshold together with the new reset timing method appears to perform as well or better for non-seasonal locations (Figure 5 and Figure S5), with no detriment for seasonal locations. This improvement is perhaps most apparent for Jarvis Island (Figure 5), for which a 6-month change in the definition of the hot period between the two methodologies occurred (Figure 6 and Figure S4). However, the new percentile-based method resulted in the overlap of the defined hot (November–December–January) and cold periods (December–January–February; Figure S4), illustrating the predominance of interannual variability but also suggesting the need for further consideration, here, and in other similar non-seasonal locations.

4.2.2. New Percentile-Based Metrics and Literature Reports on Coral Disease

The high degree of consistency between the methodologies in seasonal regions and the performance in non-seasonal regions indicates the potential of the new percentile-based metrics to effectively assess coral disease outbreak prediction in both regions.
This is further evidenced by the new percentile-based metrics exhibiting similar relationships to the existing AV- and SD-based metrics with literature reports on coral disease in the Hawaiian archipelago [8]. These observations include both winter and summer outbreaks of Porites Tissue Loss Syndrome (TLS), Montipora WS and Porites Growth Anomalies (GA). Outbreaks of Porites TLS and Montipora WS at French Frigate Shoals during the winters of 2012, 2013 and 2014 were compared with the Hot Snap of the previous summer and the Cold Snap and Winter Condition of the winter prior to that (the previous year) [8]. The new percentile-based Hot Snaps corresponding to those outbreak events were 0.15, 0 and 0.61 °C-weeks, respectively, which align with the finding that a higher prevalence of the two diseases is associated with a Hot Snap below 1.3 °C-weeks [8]. In addition, the percentile-based Winter Conditions of 7.73, 6.58 and 8.29 °C-weeks satisfy the conditions (>4.4 °C-weeks for TLS; >0.85 °C-weeks for WS) which were associated with a higher prevalence of TLS and WS [8]. In the summers of 2010 and 2011 at Kāneʻohe Bay, there were disease outbreaks of Porites GA [8]. The percentile-based Hot Snaps of 0 °C-weeks in those summers coincided with Porites GA outbreaks, consistent with the reported pattern of a negative correlation between Hot Snap and the disease prevalence of Porites GA [8,29]. Moreover, a higher prevalence of Porites GA in Hawaiʻi has been related to the Winter Condition of over 6.5 °C-weeks or below 4 °C-weeks [8] (p. 9). The percentile-based Winter Conditions of 1.14 and 7.32 °C-weeks in 2010 and 2011, respectively, are in alignment with the observed disease levels.
The new percentile-based methodology also showed a degree of correlation with the reported descriptions of coral disease in non-seasonal regions. The prevalence of WS was generally low at Johnston and Palmyra Atolls; Kingman Reef; and Howland, Baker and Jarvis Islands in 2006 and at Wake Atoll in 2007. The highest WS values occurred at Johnston Atoll (0.77 ± 0.23%) and Wake Atoll (0.16 ± 0.05%) [30], for which the corresponding percentile-based metric values (mild Winter Condition of 2.65 and 2.86 °C-weeks; Cold Snap of −0.04 and 0 °C-weeks; and Hot Snap of 0.27 and 0.05 °C-weeks, respectively) placed Johnston Atoll and Wake Atoll in the “Low Risk” category for disease outbreak [5]. The other five sites showed strong warm Winter Condition values (9.72–20.64 °C-weeks) at this time, consistent with the mean prevalence of less than 0.1%.
At Palmyra Atoll, there was an observed increase in the prevalence of two diseases from 2008. A marginal 0.79% increase in the overall prevalence of Porites GA from 2008 (0.39%) to 2009 (1.18%) [31] followed a cold winter that produced a percentile-based Cold Snap of −1.20 °C-weeks and a strongly negative Winter Condition (−14.05 °C-weeks) in 2008—but with no Hot Snap following these (Figure S5); and therefore no disease outbreak risk [5]. In contrast, Acropora WS prevalence increased from 0% in 2009 to 22.9% in 2010, coinciding with changes in the Cold Snap from −1.20 °C-weeks to 0 °C-weeks (in 2009) and in the Winter Condition from −14.05 °C-weeks to 0.26 °C-weeks (in 2009), with the 2009 Hot Snap reaching 0.59 °C-weeks (Figure S5). These conditions resulted in the “Low Risk” of disease outbreak observed in 2010 [5].
The relationships between the new percentile-based metrics and coral disease reports suggest that the existing decision tree [5] may be suitable for predicting disease outbreak risk in both seasonal and non-seasonal regions. As literature reports on coral disease in the NMI and American Samoa were limited, this could not be tested further for these regions.

4.3. Comparison of the Percentile-Based Metrics with Coral Disease Data in Howland and Baker Islands and Guam

In Howland and Baker Islands, the Hot Snap of 2015 (3.17 °C-weeks in Howland Island in Figure 7-left and 4.63 °C-weeks in Baker Island in Figure S5) may have contributed to the observed minor increase in disease prevalence from 2015 to 2018, together with the mild Winter Conditions in 2017 (3–5 °C-weeks). The dataset of only four data points limited our ability to identify a robust correlation between the new percentile-based metrics and disease prevalence. To comprehensively assess the potential of the new percentile-based metrics for predicting coral disease outbreak risk, a larger dataset, akin to the sample sizes utilised in the previous studies [5,8,10], is required. Additionally, it is essential to consider other contributing factors, such as colony density, diversity and other seasonal environmental conditions (e.g., rainfall and resultant run-off), that may play a significant role in coral disease prevalence. Given the remote location of Howland and Baker Islands, such data may prove difficult to obtain. Further comparisons in non-seasonal areas may also improve understanding of the temperature-related factors in weakly-seasonal areas, noting, however, the lack of discernible relationships between disease metrics and observations in Guam.

5. Conclusions

This study has responded to the challenge of developing satellite-derived predictions of coral disease outbreaks in non-seasonal coral reef regions. The existing seasonal AV- and SD-based Hot Snap, Cold Snap and Winter Condition metrics, which have provided predictions of coral disease outbreaks in regions characterised by consistent summer and winter periods, present limitations when applied to regions with weak or non-seasonal climatic variations. In response, a novel approach was developed based on percentile thresholds, rather than seasonal averages, to calculate these metrics independent of seasonality.
The strong consistency of percentile values corresponding to the existing AV- and SD-based thresholds across reef-containing pixels in the GBR laid the foundation for the new percentile-based methodology. The new percentile-based thresholds exhibited good alignment with existing AV- and SD-based thresholds at reef locations characterised by seasonal variations, while providing new insights for non-seasonal locations. Substantial shifts in thresholds at non-seasonal sites resulted in the improvement of metric accumulations when using the new percentile-based approach. The improved Hot Snap at Jarvis Island was also related to the 6-month change in the Hot Snap reset month. Furthermore, relationships with historical records of coral disease in the Hawaiian archipelago (seasonal) for the new percentile-based metrics were similar to those using the existing AV- and SD-based metrics. The comparisons of the new metrics with disease data in non-seasonal regions provided a degree of validation for the new approach; however, these were limited by the dearth of available disease data. Additional direct comparisons with disease data spanning various regions and time periods are essential for establishing robust correlations.
The high degree of consistency between the metric methodologies in seasonal regions, together with the performance of the new metrics in non-seasonal regions, indicates the potential of the new percentile-based metrics for effectively predicting coral disease outbreak risk in both types of regions. It is recommended that any future development of temperature-based metrics for coral disease prediction should consider non-seasonal approaches to enable broad application.

Supplementary Materials

The following supporting information can be downloaded at: https://www.mdpi.com/article/10.3390/rs17020262/s1: Figure S1: Spatial variations in wintertime thresholds; Figure S2: Distributions of daily SST from 1985 to 2005 at two reef pixels; Figure S3: SST time-series (2000–2020) at five seasonal and three non-seasonal exemplar pixels; Figure S4: Distribution of hot and cold periods for two locations; Figure S5: Time-series (2000–2020) at four non-seasonal pixels of (top) the existing AV- and SD-based and (bottom) the new percentile-based Hot Snap (red), Cold Snap (blue) and Winter Condition (purple).

Author Contributions

Conceptualization, M.Y. and S.F.H.; methodology, M.Y. and S.F.H.; software, M.Y.; validation, M.Y. and S.F.H.; formal analysis, M.Y. and S.F.H.; investigation, M.Y. and S.F.H.; resources, S.F.H.; data curation, M.Y. and S.F.H.; writing—original draft preparation, M.Y.; writing—review and editing, S.F.H.; visualisation, M.Y. and S.F.H.; supervision, S.F.H.; project administration, M.Y. and S.F.H. All authors have read and agreed to the published version of the manuscript.

Funding

This research received no external funding; however, we acknowledge the NASA Roses Ecological Forecasting grant NNX17AI21G (S.F.H.), from which the underlying ideas that led to this study were generated, and Australian Research Council grant DP230102986 (S.F.H.).

Data Availability Statement

Sea surface temperature data are available for free on the NOAA Coral Reef Watch website at https://coralreefwatch.noaa.gov/product/5km/index.php (accessed repeatedly during the period 2019–2023). Coral disease data are available via the corresponding author upon request.

Acknowledgments

Coral disease data were sourced from the NOAA National Coral Reef Monitoring Program (with special thanks to Courtney Couch) and from the University of Guam Marine Laboratory (with special thanks to Laurie Raymundo). We are immensely grateful to Jamie M. Caldwell for her constructive comments and thoughtful suggestions. We also extend our thanks to Putu Mustika for her assistance with editing.

Conflicts of Interest

The authors declare no conflicts of interest.

References

  1. Reef Resilience Network. Coral Disease. Available online: https://reefresilience.org/management-strategies/managing-local-threats/managing-coral-disease/#:~:text=Coral%20disease%20outbreaks%20are%20a,soft%20corals%20over%20extensive%20areas (accessed on 22 October 2023).
  2. Harvell, D.; Jordán-Dahlgren, E.; Merkel, S.; Rosenberg, E.; Raymundo, L.; Smith, G.; Weil, E.; Willis, B. Coral Disease, Environmental Drivers, and the Balance between Coral and Microbial Associates. Oceanography 2007, 20, 172–195. [Google Scholar] [CrossRef]
  3. Raymundo, L.J.; Couch, C.S.; Harvell, C.D. Coral Disease Handbook: Guidelines for Assessment, Monitoring & Management; Coral Reef Targeted Research and Capacity Building for Management Program: Brisbane, Australia, 2008. [Google Scholar]
  4. Tracy, A.M.; Pielmeier, M.L.; Yoshioka, R.M.; Heron, S.F.; Drew Harvell, C. Increases and decreases in marine disease reports in an era of global change. Proc. R. Soc. B Biol. Sci. 2019, 286, 20191718. [Google Scholar] [CrossRef] [PubMed]
  5. Heron, S.F.; Willis, B.L.; Skirving, W.J.; Mark Eakin, C.; Page, C.A.; Miller, I.R. Summer Hot Snaps and Winter Conditions: Modelling White Syndrome Outbreaks on Great Barrier Reef Corals. PLoS ONE 2010, 5, e12210. [Google Scholar] [CrossRef] [PubMed]
  6. Aeby, G.S.; Bourne, D.G.; Wilson, B.; Work, T.M. Coral Diversity and the Severity of Disease Outbreaks: A Cross-Regional Comparison of Acropora White Syndrome in a Species-Rich Region (American Samoa) with a Species-Poor Region (Northwestern Hawaiian Islands). J. Mar. Biol. 2011, 2011, 490198. [Google Scholar] [CrossRef]
  7. Bruno, J.F.; Selig, E.R.; Casey, K.S.; Page, C.A.; Willis, B.L.; Harvell, C.D.; Sweatman, H.; Melendy, A.M. Thermal Stress and Coral Cover as Drivers of Coral Disease Outbreaks. PLoS Biol. 2007, 5, 1220–1227. [Google Scholar] [CrossRef] [PubMed]
  8. Caldwell, J.M.; Heron, S.F.; Mark Eakin, C.; Donahue, M.J. Satellite SST-Based Coral Disease Outbreak Predictions for the Hawaiian Archipelago. Remote Sens. 2016, 8, 93. [Google Scholar] [CrossRef] [PubMed]
  9. Ferreira, B.P.; Costa, M.B.S.F.; Coxey, M.S.; Gaspar, A.L.B.; Veleda, D.; Araujo, M. The effects of sea surface temperature anomalies on oceanic coral reef systems in the southwestern tropical Atlantic. Coral Reefs 2013, 32, 441–454. [Google Scholar] [CrossRef]
  10. Greene, A.; Donahue, M.J.; Caldwell, J.M.; Heron, S.F.; Geiger, E.; Raymundo, L.J. Coral Disease Time Series Highlight Size-Dependent Risk and Other Drivers of White Syndrome in a Multi-Species Model. Front. Mar. Sci. 2020, 7, 601469. [Google Scholar] [CrossRef]
  11. Harvell, D.; Altizer, S.; Harrington, L.; Weil, E. Climate change and wildlife diseases: When does the host matter the most? Ecology 2009, 90, 912–920. [Google Scholar] [CrossRef] [PubMed]
  12. Maynard, J.A.; Anthony, K.R.N.; Harvell, C.D.; Burgman, M.A.; Beeden, R.; Sweatman, H.; Heron, S.F.; Lamb, J.B.; Willis, B.L. Predicting outbreaks of a climate-driven coral disease in the Great Barrier Reef. Coral Reefs 2011, 30, 485–495. [Google Scholar] [CrossRef]
  13. Miller, A.W.; Richardson, L.L. Emerging coral diseases: A temperature-driven process? Mar. Ecol. Mar. Ecol. 2015, 36, 278–291. [Google Scholar] [CrossRef]
  14. Randall, C.J.; Van Woesik, R. Contemporary white-band disease in Caribbean corals driven by climate change. Nat. Clim. Chang. 2015, 5, 375–379. [Google Scholar] [CrossRef]
  15. Ruiz-Moreno, D.; Willis, B.L.; Page, A.C.; Weil, E.; Cróquer, A.; Vargas-Angel, B.; Jordan-Garza, A.G.; Jordán-Dahlgren, E.; Raymundo, L.; Harvell, C.D. Global coral disease prevalence associated with sea temperature anomalies and local factors. Dis. Aquat. Org. 2012, 100, 249–261. [Google Scholar] [CrossRef] [PubMed]
  16. Sato, Y.; Bourne, D.G.; Willis, B.L. Dynamics of seasonal outbreaks of black band disease in an assemblage of Montipora species at Pelorus Island (Great Barrier Reef, Australia). Proc. R. Soc. B Biol. Sci. 2009, 276, 2795–2803. [Google Scholar] [CrossRef] [PubMed]
  17. Vega Thurber, R.; Mydlarz, L.D.; Brandt, M.; Harvell, D.; Weil, E.; Raymundo, L.; Willis, B.L.; Langevin, S.; Tracy, A.M.; Littman, R.; et al. Deciphering Coral Disease Dynamics: Integrating Host, Microbiome, and the Changing Environment. Front. Ecol. Evol. 2020, 8, 575927. [Google Scholar] [CrossRef]
  18. Zvuloni, A.; Artzy-Randrup, Y.; Katriel, G.; Loya, Y.; Stone, L. Modeling the Impact of White-Plague Coral Disease in Climate Change Scenarios. PLoS Comput. Biol. 2015, 11, e1004151. [Google Scholar] [CrossRef] [PubMed]
  19. Langlais, C.E.; Lenton, A.; Heron, S.F.; Evenhuis, C.; Sen Gupta, A.; Brown, J.N.; Kuchinke, M. Coral bleaching pathways under the control of regional temperature variability. Nat. Clim. Chang. 2017, 7, 839–844. [Google Scholar] [CrossRef]
  20. Mahlstein, I.; Spirig, C.; Liniger, M.A.; Appenzeller, C. Estimating daily climatologies for climate indices derived from climate model data and observations. J. Geophys. Res. 2015, 120, 2808–2818. [Google Scholar] [CrossRef]
  21. Skirving, W.; Marsh, B.; De La Cour, J.; Liu, G.; Harris, A.; Maturi, E.; Geiger, E.; Mark Eakin, C. CoralTemp and the Coral Reef Watch Coral Bleaching Heat Stress Product Suite Version 3.1. Remote Sens. 2020, 12, 3856. [Google Scholar] [CrossRef]
  22. NOAA Coral Reef Watch. Daily Global 5 km Satellite Coral Bleaching Heat Stress Monitoring. Available online: https://coralreefwatch.noaa.gov/product/5km/index.php (accessed on 21 September 2023).
  23. Heron, S.F.; Heron, M.L.; Pichel, W.G. Thermal and Radar Overview. In Coral Reef Remote Sensing; Springer: Dordrecht, The Netherlands, 2013; pp. 285–312. [Google Scholar]
  24. Coral Disease and Health Consortium. White Syndromes of the Western Atlantic. Available online: https://cdhc.noaa.gov/coral-disease/characterized-diseases/white-syndromes-of-the-western-atlantic/#:~:text=%E2%80%9CWhite%20Syndromes%E2%80%9D%20are%20a%20collection,coral%20diseases%20throughout%20the%20world (accessed on 23 October 2023).
  25. Coral Reef Information System. NOAA’s National Coral Reef Monitoring Program. Available online: https://www.coris.noaa.gov/monitoring/ (accessed on 2 October 2023).
  26. Middleton, J.H.; Buchwald, V.T.; Huthnance, J.M. The anomalous tides near Broad Sound. Cont. Shelf Res. 1984, 3, 359–381. [Google Scholar] [CrossRef]
  27. Weeks, S.J.; Bakun, A.; Steinberg, C.R.; Brinkman, R.; Hoegh-Guldberg, O. Capricorn Eddy: A prominent driver of the ecology and future of the southern Great Barrier Reef. Coral Reefs 2010, 29, 975–985. [Google Scholar] [CrossRef]
  28. Brinkman, R.; Wolanski, E.; Deleersnijder, E.; McAllister, F.; Skirving, W. Oceanic inflow from the Coral Sea into the Great Barrier Reef. Estuar. Coast. Shelf Sci. 2002, 54, 655–668. [Google Scholar] [CrossRef]
  29. Aeby, G.S.; Williams, G.J.; Franklin, E.C.; Kenyon, J.; Cox, E.F.; Coles, S.; Work, T.M. Patterns of Coral Disease across the Hawaiian Archipelago: Relating Disease to Environment. PLoS ONE 2011, 6, e20370. [Google Scholar] [CrossRef]
  30. Vargas-Ángel, B. Coral Health and Disease Assessment in the U.S. Pacific Remote Island Areas. Bull. Mar. Sci. 2009, 84, 211–227. [Google Scholar]
  31. Williams, G.J.; Knapp, I.S.; Aeby, G.S.; Davy, S.K. Spatial and temporal patterns of scleractinian coral, soft coral, and zoanthid disease on a remote, near-pristine coral reef (Palmyra Atoll, central Pacific). Dis. Aquat. Org. 2011, 94, 89–100. [Google Scholar] [CrossRef] [PubMed]
Figure 1. Coral reef regions within the FORE-C project: (1) the Great Barrier Reef (light grey indicates 4412 reef-containing pixels within the coordinate range of [140°E–155°E, 25°S–10°S]); (2) Guam and Northern Mariana Islands; (3) Howland (a) and Jarvis (b) Islands (noting the very sparse nature of reef locations). Locations where 5 km × 5 km pixel SST data are used in subsequent figures are highlighted (light-blue outline); letters (a,b,c) are provided to cross-reference specific pixels. The global map shows these and other FORE-C regions (grey boxes) from north to south as follows: Wake Atoll, the Hawaiian archipelago, and Johnston Atoll; Palmyra Atoll and Kingman Reef; and American Samoa (including Swains Island). The location of Baker Island (0.194°N, 176.477°W) is shown as a single dot in panel (3) just to the south of Howland Island (3a).
Remotesensing 17 00262 g001
Figure 2. Hot Snap, Cold Snap, and Winter Condition metrics (°C-weeks) for a sample SST time-series extracted from a 5 km × 5 km reef pixel at 153°4′E, 24°22′S for the period from 01 May 2001 to 01 November 2002 (for the panel label, refer to Figure 1). The Hot Snap metric (area in red) accumulates when temperature exceeds the summer AV plus one summer SD (red dashed line). The Cold Snap metric (area in blue at left) accumulates when temperature drops below the winter AV minus one winter SD (bottom blue dashed line). The Winter Condition metric (area in purple at right) accumulates (1) within the three winter months (period of accumulation), and/or (2) when temperature is equal to or below the winter AV plus one winter SD (top purple dashed line). As the wintertime values combine with the subsequent summer conditions to predict disease risk [5], the Hot Snap of 3.02 °C-weeks and the Cold Snap of −1.65 °C-weeks predict disease outbreak risk in 2002, while the Winter Condition of −2.48 °C-weeks informs disease prediction for 2003. Red and blue arrows along the time axis indicate the summer reset month (i.e., October for Hot Snap) and the winter reset month (i.e., May for Cold Snap and Winter Condition), respectively; this is when each metric is initialised to 0 °C-weeks each year. The second axis (at right) illustrates the percentile value corresponding to each of the SST thresholds specified in this pixel.
Remotesensing 17 00262 g002
Figure 3. (a) Variabilities in percentile values corresponding to the five AV- and SD-based thresholds for the 21-year period 1985–2005. Green lines are the median percentiles across reef-containing pixels in the Great Barrier Reef. Boxes indicate the interquartile range (IQR), and whiskers extend to the farthest data point within 1.5 × IQR from the box. Circles indicate outliers beyond the extent of the whiskers. (b) Spatial variations in differences in Hot Snap thresholds (97th percentile—summer AV+SD). Threshold values (°C) were derived from the daily SST between 1985 and 2005 for each pixel. (c) Spatial variations in the difference in Hot Snap for 2001/2002 (percentile-based—summer AV+SD). Histograms in the second and third panels show the distribution of thresholds and metrics, respectively, among 4412 reef-containing pixels (colours correspond to spatial variations).
Remotesensing 17 00262 g003
Figure 4. SST time-series (2000–2020) at seasonal (top-left; 1a), weakly seasonal (bottom-left; 2), and non-seasonal (right panels; 3a,3b) exemplar pixels (panel labels refer to Figure 1). Pale red, pale purple, and light blue lines are the existing AV- and SD-based thresholds (dashed for summer AV+SD, winter AV+SD, and winter AV–SD; solid for winter AV), while red, purple, and blue lines indicate the new percentile-based thresholds (97th, 28th, 16th, and 5th percentiles).
Remotesensing 17 00262 g004
Figure 5. Time-series at Jarvis Island (2000–2020; panel labels refer to the pixel location in Figure 1.3b) of the (a) existing AV- and SD-based and the (b) new percentile-based Hot Snap (red), Cold Snap (blue) and Winter Condition (purple) metrics. Red and blue arrows indicate features referred to in the text.
Remotesensing 17 00262 g005
Figure 6. Change in the reset timing for the ‘summer’ (left) and ‘winter’ (right) metrics (absolute number of months) between the new percentile-based and existing AV- and SD-based methodologies at reef pixels (shown in Figure 1). The colour intensity indicates the percentage of pixels in a region with a certain difference. Analyses were conducted for the baseline period 1985–2005. Numbers of reef-containing pixels within each of the regions were: the Great Barrier Reef, 4412 pixels; the Hawaiian archipelago, 630 pixels; Johnston Atoll, 23 pixels; Guam and Northern Mariana Islands, 155 pixels; American Samoa, 56 pixels; Wake Atoll, 6 pixels; Palmyra Atoll and Kingman Reef, 18 pixels; Howland and Baker Islands, 12 pixels; and Jarvis Island, 2 pixels.
Remotesensing 17 00262 g006
Figure 7. Time-series of the new percentile-based Hot Snap (red), Cold Snap (blue), and Winter Condition (purple) for (left) Howland Island, 2012–2018; and (right) Piti, Guam, 2012–2014 (for the panel labels, refer to Figure 1). Black dots indicate the observed mean prevalence of white syndrome.
Remotesensing 17 00262 g007
Disclaimer/Publisher’s Note: The statements, opinions and data contained in all publications are solely those of the individual author(s) and contributor(s) and not of MDPI and/or the editor(s). MDPI and/or the editor(s) disclaim responsibility for any injury to people or property resulting from any ideas, methods, instructions or products referred to in the content.

