Highlights
What are the main findings?
- Chlorophyll-a in the South China Sea shows strong seasonal and spatial variability.
- Ordinary Kriging reconstruction of chlorophyll-a provides the most accurate basis for eutrophication risk assessment.
What is the implication of the main finding?
- Spatio-temporal chlorophyll-a patterns provide key insights into marine ecosystem health.
- Long-term satellite-derived chlorophyll-a supports reliable monitoring of eutrophication dynamics.
Abstract
Chlorophyll-a is a key indicator characterizing the health of marine ecosystems. This study aimed to assess eutrophication risk by investigating the spatio-temporal evolution of chlorophyll-a in the South China Sea (SCS). Based on MODIS-Aqua remote sensing data from 2003 to 2024, five spatial interpolation methods were compared, and Ordinary Kriging was selected as the optimal method (r = 0.96) for reconstructing the chlorophyll-a distribution. The findings indicate that chlorophyll-a is higher in winter and autumn than in summer and spring, with significant enrichment observed near coastal areas. Concentrations decrease with increasing distance from the shore. The Mekong River estuary consistently exhibits high values, while the concentration in the SCS Basin remains persistently low. Furthermore, the spatial extent where chlorophyll concentrations exceed the bloom threshold was evaluated to highlight potential eutrophication risk. These results provide a scientific basis for understanding the response mechanism of the SCS ecosystem to climate change and have important implications for regional marine environmental management and ecological conservation.
1. Introduction
Water eutrophication is one of the major global environmental problems and increasingly threatens the health of ecosystems. Chlorophyll-a, a key biological indicator for measuring seawater eutrophication levels, has been widely used in the monitoring and evaluating marine ecological environments [1]. Changes in chlorophyll-a concentration directly reflect the level of marine primary productivity [2,3,4]. As a proxy for phytoplankton biomass—particularly diatoms, which play a central role in the marine biological pump—chlorophyll-a is often used as indirect evidence of variations in oceanic CO2 uptake [5,6,7]. It is also commonly used to evaluate the biogeochemical processes of marine carbon and nitrogen cycles by indicating changes in phytoplankton growth and distribution. These phytoplankton, which serve as the fundamental link of the marine food web, have population dynamics that not only regulate the cycling characteristics of nutrients in the ocean but also maintain the balance and stability of the entire marine ecosystem [8,9].
The South China Sea (SCS) is one of the most biodiverse marine regions in the world, yet it is also highly vulnerable to environmental change [10,11]. Dynamic processes in the SCS exhibit significant spatial and seasonal variations due to the combined effects of multi-scale dynamic processes such as monsoon forcing, the Kuroshio intrusion, and mesoscale eddies [12]. These dynamic processes directly impact phytoplankton biomass by modulating the vertical transport of nutrients, thereby resulting in complex spatio-temporal variations in chlorophyll-a concentrations [13,14]. The China Marine Ecological Environment Bulletin indicates in 2023 that the total area of eutrophic waters in the SCS reached 3410 km2, causing incalculable economic losses from reduced fishery yields and increased management costs. Given the ecological fragility and biodiversity value of the SCS, assessment of its chlorophyll spatio-temporal evolution and eutrophication levels is of great strategic importance.
In recent years, numerous studies have analyzed the spatio-temporal evolution characteristics of chlorophyll-a in the SCS using satellite remote sensing. Early studies based on SeaWiFS observations [15,16,17] revealed seasonal patterns and long-term evolution trends of chlorophyll-a concentration, while Tang et al. [18,19] explored the role of continental shelves upwelling in regulating phytoplankton biomass through the fusion of multi-source data. Other works analyzed the dynamic characteristics of phytoplankton blooms in the local sea area using remote sensing data and on-site observation data [20,21]. However, the low spatial resolution and lack of temporal continuity of SeaWiFS data limit its applicability for high-dynamic ocean regions and long-term time series analysis [22]. With the development of remote sensing technology, the Moderate Resolution Imaging Spectroradiometer (MODIS) data has become an important data source for marine environment monitoring due to its advantages such as wide coverage, high temporal resolution, rich spectral information, and strong data openness [23,24,25,26]. Nevertheless, MODIS Level-3 chlorophyll-a products in the SCS still exhibit data gaps, primarily caused by persistent cloud cover, sun glint, sensor viewing geometry, and uncertainties in atmospheric correction, which can leave missing pixels in the satellite composites. As early as 2007, Peñaflor et al. [27] used MODIS chlorophyll-a data to study the possible driving forces, timing and location of algal blooms occurrence in parts of the SCS; Subsequently, numerous scholars analyzed the potential relationship between phytoplankton biomass and climate factors [28,29], and studied variation characteristics of chlorophyll-a and influencing factors in various marine environments [30,31].
Nonetheless, most of these investigations have focused on localized regions or limited periods, without providing an integrated, long-term climatology for the entire SCS. In addition, quantitative assessments of long-term eutrophication dynamics—linking chlorophyll-a evolution to nutrient enrichment—remain scarce. This study addresses this gap by reconstructing a continuous 22-year (2003–2024) chlorophyll-a dataset via the optimal interpolation method for spatial gap-filling, characterizing its seasonal and interannual variability. As recommended in the Marine Ecological Survey and Assessment Guidelines, Eutrophication was quantified using a 10 mg/m3 threshold—widely used in coastal and marginal seas as an indicator of elevated phytoplankton biomass, nutrient enrichment, and potential algal bloom conditions [32,33,34]. These results not only provide new insights into the long-term eutrophication dynamics of the SCS, but also demonstrate the capability of integrating satellite observations with statistical methods to detect subtle ecological changes. Importantly, the findings highlight the potential of satellite-based monitoring for capturing basin-scale marine environmental variability, offering methodological implications for the design and application of future ocean color remote sensing missions.
2. Data and Methods
2.1. Data
MODIS is the core sensor aboard the U.S. Aqua (EOS PM) and Terra (EOS AM) sun-synchronous orbiting satellites. It adopts an optical remote sensing design that integrates spectra, with 36 discrete spectral bands (spectral range of 0.405–14.385 μm, resolution of 10–20 nm), and realizes 1–2 days of global coverage through the coordinated observation of two satellites, with a scanning bandwidth of 2330 km. MODIS can provide data with three-level spatial resolutions of 250 m, 500 m, and 1000 m, and broadcast globally in real time through the X-band, providing important data support for the monitoring of dynamic changes in the earth’s surface. Its data products can effectively support the study and trend analysis of land, ocean and atmosphere from local to global scales, and it has the advantages of being globally free of charge, rich information resource, high-frequency observation and wide spectral range, which are of great application value in the dynamic monitoring of ocean color. This study uses the MODIS-Aqua Level-3 Standard Mapped Image (SMI) chlorophyll-a products, with a spatial resolution of 4 km. The chlorophyll-a concentration is calculated using a blended empirical algorithm combining the updated OC3/OC4 band ratio algorithm and the color index (CI) algorithm, based on in situ measurements and spectral remote sensing reflectances (Rrs). In this study, seasonal climate composite data and monthly average data from January 2003 to December 2024 were mainly used. The study area focuses on the core waters of the SCS (105–118°E, 4–21°N). The data can be obtained from NASA’s official Ocean Color website (http://oceancolor.gsfc.nasa.gov). In order to solve the problem of missing data in the original monthly average data, this study systematically evaluates the accuracy of multiple interpolation methods, and finally adopts the optimal spatial interpolation method for data reconstruction, which provides a high-quality data foundation for the study of marine ecological environment in the SCS.
2.2. Spatial Interpolation Techniques
Spatial interpolation techniques reconstruct spatial fields from discrete observations and are widely used in marine environmental parameter estimation [35,36,37,38]. This study, aiming at the spatial distribution characteristics of chlorophyll-a concentration data in the SCS, systematically evaluates the applicability of five typical interpolation methods, including: the inverse distance weighted (IDW) interpolation method, the ordinary kriging (OK) interpolation method, the nearest-neighbor interpolation (NNI), the local polynomial interpolation method (LPI), and the regularized thin-plate spline interpolation (RTPS). The study adopts a standardized data processing process: firstly, the geographic coordinates are converted into a plane coordinate system and the remote sensing data are log-transformed and standardized, then we apply the optimal interpolation method to fill in the missing values of the data and complete the data back-standardization and exponential transformation, and finally the interpolation results are visualized.
2.3. The Cross-Validation Method and Evaluation Parameters
This study systematically assesses the accuracy and robustness of five widely used interpolation methods using ten randomized cross-validations [39,40]. The cross-validation procedure, utilizing systematic sampling and iterative verification, effectively avoids the impact of randomness inherent in data division, thereby guaranteeing the reliability and representativeness of the evaluation outcomes. The procedure of a specific implementation is presented as: Initially, the chlorophyll-a concentration dataset in the South China Sea (SCS), derived exclusively from satellite remote sensing data, is randomly divided into ten equally sized subsets for each year. Subsequently, a tenfold cross-validation is performed: in each of the ten iterations, one subset is designated as the validation set, while the remaining nine subsets are used as the training set. This process ensures that every data point is utilized exactly once as part of the validation set across the ten iterations. In this study, chlorophyll-a data spanning 22 years (2003–2024) are used, and for each year, a tenfold cross-validation is performed, resulting in a total of 220 validation runs. During the verification process, four critical indicators are involved in assessing the estimation performance. The equations are as follows:
where is the estimated value, is the observed value, and n is the sample size, is the average value of the observations, is the average value of the predicted values.
3. Results and Discussion
3.1. Estimation of Chlorophyll-a Distributions
Figure 1 shows the error distributions of different interpolation methods. For MAE (Figure 1a), LPI exhibited the largest errors, with a maximum of 0.51 mg/m3, while OK had the smallest, below 0.19 mg/m3. IDW, RTPS, and NNI showed intermediate MAE values, all notably lower than LPI but higher than OK, with smaller differences in MAE among the three methods. The MAPE distribution (Figure 1b) shows a similar trend: LPI fluctuated most widely, with the highest mean relative error, whereas OK had the smallest MAPE (~16%), and IDW, RTPS, and NNI were intermediate. RMSE values (Figure 1c) showed less pronounced differences, though LPI remained generally higher and IDW and NNI occasionally exceeded other methods. These high values were primarily observed in regions with steep chlorophyll-a gradients or sparse sampling points, where interpolation is more sensitive to local variability, indicating potential instability of these methods under such conditions. Overall, across all experiments, OK consistently demonstrated the highest accuracy and stability among the five methods, as summarized in Table 1, and was superior in all evaluation metrics.
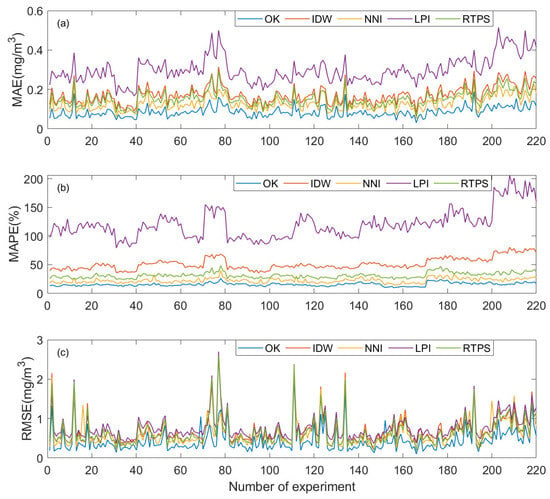
Figure 1.
Error distributions of (a) mean absolute error, (b) mean absolute percentage error, and (c) root mean square error of five interpolation methods for chlorophyll-a data in the SCS.

Table 1.
The average cross-validation error of chlorophyll-a in the SCS using different spatial interpolation methods in all experiments.
We selected the results of the cross-validation experiment whose error was closest to the mean error of all experiments to further evaluate the accuracy among different estimation methods. As illustrated in Figure 2, the predicted values of OK (Figure 2a), IDW (Figure 2c), NNI (Figure 2d), and RTPS (Figure 2e) were relatively close to the observed values, with correlation coefficients r > 0.9 (p < 0.05). Notably, OK interpolation showed the best fitting performance, with its predicted values closely following the y = x baseline and the highest correlation coefficient with observations (r = 0.96, p < 0.05). In contrast, LPI interpolation (Figure 2b) showed the weakest correlation (r = 0.71, p < 0.05), indicating that the applicability of the LPI interpolation method for chlorophyll-a data in the SCS is questionable. NNI and RTPS performed moderately; however, the interpolation results of both methods are underestimated in the high-value region, and a few scatter points deviate far from the regression line. IDW and LPI exhibited more pronounced deviations, with high values underestimated and low values overestimated.
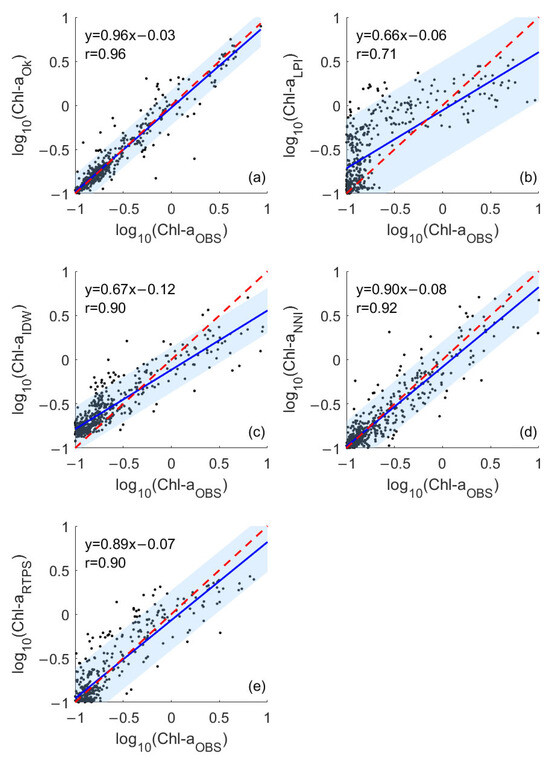
Figure 2.
The logarithm-transformed interpolation results are shown in the scattering diagram: (a) the scattering diagram of OK of the 77th experiment, (b) the scattering diagram of LPI of the 198th experiment, (c) the scattering diagram of IDW of the 55th experiment, (d) the scattering diagram of NNI of the 113th experiment, (e) the scattering diagram of RTPS of the 193th experiment. Each dot represents a pair of the interpolated value and the corresponding observed value. ‘r’ is the Pearson correlation coefficient. The solid blue line is the regression line. The red line is y = x. The shaded area represents the 95% confidence interval of the regression line.
In addition, we applied the above 5 interpolation methods to fill in the missing data of the chlorophyll-a satellite data observed in January 2011, which had the highest proportion of missing values. The original observations and the interpolation results are shown in Figure 3. Ordinary Kriging (OK) effectively reconstructed high-value coastal data in the western part of the study area, yielding a distribution pattern characterized by higher chlorophyll concentrations near the coast and lower values in the deep sea—consistent with previous findings on chlorophyll distribution in the South China Sea [15]. Moreover, in deep-sea regions with missing data, OK interpolation results exhibited a gradual concentration gradient (Figure 3f). The performance of the remaining four interpolation methods was inferior to that of OK. Combined with the error analysis, OK demonstrated the best accuracy and reliability and was selected as the optimal method for three-dimensional spatial interpolation of chlorophyll-a concentration in the SCS from 2003 to 2024.
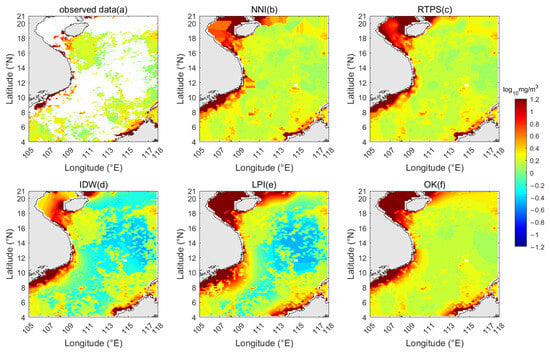
Figure 3.
Results of Missing Value Imputation for Chlorophyll Data in January 2011 Using Five Interpolation Methods. (a) Observed data, (b) NNI method, (c) RTPS method, (d) IDW method, (e) LPI method, (f) OK method.
3.2. Spatial and Temporal Variations in Chlorophyll-a Concentration
3.2.1. Seasonal Variations of Chlorophyll-a Concentration
We averaged the chlorophyll data of the monthly time series from 2003 to 2024 to analyze the seasonal variation in the South China Sea. This study selected January, April, July, and October each year to represent the seasons of winter, spring, summer, and autumn, respectively, for investigating the spatio-temporal evolution of chlorophyll-a. Figure 4 shows the distribution of chlorophyll-a concentration in the SCS during different seasons. The findings indicate that chlorophyll-a concentrations are generally higher in winter, relatively lower in autumn and summer, and reach their lowest levels in spring (Figure 4). This variability is primarily influenced by factors such as sea surface temperature, monsoon circulation and nutrient availability [12,41,42]. In winter (Figure 4a), the concentration of chlorophyll-a in the entire SCS reaches its annual peak, with concentrations above 0.13 mg/m3. This phenomenon is primarily attributed to the activity of strong Sea surface winds dominated by the northeasterly monsoon in winter [41]. During spring (Figure 4b), the chlorophyll-a concentration in the SCS declines rapidly, with the lowest concentration in the basin area dropping to 0.07 mg/m3. The high-value region north of 18°N (the northwest of Luzon Island) essentially vanishes, and the range of the high-value area near the western coast of the SCS significantly diminishes, retaining only a narrow strip spanning tens of kilometers.
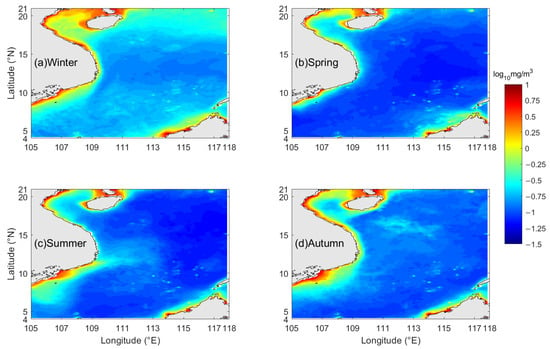
Figure 4.
Map of spatial distribution of average chlorophyll-a concentration in the SCS during (a) winter, (b) spring, (c) summer, and (d) autumn.
During summer (Figure 4c), the chlorophyll-a concentration exhibits an uneven variation compared to spring. However, the chlorophyll-a concentration across the majority of waters in the SCS has notably risen compared to spring, influenced by southwestern monsoons [43]. Significantly, the increase in the chlorophyll-a concentration in the area around the Mekong River estuary is the most significant, forming a distinctly high-valued tongue-shaped area that stretches from the coastal waters of southeastern Vietnam to the central part of the basin in the SCS. Compared with summer, the chlorophyll-a concentration in the southern part of the SCS increases insignificantly during autumn (Figure 4d), and there even exist a few areas where the concentration decreases. In contrast, the chlorophyll-a concentration in the northern part of the SCS increases rapidly. Meanwhile, the concentration in the waters near the Mekong River estuary maintains persistently high-valued condition.
The previous analysis reveals that there is a distinct regional characteristic of chlorophyll-a concentration between the nearshore sea area and the SCS basin. To explore the seasonal variation patterns across various regions in depth, this study selects two representative areas, as illustrated in Figure 5. The yellow-bordered region (12.3–15.1°N, 114–118°E) is designated as the deep-water basin area, while the area enclosed by the red border (7–12°N, 105–110°E) is identified as typical nearshore waters for further study of the seasonal variation in chlorophyll-a concentration.
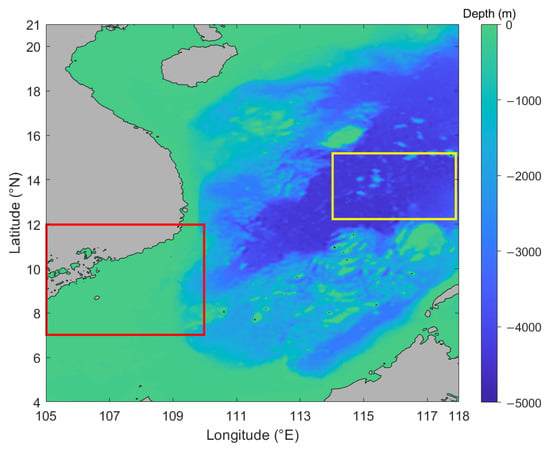
Figure 5.
The distribution of water depth in the SCS and the division of typical areas (the gray regions indicate the landmass). The yellow-bordered region represents the deep-water basin area, while the red-bordered region denotes the typical nearshore waters.
To capture temporal changes across the 22-year study period while minimizing the impact of single-year anomalies, we averaged data over three representative intervals—2003–2005, 2012–2014, and 2022–2024. These intervals represent early-, mid-, and late-period conditions separated by roughly a decade. To identify regions with comparatively higher productivity, a threshold of 0.32 mg/m3 was adopted, which corresponds approximately to the transition from oligotrophic to mesotrophic conditions in the SCS [44], effectively distinguishing nutrient-poor offshore waters from more productive nearshore waters.
The distribution of chlorophyll-a concentrations in two typical sea areas is shown in Figure 6 and Figure 7. The chlorophyll-a concentration values in nearshore waters are high all year round and exhibit pronounced seasonal variations (Figure 6). In 2003–2005 (Figure 6a–d), the coverage of the region with winter chlorophyll-a concentrations exceeding 0.32 mg/m3 was relatively large. The chlorophyll-a concentration decreased gradually with increasing offshore distance, reaching a minimum of 0.14 mg/m3 in waters farther from the shore. During spring, the range of the area with concentrations above 0.32 mg/m3 notably contracted compared to winter, whereas while nearshore waters maintained high levels, peaking at 8.13 mg/m3. In contrast, the concentrations in the sea farther from the coast declined sharply compared to winter, with a minimum value of 0.1 mg/m3. In summer, chlorophyll levels showed a slight increase relative to spring, and the belt-like region with concentrations surpassing 0.32 mg/m3 expanded. Two distinct low-value patches emerged in the sea farther from the coast, with concentrations around 0.08 mg/m3. In autumn, the peak concentration in the nearshore waters reached 6.76 mg/m3, and the spatial extent of the high-value belt-like area showed minimal variation compared to summer, while the concentrations in the sea farther from the coast experienced a modest increase compared to the summer period, though this increase was very slight.
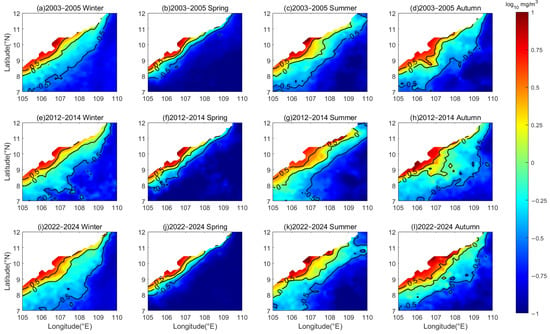
Figure 6.
Spatial and temporal distribution of chlorophyll-a concentrations in the nearshore waters of the SCS during (a,e,i) winter, (b,f,j) spring, (c,g,k) summer, and (d,h,l) autumn for the periods 2003–2005, 2012–2014, and 2022–2024, respectively (the white regions indicate the landmass).
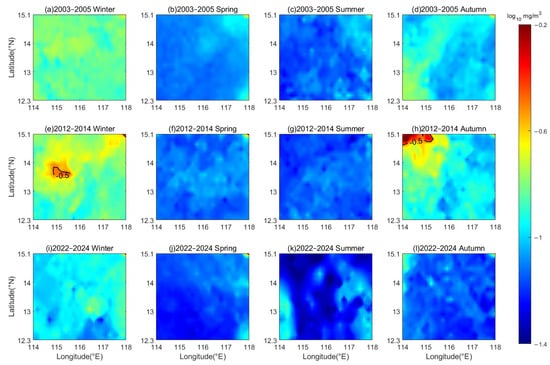
Figure 7.
Spatial and temporal distribution of chlorophyll-a concentrations in the deep-water basin area of the SCS during (a,e,i) winter, (b,f,j) spring, (c,g,k) summer, and (d,h,l) autumn for the periods 2003–2005, 2012–2014, and 2022–2024, respectively.
In 2012–2014 (Figure 6e–h), the chlorophyll-a concentrations and their seasonal variations in winter, spring, and summer exhibited negligible differences from those in 2003–2005. During the autumn, the area with concentrations exceeding 0.32 mg/m3 notably expanded compared to the summer of the same year, even surpassing the extent of coverage observed in the winters of those years.
In 2022–2024 (Figure 6i–l), the area of high chlorophyll-a concentrations exceeding 0.32 mg/m3 spanned a broad region during winter. The peak concentration in the nearshore waters reached 7.24 mg/m3, which was lower than the highest concentrations recorded in the same season in 2003–2005. In spring, the concentration plummeted. In summer, it recovered compared to spring, with a maximum value of 18.19 mg/m3, the waters farther from the coast exhibited a patchy low-value zone with concentrations around 0.1 mg/m3. Chlorophyll concentration increased in autumn compared to summer. In a word, the chlorophyll-a concentration in the nearshore waters tends to be higher in winter and autumn, and lower in spring and summer.
The seasonal variability and interannual fluctuations of chlorophyll-a concentration are more pronounced in the deep-water basin area (Figure 7). In 2003–2005 (Figure 7a–d), the chlorophyll-a concentration in the SCS basin fluctuated between 0.1 mg/m3 and 0.25 mg/m3 in winter. During spring, concentrations in most regions dropped below 0.1 mg/m3. In summer, concentrations showed little change compared with spring. In autumn, chlorophyll-a levels rapidly rebounded but still remained lower than winter levels in the same year.
In 2012–2014 (Figure 7e–h), the winter concentration fluctuated between 0.1 mg/m3 and 0.32 mg/m3. It decreased rapidly in spring. The change in chlorophyll-a concentration in summer was relatively minor compared to spring. In autumn, the concentration increased significantly relative to summer, with small areas of the sea exhibiting chlorophyll concentrations surpassing those of the same year’s winter.
In 2022–2024 (Figure 7i–l), the chlorophyll-a concentration exhibited fluctuations between 0.05 mg/m3 and 0.20 mg/m3 during winter. In spring, the concentration in most marine areas dropped below 0.1 mg/m3. During summer, the concentration exhibited irregular variations, with both increases and decreases relative to spring, but the changes were not apparent. From summer to autumn, a modest rebound in chlorophyll concentration was observed. In brief, the chlorophyll-a concentration in the deep-water basin area was significantly higher in winter and autumn compared to summer and spring, which was consistent with the seasonal pattern of change in the nearshore waters. Additionally, the chlorophyll-a levels in 2012–2014 exceeded those in 2003–2005, while the concentration in 2022–2024 was the lowest among the three periods, reflecting a trend of an initial increase followed by a decline. The large-scale circulation systems, the micro-scale and meso-scale ocean dynamic processes play a key role in chlorophyll-a distribution in the deep-water basin area [45,46,47].
3.2.2. Interannual Variations of Chlorophyll-a Concentration
As depicted in Figure 8, the annual average chlorophyll-a concentration in the SCS exhibited notable fluctuations from 2003 to 2024, reaching a maximum of 0.42 mg/m3 in 2007 and decreasing to a minimum of 0.36 mg/m3 in 2019. However, no significant changing trend was observed. The interannual variation trends for each season are shown in Figure 9. During the period 2003–2024, the annual average chlorophyll-a concentration in winter exhibited a slight declining trend, with fluctuations ranging from 0.45 mg/m3 to 0.61 mg/m3, peaking in 2009 and reaching the lowest level in 2020. This decline may be attributed to climate warming, as rising sea temperatures and a weakening northeast monsoon have reduced vertical mixing, limited nutrient upwelling, and consequently suppressed the growth of surface phytoplankton [48]. In autumns, typhoons have been highly active in the regions around the SCS [49]. Affected by typhoons and rainfall, the annual average chlorophyll-a concentration in autumn showed a significant upward trend, with the lowest concentration recorded in 2006 (0.32 mg/m3) and the highest in 2023 (0.49 mg/m3). In contrast, in summer the concentration remained relatively stable with insignificant variation trend, with the lowest value in 2015 and the highest in 2022. Similarly, the concentration in spring showed no clear trend, and the highest value was recorded in 2008, and the lowest in 2014.
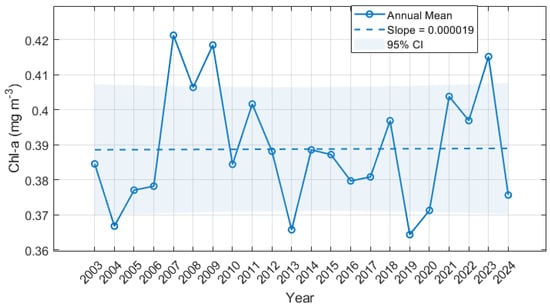
Figure 8.
Variation in the annual mean chlorophyll-a concentration in the SCS from 2003 to 2024, where the dashed line represents the fitted regression line of interannual variation and 0.000019 is the slope of the regression line.
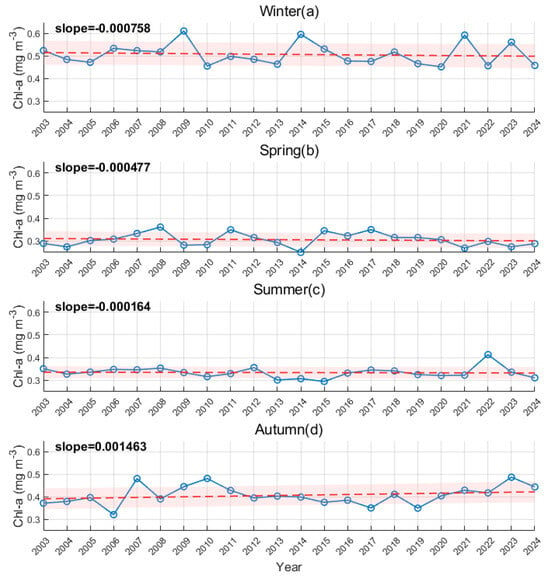
Figure 9.
Interannual variations of chlorophyll-a Concentration for four seasons in the SCS from 2003 to 2024: winter (a), spring (b), summer (c), and autumn (d). The red line indicates the fitted regression line. The shaded area represents the 95% confidence interval of the regression line.
Notably, the concentration in autumn exceeded the winter value by 5.7% in 2010 (Figure 9). In 2010, Super Typhoon Megi passed through the SCS in October [50], leading to the disruption of marine stratification and the upward movement of nutrients, which dramatically increased chlorophyll-a concentrations in the short term. Similar extreme weather events have significantly impacted marine ecosystems, potentially worsening eutrophication or altering community structures in local waters, thus disrupting ecological balance [51,52]. In 2006, a weak El Niño transitioned to La Niña. The southwest monsoon in summer was anomalously strong, while the onset of the northeast monsoon in autumn was delayed [53]. These resulted in the concentration in summer being higher than the autumn value by 8.2% in 2006 (Figure 9). The phenomenon reflects that the important role of interannual variation of the El Niño-Southern Oscillation (ENSO) in regulating the SCS ecosystem, and the influence of oceanic dynamic processes on primary production during the monsoon transition [54,55]. In 2008, 2011, 2015, and 2017, the chlorophyll-a concentration in spring exceeded the values observed in the corresponding summers (Figure 9). Interannual variations in the monsoon and circulation in the SCS may cause annual differences in the strength of coastal upwelling, the degree of mixing of seawater, and the spatial layout of sea surface temperature, which may be the main causes of interannual variations in chlorophyll-a concentrations in the SCS [56].
3.3. Marine Ecological Environment Assessment in the South China Sea
The area of algal bloom occurrence serves as a key indicator for assessing the quality of the marine biological environment. It is generally accepted that chlorophyll-a concentrations above 10 mg/m3 are indicative of phytoplankton blooms in China’s marginal seas [32]. The above analysis revealed that the chlorophyll-a concentration in the Beibu Gulf and near the Mekong River estuary is high all year round, making these areas susceptible to harmful events such as red tides. Therefore, based on the above criteria, a statistical analysis was performed on regions with chlorophyll-a concentrations exceeding 10 mg/m3 in the SCS from 2003 to 2024 to evaluate the condition of the marine ecological environment in the SCS.
Figure 10 illustrates the spatial extent of phytoplankton blooms in the SCS, which can serve as an indicator of eutrophication. Bloom events were more extensive in 2005, 2012, 2014, 2018, 2022, and 2023, particularly in 2023, when the bloom area exceeded 1000 km2. In contrast, bloom events in 2006, 2009, 2013, 2017, 2021, and 2024 were relatively smaller. It is important to note that the area analyzed in this study refers to regions where chlorophyll-a concentrations reached the bloom threshold (>10 mg/m3), which does not equate to the actual area of the disastrous bloom. Consequently, the extent of the area of high concentrations estimated by the study is generally larger than the area of red tide reported in the China Marine Disaster Bulletin.
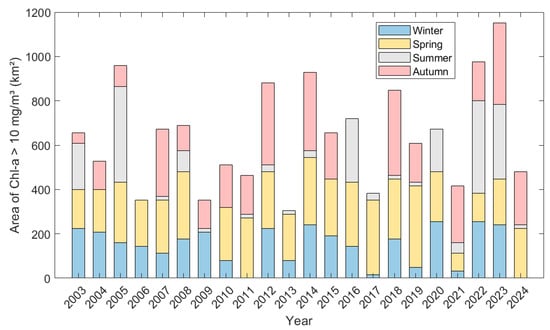
Figure 10.
Comparison of the area with chlorophyll-a concentration exceeding 10 mg/m3 in the SCS from 2003 to 2024.
Figure 11 further analyzes the area variation trends of regions in the SCS where chlorophyll-a concentration exceeds 10 mg/m3 across winter, spring, summer, and autumn from 2003 to 2024. In winter (Figure 11a), the area of high chlorophyll-a concentration regions showed a decreasing trend, but the overall trend line was relatively flat, indicating that the eutrophication status of this sea area was relatively stable in winter. In spring (Figure 11b), no significant increasing or decreasing trend in eutrophication area was observed in the SCS. The variation trend in summer was the most irregular; in many years, the eutrophic area in summer was less than 100 km2, but there were also multiple extreme-value years, such as 2005 and 2022, which were significantly higher than other years (Figure 11c). Although the eutrophic area showed an upward trend over these 22 years, the fluctuation was large, suggesting that the eutrophication risk intermittently increased in summer. Autumn exhibited a significant increasing trend, with intensifying eutrophication in the SCS. Particularly large eutrophic areas were observed in 2012, 2014, 2018, and 2023 (Figure 11d). In view of the overall trend, there has been no significant overall increase in the degree of eutrophication in the SCS in recent years. However, in some years, there have still been instances where the areas of eutrophicated water bodies were large. Therefore, it is essential to strengthen comprehensive monitoring and management of nutrient inputs, sea surface temperature changes, and the impacts of human activities to mitigate the potential risks of red tide outbreaks and ecosystem degradation.
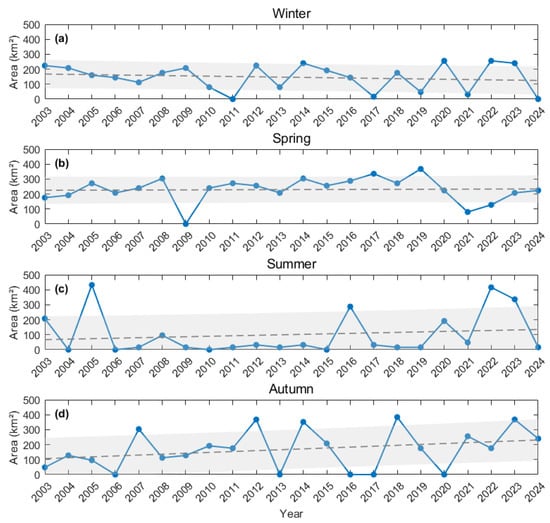
Figure 11.
Trends in the area where chlorophyll-a concentration is above 10 mg/m3 in the SCS during (a) winter, (b) spring, (c) summer and (d) autumn from 2003 to 2024. The shaded area represents the 95% confidence interval of the regression line.
4. Conclusions
By using MODIS-Aqua satellite remote sensing data, this study analyzes the evolution of chlorophyll-a in the SCS. At first, the accuracy of interpolation methods was evaluated. Results indicate that the OK method has the lowest error and the optimal stability, with an average MAE of 0.09 mg/m3, an MRE of 16%, and an RMSE of 0.43 mg/m3. Subsequently, the OK interpolation method was used to obtain the spatial distribution of chlorophyll-a concentrations in the SCS. By combining climatological data spanning these 22 years, this study provided a comprehensive analysis of the spatio-temporal patterns of chlorophyll-a concentration in the region. The scales of seasonal and interannual variations are also explored.
The distribution of chlorophyll-a concentration in the SCS exhibits pronounced seasonal variations. The chlorophyll-a concentration in winter is the highest among all seasons. In spring, the concentration is the lowest. The chlorophyll-a concentration in summer and autumn is intermediate between spring and winter. The spatial distribution demonstrates a pronounced nearshore enrichment pattern, with concentrations in nearshore waters higher than those in the basin area. These nutrient-rich nearshore regions—such as the typical coastal waters between 7 and 12°N and 105–110°E—maintain elevated chlorophyll-a levels throughout the year. From 2003 to 2024, although the annual average concentration of chlorophyll-a in the SCS exhibited significant interannual fluctuations, no clear long-term increasing or decreasing trend was observed.
Separately, eutrophication status was assessed based on the area of water bodies where chlorophyll-a concentrations exceeded the bloom threshold (>10 mg/m3). The results indicate that there has been no significant increase in the degree of eutrophication in the SCS in recent years, although large fluctuations have occurred. Meanwhile, certain years still exhibited large eutrophication areas. Overall, this study demonstrates the feasibility of using long-term satellite-derived chlorophyll-a records to assess eutrophication dynamics in the SCS. The findings highlight the potential of future ocean color remote sensing missions to improve large-scale ecological monitoring and early warning of marine environmental change.
Author Contributions
Conceptualization, B.L. and Z.C.; methodology, D.J.; software, J.W. and G.L.; validation, J.W. and J.L.; formal analysis, Z.C. and B.L.; investigation, D.J.; data curation, J.W.; writing—original draft, J.W.; visualization, J.W. and G.L.; supervision, B.L. and J.L.; funding acquisition, D.J. and B.L. All authors have read and agreed to the published version of the manuscript.
Funding
This research was funded by the Natural Science Foundation of Shandong Province (Grant No. ZR2020MD085), the School of Basic Sciences for Aviation Self-initiated Research Fund of Naval Aviation University.
Data Availability Statement
Data can be accessed from http://oceancolor.gsfc.nasa.gov.
Conflicts of Interest
The authors declare no conflicts of interest.
References
- Busari, I.; Sahoo, D.; Das, N.; Privette, C.; Schlautman, M.; Sawyer, C. Advancing harmful algal bloom predictions using chlorophyll-a as an indicator: Combining deep learning and EnKF data assimilation method. J. Environ. Manag. 2025, 382, 125441. [Google Scholar] [CrossRef]
- Behrenfeld, M.J.; Boss, E.; Siegel, D.A.; Shea, D.M. Carbon-based ocean productivity and phytoplankton physiology from space. Glob. Biogeochem. Cycles 2005, 19, GB1006. [Google Scholar] [CrossRef]
- Platt, T.; Sathyendranath, S.; Forget, M.H.; White, G.N., III; Caverhill, C.; Bouman, H.; Son, S. Operational estimation of primary production at large geographical scales. Remote Sens. Environ. 2008, 112, 3437–3448. [Google Scholar] [CrossRef]
- Xie, W.; Wang, T.; Jiang, W. Spatio-temporal variability of surface chlorophyll a in the Yellow Sea and the East China Sea based on reconstructions of satellite data of 2001–2020. J. Oceanol. Limnol. 2024, 42, 390–407. [Google Scholar] [CrossRef]
- Chavez, F.P.; Messié, M.; Pennington, J.T. Marine primary production in relation to climate variability and change. Annu. Rev. Mar. Sci. 2011, 3, 227–260. [Google Scholar] [CrossRef]
- Landschützer, P.; Gruber, N.; Bakker, D.C.; Schuster, U. Recent variability of the global ocean carbon sink. Glob. Biogeochem. Cycles 2014, 28, 927–949. [Google Scholar] [CrossRef]
- Moran, M.A.; Kujawinski, E.B.; Stubbins, A.; Fatland, R.; Aluwihare, L.I.; Buchan, A.; Waldbauer, J.R. Deciphering ocean carbon in a changing world. Proc. Natl. Acad. Sci. USA 2016, 113, 3143–3151. [Google Scholar] [CrossRef]
- Jakobsen, H.H.; Markager, S. Carbon-to-chlorophyll ratio for phytoplankton in temperate coastal waters: Seasonal patterns and relationship to nutrients. Limnol. Oceanogr. 2016, 61, 1853–1868. [Google Scholar] [CrossRef]
- Chen, S.; Hu, C.; Barnes, B.B.; Wanninkhof, R.; Cai, W.J.; Barbero, L.; Pierrot, D. A machine learning approach to estimate surface ocean pCO2 from satellite measurements. Remote Sens. Environ. 2019, 228, 203–226. [Google Scholar] [CrossRef]
- An, X.; Chung, Y.S.; Xia, L.; Qian, Y. The interannual variations of the summer monsoon onset over the South China Sea. Oceanogr. Lit. Rev. 1998, 9, 1509. [Google Scholar] [CrossRef]
- Jiang, K.; Wang, Y.; Sun, Y.; Lan, J. The seasonal variation of shallow meridional overturning circulation in the South China Sea and the related dynamics. Ocean Model. 2023, 186, 102242. [Google Scholar] [CrossRef]
- Wei, X.; Zhao, H. Spatiotemporal distribution of chlorophyll-a concentration in the South China Sea and its possible environmental regulation mechanisms. Mar. Environ. Res. 2025, 204, 106902. [Google Scholar] [CrossRef]
- Li, J.; Jiang, X.; Li, G.; Jing, Z.; Zhou, L.; Ke, Z.; Tan, Y. Distribution of picoplankton in the northeastern South China Sea with special reference to the effects of the Kuroshio intrusion and the associated mesoscale eddies. Sci. Total Environ. 2017, 589, 1–10. [Google Scholar] [CrossRef]
- Lai, C.C.; Wu, C.R.; Chuang, C.Y.; Tai, J.H.; Lee, K.Y.; Kuo, H.Y.; Shiah, F.K. Phytoplankton and bacterial responses to monsoon-driven water masses mixing in the Kuroshio off the east coast of Taiwan. Front. Mar. Sci. 2021, 8, 707807. [Google Scholar] [CrossRef]
- Xin, L.; Wang, J.; Cheng, X.; Yan, T. The temporal and spatial evolution of chlorophyll-a concentration in the South China Sea. J. Trop. Oceanogr. 2012, 31, 42–48. [Google Scholar]
- Liu, F.; Chen, C. Seasonal variation of chlorophyll a in the South China Sea from 1997–2010. Aquat. Ecosyst. Health Manag. 2014, 17, 212–220. [Google Scholar] [CrossRef]
- Qiu, F.; Fang, W.; Fang, G. Seasonal-to-interannual variability of chlorophyll in central western South China Sea extracted from SeaWiFS. Chin. J. Oceanol. Limnol. 2011, 29, 18–25. [Google Scholar] [CrossRef]
- Tang, D.; Kawamura, H.; Van Dien, T.; Lee, M. Offshore phytoplankton biomass increase and its oceanographic causes in the South China Sea. Mar. Ecol. Prog. Ser. 2004, 268, 31–41. [Google Scholar] [CrossRef]
- Tang, D.L.; Kawamura, H.; Doan-Nhu, H.; Takahashi, W. Remote sensing oceanography of a harmful algal bloom off the coast of southeastern Vietnam. J. Geophys. Res. Oceans. 2004, 109. [Google Scholar] [CrossRef]
- Chen, C.C.; Shiah, F.K.; Chung, S.W.; Liu, K.K. Winter phytoplankton blooms in the shallow mixed layer of the South China Sea enhanced by upwelling. J. Mar. Syst. 2006, 59, 97–110. [Google Scholar] [CrossRef]
- Wang, J.; Tang, D.; Sui, Y. Winter phytoplankton bloom induced by subsurface upwelling and mixed layer entrainment southwest of Luzon Strait. J. Mar. Syst. 2010, 83, 141–149. [Google Scholar] [CrossRef]
- Esaias, W.E.; Abbott, M.R.; Barton, I.; Brown, O.B.; Campbell, J.W.; Carder, K.L.; Minnett, P.J. An overview of MODIS capabilities for ocean science observations. IEEE Trans. Geosci. Remote Sens. 1998, 36, 1250–1265. [Google Scholar] [CrossRef]
- Tang, D.; Kawamura, H.; Lee, M.A.; Van Dien, T. Seasonal and spatial distribution of chlorophyll-a concentrations and water conditions in the Gulf of Tonkin, South China Sea. Remote Sens. Environ. 2003, 85, 475–483. [Google Scholar] [CrossRef]
- Tang, D.; Ni, I.H.; Müller-Karger, F.E.; Oh, I.S. Monthly variation of pigment concentrations and seasonal winds in China’s marginal seas. Hydrobiologia 2004, 511, 1–15. [Google Scholar] [CrossRef]
- Ding, H.; Zhu, C.; Liu, N.; Wang, G. Feature extraction and analysis of small floating targets in high sea conditions. J. Nav. Aviat. Univ. 2023, 38, 301–312. [Google Scholar] [CrossRef]
- Tian, K.; Yu, X.; Wang, Z.; Liu, N. Analysis of sea clutter and small target characteristics based on measured data. J. Nav. Aviat. Univ. 2023, 38, 313–322. [Google Scholar] [CrossRef]
- Peñaflor, E.L.; Villanoy, C.L.; Liu, C.T.; David, L.T. Detection of monsoonal phytoplankton blooms in Luzon Strait with MODIS data. Remote Sens. Environ. 2007, 109, 443–450. [Google Scholar] [CrossRef]
- Wu, Y.; Zhu, H.; Dang, X.; Cheng, T.; Yang, S.; Wang, L.; Huang, L.; Cui, X. Spatial-temporal change of phytoplankton biomass in the East China Sea with MODIS data. J. Ocean Univ. China 2021, 20, 454–462. [Google Scholar] [CrossRef]
- Park, J.E.; Park, K.A.; Kang, C.K.; Kim, G. Satellite-observed chlorophyll-a concentration variability and its relation to physical environmental changes in the East Sea (Japan Sea) from 2003 to 2015. Estuaries Coasts 2020, 43, 630–645. [Google Scholar] [CrossRef]
- Cheng, Y.; Zhang, S. The research on the variation of chlorophyll-a in Bohai Sea based on MODIS data. IOP Conf. Ser. Earth Environ. Sci. 2021, 714, 022029. [Google Scholar] [CrossRef]
- Zhou, Y.; Gai, Y.; Liu, X. Long-term variation of chlorophyll-a concentration in Qingdao coastal area from MODIS data. IOP Conf. Ser. Earth Environ. Sci. 2021, 631, 012007. [Google Scholar] [CrossRef]
- He, X.Q.; Bai, Y.; Pan, D.L.; Chen, C.T.A.; Gong, F. Satellite views of the seasonal and interannual variability of phytoplankton blooms in the eastern China seas over the past 14 yr (1998–2011). Biogeosciences 2013, 10, 4721–4739. [Google Scholar] [CrossRef]
- Huo, S.; Ma, C.; Xi, B.; Su, J.; Zan, F.; Ji, D.; He, Z. Establishing eutrophication assessment standards for four lake regions, China. J. Environ. Sci. 2013, 25, 2014–2022. [Google Scholar] [CrossRef] [PubMed]
- Ptacnik, R.; Lepistö, L.; Willén, E.; Brettum, P.; Andersen, T.; Rekolainen, S.; Carvalho, L. Quantitative responses of lake phytoplankton to eutrophication in Northern Europe. Aquat. Ecol. 2008, 42, 227–236. [Google Scholar] [CrossRef]
- Zhao, Z.; Xiao, R.; Guo, J.; Zhang, Y.; Zhang, S.; Lv, X.; Shi, H. Three-dimensional spatial interpolation for chlorophyll-a and its application in the Bohai Sea. Sci. Rep. 2023, 13, 7930. [Google Scholar] [CrossRef]
- Murphy, R.R.; Curriero, F.C.; Ball, W.P. Comparison of spatial interpolation methods for water quality evaluation in the Chesapeake Bay. J. Environ. Eng. 2010, 136, 160–171. [Google Scholar] [CrossRef]
- Yan, X.; Gao, Z.; Jiang, Y.; He, J.; Yin, J.; Wu, J. Application of synthetic DINCAE–BME spatiotemporal interpolation framework to reconstruct chlorophyll–a from satellite observations in the Arabian Sea. J. Mar. Sci. Eng. 2023, 11, 743. [Google Scholar] [CrossRef]
- Li, J.; Heap, A.D. Spatial interpolation methods applied in the environmental sciences: A review. Environ. Model. Softw. 2014, 53, 173–189. [Google Scholar] [CrossRef]
- Chen, D.; Ou, T.; Gong, L.; Xu, C.Y.; Li, W.; Ho, C.H.; Qian, W. Spatial interpolation of daily precipitation in China: 1951–2005. Adv. Atmos. Sci. 2010, 27, 1221–1232. [Google Scholar] [CrossRef]
- Chen, Y.; Shan, X.; Jin, X.; Yang, T.; Dai, F.; Yang, D. A comparative study of spatial interpolation methods for determining fishery resources density in the Yellow Sea. Acta Oceanol. Sin. 2016, 35, 65–72. [Google Scholar] [CrossRef]
- Huynh, H.N.T.; Alvera-Azcárate, A.; Beckers, J.M. Analysis of surface chlorophyll a associated with sea surface temperature and surface wind in the South China Sea. Ocean Dyn. 2020, 70, 139–161. [Google Scholar] [CrossRef]
- Liu, K.K.; Chao, S.Y.; Shaw, P.T.; Gong, G.C.; Chen, C.C.; Tang, T.Y. Monsoon-forced chlorophyll distribution and primary production in the South China Sea: Observations and a numerical study. Deep Sea Res. Part I Oceanogr. Res. Pap. 2002, 49, 1387–1412. [Google Scholar] [CrossRef]
- Dippner, J.W.; Nguyen, K.V.; Hein, H.; Ohde, T.; Loick, N. Monsoon-induced upwelling off the Vietnamese coast. Ocean Dyn. 2007, 57, 46–62. [Google Scholar] [CrossRef]
- Uitz, J.; Claustre, H.; Morel, A.; Hooker, S.B. Vertical distribution of phytoplankton communities in open ocean: An assessment based on surface chlorophyll. J. Geophys. Res. Oceans 2006, 111, C08005. [Google Scholar] [CrossRef]
- Ye, H.; Kalhoro, M.A.; Morozov, E.; Tang, D.; Wang, S.; Thies, P.R. Increased chlorophyll-a concentration in the South China Sea caused by occasional sea surface temperature fronts at peripheries of eddies. Int. J. Remote Sens. 2018, 39, 4360–4375. [Google Scholar] [CrossRef]
- Yang, D.; Ye, H.; Wang, G. Impacts of internal waves on chlorophyll a distribution in the northern portion of the South China Sea. Chin. J. Oceanol. Limnol. 2010, 28, 1095–1101. [Google Scholar] [CrossRef]
- Yu, Y.; Xing, X.; Liu, H.; Yuan, Y.; Wang, Y.; Chai, F. The variability of chlorophyll-a and its relationship with dynamic factors in the basin of the South China Sea. J. Mar. Syst. 2019, 200, 103230. [Google Scholar] [CrossRef]
- Lao, Q.; Liu, S.; Wang, C.; Chen, F. Global warming weakens the ocean front and phytoplankton blooms in the Luzon Strait over the past 40 years. J. Geophys. Res. Biogeosci. 2023, 128, e2023JG007726. [Google Scholar] [CrossRef]
- Zheng, G.M.; Tang, D.L. Offshore and nearshore chlorophyll increases induced by typhoon winds and subsequent terrestrial rainwater runoff. Mar. Ecol. Prog. Ser. 2007, 333, 61–74. [Google Scholar] [CrossRef]
- Ko, D.S.; Chao, S.Y.; Wu, C.C.; Lin, I.I. Impacts of Typhoon Megi (2010) on the South China Sea. J. Geophys. Res. Oceans 2014, 119, 4474–4489. [Google Scholar] [CrossRef]
- Wang, Y. Composite of typhoon-induced sea surface temperature and chlorophyll-a responses in the South China Sea. J. Geophys. Res. Oceans 2020, 125, e2020JC016243. [Google Scholar] [CrossRef]
- Ye, H.J.; Sui, Y.; Tang, D.L.; Afanasyev, Y.D. A subsurface chlorophyll a bloom induced by typhoon in the South China Sea. J. Mar. Syst. 2013, 128, 138–145. [Google Scholar] [CrossRef]
- Lee, C.W.; Sui, C.H.; Izumo, T. The evolutions of single-year and multiyear El Niño from preconditioning to decay stages: Direct wind-driven versus boundary-reflected oceanic responses. J. Clim. 2025, 38, 1205–1220. [Google Scholar] [CrossRef]
- Ning, X.; Lin, C.; Hao, Q.; Liu, C.; Le, F.; Shi, J. Long term changes in the ecosystem in the northern South China Sea during 1976–2004. Biogeosciences 2009, 6, 2227–2243. [Google Scholar] [CrossRef]
- Kuo, N.J.; Ho, C.R.; Lo, Y.T.; Huang, S.J.; Tsao, C.C. Variability of chlorophyll-a concentration and sea surface wind in the South China Sea associated with the El Niño-Southern Oscillation. In Proceedings of the OCEANS 2008—MTS/IEEE Kobe Techno-Ocean, Kobe, Japan, 8–11 April 2008; pp. 1–5. [Google Scholar] [CrossRef]
- Palacz, A.P.; Xue, H.; Armbrecht, C.; Zhang, C.; Chai, F. Seasonal and inter-annual changes in the surface chlorophyll of the South China Sea. J. Geophys. Res. Oceans 2011, 116. [Google Scholar] [CrossRef]
Disclaimer/Publisher’s Note: The statements, opinions and data contained in all publications are solely those of the individual author(s) and contributor(s) and not of MDPI and/or the editor(s). MDPI and/or the editor(s) disclaim responsibility for any injury to people or property resulting from any ideas, methods, instructions or products referred to in the content. |
© 2025 by the authors. Licensee MDPI, Basel, Switzerland. This article is an open access article distributed under the terms and conditions of the Creative Commons Attribution (CC BY) license (https://creativecommons.org/licenses/by/4.0/).