Article

Diffractive Neural Network Enabled Spectral Object Detection

1
Shanghai Institute of Technical Physics, Chinese Academy of Sciences, Shanghai 200083, China
2
University of Chinese Academy of Sciences, Beijing 100049, China
3
National Key Laboratory of Infrared Detection Technologies, Shanghai Institute of Technical Physics, Chinese Academy of Sciences, 500 Yutian Road, Shanghai 200083, China
*
Author to whom correspondence should be addressed.
Remote Sens. 2025, 17(19), 3381; https://doi.org/10.3390/rs17193381
Submission received: 15 August 2025 / Revised: 3 October 2025 / Accepted: 3 October 2025 / Published: 8 October 2025

Abstract

Highlights

What are the main findings?
  • We proposed an innovative DNN-SOD diffractive neural network architecture that leverages spectral characteristics and field-of-view segmentation to enable direct spectral feature reconstruction and target detection for infrared targets.
  • The architecture achieved 84.27% on an infrared target dataset, demonstrating its feasibility for large-scale remote sensing tasks.
What is the implication of the main finding?
  • This study presents a new paradigm of applying optical computing to spectral remote sensing target detection, overcoming the limitations of traditional optical computing methods that fail to fully exploit spectral properties of targets and handle large-scale data effectively.
  • It provides a novel pathway for integrated sensing-computing information processing in future sky-based remote sensing, highlighting the potential of optical computing inference in real-world applications.

Abstract

This article introduces a diffractive neural network-enabled spectral object detection approach (DNN-SOD) to efficiently process massive sky-based multidimensional light field data. DNN-SOD combines the novel exploitation of target spectral features with the intrinsic parallelism of optical computing to process multidimensional information efficiently. DNN-SOD detects targets by segmenting the spectral data cube and processing it with the DNN. The DNN maps spectral intensity to the designated area of the detector, then reconstructs spectral curves, and differentiates targets by comparing them with reference spectral signatures. Classification results from individual sub-spectral data cubes are compiled in sequence, enabling accurate target detection. Simulation results indicate that the architecture achieved an accuracy of 91.56% on the MNIST multi-spectral dataset and 84.27% on the infrared target multi-spectral dataset, validating its feasibility for target detection. This architecture represents an innovative outcome at the intersection of remote sensing and optical computing, significantly advancing the dissemination and practical adoption of optical computing in the field.

1. Introduction

With the rapid advancement of sky-based remote sensing, multidimensional light field acquisition technologies, such as spectral [1,2,3] and polarization [4,5] imaging, have seen widespread application. However, exponential growth in data volume outpaces processing capabilities, creating a bottleneck for time-sensitive tasks such as infrared target detection [6] and extreme disaster prediction [7,8]. An approach to addressing the contradiction between the growth of data volume and the need for high-speed information processing is to introduce neuromorphic computing architectures. Among them, optical neural networks, as a branch of neuromorphic computing, have gained widespread attention and rapid development in recent years. It leverages the propagation of multidimensional light fields to perform computational tasks, offering advantages such as parallelism, high throughput, and low power consumption [9,10,11]. First proposed by Lin et al. in 2018, the diffractive neural network (DNN) manipulates the light field through multiple layers of stacked optical planes, achieving the mapping between the input and output light fields [12].
Using the wavelength-dependent and polarization-dependent response of optical elements in DNN, a multidimensional multiplexed DNN can be constructed. In 2023, D. Mengu et al. proposed a diffractive optical network-based multi-spectral imaging system that achieves multi-spectral snapshot imaging [13]. In 2024, Z Wang et al. proposed an opto-intelligence spectrometer using DNN that can achieve spectral reconstruction at the speed of light [14]. The aforementioned DNNs leverage the independent characteristics of different dimensions and channels of the light field. However, architectures based on these DNNs do not integrate and utilize the information contained in each channel of the multidimensional optical field for tasks such as inference and detection.
In this paper, we propose a DNN-enabled spectral object detection method that leverages the spectral characteristics of targets for detection through DNN-based reconstruction. The motivation for this architecture is leveraging optical computing to efficiently process massive multidimensional light-field data from sky-based remote sensing payloads, resolving the contradiction between rapidly evolving data acquiring capabilities and limited onboard data processing capacity.
DNN-SOD takes multi-spectral data of the scene as input and maps the different spectral channels of the input light field to corresponding regions of the complementary metal-oxide-semiconductor (CMOS) detector. The energy distribution curve of incident light at different wavelengths is obtained by calculating the intensity of the corresponding regions of the CMOS detector. Compared to traditional multi-wavelength DNNs, DNN-SOD considers the fact that different materials exhibit unique spectral characteristics. It utilizes DNN to reconstruct the spectral feature curves from the spectral data cube, and the detection of objects is achieved by comparing the reconstructed spectral curves with the existing spectrum database. The simulation results show that DNN-SOD can effectively utilize multi-spectral data to perform an object detection task.
The proposed architecture has the potential to bring about a breakthrough in spectral remote sensing, particularly in applications such as infrared target detection, environmental monitoring, and mineral exploration.

2. Materials and Methods

2.1. Architecture of DNN-SOD

Compared with traditional models deployed on GPUs or CPUs, DNN constructs neural networks in the optical domain using optical elements to perform data processing. As illustrated in Figure 1, traditional electronic algorithms (electronic neural networks) perform inference and training on GPUs or CPUs to achieve the mapping from data input to information output. In contrast, the DNN converts data from the digital domain to the optical domain through optoelectronic modulation devices and constructs a neural network in hardware via optical diffraction. This enables the processing of multidimensional data in the optical domain, performing computation through mathematical operations abstracted from light field propagation, and realizing the mapping from data input to information output.
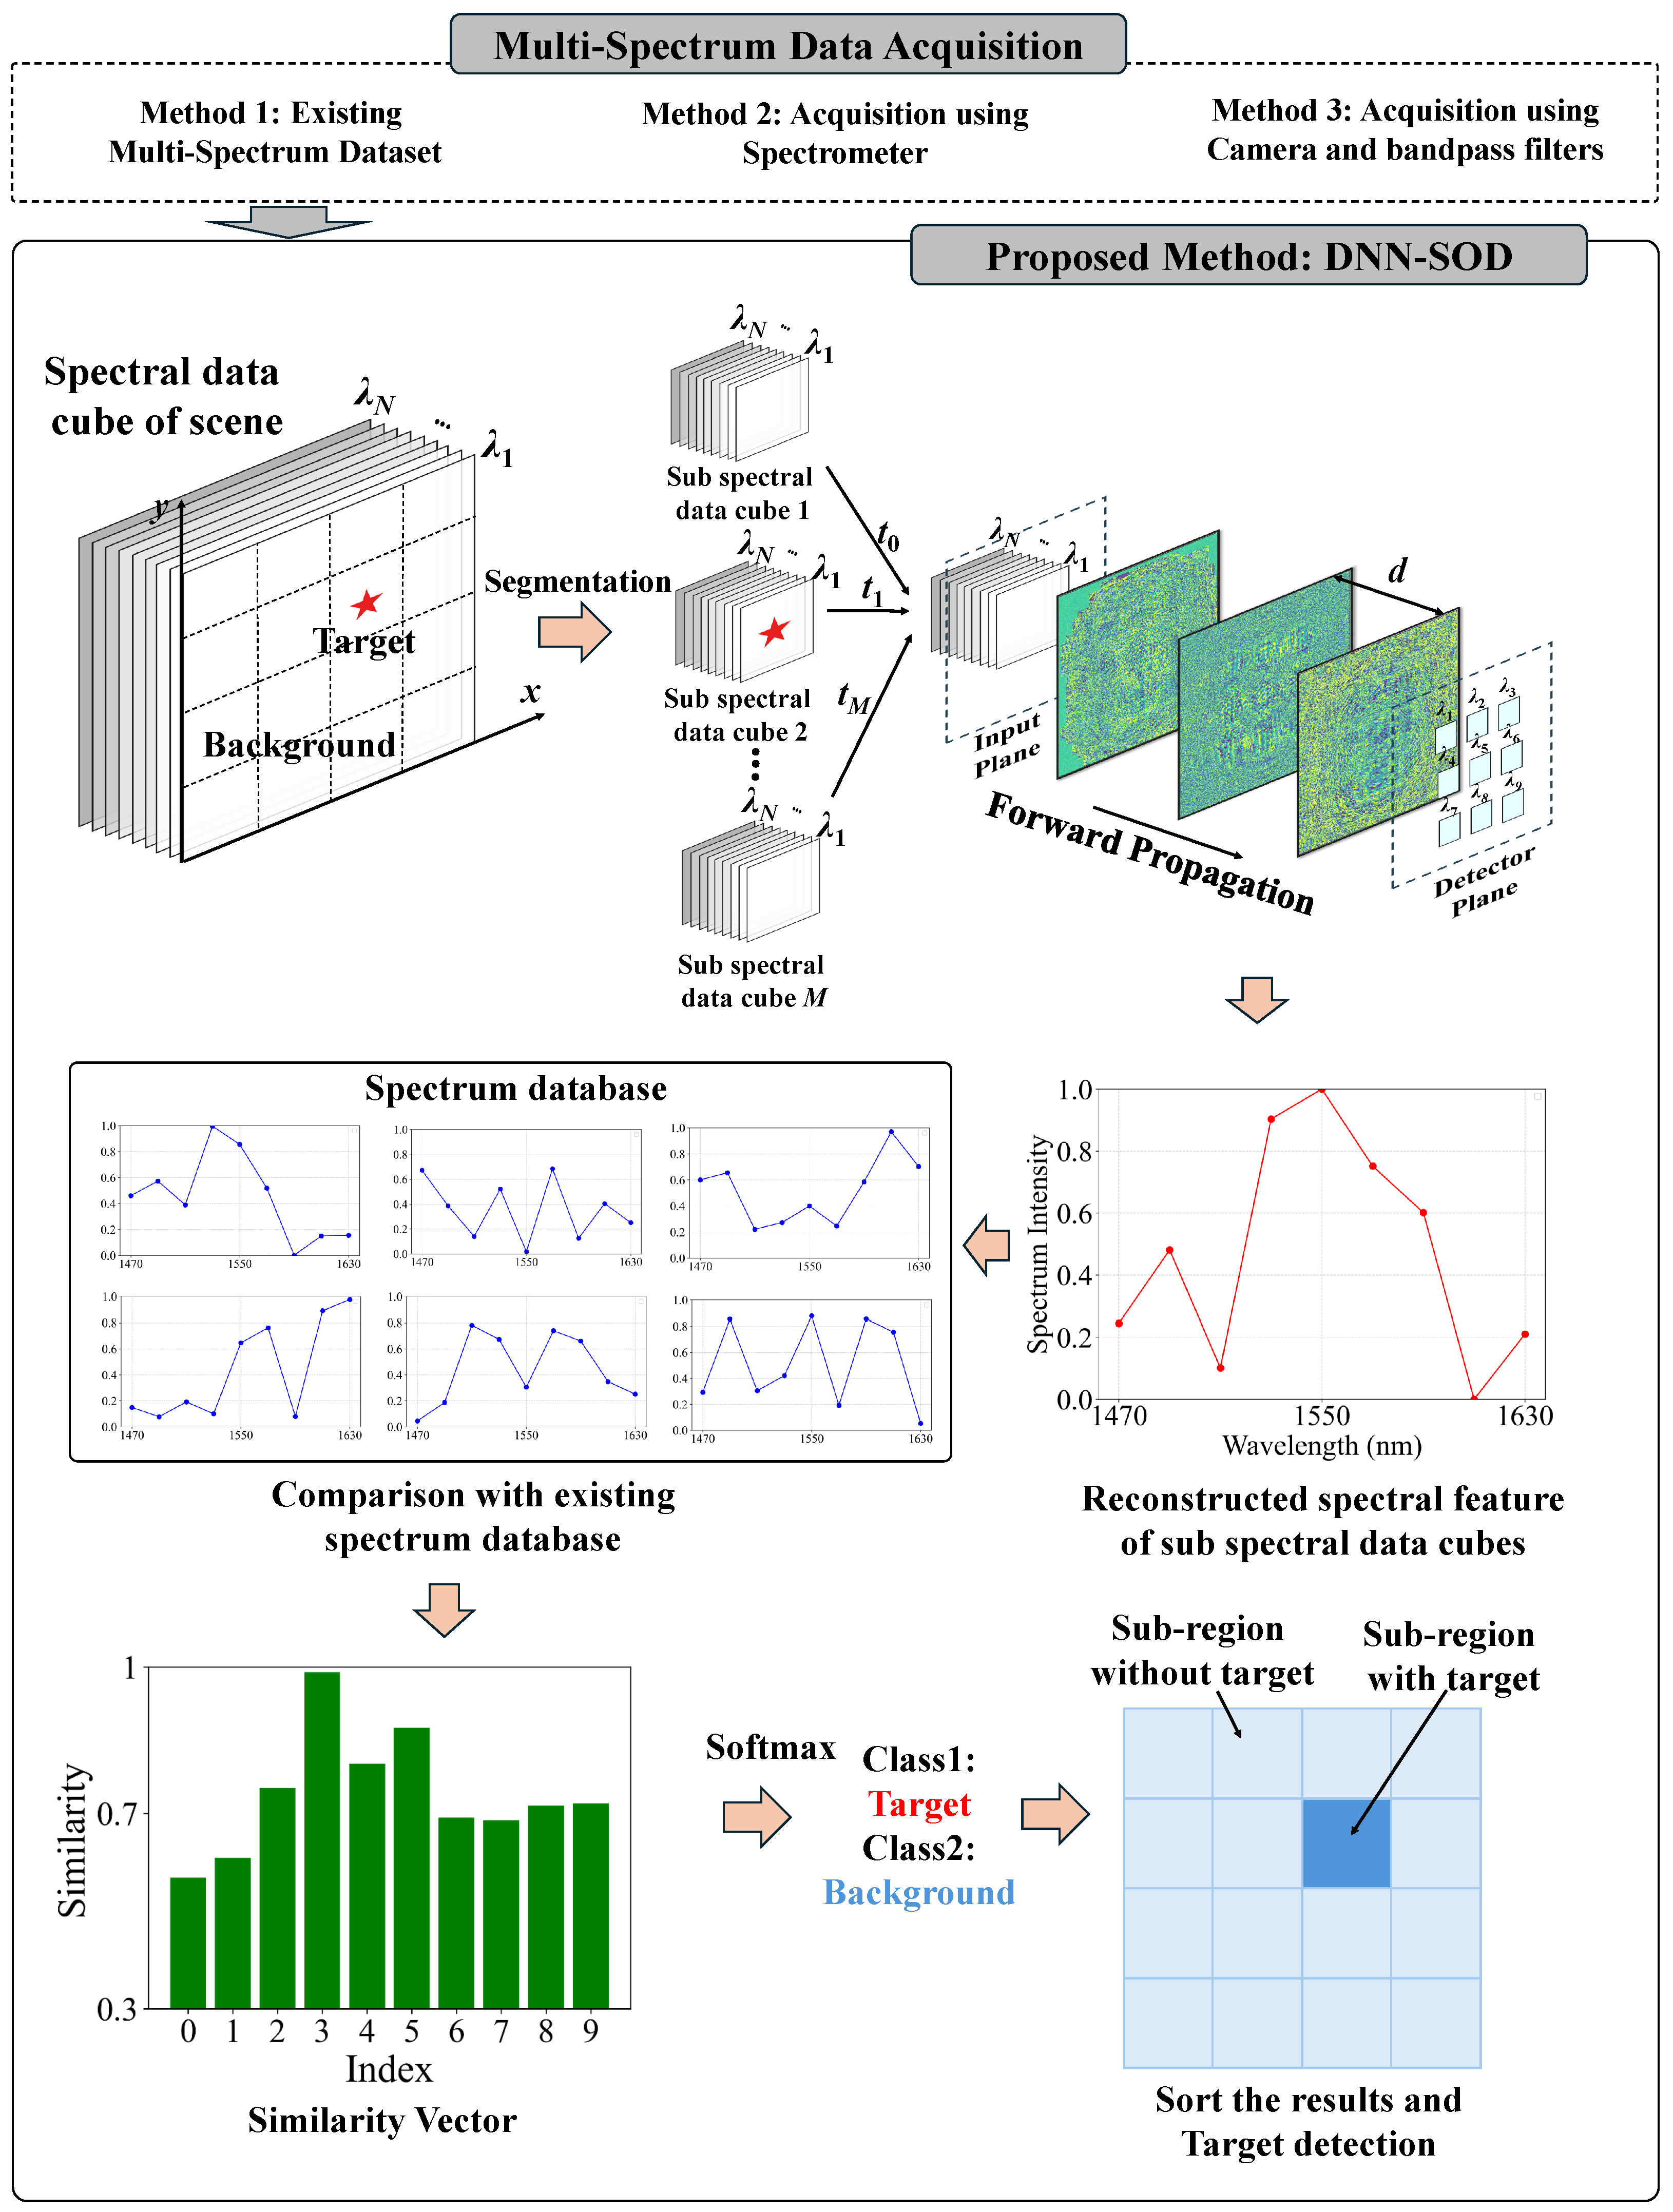
DNN-SOD is a DNN-based architecture for spectral information processing aimed at object detection. DNN-SOD is based on the fact that different targets exhibit unique spectral signatures, theoretically enabling the detection of targets with different spectral features through the analysis of their spectral data cubes. As shown in Figure 2, it is a conceptual diagram of the DNN-SOD system. For remote sensing applications such as ship detection and unmanned aerial vehicle (UAV) detection, the target occupies a very small proportion of the high spatial resolution image. For a spectral data cube with high spatial resolution, we divide it into several subspectral data cubes and send them to the DNN in sequence. Different wavelength channels propagate forward through the DNN in parallel. Sub-regions corresponding to the number of wavelength channels are set on the detector plane, where the intensity distributions of different spectral bands in the input spectral data cube are mapped by the DNN to the corresponding sub-regions on the detector plane. By measuring the intensity distributions in each region, the spectral distribution curve of the input subspectral data cube can be obtained. Target classification is achieved by comparing the computed spectral curve with the ground-truth spectral characteristic curves of different target types. Target detection in high spatial resolution images is achieved by arranging the output classification results of each spectral data cube slice in the original sequence.
In this paper, we place the DNN-SOD module after photo-electroconversion to overcome the data volume bottleneck in sky-based remote sensing of multidimensional light fields. Future research could explore the integration of the DNN-SOD module with the image system of the satellite payload. In this case, DNN-SOD operates in spatially incoherent illumination, and segmentation of the spectral data cube in the optical domain can be achieved using micro-lens fiber integral field units (IFU) [15,16]. Recent research has already combined optical fibers with diffractive neural networks, which we believe is a highly promising research direction [17].

2.2. Forward Propagation Model of DNN-SOD

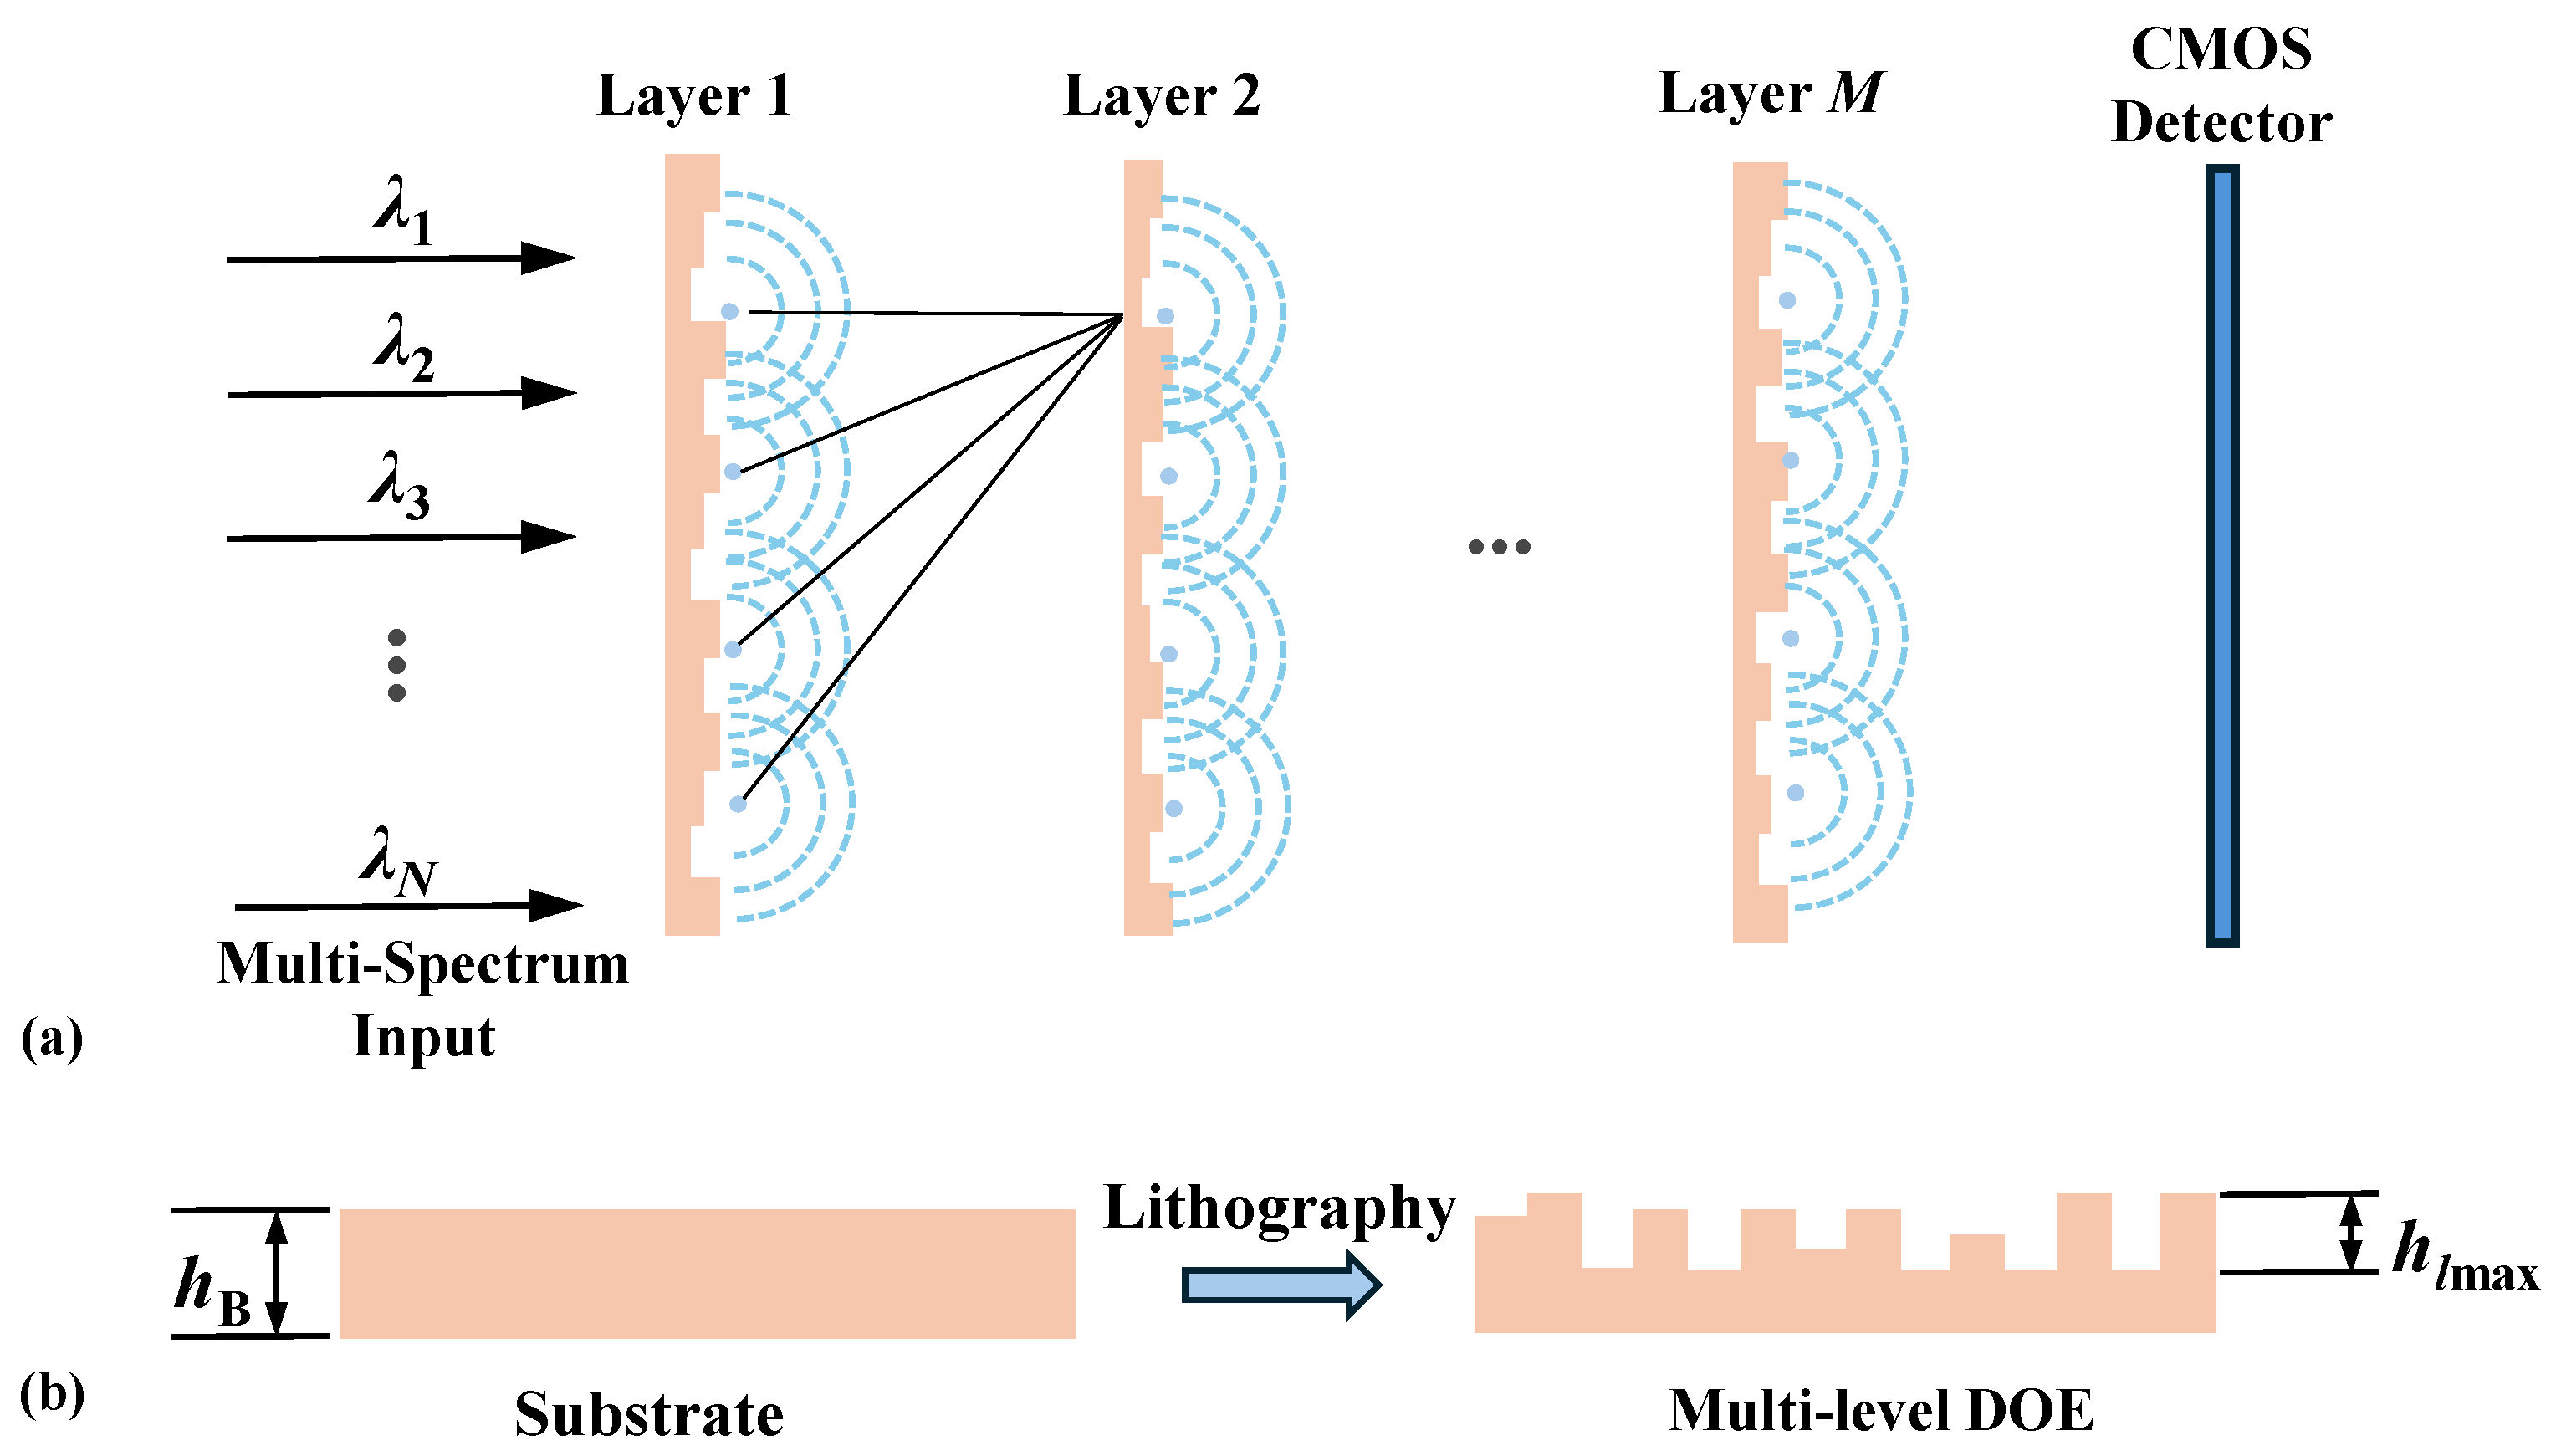
A fully connected neural network relies on numerical computation, utilizing matrix multiplication and non-linear activation functions. The output of each layer is obtained by multiplying the input vector by a weight matrix, adding a bias, and applying an activation function. In contrast, a diffractive neural network (DNN) computes based on optical diffraction propagation, where information passes through multiple diffractive layers, typically consisting of phase modulation surfaces. Each layer transforms the wavefront according to the diffraction principles, following the laws of wave optics. DNN-SOD utilizes multiple diffractive layers to map the spectral data cube of the scene in the input plane to the energy distribution of different wavelengths in the output plane. The forward propagation model of DNN-SOD is illustrated in Figure 3a, the optical component modulates the complex amplitude of the incident wave for a given wavelength λ , the output of the ith neuron in the lth plane can be expressed as
n p l ( x , y , z , λ ) = w i l ( x , y , z , λ ) · t i l ( x i , y i , z i , λ ) · m i l ( x , y , z , λ ) ,
where m i l ( x , y , z , λ ) is the input complex amplitude of the neuron and equals to the linear superposition of the diffracted complex amplitudes from all neurons in the l 1 th plane.
m i l ( x , y , z , λ ) = k n k , i l 1 .
t l ( x , y , z , λ ) is complex amplitude transmission of lth diffractive element at wavelength λ m .
t l ( x , y , z , λ ) = a l ( x , y , z , λ ) exp j ϕ l ( x , y , z , λ ) .
w i l ( x , y , z , λ m ) represents the propagation of the light wave between two adjacent planes, which can be described using the Rayleigh–Sommerfeld equation,
w i l ( x , y , z , λ ) = z z i r 2 1 2 π r + 1 j λ exp j 2 π r λ ,
where r = x x i 2 + y y i 2 + z z i 2 and j = 1 . A detector at the output plane measures the intensity of the resulting optical field,
I i = k = 1 K σ λ k · I i λ k = i = 1 K σ λ k · m i M + 1 2 ,
where K refers to the number of channels of the spectral datacube and σ λ k is the spectral response function of the CMOS detector at wavelength λ k .
As shown in Figure 3b, we choose multilevel diffractive optical elements (DOE) as the diffractive element of the DNN, which are phase-only elements that offer the advantage of minimal energy loss. Therefore, a l ( x , y , z , λ ) is 1, and complex amplitude transmission is t l ( x , y , z , λ ) = exp j ϕ l ( x , y , z , λ ) . The proposed architecture is also compatible with other types of diffractive elements. At a given wavelength, the phase introduced by the DOE can be expressed as
ϕ ( x i , y i , λ ) = 2 π λ n λ 1 h ( x i , y i ) ,
where n λ is the refractive index corresponding to wavelength λ , and h ( x i , y i ) is the height profile of the DOE at position ( x i , y i ) . The height profile of DOE can be mathematically expressed as
h ( x i , y i ) = h b h l ( x i , y i ) ,
where h b is the thickness of the substrate, and h l ( x , y ) is the DOE etching map at position ( x , y ) . To determine the etching depth at each position, we set the phase difference range corresponding to the central wavelength with a range of 0 to 2 π , and define the maximum etching depth as the etching depth corresponding to a phase difference of 2 π at the central wavelength. The maximum etching depth can be expressed as
h l m a x = λ c n λ c 1 ,
where λ c is the central wavelength, and n λ c is the refractive index of the medium corresponding to the central wavelength. An etching weight matrix W ( x , y ) is defined here as a trainable parameter, with values constrained between 0 and 1, and the etching map of the DOE can be expressed as
h l ( x i , y i ) = h l max W ( x i , y i ) .
In the above forward propagation model, the light in each wavelength channel is spatially coherent, meaning there is a stable phase relationship between any two points on a given plane. The proposed architecture can also be extended to spatially incoherent light. Typical approaches for modeling incoherent light include the random phase superposition method, mode decomposition, and the convolution-based method. The random phase superposition method approximates incoherence for a single input example by averaging the output intensity patterns from numerous coherent input fields with random phase distributions [18,19]. The mode decomposition method decomposes an incoherent scene into multiple coherent point sources, and the propagation result of the optical field is equal to the linear superposition of the propagation of each point source. The core idea of the convolution-based method is that, under the assumption of a linear and shift-invariant system, the propagation result of the optical field can be regarded as the convolution of the scene with the system’s point spread function (PSF). As shown in the Table 1, the three modeling methods are compared in terms of computational complexity and applicable conditions.
Spatially incoherent light modeling can enhance the application prospects of the proposed framework in passive scenarios such as remote sensing and security [20]. However, compared to coherent light illumination, the computational burden under incoherent light conditions will increase [21], but it can be alleviated through parallel computing and other methods.

2.3. Dataset Generation and Training of DNN-SOD

DNN-SOD requires multi-spectral data of the scene as training samples. In this paper, we validate the principles and feasibility of DNN-SOD by constructing a multi-spectral dataset based on the MNIST (Modified National Institute of Standards and Technology) handwritten number dataset. The process of generating datasets is shown in Figure 4. First, the data in the MNIST dataset is resized and binarized. For a particular class of handwritten digits, we assume that all non-zero pixels have the same spectral feature. The spectral characteristics are randomly generated with values between 0 and 1 for each wavelength. The binarized image is multiplied by the corresponding value in the spectral curve for each wavelength, yielding the intensity distribution for that wavelength. A three-dimensional spectral data cube is obtained by stacking the intensity distributions for each wavelength along the spectral dimension. A total of 60,000 spectral data cubes were generated, each with dimensions of M × N × C , where M × N represents the spatial dimensions and C is the number of channels in the spectral data cube. The dataset was divided into training, validation, and test sets in a ratio of 8:1:1.
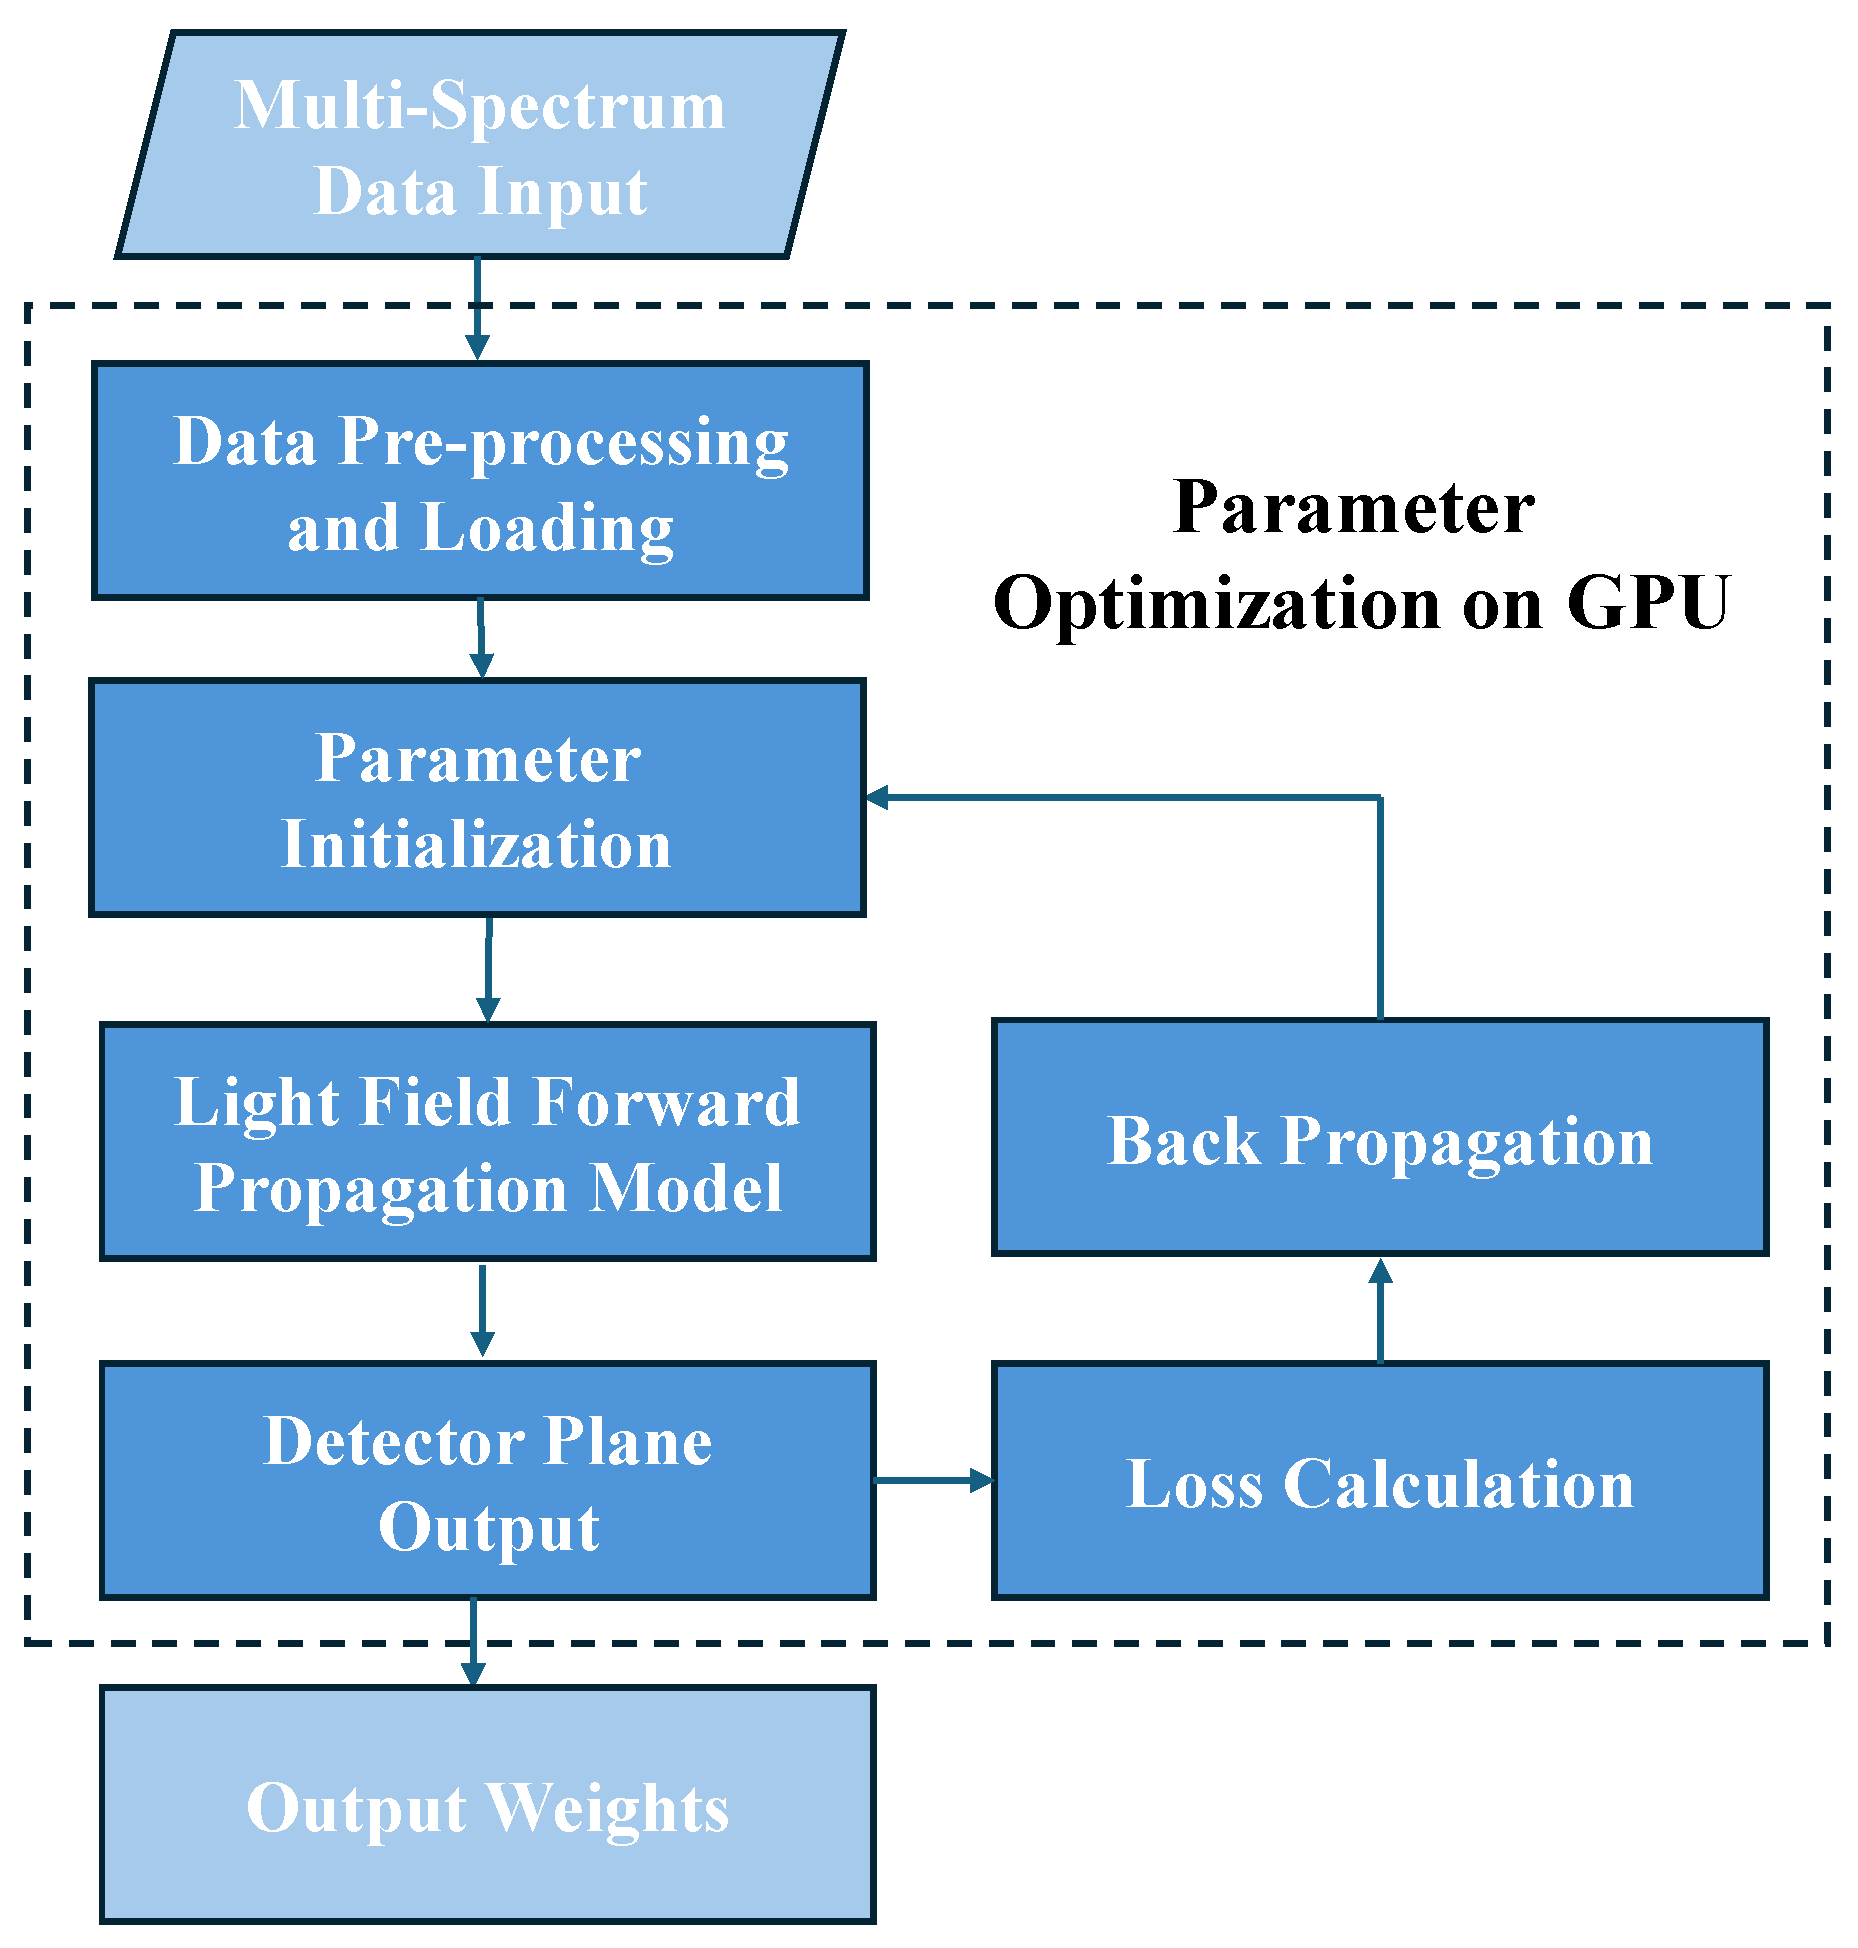
Similarly to electronic neural networks, the weights of DNN-SOD also require training. The difference is that in DNN-SOD, the weights refer to optical parameters such as the phase distribution of DOE. The forward propagation model of DNN-SOD is described by the multidimensional optical field propagation, whereas the backpropagation process employs a gradient descent algorithm similar to that used in electronic neural networks. As shown in Figure 5, multi-spectral data is fed into the forward propagation model, and the output results are compared with the ground truth to compute the loss. The gradient descent algorithm is used for backpropagation to optimize the weight parameters. These parameters will guide the subsequent fabrication of the DOE.
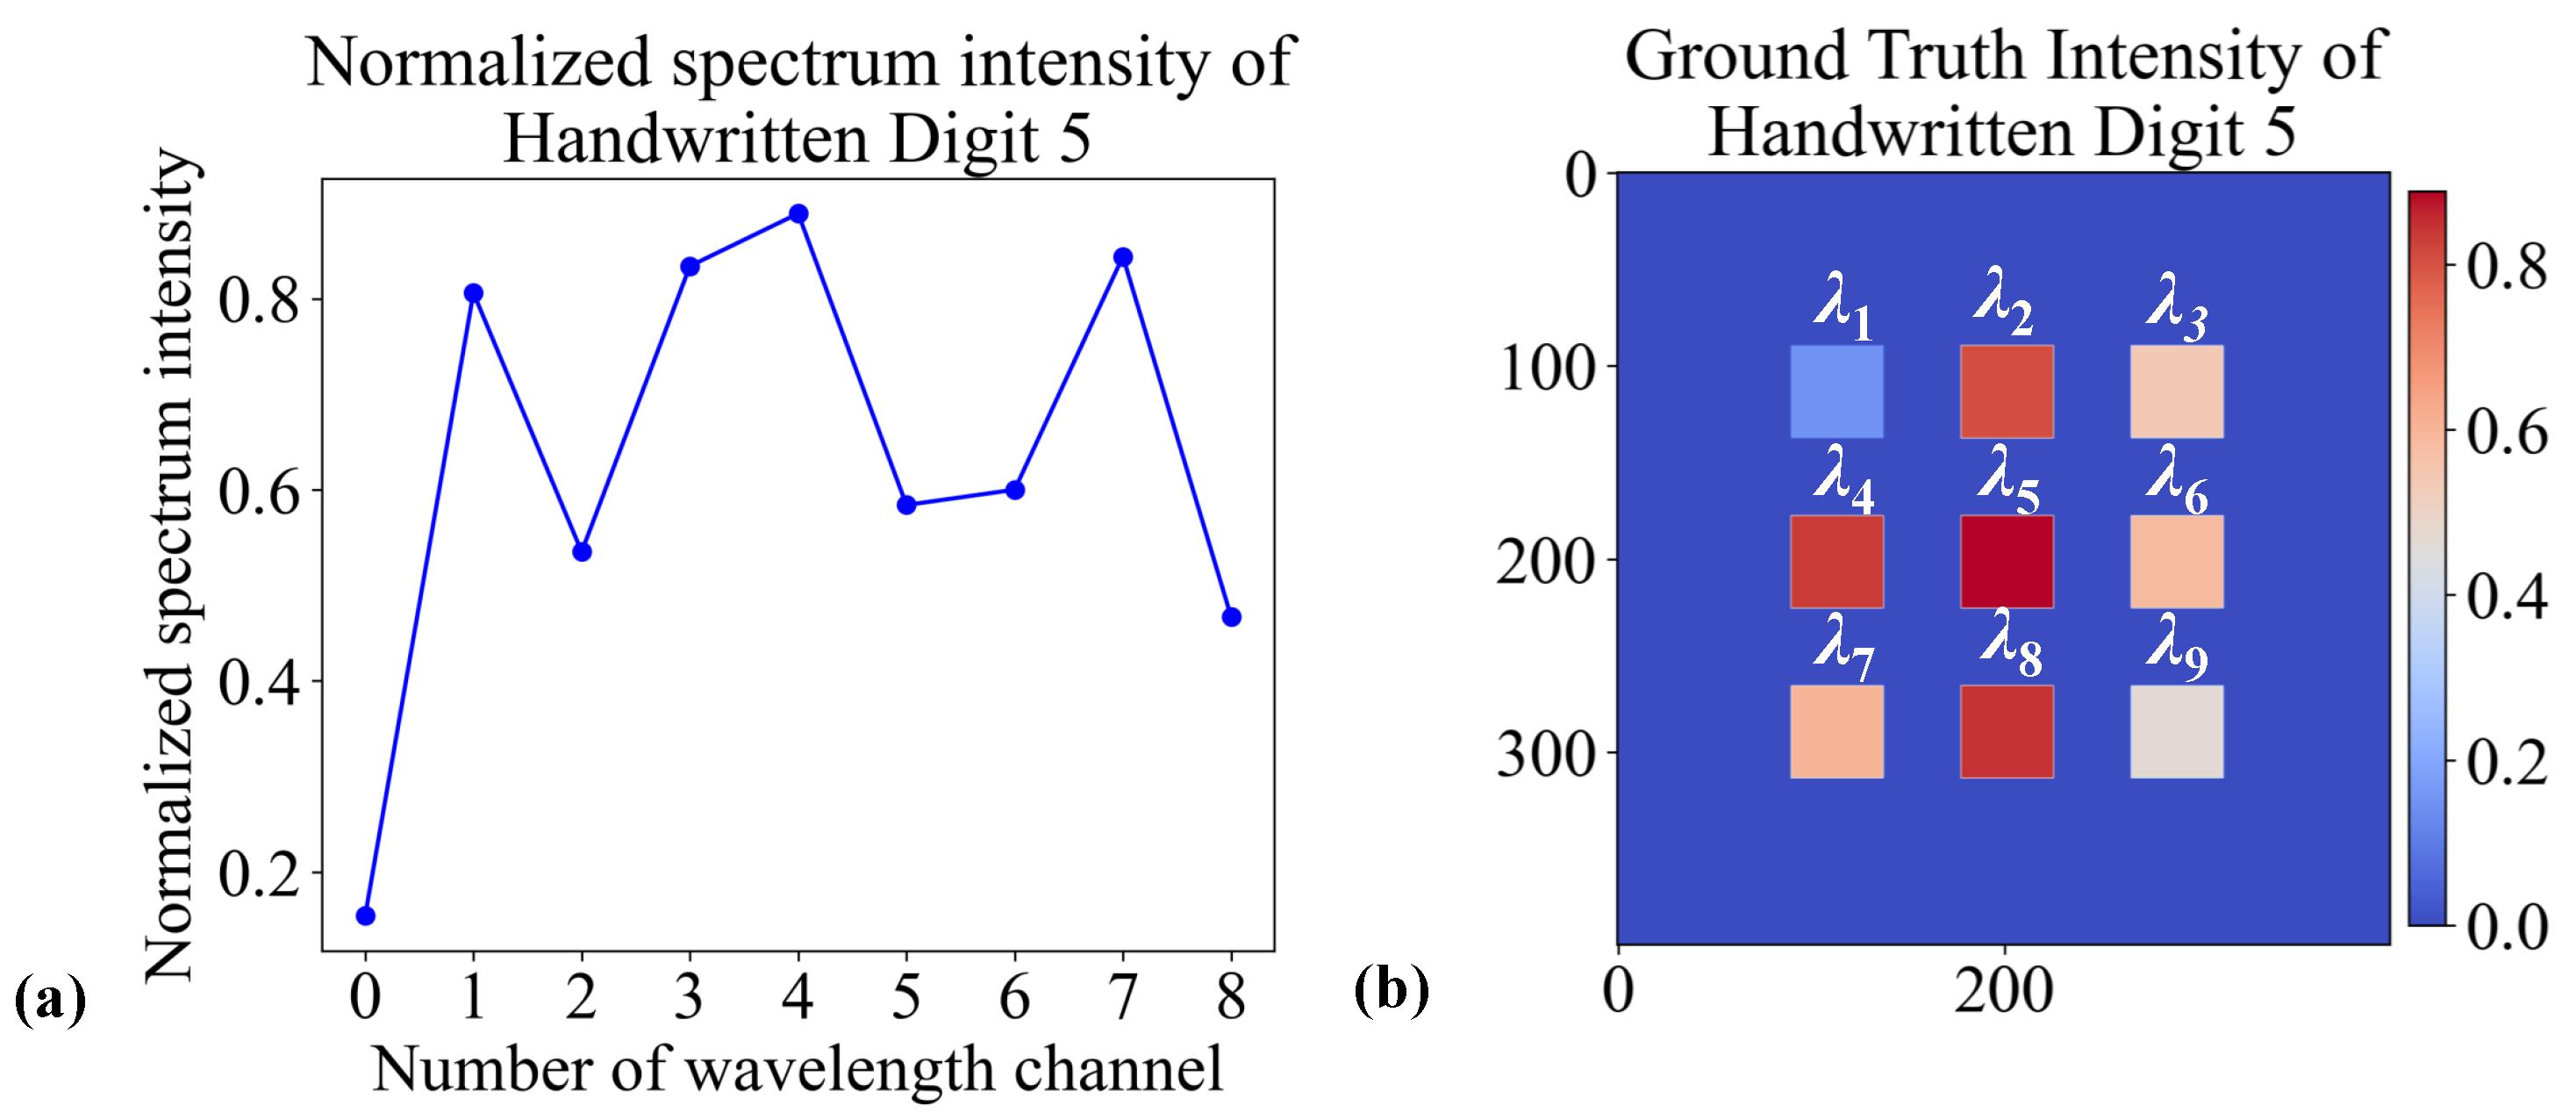
We define the ground-truth light intensity I gt on the detector plane for each class of handwritten numbers. The normalized spectral intensity of handwritten digit “5” is shown in the Figure 6a. As shown in Figure 6b, we divide the detector surface into nine sub-regions corresponding to nine wavelength channels. In the generated dataset, since each non-zero pixel of a specific handwritten digit has the same spectral curve in the spatial domain, the ground truth light intensity for each detector sub-region on the surface should be proportional to the intensity at the corresponding wavelength in the spectral feature curve. Therefore, the true light intensity value for a sub-region is set to the intensity value corresponding to the wavelength in the spectral curve, while the light intensity in the remaining areas outside the sub-region is set to 0.
To ensure both the distinguishability of the detector’s output and the accuracy of the computed spectral curve, we define two types of mean squared error (MSE) loss, which can be expressed as
L intensity = MSE ( I measurement , I gt ) ,
L curve = MSE ( f measurement , f gt ) ,
where I measurement , I gt , f measurement , and f gt represent the detector’s measured intensity and the ground truth intensity, as well as the calculated and true values of the spectral curve, respectively. During the backpropagation, the Adam optimizer is used to update the etching weight matrix of the multi-layer diffractive plane in DNN-SOD with a linear combination of two loss functions,
L = α · L intensity + β · L curve ,
where α and β are the weighting factors.

3. Results

3.1. Preliminary Validation on the Multi-Spectrum MNIST Dataset

In this article, we validate the proposed architecture in the near-infrared band, selecting a central wavelength of 1550 nm, with a spectral resolution of 20 nm, and defining a total of 9 spectral channels. The spectral bands in the multi-spectral data cube are 1470 nm, 1490 nm, 1510 nm, 1530 nm, 1550 nm, 1570 nm, 1590 nm, 1610 nm, and 1630 nm, respectively. The corresponding refractive indices of the medium are 1.4450, 1.4447, 1.4445, 1.4443, 1.4440, 1.4438, 1.4435, 1.4433, and 1.4431, respectively. The architecture proposed in this article is also applicable to other electromagnetic spectral bands and can be flexibly adjusted in terms of spectral resolution and the number of spectral channels according to the specific application requirements. For generating the multi-spectral dataset, the images in the MNIST dataset are first padded from 28 × 28 to 400 × 400, and the multi-spectral dataset is constructed using the method described in the previous section. As shown in Figure 4, the spectral features for each handwritten digit class are generated. The DNN in this article consists of three layers of diffractive elements, with each neuron having a size of 8 μm × 8 μm and each layer containing 400 × 400 neurons. According to the half-cone diffraction angle formula, achieving full connectivity in the DNN requires that the distance between adjacent layers meet certain conditions. Nine sub-regions are defined in the detector plane, with each sub-region corresponding to a specific wavelength.
We employ Adam to train the diffractive element parameters, with an initial learning rate of 0.01, which decays to 80% of its previous value every 10 epochs. Based on empirical experience and a review of the relevant literature, we set the two constants α and β at 100 and 1, respectively. The model was implemented using Python version 3.8.0 and the PyTorch framework (version 2.1). We use a desktop computer equipped with an NVIDIA GeForce RTX 3080 GPU and an Intel(R) Core(TM) i9-12900K CPU to train the model.
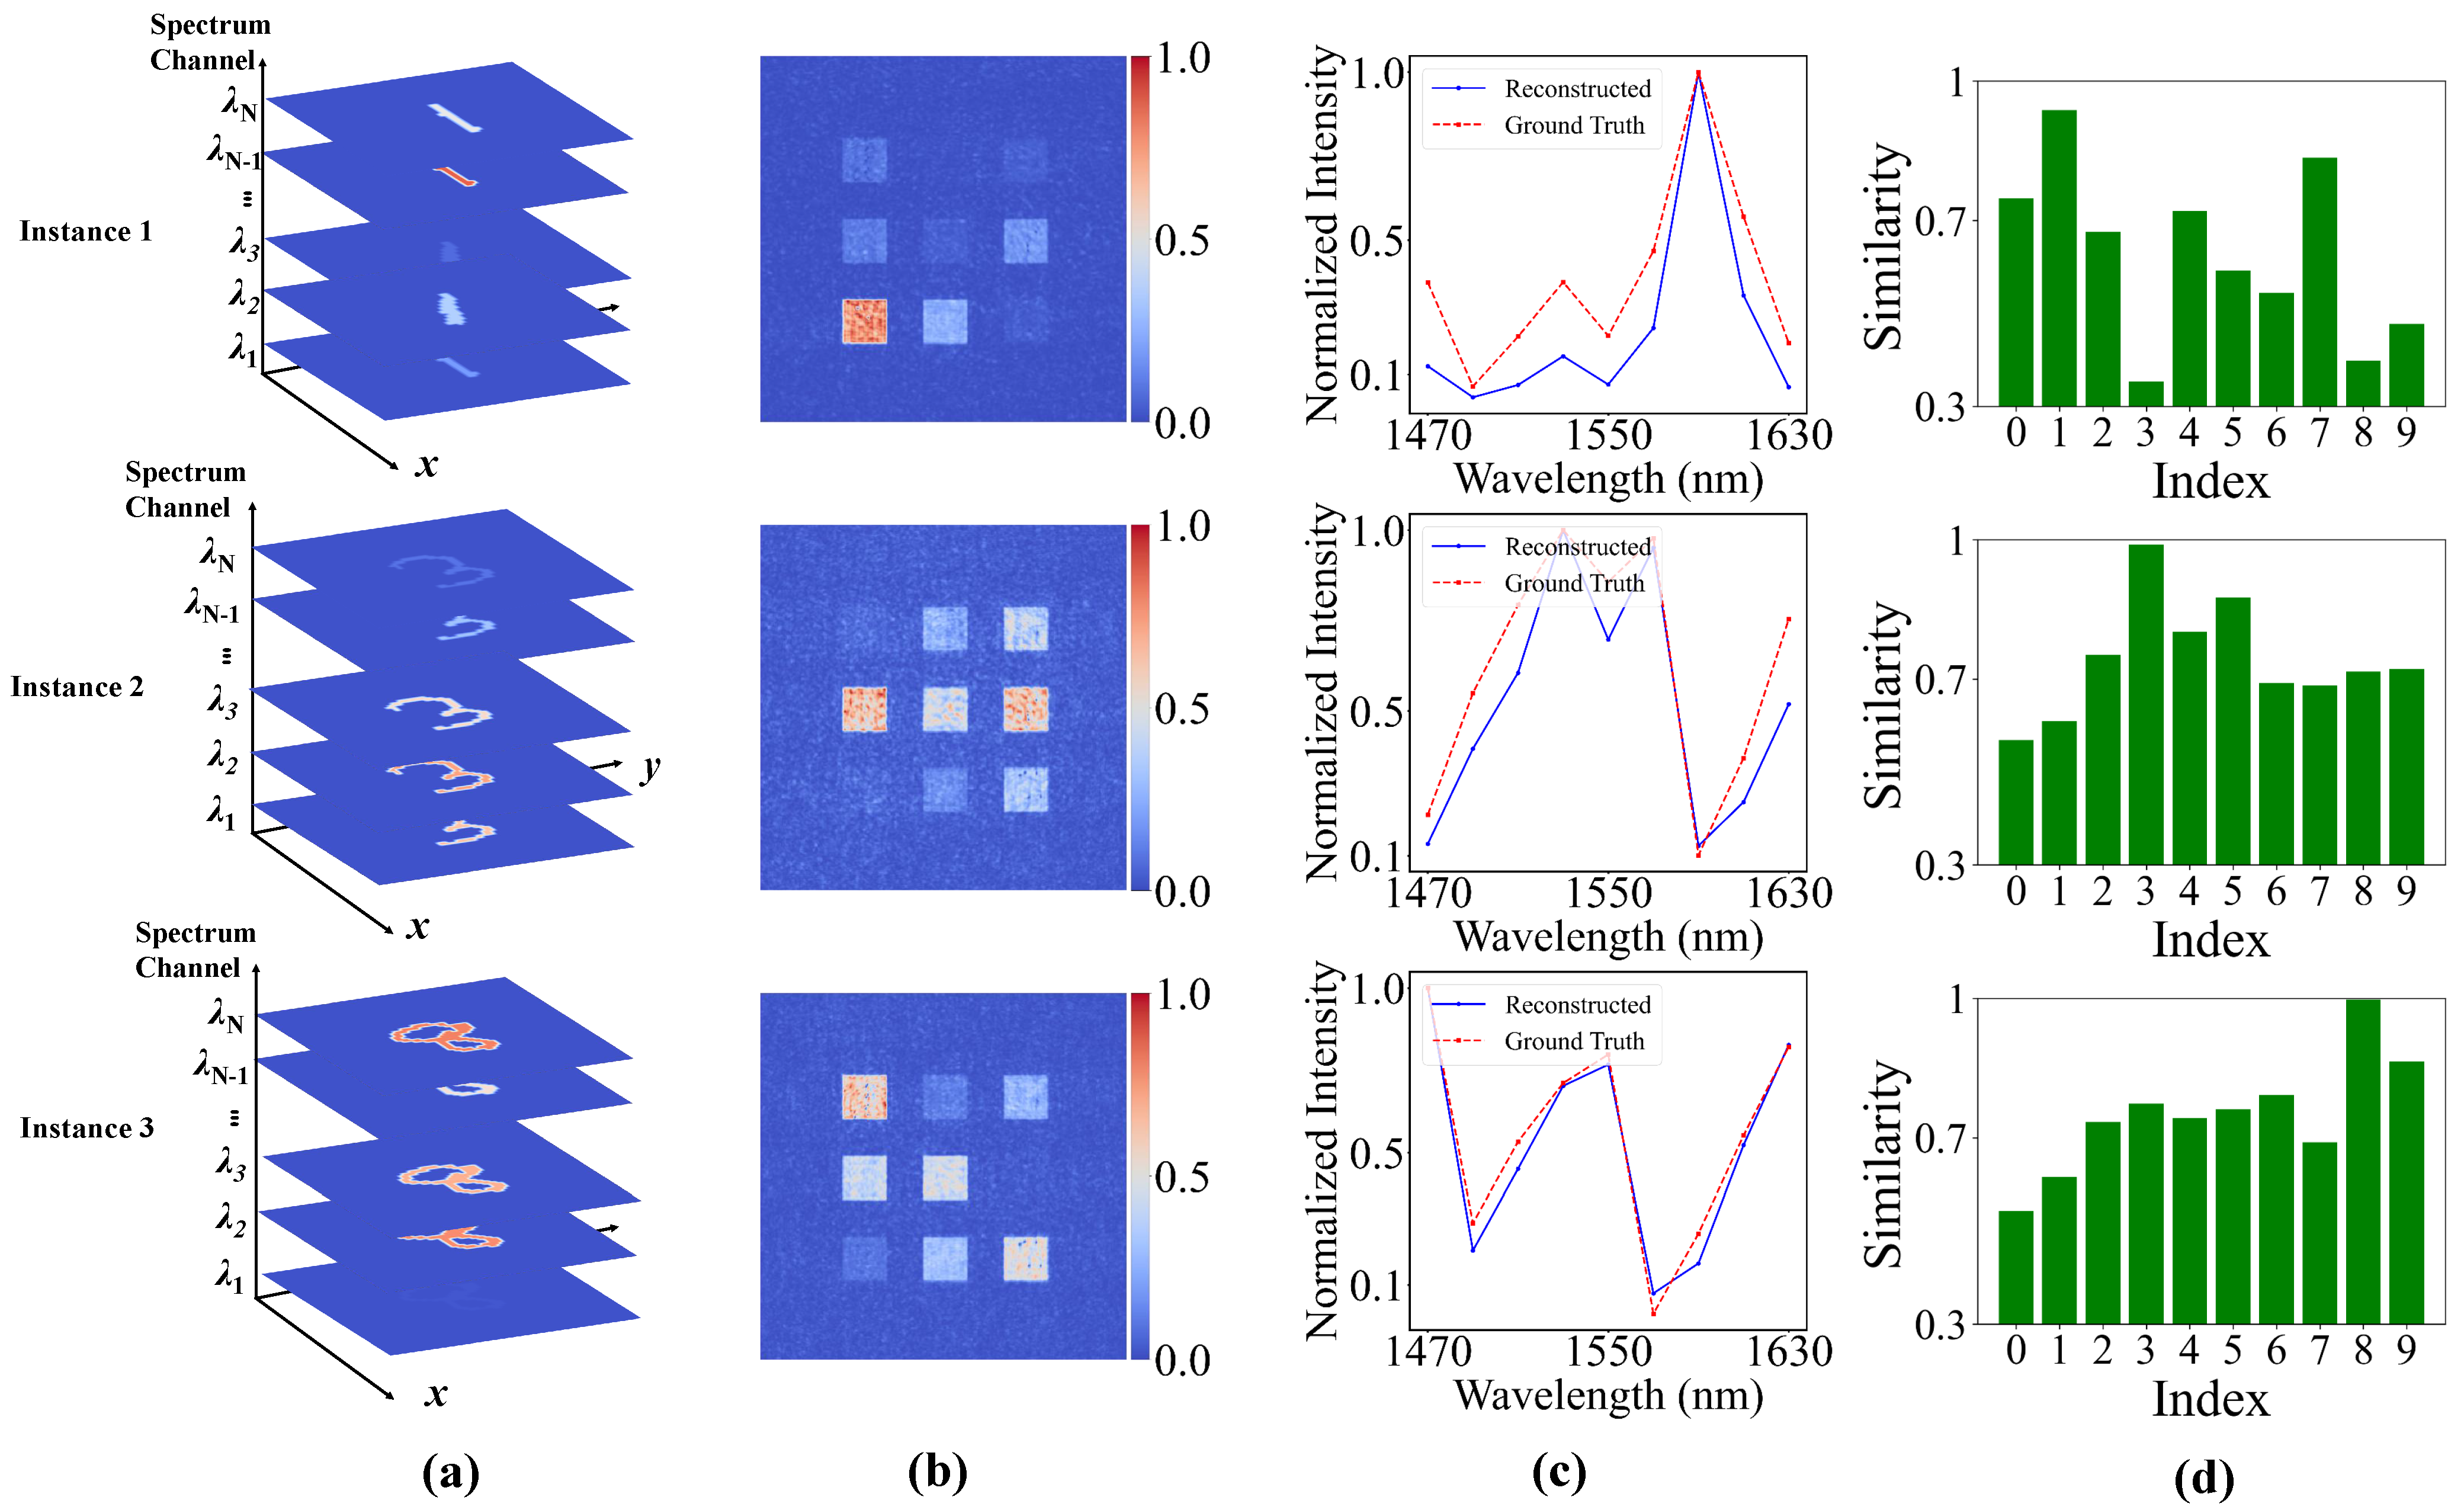
The test results are shown in Figure 7. Figure 7a presents the spectral data of selected handwritten digit inputs. The intensity distribution on the detector is measured after the handwritten digits’ spectral data cubes pass through the DNN-SOD architecture. As shown in Figure 7b, different spectral components are directed to designated regions of the detector through the dispersion control of DNN-SOD. By calculating the total intensity in each sub-region, the spectral characteristic distribution curve shown in Figure 7c can be obtained. By comparing the computed spectral characteristic curves with the ground truth spectral characteristic curves of different handwritten digits, a similarity characteristic vector is obtained, as illustrated in Figure 7d. This feature vector is then processed through a Softmax operation to determine the classification result of the handwritten digit. The test set contains 5000 spectral data cubes, with 4578 correctly identified, resulting in an accuracy of 91.56%.
The DOEs are manufactured on a 1 mm thick quartz substrate using photolithography. During the training process, the etching weights are treated as trainable variables, and the etching depth at each pixel of the DOE is obtained by multiplying the etching weights by the maximum etching depth. As shown in Figure 8, the etching weights of the trained three-layer DOE are presented, where the maximum etching depth is 3.39 μm and the minimum etching depth is 0. The diffraction efficiency is a key performance metric of DOEs. In this work, phase-only DOEs are employed, which theoretically can achieve a diffraction efficiency of 1. However, in practical nanofabrication, the phase needs to be quantized, which reduces the diffraction efficiency. For an Q-bit quantized phase DOE, the diffraction efficiency as a function of the quantization level can be expressed as
η = sin ( π / 2 Q ) π / 2 Q 2 ,
where Q is the number of phase quantization bits. On the basis of the above expression, the diffraction efficiencies of DOEs with different bit quantizations are listed in the Table 2. In practical fabrication, considering both the diffraction efficiency and the fabrication complexity and cost, a 3-bit DOE is typically chosen.

3.2. Validation on Dataset with Infrared Targets

After validating the theoretical feasibility of DNN-SOD using multi-spectral data based on handwritten digits, we further verified the effectiveness of the DNN-SOD architecture on data with infrared targets. We evaluated the effectiveness of DNN-SOD on two distinct infrared datasets. The first dataset is constructed from existing infrared data [22], while the second is a multi-spectral infrared target dataset acquired using a near-infrared camera equipped with bandpass filters. These two datasets provide complementary validation scenarios that allow us to assess the robustness of the proposed method under various infrared imaging conditions. We hereafter refer to these two datasets as Dataset I and Dataset II for clarity.
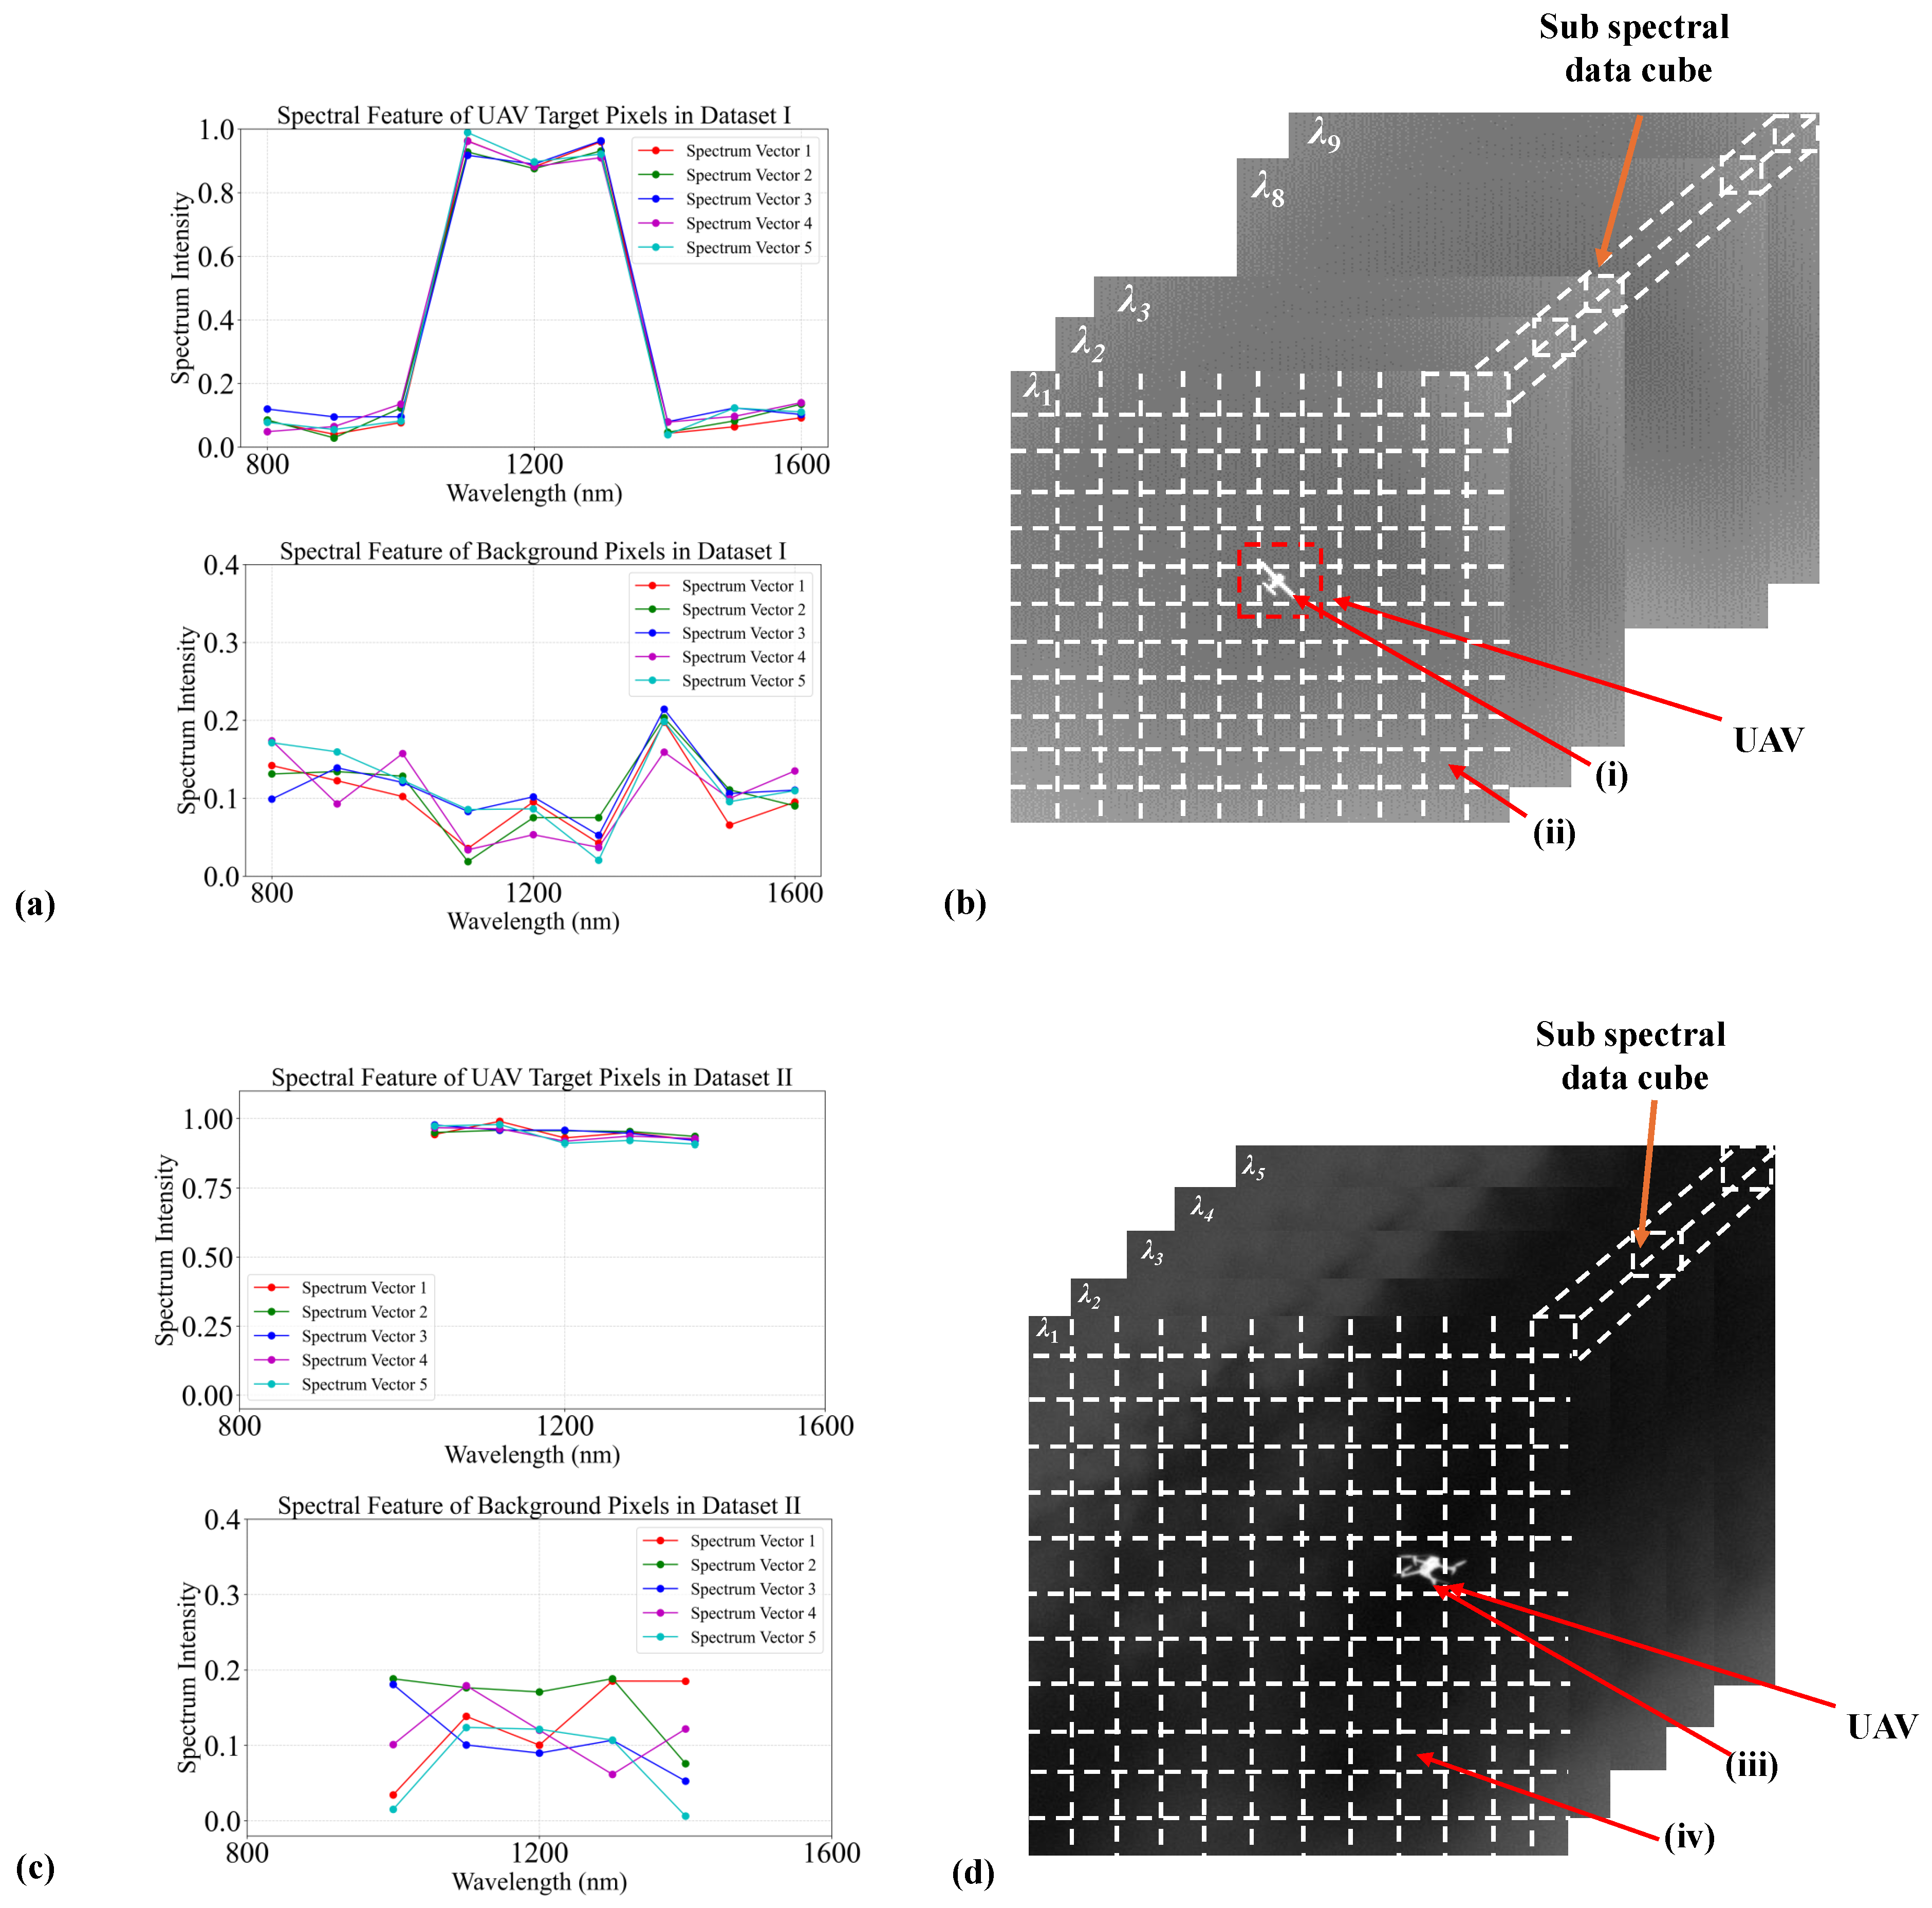
For Dataset I, we constructed the data based on existing infrared imagery. The targets and backgrounds were first separated, and two spectral curves were defined to represent the baseline spectral characteristics of the targets and background, respectively. Before assigning the spectral curves to each spatial pixel, we added a random vector of the same dimension, with values ranging from 0 to 0.08, in order to better simulate a multi-spectral data cube. For Dataset II, we employed an InGaAs infrared camera in combination with bandpass filters to capture real multi-spectral infrared target data. As illustrated in Figure 9a,c, we visualize the spectral curves of randomly selected pixels from targets and backgrounds in the two datasets.
As shown in Figure 9b,d, for both Dataset I and Dataset II, we divide the spectral data cube of the scene along the spatial dimension into multiple sub-spectral data cubes. The training, testing, and validation sets are divided according to a ratio of 6:2:2. The spatial dimension of the hyperspectral datacube is 300 × 300, and after slicing, the size of each sub-spectrum datacube is 25 × 25. As shown in Table 3, the number of channels, central wavelengths, data dimensions, and other relevant information for the two datasets are summarized. We train the parameters of DNN-SOD separately using the two datasets.
We set sub-regions on the detector plane corresponding to the number of channels of the dataset., each representing a different wavelength channel. The ground truth intensity for each sub-region and spectral distribution curves for each sub-spectral cube are calculated on the basis of the ratio of the sum of the grayscale values of each channel. Each subspectral data cube undergoes spectral analysis according to the previously described process.
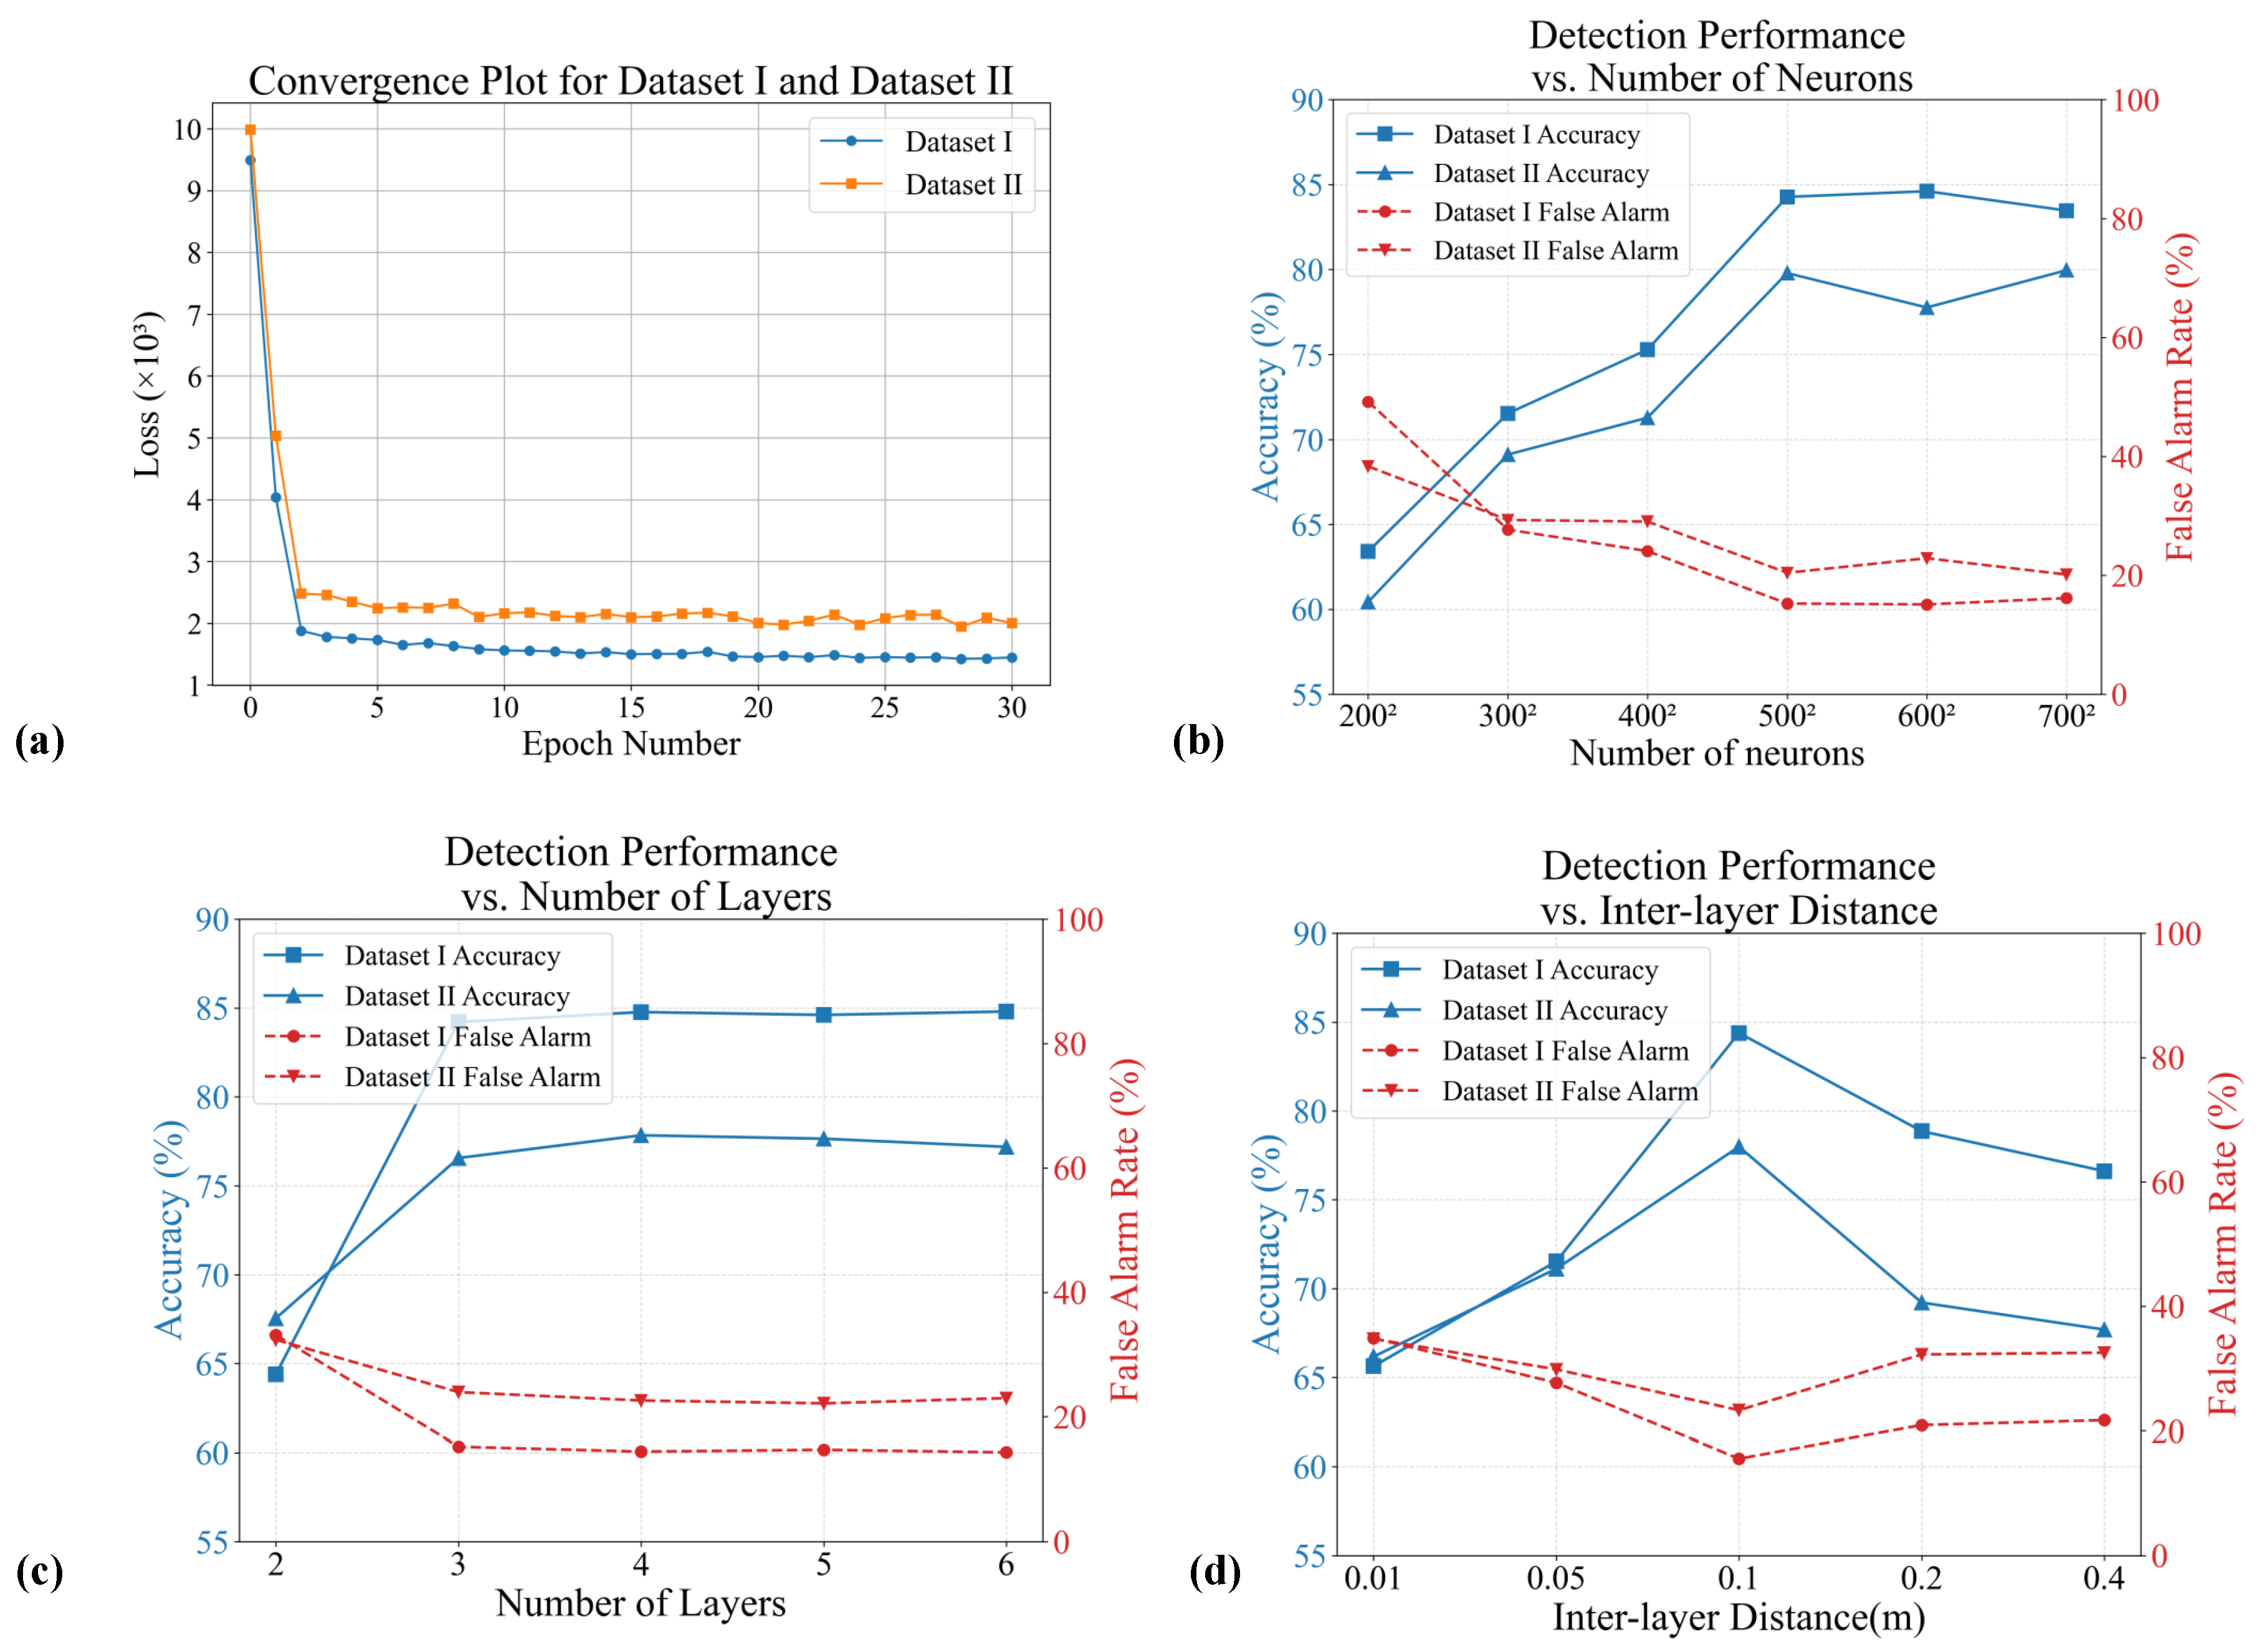
During the training on Dataset I and Dataset II, we trained the models for 30 epochs with batch sizes of 16 and 8, respectively, and the corresponding convergence curves are shown in Figure 10a. The key hyperparameters of DNN-SOD are the number of DOE neurons, the number of DOE layers, and the inter-layer spacing. In our experiments, we made the underlying assumption that the performance variations in DNN-SOD are primarily caused by the parameter under investigation. Therefore, we adopted a controlled experimental design in which only one variable was changed at a time while all other factors were kept fixed. We use accuracy and false alarm rate as evaluation metrics to investigate the impact of these parameters on DNN-SOD, and the results are shown in Figure 10b–d. For both Dataset 1 and Dataset 2, increasing the number of neurons and layers in DNN-SOD initially improves the performance metrics, which then stabilize. This is because, as the number of neurons and layers increases, the performance of DNN-SOD approaches its theoretical limit, which is consistent with its linear mathematical model. As the interlayer spacing increases, the performance of DNN-SOD exhibits an initial improvement followed by a decrease. The gradual improvement can be attributed to the fact that, as the inter-layer spacing increases, the layers tend to form a fully connected structure, enabling more effective backward propagation of features. However, when the spacing continues to increase, the incidence angles at which neurons receive light from the previous layer become smaller, which in turn degrades the overall system performance. Considering fabrication cost and inter-layer alignment accuracy, the DNN-SOD for infrared target detection in this study consists of three DOE layers, with each layer containing 500 × 500 neurons, and inter-layer distance is 0.1 m.
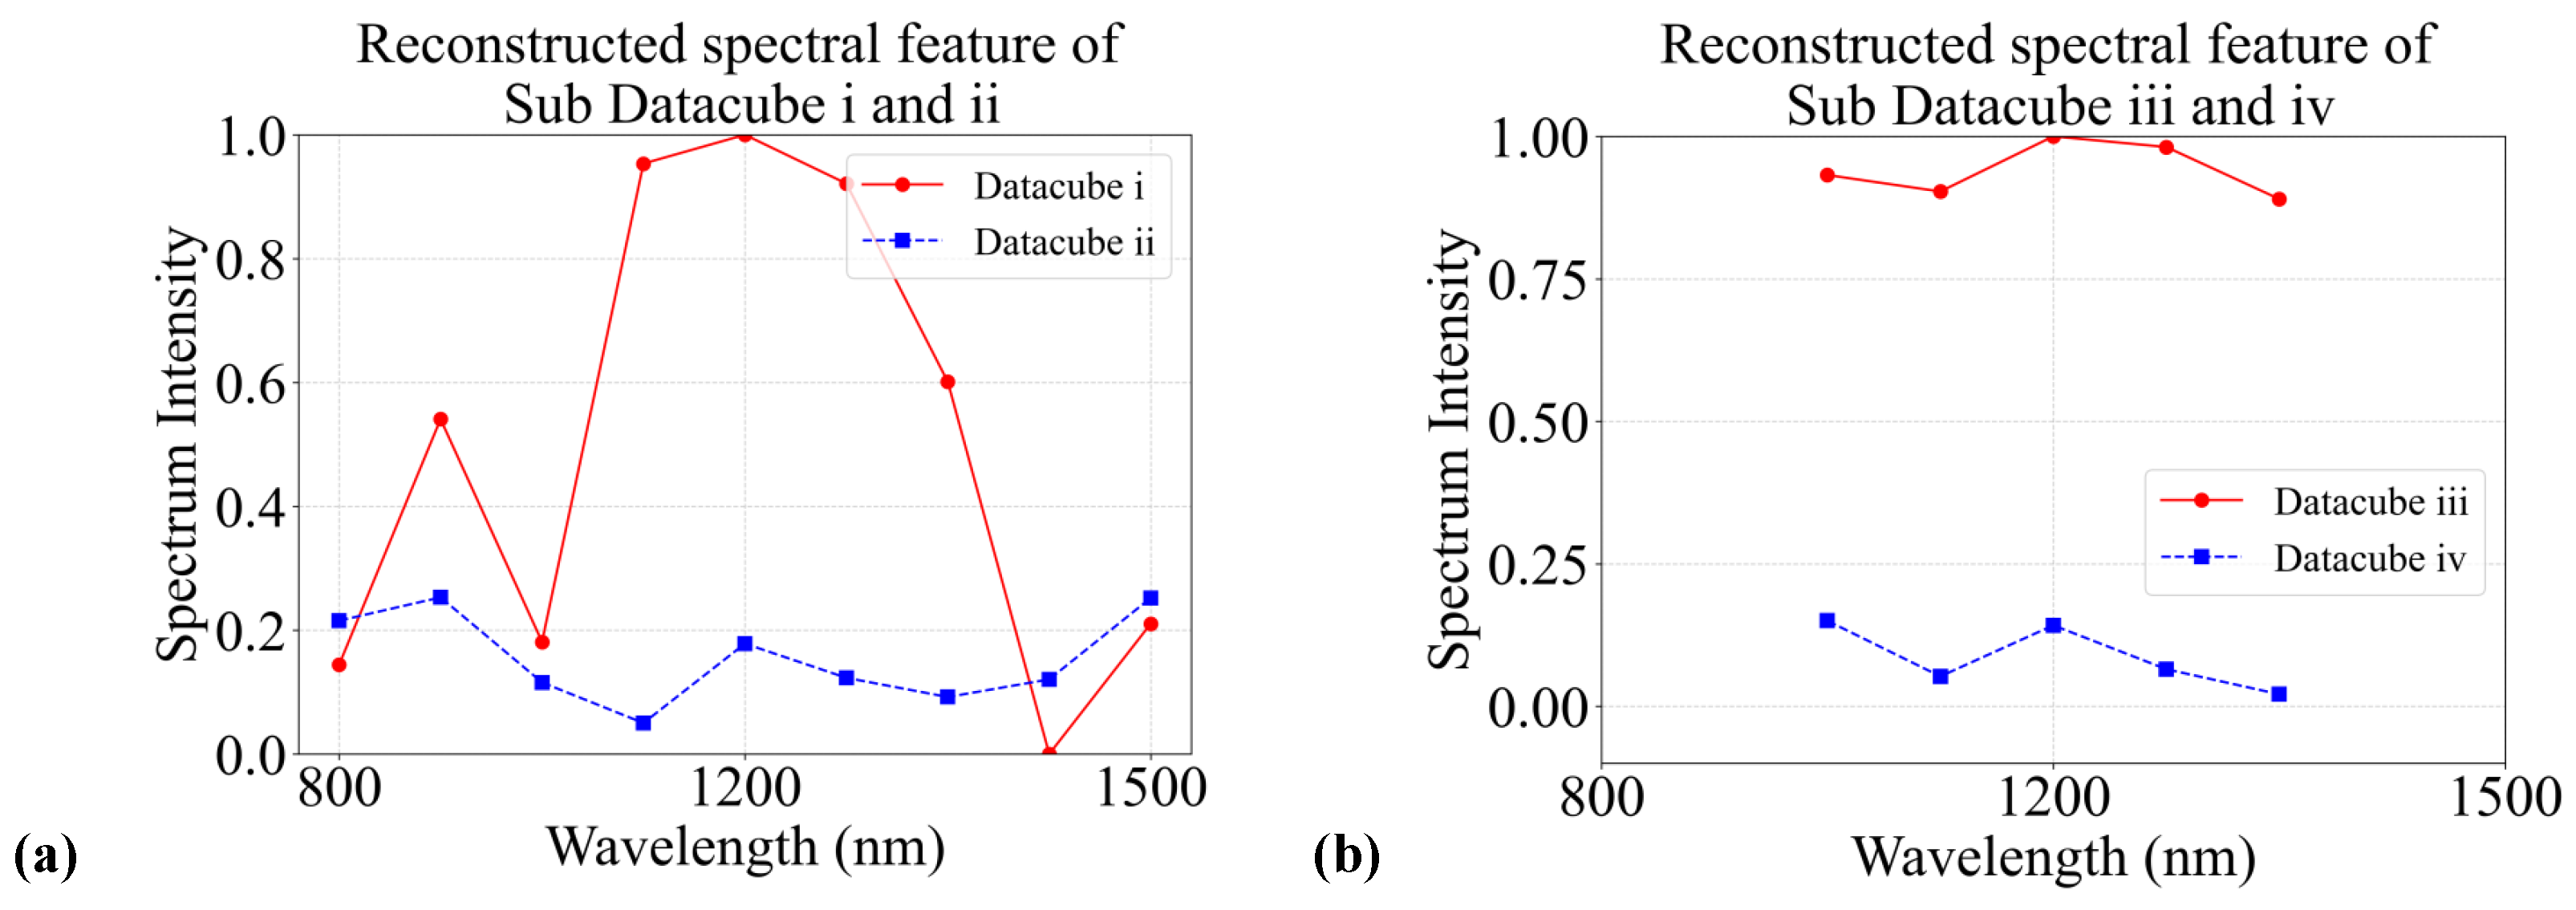
The spectral reconstruction curves processed by DNN-SOD are shown in the Figure 11. Figure 11a presents the reconstruction curves of sub-spectrum data cubes (i) and (ii) from Dataset I, while Figure 11b shows the reconstruction curves of sub-spectrum data cubes (iii) and (iv) from Dataset II. It can be observed from the figure that the energy distributions of the spectral reconstruction curves, both with and without targets, exhibit distinctive characteristics. This validates the feasibility of DNN-SOD for target detection based on spectral features.
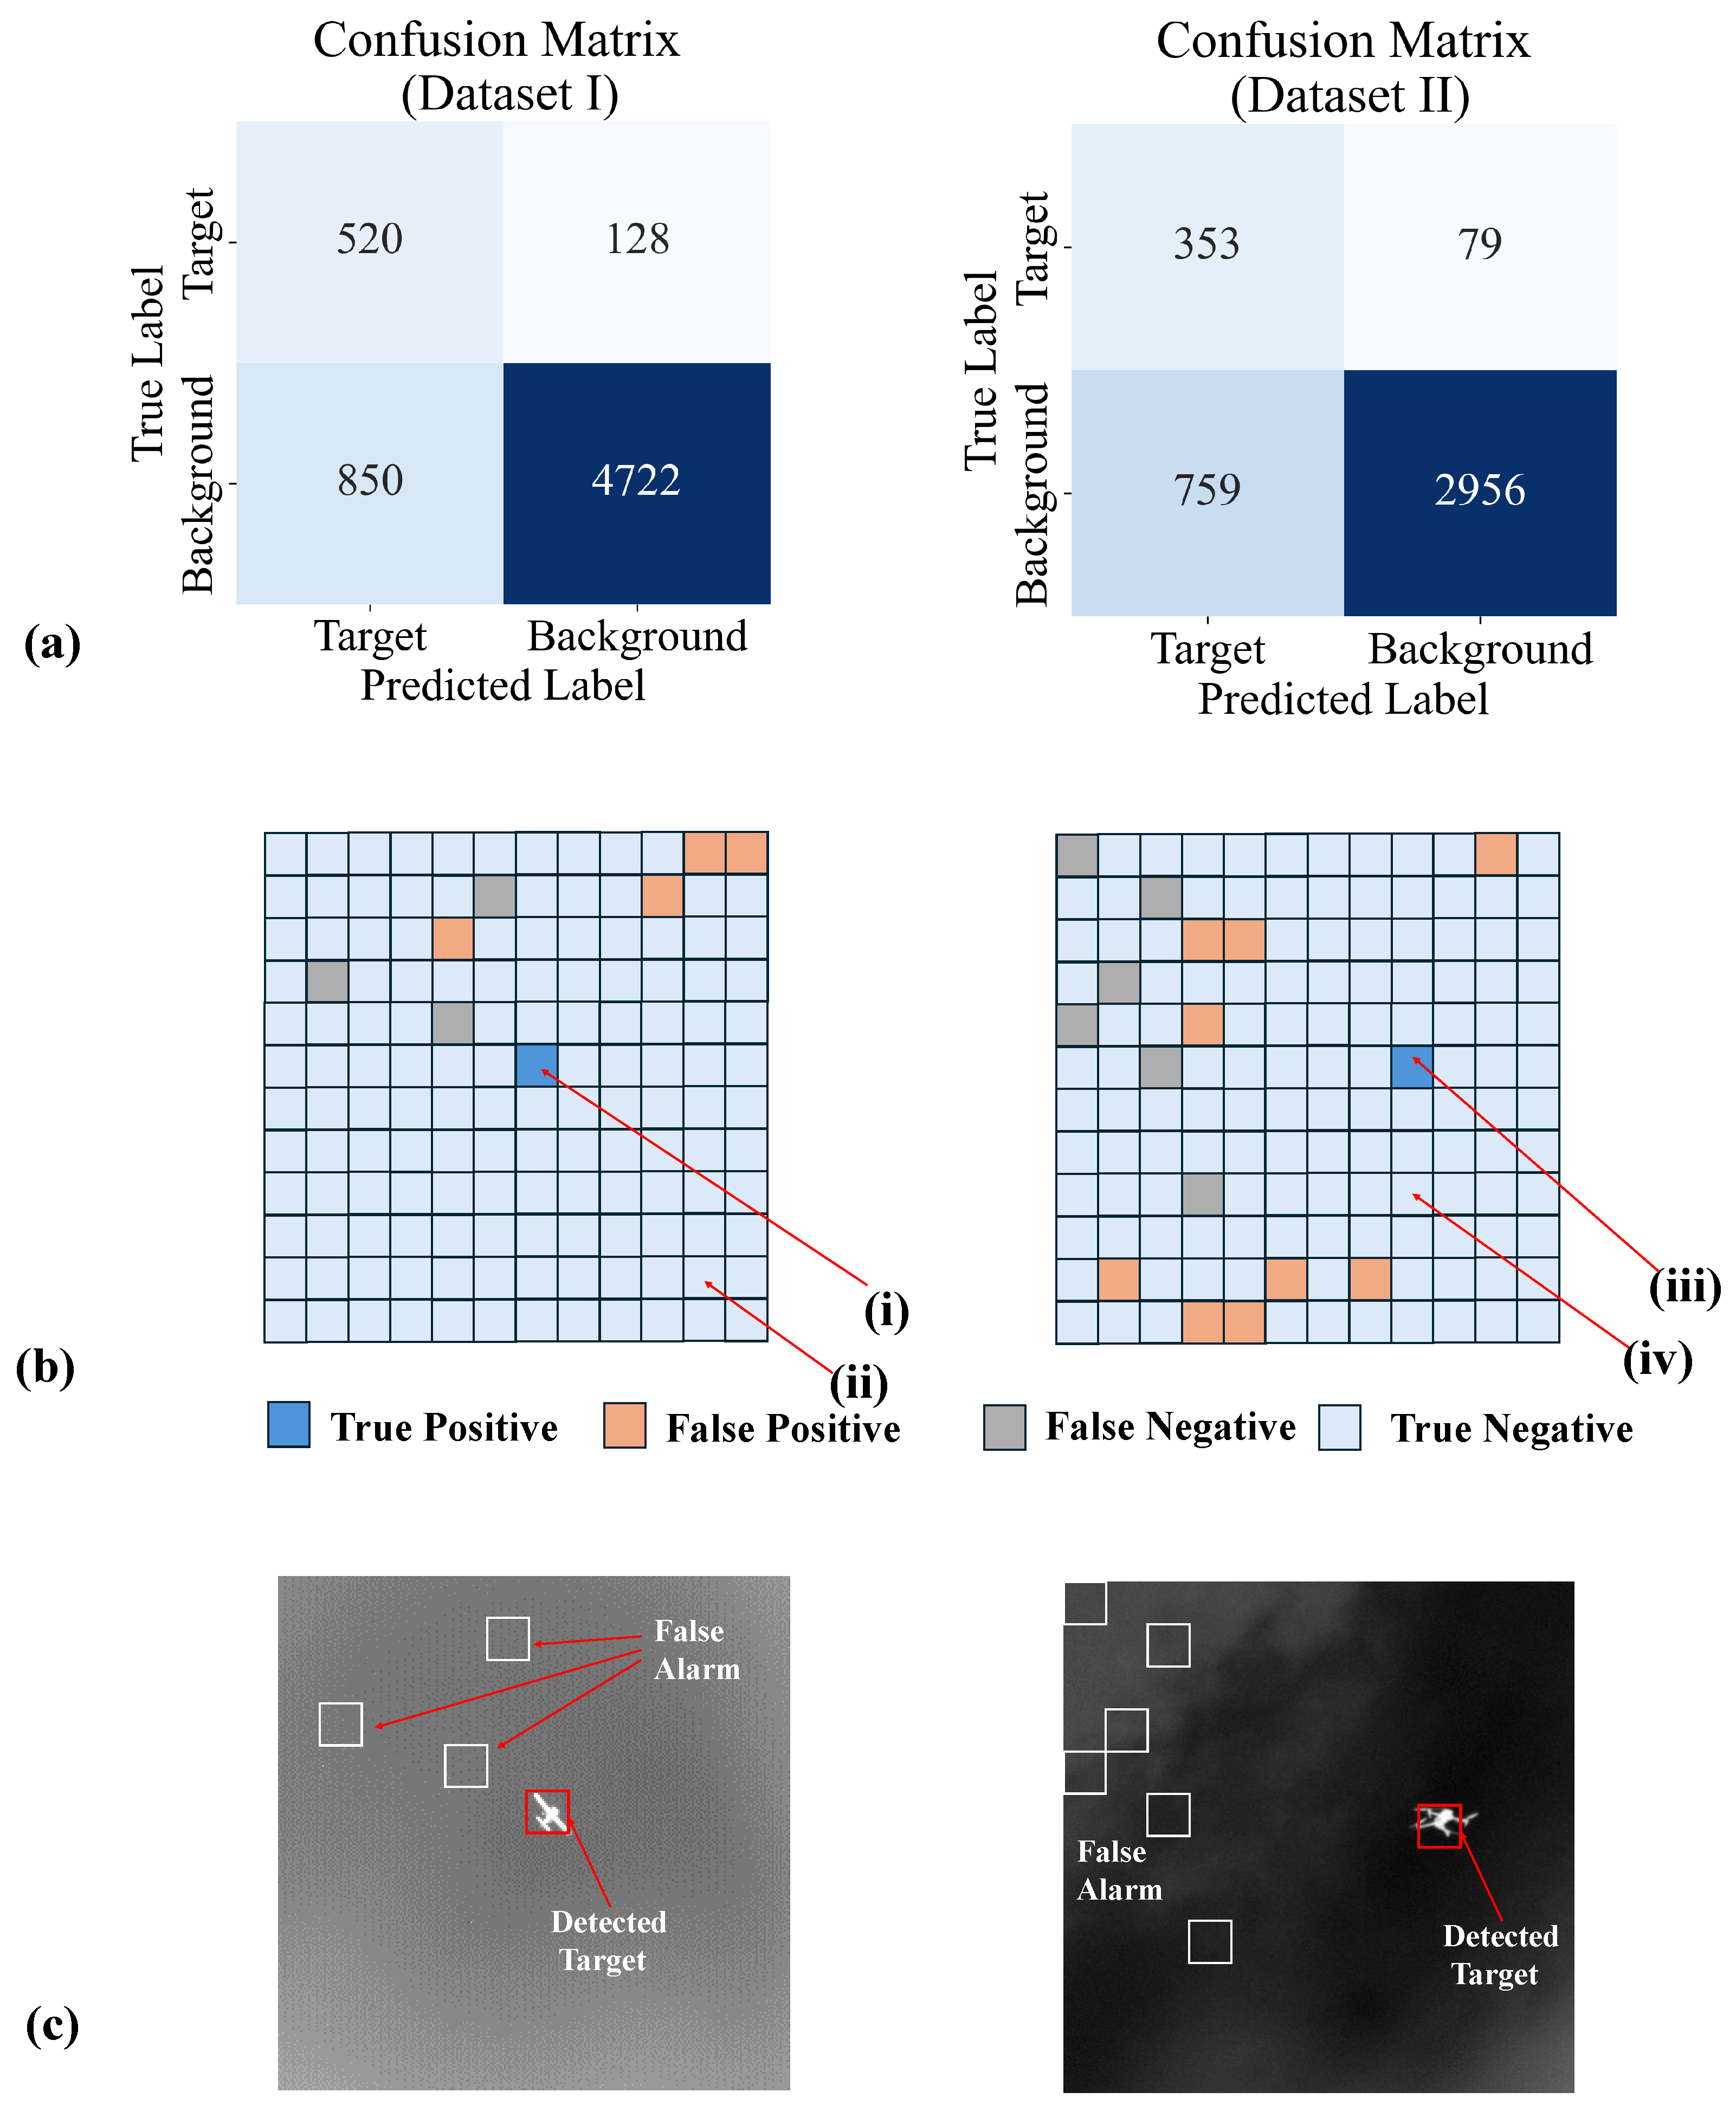
Under the conditions of a three-layer DOE, with each layer containing 500 × 500 neurons and an inter-layer spacing of 0.1 m, the confusion matrices corresponding to Dataset I and Dataset II are shown in Figure 12a. In this case, the accuracies obtained for Dataset I and Dataset II are 84.27% and 79.79%, respectively. The false alarm rates are 15.25% and 20.43% for Dataset I and Dataset II, respectively. Finally, the results of all subspectral data cubes are arranged according to their original positions in the original spectral data cube, thereby achieving target detection. As shown in Figure 12b, the subspectral data cube (i) in Figure 9 is classified as a target, and the subspectral data cube (ii) is classified as a background. As shown in Figure 12c, the visualized detection results for both Dataset I and Dataset II are derived from the outcome corresponding to Figure 12b. It is worth noting that some backgrounds have still been misclassified as targets. In future work, the detection accuracy can be further improved and the false alarm rate reduced by integrating a back-end electrical neural network.
The above results verify the feasibility of using the DNN-SOD architecture to detect targets such as drones. The combination of spectral features and optical computing inference is expected to become an effective solution for target detection in the future. As shown in Table 4, we selected three baseline methods for comparison with DNN-SOD. Among them, DNN is the pioneering work in this field, which first proposed using diffractive optics for information processing [12]. Both PCONN [20] and ICONN [23] try to employ DNN for target detection through classification-based discrimination, which is similar in approach to the methodology in this article. We did not include comparisons with conventional electronic neural networks, as our focus is on exploring the potential of optical neural networks for spectral object detection. Due to fundamental differences in processing paradigms and the early stage of optical neural network development, direct comparisons with electronic networks are beyond the scope of this study. Although DNN-SOD shows lower accuracy compared with these three methods, it distinguishes itself by leveraging multi-band information for computational inference and target detection, in contrast to traditional DNNs that operate under single-band conditions. The relatively lower accuracy of DNN-SOD can be attributed to two main reasons. First, DNN-SOD is designed to handle more complex task scenarios, where the similarity between the background and the target often leads to a higher false alarm rate. Second, when segmenting the spectral data cube, DNN-SOD may split the target into several parts. These two factors place higher demands on the overall architecture. In future work, we plan to enhance the detection performance of DNN-SOD by introducing optical non-linearity and incorporating lightweight electronic neural networks in the backend.

4. Discussion

4.1. Research Implications

In this paper, we propose the DNN-SOD architecture for target detection and validate its feasibility on multi-spectral datasets. The simulation results demonstrate that DNN-SOD has the capability to process multi-spectral data and identify the scene using spectral features. Target detection within the field of view is achieved by sequentially classifying the subspectral data cubes.
To the best of our knowledge, this is the first study to combine optical computing inference with remote sensing spectral data processing, marking a significant advancement in both the fields of optical computing and remote sensing technology. In the optical community, compared to conventional DNN models, which typically focus on spatial information alone, the DNN-SOD utilizes the full spectrum of available data, ensuring that subtle spectral differences are fully exploited to improve detection performance. In the remote sensing community, the introduction of optical computing inference provides a new solution for real-time on-orbit processing of massive remote sensing data. This capability is particularly important for sky-based payloads, where large volumes of data are continuously generated, and timely decision-making is critical. By incorporating optical computing into the target detection pipeline, the DNN-SOD architecture addresses the challenge of processing and analyzing data in real time, making it a valuable tool for future remote sensing missions.
In addition, the proposed architecture offers great flexibility for spectral extension, allowing the selection of wavelength, number of spectral bands, and spectral resolution according to practical requirements. Moreover, current nanofabrication technologies are fully capable of supporting the fabrication of the DOE in DNN-SOD. Since DOEs have already been widely applied to improve image resolution and other fields, their spatial adaptability does not face insurmountable bottlenecks. Therefore, the proposed approach has significant engineering value for practical aerospace remote sensing payloads.

4.2. Limitation and Future Perspectives

Although this study has successfully developed a DNN-based architecture for spectrum object detection and achieved accuracy up to 84.27%, there are several limitations that should be addressed in future research.
Firstly, the two infrared target datasets used in this work have nine and five spectral channels, respectively, which is somewhat limited for fully validating the scalability of DNN-SOD to a larger number of spectral channels. In future work, we plan to create a more comprehensive multi-spectral dataset This dataset will cover a wider variety of environmental conditions, including different geographic locations, seasons, and weather patterns, as well as a broader range of target types. By incorporating more diverse scene data, we aim to enhance the model’s robustness and adaptability, enabling it to handle a wider array of real-world conditions.
Secondly, the functionality of the diffraction neural network in this paper is still quite basic compared to complex electrical neural networks [24,25]. It faces challenges in handling more complex situations, such as when a target is divided into multiple segments during the segmentation process, which may lead to an increased false alarm rate. The main reason for this limitation is the relatively shallow depth and small scale of the current optical neural network. In upcoming research, metasurfaces can be used to construct diffractive neural networks. Metasurfaces offer the potential to dynamically manipulate light fields, further improving the inference performance of the optical neural network. [26]. Moreover, DNN-SOD can also be integrated with an in-sensor back-end [27,28,29] and near-sensor computing [30] to introduce nonlinearity into the architecture. This integrated approach will be capable of tackling complex sensing tasks in a wide range of applications, including infrared target detection, environmental monitoring, and mineral exploration. Moreover, optical computing-based multi-spectral information processing methods can also be integrated with state-of-the-art hyperspectral algorithms to perform a range of tasks, such as super-resolution imaging [31,32,33] and image fusion [34].
In future work, we aim to integrate the DNN-SOD prior to the photonic-to-electronic conversion process of the detector, using IFU for field-of-view segmentation. By leveraging the multidimensional optical fields in natural scenes for computational inference and integrating back-end in-sensor computing and near-sensor computing modules, we aim to create a novel end-to-end optical field multidimensional perception architecture to perform computation and inference tasks tailored to specific application scenarios.

5. Conclusions

In this paper, we propose a DNN-based target detection architecture, where target detection is achieved by reconstructing the spectral characteristics of the target in the optical domain. The performance of DNN-SOD is validated using two infrared multi-spectral datasets containing UAV targets. Experimental results demonstrate that DNN possesses the potential to process spectral data and accomplish target detection tasks, laying the foundation for the development of novel sky-based remote sensing and information processing architectures in the future.

Author Contributions

Conceptualization, Y.M. and S.S.; methodology, Y.M.; software, Y.M.; validation, Y.M.; formal analysis, Y.M. and R.C.; investigation, Y.M. and S.Q.; resources, S.Q.; data curation, Y.M. and S.Q.; writing—original draft preparation, Y.M.; writing—review and editing, Y.M., R.C. and S.S.; visualization, Y.M. and R.C.; supervision, S.S.; project administration, S.S.; funding acquisition, S.S. All authors have read and agreed to the published version of the manuscript.

Funding

This research received no external funding.

Data Availability Statement

Data underlying the results presented in this paper are not publicly available at this time but may be obtained from the authors upon reasonable request.

Conflicts of Interest

The authors declare no conflicts of interest.

References

  1. Liu, Y.N.; Sun, D.X.; Hu, X.N.; Ye, X.; Li, Y.D.; Liu, S.F.; Cao, K.Q.; Chai, M.Y.; Zhou, W.Y.N.; Zhang, J.; et al. The advanced hyperspectral imager: Aboard China’s GaoFen-5 satellite. IEEE Geosci. Remote Sens. Mag. 2019, 7, 23–32. [Google Scholar] [CrossRef]
  2. Chen, L.; Letu, H.; Fan, M.; Shang, H.; Tao, J.; Wu, L.; Zhang, Y.; Yu, C.; Gu, J.; Zhang, N.; et al. An introduction to the Chinese high-resolution Earth observation system: Gaofen-1~7 civilian satellites. J. Remote Sens. 2022, 2022, 9769536. [Google Scholar] [CrossRef]
  3. Deschamps, P.Y.; Bréon, F.M.; Leroy, M.; Podaire, A.; Bricaud, A.; Buriez, J.C.; Seze, G. The POLDER mission: Instrument characteristics and scientific objectives. IEEE Trans. Geosci. Remote Sens. 1994, 32, 598–615. [Google Scholar] [CrossRef]
  4. Fan, Y.; Huang, W.; Zhu, F.; Liu, X.; Jin, C.; Guo, C.; An, Y.; Kivshar, Y.; Qiu, C.W.; Li, W. Dispersion-assisted high-dimensional photodetector. Nature 2024, 630, 77–83. [Google Scholar] [CrossRef] [PubMed]
  5. Tiwary, A.R.; Mathew, S.K.; Bayanna, A.R.; Venkatakrishnan, P.; Yadav, R. Imaging spectropolarimeter for the multi-application solar telescope at Udaipur solar observatory: Characterization of polarimeter and preliminary observations. Sol. Phys. 2017, 292, 49. [Google Scholar] [CrossRef]
  6. Li, B.; Xiao, C.; Wang, L.; Wang, Y.; Lin, Z.; Li, M.; An, W.; Guo, Y. Dense nested attention network for infrared small target detection. IEEE Trans. Image Process. 2022, 32, 1745–1758. [Google Scholar] [CrossRef]
  7. Xiong, P.; Tong, L.; Zhang, K.; Shen, X.; Battiston, R.; Ouzounov, D.; Iuppa, R.; Crookes, D.; Long, C.; Zhou, H. Towards advancing the earthquake forecasting by machine learning of satellite data. Sci. Total Environ. 2021, 771, 145256. [Google Scholar] [CrossRef]
  8. Higuchi, A. Toward more integrated utilizations of geostationary satellite data for disaster management and risk mitigation. Remote Sens. 2021, 13, 1553. [Google Scholar] [CrossRef]
  9. Feldmann, J.; Youngblood, N.; Wright, C.D.; Bhaskaran, H.; Pernice, W.H. All-optical spiking neurosynaptic networks with self-learning capabilities. Nature 2019, 569, 208–214. [Google Scholar] [CrossRef]
  10. Li, C.; Zhang, X.; Li, J.; Fang, T.; Dong, X. The challenges of modern computing and new opportunities for optics. PhotoniX 2021, 2, 20. [Google Scholar] [CrossRef]
  11. Shastri, B.J.; Tait, A.N.; Ferreira de Lima, T.; Pernice, W.H.; Bhaskaran, H.; Wright, C.D.; Prucnal, P.R. Photonics for artificial intelligence and neuromorphic computing. Nat. Photonics 2021, 15, 102–114. [Google Scholar] [CrossRef]
  12. Lin, X.; Rivenson, Y.; Yardimci, N.T.; Veli, M.; Luo, Y.; Jarrahi, M.; Ozcan, A. All-optical machine learning using diffractive deep neural networks. Science 2018, 361, 1004–1008. [Google Scholar] [CrossRef]
  13. Mengu, D.; Tabassum, A.; Jarrahi, M.; Ozcan, A. Snapshot multispectral imaging using a diffractive optical network. Light Sci. Appl. 2023, 12, 86. [Google Scholar] [CrossRef]
  14. Wang, Z.; Chen, H.; Li, J.; Xu, T.; Zhao, Z.; Duan, Z.; Gao, S.; Lin, X. Opto-intelligence spectrometer using diffractive neural networks. Nanophotonics 2024, 13, 3883–3893. [Google Scholar] [CrossRef]
  15. Allington-Smith, J. Basic principles of integral field spectroscopy. New Astron. Rev. 2006, 50, 244–251. [Google Scholar] [CrossRef]
  16. Wright, G.S.; Rieke, G.H.; Glasse, A.; Ressler, M.; Marín, M.G.; Aguilar, J.; Alberts, S.; Álvarez-Márquez, J.; Argyriou, I.; Banks, K.; et al. The mid-infrared instrument for JWST and its in-flight performance. Publ. Astron. Soc. Pac. 2023, 135, 48003. [Google Scholar] [CrossRef]
  17. Yu, H.; Huang, Z.; Lamon, S.; Wang, B.; Ding, H.; Lin, J.; Wang, Q.; Luan, H.; Gu, M.; Zhang, Q. All-optical image transportation through a multimode fibre using a miniaturized diffractive neural network on the distal facet. Nat. Photonics 2025, 19, 486–493. [Google Scholar] [CrossRef]
  18. Suda, R.; Naruse, M.; Horisaki, R. Incoherent computer-generated holography. Opt. Lett. 2022, 47, 3844–3847. [Google Scholar] [CrossRef]
  19. Rahman, M.S.S.; Yang, X.; Li, J.; Bai, B.; Ozcan, A. Universal linear intensity transformations using spatially incoherent diffractive processors. Light Sci. Appl. 2023, 12, 195. [Google Scholar] [CrossRef]
  20. Chen, R.; Ma, Y.; Zhang, C.; Xu, W.; Wang, Z.; Sun, S. All-optical perception based on partially coherent optical neural networks. Opt. Express 2025, 33, 1609–1624. [Google Scholar] [CrossRef]
  21. Filipovich, M.J.; Malyshev, A.; Lvovsky, A. Role of spatial coherence in diffractive optical neural networks. Opt. Express 2024, 32, 22986–22997. [Google Scholar] [CrossRef]
  22. Hui, B.; Song, Z.; Fan, H.; Zhong, P.; Hu, W.; Zhang, X.; Lin, J.; Su, H.; Jin, W.; Zhang, Y.; et al. A dataset for infrared image dim-small aircraft target detection and tracking under ground/air background. Sci. Data Bank 2019. [Google Scholar] [CrossRef]
  23. Chen, R.; Ma, Y.; Wang, Z.; Sun, S. Incoherent Optical Neural Networks for Passive and Delay-Free Inference in Natural Light. Photonics 2025, 12, 278. [Google Scholar] [CrossRef]
  24. Khanam, R.; Hussain, M. YOLOv11: An overview of the key architectural enhancements. arXiv 2024, arXiv:2410.17725. [Google Scholar] [CrossRef]
  25. Wang, A.; Chen, H.; Liu, L.; Chen, K.; Lin, Z.; Han, J.; Ding, G. YOLOv10: Real-time end-to-end object detection. Adv. Neural Inf. Process. Syst. 2024, 37, 107984–108011. [Google Scholar]
  26. Wang, J.; Chen, J.; Yu, F.; Chen, R.; Wang, J.; Zhao, Z.; Li, X.; Xing, H.; Li, G.; Chen, X.; et al. Unlocking ultra-high holographic information capacity through nonorthogonal polarization multiplexing. Nat. Commun. 2024, 15, 6284. [Google Scholar] [CrossRef]
  27. Yang, Y.; Pan, C.; Li, Y.; Yangdong, X.; Wang, P.; Li, Z.A.; Wang, S.; Yu, W.; Liu, G.; Cheng, B.; et al. In-sensor dynamic computing for intelligent machine vision. Nat. Electron. 2024, 7, 225–233. [Google Scholar] [CrossRef]
  28. Zhou, F.; Chai, Y. Near-sensor and in-sensor computing. Nat. Electron. 2020, 3, 664–671. [Google Scholar] [CrossRef]
  29. Li, T.; Miao, J.; Fu, X.; Song, B.; Cai, B.; Ge, X.; Zhou, X.; Zhou, P.; Wang, X.; Jariwala, D.; et al. Reconfigurable, non-volatile neuromorphic photovoltaics. Nat. Nanotechnol. 2023, 18, 1303–1310. [Google Scholar] [CrossRef]
  30. Plastiras, G.; Terzi, M.; Kyrkou, C.; Theocharides, T. Edge intelligence: Challenges and opportunities of near-sensor machine learning applications. In Proceedings of the 2018 IEEE 29th International Conference on Application-Specific Systems, Architectures and Processors (ASAP), Milan, Italy, 10–12 July 2018; pp. 1–7. [Google Scholar]
  31. Li, J.; Zheng, K.; Li, Z.; Gao, L.; Jia, X. X-Shaped Interactive Autoencoders with Cross-Modality Mutual Learning for Unsupervised Hyperspectral Image Super-Resolution. IEEE Trans. Geosci. Remote Sens. 2023, 61, 5518317. [Google Scholar] [CrossRef]
  32. Li, J.; Zheng, K.; Liu, W.; Li, Z.; Yu, H.; Ni, L. Model-Guided Coarse-to-Fine Fusion Network for Unsupervised Hyperspectral Image Super-Resolution. IEEE Geosci. Remote Sens. Lett. 2023, 20, 5508605. [Google Scholar] [CrossRef]
  33. Li, J.; Zheng, K.; Gao, L.; Han, Z.; Li, Z.; Chanussot, J. Enhanced Deep Image Prior for Unsupervised Hyperspectral Image Super-Resolution. IEEE Trans. Geosci. Remote Sens. 2025, 63, 5504218. [Google Scholar] [CrossRef]
  34. Ma, Q.; Jiang, J.; Liu, X.; Ma, J. Reciprocal transformer for hyperspectral and multispectral image fusion. Inf. Fusion 2024, 104, 102148. [Google Scholar] [CrossRef]
Figure 1. Comparison between conventional remote sensing data process pipeline and DNN-based remote sensing data process pipeline. (a) Conventional remote sensing data process pipeline. (b) DNN-based remote sensing data process pipeline.
Remotesensing 17 03381 g001
Figure 2. Conceptual diagram of the DNN-SOD system.
Remotesensing 17 03381 g002
Figure 3. (a) Forward propagation model of DNN-SOD. (b) Schematic diagram of DOE etching fabrication.
Remotesensing 17 03381 g003
Figure 4. Multi-spectral dataset generation flowchart.
Remotesensing 17 03381 g004
Figure 5. The Training Procedure of DNN-SOD.
Remotesensing 17 03381 g005
Figure 6. Generation of ground truth intensity of each class of handwritten digits. (a) Normalized spectral intensity of handwritten digit “5”. (b) Ground Truth Intensity of handwritten digit “5”.
Remotesensing 17 03381 g006
Figure 7. Verification of DNN-SOD based on MNIST dataset. (a) Multi-spectral data cubes of MNIST handwritten digits. (b) Detector measurement for different spectral data input. (c) Reconstructed spectrum feature curve calculated from detector measurement. (d) Similarity characteristic vector visualization.
Remotesensing 17 03381 g007
Figure 8. Visualization of trained etching weight of three DOEs.
Remotesensing 17 03381 g008
Figure 9. (a) Randomly selected spectral features of target and background in Dataset I. (b) Segmenting the spectral data cube in Dataset I, (i) and (ii) represent the spectral data cubes of the target and the background, respectively. (c) Randomly selected spectral features of target and background in Dataset II. (d) Segmenting the spectral data cube in Dataset II, (iii) and (iv) represent the spectral data cubes of the target and the background, respectively.
Remotesensing 17 03381 g009
Figure 10. (a) Convergence plot of DNN-SOD. (b) Detection performance vs. the number of neurons. (c) Detection performance vs. the number of DOE layers. (d) Detection performance vs. the inter-layer spacing.
Remotesensing 17 03381 g010
Figure 11. (a) Reconstruction of spectral feature of sub-Datacube (i) (with UAV target) and (ii) (without UAV target) from Dataset I. (b) Reconstruction of spectral feature of sub-Datacube (iii) (with UAV target) and (iv) (without UAV target) from Dataset II.
Remotesensing 17 03381 g011
Figure 12. (a) Confusion matrix for Dataset I and Dataset II. (b) Re-arranged classification results for target detection (c) The actual detection results (for both Dataset I and Dataset II) obtained from the outcome corresponding to (b).
Remotesensing 17 03381 g012
Table 1. Characteristics and computational complexity of incoherent light models.
Incoherent Light Modeling MethodComputational ComplexityCharacteristics
Random phase superposition O ( M · N 2 log N ) High accuracy with rapidly growing cost
Mode decomposition O ( K · N 2 log N ) Suitable for sparse scenes; parallelizable
Convolution-based method O ( N 2 log N ) Fastest approach, limited by linearity and shift invariance
Notes: O ( · ) denotes computational complexity; M is the number of random phase realizations; K is the number of point sources in mode decomposition; N × N is the input field size.
Table 2. Diffraction efficiency of DOEs with different phase quantization bits.
Bit NumberQuantization LevelsDiffraction Efficiency η
1240.5%
2481.0%
3895.0%
41698.7%
Table 3. Key parameters of the Dataset I and Dataset II.
DatasetNumber of Spectrum ChannelCenter Wavelength(nm)Number of Sub Spectrum Cubes
Dataset I9800, 900, 1000, 1100, 1200, 1300, 1400, 1500, 160031,104
Dataset II51000, 1100, 1200, 1300, 140020,736
Table 4. Comparison of DNN-SOD with existing DNN processors.
DNN ProcessorNumber of ChannelTaskDatasetAccuracy (%)Reference
DNN-SODMultiDetectionUAV Dataset84.27Ours
DNNSingleClassificationMNIST91.75[12]
PCONNSingleClassificationISDD94.69[20]
ICONNSingleClassificationISDD93.25[23]
Disclaimer/Publisher’s Note: The statements, opinions and data contained in all publications are solely those of the individual author(s) and contributor(s) and not of MDPI and/or the editor(s). MDPI and/or the editor(s) disclaim responsibility for any injury to people or property resulting from any ideas, methods, instructions or products referred to in the content.