Article

Assessing the Capability of Visible Near-Infrared Reflectance Spectroscopy to Monitor Soil Organic Carbon Changes with Localized Predictive Modeling

1
College of Earth Sciences, Jilin University, Changchun 130061, China
2
Jilin Academy of Agricultural Sciences (Northeast Agricultural Research Center of China), Changchun 130033, China
*
Author to whom correspondence should be addressed.
Remote Sens. 2025, 17(19), 3373; https://doi.org/10.3390/rs17193373
Submission received: 6 September 2025 / Revised: 2 October 2025 / Accepted: 3 October 2025 / Published: 6 October 2025
(This article belongs to the Section Remote Sensing in Agriculture and Vegetation)

Abstract

Highlights

What are the main findings?
  • A localized spectral modelling framework was developed to monitor SOC changes.
  • Combining spectral and soil property similarities during local learning improved model performance.
What is the implication of the main finding?
  • The developed approach could enable the detection of hotspots that underwent significant SOC loss and gain.
  • Localized modelling with VNIR spectroscopy offers strong potential for tracking SOC changes.

Abstract

Visible near-infrared (VNIR) spectroscopy offers a cost-effective solution to quantify the spatiotemporal dynamics of soil organic carbon (SOC), especially in the context of rapid advances in spectra-based local modeling approaches using large-scale soil spectral libraries. And yet, direct temporal transferability of VNIR spectroscopic modeling (applying historical models to new spectral data) and its capability to monitor temporal changes in SOC remain underexplored. To address this gap, this study uses the LUCAS Soil dataset (2009 and 2015) from France to evaluate the effectiveness of localized spectral models in detecting SOC changes. Two local learning algorithms, memory-based learning (MBL) and GLOBAL-LOCAL algorithms, were adapted to integrate spectral and soil property similarities during local training set selection, while also incorporating LUCAS 2009 soil measurements (clay, silt, sand, CEC) as covariates. These adapted local learning algorithms were then compared against global partial least squares regression (PLSR). The results demonstrated that localized models substantially outperformed global PLSR, with MBL achieving the highest accuracy for croplands, grasslands, and woodlands (R2 = 0.72–0.79, RMSE = 4.73–20.92 g/kg). Incorporating soil properties during the local learning procedure reduced spectral heterogeneity, leading to improved SOC prediction accuracy. This improvement was particularly pronounced after excluding organic soils from grasslands and woodlands, as evidenced by 13.3–21.1% decreases in the RMSE. Critically, for SOC monitoring, spectrally predicted SOC successfully identified over 70% of samples experiencing significant SOC changes (>10% loss or gain), effectively capturing the spatial patterns of SOC changes. This study demonstrated the potential of localized spectral modeling as a cost-effective tool for monitoring SOC dynamics, enabling efficient and large-scale assessments critical for sustainable soil management.

1. Introduction

Soil organic carbon (SOC) is among the largest and most dynamic C pools in the terrestrial ecosystem [1]. Efforts to increase SOC storage has gained significant momentum in recent years, not only because it serves as an important indicator of soil quality, and is thus critical to global food security [2,3,4], but also because of its potential for climate change regulation [5,6], as highlighted by several high-level international initiatives including the “4p1000 initiative” and FAO’s RECSOIL program [7]. These endeavors require the establishment of a liable measurement, monitoring, reporting, and verification (MRV) framework that allows accurate and efficient detection and assessment of SOC changes in space and time [8].
Visible and near-infrared (VNIR) diffuse reflectance spectroscopy serves as a promising and cost-effective technique to provide rapid and accurate SOC estimations via multivariate spectroscopic modeling [9,10,11,12]. The principle behind using VNIR spectroscopy to quantify SOC content is that organic molecules and the functional groups of organic matter in soils exhibit distinct absorption features in the 400–2500 nm spectral region [13], thus allowing prediction models to be developed based on the relationship between SOC and soil spectra. This, together with advancements in machine learning algorithms, has successfully enabled the widespread application of spectra-based predictive modeling for SOC quantification [14]. However, most studies have focused on utilizing single-year datasets collected within a limited time frame, leaving the temporal transferability of spectral methods untested. Consequently, the question of whether and to what extent soil spectroscopy can be used to monitor SOC changes remains largely unanswered. Pilot studies investigating the capability of spectra-based SOC monitoring are constrained in small spatial scales with limited training data [15,16]. To date, a comprehensive assessment of the capability of soil spectroscopy to detect SOC changes at a large scale is lacking.
Recent efforts to establish large-scale soil spectral libraries (SSLs) across the globe, including the European LUCAS Soil database that offers temporally resolved soil property and VNIR measurements in 2009 and 2015 [17], may provide a new arena of opportunities to close the aforementioned gap. Using the open-access SSLs, various researchers have demonstrated the promising potential of soil VNIR spectroscopy to effectively and accurately predict SOC at low costs [18,19]. However, due to the spectral and edaphic diversity of large SSLs, a global prediction model based on an entire dataset does not necessarily provide accurate predictions at the local scale, thus hampering the applicability of SSLs at scales relevant for soil monitoring and assessment [20,21].
To overcome this issue, a number of data-driven, local learning approaches have been proposed to develop site-specific models for more accurate SOC prediction on the local scale. For instance, the memory-based learning (MBL) algorithm, developed by Ramirez-Lopez et al. (2013) [22], exemplifies an approach that leverages large-scale SSLs to select spectrally similar instances for each target sample, enabling the development of localized prediction models tailored for site-specific SOC assessment. The effectiveness of MBL-based SOC predictive modeling has since been extensively demonstrated [23]. Similarly, GLOBAL-LOCAL, building on the progress from RS-LOCAL [24], represents another local learning approach that searches a subset of spectrally similar training data from an SSL. This selected subset is then used as the calibration dataset for a group of unobserved local samples, rather than focusing on a single target sample as is performed in MBL [20].
However, local spectral modeling approaches, such as MBL and GLOBAL-LOCAL, also face unresolved issues. The physical relationship between soil spectra and SOC can become more complex with increasing diversity of soil genesis and biophysical environments in SSLs. As a result, samples with similar spectral characteristics may not always correspond to similar SOC content [20]. This means that the performance of local learning approaches relying entirely on spectral similarity may deteriorate as the size of SSLs expands. Therefore, incorporating additional information beyond the spectral dimension for the search of training subsets could potentially enhance the local learning performance. Tziolas et al. (2019) found that MBL models considering both geographic and spectral similarity outperformed those based solely on either spectral or geographic similarity in predicting SOC [25]. Moreover, incorporating environmental covariates into the spectral modeling framework has also been shown to improve model performance [26,27,28]. Stevens et al. (2013) [29] and Nocita et al. (2014) [30] reported that adding spatial and soil legacy data as co-predictors could enhance SOC prediction accuracy. However, few studies have combined the use of non-spectral covariates with spectra-based local predictive modeling to develop a more comprehensive SOC prediction and assessment framework. Applying this type of data-driven local learning approach to monitor SOC changes is even more scarce.
The goal of this study is to develop an optimal VNIR-based local modeling strategy for accurate SOC prediction in an attempt to assess the capability of soil spectroscopy for detecting SOC changes. To this end, two local learning approaches (i.e., MBL and GLOBAL-LOCAL) were adapted and tested using the LUCAS Soil dataset (2009 and 2015) covering mainland France. Specifically, the adaptation of MBL and GLOBAL-LOCAL algorithms involves two main aspects, including (1) using both spectral and soil property characteristics as the search criteria for the local learning procedure to find similar training subsets and (2) adding legacy soil data as co-predictors to enhance localized SOC predictive modeling. The performances of conventional and adapted MBL and GLOBAL-LOCAL models were compared against global models using partial least squares regression (PLSR). Lastly, the best-performing modeling strategy was used to evaluate which soil spectroscopic techniques can be used for SOC monitoring across large scales.

2. Materials and Methods

2.1. Test Dataset

The Land Use and Coverage Frame Survey (LUCAS) Soil database in Europe represents one of the most complete and widely used open-access SSLs worldwide [17,29]. It was first established in 2009, containing soil property and VNIR measurements for various land use types, and most of the surveyed points were resampled in 2015, making this database ideal for testing whether VNIR spectral data can be used to monitor temporal changes in SOC. To achieve this goal, we selected mainland France as the study region. Soil samples, collected in 2009 and revisited in 2015, covering three main land use types (cropland, grassland, and woodland) were extracted, and their soil property and VNIR data were used for spectral modeling. In total, 1453, 671, and 304 samples were available for cropland, grassland, and woodland (Figure 1). The summary of soil properties measured in 2009 is given in Table S1, Supporting Information. For the measurement of VNIR data, each sample was air-dried and passed through a 2 mm sieve. Based on the standardized measurement protocol of the LUCAS Soil database, the absorbance spectra were measured using a FOSS XDS Rapid Content Analyzer (FOSS NIR Systems Inc., Laurel, MD, USA) in the laboratory. The spectrometer covers a spectral range between 400 and 2500 nm at a resolution of 0.5 nm. Each spectral measurement typically takes less than 1 min per sample, including setup time, making it highly efficient for routine measurement and monitoring.

2.2. Spectral Modeling Methodology

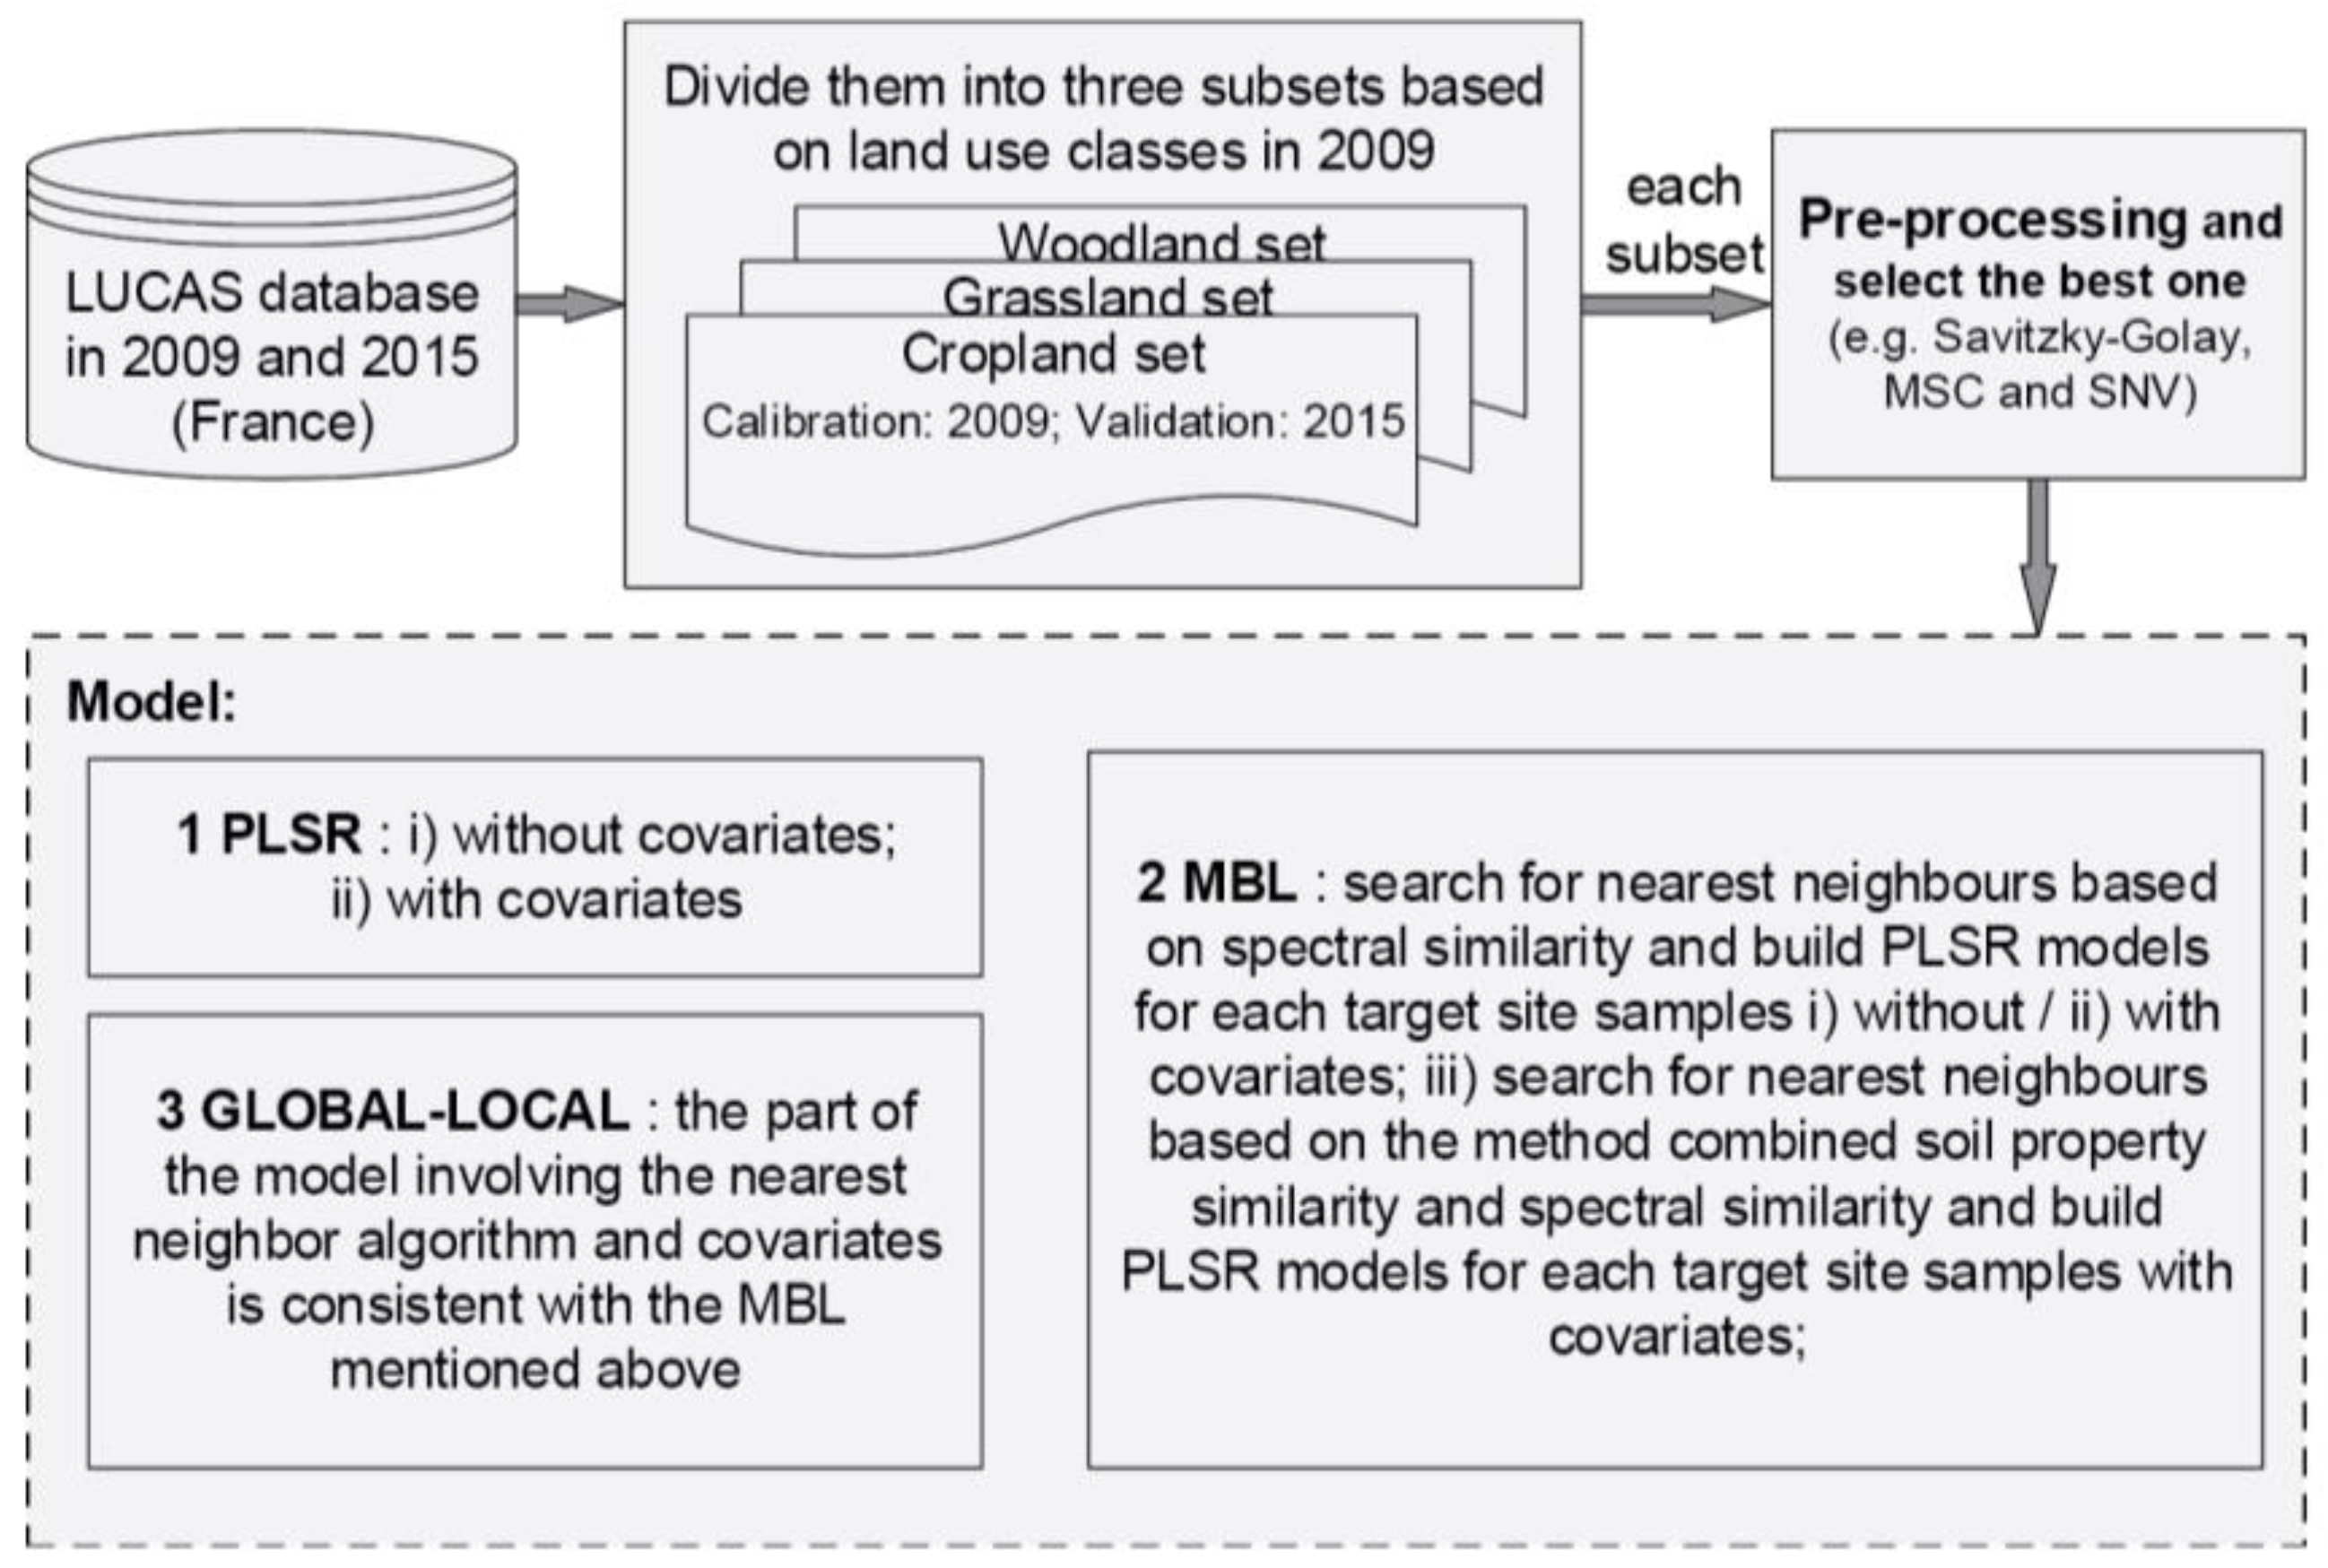
The general workflow of the methodological framework is described in Figure 2. SOC and VNIR data measured in 2009 were used as the calibration dataset, and data collected in 2015 were used to validate the performance of different modeling strategies. Note that prediction models were developed for each of the three land use types separately. The spectra-based modeling algorithms include global PLSR, MBL, and GLOBAL-LOCAL, with and without adding measured soil properties as covariates. Preliminary tests revealed that adding clay, silt, sand, and cation exchange capacity (CEC) as covariates led to the biggest level of improvement, so these four soil properties were incorporated in subsequent modeling development and cross-comparisons. Furthermore, the local learning criteria to find similar training subsets for MBL and GLOBAL-LOCAL were adapted to test whether considering both spectral and soil property similarity could improve the prediction performance. More detailed descriptions of the methodology are given below.

2.2.1. Spectral Pre-Processing

Soil VNIR absorbance was first resampled to a resolution of 5 nm, resulting in a total of 399 spectral features within the 500–2490 nm spectral range. Spectral resampling was conducted to smooth the spectral curves, while also reducing the number of covariates for higher computational efficiency. Preliminary analysis indicated that the effect of spectral resampling on model performance was negligible. Furthermore, considering that the accuracy of spectroscopic models can be markedly impacted by the pretreatments of spectral data, we constructed global PLSR models using the 2009 dataset to test the performance of different pre-processing methods, including multiplicative scatter correction (MSC), standard normal variate (SNV), detrending, derivatives, and combinations of these methods. The optimal model was achieved by applying Savitzky–Golay smoothing with a first-order derivative using a first-order polynomial approximation (window size was set at 9). Subsequently, the pre-processing was applied to all samples, and a Mahalanobis distance was calculated against the processed spectra to detect outliers (distance > 3) before subsequent modeling development. No outliers were detected, and all samples were, therefore, used in the modeling process.

2.2.2. MBL Model

The essence of MBL is the case-specific selection of spectrally similar subsets from an SSL. This selection procedure allows the development of a specific predictive model for each target sample. Conventionally, the case-specific subset selection is achieved by k-nearest neighbor (KNN) search based on the spectral distance between samples in the SSLs and the target sample, where k represents the number of selected samples for local modeling. In this study, the conventional MBL was adapted in two main aspects, resulting in three different types of MBLs, with MBL1 being the conventional MBL model. MBL 2 represents the version with added soil properties as covariates, while the difference between MBL 2 and MBL 3 is that MBL 3 considers both spectral and soil property similarities during KNN search.
To implement the different strategies, the spectral distance Dspecij and the soil properties distance Dsoilij between each sample i in the validation set (i.e., 2015) and each sample j in the calibration set (i.e., 2009) were first calculated using the Euclidean dissimilarity metric. It should be noted that the 2015 soil property data were intentionally excluded in the modeling process to reflect real-world conditions, where future spectra-based SOC monitoring will lack concurrent soil property measurements. Next, the spectral and soil property distances were normalized to the same scale and assigned different weights under different scenarios. For MBL 1 with spectral similarity as the sole KNN search criteria, the weight of spectral distance was 1, whereas for MBL3, the weight was equally set as 0.5 for both spectral and soil property distance based on the recent study by Sun and Shi (2025) [31], who found that equally weighting soil spectral and compositional similarities generally produced the best results. Lastly, after the selection of local training samples for each target sample, local PLSR models were developed. In cropland and grassland subsets, we considered a range of k values from 30 to 400 with an increment of 10, while in the woodland subset, the range was from 30 to 300. The k value ranges were selected based on the principle that the maximum k value was not much higher than the sample size of each land use class in order to avoid overfitting during localized PLSR modeling.

2.2.3. GLOBAL-LOCAL Model

To implement the GLOBAL-LOCAL algorithm, the validation dataset in 2015 and the calibration dataset in 2009 were first subjected to a data partitioning procedure using k-means clustering based on the 11 soil properties shown in Table S1. This was performed to generate multiple groups of data for each land use type, with each group sharing similar soil characteristics. Then, the conditioned Latin hypercube sampling method was used to select a representative set of 10% from each group of the validation dataset. This 10% representative dataset, originally described as the LAB dataset in St. Luce et al. (2022) [20], served as the reference for the KNN selection of similar samples from the calibration dataset in order to form the training subset for the remaining 90% of the validation dataset.
Similar to the MBL algorithm, three types of GLOBAL-LOCAL models were developed. GLOBAL-LOCAL 1 represents the modeling strategy in which only spectral similarity was considered during the KNN selection of local training samples. For GLOBAL-LOCAL 2, soil properties were used as covariates during the construction of local PLSR models. For GLOBAL-LOCAL 3, both spectral and soil property similarities were considered, and soil properties were also added as covariates. It should be noted that the range of k during KNN search was from 10 to 200, with an increment of 10.
Lastly, global PLSR models were also developed, both with and without the addition of soil properties as covariates. This procedure was conducted because model performances of global PLSR models allow direct comparisons between global and local modeling strategies, which also use PLSR as the modeling algorithm. Therefore, the results of the global PLSR models served as the baseline for comparing with the MBL and GLOBAL-LOCAL models.

2.2.4. Performance Evaluation of Modeling Strategies

The model performances were evaluated using the coefficient of determination (R2, Equation (1)), the root mean square error (RMSE, Equation (2)), the ratio of performance to deviation (RPD, Equation (3)), and the ratio of performance to interquartile range (RPIQ, Equation (4)). The calculation formulas are as follows:
R 2 = 1 i = 1 n y i y i ^ 2 i = 1 n y i y ¯ 2
RMSE = i = 1 n y i y i ^ 2 n
R P D = SD y RMSE
R P I Q = IQ RMSE
where y i is the observed value, y i ^ is the predicted value, n is the number of each validation set, S D y is the standard deviation of the observed value, and I Q is the interquartile range ( I Q = Q 3 Q 1 ) of the observed values.
The above-mentioned spectral pre-processing, model development, and statistical analyses were performed in the R statistical computing environment [32].

2.3. Detection of SOC Changes by Soil Spectroscopy

To assess the capability of soil spectroscopy to detect SOC changes, it is important to define a threshold beyond which significant changes in SOC have occurred. In this study, we set the threshold at 10% of relative SOC changes, according to the Good Practice Guidance provided by the United Nations Sustainable Development Goal Indicator 15.3.1 to combat soil degradation.
The rate of change in SOC was first calculated using measured SOC data in 2009 and 2015, and the results were classified into three groups, i.e., rate of change ≥10%, ≤10%, and −10–10%. Then, the measured SOC data in 2015 was replaced by predicted values using the optimal modeling strategy. The rate of change in SOC was again calculated using the spectrally predicted data, and the extent to which soil spectroscopy can be used to monitor SOC changes was assessed by calculating the percentage of overlaps in the three groups. Moreover, the differences between predicted values in 2015 and observed values in 2009 (2015Pred–2009Obs) were compared with 2015Obs–2009Obs. Also, inverse distance weighting (IDW) was employed to spatially interpolate point-based SOC change estimates (2015Pred–2009Obs and 2015Obs–2009Obs), with the goal to evaluate whether soil spectroscopy can be used to effectively identify geographical hotspots that underwent significant SOC changes.

3. Results

3.1. Temporal Change in SOC Based on Measured Data

By leveraging the measured SOC values to investigate their temporal changes from 2009 to 2015, it can be seen that the SOC distribution characteristics of those two years generally followed a similar pattern within each land use type. This similarity was also displayed by the soil spectral reflectance values and their standard deviations between 2009 and 2015 (Figure 3). Nonetheless, significant changes have also occurred during this period, as evidenced by the variations in the mean SOC content and the change rate (Figure 3 and Table 1).
For the cropland soils, a significant decrease (p < 0.01) in mean SOC content from 17.56 g/kg to 16.96 was observed. This decreasing trend is reflected in the rate of change in SOC (Table 1), with approximately 2/3 of cropland samples experiencing changes of more than 10%. In particular, 534 out of 1453 samples had a more than 10% decrease in SOC content, which was averaged at only 13.84 g/kg for these samples, suggesting considerable soil degradation for the croplands in France. Similarly, for the grasslands and woodlands, a large percentage (>65%) of the samples experienced more than 10% changes in SOC. However, different from the croplands, the mean SOC content showed an increasing trend from 2009 to 2015 for grasslands and woodlands. Also, among the three groups of varying SOC change rates, the group with more than 10% increase from 2009 to 2015 always had the highest mean SOC content, while the opposite was true for the group with more than 10% decrease in SOC during the same period. The observed significant SOC changes during the period investigated laid a good foundation for the evaluation of whether the spectrally predicted SOC in 2015 could serve as a viable replacement to detect the SOC changes.

3.2. Performances of Different Modeling Strategies

The global PLSR models, with and without the addition of soil properties as covariates, were used as baseline models and compared with the MBL and GLOBAL-LOCAL models. As summarized in Table 2, for the global PLSR models (PLSR 1 and PLSR 2), incorporating the auxiliary soil property data (measured in 2009) largely enhanced the model capability to predict SOC contents in 2015 for all three land use types, conclusively proving the added value provided by the legacy soil data. The same is true for the MBL and GLOBAL-LOCAL algorithms, regardless of the land use type, with MBL 2 and GLOBAL-LOCAL 2 consistently outperforming the models (MBL 1 and GLOBAL-LOCAL 1) without the inclusion of soil property data as covariates.
Comparing the different modeling strategies, the two local predictive modeling algorithms yielded higher prediction accuracies than the global PLSR models. MBL 2 and GLOBAL-LOCAL 2 consistently had higher R2 and lower RMSE values than PLSR 2 for all three land use types, with one exception, where GLOBAL-LOCAL 2 had identical performance with PLSR 2 for cropland soils. Note that higher RPD and RPIQ values reflect higher model reliability. When comparing model performances, both metrics followed the same patterns as R2 (Table 2), and are, therefore, omitted from subsequent result description for brevity. Apart from the clear advantage of local over global modeling strategies, it is evident that MBL outperformed GLOBAL-LOCAL, with MBL 2 producing a higher R2 than GLOBAL-LOCAL 2 for cropland and grassland soils. The same R2 was obtained for woodland soils between the two local learning algorithms.
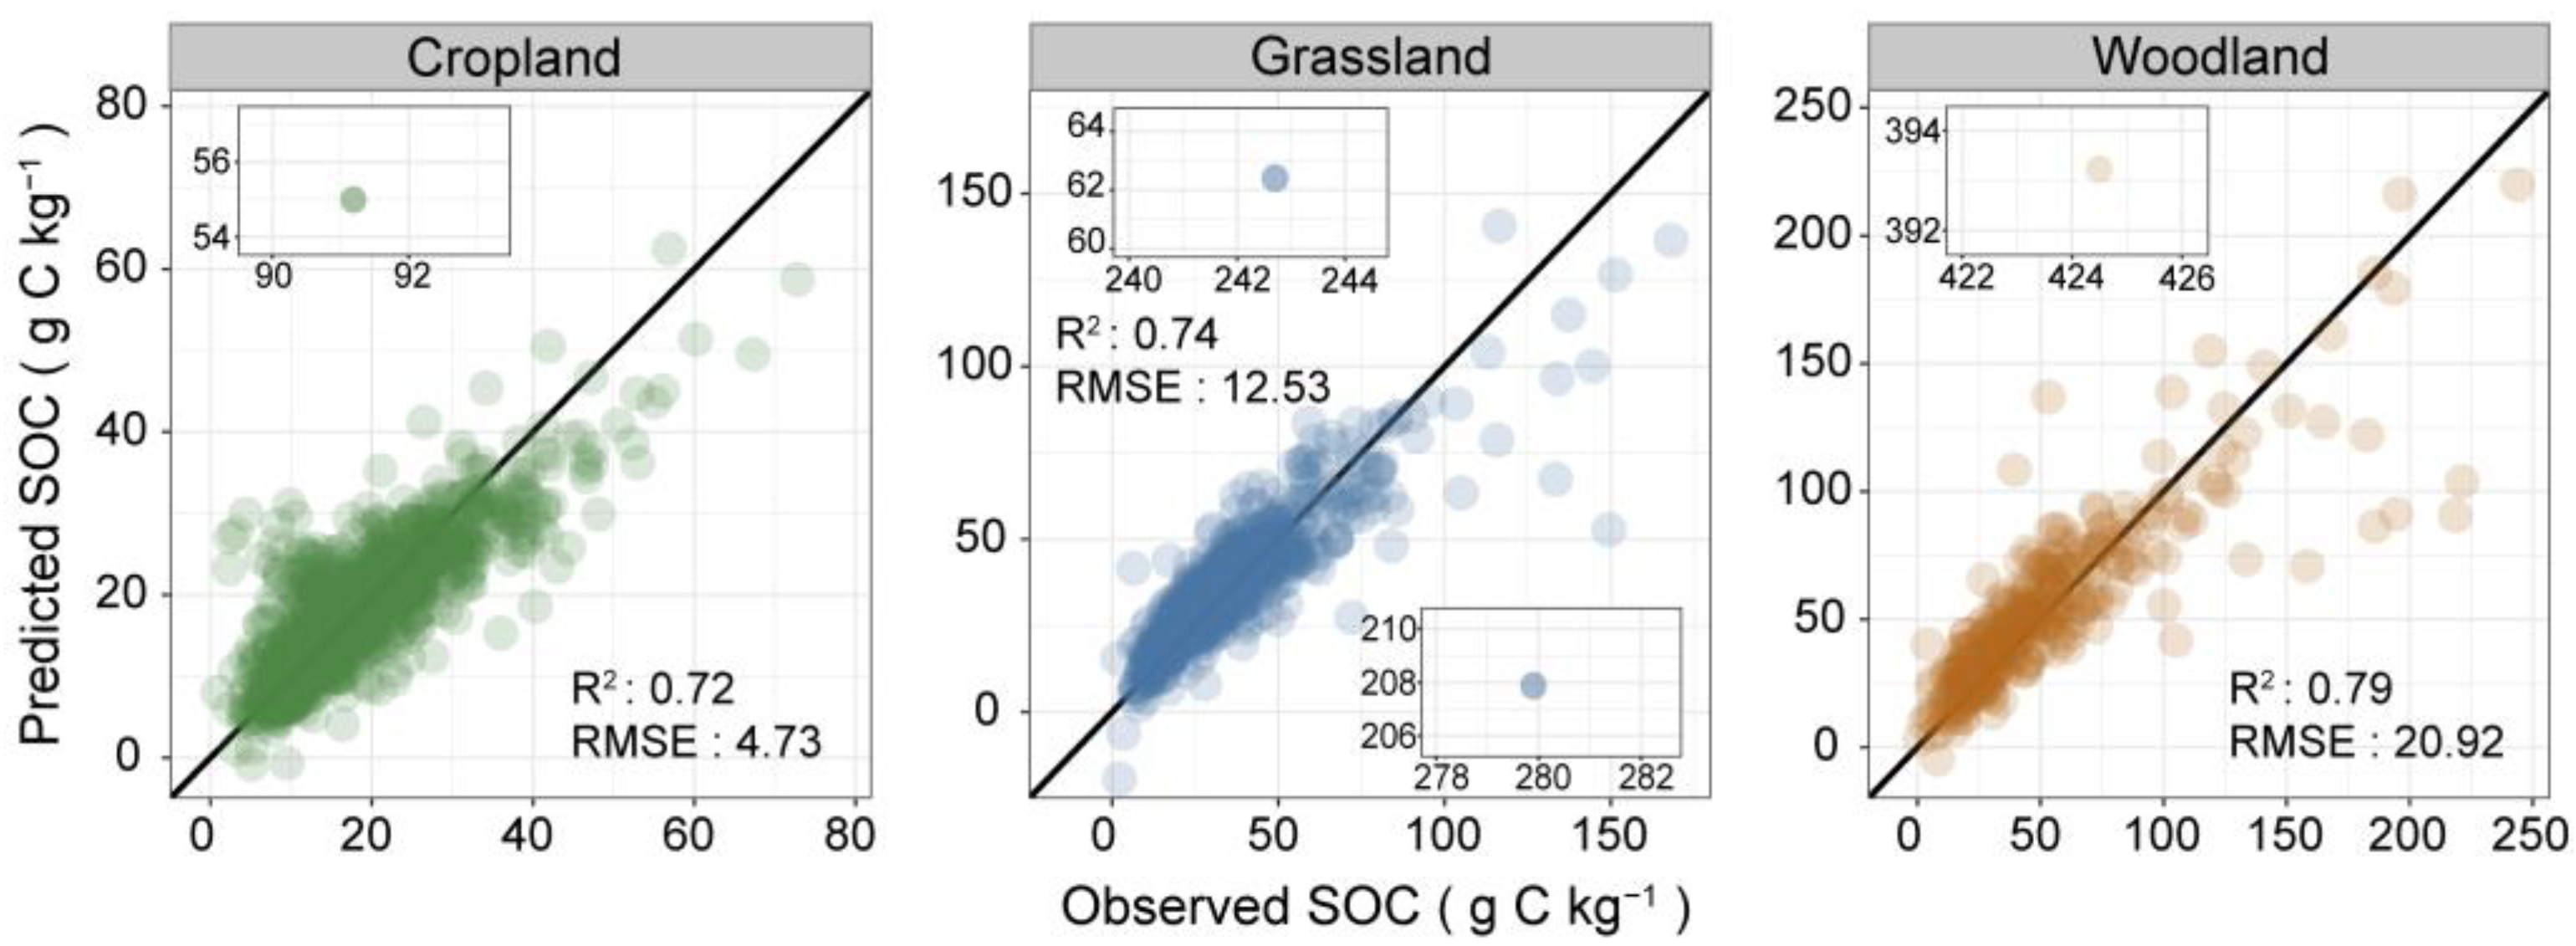
Furthermore, MBL 3 and GLOBAL-LOCAL 3 generally outperformed MBL 2 and GLOBAL-LOCAL 2. This finding indicates that the localized KNN search based on both spectral and soil compositional similarities was more beneficial than relying solely on spectral similarity alone, although the level of improvement was small compared to that brought by the addition of soil property covariates and the switch from global to local modeling methods. One exception was that, for grassland, the highest SOC prediction accuracy was obtained from MBL 2 (R2: 0.75; RMSE: 12.40 g/kg), meaning that adding soil property similarity during KNN search did not lead to improved prediction accuracy for this class. For croplands and woodlands, model predictions resulting from MBL 3 had the highest accuracy, with an R2 of 0.72 and an RMSE of 4.73 g/kg for the former and an R2 of 0.79 and an RMSE of 20.92 g/kg for the latter. Based on the best-performing MBL models, Figure 4 depicts the scatterplots of predicted versus observed SOC values in 2015. The range of variations in SOC values was well-captured by the individual MBL models specific to each land use type. However, it is worth noting that the models for grassland and woodland were associated with some underestimation for samples with high SOC values within each land use type.
To investigate the physical significance of the developed spectral prediction models, variable importance in projection (VIP) figures were created for three modeling strategies and three land use types (Figure 5). It can be seen that, regardless of the modeling strategy or land use type, VIP figures displayed consistent patterns across the 400–2500 nm spectral range. In particular, the visible region (400–700 nm) and specific SWIR bands around 1900 nm and 2100–2300 nm were consistently the most significant for SOC prediction. This aligns with the well-established understanding that these regions capture the absorption features of soil color and organic compounds, confirming the physical relevance of the developed spectral models for SOC prediction.

3.3. Evaluation on the Capability of Soil Spectroscopy to Detect SOC Changes

Using the optimal model identified above, the SOC content of the samples collected in 2015 was spectrally predicted. These predicted values, denoted as 2015Pred, were then used to substitute the observed SOC values in 2015 (2015Obs), and the temporal change in SOC was re-analyzed with the spectrally predicted SOC data. Table 3 presents the number of samples that overlapped with the same degree of SOC change rates in Table 1. It can be seen that samples with more than 10% SOC changes could be largely detected by soil spectroscopy. For samples that underwent more than a 10% increase in SOC from 2009 to 2015, 66.5%, 82.4%, and 85.9% of the previously detected cropland, grassland, and woodland samples were re-detected by soil spectroscopic prediction. Similarly, more than 55% of the degraded soils (≤−10%) could be successfully detected, with the ratio of detection reaching 70.6% for cropland soils. This is highly significant because it implies that soil spectroscopy could potentially serve as a valuable tool to assess and monitor the degree of soil degradation and its restoration effects.
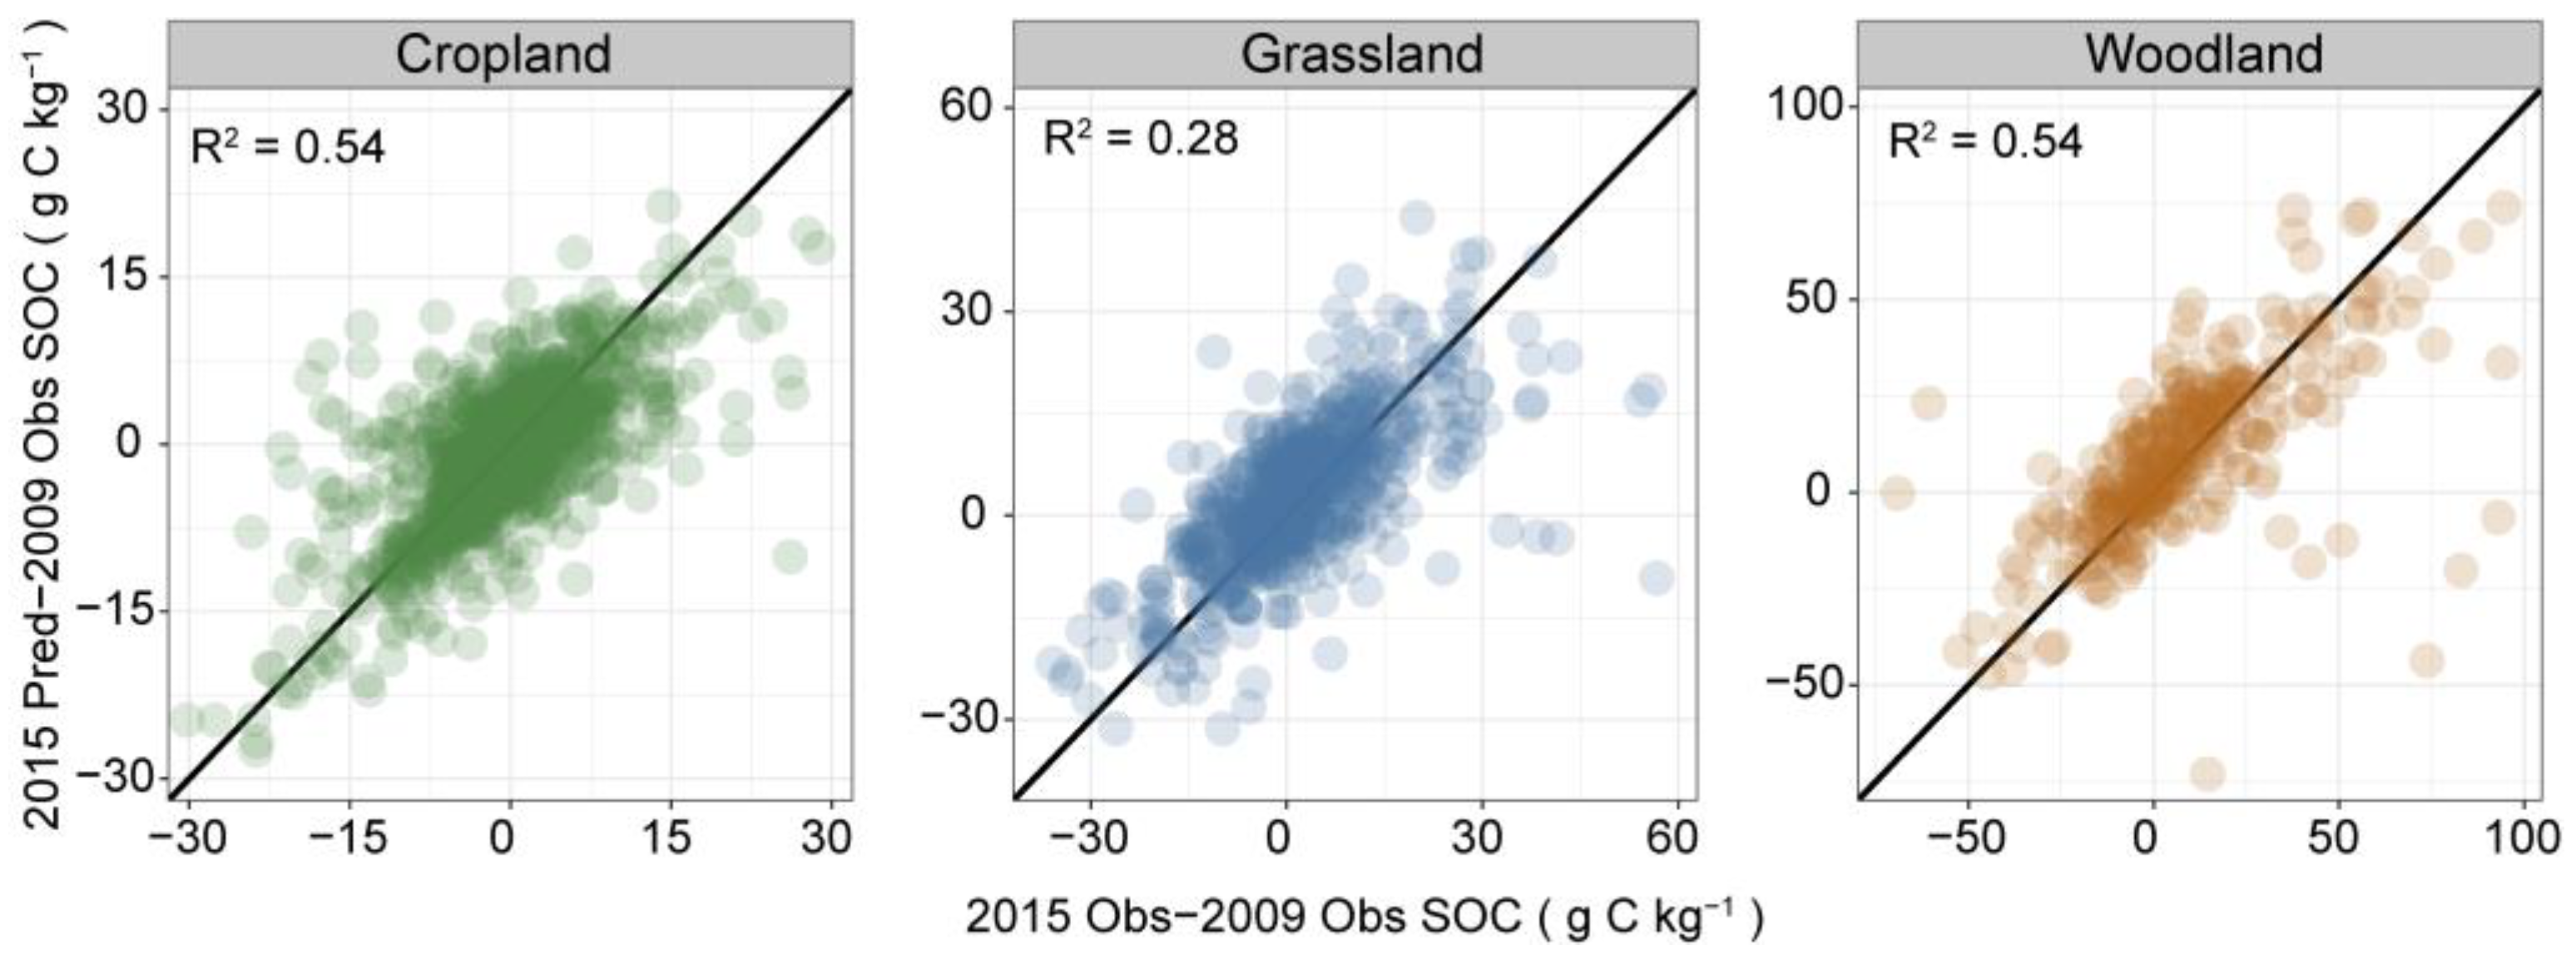
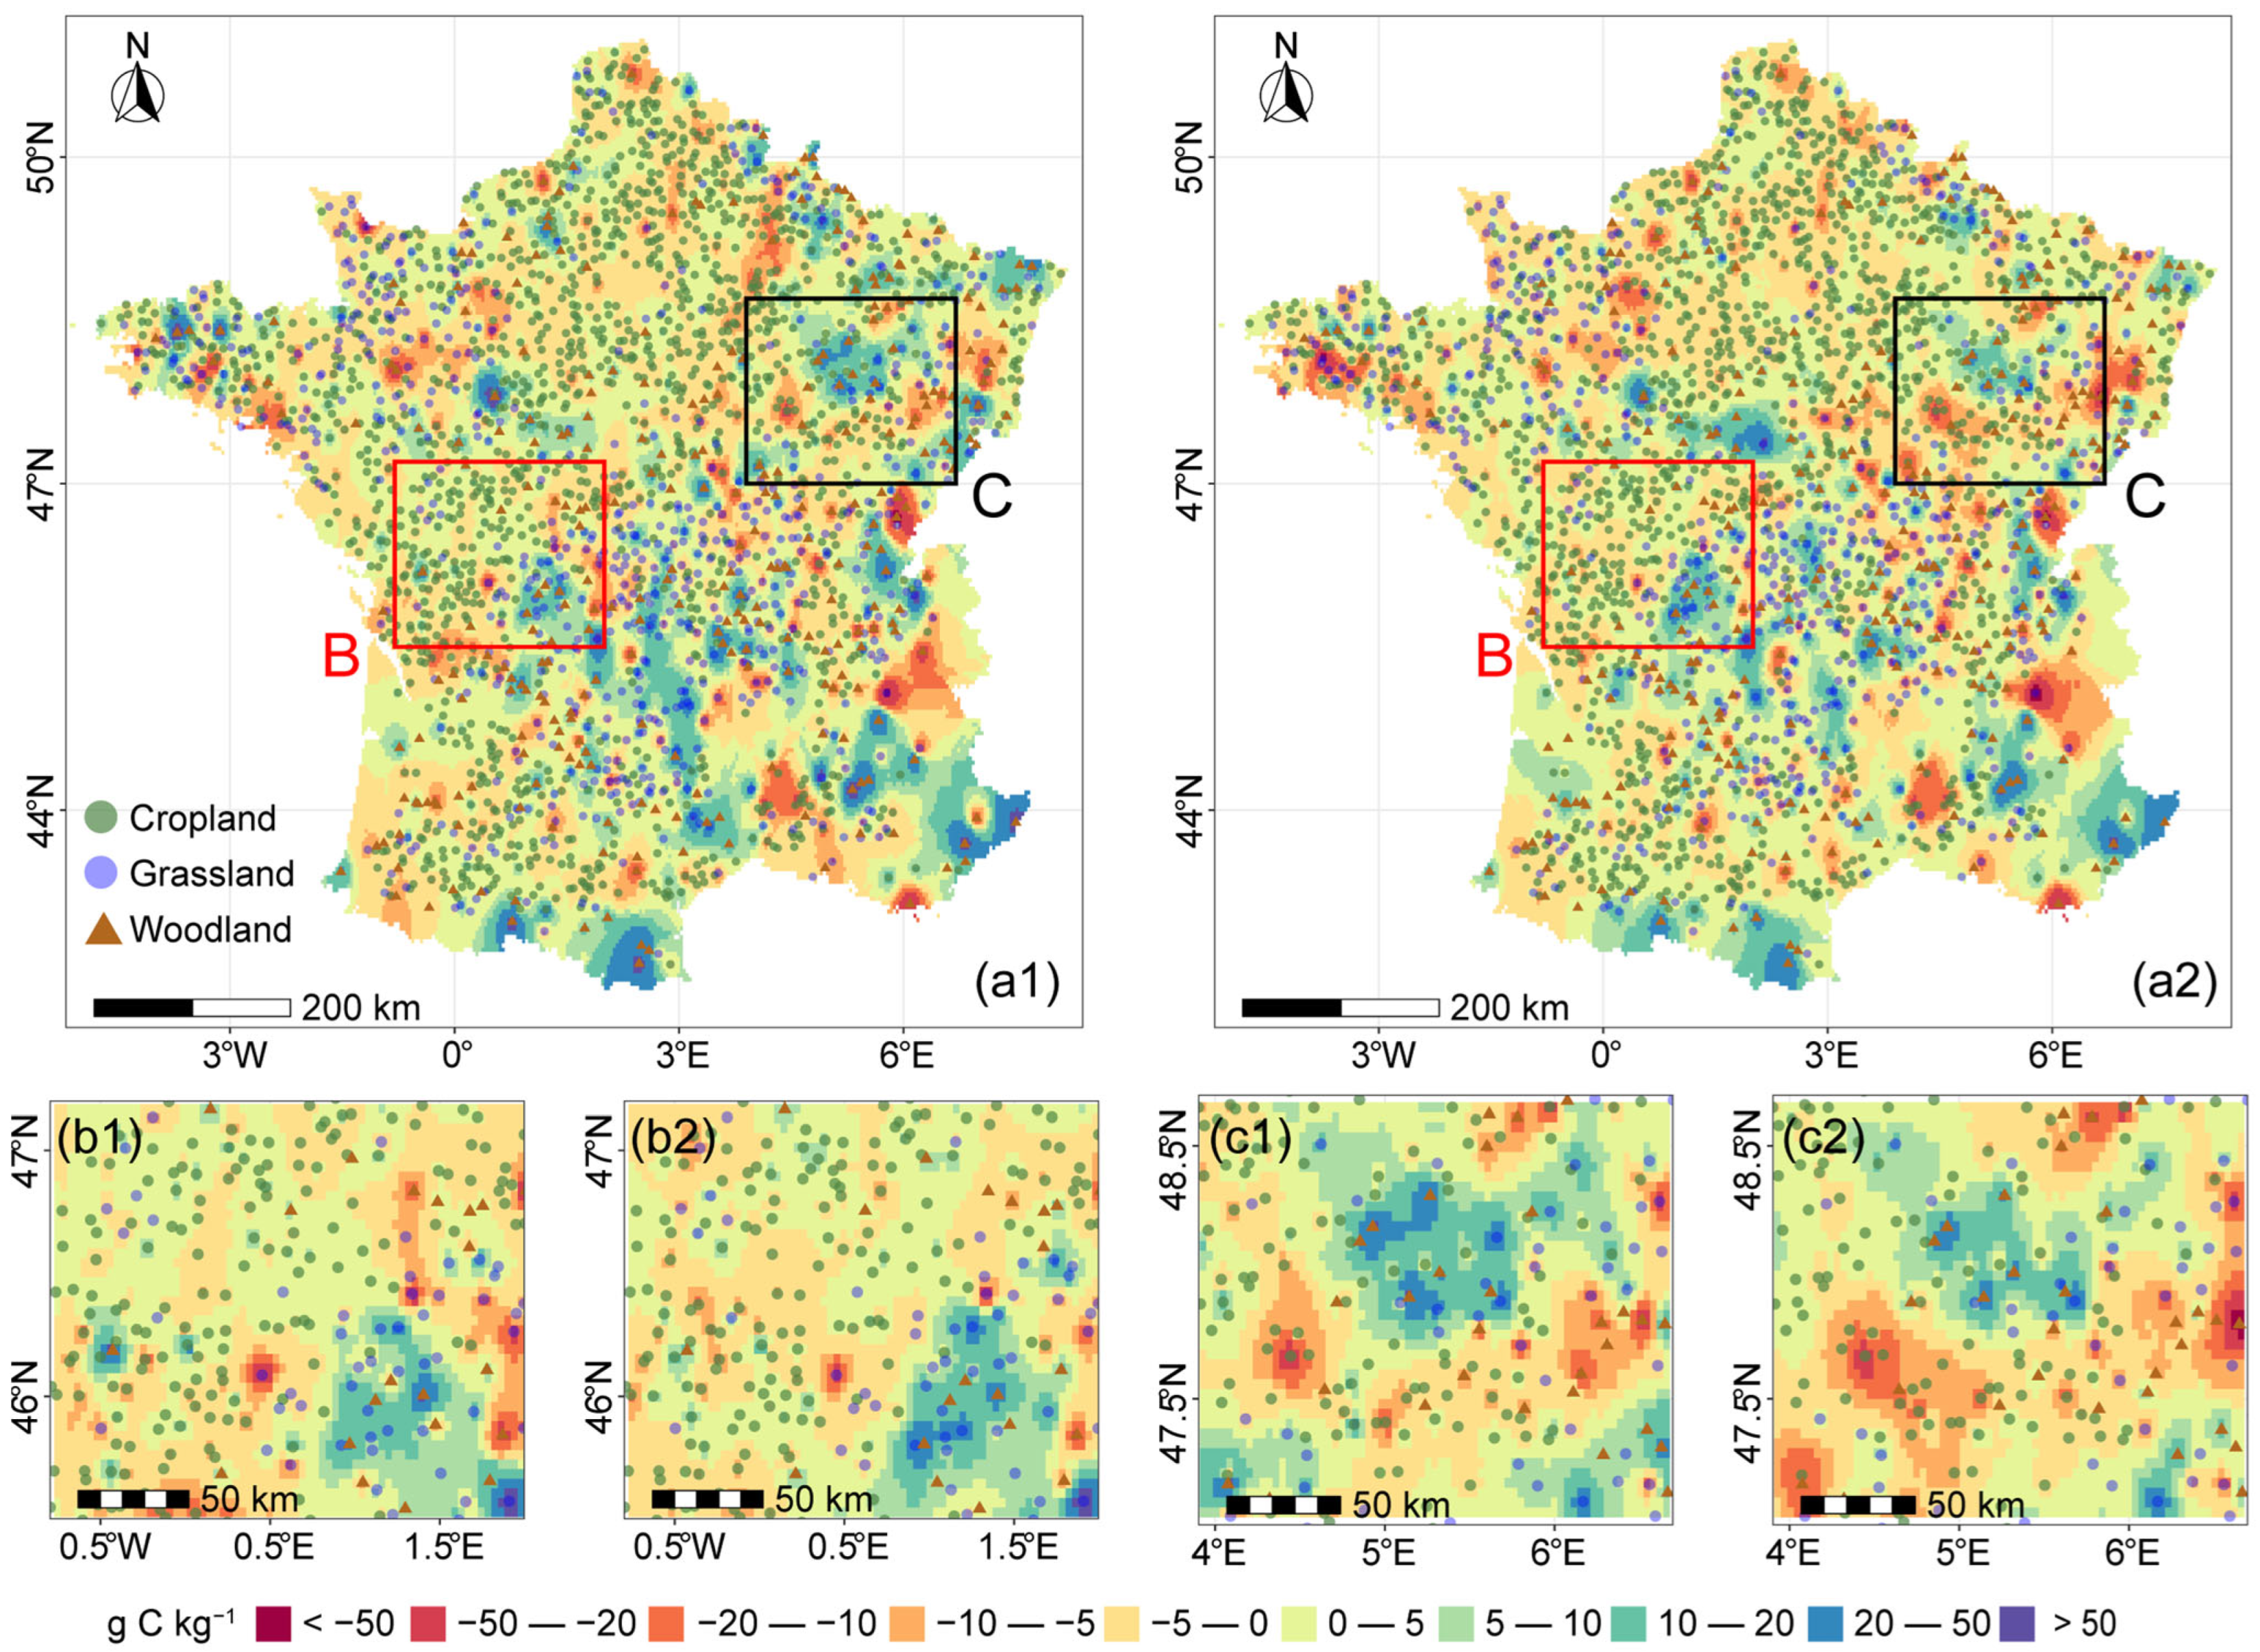
The capability of soil spectroscopy to monitor SOC changes can be further confirmed in Figure 6, which compares the pattern of 2015Pred–2009Obs and 2015Obs–2009Obs. The degree of SOC differences observed during the six-year period was well-captured by spectrally predicted data. Furthermore, point-based calculations of 2015Pred–2009Obs and 2015Obs–2009Obs were interpolated to generate a spatially explicit map, depicting the patterns of SOC changes. As demonstrated in Figure 7, the spatial pattern of 2015Pred–2009Obs generally mimicked that of the 2015Obs–2009Obs, particularly around the red hotspots, which showed significant SOC loss in croplands. Zoom-in figures further highlighted the ability of soil VNIR spectroscopy to monitor and identify the locations that experienced significant temporal changes in SOC across large scales and using complex SSLs. Comparing the interpolated map with the distribution pattern of land use types, it was clear that SOC losses were more associated with cropland soils, while hotspots that received significant SOC gain mostly concentrated in grassland and woodland soils.

4. Discussion

4.1. The Effectiveness of Local Modeling for SOC Spectral Prediction

Spectra-based models calibrated against the 2009 data could be temporally transferred to 2015 in general (Table 2), suggesting that large-scale SSLs have the potential to be deployed for SOC monitoring, especially given that the rapid development of global SSLs currently underway can provide easily accessible soil spectral and property data across spatial and temporal scales [33,34]. However, the potential for spectra-based SOC monitoring can only be realized with the optimization of a modeling approach capable of dealing with the spectral–pedogenic diversity associated with complex datasets. Through a comparison of multiple modeling strategies (Table 2), the key findings can be summarized into three aspects. A consistent improvement in SOC prediction accuracy was found after the incorporation of legacy soil property data as model covariates, both for global PLSR and for the two local predictive modeling methods (i.e., MBL and GLOBAL-LOCAL). This finding aligns well with the studies by Stevens et al. (2013) [29] and Nocita et al. (2014) [30], who reported increasing model performances with the inclusion of soil textural and geographical data as auxiliary variables. Because the relationship between soil spectral reflectance and SOC is complex and non-linear [35], especially across large spatial scales, the auxiliary information on the spatial heterogeneity of soil mineral composition essentially provided a pedological dimension of knowledge to complement the soil spectral characteristics for more accurate SOC prediction.
More importantly, two local predictive modeling methods consistently outperformed the global PLSR models regardless of the land use types, highlighting the capability of local learning methods to handle complex SSLs in attempts to better reflect site-specific SOC variations. As demonstrated by numerous studies [18,20,23], localized spectral learning methods, such as MBL and GLOBAL-LOCAL, offer a clear advantage over global modeling approaches for SOC prediction by prioritizing training datasets that closely align with the soil spectral features of the target samples. Conventionally, the MBL algorithm relies solely on spectral similarity to select calibration samples, using both spectral and soil property similarities as the criteria during localized selection of training subsets further improved model performance (MBL 3 and GLOBAL-LOCAL 3 in this study). This is because those models addressed a critical limitation: spectral resemblance alone may not fully capture soil compositional coherence due to non-linear relationships between soil chromophores and spectral responses, particularly in datasets marked by high heterogeneity in soil genesis, types, or texture. Empirical validations, including studies by Tziolas et al. (2019) [25] and Nocita et al. (2014) [30], corroborate that refining training data to reflect localized spectral–spatial relationships improves SOC estimation, underscoring the superiority of hybridized local learning strategies in capturing the intricate interplay between soil spectra, composition, and environmental context.
The optimal MBL model yielded SOC predictions closely matching the observations in 2015. However, it tended to underestimate high SOC values in grassland and woodland. The likely cause of this underestimation can be attributed to the insufficient representation of samples with high SOC content within the calibration set. According to Sims et al. (2021) [36], soils with SOC content exceeding 120 g/kg are classified as organic soils. Table 4 shows that, after excluding the organic soils, the recalibrated MBL models demonstrated improved predictive accuracy, with validation results indicating a reduction in the RMSE from 12.53 to 9.88 g/kg (a 21.1% decrease) for grassland soils and from 20.92 to 18.14 g/kg (a 13.3% decrease) for woodland soils. This underscores the enhanced model performance achieved by refining the training dataset to exclude organic soil samples, which likely reduced spectral and compositional heterogeneity within the calibration subsets. However, it should be noted that, while the exclusion of organic soils led to a marked improvement in predictive accuracy for grassland and woodland soils, this approach inherently involves a trade-off between spectral uniformity and environmental representativeness. By removing these high SOC samples, the spectral heterogeneity and compositional complexity of the calibration dataset were reduced, thus allowing the local models to more accurately capture the SOC–spectral relationship for the majority of mineral soils [29]. For future SOC monitoring applications with unknown SOC values, it may be advisable to adopt spectra-based stratified modeling strategies. This could involve, for instance, first using spectral clustering to identify and separate organic soils and then building dedicated local models for each distinct spectral group (e.g., mineral soils vs. organic soils). Another matter requiring attention is selecting an appropriate k range for the KNN search of local training subsets. In a recent study, Sun and Shi (2025) used the MBL model to demonstrate that SOC prediction accuracy remained stable over a range of k [31], but excessively large values should be avoided to prevent overfitting.

4.2. The Ability of Soil Spectroscopy to Monitor SOC Changes

Using the optimized spectral modeling approach, it was shown in this study that soil VNIR spectroscopy offers significant potential for SOC monitoring, offering cost-effective and scalable solutions. For soils with more than a 10% increase in SOC content, more than 80% of the samples could be successfully detected using soil spectroscopy. For cropland soils that experienced more than 10% SOC losses from 2009 and 2015, more than 70% of the samples could be detected using the spectrally predicted SOC data. This has important implications for assessing the degree and extent of soil degradation, most of which occurs on croplands worldwide [3].
Compared to previous studies, Deng et al. (2013) used a Danish SSL to monitor SOC changes over 23 years and found that VNIR effectively captured topsoil SOC trends and spatial patterns consistent with laboratory measurements [15]. Guerrero and Lorenzetti (2021) combined composite soil sampling with NIR spectroscopy to develop an inexpensive approach for spatial assessment of SOC changes over time, but they also stressed the necessity of using large-scale SSLs to develop localized prediction models for improved accuracy [16]. In this study, a spectra-based local predictive modeling approach was proposed, allowing temporally transferable models to be applied for SOC monitoring while effectively dealing with large-scale soil–spectra–environment complexities by considering both spectral and soil compositional similarities during the local learning procedure. The detected SOC changes proved effective in revealing the spatial patterns of significant SOC loss and gain (Figure 7). However, using a 10% threshold to detect SOC change may be problematic in practical applications, especially for locations with low initial SOC values, where a 10% relative change may fall within the range of prediction error. In this sense, while the general pattern of SOC change detected by soil spectroscopy is valuable, the absolute magnitude of change should be interpreted with caution. Future studies could develop an error-adjusted SOC change threshold to allow a more accurate account of SOC loss and gain. Also, the proposed approach could be applied in the context of monitoring management impacts on SOC dynamics, which is essential for evaluating the effect of sustainable agricultural practices [37]. Beyond assessments on soil degradation and management, spectra-based SOC monitoring could also be integrated with targeted verification of regenerative agricultural practices (e.g., cover cropping, reduced tillage), facilitating rapid auditing of carbon sequestration initiatives [8].
Despite demonstrating the potential of localized spectral modeling to monitor spatiotemporal SOC changes using large-scale SSLs, future applications of this technique should aim towards overcoming data scarcity and compatibility barriers. Considering the lack of temporally resolved spectral data worldwide, the establishment of temporally resolved spectral datasets necessitates (1) integration of national soil monitoring networks and long-term field experiments to include revisited soil sampling points [38] and (2) implementation of routine model recalibrations to dynamically update prediction models as new spectral–soil data becomes available. However, model transferability across diverse surveys or monitoring networks should be further investigated. In this regard, recent research has developed techniques, such as transfer learning [18] and spectral correction methods [39], to minimize the biases caused by different instruments and inconsistent measurement protocols.
Moreover, the local modeling strategy proposed in this study showed that adding soil property measurements as covariates could improve model performance, but this approach relies on the availability of high-quality legacy soil data, which are often lacking, especially outside of Europe, where resources like the LUCAS database are unavailable. For practical, large-scale applications in data-scarce regions, global soil mapping products (e.g., SoilGrids) represent a promising alternative source of covariate data for the local learning procedure. However, it is important to note that these mapping products themselves are model predictions, carrying inherent errors and uncertainties. Therefore, further investigation is required to determine if their application to the local modeling procedure could improve prediction accuracy. Lastly, with the recent advances in optical remote sensing of bare soils for SOC mapping [40,41,42], it remains to be tested whether spectra-based local learning models could be translated to satellite platforms, enabling pixel-wise prediction of SOC at enhanced accuracy.

5. Conclusions

This study developed a spectra-based predictive modeling approach to assess the capability of soil VNIR spectroscopy for SOC monitoring. Multiple modeling strategies were calibrated using the LUCAS soil database in 2009 and validated against the 2015 database. Localized spectral modeling strategies, particularly memory-based learning (MBL), largely enhanced the accuracy of soil organic carbon (SOC) predictions compared to global approaches, achieving R2 values of 0.72–0.79 across croplands, grasslands, and woodlands. Incorporating soil properties (e.g., texture, CEC) as covariates reduced spectral heterogeneity and improved model robustness. The adapted MBL framework successfully detected >70% of samples experiencing >10% SOC changes from 2009 to 2015. IDW-based spatial interpolation of 2015Pred–2009Obs and 2015Obs–2009Obs depicted similar patterns, demonstrating the monitoring capability of VNIR spectroscopy to identify hotspots experiencing significant SOC changes. These findings highlight the potential of combining spectral and pedological data in localized models to monitor SOC dynamics at scale, offering a viable tool for soil health assessment and climate-smart agricultural practices.

Supplementary Materials

The following supporting information can be downloaded at https://www.mdpi.com/article/10.3390/rs17193373/s1, Figure S1: Spatial distribution patterns of (a1) the differences of SOC observations in 2015 and 2009, and (a2) the differences of SOC predictions in 2015 and observations in 2009; Table S1: Summary statistics for soil samples from the LUCAS Soil 2009 data in France. Q1 and Q3 are the first and third quartiles, while SD stands for standard deviation.

Author Contributions

Conceptualization, D.W., H.C., Q.S. and P.S.; methodology, N.D., Q.S. and P.S.; validation, D.W., H.C., Q.S. and P.S.; formal analysis, N.D., Q.S. and P.S.; writing—original draft preparation, N.D., Q.S. and P.S.; writing—review and editing, N.D., D.W., H.C., Q.S. and P.S.; visualization, N.D. and Q.S.; supervision, D.W., H.C. and P.S.; funding acquisition, H.C. and P.S. All authors have read and agreed to the published version of the manuscript.

Funding

This study was funded by the National Key R&D Program of China (2023YFD1501100) and the Science and Technology Development Plan of Jilin Province, China (20250205024GH).

Data Availability Statement

The original data presented in the study are openly available at https://esdac.jrc.ec.europa.eu/projects/lucas (accessed on 5 September 2025).

Conflicts of Interest

The authors declare no conflicts of interest.

References

  1. Janzen, H.H. Carbon cycling in earth systems—A soil science perspective. Agric. Ecosyst. Environ. 2004, 104, 399–417. [Google Scholar] [CrossRef]
  2. Lal, R. Soil carbon sequestration to mitigate climate change. Geoderma 2004, 123, 1–22. [Google Scholar] [CrossRef]
  3. Lorenz, K.; Lal, R.; Ehlers, K. Soil organic carbon stock as an indicator for monitoring land and soil degradation in relation to United Nations’ Sustainable Development Goals. Land Degrad. Dev. 2019, 30, 824–838. [Google Scholar] [CrossRef]
  4. Urbina-Salazar, D.; Vaudour, E.; Richer-de-Forges, A.C.; Chen, S.; Martelet, G.; Baghdadi, N.; Arrouays, D. Sentinel-2 and Sentinel-1 Bare Soil Temporal Mosaics of 6-Year Periods for Soil Organic Carbon Content Mapping in Central France. Remote Sens. 2023, 15, 2410. [Google Scholar] [CrossRef]
  5. Paustian, K.; Lehmann, J.; Ogle, S.; Reay, D.; Robertson, G.P.; Smith, P. Climate-smart soils. Nature 2016, 532, 49–57. [Google Scholar] [CrossRef] [PubMed]
  6. Moinet, G.Y.K.; Hijbeek, R.; van Vuuren, D.P.; Giller, K.E. Carbon for soils, not soils for carbon. Glob. Change Biol. 2023, 29, 2384–2398. [Google Scholar] [CrossRef]
  7. Minasny, B.; Malone, B.P.; McBratney, A.B.; Angers, D.A.; Arrouays, D.; Chambers, A.; Chaplot, V.; Chen, Z.-S.; Cheng, K.; Das, B.S.; et al. Soil carbon 4 per mille. Geoderma 2017, 292, 59–86. [Google Scholar] [CrossRef]
  8. Smith, P.; Soussana, J.-F.; Angers, D.; Schipper, L.; Chenu, C.; Rasse, D.P.; Batjes, N.H.; van Egmond, F.; McNeill, S.; Kuhnert, M.; et al. How to measure, report and verify soil carbon change to realize the potential of soil carbon sequestration for atmospheric greenhouse gas removal. Glob. Change Biol. 2020, 26, 219–241. [Google Scholar] [CrossRef]
  9. Viscarra Rossel, R.A.; Behrens, T.; Ben-Dor, E.; Brown, D.J.; Dematte, J.A.M.; Shepherd, K.D.; Shi, Z.; Stenberg, B.; Stevens, A.; Adamchuk, V.; et al. A global spectral library to characterize the world’s soil. Earth-Sci. Rev. 2016, 155, 198–230. [Google Scholar] [CrossRef]
  10. Nocita, M.; Stevens, A.; van Wesemael, B.; Brown, D.J.; Shepherd, K.D.; Towett, E.; Vargas, R.; Montanarella, L. Soil spectroscopy: An opportunity to be seized. Glob. Change Biol. 2015, 21, 10–11. [Google Scholar] [CrossRef]
  11. Kalopesa, E.; Tziolas, N.; Tsakiridis, N.L.; Safanelli, J.L.; Hengl, T.; Sanderman, J. Large-Scale Soil Organic Carbon Estimation via a Multisource Data Fusion Approach. Remote Sens. 2025, 17, 771. [Google Scholar] [CrossRef]
  12. Li, S.; Shen, X.; Shen, X.; Cheng, J.; Xu, D.; Makar, R.S.; Guo, Y.; Hu, B.; Chen, S.; Hong, Y.; et al. Improving the Accuracy of Soil Classification by Using Vis–NIR, MIR, and Their Spectra Fusion. Remote Sens. 2025, 17, 1524. [Google Scholar] [CrossRef]
  13. Ben-Dor, E.; Inbar, Y.; Chen, Y. The reflectance spectra of organic matter in the visible near-infrared and short wave infrared region (400–2500 nm) during a controlled decomposition process. Remote Sens. Environ. 1997, 61, 1–15. [Google Scholar] [CrossRef]
  14. Viscarra Rossel, R.A.; Shen, Z.; Ramirez Lopez, L.; Behrens, T.; Shi, Z.; Wetterlind, J.; Sudduth, K.A.; Stenberg, B.; Guerrero, C.; Gholizadeh, A.; et al. An imperative for soil spectroscopic modelling is to think global but fit local with transfer learning. Earth-Sci. Rev. 2024, 254, 104797. [Google Scholar] [CrossRef]
  15. Deng, F.; Minasny, B.; Knadel, M.; McBratney, A.; Heckrath, G.; Greve, M.H. Using Vis-NIR Spectroscopy for Monitoring Temporal Changes in Soil Organic Carbon. Soil Sci. 2013, 178, 389–399. [Google Scholar] [CrossRef]
  16. Guerrero, C.; Lorenzetti, R. Use of composite samples and NIR spectroscopy to detect changes in SOC contents. Geoderma 2021, 396, 115069. [Google Scholar] [CrossRef]
  17. Orgiazzi, A.; Ballabio, C.; Panagos, P.; Jones, A.; Fernández-Ugalde, O. LUCAS Soil, the largest expandable soil dataset for Europe: A review. Eur. J. Soil Sci. 2018, 69, 140–153. [Google Scholar] [CrossRef]
  18. Shen, Z.; Ramirez-Lopez, L.; Behrens, T.; Cui, L.; Zhang, M.; Walden, L.; Wetterlind, J.; Shi, Z.; Sudduth, K.A.; Baumann, P.; et al. Deep transfer learning of global spectra for local soil carbon monitoring. ISPRS J. Photogramm. Remote Sens. 2022, 188, 190–200. [Google Scholar] [CrossRef]
  19. Gruszczyński, S.; Gruszczyński, W. Supporting soil and land assessment with machine learning models using the Vis-NIR spectral response. Geoderma 2022, 405, 115451. [Google Scholar] [CrossRef]
  20. St. Luce, M.; Ziadi, N.; Viscarra Rossel, R.A. GLOBAL-LOCAL: A new approach for local predictions of soil organic carbon content using large soil spectral libraries. Geoderma 2022, 425, 116048. [Google Scholar] [CrossRef]
  21. Shi, Z.; Wang, Q.L.; Peng, J.; Ji, W.J.; Liu, H.J.; Li, X.; Viscarra Rossel, R.A. Development of a national VNIR soil-spectral library for soil classification and prediction of organic matter concentrations. Sci. China Earth Sci. 2014, 57, 1671–1680. [Google Scholar] [CrossRef]
  22. Ramirez-Lopez, L.; Behrens, T.; Schmidt, K.; Stevens, A.; Dematte, J.A.M.; Scholten, T. The spectrum-based learner: A new local approach for modeling soil vis-NIR spectra of complex datasets. Geoderma 2013, 195, 268–279. [Google Scholar] [CrossRef]
  23. Wang, Z.; Chen, S.; Lu, R.; Zhang, X.; Ma, Y.; Shi, Z. Non-linear memory-based learning for predicting soil properties using a regional vis-NIR spectral library. Geoderma 2024, 441, 116752. [Google Scholar] [CrossRef]
  24. Lobsey, C.R.; Viscarra Rossel, R.A.; Roudier, P.; Hedley, C.B. rs-local data-mines information from spectral libraries to improve local calibrations. Eur. J. Soil Sci. 2017, 68, 840–852. [Google Scholar] [CrossRef]
  25. Tziolas, N.; Tsakiridis, N.; Ben-Dor, E.; Theocharis, J.; Zalidis, G. A memory-based learning approach utilizing combined spectral sources and geographical proximity for improved VIS-NIR-SWIR soil properties estimation. Geoderma 2019, 340, 11–24. [Google Scholar] [CrossRef]
  26. Lamichhane, S.; Kumar, L.; Wilson, B. Digital soil mapping algorithms and covariates for soil organic carbon mapping and their implications: A review. Geoderma 2019, 352, 395–413. [Google Scholar] [CrossRef]
  27. Garosi, Y.; Ayoubi, S.; Nussbaum, M.; Sheklabadi, M. Effects of different sources and spatial resolutions of environmental covariates on predicting soil organic carbon using machine learning in a semi-arid region of Iran. Geoderma Reg. 2022, 29, e00513. [Google Scholar] [CrossRef]
  28. Sun, Z.; Liu, F.; Wang, D.; Wu, H.; Zhang, G. Improving 3D Digital Soil Mapping Based on Spatialized Lab Soil Spectral Information. Remote Sens. 2023, 15, 5228. [Google Scholar] [CrossRef]
  29. Stevens, A.; Nocita, M.; Toth, G.; Montanarella, L.; van Wesemael, B. Prediction of Soil Organic Carbon at the European Scale by Visible and Near InfraRed Reflectance Spectroscopy. PLoS ONE 2013, 8, e66409. [Google Scholar] [CrossRef]
  30. Nocita, M.; Stevens, A.; Toth, G.; Panagos, P.; van Wesemael, B.; Montanarella, L. Prediction of soil organic carbon content by diffuse reflectance spectroscopy using a local partial least square regression approach. Soil Biol. Biochem. 2014, 68, 337–347. [Google Scholar] [CrossRef]
  31. Sun, Q.; Shi, P. Enhancing proximal and remote sensing of soil organic carbon: A local modelling approach guided by spectral and spatial similarities. Geoderma 2025, 457, 117298. [Google Scholar] [CrossRef]
  32. R Core Team. R: A Language and Environment for Statistical Computing; R Foundation for Statistical Computing: Vienna, Austria, 2022. [Google Scholar]
  33. Peng, Y.; Ben-Dor, E.; Biswas, A.; Chabrillat, S.; Demattê, J.A.M.; Ge, Y.; Gholizadeh, A.; Gomez, C.; Guerrero, C.; Herrick, J.; et al. Spectroscopic solutions for generating new global soil information. Innovation 2025, 6, 100839. [Google Scholar] [CrossRef]
  34. Viscarra Rossel, R.A.; Behrens, T.; Ben-Dor, E.; Chabrillat, S.; Demattê, J.A.M.; Ge, Y.; Gomez, C.; Guerrero, C.; Peng, Y.; Ramirez-Lopez, L.; et al. Diffuse reflectance spectroscopy for estimating soil properties: A technology for the 21st century. Eur. J. Soil Sci. 2022, 73, e13271. [Google Scholar] [CrossRef]
  35. Ramirez-Lopez, L.; Behrens, T.; Schmidt, K.; Rossel, R.A.V.; Demattê, J.A.M.; Scholten, T. Distance and similarity-search metrics for use with soil vis–NIR spectra. Geoderma 2013, 199, 43–53. [Google Scholar] [CrossRef]
  36. Sims, N.C.; Newnham, G.J.; England, J.R.; Guerschman, J.; Cox, S.J.D.; Roxburgh, S.H.; Viscarra Rossel, R.A.; Fritz, S.; Wheeler, I. Good Practice Guidance. SDG Indicator 15.3.1, Proportion of Land That Is Degraded over Total Land Area. Version 2.0; United Nations: New York, NY, USA, 2021. [Google Scholar]
  37. Ma, J.; Shi, P. Remotely sensed inter-field variation in soil organic carbon content as influenced by the cumulative effect of conservation tillage in northeast China. Soil Tillage Res. 2024, 243, 106170. [Google Scholar] [CrossRef]
  38. Baumann, P.; Helfenstein, A.; Gubler, A.; Keller, A.; Meuli, R.G.; Wächter, D.; Lee, J.; Viscarra Rossel, R.; Six, J. Developing the Swiss mid-infrared soil spectral library for local estimation and monitoring. SOIL 2021, 7, 525–546. [Google Scholar] [CrossRef]
  39. Safanelli, J.L.; Hengl, T.; Parente, L.L.; Minarik, R.; Bloom, D.E.; Todd-Brown, K.; Gholizadeh, A.; Mendes, W.d.S.; Sanderman, J. Open Soil Spectral Library (OSSL): Building reproducible soil calibration models through open development and community engagement. PLoS ONE 2025, 20, e0296545. [Google Scholar] [CrossRef] [PubMed]
  40. Shi, P.; Six, J.; Sila, A.; Vanlauwe, B.; Van Oost, K. Towards spatially continuous mapping of soil organic carbon in croplands using multitemporal Sentinel-2 remote sensing. ISPRS J. Photogramm. Remote Sens. 2022, 193, 187–199. [Google Scholar] [CrossRef]
  41. Hong, Y.; Chen, Y.; Chen, S.; Wang, Y.; Hu, W.; Ye, S.; Song, X.; Liu, F.; Zhao, Y.; Demattê, J.A.M.; et al. Bridging the gap between laboratory VNIR-SWIR spectra and Landsat-8 bare soil composite image for soil organic carbon prediction. Remote Sens. Environ. 2025, 328, 114874. [Google Scholar] [CrossRef]
  42. Tziolas, N.; Tsakiridis, N.; Heiden, U.; van Wesemael, B. Soil organic carbon mapping utilizing convolutional neural networks and Earth observation data, a case study in Bavaria state Germany. Geoderma 2024, 444, 116867. [Google Scholar] [CrossRef]
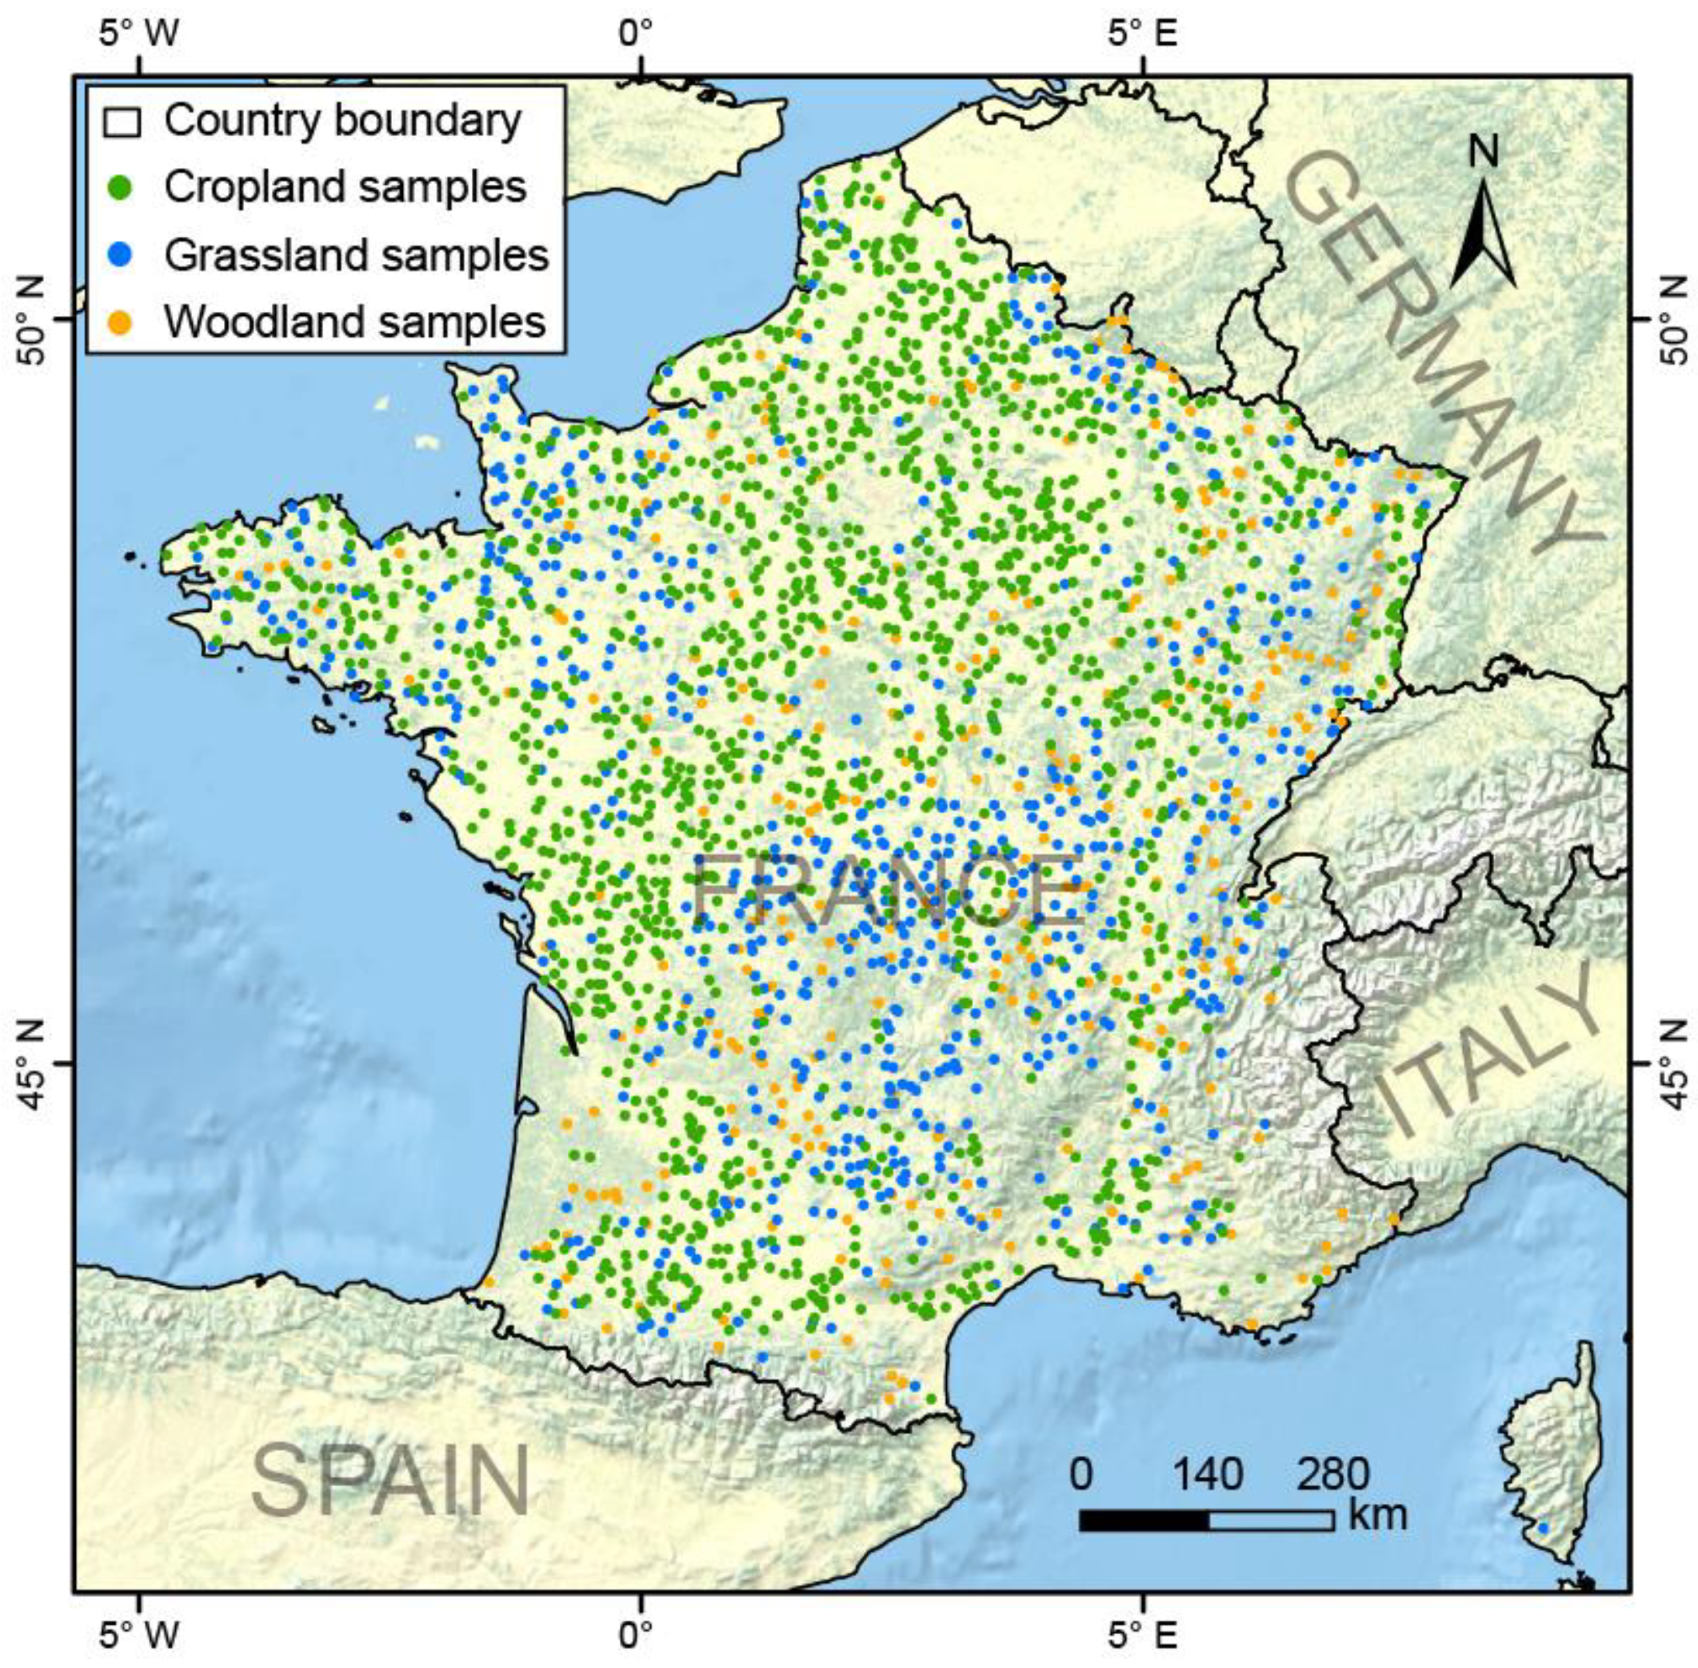
Figure 1. Spatial distribution of LUCAS soil samples in 2009 and revisited in 2015 for France. Samples are categorized into cropland, grassland, and woodland according to the land use classes in 2009.
Remotesensing 17 03373 g001
Figure 2. The flowchart illustrates the modeling process, including data partitioning into three land use classes, followed by spectral pre-processing and spectra modeling using both global and local modeling strategies.
Remotesensing 17 03373 g002
Figure 3. SOC content and corresponding VNIR spectral characteristic. Density plots show similar distribution patterns of SOC between 2009 and 2015. The similarity is also reflected in the absorbance curves. Solid lines represent the average spectra of all samples in 2009 and 2015, and the shaded area depicts the standard deviation from the mean spectra.
Remotesensing 17 03373 g003
Figure 4. Scatterplots of predicted versus observed SOC in 2015. Observation data in 2009 served as the calibration dataset to derive localized prediction models for the 2015 samples. Spectrally predicted values are the results of the optimal MBL modeling strategy in Table 2.
Remotesensing 17 03373 g004
Figure 5. Variable importance in projection (VIP) for three modeling strategies, i.e., (a) PLSR, (b) GLOBAL-LOCAL, and (c) MBL, and land use types, highlighting the consistency and physical significance of the spectral models across all test cases. The figures for GLOBAL-LOCAL and MBL were generated based on one test instance.
Remotesensing 17 03373 g005
Figure 6. Comparisons between the differences of SOC observations in 2015 and 2009 and the differences of SOC predictions in 2015 and observations in 2009.
Remotesensing 17 03373 g006
Figure 7. Spatial distribution patterns of (a1) the differences of SOC observations in 2015 and 2009 and (a2) the differences of SOC predictions in 2015 and observations in 2009, as superimposed by the distribution of surveyed land use types (see also Figure 1). The maps were generated through IDW interpolation. In (a1,a2), the red box B corresponds to (b1,b2), while the black box C corresponds to (c1,c2). SOC losses were more associated with cropland soils, while hotspots that received significant SOC gain mostly concentrated in grassland and woodland soils. The same maps without superimposed land use information are provided as Figure S1 in the Supporting Information.
Remotesensing 17 03373 g007
Table 1. The rate of change in SOC content for different land use types from 2009 to 2015. The rate of change was calculated as (2015 observed value—2009 observed value)/2009 observed value, and the results were divided into three groups. SD stands for standard deviation.
Land UseParameterSOC Change in Percentage
≥10%≤−10%−10–10%
CroplandSample size430534489
Mean SOC21.6213.8416.28
SD10.286.957.82
GrasslandSample size284219168
Mean SOC43.6925.9735.74
SD31.1214.1917.17
WoodlandSample size16410040
Mean SOC66.7130.8953.79
SD53.0817.9742.23
Table 2. Model performances of different model strategies, including global PLSR, MBL, and GLOBAL-LOCAL algorithms. All results are model validation results against SOC observations in 2015. Descriptions of the modeling strategies are given in Section 2.2.
Land UseModeling StrategyRMSER2RPDRPIQ
CroplandPLSR 15.670.601.581.78
PLSR 25.100.671.751.98
MBL 15.350.641.671.89
MBL 24.870.701.832.07
MBL 34.730.721.892.14
GLOBAL_LOCAL 15.600.611.601.80
GLOBAL_LOCAL 25.100.671.751.98
GLOBAL_LOCAL 34.990.691.792.02
GrasslandPLSR 116.400.561.501.33
PLSR 214.400.661.711.52
MBL 114.470.651.701.51
MBL 212.400.751.991.76
MBL 312.530.741.971.74
GLOBAL_LOCAL 115.390.611.601.42
GLOBAL_LOCAL 213.660.691.801.60
GLOBAL_LOCAL 313.550.701.821.61
WoodlandPLSR 124.490.711.871.51
PLSR 222.070.772.081.67
MBL 127.780.631.651.33
MBL 221.700.782.111.70
MBL 320.920.792.191.77
GLOBAL_LOCAL 123.900.731.921.55
GLOBAL_LOCAL 221.650.782.121.71
GLOBAL_LOCAL 321.700.782.111.70
Table 3. The sample size of detected SOC changes matching those presented in Table 1.
2009 Land
Use Classes
ParameterPercentage Variation
≥10%≤−10%−10–10%
CroplandSize286377223
Ratio of detection66.5%70.6%45.6%
GrasslandSize23412162
Ratio of detection82.4%55.3%36.9%
WoodlandSize1405819
Ratio of detection85.9%58.0%47.5%
Table 4. Predictive accuracy of the MBL model after excluding organic soils (SOC > 120 g/kg) in grassland and woodland subsets.
2009 Land Use ClassesRMSER2RPDRPIQ
Grassland9.880.751.982.19
Woodland18.140.661.711.84
Disclaimer/Publisher’s Note: The statements, opinions and data contained in all publications are solely those of the individual author(s) and contributor(s) and not of MDPI and/or the editor(s). MDPI and/or the editor(s) disclaim responsibility for any injury to people or property resulting from any ideas, methods, instructions or products referred to in the content.