Article

Toward Automatic 3D Model Reconstruction of Building Curtain Walls from UAV Images Based on NeRF and Deep Learning

School of Civil Engineering, Southeast University, Nanjing 211189, China
*
Author to whom correspondence should be addressed.
Remote Sens. 2025, 17(19), 3368; https://doi.org/10.3390/rs17193368
Submission received: 11 September 2025 / Revised: 2 October 2025 / Accepted: 3 October 2025 / Published: 5 October 2025
(This article belongs to the Section AI Remote Sensing)

Abstract

Highlights

What are the main findings?
  • A BIM model reconstruction method based on NeRF and deep learning is estab-lished.
  • The overall accuracy of semantic segmentation for curtain wall point clouds is 71.8%.
  • The overall dimensional error of the reconstructed BIM model is within 0.1m.
What is the implication of the main finding?
  • For curtain wall reconstruction, NeRF performs better than photogrammetry.
  • For semantic segmentation of curtain wall point clouds, the deep learning method is superior to the traditional method.

Abstract

The Automated Building Information Modeling (BIM) reconstruction of existing building curtain walls is crucial for promoting digital Operation and Maintenance (O&M). However, existing 3D reconstruction technologies are mainly designed for general architectural scenes, and there is currently a lack of research specifically focused on the BIM reconstruction of curtain walls. This study proposes a BIM reconstruction method from unmanned aerial vehicle (UAV) images based on neural radiance field (NeRF) and deep learning-based semantic segmentation. The proposed method compensates for the lack of semantic information in traditional NeRF methods and could fill the gap in the automatic reconstruction of semantic models for curtain walls. A comprehensive high-rise building is selected as a case study to validate the proposed method. The results show that the overall accuracy (OA) for semantic segmentation of curtain wall point clouds is 71.8%, and the overall dimensional error of the reconstructed BIM model is less than 0.1m, indicating high modeling accuracy. Additionally, this study compares the proposed method with photogrammetry-based reconstruction and traditional semantic segmentation methods to further validate its effectiveness.

1. Introduction

As a widely adopted facade solution for high-rise buildings, curtain walls have a critical impact on overall building quality through their safety, aesthetic value, and functional performance [1,2]. Consequently, curtain wall systems generate complex Operation and Maintenance (O&M) requirements during long-term service [3]. Facing increasingly sophisticated management demands, the traditional reactive O&M model, reliant on manual expertise, is undergoing profound transformation, while digital O&M has emerged as an inevitable industry trend. Within this context, Building Information Modeling (BIM) technology demonstrates significant value—it establishes a structured information repository integrating geometric data, material properties, functional parameters of components, and full lifecycle maintenance records [4]. Therefore, establishing accurate BIM models for existing building curtain walls is crucial for promoting the digital transformation of curtain wall O&M.
Although BIM technology has become increasingly mature in the design and construction phases of new buildings [4,5,6,7], the modeling of existing curtain walls still heavily relies on manual operations. Because of the complex structure of curtain walls and challenges in data acquisition, manual BIM modeling is time-consuming and requires substantial manpower and financial resources. Moreover, manual operations are prone to subjective errors, making it difficult to continuously ensure the accuracy of the models. In the digital age, building O&M is evolving toward digitalization and intelligence, thereby imposing higher requirements on the accuracy and update frequency of BIM models for existing building curtain walls. The existing manual modeling approach is insufficient to meet the urgent needs of digital operation and maintenance. Therefore, actively developing automated BIM modeling technology for curtain walls holds significant practical importance and urgency.
BIM model reconstruction refers to the process of using various data collection techniques to obtain geometric and non-geometric information of buildings or infrastructure, and transforming this information into a 3D digital model containing rich attribute data through specific algorithms and software tools. Existing 3D reconstruction techniques depend on laser scanning or photogrammetry to acquire point cloud data of structures. Laser scanning imposes stringent equipment requirements and prohibitive costs, hindering its feasibility for high-altitude curtain wall applications [5,8,9]. Photogrammetry relies on distinct surface textures, but it is ineffective for curtain walls dominated by homogeneous materials, often producing inaccurate results [10].
Against this backdrop, Neural Radiance Fields (NeRF) emerges as a novel 3D reconstruction approach, demonstrating unique advantages. NeRF’s core methodology employs deep learning neural networks to synthesize continuous 3D scene representations directly from sparse 2D input images. This technique generates photorealistic novel views and point clouds with superior detail reconstruction capabilities while exhibiting enhanced robustness for low-texture surfaces [11].
Despite NeRF’s groundbreaking progress in computer vision and graphics, research and applications remain concentrated on small objects, indoor scenes, or natural landscapes [11,12,13]. The application of building curtain walls is almost an unexplored field. Architectural curtain walls exhibit significant differences from the other components in existing building scenarios. Curtain walls not only have complex geometric shapes but also feature a diverse range of surface materials. Moreover, they often present rich visual effects due to the influence of multiple factors such as lighting and the environment. Existing 3D reconstruction technologies cannot accurately handle these complex factors and are difficult to directly apply to curtain walls. In addition, current NeRF-based methods are mainly limited to rendering tasks and lack semantic information, making it impossible to segment curtain wall components such as mullions and panels (Figure 1).
The research objective of this paper is to reconstruct BIM models for existing buildings with curtain walls in order to achieve their digital operation and maintenance. The research problem of this paper is to solve the problem that manual methods are time-consuming and laborious, and existing photogrammetry methods have poor reconstruction effects on weak texture areas. Based on this analysis, this paper proposes a reconstruction method for existing curtain walls from unmanned aerial vehicle (UAV) images based on NeRF and deep learning semantic segmentation. UAV is used to obtain rich exterior images of high-rise buildings, and the UAV images are input into NeRF to obtain point cloud data of the building’s exterior. Then, this study applies a deep learning semantic segmentation method to classify curtain wall point clouds, and modeling parameters are obtained. Finally, the automated modeling of the curtain wall is carried out.
The rest of this paper is organized as follows. Section 2 outlines the relevant works. Section 3 introduces the methods used in this study and explains the experimental setup and parameter selection. Section 4 presents the results of the experiment. Section 5 discusses the results of different algorithms. Section 6 summarizes this study.

2. Related Work

2.1. Image-Based 3D Model Reconstruction

Image-based 3D model reconstruction is the process of recovering the 3D geometry and surface texture of a scene or object from a series of 2D images captured at different perspectives, using algorithms in computer vision and computer graphics.
In the field of image-based 3D model reconstruction, traditional methods have achieved remarkable results. Structure from Motion (SfM) is a classical approach that estimates camera trajectory and reconstructs 3D structure by analyzing sequential image data [14,15]. Multi-View Stereo (MVS) makes use of images from multiple viewpoints. By calculating the disparity between images, the depth information of the object is obtained, and then a 3D model is constructed [16,17]. Poisson reconstruction, based on point cloud data, generates smooth 3D surfaces by solving the Poisson equation. It effectively handles noisy and incomplete data, resulting in more accurate models [18].
In the construction industry, image-based 3D model reconstruction technology demonstrates immense application potential. This technology can create detailed models of indoor scenes, capturing every nuance [19]. Image-based reconstruction can also provide comprehensive models of outdoor buildings, clearly displaying their appearance, structure, and surrounding environment [6]. Currently, image-based 3D model reconstruction has been widely applied in the field of digital cultural heritage protection. Through the 3D reconstruction of historical buildings and cultural sites, the precious historical information of historical buildings is preserved, providing convenience for future generations to study and appreciate [20]. In surveying and urban planning, 3D models based on image reconstruction can offer more intuitive and accurate information about terrain, landforms, and building distributions, assisting urban planners in making scientific and reasonable plans and decisions [21]. In the O&M of existing buildings, image-based 3D models can monitor structural changes and damage in real time, enabling timely detection of safety hazards and ensuring safe building use [22,23,24].
However, despite the significant application value of image-based 3D model reconstruction technology in the field of building digitization, there is still a lack of reconstruction methods for curtain walls. As a common facade form in modern buildings, curtain walls generally feature a large area of homogeneous materials such as glass and metal panels. Traditional image-based 3D reconstruction methods highly rely on the rich texture features on the scene surface for feature extraction and matching. The strong specular reflection and transmission characteristics of curtain wall glass make it difficult for traditional methods to handle effectively, resulting in low precision or even failed reconstruction of the models. Some photogrammetric reconstruction methods for materials similar to curtain walls (such as windows) have not achieved good results [25], or they need to be combined with laser scanning point clouds to reconstruct the model of the component [26]. Therefore, there is an urgent need to develop an image-based 3D reconstruction method suitable for curtain walls.

2.2. Application of NeRF in the Field of Architecture

NeRF is a deep learning based implicit representation method for 3D scenes. Compared with traditional explicit 3D reconstruction methods, NeRF can directly generate highly realistic novel view synthesis results with complex material details, showing advantages in handling weakly textured regions and complex appearances [11]. In the architectural field, the application of NeRF is gradually increasing, with main application scenarios including construction progress monitoring, prefabricated component detection, and complex scene reconstruction. Jeon et al. [7] proposed a NeRF-based scene understanding method synchronized with BIM for construction site progress monitoring. Li et al. [27] presented an improved NeRF point sampling method suitable for UAV views. Chen et al. [10] introduced a sparse voxel-based NeRF that can be applied to 3D reconstruction of urban scenes. Lee et al. [28] used neural radiance fields to generate point clouds for the identification of bridge prefabricated components. Cui et al. [29] proposed NeRFusion for complex architectural scene reconstruction, which integrates Mip–NeRF and iNGP and improves the accuracy of 3D reconstruction by adding geometric constraints. Dong et al. [30] proposed SRecon–NeRF to obtain point clouds with semantic and geometric information, which can be applied to indoor construction progress monitoring. Fan et al. [31] presented Edge–NeRF, a 3D wireframe model reconstruction method using neural implicit fields, which achieved self-supervised extraction of 3D wireframe models. Hermann et al. [32] evaluated the accuracy and completeness of three methods—Mega–NeRF, Block–NeRF, and direct voxel grid optimization—for reconstructing large-scale outdoor scenes. The summary of relevant research is shown in Table 1.
Although NeRF has achieved applications in areas such as indoor scene reconstruction and the identification of simple components, these efforts remain limited to relatively regular structures and have not yet addressed building curtain walls. The effectiveness of NeRF in the reconstruction of building curtain walls is still unclear. In addition, the current NeRF has not been adequately integrated with semantic segmentation. Semantic segmentation technology can assign semantic information to different parts of an image or 3D model, for example, distinguishing between the mullions and panels of a curtain wall. Without integration with semantic segmentation, current NeRF models lack semantic-level information, which limits their practical application value.
To address this issue, this paper proposes a method that combines NeRF with semantic segmentation technology. This method enables the generated 3D models to not only possess precise geometric shapes and rich visual details but also contain abundant semantic information, thereby having broader application potential in the 3D reconstruction of architectural curtain walls.

3. Materials and Methods

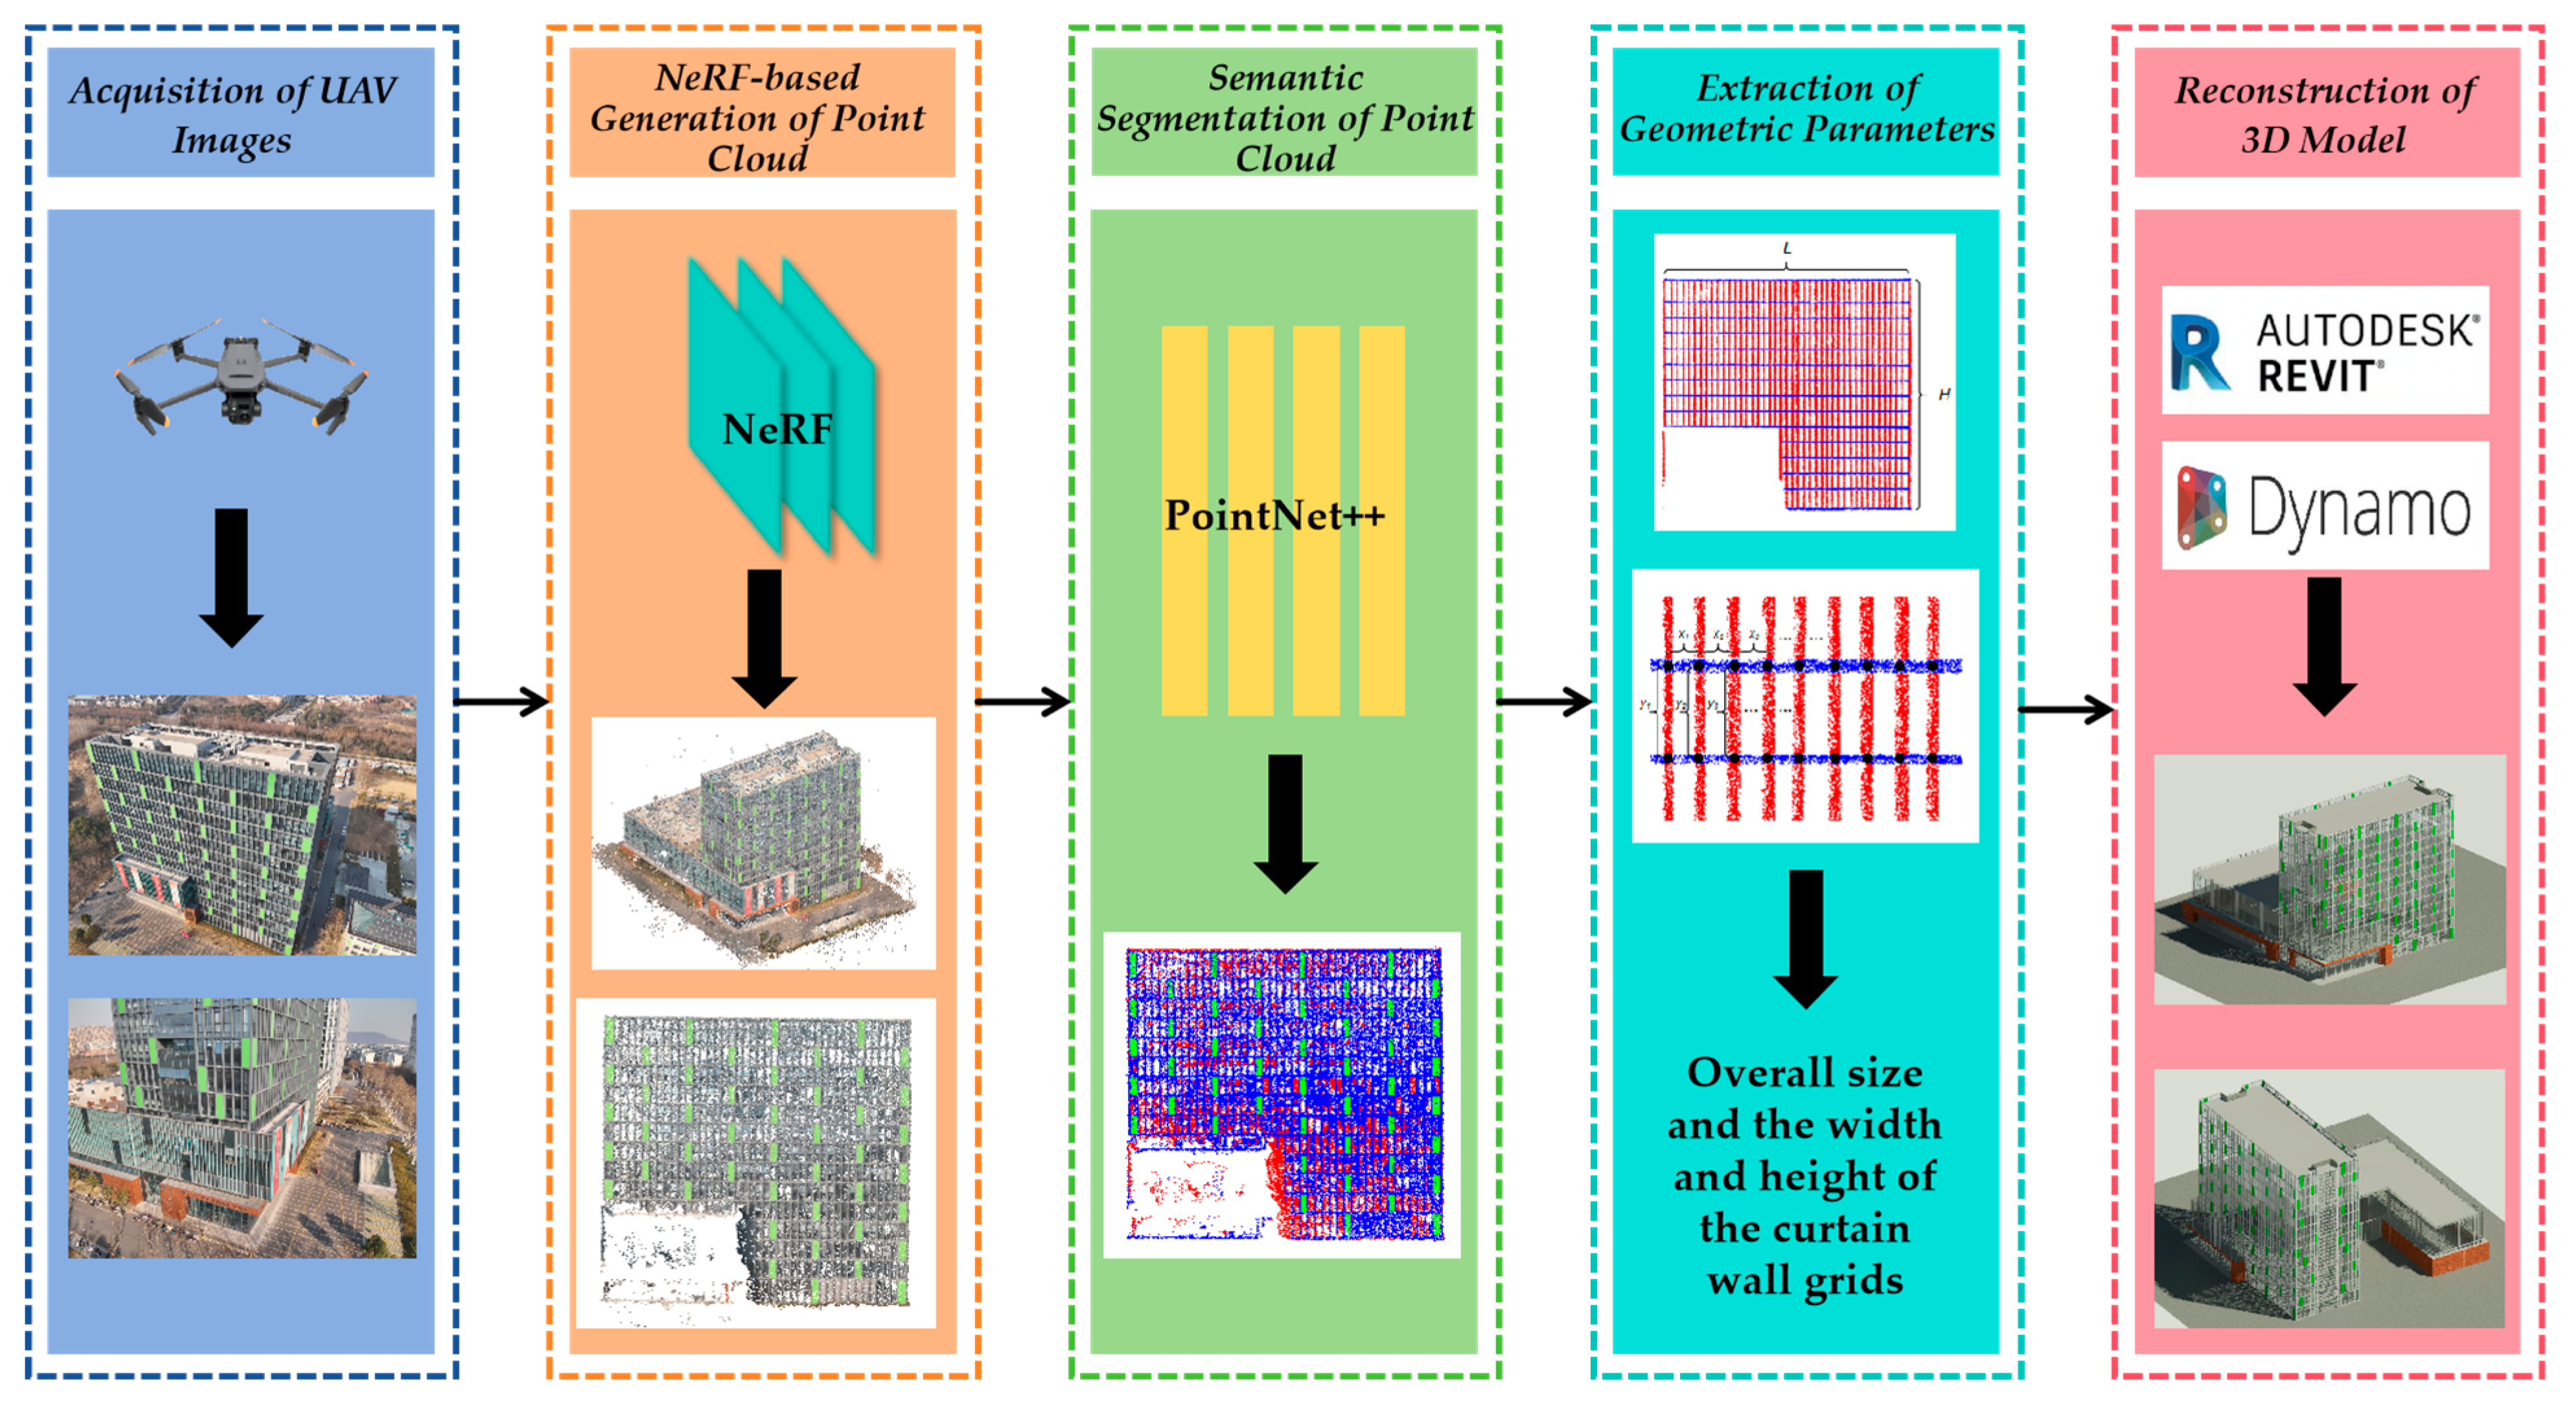
This paper proposes a BIM reconstruction method for existing building curtain walls based on NeRF, as shown in Figure 2. Firstly, UAV-based image acquisition technology was introduced, as detailed in Section 3.1. Then, NeRF-based generation of point clouds was introduced, as detailed in Section 3.2. Semantic segmentation of curtain wall point cloud using PointNet++ was introduced, as detailed in Section 3.3. Extraction of geometric parameters of curtain walls from point clouds was proposed, as detailed in Section 3.4. Finally, the reconstruction technique of the BIM model was introduced, as detailed in Section 3.5.

3.1. UAV-Based Image Acquisition

As an emerging and highly promising approach, UAV-based image acquisition technology is gradually becoming an important means of data acquisition in the construction industry. UAV-based image acquisition refers to an advanced technology that utilizes high-resolution cameras mounted on UAVs to obtain detailed image data of buildings and their surrounding environments from the air [33].
The core process of UAV-based image acquisition technology is rigorous and well-structured, encompassing key steps from task planning to data acquisition. First, it is essential to clarify the task objectives, such as detecting quality defects, monitoring progress, or conducting 3D modeling. Based on these objectives, a detailed plan is formulated, which includes precisely defining the flight area, reasonably determining the flight altitude, meticulously planning the flight path, and scientifically setting the image overlap rate [6,34].
Subsequently, the UAV equipped with cameras executes the flight mission automatically or manually according to the pre-designed plan. In automatic mode, the UAV accurately collects a vast number of images based on the preset flight path and parameters, minimizing human errors [35,36]. In manual mode, operators can flexibly adjust the flight attitude and shooting angle to obtain more detailed images. With its flexibility and maneuverability, the UAV can access areas that are difficult to reach using traditional methods, enabling the acquisition of comprehensive image data.
UAV-based image acquisition technology offers unique advantages, providing rapid, safe, comprehensive, and high-precision aerial images and 3D data. Compared with traditional approaches, the UAV-based method can complete large area image acquisition in a short time, shortening the data acquisition period. UAV-based image acquisition eliminates the need for personnel to enter hazardous areas and ensures the safety of operators. The aerial perspective overcomes the limitations and occlusions of ground photogrammetry, delivering more comprehensive data. High-resolution cameras equipped on UAVs and advanced processing technologies guarantee data accuracy. Currently, UAV-based image acquisition technology has been applied in various aspects such as building quality inspection, progress monitoring, and 3D modeling. [37,38]. As a key technology for the digital transformation of the construction industry, UAV-based image acquisition technology runs through the entire life cycle of buildings, from the planning, design, and construction stages to the operation and maintenance stages of projects. This technology can provide powerful data support for each link, greatly improving the efficiency, safety, and decision-making quality of construction projects.

3.2. NeRF-Based Generation of Point Cloud

NeRF is a deep learning-based technique for 3D scene representation and rendering [11]. The fundamental input to NeRF comprises a collection of 2D images capturing the same static scene, accompanied by precise camera poses corresponding to each image. This framework enables high-fidelity new view synthesis from sparse 2D inputs. The workflow of NeRF is shown in Figure 3.
The core concept of NeRF is implicitly modeling a continuous radiance field of the 3D scene using an MLP neural network. The computational workflow of NeRF comprises two principal stages: MLP and volume rendering. MLP maps the 3D location (x, y, z) and 2D viewing direction (the azimuth and elevation angles of spherical coordinates, θ, ϕ) of any point in space to its color (RGB) and volume density (σ), which can be expressed using the following Formula (1):
F θ : ( x , y , z , θ , ϕ ) ( R , G , B , σ )
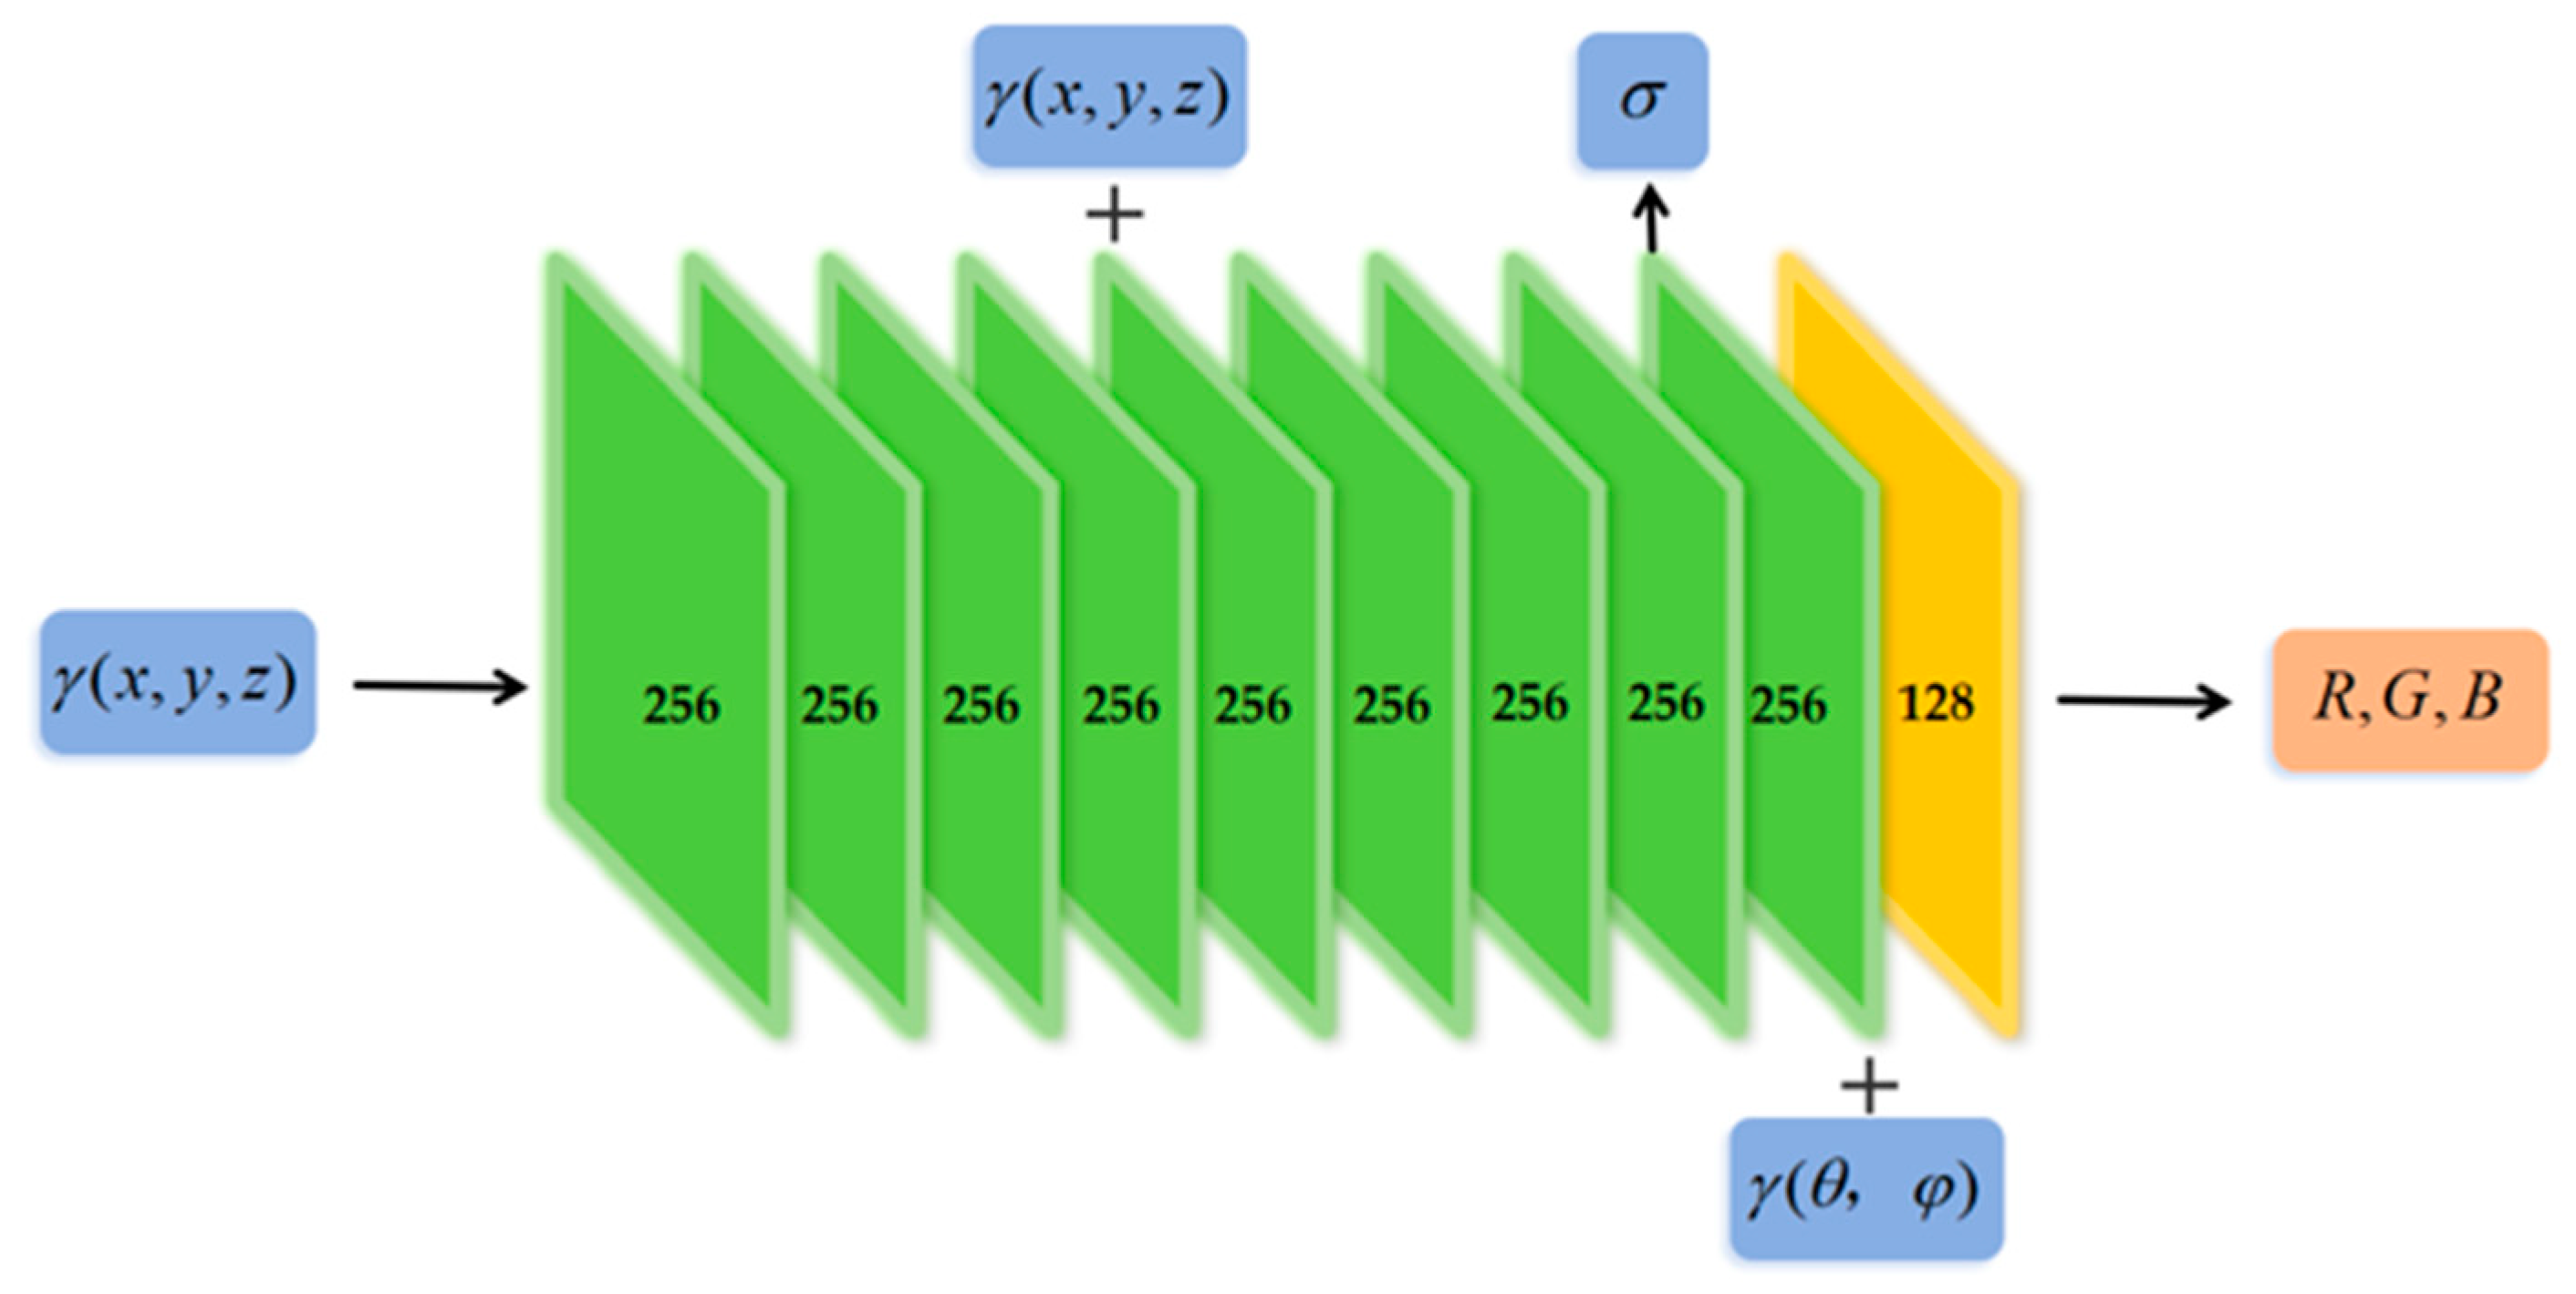
The input to this MLP is a 5D vector representing a spatial point, comprising its positional coordinates (x, y, z) and viewing direction (θ, ϕ). This representation enables NeRF to model light transport phenomena within a medium, including propagation, reflection, refraction, and scattering, while simultaneously accounting for energy conversion processes such as absorption and emission. The MLP outputs a four-dimensional vector consisting of the point’s volume density (σ) and RGB color (R, G, B). Specifically, NeRF first feeds the positional coordinate vector (x, y, z) into an 8-layer fully connected network. This network outputs volume density (σ) and a 256-dimensional intermediate feature vector. This intermediate feature is then concatenated with the viewing direction (θ, ϕ) and passed into an additional fully connected layer (128-dimensional) to predict the RGB color, as shown in Figure 4. This architecture ensures that volume density (σ) depends on position (x, y, z) and is independent of viewing direction (θ, ϕ), whereas the RGB color depends on both position (x, y, z) and viewing direction (θ, ϕ). Since neural networks struggle to learn high-frequency details, directly inputting raw positional and viewing coordinates results in low-resolution renderings. To address this, NeRF employs a positional encoding technique. This method maps the inputs into a higher-dimensional space, enabling the MLP to better represent coordinate information.
Volume rendering is a method used for visualizing 3D data, which aims to convert voxels in the data into images in order to display their internal structure and features. NeRF uses classic volume rendering methods to render scenes, with the core idea of projecting light rays onto 3D voxel data and calculating voxel transparency and color along the light ray path to generate the final rendered image. For continuous scenes, NeRF has designed a hierarchical volume sampling method that can reduce rendering time and improve rendering efficiency.
Although NeRF has shown outstanding performance in new perspective synthesis and 3D reconstruction, there are still multiple limitations. In recent years, some studies have proposed targeted improvement directions. This paper focuses on Nerfacto in Nerfstudio. Nerfstudio provides real-time visualization tools and simplified processes for NeRF development by offering a modular framework, enhancing the efficiency of researchers and developers in utilizing NeRF technology. Nerfacto is the default method recommended by Nerfstudio. This method optimizes the camera angle and uses segmented samplers to improve sampling efficiency, and uses small-scale fusion MLP and hash encoding to improve the computational efficiency of the scene density function [13].

3.3. Semantic Segmentation of Point Cloud

Point cloud semantic segmentation serves as a core and crucial task in the field of 3D computer vision, playing an indispensable role in numerous practical application scenarios [9,39,40]. The primary objective of point cloud semantic segmentation is to accurately process unordered and discrete 3D point cloud data by dividing the entire point cloud dataset into different subsets or regions in a reasonable and effective manner based on the semantic attributes of each point. This division provides a solid and robust foundation for subsequent tasks such as 3D scene understanding, object recognition, and modeling.
Throughout the development of point cloud semantic segmentation, common segmentation methods can be mainly classified into two categories: traditional methods and deep learning-based methods. Traditional methods, including region growing algorithms [41] and clustering algorithms [42], held a certain position in early research and applications. However, they face numerous significant challenges in practical applications. Due to the inherent characteristics of point cloud data, such as sparsity, disorder, irregularity, and the occurrence of occlusions during data collection, traditional methods often struggle to achieve ideal results, with limited accuracy and stability in point cloud processing.
In recent years, with the rapid development of artificial intelligence technology, deep learning-based point cloud semantic segmentation methods have made remarkable progress and shown a thriving trend. A series of representative deep learning models have emerged, such as PointNet [43] and PointNet++ [43]. By introducing the structures and algorithms of deep neural networks, these models can automatically learn complex features from point cloud data, thereby significantly improving the performance and effectiveness of semantic segmentation [39,40,44].
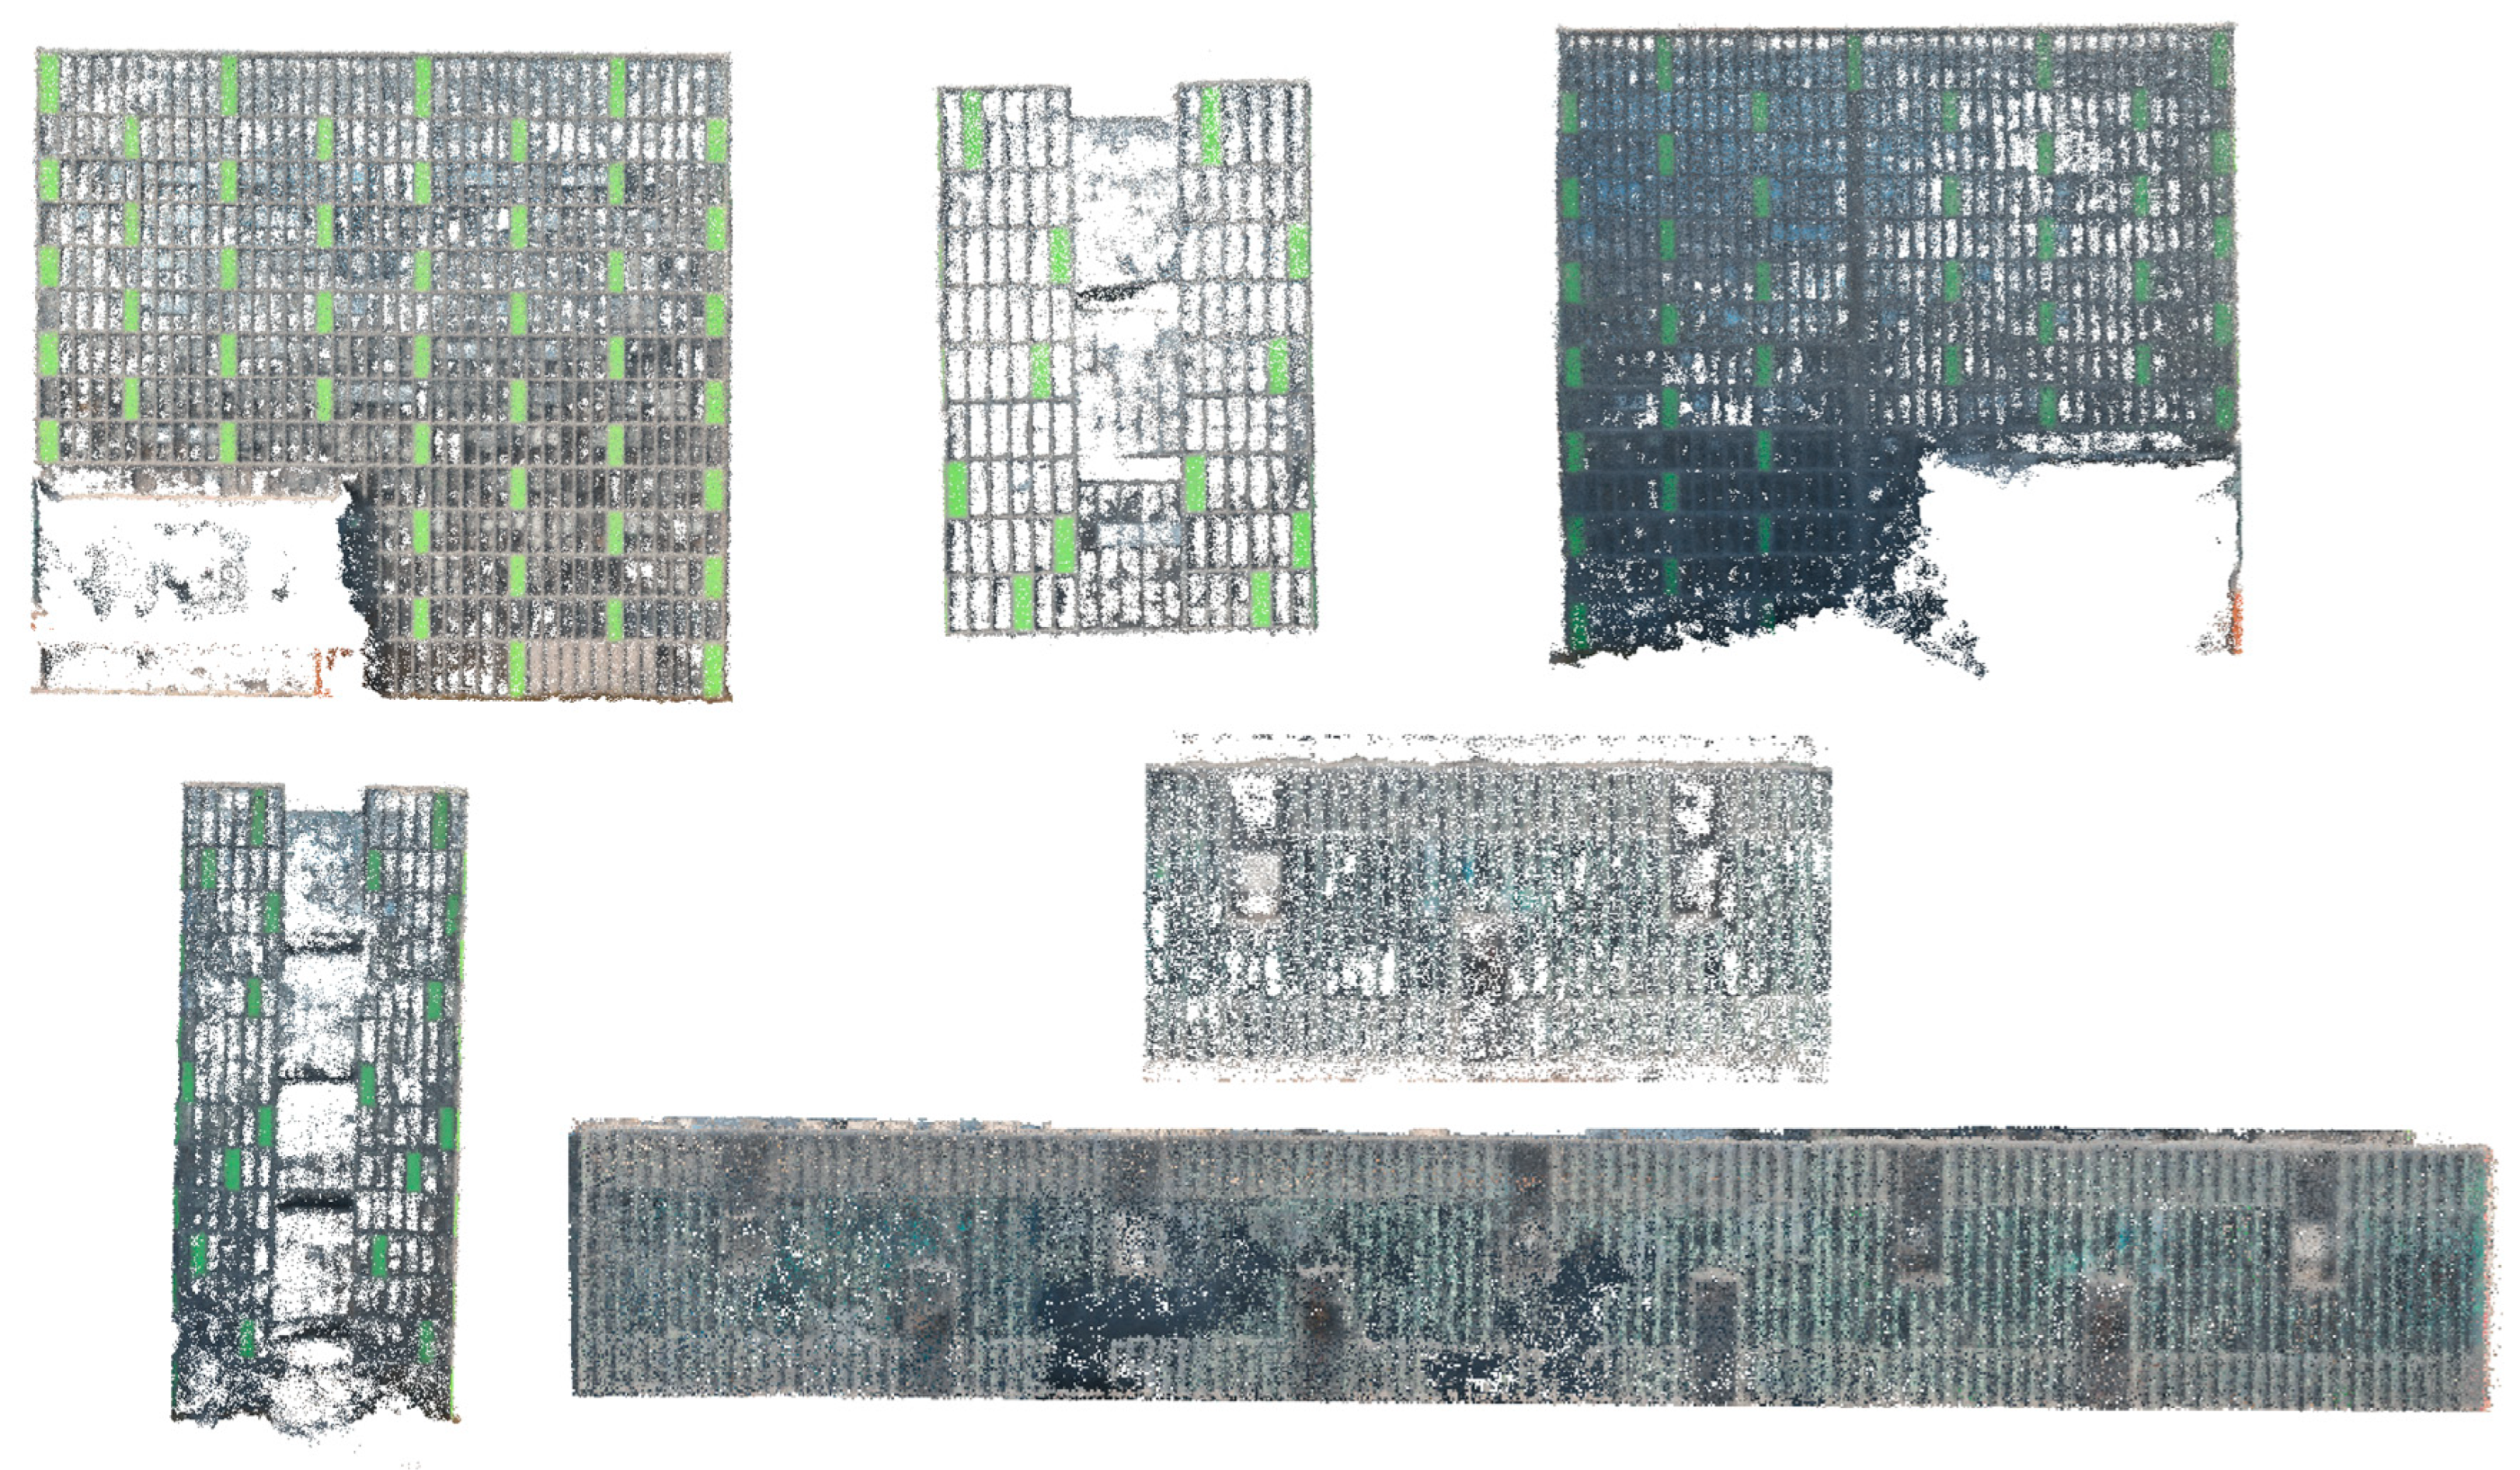
This paper focuses on the semantic segmentation task of curtain wall point clouds, and the classification task encompasses a total of three classes: mullion, glass panels, and aluminum panels. Mullions and panels are the main components in curtain walls, and precise classification of these categories is important for BIM reconstruction. The dataset used for training and testing PointNet++ is the curtain wall point cloud of the main building and podium of the Biomedical Research Complex Building at Southeast University, as shown in Figure 5. This experiment uses a large curtain wall in the main building as the testing set for the model, while other data are used as the training set. The ratio of the training set to the testing set is about 4:1. The class distributions of the training and testing sets are shown in Table 2. The original point cloud data needs to be manually classified to determine the ground truth.
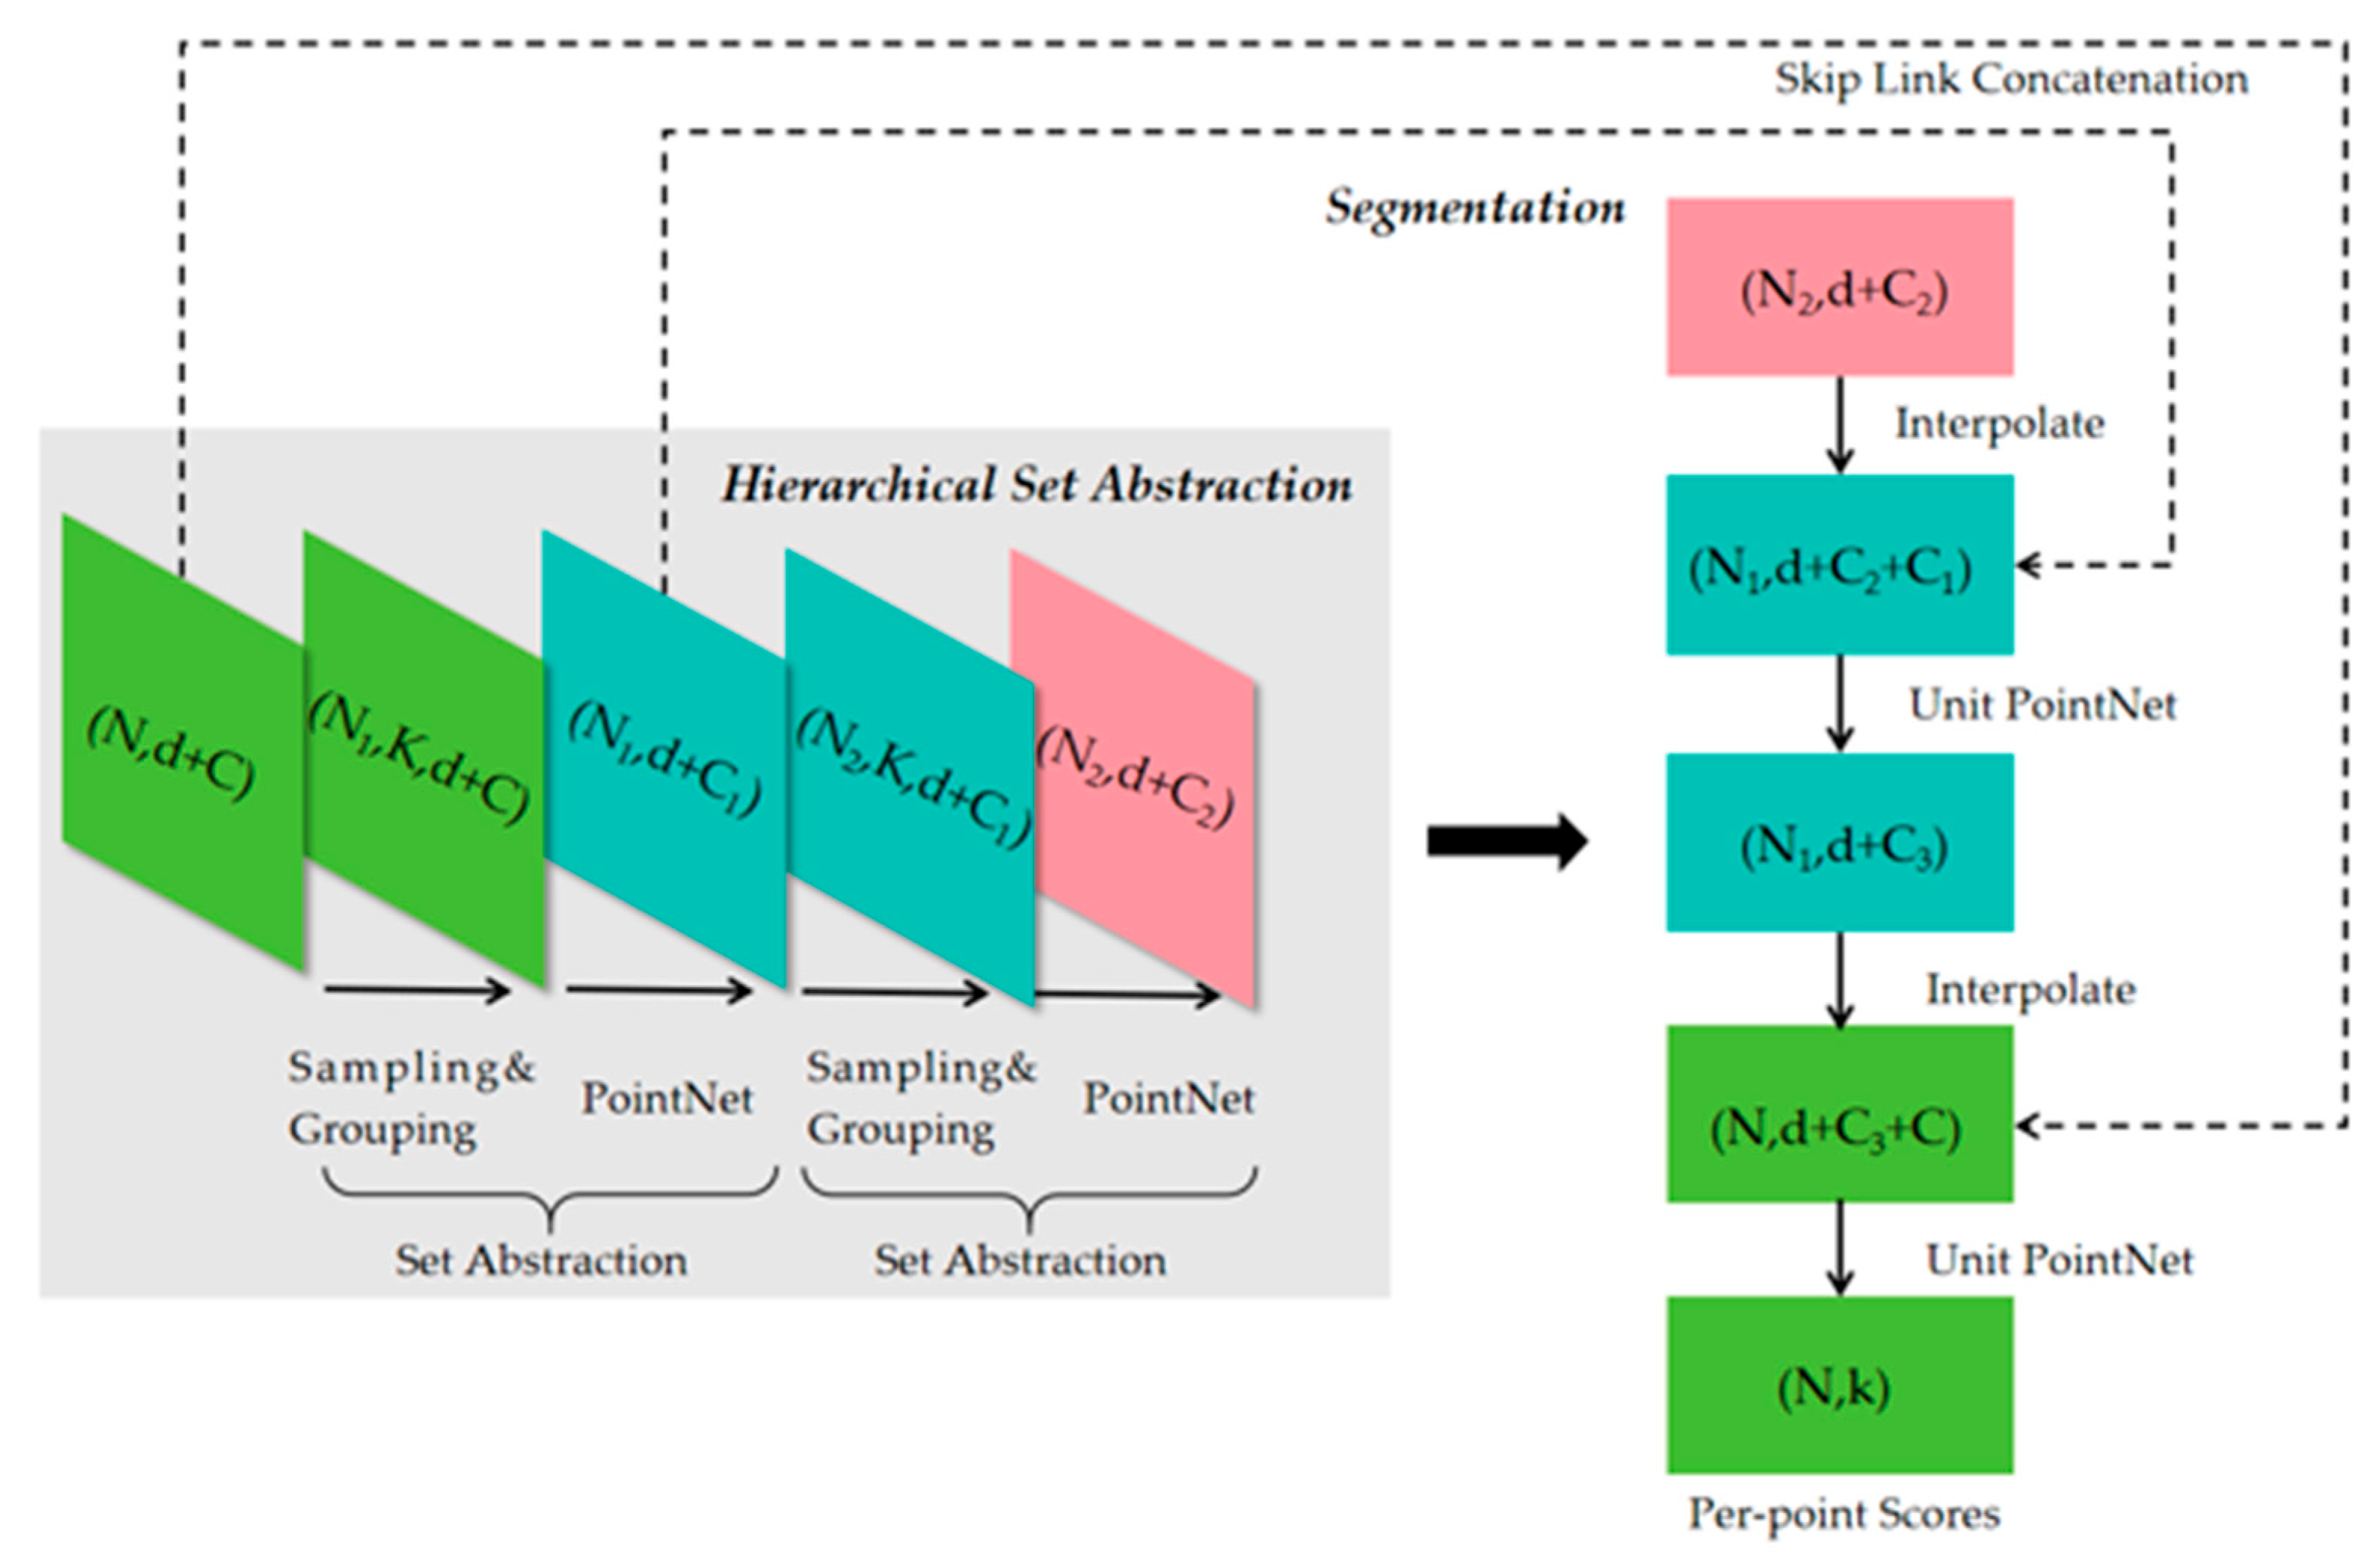
The PointNet++ model is selected for our research work. PointNet++ can be regarded as a landmark model in the field of point cloud processing, boasting unique and powerful advantages. The structure of PointNet++ is shown in Figure 6. The core structure of PointNet++ is the hierarchical point set abstraction layer, which effectively addresses the major drawback of previous methods that were unable to capture local features [45]. Through hierarchical feature extraction, PointNet++ can conduct a comprehensive and in-depth analysis of point cloud data at different scales, enabling a better understanding of both local and global features of the point cloud.
To tackle the common problem of uneven point cloud density, PointNet++ innovatively proposes multi-scale grouping (MSG) and multi-resolution grouping (MRG) strategies [45]. These strategies can adaptively adjust the feature extraction method and scale according to the different density conditions of the point cloud, ensuring that the model can accurately extract features in point cloud regions with varying densities. Meanwhile, combined with the random input dropout algorithm, PointNet++ further enhances the model’s robustness to sparse point clouds, enabling the model to maintain stable performance and high segmentation accuracy when dealing with complex and irregular point cloud data.
When evaluating the performance of point cloud semantic segmentation, this study employ a series of key metrics, including Overall Accuracy (OA), mean Class Accuracy (mAcc), as well as Intersection over Union (IoU) and mean Intersection over Union (mIoU) which are used to measure the degree of overlap between the predicted regions and the actual regions [39,43,45].
OA refers to the proportion of correctly predicted points out of the total number of points. mAcc involves calculating the proportion of correctly classified points for each class one by one and then taking the average of these proportions after summing them up. IoU measures the ratio of the intersection area between the ground truth and the predicted value to the union area of the two. When IoU is large, it indicates that the segmentation results of the model are more accurate; conversely, a small ratio value implies a poor segmentation performance. To comprehensively evaluate the model performance, the concept of mIoU is introduced. mIoU first calculates the IoU value for each class separately and then averages the IoU values of these classes to obtain a comprehensive evaluation result. The calculation formulas are as follows:
O A = i = 1 m T P i N t o t a l
m A c c = 1 m + 1 i = 0 m T P i T P i + F P i
I o U i = T P i T P i + F N i + F P i
m I o U = 1 m + 1 i = 0 m I o U i
where Ntotal represents the total number of point clouds, TPi, TNi, FPi, and FNi represent True Positives, True Negatives, False Positives, and False Negatives, respectively, in class i, and m denotes the number of classes.

3.4. Extraction of Geometric Parameters

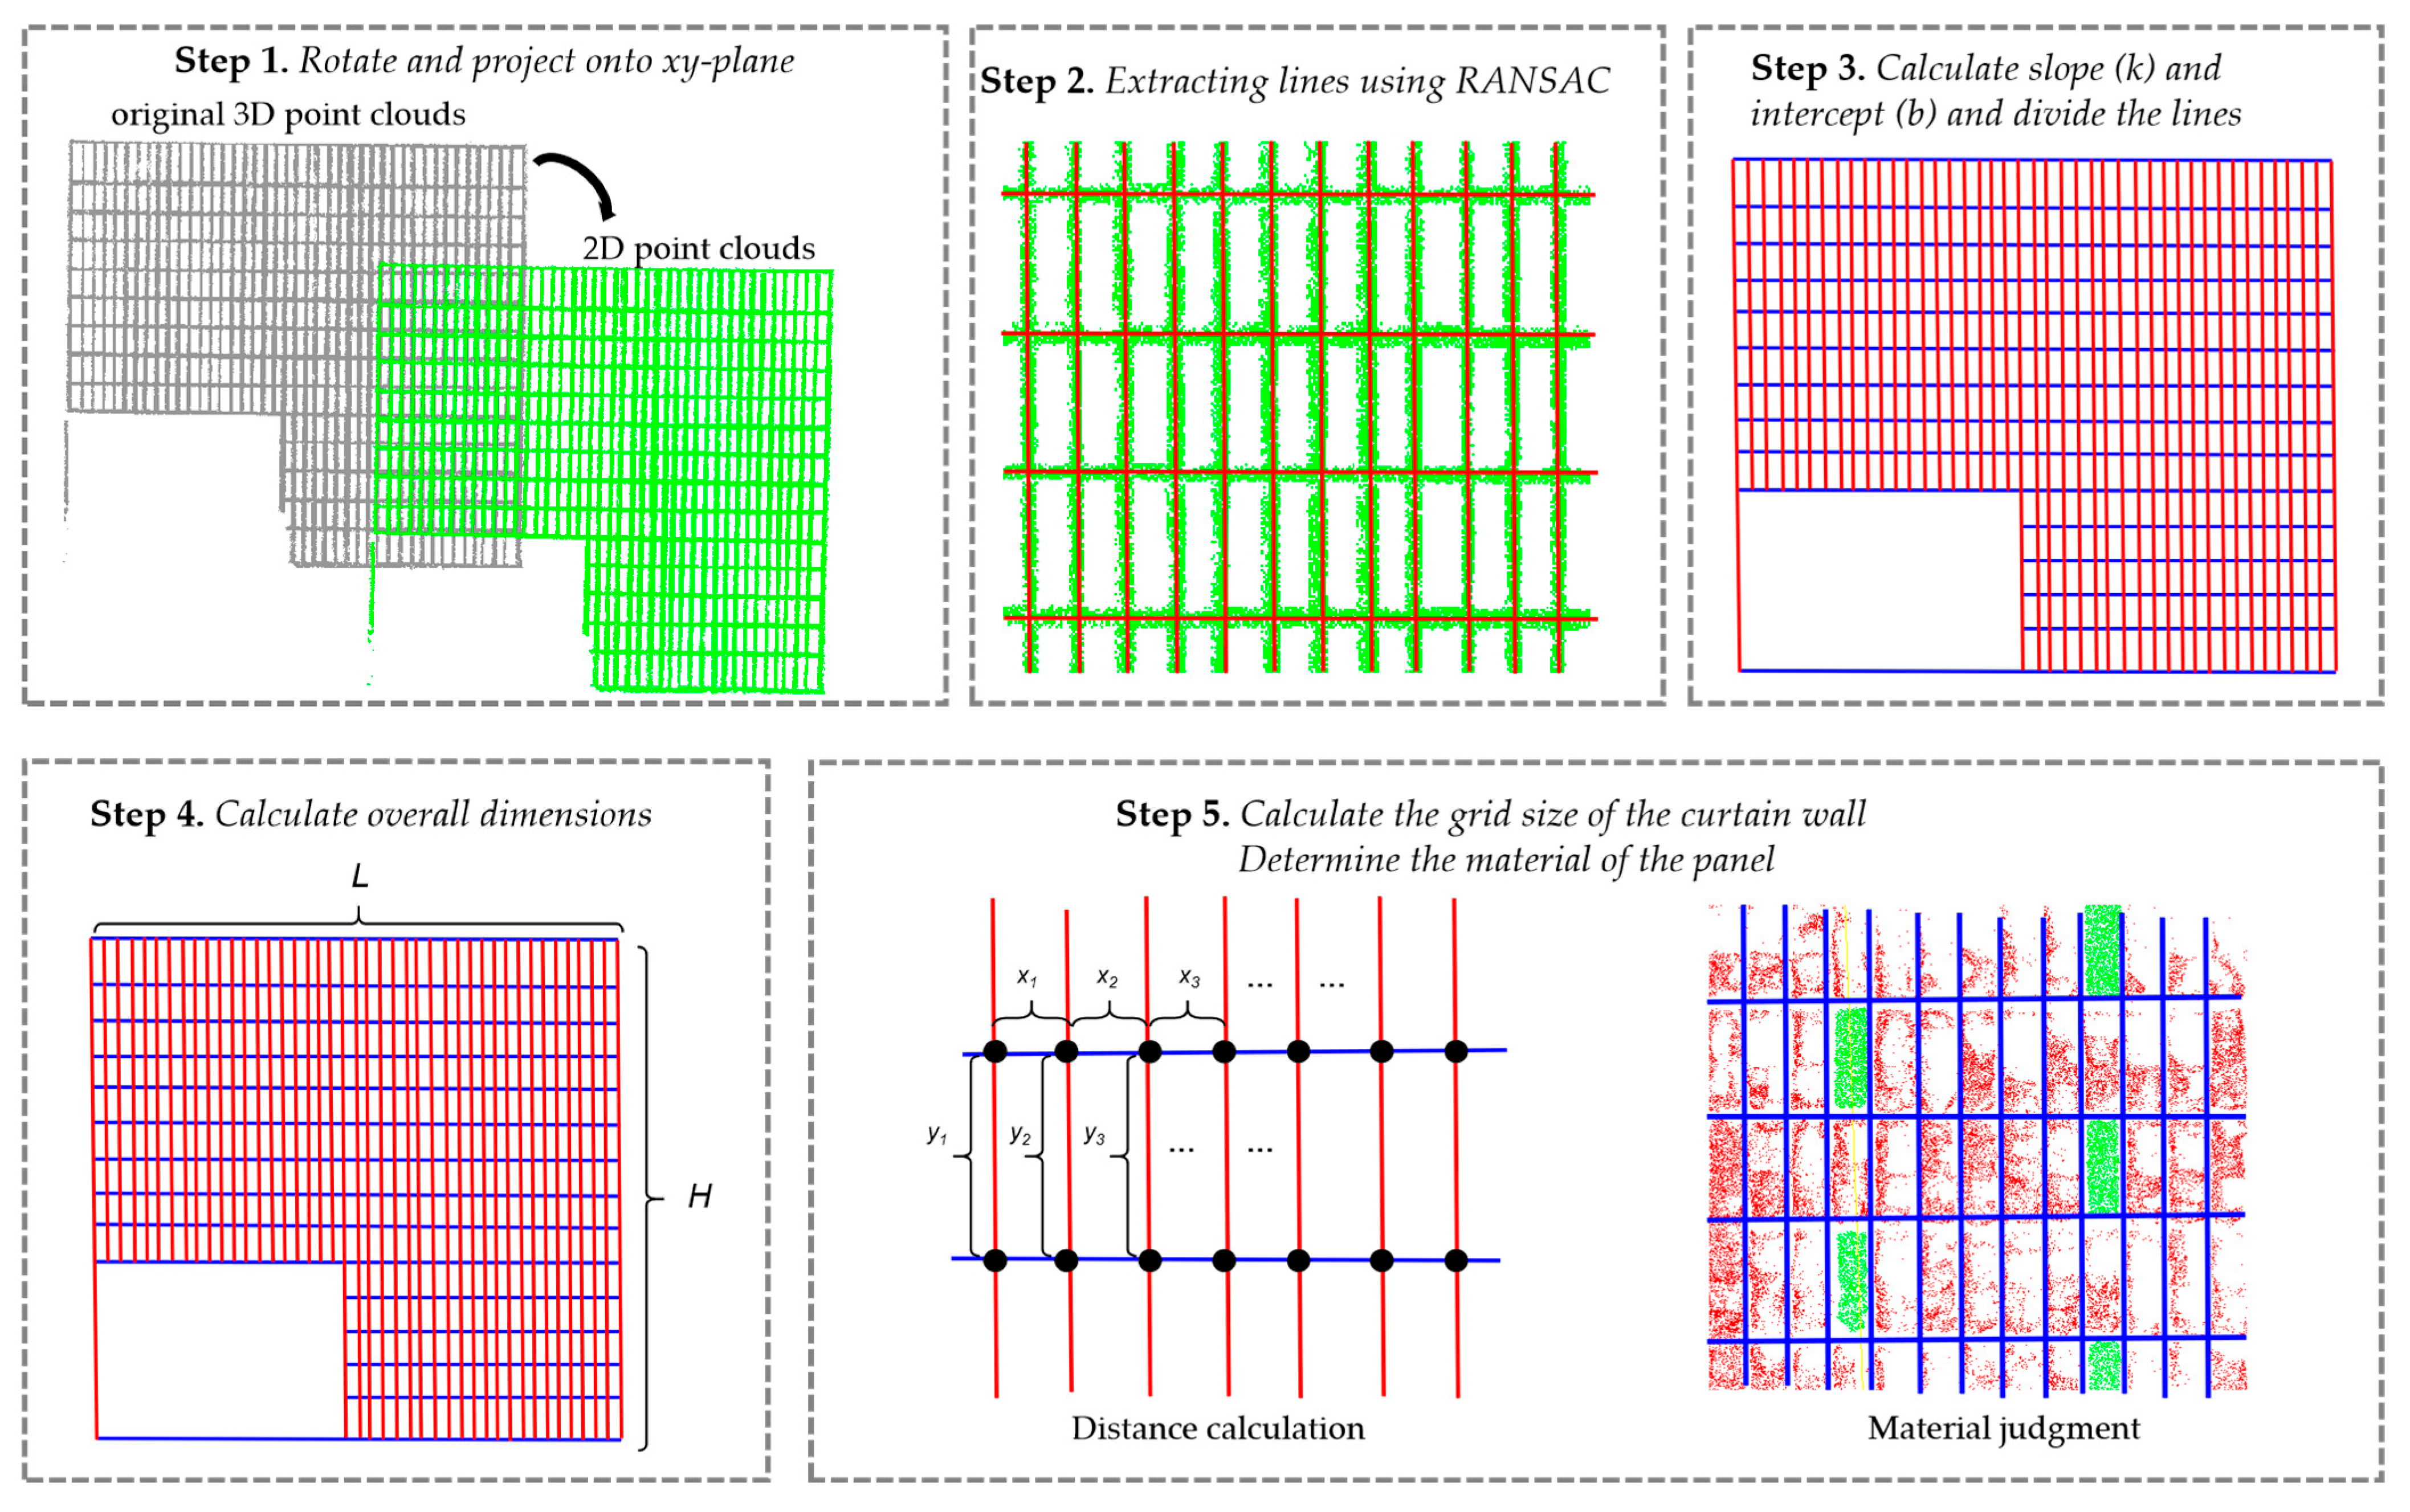
When establishing a BIM for curtain walls, accurately extracting corresponding geometric parameters from point cloud data is a crucial step, which directly affects the accuracy and reliability of the constructed BIM model. This study proposes an innovative parameter extraction algorithm and consists of five steps to ensure efficient and precise acquisition of the required geometric parameters from curtain wall point clouds, as shown in Figure 7.
Step 1 involves processing the 3D point clouds of the mullion grids. For the point cloud of mullions of a curtain wall, the RANSAC algorithm is first applied to find the fitted plane, and find the rectangular bounding box of the point cloud on this plane. Then, based on the position of the fitted plane and the rectangular bounding box, the point cloud is rotated and shifted such that the fitted plane overlaps with the xy-plane, and the bounding box aligns with the x and y axes. In this way, the mullion grids will become horizontal and vertical. In subsequent calculations, only the x and y coordinates of the points are processed, and the 3D point cloud becomes a 2D point cloud. This transformation significantly simplifies the subsequent data processing and lays the foundation for operations such as line extraction.
Step 2 is to extract straight lines from the transformed 2D point clouds. Straight lines are important geometric elements for describing the structure of curtain walls, and accurate extraction of straight lines is crucial for subsequent parameter calculations. In this step, the Random Sample Consensus (RANSAC) algorithm is used for straight line extraction [46]. RANSAC is a highly robust model parameter estimation method, especially suitable for processing data containing a large amount of noise and outliers. The algorithm extracts straight lines by randomly and repeatedly performing the following operations: First, a minimum sample set is randomly selected from all data points. Then, a candidate straight line model is fitted using this set of points. Next, the quality of the model is evaluated by calculating the distances from all data points to the candidate straight line. Points with distances less than a preset threshold are identified as inliers of the model, and the current model and the number of its inliers are recorded. The above process is iterated N times, where N is usually automatically calculated based on the desired success probability and inlier rate. After all iterations are completed, the candidate straight line model with the largest set of inliers is selected as the final best model, thereby obtaining the straight line information in the 2D point clouds and calculating the slope and intercept (k, b) of the straight lines. This paper designed an iterative RANSAC algorithm using Python 3.9.2, which can extract multiple lines from the mullion point cloud at once. In each iteration, the RANSAC algorithm is performed with a distance threshold of 0.2m, and the minimum number of inlier points is set as 500. After each iteration, all the inlier points of the fitted line are extracted and removed from the point cloud. Then, the next iteration will be performed on the remaining points. The iteration will terminate when the algorithm cannot find a line with more than 500 inliers. With such an iterative approach, the algorithm is able to find multiple lines from the point cloud. In each iteration, after obtaining all the interior points, our algorithm uses the least squares method to calculate the optimal slope (k) and intercept (b) based on all the interior points.
Step 3 is to classify the extracted straight lines into horizontal and vertical straight lines. The structure of curtain walls is usually composed of horizontal and vertical components, and accurately distinguishing between horizontal and vertical straight lines is helpful for the precise calculation of the overall size and grid size of the curtain wall in the subsequent steps. By analyzing information such as the slope of the straight lines, the straight lines can be effectively classified into horizontal and vertical categories. During the analysis process, if the slopes and intercepts of two lines are very close (slope difference < 0.2 and intercept difference < 0.2, for horizontal lines), these two lines are considered to represent the same mullion. In this case, the interior points of these two lines will be combined to form a new interior point set, and slope (k) and intercept (b) will be recalculated based on this new interior point set.
Step 4 is to determine the overall size parameters of the curtain wall. The overall size of the curtain wall is important information in the BIM model, reflecting the actual size of the curtain wall in the building. By calculating the lengths of the line segments fitted from the outer contour of the mullion grid point clouds, the overall size of the curtain wall can be accurately determined. This step requires the precise fitting of the edge point clouds to ensure that the lengths of the obtained lines can truly reflect the actual size of the curtain wall.
Step 5 is to determine the width and height parameters of the curtain wall grids and determine the material of the panel. The curtain wall grids are important components of the curtain wall structure, and the accuracy of their width and height directly affects the appearance and performance of the curtain wall. By calculating the intersection points of each horizontal and vertical straight line and then calculating the distances between adjacent intersection points, the width and height of the curtain wall grids can be obtained. This step requires accurate calculation of the positions of the straight lines’ intersection points to ensure that the obtained grid size parameters are accurate. For each panel, this study extracts the points belonging to this panel and analyzes the classification results of these points. If more points are classified as glass panels than aluminum panels, this panel will be considered as a glass panel. Otherwise, it will be classified as an aluminum panel.

3.5. Reconstruction of BIM Model

BIM model reconstruction can be efficiently accomplished using the Dynamo plug-in Autodesk Revit 2020 software. Autodesk Revit 2020, as a widely used BIM software in the architectural industry, provides a powerful fundamental platform for architectural design and modeling. Dynamo, an open-source visual programming platform based on Autodesk Revit, features an intuitive and highly functional scripting interface. For modelers, traditional manual modeling methods often require a significant amount of time and effort and are prone to errors. The emergence of Dynamo has changed this situation. Dynamo’s visual programming characteristics make code writing simple and fast, eliminating the need to write complex lines of code as in traditional programming. Users can quickly construct the required modeling logic through intuitive graphical operations, thereby greatly improving the efficiency and quality of modeling and providing more accurate and efficient model support for architectural design and construction.
In the visual programming environment of Dynamo, nodes and wires are the core components for building programs. Nodes are like functional modules, with each node having a specific function, such as creating geometric shapes, reading data, and performing mathematical calculations. Wires are used to connect these nodes, linking them together according to specific logical relationships to form a complete program flow. When using Dynamo, users only need to select nodes with different functions from the node library according to the modeling requirements and then connect these nodes with wires based on specific logic to construct an intuitive and visual program. This construction method has significant advantages. Dynamo not only improves the intuitiveness of programming, allowing users to clearly see the program’s operating logic and data flow, but also enhances the flexibility and customizability of the program. Users can flexibly adjust the combination and connection methods of nodes according to different project requirements to quickly adapt to various complex modeling scenarios. After running the program, the visual operation results, including the created geometric shapes and calculated data, can be clearly observed in the Dynamo work interface, facilitating timely inspection and adjustment by modelers.
Dynamo has an extremely rich node library that contains hundreds of nodes. The functions of these nodes can be roughly divided into three categories: creation, operation, and query. Creation nodes are used to generate various geometric shapes and architectural elements, such as walls, floors, and curtain wall components. Operation nodes are used to modify and transform existing geometric shapes and data, such as moving, rotating, and scaling. Query nodes are mainly used to obtain various information in the model, such as the properties, positions, and dimensions of components. These diverse nodes not only improve the flexibility and functionality of Dynamo, enabling modelers to achieve various complex modeling requirements through different node combinations, but also greatly enrich the user’s operating experience in the BIM workflow, making the modeling process more efficient and convenient.
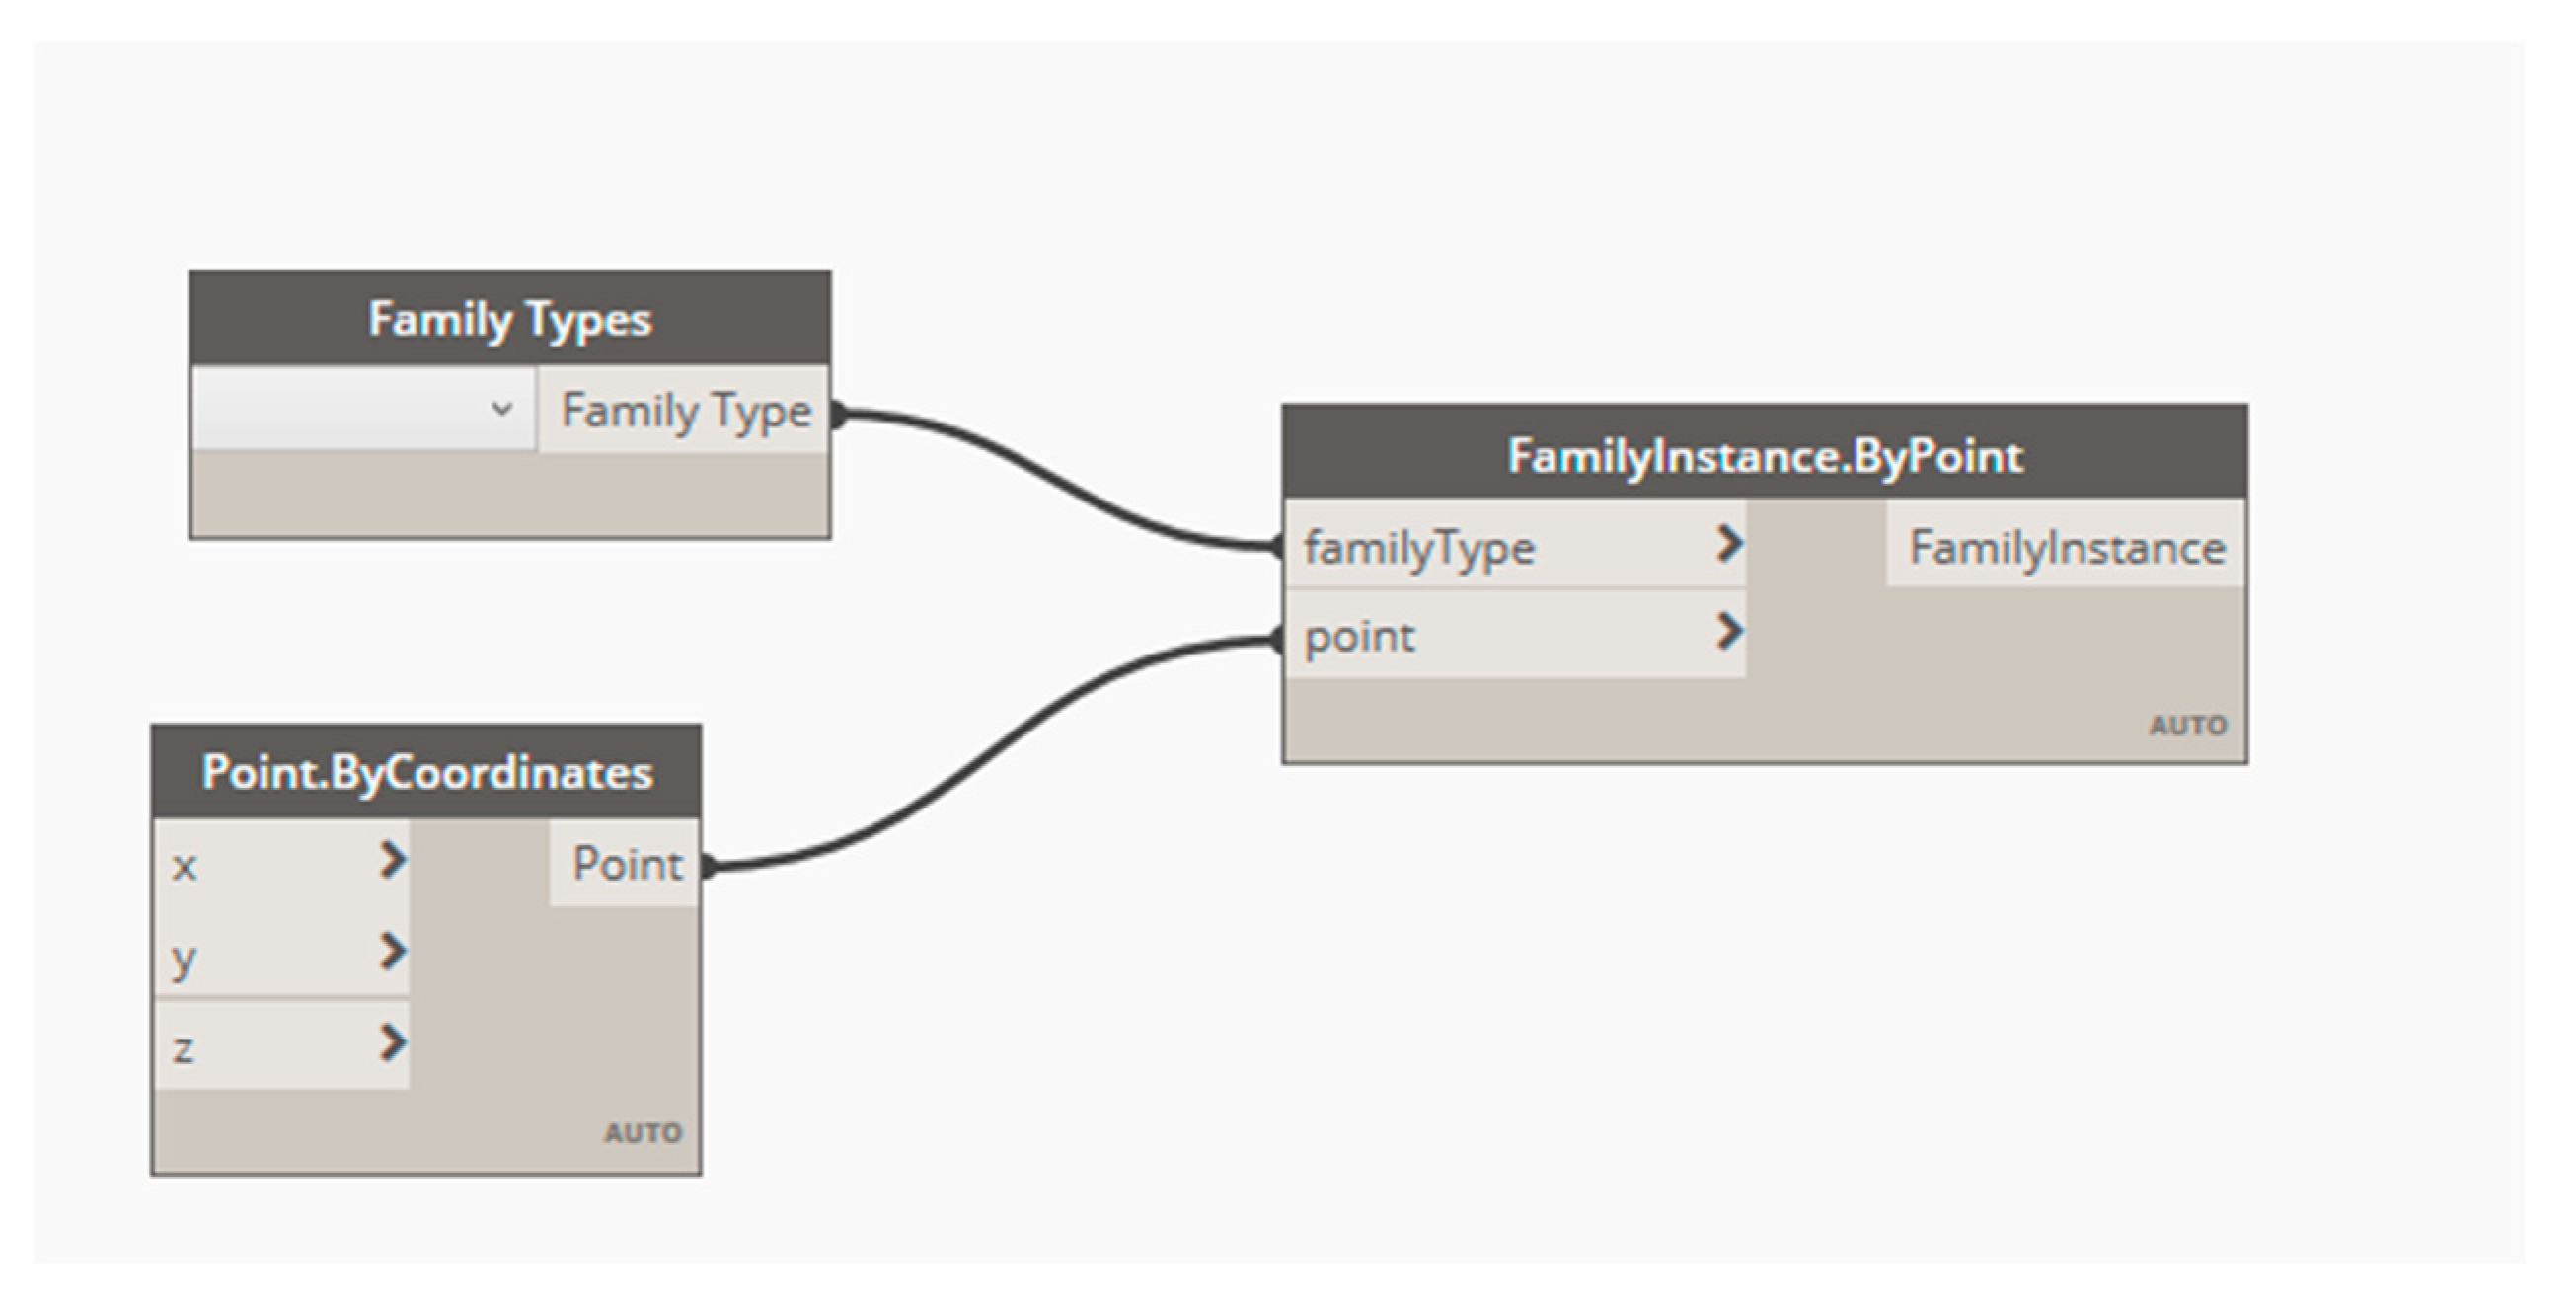
A curtain wall can be created using the “FamilyInstance.ByPoint” node in Dynamo, as shown in Figure 8. The inputs of this node mainly include family type parameters and 3D points. The “Family Types” node is used to define the family type of the component. Different family types have different properties and characteristics, such as the material, thickness, and opening method of the curtain wall. The “Point.ByCoordinates” node is used to determine the position reference point of the component. This node can accurately locate the position of the component in 3D space according to the given coordinate values. After inputting the defined family type and position reference point into the “FamilyInstance.ByPoint” node and running the program, the created components can be observed in the corresponding Revit view. This method of creating a curtain wall greatly improves the modeling efficiency and reduces the workload and error probability of manually creating components.

3.6. Point Clouds Quality Assessment

Due to the planar characteristics of curtain wall panels, the accuracy of point cloud fitting of the plane can be evaluated. The evaluation strategy is to fit the optimal plane and calculate the distance from each point to the optimal plane to measure the degree of deviation of that point from the plane. This study selected 20 panels from ten locations on the curtain wall for comparison of fitting plane accuracy, including glass and aluminum materials. The RANSAC algorithm is also used to fit planes because it has excellent resistance to noise and outlier interference, making it suitable for processing complex and noisy real-world point cloud data. Using standard deviation (STD), root mean square error (RMSE), and mean absolute error (MAE) to evaluate the effectiveness of point clouds fitting a plane [12]. The calculation formulas for STD, RMSE, and MAE are as follows:
S T D = 1 N 1 i = 1 N ( d i μ d ) 2
R M S E = i = 1 N d i 2 N
M A E = i = 1 N d i N
di represents the distance from each point to the optimal plane, and μd represents the arithmetic mean of all distances di. STD measures the degree of dispersion of the distance from these points to the plane, and a smaller value indicates that the point cloud is more tightly clustered around the fitting plane, demonstrating the clustering of the point cloud. RMSE reflects the severity of the overall deviation of the point cloud from the fitting plane and is sensitive to larger errors. MAE directly calculates the average distance absolute value, providing a robust estimate of the point-to-plane deviation size, which is relatively insensitive to outliers. If MAE, RMSE, and STD are all small, it indicates that the point cloud is tightly and uniformly fitted around the fitting plane as a whole, without significant outliers, and the fitting effect is excellent. By combining the sizes and interrelationships of the three indices, it is possible to more reliably assess the quality of plane fitting, identify potential issues, and provide a basis for subsequent processing.
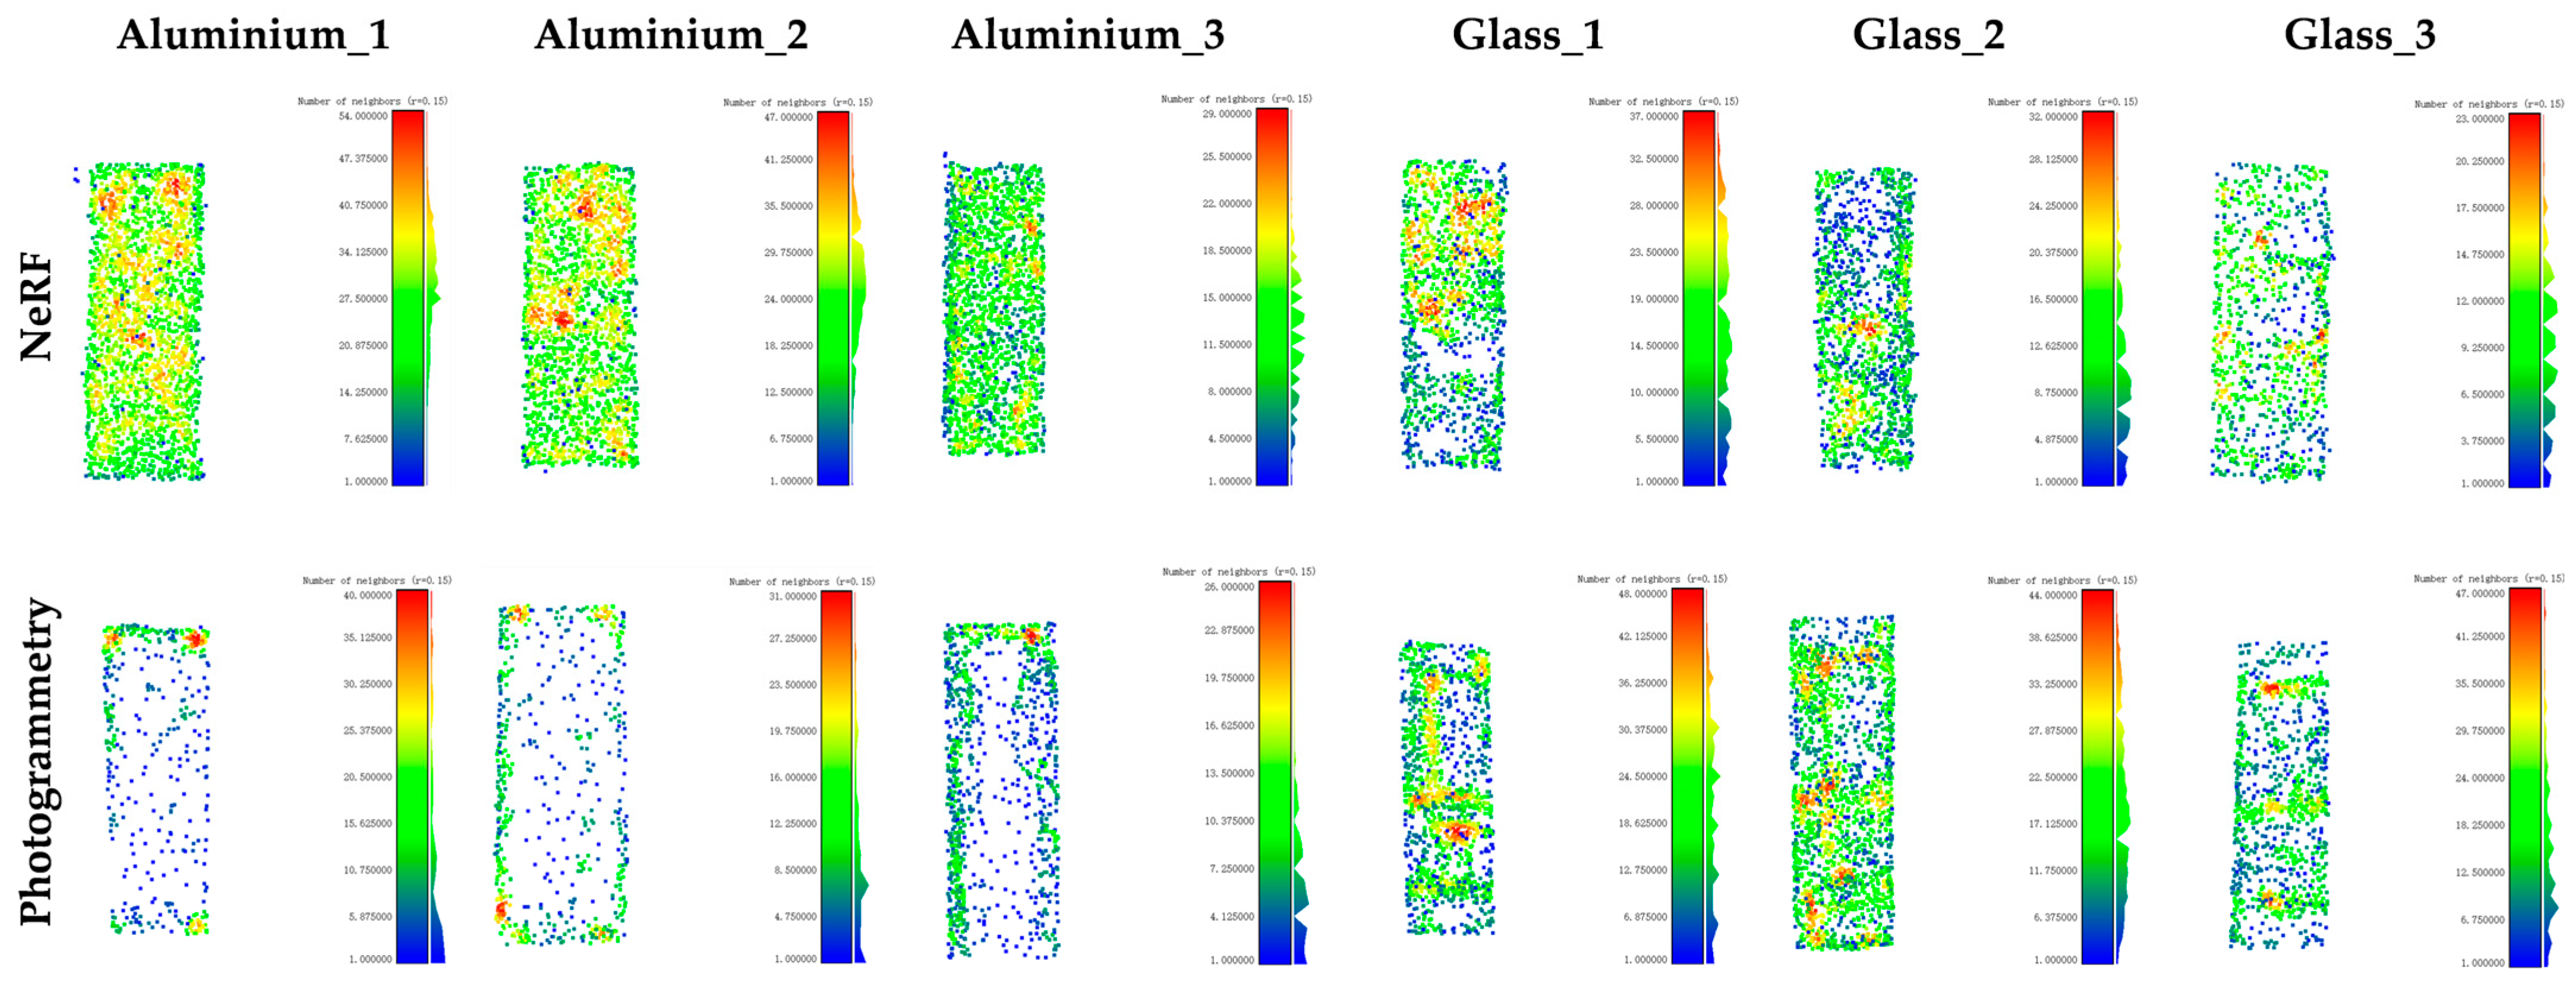
It is incomplete to only focus on fitting error indicators (such as STD, RMSE, and MAE) when evaluating the effectiveness of the point cloud fitting plane. The completeness and density distribution of point cloud data have a crucial impact on its representativeness, reliability, and ultimate application value. The completeness and density distribution are fundamental factors for evaluating data quality and the credibility of fitting results. Point clouds completeness refers to the degree to which the target plane area is effectively covered by the point cloud, reflecting whether there are missing, hollow, or large areas of occlusion in the point cloud data. High completeness means that most areas of the target plane have sufficient point data support, and the fitted plane can more accurately and comprehensively reflect the geometric characteristics of the entire target surface. Low completeness can lead to bias and reduce the reliability of point cloud data. The point cloud density distribution describes the spatial distribution density of points within the target plane area. Uniform and moderate density is the most ideal, as it ensures that all parts of the plane have approximately equal data support, and the fitting results can fairly reflect the geometric information of the entire surface. Uneven density distribution can lead to significant issues such as loss of details and fitting bias. The method for evaluating point cloud density in this study is to set the radius of the nearest neighbor’s sphere neighborhood to 0.15 and calculate the number of points for each point in this sphere neighborhood.

3.7. Experiment

3.7.1. Basic Information of the Building

The building selected for this study is the Biomedical Research Complex Building located at the Jiulonghu Campus of Southeast University. The total construction area of the building is 33,265.20 m2, with 13 above-ground floors and one underground floor, including 13 main floors and four podium floors. The main functions of the building are laboratories and offices, and it was completed on 22 December 2022.
The main building of the Biomedical Research Complex Building has a height of 57.60 m above ground, with an east-west length of 62.50 m. The height of the above-ground buildings in the podium building is 19.50 m. The building’s curtain wall adopts a unit-type curtain wall system, and the curtain wall of the podium building is a wooden fiberboard curtain wall. The curtain wall of the main building is a frame-type glass curtain wall (some panels contain green aluminum panels).

3.7.2. Image Acquisition

This study used a DJI Mavic 3T for image acquisition. The UAV is equipped with a 48-megapixel wide-angle camera and supports RTK centimeter-level positioning to ensure data accuracy. The entire flight process is carried out under suitable lighting and meteorological conditions to ensure the effectiveness and reliability of data collection. The UAV strictly followed the preset surround flight path and steadily flew at four different altitude levels of 128 m, 88 m, 60 m, and 40 m, ultimately obtaining a total of 242 high-resolution images. The UAV took images at 2 pm in good weather conditions, ensuring good lighting conditions during the shooting process. The UAV maintains a flight speed of 3–5 m/s to ensure the clarity of the captured images. The horizontal and vertical overlap between images was greater than 50%. Some collected images are shown in Figure 9. The 242 collected images have 4000 × 3000 pixels and a horizontal and vertical resolution of 96 dpi.

3.7.3. Model Parameter Settings

This study used the Nerfacto model based on nerfstudio to obtain building point clouds. The original 242 UAV images need to be preprocessed using the SfM algorithm to obtain camera intrinsic parameters (cx, cy, fx, fy) and camera extrinsic parameter matrices (R, T). Colmap software 3.8 was employed for this process. During the training and evaluation of the Nerfacto model, the batch size of each ray was set to 4096, and the sample size for each ray was set to 48. The size of the network and color prediction layer was 64, and the numbers of samples per ray for each proposal network were 256 and 96 for two-stage sampling. The experiment was run on a server equipped with an NVIDIA L40 GPU for less than 6 h, with a total of 30,000 iterations. Thus, a building point clouds containing 10,000,000 points were obtained.
In order to compare with the point cloud generated by NeRF, this study also used photogrammetry to generate point clouds based on the same images. Agisoft Metashape 2.2.1 software is used to generate point clouds. Agisoft Metashape is a powerful professional photogrammetric software, and the steps of generating point clouds include importing images, aligning images, and generating dense point clouds.
The Pointnet++ network was used for the semantic segmentation of the curtain wall point clouds. The initial parameter batch size for network training was 16, the initial learning rate was set to 0.001, and the initial number of center point samples was 128. The experiment was run on a server equipped with an NVIDIA RTX4090. The ratio of the training dataset to the testing dataset is 4:1. OA, mAcc, IoU, and mIoU were selected as indicators for evaluating semantic segmentation results.
The RANSAC algorithm was used to extract lines from the mullion grid. The distance threshold of RANSAC was set to 0.2, the minimum number of inliers required to segment each line was 500, and the maximum number of iterations was 100.

4. Result

4.1. Point Clouds Obtained from NeRF

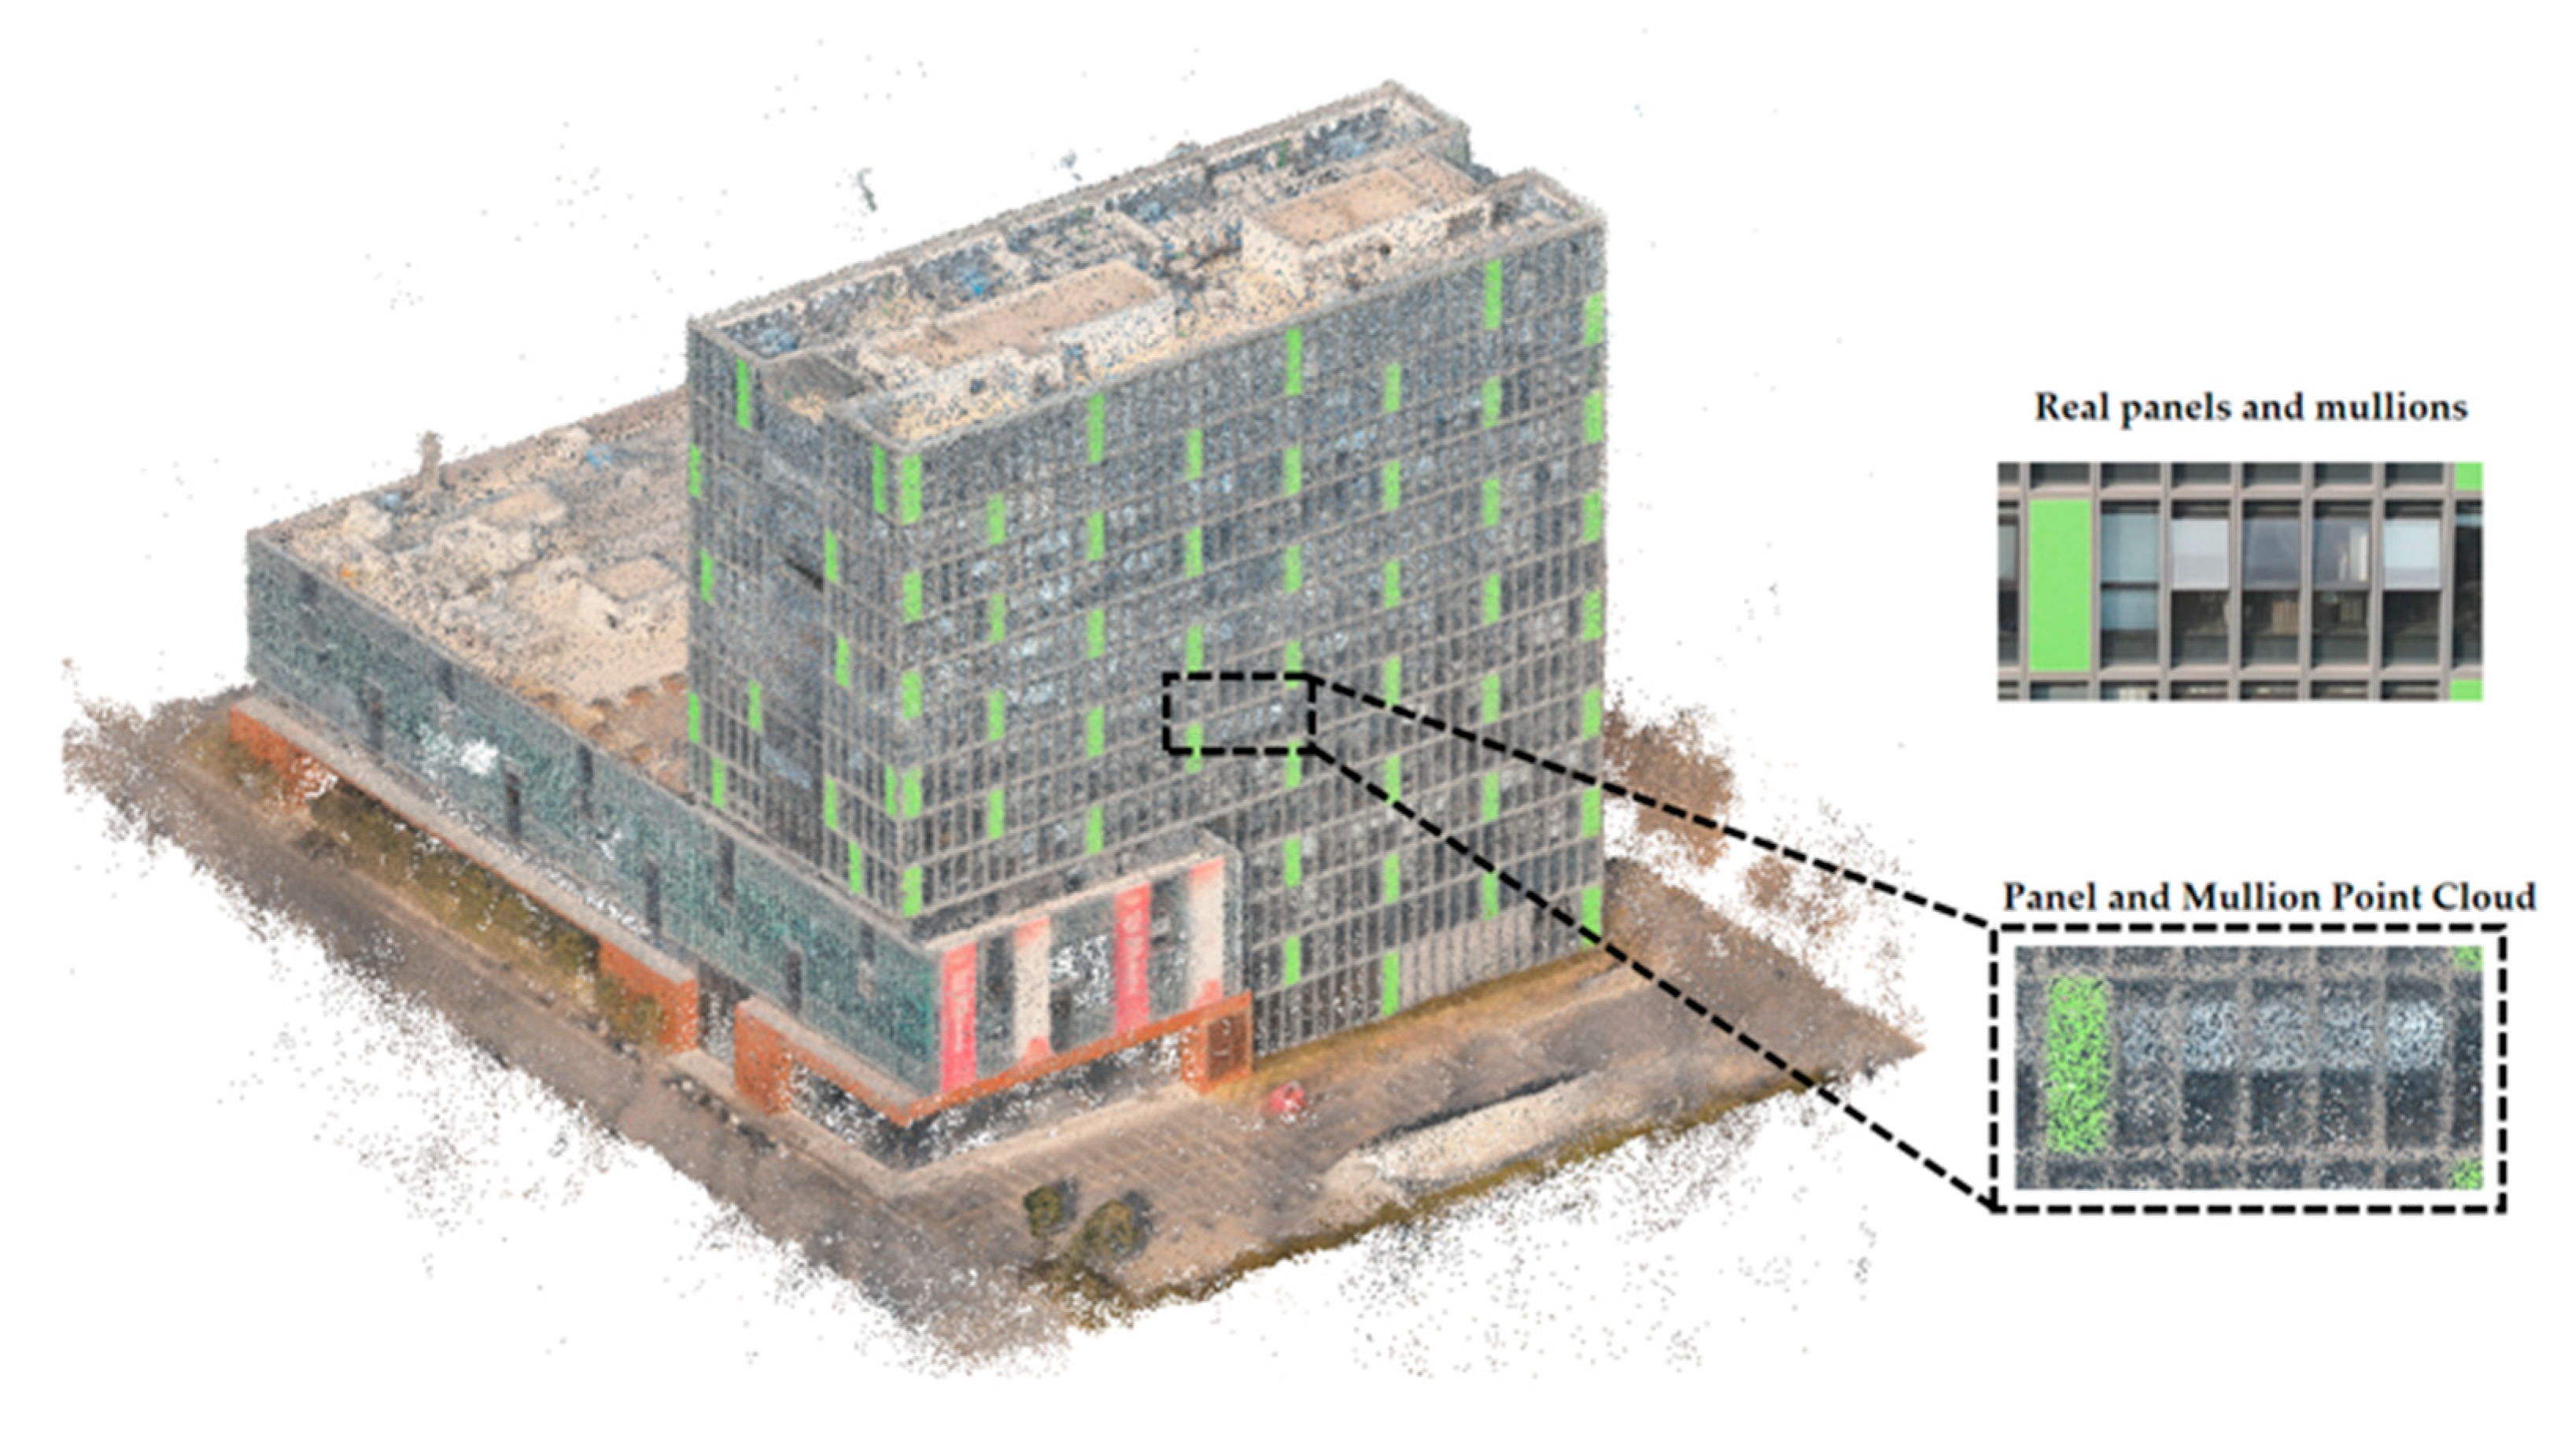
The point clouds obtained by NeRF are shown in Figure 10. As depicted in the figure, the point clouds acquired through NeRF demonstrate exceptionally remarkable results. From an overall perspective, the generated point cloud data exhibit a relatively high degree of completeness, indicating that it encompasses nearly all the critical information within the architectural scene without significant areas of missing or omitted data. This highly complete point cloud data is capable of representing the real-world situation of the building with extreme precision and comprehensiveness.
In particular, when it comes to the point clouds of architectural curtain walls, NeRF showcases significant advantages. NeRF can precisely restore the true contours of the curtain walls, with the generated point cloud data showing a high level of consistency with the actual shape of the curtain walls. Moreover, in terms of color restoration, NeRF also performs excellently. Based on the collected image information, the colors of various materials on the curtain wall surface can be restored accurately, including the transparent gray of mullions and the green of aluminum panels. As a result, the generated curtain wall point cloud data is visually highly similar to the real architectural curtain walls, providing a reliable and high-quality data foundation for subsequent tasks such as semantic segmentation and parameter extraction.

4.2. Result of Semantic Segmentation

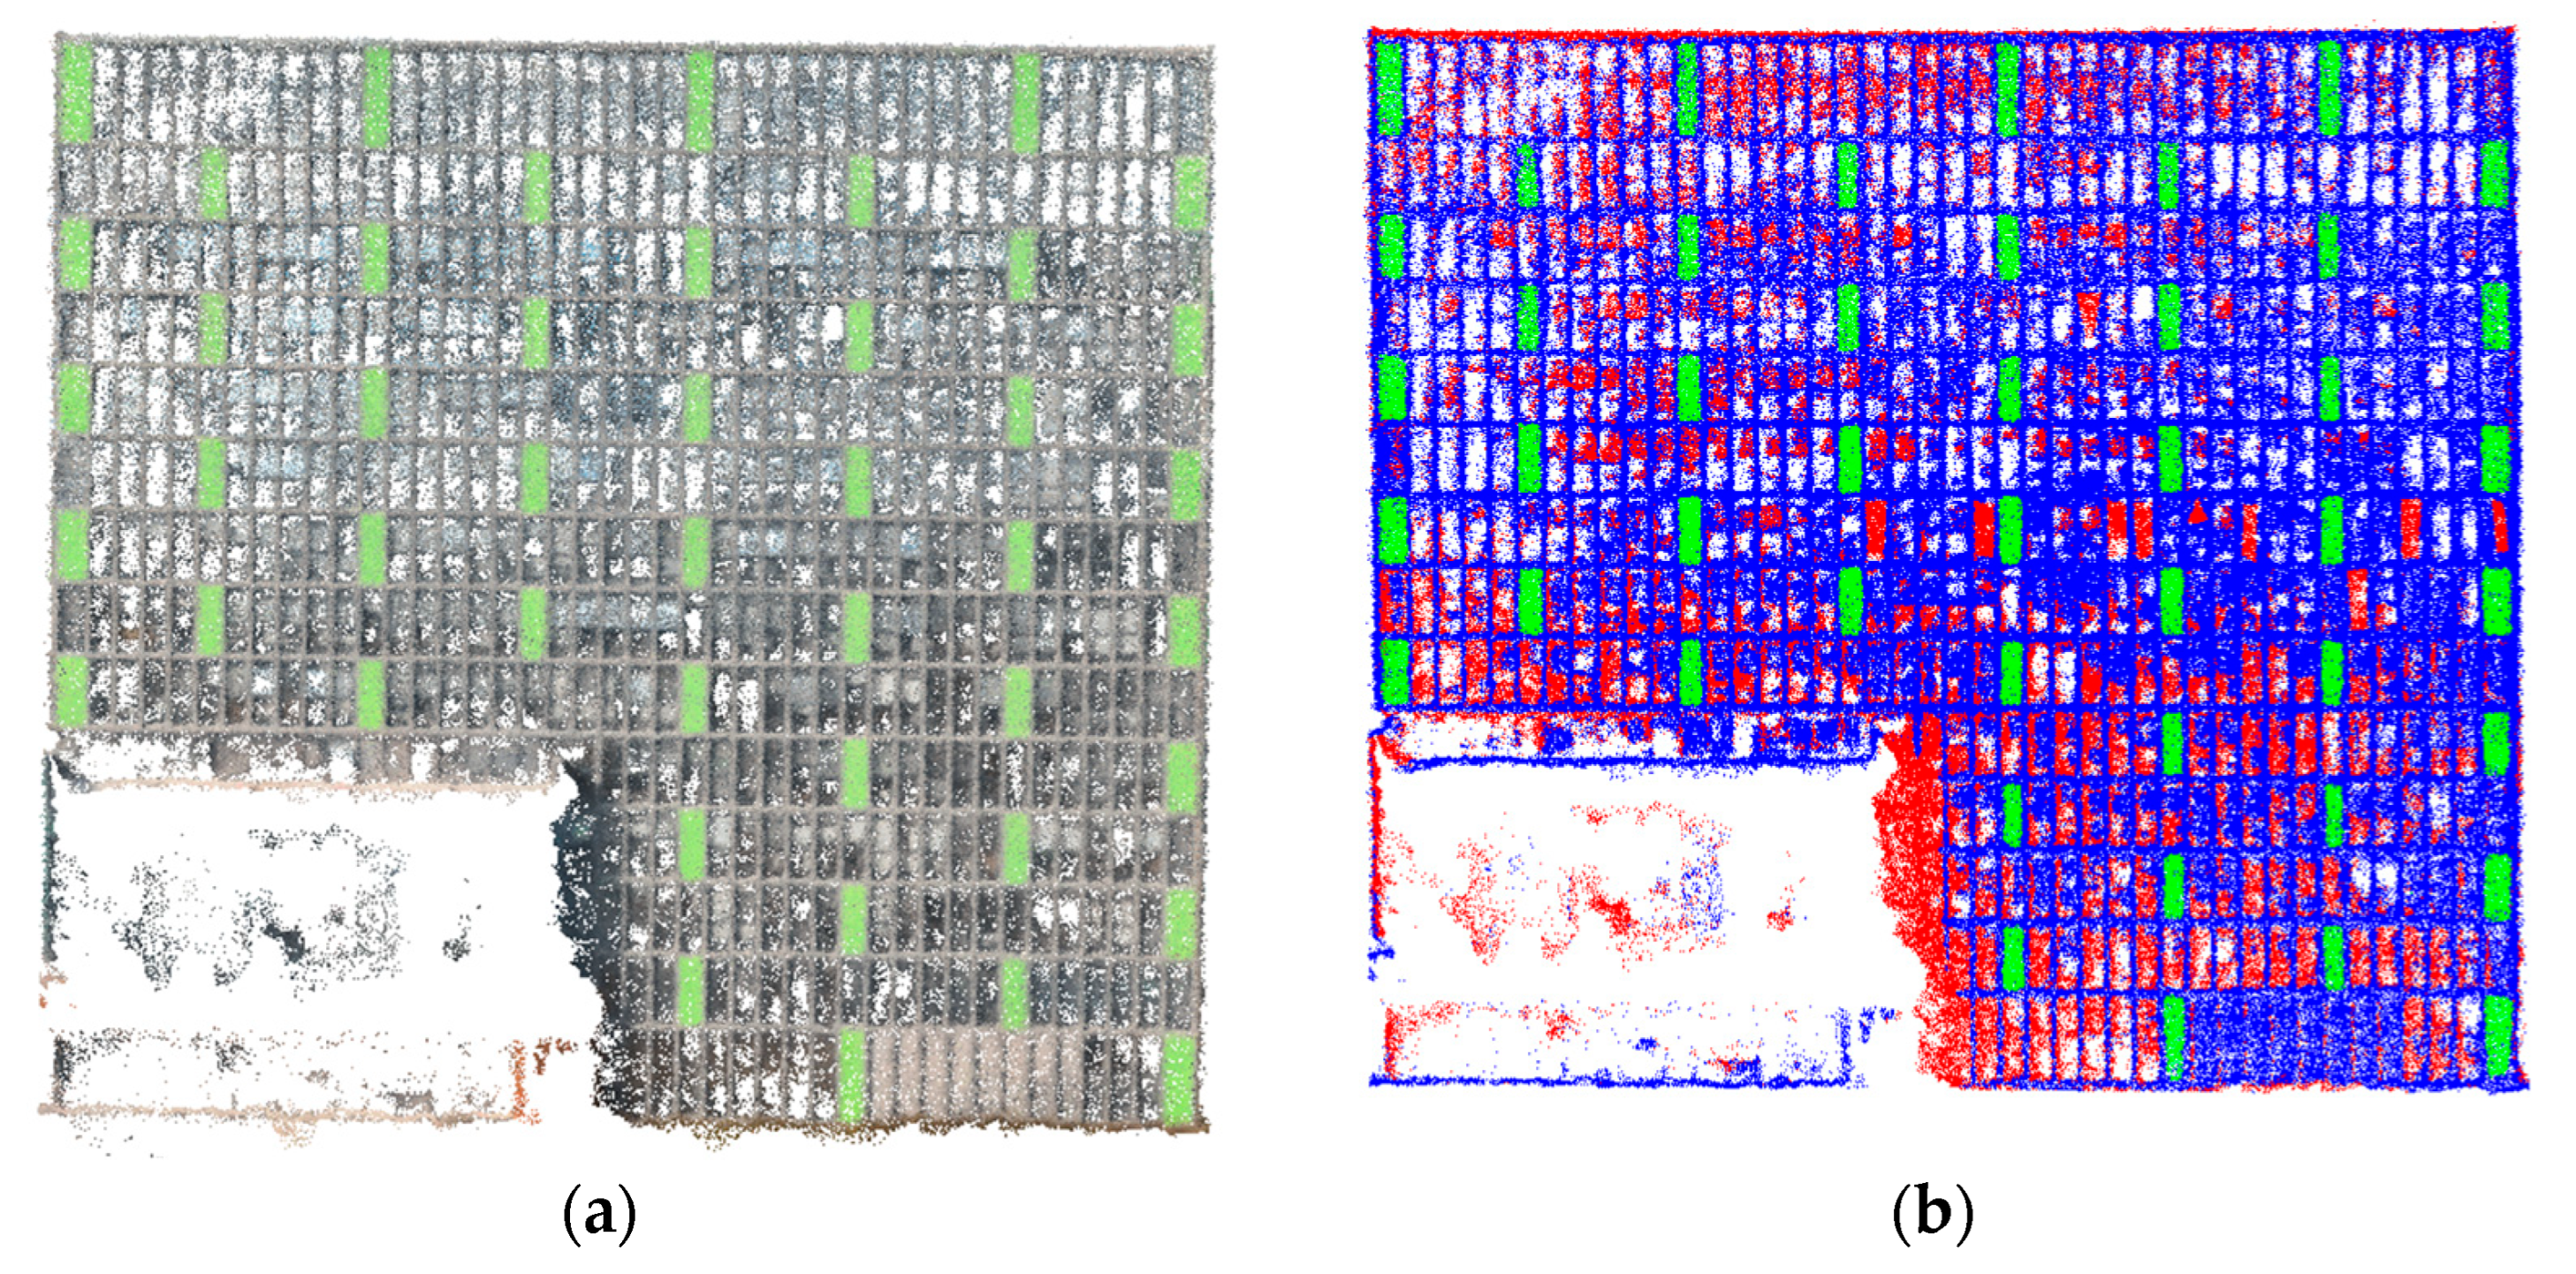
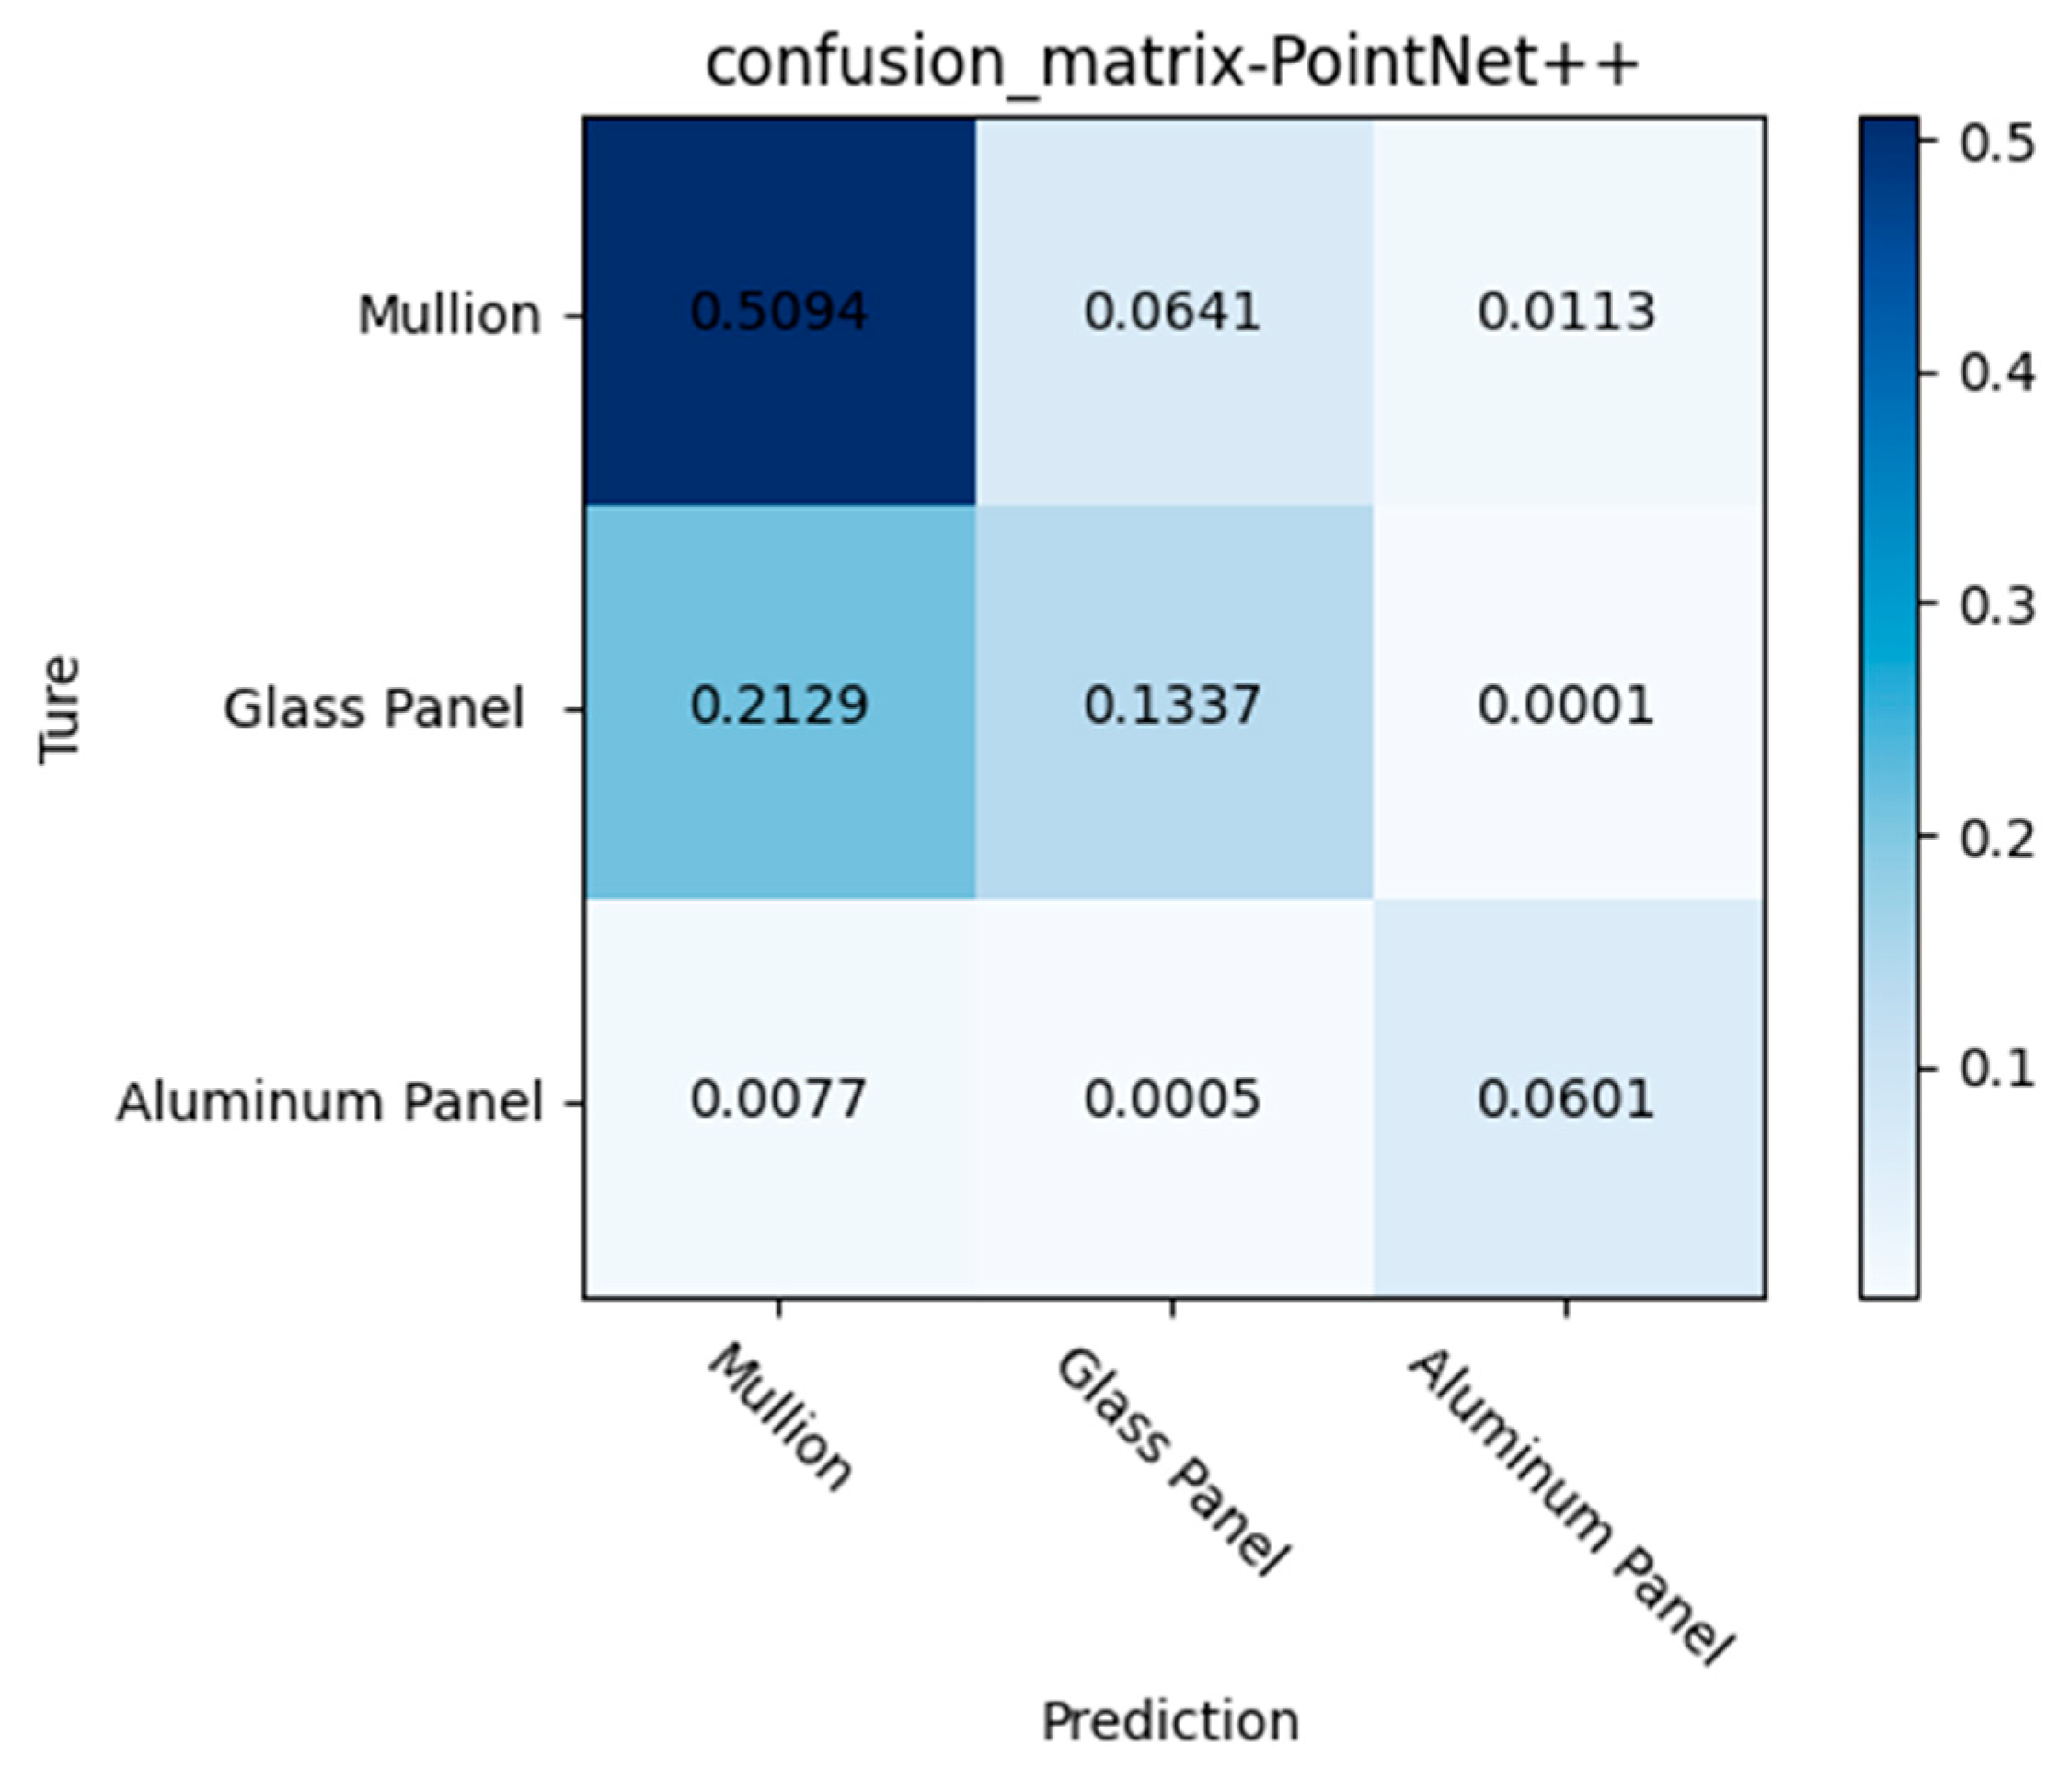
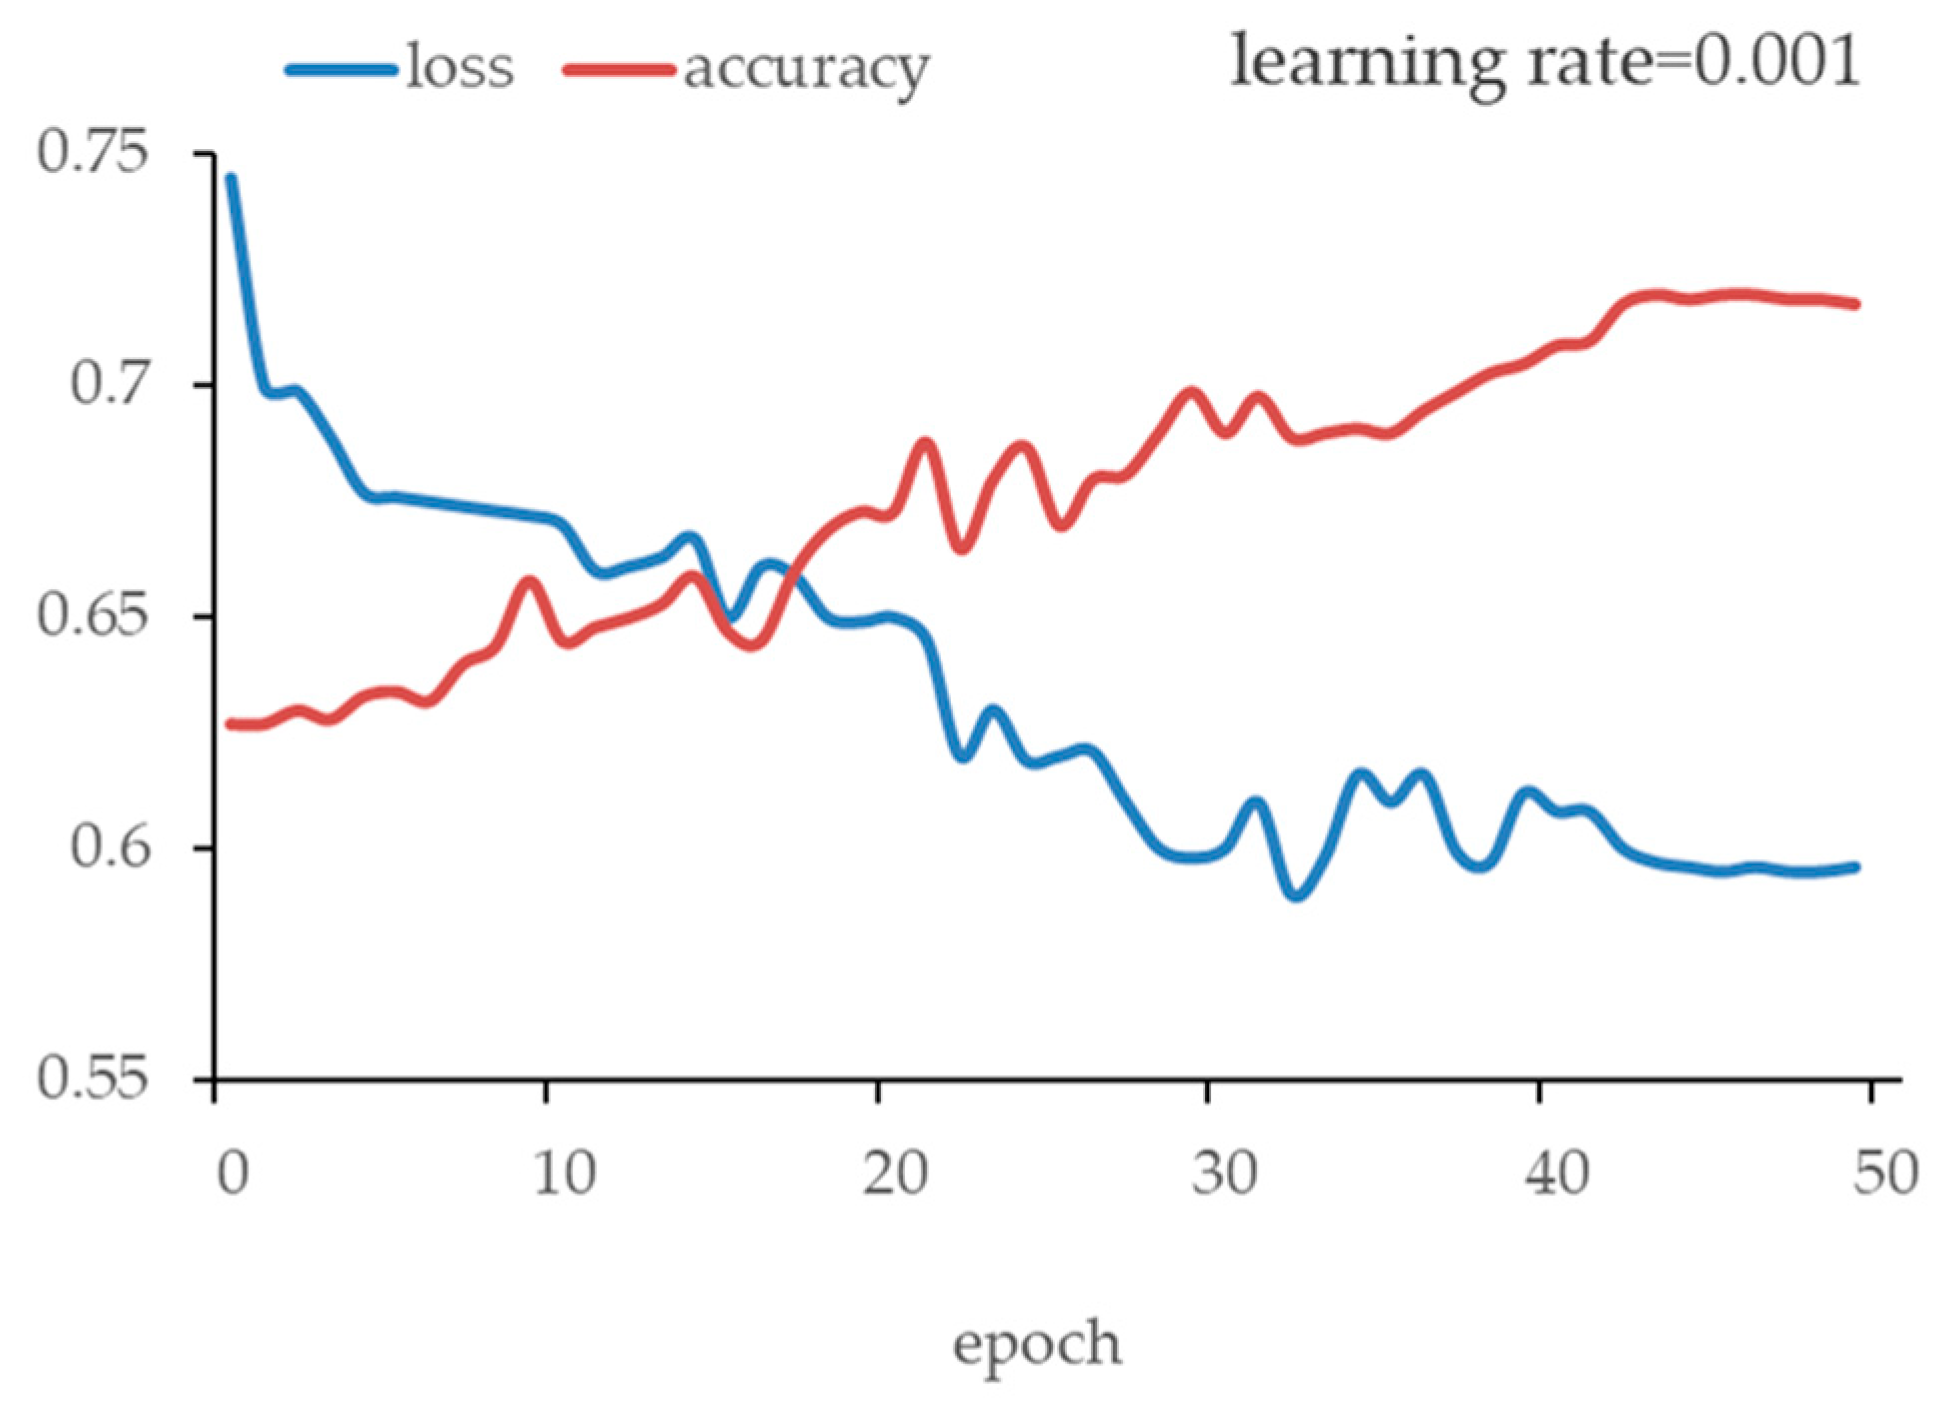
The curtain wall point cloud data obtained from NeRF was input into the PointNet++ network for semantic segmentation. The metrics for evaluating semantic segmentation include OA, mAcc, IoU, and mIoU, with the results presented in Table 3. All evaluation metrics are calculated based on three classification categories: mullion, glass panels, and aluminum panels. The semantic segmentation result of the curtain wall point cloud is shown in Figure 11. The confusion matrix of the classification results is shown in Figure 12, and the loss curve and accuracy curve of the model during the training process are shown in Figure 13. As shown in Figure 13, as the number of training epochs increases, the training loss gradually decreases while the accuracy gradually increases. After about 40 epochs, the loss and accuracy tend to stabilize, with the highest accuracy value occurring in epoch 44. According to Table 3, the OA and mIoU of semantic segmentation reached 0.718 and 0.594, which were relatively high compared to relevant research in reference [1]. The IoU of mullion is 0.626, which is sufficient for accurate identification and reconstruction of mullions. After successful reconstruction of mullions, the positions of panels (both glass and aluminum) can also be obtained accurately based on mullion grids. The IoUs of the glass panel and the aluminum panel are 0.425 and 0.732, respectively. As shown in Figure 12, it can be found that the relatively low IoU of the glass panel is mainly because the points of the glass panels can be easily misclassified as mullions. Despite the relatively low IoU for the glass panel, and based on the semantic segmentation results of points on each panel, it is still possible to accurately identify the material of each panel.

4.3. Geometric Parameters of Curtain Wall

The result of extracting straight lines from the segmented mullion point cloud is shown in Figure 14. As shown in Figure 14, our method can extract accurate vertical and horizontal lines.
The geometric parameters extracted from the curtain wall point cloud data for BIM are presented in Table 4. This study consulted as-built drawings of this building to obtain the ground-truth values of the overall dimensions. For the main building, its height, length, and width are 57.60 m, 62.50 m, and 25.80 m, respectively. For the podium, its height and length are 19.50 m and 62.50 m, respectively, and its widths are 80.50, 18.80, and 34.20 m at different positions. As the curtain walls’ grid sizes are not available in the drawings, we have adopted a terrestrial laser scanner (TLS) to measure the ground-truth values. The adopted TLS (FARO Focus Premium 150) has a ranging error of ±1 mm at 10 m and 25 m. The TLS measurements show that the grid sizes of curtain walls are different for different floors at the main building, including three different sizes: 5.62 m × 1.43 m, 3.96 m × 1.43 m, and 4.95 m × 1.43 m. The grid size of the curtain walls of the podium is 11.18 m × 0.86 m. Table 4 presents the ground-truth values and the measured values from the proposed method. According to the results, all the discrepancies are smaller than 0.1 m, and the average discrepancy is 0.06 m. This result demonstrates that the method proposed in this paper for extracting building geometric parameters from point clouds has high accuracy and can provide reliable data to support BIM modeling.
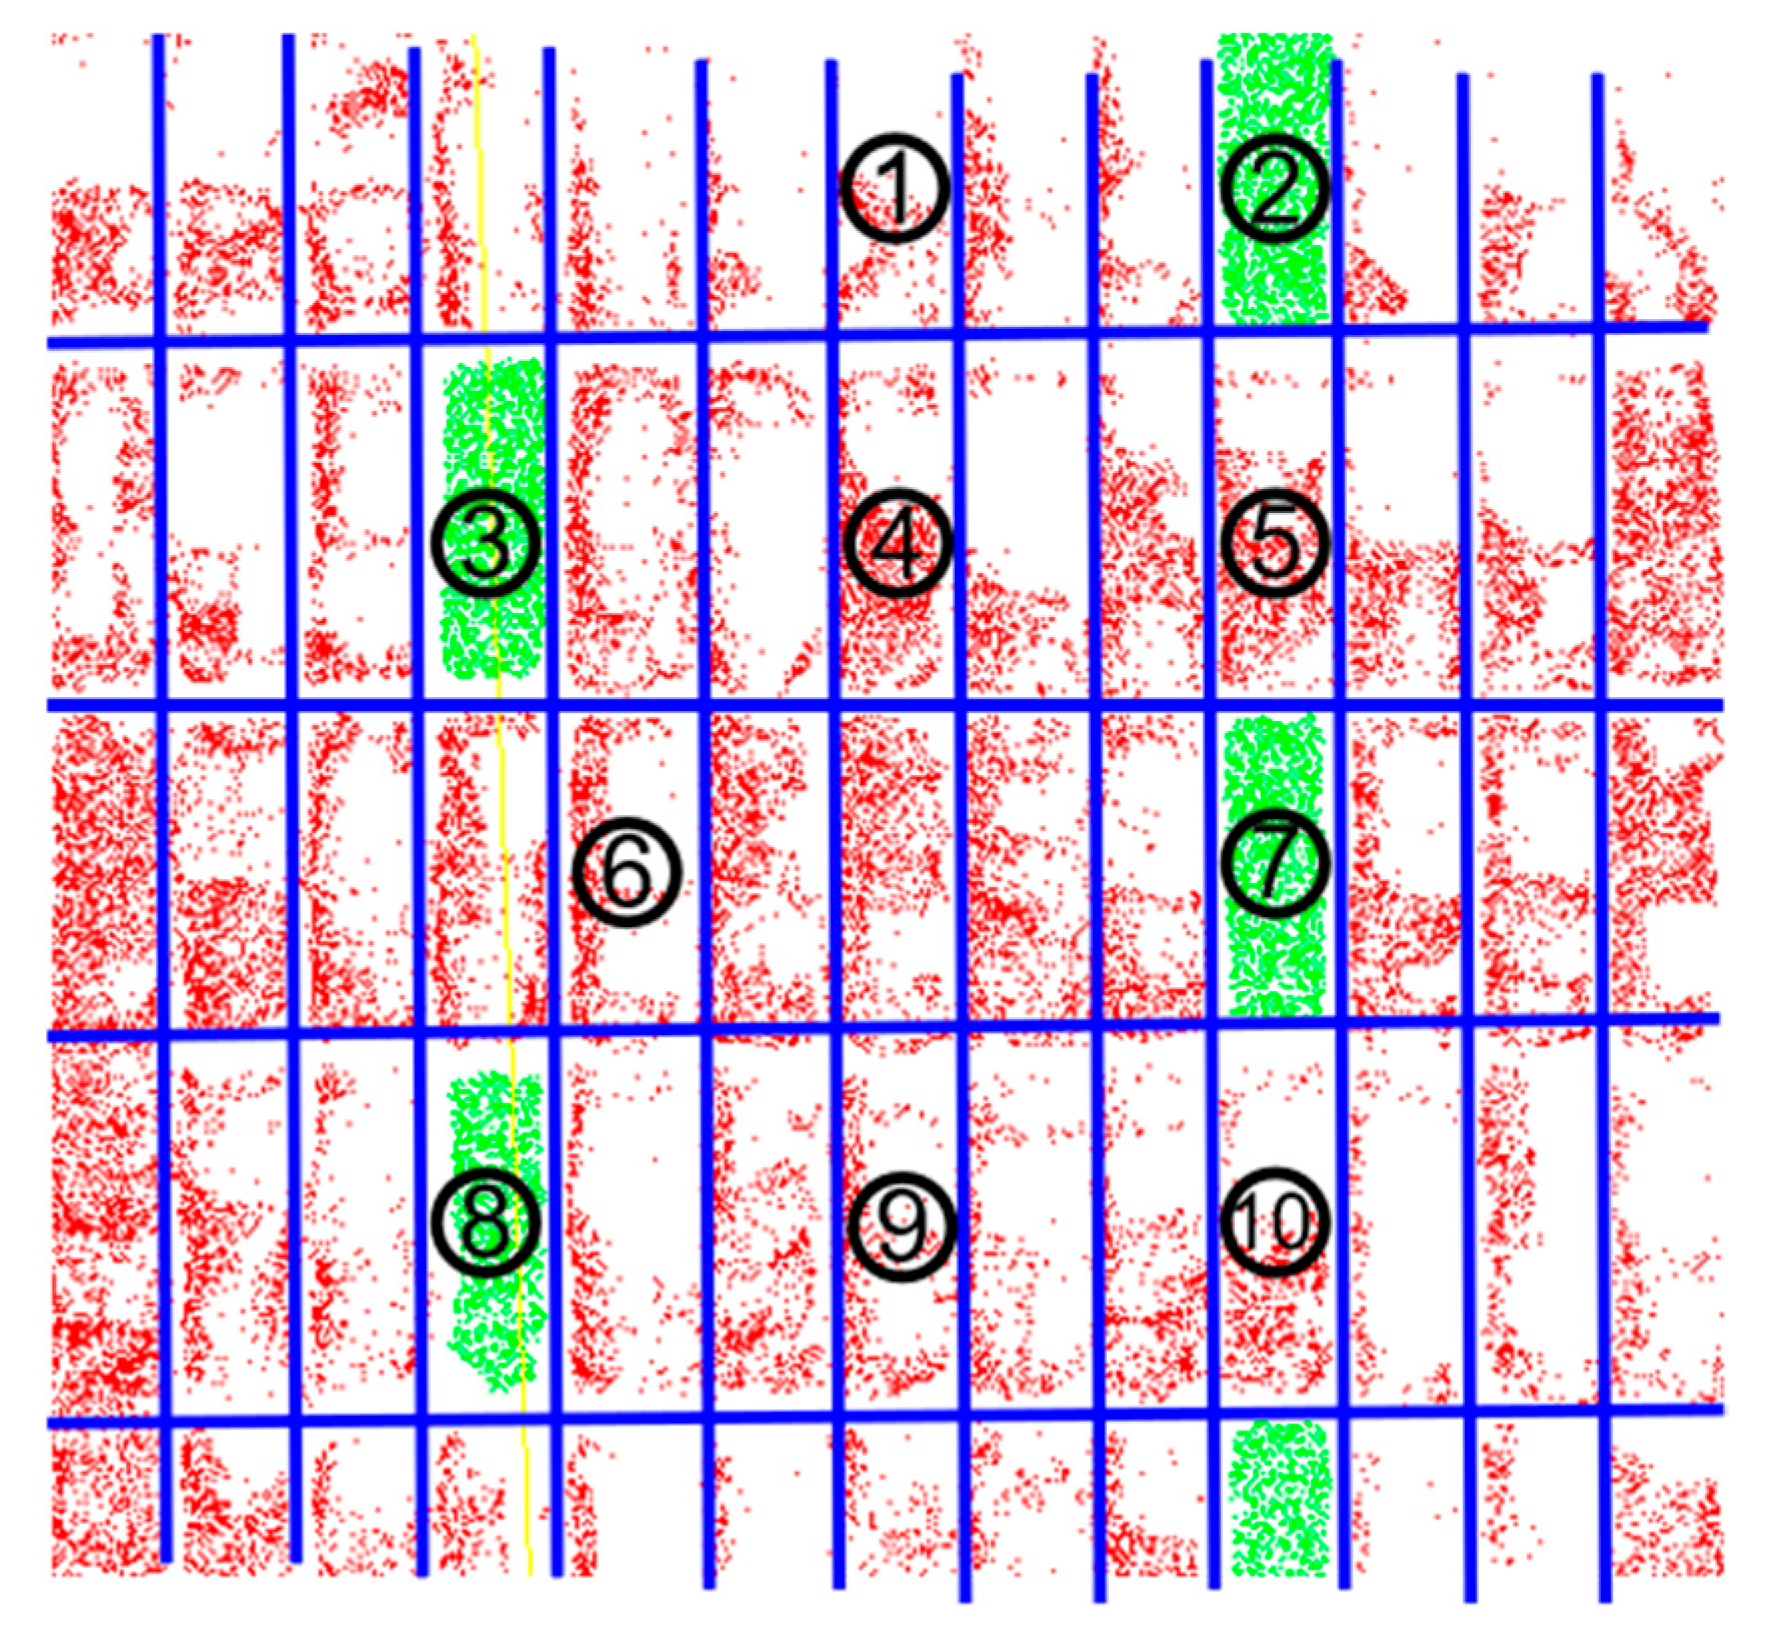
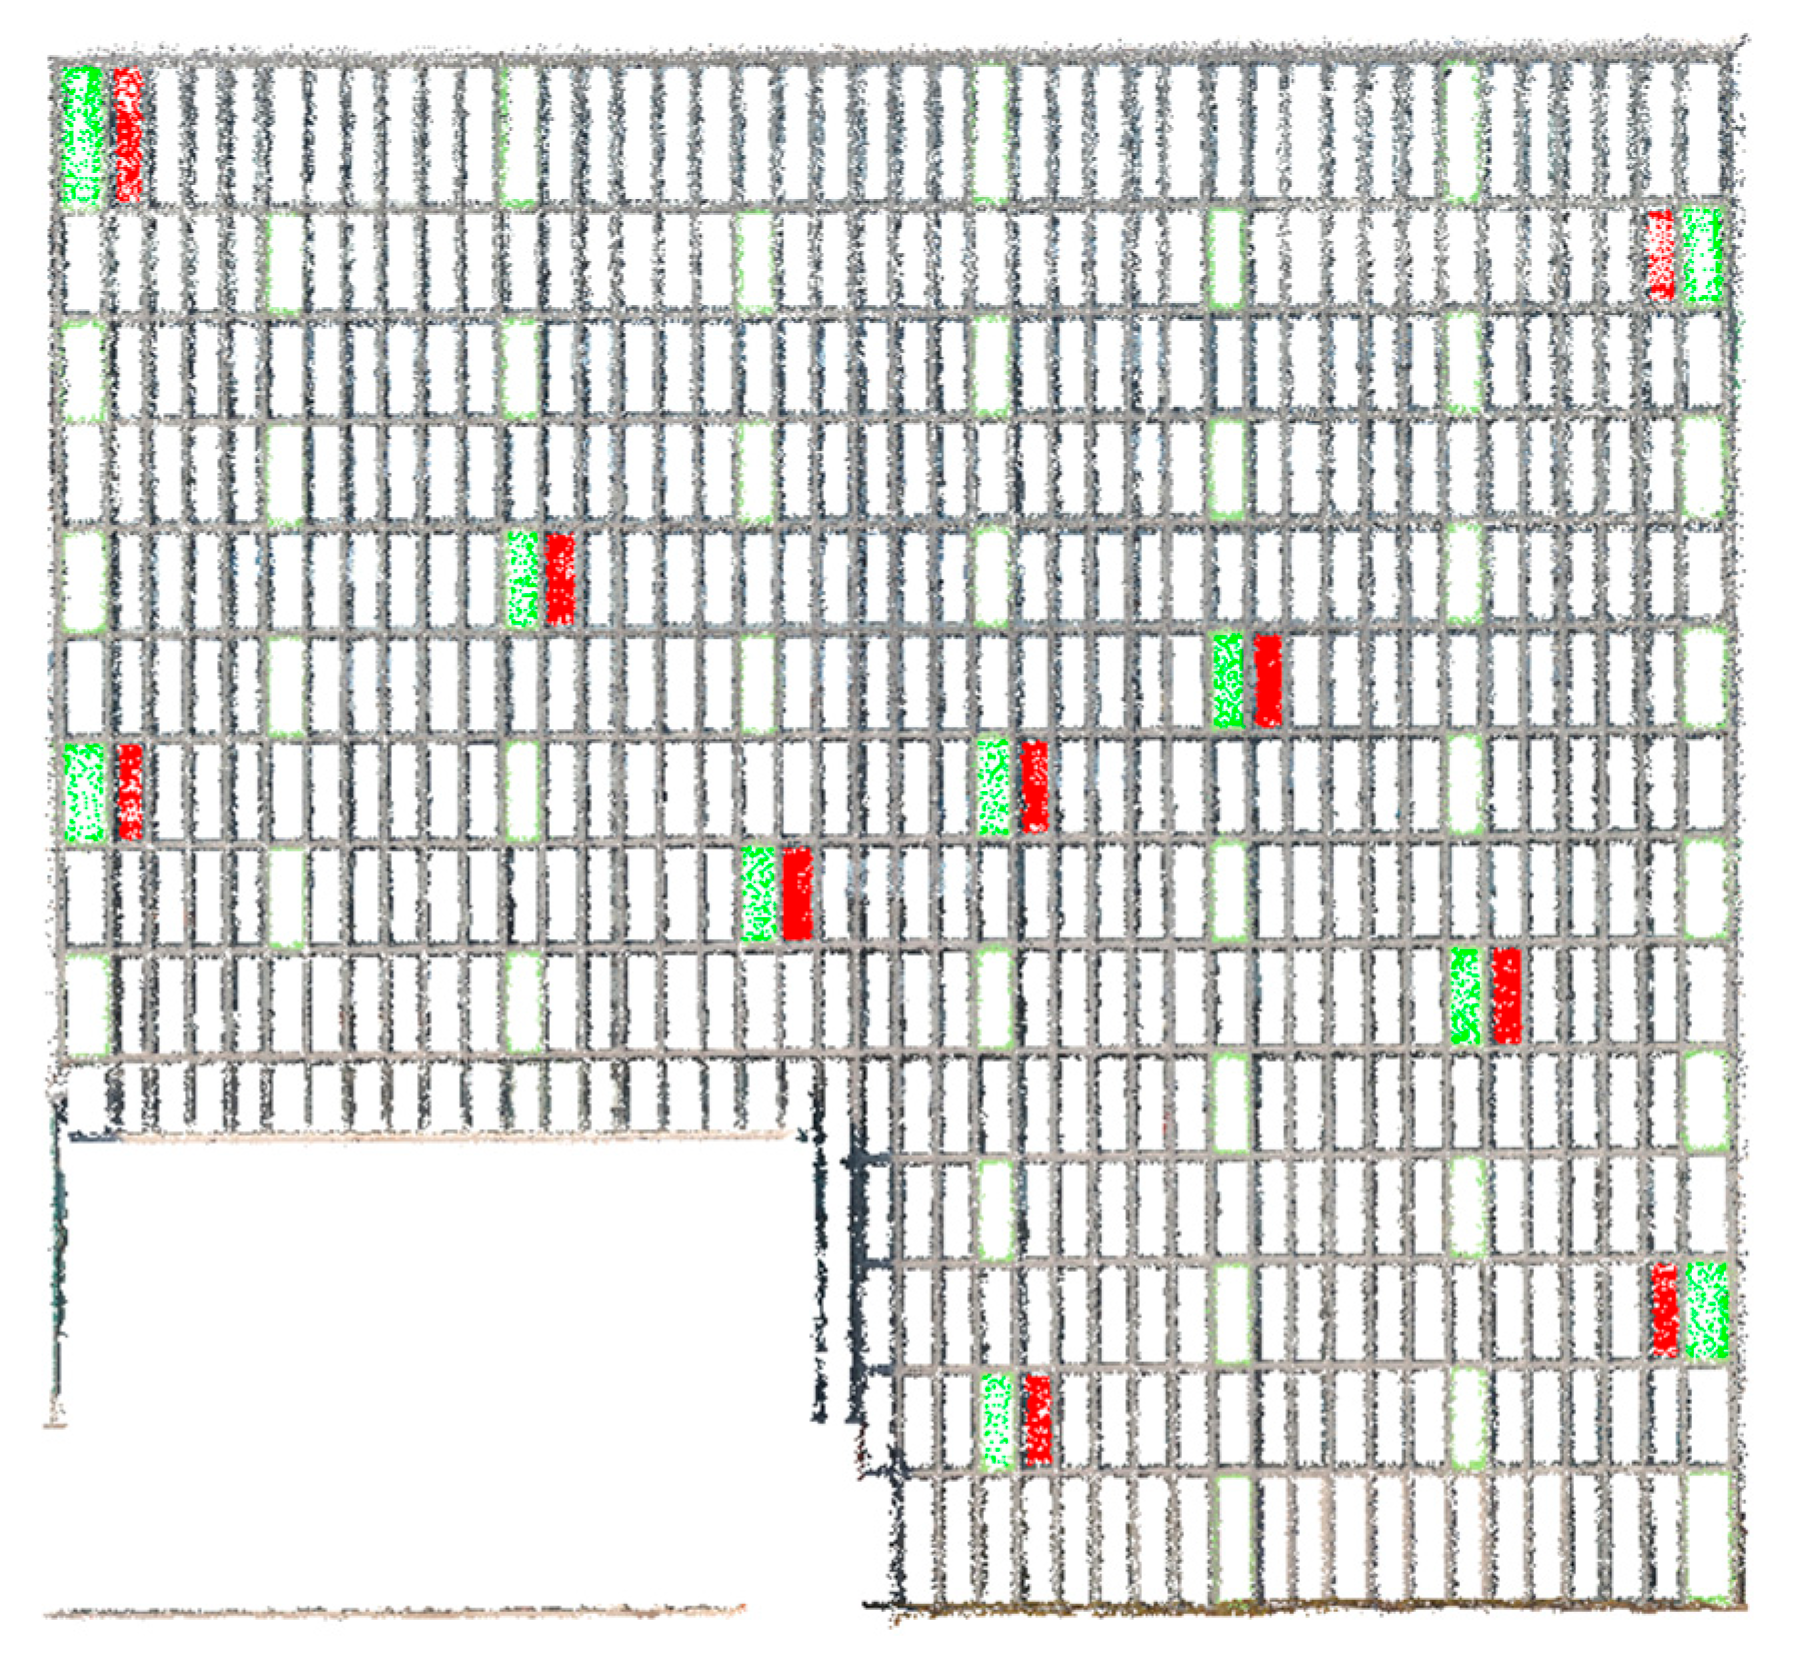
Figure 15 shows 10 different panels, and the classification results of points on these 10 panels are shown in Table 5. By our proposed method in Section 3.4, we can accurately identify the materials for all 1345 panels.

4.4. Reconstructed BIM Model

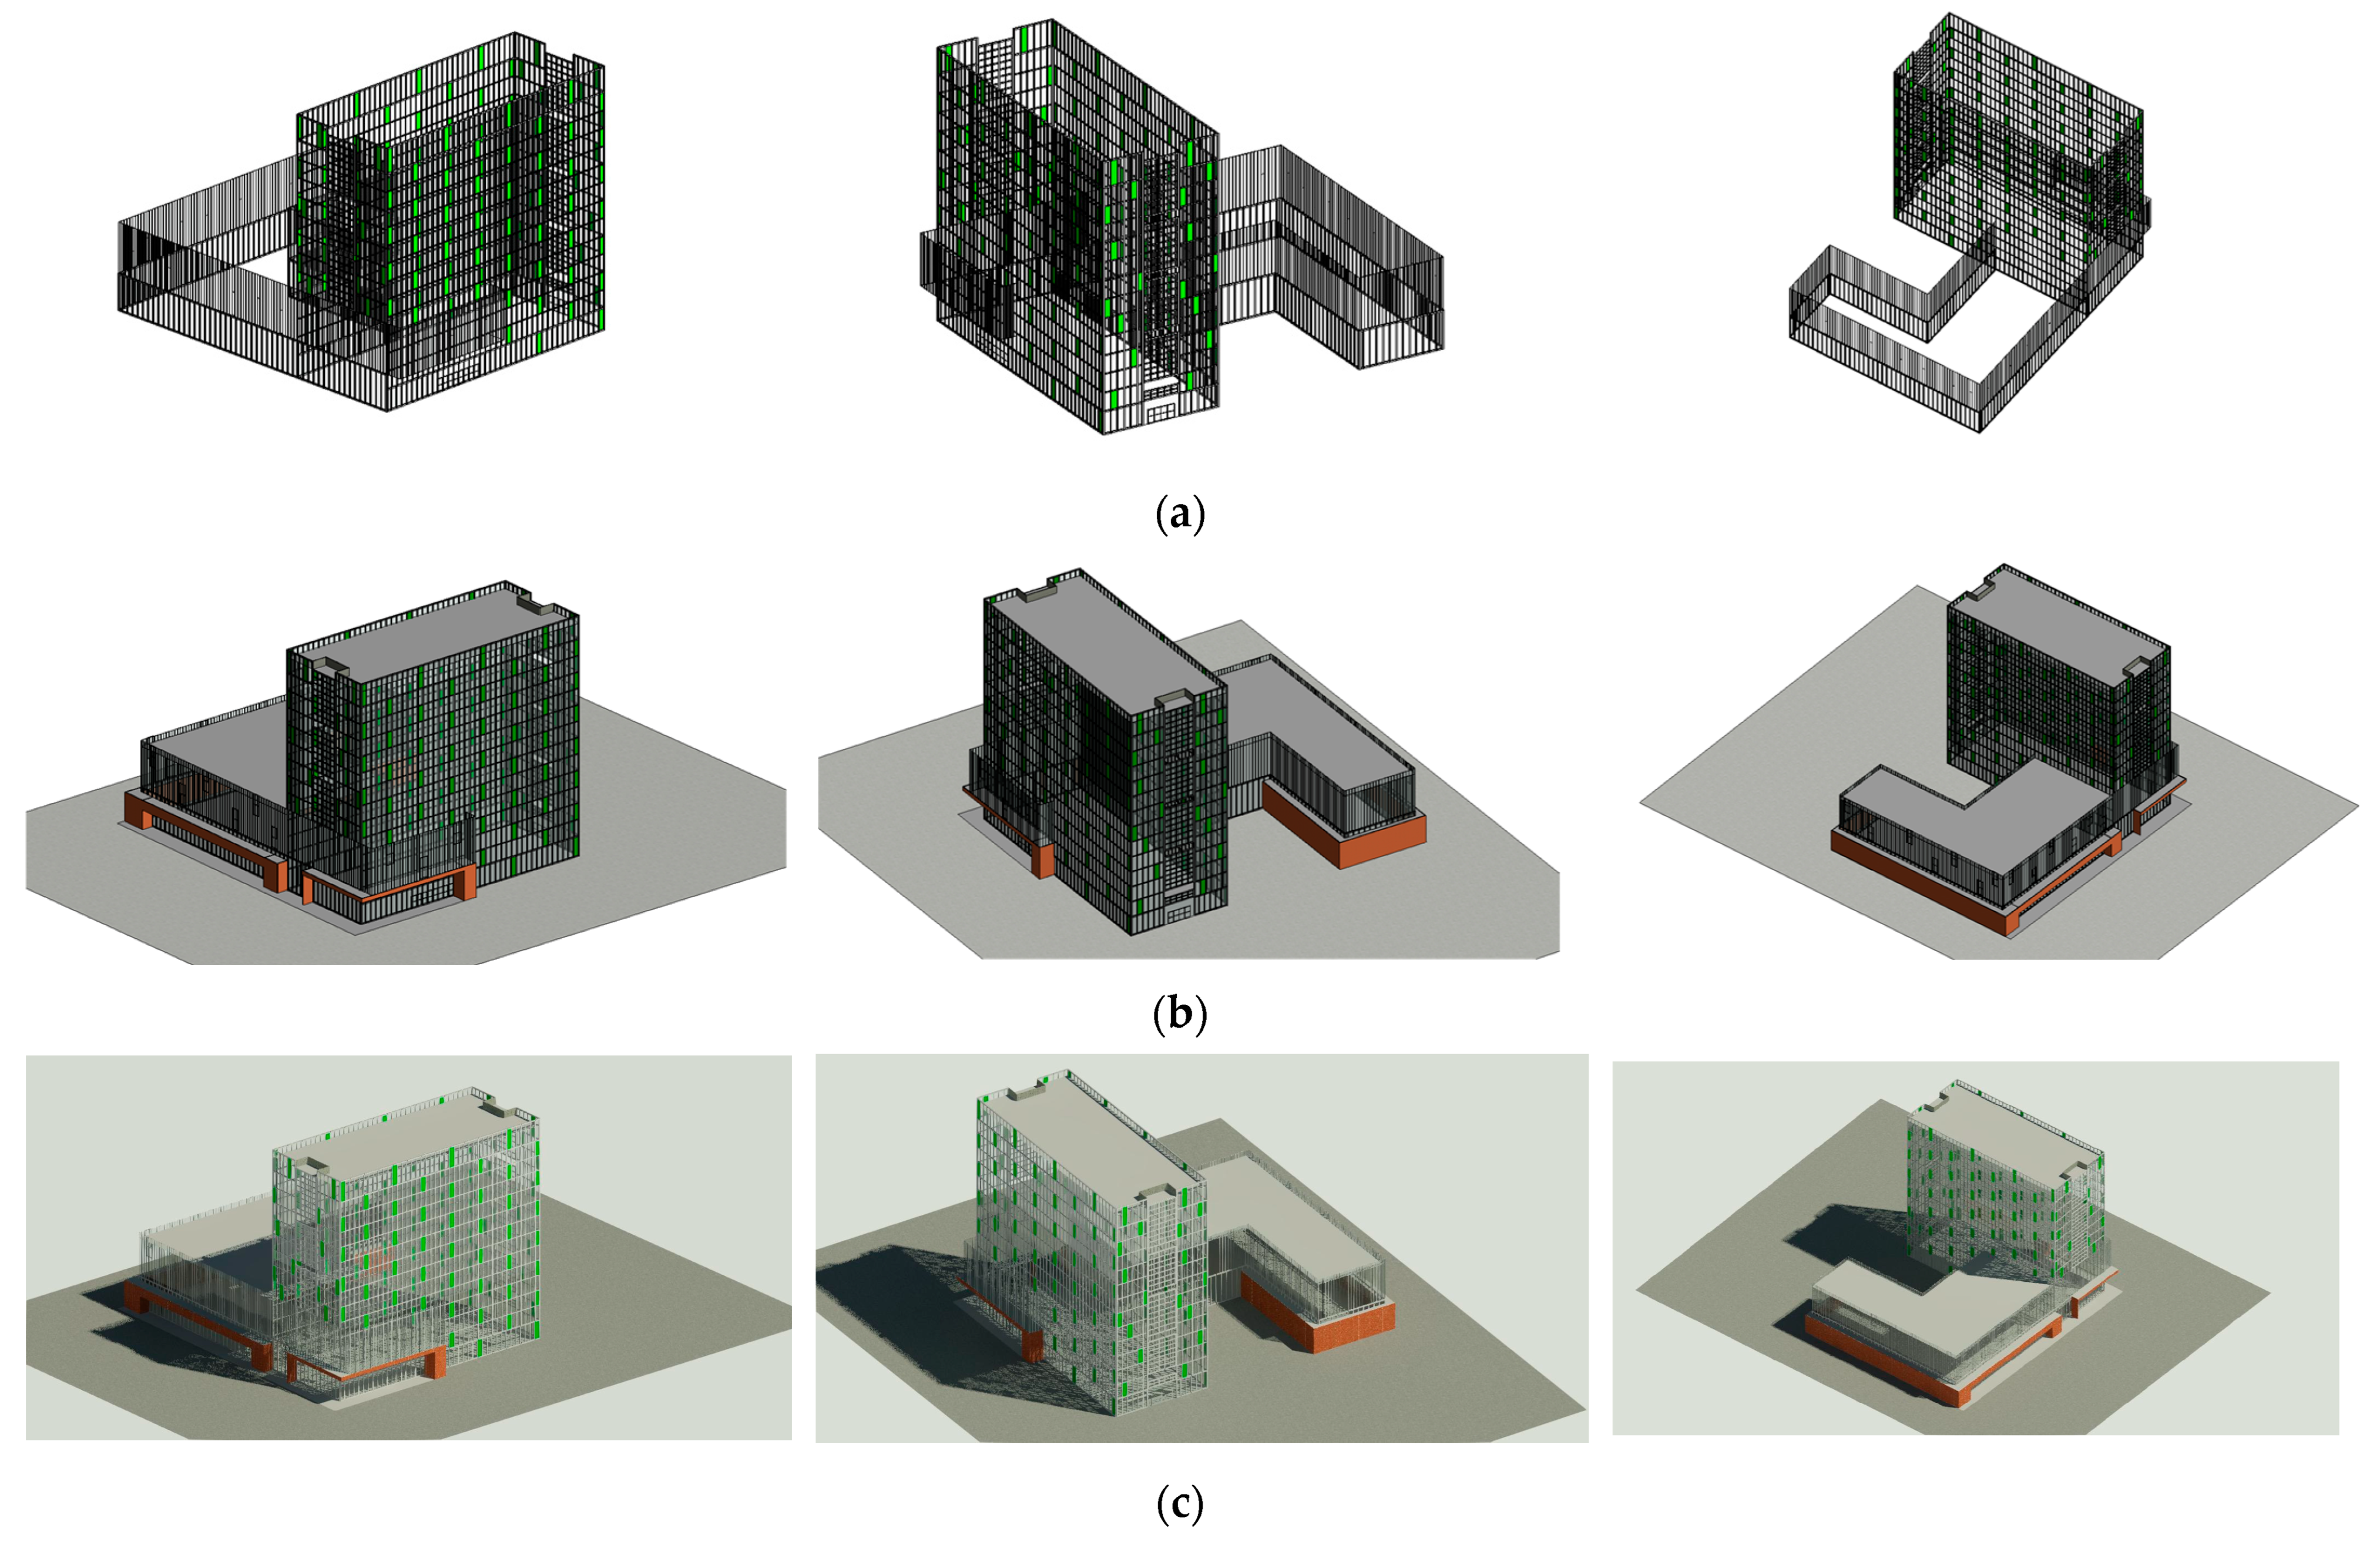
Based on the modeling parameters extracted in Section 4.3, the building’s curtain walls, including mullions and panels, were reconstructed automatically, as shown in Figure 16a. Then, other major components (floors, walls, and roofs) were reconstructed based on the position of the curtain walls, as shown in Figure 16b. The roof and floor were reconstructed based on the position and size of the curtain walls, while the walls in the podium were reconstructed based on the elevation from the floor to the podium curtain wall. Finally, the reconstructed BIM model was rendered to present a more realistic appearance, as shown in Figure 16c.
By comparing the reconstructed model with real photographs and point cloud data, it can be observed that this BIM model not only demonstrates a high degree of alignment with the actual building in terms of overall architectural form but also excels in the detailed representation of the curtain walls. The reconstructed BIM model effectively reproduces features such as the material texture, splicing method, and 3D shape of the curtain wall, fully proving the high quality and precision of this BIM model.

5. Discussion

5.1. Comparison of Point Cloud Quality Generated by NeRF and Photogrammetry

5.1.1. Plane Fitting Accuracy

Due to the unique geometric structure of building curtain walls, where all panels are planar, the accuracy of point cloud plane fitting can be employed to evaluate the quality of point clouds. This study selected ten panels of different materials (aluminum and glass) on the curtain wall for planar accuracy evaluation, and the position of the selected panels is shown in Figure 17. STD, RMSE, and MAE were calculated for the results of NeRF and photogrammetry, as shown in Table 6 and Table 7.
It can be clearly seen from the tabular data that for the ten selected aluminum panels, the values of NeRF technology in the three indicators of STD, RMSE, and MAE are all smaller than those of photogrammetry technology. This result indicates that when processing data of aluminum panels, NeRF technology can fit planes more accurately, with relatively better quality in plane fitting, and higher precision and stability.
For the ten selected glass panels, the situation is slightly different. NeRF technology outperforms photogrammetry technology in terms of evaluation indicators for only two panels, while its performance for the remaining panels is relatively weaker. This may be attributed to the fact that the special optical properties of glass have caused certain interference to the modeling and fitting process of NeRF technology, resulting in a decrease in its precision when processing glass panels.
Taking into account the analysis results of both aluminum and glass panels, on the whole, although NeRF technology has certain deficiencies in processing glass panels, its performance is still superior to photogrammetry technology in most cases.

5.1.2. Point Cloud Completeness and Density Distribution

The completeness and density distribution of NeRF and photogrammetry are shown in Figure 18. It is obvious that there are voids in the aluminum panel point clouds generated by photogrammetry, and the completeness of the aluminum panel point cloud generated by NeRF is better than that of photogrammetry. There is no significant difference between the two for glass panels.
For NeRF, there is not much difference in density between aluminum panels and glass panels located in similar positions, and their distribution is relatively uniform throughout the entire panel. For photogrammetry, there is a significant difference in density between aluminum panels and glass panels located in close proximity, with the point cloud density of aluminum panels being higher around the edges and lower in the middle. The point cloud generated by photogrammetry has a relatively uniform density distribution overall.
Overall, NeRF outperforms photogrammetry in point cloud completeness and density distribution in curtain walls containing glass and aluminum panels.

5.2. Comparison of Semantic Segmentation Between Traditional and Deep Learning Methods

Due to the unique structure of building curtain walls, panels, and mullions can be divided based on their characteristics. Due to the significant difference in color between panels and mullions, RGB values can be used as one of the criteria for classification. The curtain wall surface has a special geometric property, that is, the curtain wall surface is a vertical plane, and the vertical point cloud is located on the outer side of the vertical plane. This property can also be used as a basis for point cloud classification.
The semantic segmentation of the curtain wall point cloud based on color and distance to the standard plane is shown in Table 8. Whether for NeRF or photogrammetric point clouds, using deep learning methods for semantic segmentation yields better results than traditional methods for classification. Traditional methods also suffer from significant subjective factors and poor generalization.

6. Conclusions

This paper proposes a BIM reconstruction method from UAV images based on NeRF and deep learning, which can achieve precise reconstruction of the curtain walls of existing buildings. UAV is first used to capture comprehensive images of the target building. Based on the acquired building images, NeRF technology is employed to generate point cloud data. The resulting point cloud data can authentically reproduce the building’s exterior. To extract accurate modeling parameters of the curtain walls from the point clouds, PointNet++ is used for the semantic segmentation of the point clouds. The OA of semantic segmentation reached 71.8% and the IoU of mullion reached 62.6%. The geometric parameters of the curtain walls are extracted accurately, and the overall dimensional error is less than 0.1 m. After obtaining the accurate geometric parameters of the curtain walls, the Dynamo plug-in Autodesk Revit is utilized to achieve the automated parametric modeling of the building’s curtain walls.
This paper conducts a comprehensive and detailed discussion of the experimental results. On the one hand, this study delves into the quality of point clouds generated by NeRF and photogrammetry, including key indicators such as point cloud plane fitting accuracy, completeness, and density distribution. It is found that, for curtain walls containing aluminum and glass panels, the point clouds generated by NeRF outperform those generated by photogrammetry in terms of accuracy, completeness, and density distribution. On the other hand, this study compares the results of semantic segmentation of curtain wall point clouds using deep learning methods and traditional classification methods. The experimental results show that the accuracy and efficiency of using deep learning methods for curtain wall point cloud segmentation are significantly higher than those of traditional classification methods.
However, despite achieving certain results, this study also has some limitations. Firstly, the training and testing datasets used for PointNet++ are from the same building. This limits the generalization ability of the trained semantic segmentation model. Therefore, future research should include point clouds of multiple buildings with variations and introduce synthetic data for model training when necessary to improve the generalization ability and segmentation accuracy of the model. In addition, if there are higher precision requirements in practical applications, professional surveying cameras with better performance should be used. In addition, although using the PointNet++ network for semantic segmentation of curtain wall point clouds has achieved high precision, other mainstream semantic segmentation networks, such as PointCNN [47], have not been fully discussed and compared. Future research should take this into full consideration and conduct a comprehensive evaluation and analysis of the effects of different semantic segmentation networks on curtain wall point cloud segmentation to provide more references for selecting the optimal semantic segmentation method in practical applications. Finally, in order to explore more automated “scan to BIM” pipelines, the next research step should be to achieve the automatic 3D recognition and modeling of the entire building by recognizing the connection between horizontal and vertical load-bearing structures and curtain walls through close-range UAV image recognition.

Author Contributions

Conceptualization, Q.W.; methodology, Q.W. and Z.L.; software, Z.L. and X.N.; validation, H.Y.; formal analysis, Q.W.; investigation, H.Y.; resources, Q.W.; data curation, H.Y. and X.N.; writing—original draft preparation, Z.L.; writing—review and editing, Q.W. and H.Y.; visualization, Z.L. and X.N.; supervision, Q.W. and H.Y.; project administration, Q.W.; funding acquisition, Q.W. All authors have read and agreed to the published version of the manuscript.

Funding

This work was supported by the National Key R&D Program of China (No. 2023YFC3804300), Start-up Research Fund of Southeast University (No. RF1028623126), and Science and Technology Planning Project of Jiangsu Province of China (No. BZ2024058).

Data Availability Statement

The original contributions presented in the study are included in the article, and further inquiries can be directed to the corresponding author.

Conflicts of Interest

The authors declare no conflicts of interest.

References

  1. Wu, D.; Li, Y.; Li, R.; Cheng, L.; Zhao, J.; Zhao, M.; Lee, C.H. Automatic curtain wall frame detection based on deep learning and cross-modal feature fusion. Autom. Constr. 2024, 160, 105305. [Google Scholar] [CrossRef]
  2. Zhou, K.; Shi, J.-L.; Fu, J.-Y.; Zhang, S.-X.; Liao, T.; Yang, C.-Q.; Wu, J.-R.; He, Y.-C. An improved YOLOv10 algorithm for automated damage detection of glass curtain-walls in high-rise buildings. J. Build. Eng. 2025, 101, 111812. [Google Scholar] [CrossRef]
  3. Elshabshiri, A.; Ghanim, A.; Hussien, A.; Maksoud, A.; Mushtaha, E. Integration of Building Information Modeling and Digital Twins in the Operation and Maintenance of a building lifecycle: A bibliometric analysis review. J. Build. Eng. 2025, 99, 111541. [Google Scholar] [CrossRef]
  4. Yue, H.; Wang, Q.; Zhao, Z.; Lai, S.; Huang, G. Interactions between BIM and robotics: Towards intelligent construction engineering and management. Comput. Ind. 2025, 169, 104299. [Google Scholar] [CrossRef]
  5. Fang, Y.P.; Mitoulis, S.A.; Boddice, D.; Yu, J.L.; Ninic, J. Scan-to-BIM-to-Sim: Automated reconstruction of digital and simulation models from point clouds with applications on bridges. Results Eng. 2025, 25, 104289. [Google Scholar] [CrossRef]
  6. Zhang, C.; Zou, Y.; Wang, F.; Dimyadi, J. Automated UAV image-to-BIM registration for planar and curved building façades using structure-from-motion and 3D surface unwrapping. Autom. Constr. 2025, 174, 106148. [Google Scholar] [CrossRef]
  7. Jeon, Y.; Tran, D.Q.; Vo, K.T.D.; Jeon, J.; Park, M.; Park, S. Neural radiance fields for construction site scene representation and progress evaluation with BIM. Autom. Constr. 2025, 172, 106013. [Google Scholar] [CrossRef]
  8. Wang, Q.; Kim, M.K. Applications of 3D point cloud data in the construction industry: A fifteen-year review from 2004 to 2018. Adv. Eng. Inf. 2019, 39, 306–319. [Google Scholar] [CrossRef]
  9. Yue, H.Z.; Wang, Q.; Yan, Y.Z.; Huang, G.Y. Deep learning-based point cloud completion for MEP components. Autom. Constr. 2025, 175, 106218. [Google Scholar] [CrossRef]
  10. Chen, X.Z.; Song, Z.B.; Zhou, J.; Xie, D.; Lu, J.F. Camera and LiDAR Fusion for Urban Scene Reconstruction and Novel View Synthesis via Voxel-Based Neural Radiance Fields. Remote Sens. 2023, 15, 4628. [Google Scholar] [CrossRef]
  11. Mildenhall, B.; Srinivasan, P.P.; Tancik, M.; Barron, J.T.; Ramamoorthi, R.; Ng, R. NeRF: Representing Scenes as Neural Radiance Fields for View Synthesis. Commun. ACM 2022, 65, 99–106. [Google Scholar] [CrossRef]
  12. Remondino, F.; Karami, A.; Yan, Z.Y.; Mazzacca, G.; Rigon, S.; Qin, R.J. A Critical Analysis of NeRF-Based 3D Reconstruction. Remote Sens. 2023, 15, 3585. [Google Scholar] [CrossRef]
  13. Tancik, M.; Weber, E.; Ng, E.; Li, R.L.; Yi, B.; Kerr, J.; Wang, T.; Kristofferson, A.; Austin, J.; Salahi, K.; et al. Nerfstudio: A Modular Framework for Neural Radiance Field Development. In Proceedings of the ACM SIGGRAPH Conference, Los Angeles, CA, USA, 6–10 August 2023. [Google Scholar]
  14. Ullman, S. Interpretation of structure from motion. Proc. R. Soc. Ser. B Biol. Sci. 1979, 203, 405–426. [Google Scholar] [CrossRef]
  15. Schönberger, J.L.; Frahm, J.M. Structure-from-Motion Revisited. In Proceedings of the 2016 IEEE Conference on Computer Vision and Pattern Recognition (CVPR), Seattle, WA, USA, 27–30 June 2016; pp. 4104–4113. [Google Scholar]
  16. Snavely, N.; Seitz, S.M.; Szeliski, R. Modeling the world from Internet photo collections. Int. J. Comput. Vision 2008, 80, 189–210. [Google Scholar] [CrossRef]
  17. Schönberger, J.L.; Zheng, E.L.; Frahm, J.M.; Pollefeys, M. Pixelwise View Selection for Unstructured Multi-View Stereo. In Proceedings of the 14th European Conference on Computer Vision (ECCV), Amsterdam, The Netherlands, 8–16 October 2016; pp. 501–518. [Google Scholar]
  18. Kazhdan, M. Poisson Surface Reconstruction. In Proceedings of the Eurographics Symposium on Geometry Processing, Cagliari, Italy, 26–28 June 2006. [Google Scholar]
  19. Wang, T.; Li, M.K.; Wang, H.M.; Li, P.B.; Xu, B.Q.; Hu, D.F. Context-aware depth estimation for improved 3D reconstruction of homogeneous indoor environments. Autom. Constr. 2025, 177, 106343. [Google Scholar] [CrossRef]
  20. Zhu, X.D.; Zhu, Q.K.; Zhang, Q.; Du, Y.F. Deep learning-based 3D reconstruction of ancient buildings with surface damage identification and localization. Structures 2025, 73, 108383. [Google Scholar] [CrossRef]
  21. Li, J.; Ren, G.; Pan, Y.; Sun, J.; Wang, P.; Xu, F.; Liu, Z. Surface Reconstruction Planning with High-Quality Satellite Stereo Pairs Searching. Remote Sens. 2025, 17, 2390. [Google Scholar] [CrossRef]
  22. Su, Y.; Wang, J.; Wang, X.Y.; Hu, L.; Yao, Y.; Shou, W.C.; Li, D.Q. Zero-reference deep learning for low-light image enhancement of underground utilities 3D reconstruction. Autom. Constr. 2023, 152, 104930. [Google Scholar] [CrossRef]
  23. Sterckx, J.; Vlaminck, M.; De Bauw, K.; Luong, H. Accurate and robust 3D reconstruction of wind turbine blade leading edges from high-resolution images. Autom. Constr. 2025, 175, 106153. [Google Scholar] [CrossRef]
  24. Dino, I.G.; Sari, A.E.; Iseri, O.K.; Akin, S.; Kalfaoglu, E.; Erdogan, B.; Kalkan, S.; Alatan, A.A. Image-based construction of building energy models using computer vision. Autom. Constr. 2020, 116, 103231. [Google Scholar] [CrossRef]
  25. Santagati, C.; Lo Turco, M.; D’Agostino, G. Populating a Library of Reusable H-Boms: Assessment of a Feasible Image Based Modeling Workflow. In Proceedings of the 26th International Symposium of ICOMOS/ISPRS-International-Scientific-Committee-on-Heritage-Documentation (CIPA) on Digital Workflows for Heritage Conservation, Ottawa, ON, Canada, 28 August–1 September 2017; pp. 627–634. [Google Scholar]
  26. Xu, Z.H.; Wu, L.X.; Shen, Y.L.; Li, F.S.; Wang, Q.L.; Wang, R. Tridimensional Reconstruction Applied to Cultural Heritage with the Use of Camera-Equipped UAV and Terrestrial Laser Scanner. Remote Sens. 2014, 6, 10413–10434. [Google Scholar] [CrossRef]
  27. Li, L.; Zhang, Y.; Jiang, Z.; Wang, Z.; Zhang, L.; Gao, H. Unmanned Aerial Vehicle-Neural Radiance Field (UAV-NeRF): Learning Multiview Drone Three-Dimensional Reconstruction with Neural Radiance Field. Remote Sens. 2024, 16, 4168. [Google Scholar] [CrossRef]
  28. Lee, G.; Asad, A.T.; Shabbir, K.; Sim, S.H.; Lee, J. Robust localization of shear connectors in accelerated bridge construction with neural radiance field. Autom. Constr. 2024, 168, 105843. [Google Scholar] [CrossRef]
  29. Cui, D.P.; Wang, W.D.; Hu, W.B.; Peng, J.; Zhao, Y.D.; Zhang, Y.K.; Wang, J. 3D reconstruction of building structures incorporating neural radiation fields and geometric constraints. Autom. Constr. 2024, 165, 105517. [Google Scholar] [CrossRef]
  30. Dong, Z.M.; Lu, W.S.; Chen, J.J. Neural rendering-based semantic point cloud retrieval for indoor construction progress monitoring. Autom. Constr. 2024, 164, 105448. [Google Scholar] [CrossRef]
  31. Fan, W.; Liu, X.; Zhang, Y.; Wei, D.; Guo, H.; Yue, D. 3D wireframe model reconstruction of buildings from multi-view images using neural implicit fields. Autom. Constr. 2025, 174, 106145. [Google Scholar] [CrossRef]
  32. Hermann, M.; Kwak, H.; Ruf, B.; Weinmann, M. Leveraging Neural Radiance Fields for Large-Scale 3D Reconstruction from Aerial Imagery. Remote Sens. 2024, 16, 4655. [Google Scholar] [CrossRef]
  33. Yao, H.; Qin, R.J.; Chen, X.Y. Unmanned Aerial Vehicle for Remote Sensing Applications-A Review. Remote Sens. 2019, 11, 1443. [Google Scholar] [CrossRef]
  34. Duan, T.; Hu, P.C.; Sang, L.Z. Research on route planning of aerial photography of UAV in highway greening monitoring. In Proceedings of the International Symposium on Power Electronics and Control Engineering (ISPECE), Xi’an, China, 28–30 December 2018. [Google Scholar]
  35. Xiao, R.Y.; Yang, F.; Dong, Z.H. Path Planning of Unmanned Air Vehicles Relay Communication Based on Lowest Power Loss. In Proceedings of the 9th Asia Conference on Mechanical and Aerospace Engineering (ACMAE), Singapore, 29–31 December 2018. [Google Scholar]
  36. Ding, Y.L.; Xin, B.; Chen, J.; Fang, H.; Zhu, Y.G.; Gao, G.Q.; Dou, L.H. Path Planning of Messenger UAV in Air-ground Coordination. In Proceedings of the 20th World Congress of the International-Federation-of-Automatic-Control (IFAC), Toulouse, France, 9–14 July 2017; pp. 8045–8051. [Google Scholar]
  37. Yusof, H.; Ahmad, M.A.; Abdullah, A.M.T. Historical Building Inspection using the Unmanned Aerial Vehicle (Uav). Int. J. Sustain. Constr. Eng. Technol. 2020, 11, 12–20. [Google Scholar] [CrossRef]
  38. Tang, F.F.; Ruan, Z.M.; Li, L. Application of Unmanned Aerial Vehicle Oblique Photography in 3D Modeling of Crag. In Proceedings of the 10th International Conference on Digital Image Processing (ICDIP), Shanghai, China, 11–14 May 2018. [Google Scholar]
  39. Yue, H.; Wang, Q.; Huang, L.; Zhang, M. Enhancing point cloud semantic segmentation of building interiors through diffusion-based scene-level synthesis. Autom. Constr. 2025, 178, 106390. [Google Scholar] [CrossRef]
  40. Yue, H.Z.; Wang, Q.; Zhang, M.Y.; Xue, Y.T.; Lu, L. 2D-3D fusion approach for improved point cloud segmentation. Autom. Constr. 2025, 177, 106336. [Google Scholar] [CrossRef]
  41. Adams, R.; Bischof, L. Seeded Region Growing. IEEE Trans. Pattern Anal. Mach. Intell. 1994, 16, 641–647. [Google Scholar] [CrossRef]
  42. Jain, A.K.; Murty, M.N.; Flynn, P.J. Data clustering: A review. ACM Comput. Surv. 1999, 31, 264–323. [Google Scholar] [CrossRef]
  43. Qi, C.R.; Su, H.; Mo, K.C.; Guibas, L.J. PointNet: Deep Learning on Point Sets for 3D Classification and Segmentation. In Proceedings of the 30th IEEE/CVF Conference on Computer Vision and Pattern Recognition (CVPR), Honolulu, HI, USA, 21–26 July 2017; pp. 77–85. [Google Scholar]
  44. Yue, H.; Wang, Q.; Su, Y.; Fang, H.; Cheng, J.C.P.; Zhang, M. A point cloud dataset and deep learning method for semantic segmentation of underground garages. Copmut.-Aided Civ. Infrastruct. Eng. 2025, 40, 3726–3749. [Google Scholar] [CrossRef]
  45. Qi, C.R.; Yi, L.; Su, H.; Guibas, L.J. PointNet plus plus: Deep Hierarchical Feature Learning on Point Sets in a Metric Space. In Proceedings of the 31st Annual Conference on Neural Information Processing Systems (NIPS), Long Beach, CA, USA, 4–9 December 2017. [Google Scholar]
  46. Fischler, M.A.; Bolles, R.C. Random sample consensus: A paradigm for model-fitting with applications to image-analysis and automated cartography. Commun. ACM 1981, 24, 381–395. [Google Scholar] [CrossRef]
  47. Li, Y.; Bu, R.; Sun, M.; Wu, W.; Di, X.; Chen, B. PointCNN: Convolution On X-Transformed Points. In Proceedings of the 32nd Conference on Neural Information Processing Systems (NIPS), Montreal, QC, Canada, 2–8 December 2018. [Google Scholar]
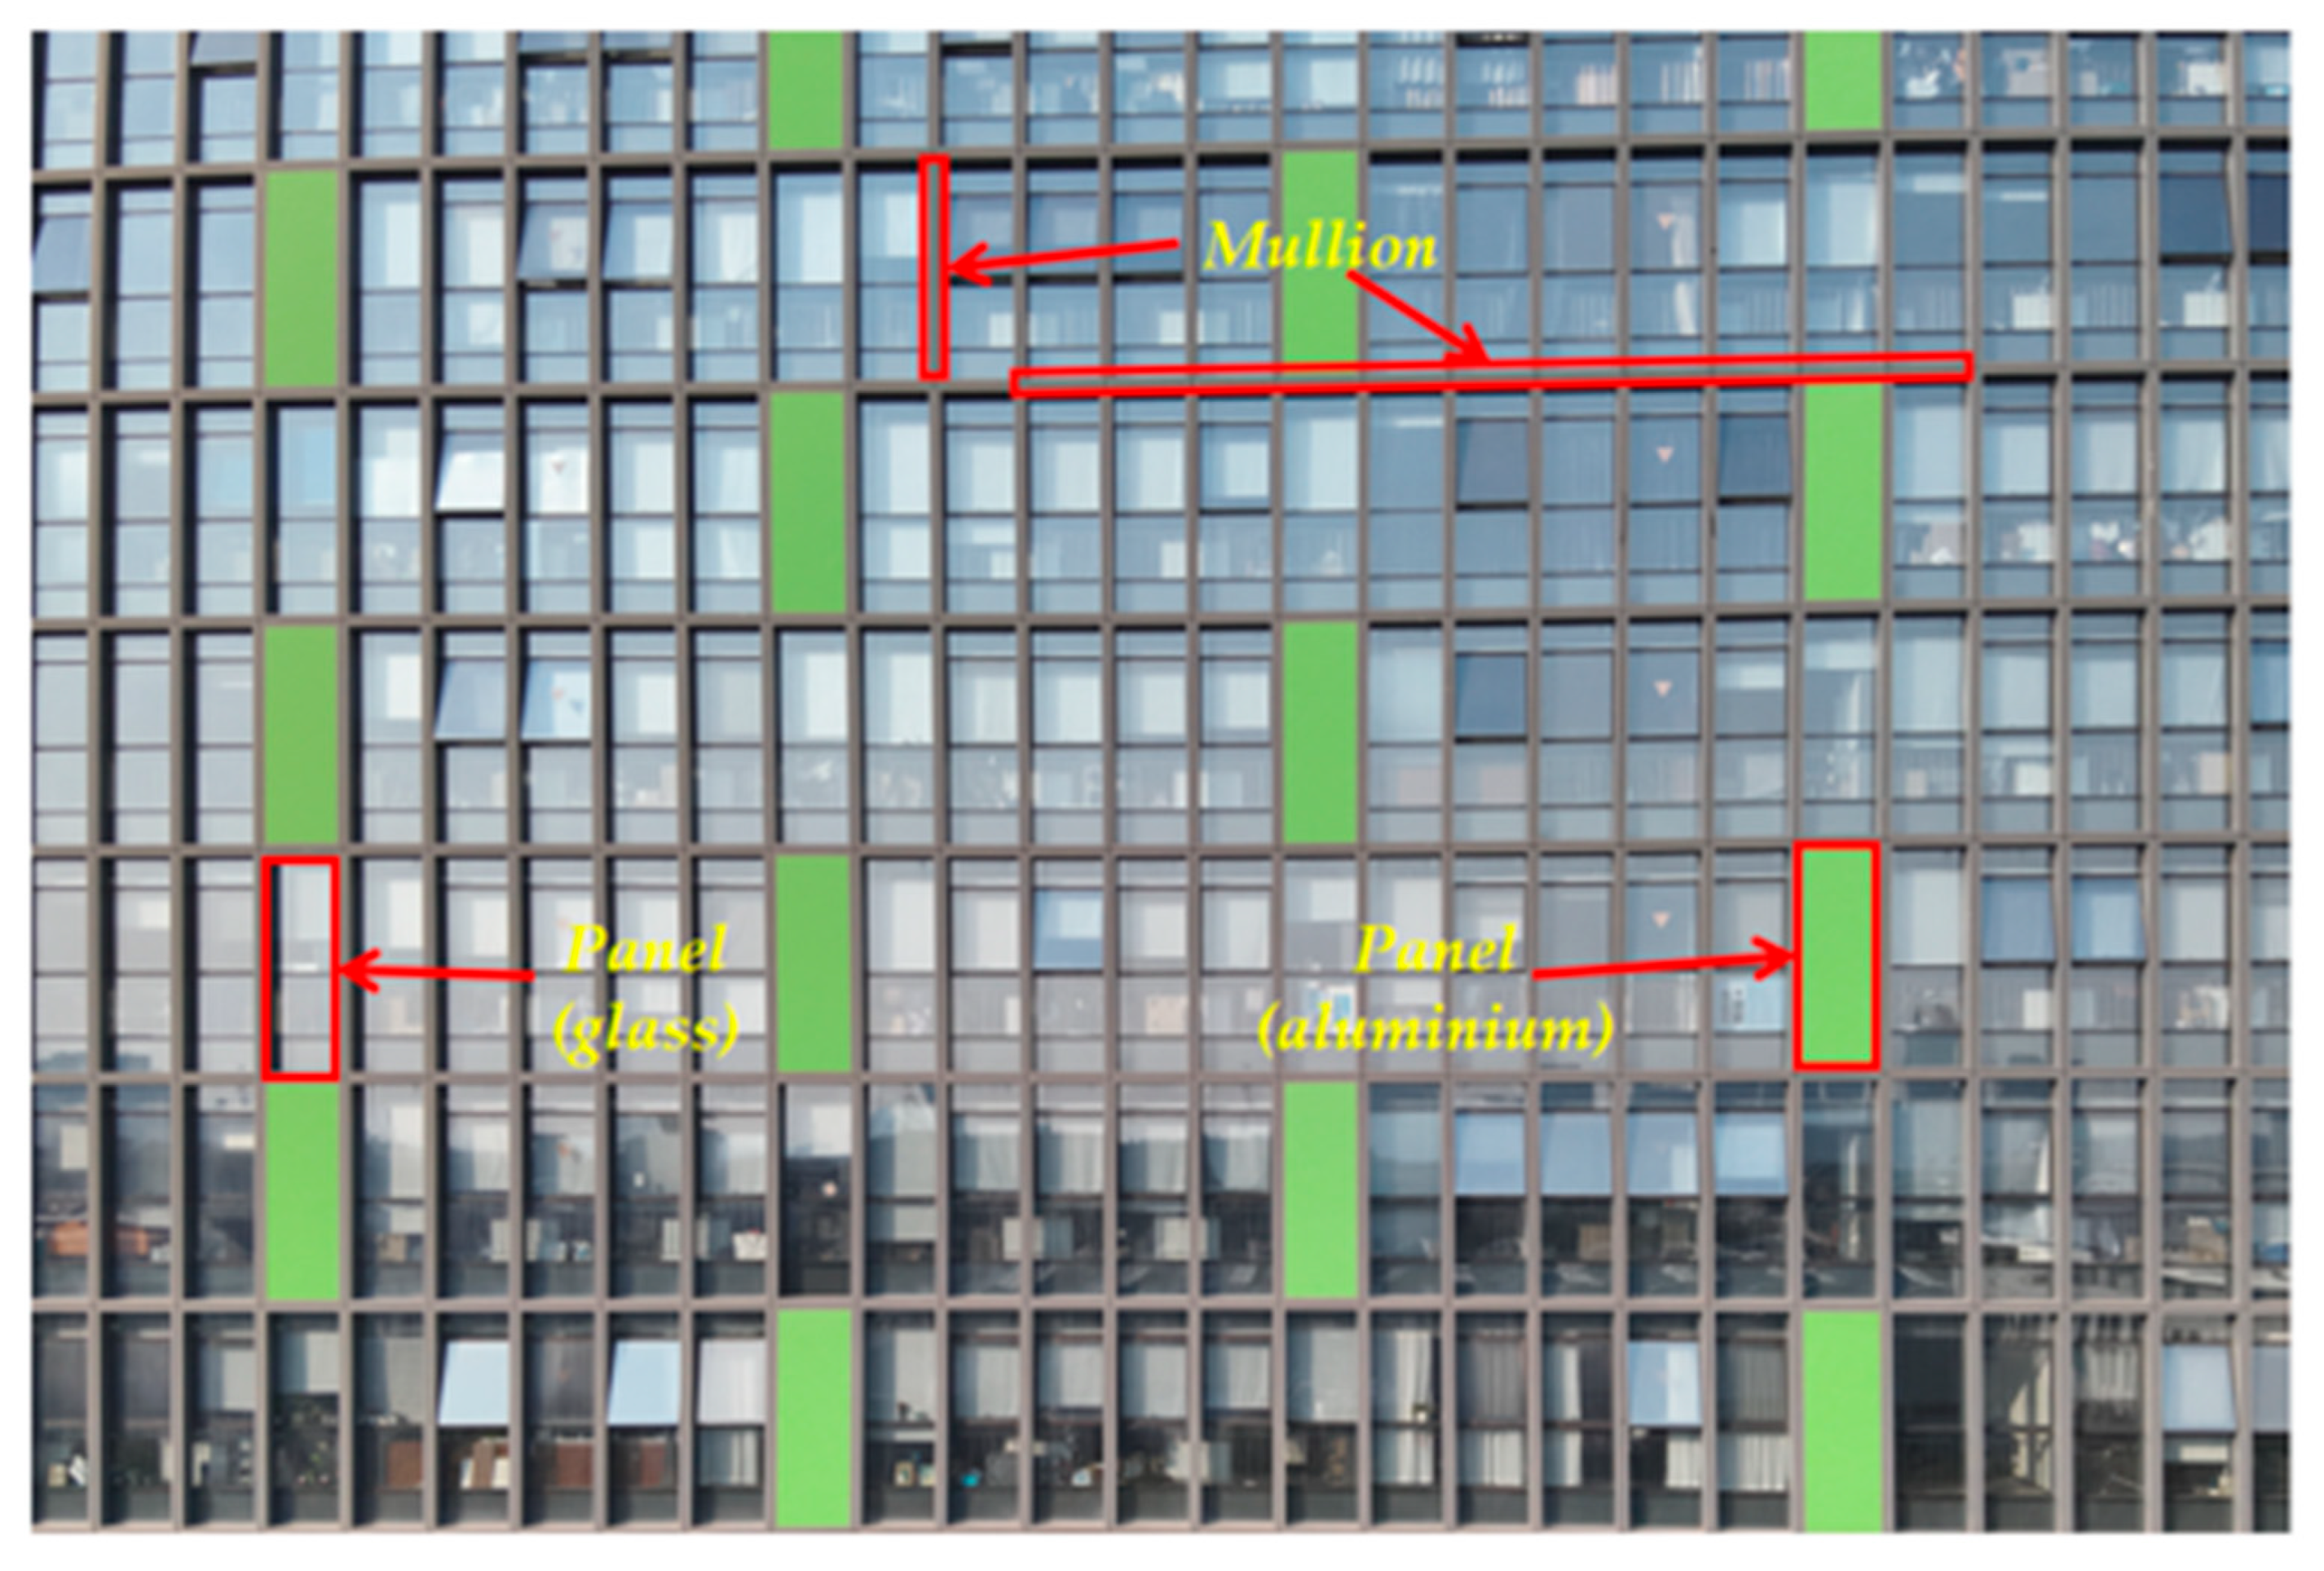
Figure 1. Mullions and panels in the curtain wall.
Remotesensing 17 03368 g001
Figure 2. Process of BIM reconstruction method for existing building curtain walls based on NeRF.
Remotesensing 17 03368 g002
Figure 3. Workflow of NeRF [11].
Remotesensing 17 03368 g003
Figure 4. MLP architecture for NeRF [11].
Remotesensing 17 03368 g004
Figure 5. The dataset used for training and testing the model.
Remotesensing 17 03368 g005
Figure 6. Structure of PointNet++.
Remotesensing 17 03368 g006
Figure 7. Five steps to extract parameters: step 1. rotate and project mullion point cloud onto xy-plane; step 2. extracting lines using RANSAC; step 3. calculate slope (k) and intercept (b), and divide the lines into horizontal and vertical ones; step 4. calculate overall dimensions of the curtain wall including length L and height H; step 5. Calculate the grid size of the curtain wall and determine the panel materials.
Remotesensing 17 03368 g007
Figure 8. The core program for creating curtain walls in Dynamo.
Remotesensing 17 03368 g008
Figure 9. Examples of collected images.
Remotesensing 17 03368 g009
Figure 10. Point clouds obtained by NeRF.
Remotesensing 17 03368 g010
Figure 11. The semantic segmentation result of PointNet++. (a) Original curtain wall point cloud; (b) Segmented curtain wall point cloud, where blue represents mullions, green represents aluminum panels, and red represents glass panels.
Remotesensing 17 03368 g011
Figure 12. The confusion matrix of the classification results.
Remotesensing 17 03368 g012
Figure 13. The loss curve and accuracy curve of the model during the training process.
Remotesensing 17 03368 g013
Figure 14. The result of extracting straight lines from the segmented mullion point cloud: (a) mullion points after semantic segmentation; (b) interior points of each line extracted by RANSAC; (c) straight lines extracted by RANSAC, where red represents vertical lines and blue represents horizontal lines.
Remotesensing 17 03368 g014
Figure 15. Ten different panel point clouds, where green represents aluminum panels and red represents glass panels.
Remotesensing 17 03368 g015
Figure 16. Reconstructed BIM model, where (a) shows the automatic reconstruction of curtain walls, (b) shows other components reconstructed based on the position and size of the curtain walls, and (c) shows the manually rendered BIM model.
Remotesensing 17 03368 g016
Figure 17. The position of the selected panels, where green represents aluminum, and red represents glass.
Remotesensing 17 03368 g017
Figure 18. The completeness and density distribution of NeRF and photogrammetry.
Remotesensing 17 03368 g018
Table 1. Summary of NeRF applications in the construction industry.
ResearcherMethodApplication ScenariosSemantic Information
Jeon et al. [7]NeRF, BIMConstruction site progress monitoringYes
Dong et al. [30]SRecon-NeRFIndoor construction progress monitoringYes
Chen et al. [10]Voxel-Based NeRFReconstruction of urban scenes.No
Cui et al. [29]NeRFusionReconstruction of complex architectural scenesNo
Fan et al. [31]Edge-NeRFExtraction of 3D wireframe modelsNo
Lee et al. [28]NerfactoRecognition of prefabricated bridge componentsNo
OursNeRF (Nerfacto), Semantic segmentation, BIMCurtain walls O&MYes
Table 2. Class distributions of the training and testing sets.
The Number of PointsMullionGlass PanelAluminum PanelTotal
Training set2,295,9341,029,146150,6483,475,728
Testing set540,282320,29163,148923,721
Table 3. The semantic segmentation metrics of PointNet++.
DatasetOAmAccMullion IoUGlass Panel IoUAluminum Panel IoUmIoU
NeRF point cloud0.7180.7000.6260.4250.7320.594
Table 4. Discrepancies of the building’s dimensional parameters between the ground-truth values and the measured values by the proposed method.
Building PartDimensionsGround-TruthMeasured by Proposed MethodDiscrepancy
Main BuildingHeight (m)57.6057.530.07
Length (m)62.5062.420.08
Width (m)25.8025.750.05
Curtain Wall Grid (m × m)5.62 × 1.43, 3.96 × 1.43, 4.95 × 1.435.70 × 1.48, 3.90 × 1.48, 5.00 × 1.480.08, 0.06, 0.05
PodiumHeight (m)19.5019.520.02
Length (m)62.5062.420.08
Width (m)80.50, 18.80, 34.2080.43, 18.84, 34.150.07, 0.04,
0.05
Curtain Wall Grid (m × m)11.18 × 0.8611.12 × 0.800.06
Table 5. Classification of panel material based on the semantic segmentation results of points on each panel.
Panel No.Proportion of Points Classified as Glass Panel (%)Proportion of Points Classified as Aluminum Panel (%)Material Classification
123.20Glass
2093.6Aluminum
3094.1Aluminum
452.60.4Glass
566.50.1Glass
630.10Glass
70.196.5Aluminum
8088.3Aluminum
936.80Glass
1052.60.1Glass
Table 6. Evaluation metrics for NeRF and photogrammetry results on aluminum panels [unit: m].
MaterialNeRFPhotogrammetry
STDRMSEMAESTDRMSEMAE
Aluminium_10.090.070.050.110.100.06
Aluminium_20.090.070.060.140.110.08
Aluminium_30.090.070.050.170.130.10
Aluminium_40.160.140.080.270.220.16
Aluminium_50.200.160.120.490.360.33
Aluminium_60.230.190.130.260.210.16
Aluminium_70.200.160.120.100.090.04
Aluminium_80.090.070.060.120.110.07
Aluminium_90.090.080.050.100.080.05
Aluminium_100.060.050.040.090.080.04
Table 7. Evaluation metrics for NeRF and photogrammetry results on glass panels [unit: m].
MaterialNeRFPhotogrammetry
STDRMSEMAESTDRMSEMAE
Glass_10.250.200.160.270.210.18
Glass_20.360.230.230.270.210.17
Glass_30.300.240.190.220.170.14
Glass_40.220.180.140.180.140.11
Glass_50.290.220.180.310.240.19
Glass_60.290.230.180.210.160.13
Glass_70.340.260.220.200.150.12
Glass_80.200.170.120.200.160.12
Glass_90.230.190.140.200.150.13
Glass_100.290.230.190.240.180.15
Table 8. The semantic segmentation metrics of PointNet++ and the traditional method.
DatasetMethodOAmAccMullion IoUGlass Panel IoUAluminum Panel
IoU
mIoU
NeRFPointNet++0.7180.7000.6260.4250.7320.594
PhotogrammetryPointNet++0.7360.7450.5690.5850.6990.617
NeRFTraditional method0.5630.6560.2730.4360.5660.425
PhotogrammetryTraditional method0.5330.6430.1550.4900.4320.359
Disclaimer/Publisher’s Note: The statements, opinions and data contained in all publications are solely those of the individual author(s) and contributor(s) and not of MDPI and/or the editor(s). MDPI and/or the editor(s) disclaim responsibility for any injury to people or property resulting from any ideas, methods, instructions or products referred to in the content.