Highlights
What are the main findings?
- A coupled multi-model simulation of land use-distribution under future climate scenarios.
- Identification of the appropriate areas for-the development of different ecosystem services.
What are the implications of the main findings?
- They can be used to establish a prediction-system for the spatial distribution pattern of ecosystem services.
- They can provide a strategic basis for-optimizing the patterns of ecosystem services, which can aid policymakers and-land planners in making informed decisions for sustainable development.
Abstract
Identifying suitable areas for ecosystem services (ES) development is essential for balancing economic growth with environmental sustainability in ecologically fragile regions. However, existing studies often neglect integrating future climate and socioeconomic drivers into ES optimization, hindering the design of robust strategies for sustainable resource management. In this study, we propose a novel framework integrating the System Dynamics (SD) model, the Patch-based Land Use Simulation (PLUS) model, the Integrated Valuation of Ecosystem Services and Trade-offs (InVEST) model, and the Dynamic Bayesian Network (DBN) to optimize ES patterns in the Sanjiangyuan region under three climate scenarios (SSP126, SSP245, and SSP585) from 2030 to 2060. Our results show the following: (1) Ecological land (forest) expanded by 0.86% under SSP126, but declined by 11.54% under SSP585 due to unsustainable land use intensification. (2) SSP126 emerged as the optimal scenario for ES sustainability, increasing carbon storage and sequestration, habitat quality, and water conservation by 3.2%, 1%, and 1.4%, respectively, compared to SSP585. (3) The central part of the Sanjiangyuan region, characterized by gentle topography and adequate rainfall, was identified as a priority zone for ES development. This study provides a transferable framework for aligning ecological conservation with low-carbon transitions in global biodiversity hotspots.
1. Introduction
Ecosystem services (ES) represent the advantages humans obtain from natural systems, including both direct and indirect outputs of ecological processes [1,2]. These services underpin socioeconomic stability by bridging ecological integrity and human well-being. However, climate change, intensified anthropogenic activities, and rapid socioeconomic expansion threaten regional ecosystem health and sustainable development [3,4]. To address these challenges, accurate assessments of ES and spatial pattern optimizations are essential for advancing ecological sustainability goals.
Land use (LU) and land use/cover change (LUCC) significantly influence ES provision by altering natural landscapes. Climate change and socioeconomic development jointly drive these changes, reflecting anthropogenic pressures on ecosystems. Such transformations modify fundamental LU patterns and compromise ecological equilibrium, leading to progressive ES deterioration [5]. In LUCC simulation studies, Logistic-CA [6], ANN-CA [7], CLUE-S [8], CLU-Mondo [9], and FLUS [10] are the most widely used models in land use simulation. They have played significant roles in revealing the trends and mechanisms of LUCC. However, these existing models still have certain limitations in identifying key driving factors, handling the dynamic evolution of multi-category LU, especially in capturing the complex changes in natural land types. In recent years, the Patch Generation Land Use Simulation (PLUS) model has enhanced its simulation capabilities by integrating the random forest algorithm with an adaptive competition mechanism [11,12,13,14]. The System Dynamics (SD) model is widely used for regional land use demand simulation due to its advantages in handling nonlinear and multi-scenario predictions. Therefore, by integrating the advantages of the SD and PLUS models, a more comprehensive methodological support can be provided for the multi-scale and multi-process simulation of LUCC, especially suitable for the study of the evolution of ecosystem service patterns in ecologically sensitive areas such as the Sanjiangyuan region.
Accurate simulation of climate and anthropogenic activity scenarios plays an essential role in predicting future LUCC and its impacts on ES. The Coupled Model Intercomparison Project (CMIP) supports the advancement of global climate modeling by systematically evaluating simulation outputs across participating models. These comparative analyses yield robust datasets that inform research across multiple disciplines [15,16]. CMIP6 introduces innovative scenarios combining Shared Socioeconomic Pathways (SSPs) with Representative Concentration Pathways (RCPs) as the latest phase, featuring enhanced spatial resolution and more sophisticated climate system representations [17,18]. These advancements enable more precise predictions of climatic parameters [19,20]. Against the backdrop of global challenges such as unsustainable development and climate change, understanding ecosystem responses to natural and anthropogenic disturbances becomes critically important [21]. While existing studies have examined ES distributions under various SSP-RCP scenarios [22,23,24], the intrinsic variability of ecosystem variables and the uncertainties that may result from the model structure and parameter estimation are frequently overlooked, which primarily concentrate on how ES change as a result of LU changes under future climatic scenarios. Moreover, scenario-based assessments of ES offers valuable insights, but it alone cannot adequately inform environmental management decisions. Integrating ecological evaluation with spatial optimization strategies strengthens the linkage between ES and practical conservation planning, facilitating more effective ecosystem governance.
A comprehensive evaluation of regional ES and their driving mechanisms is crucial for developing effective ecological governance strategies. As an advanced probabilistic graphical model, Bayesian Networks (BNs) demonstrate exceptional capability in characterizing complex nonlinear relationships among environmental drivers through their probabilistic inference framework. This methodology enables quantitative analysis of variable interactions by establishing conditional probability matrices that capture causal dependencies [25]. Currently, numerous scholars have utilized BNs to explore the correlations between ES and various factors. Furlan gave marine managers and policymakers a scientific foundation by creating a GIS-based BN to evaluate cumulative ecological impacts in the Adriatic Sea under diverse management strategies and climate conditions [26]. Similarly, Sperotto employed a BN to assess hydrological response uncertainties in the Zero River basin, comparing outcomes across contrasting global emission scenarios [27]. Nevertheless, most current studies predominantly employed static methods to analyze interactions between influencing factors and ES, neglecting the dynamic interdependencies among variables [28,29]. The Dynamic Bayesian Network (DBN) framework addresses these limitations in coping with uncertainties in complex systems and elucidates temporal variations in ES responses to diverse climatic conditions through its predictive and diagnostic capabilities. This enables to optimization of ES spatial configurations and supports climate change adaptation strategies for ecosystem conservation.
This study proposed an integrated DBN modeling framework to optimize ES spatial patterns under climate change scenarios, with the Sanjiangyuan region of China serving as a representative case study. The research aims to (1) develop a comprehensive LU simulation system that integrated the PLUS and SD models to predict future LU distributions under different climate scenarios; (2) construct a DBN model to analyze relationships between ES and influencing factors, employing predictive functions to assess ES development levels across scenarios and identify optimal development pathways; and (3) identify the critical factors influencing ES and determine the optimal development regions for the ecological environment using the diagnostic function and sensitivity analysis of a DBN, providing valuable scientific advice for ecosystem management.
2. Materials and Methods
2.1. Research Area
The Sanjiangyuan region between 31°33′–37°08′N and 89°25′–102°26′E, located in the central Tibetan Plateau, encompasses the Yangtze River, the Yellow River and the Lantsang [30,31,32] (Figure 1). This ecologically significant area spans more than 360,000 km2 and exhibits characteristic plateau continental climate conditions, with mean annual temperatures averaging −4.8 °C and precipitation reaching approximately 484.85 mm based on multi-year observations. Geomorphologically, the region displays distinct elevation gradients, sloping from higher western areas to lower eastern zones, with grasslands constituting the predominant LU type. However, recent landscape changes, particularly urban expansion and vegetation degradation, have progressively diminished ES quality, creating substantial environmental challenges for this fragile alpine ecosystem.
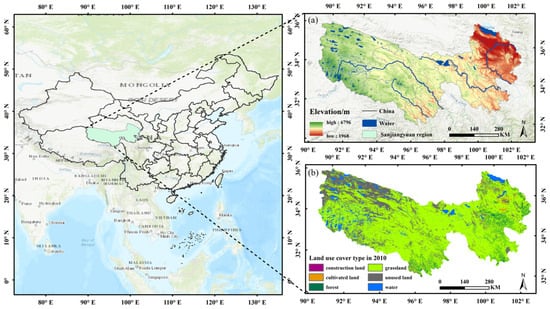
Figure 1.
Geographic location (elevation (a), LU (land use) (b)).
2.2. Data Sources
This study combines multiple models to assess and optimize the ES in the Sanjiangyuan region. A multi-source dataset was gathered to satisfy the needs of various models (Table 1). Along with the data outlined in Table 1, this study additionally collected domestic product (GDP) population density (POP), temperature (TEM), and precipitation (PRE) from CMIP6 under future climate scenarios to examine the effects of future climate impacts on ES. To comply with the national land classification standards and align with the regional ecological environment characteristics and research objectives, this study categorizes the land use in the Sanjiangyuan region into six categories: cultivated land, forest land, grassland, water bodies, construction land, and unused land. In this study, the nearest neighbor method was employed to resample all the data to a spatial resolution of 30 m.

Table 1.
Details of data sources.
2.3. Research Framework
This research introduces a novel methodological framework that synergistically integrates the SD, PLUS, InVEST, and DBN models. The framework leveraged multi-source geospatial data to project LU configurations under various climate scenarios, evaluate historical ES, and determine optimal development pathways using spatial suitability analysis for ES enhancement (Figure 2).
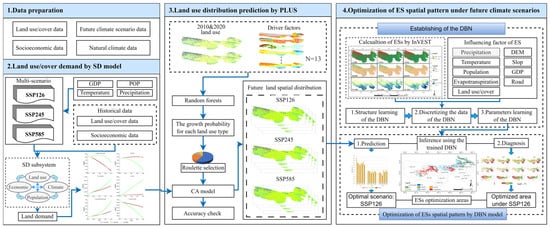
Figure 2.
Structure of this research.
2.4. LU Distribution Simulation
2.4.1. SD Model Construction
SD establishes an effective framework for simulating complex systems with interacting feedback mechanisms. This method quantitatively resolves nonlinear processes and time-varying relationships within such systems. This approach has gained prominence in LUCC simulations due to its capacity to incorporate socioeconomic drivers while maintaining methodological simplicity [33]. The effectiveness of SD in representing complex nonlinear relationships has led to widespread applications in urban system modeling and LUCC analysis.
This study developed an SD model consisting of four interconnected subsystems, which were economic, demographic, climatic, and LU modules used to quantitatively assess how socioeconomic and environmental drivers influence LUCC dynamics [34] (Figure 3). The modeling framework was implemented in Vensim PLE 10.3.0 software, with simulations conducted at a 5-year temporal resolution spanning 2000–2060. The modeling approach consisted of historical calibration and future projection. During the historical calibration phase, we employed SPSS 27.0 to analyze interrelationships among subsystems from 2000 to 2020. Model accuracy was verified through relative error analysis comparing simulated and observed 2020 LU data. For future projections, the calibrated SD model incorporated scenario-specific parameters to predict LU demands under different climate scenarios.
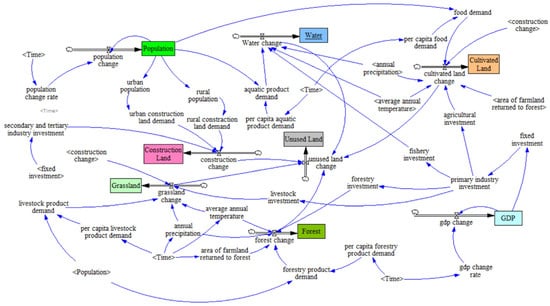
Figure 3.
The SD (System Dynamics) model used to predict the quantitative causal relationship of LUCC (land use/cover change).
2.4.2. PLUS Model Construction
The PLUS model integrates a Cellular Automata (CA) framework enhanced with multi-category stochastic patch generation capabilities and a rule-extraction component implementing the Land Expansion Analysis Strategy (LEAS) [22,35,36]. This integrated approach utilizes adaptive inertia mechanisms and probabilistic selection algorithms within the CA framework to effectively simulate the spatiotemporal dynamics of LU patch transformations under development probability constraints. Meanwhile, LEAS utilizes a dual-decision random forest algorithm to quantitatively analyze expansion patterns across LU categories and assess driving factor impacts on LUCC. The expansion probability is calculated as follows:
where m is either 0 or 1 and the expansion probability of LU type j at spatial unit i is represented by in the formula. Other LU types are converted to LU type j if m = 1 and no conversion to LU type j is indicated if m = 0. is the expected LU type for vector v in decision tree n. M is the ensemble size of decision trees. i is the decision indicator function of the tree and v is the vector of driving factors.
LU expansion trends were analyzed using 2010–2020 LU datasets, with the LEAS model incorporating 13 natural and socioeconomic drivers to calculate the development probabilities for each LU category. A CA framework was then employed to generate the simulated 2020 LU distributions. Model validation involved comparing these simulations with observed 2020 LU patterns, yielding Kappa coefficients >0.8 in confusion matrix analyses, thereby confirming the predictive reliability of the PLUS model [37,38]. After validating the model’s performance, this study integrated the quantitative outputs from the SD approach with the spatial distribution algorithms of the PLUS model to produce LU projections across different climate scenarios.
2.5. ES Assessment
ES constitute fundamental support systems for human survival and sustainable development. Focusing on the Sanjiangyuan Region, a critical ecological zone characterized by unique environmental and socioeconomic conditions, this study systematically evaluated carbon storage and sequestration (CS), habitat quality (HQ), and water yield (WY), utilizing the InVEST model with multi-source geospatial dataset. Hydrological adjustments were then implemented to calculate final water conservation (WC) estimates. Complete methodological details are available in the Supplementary Material.
2.6. Optimizing the Spatial Pattern of ES
2.6.1. DBN Construction
BN represents a class of probabilistic graphical models that integrates a Directed Acyclic Graph (DAG) and a Conditional Probability Table (CPT). BN excels at modeling static probabilistic relationships through their intuitive graphical representation and efficient computation [39]. However, these frameworks lack inherent capacity for temporal dynamics modeling. DBN addresses this limitation by linking sequential BN via temporal edges, enabling time-series analysis [40]. The mathematical foundation of DBN relies on Bayesian probability theory, which can be represented by the following joint probability distribution formulation [41,42]:
where denotes the i-th node at time t (t = 1, 2, …, N). represents its parent nodes. T is simulation periods or time steps.
DBN was constructed using Netica 6.0 software, which required both structural and parametric learning. The network architecture was constructed by integrating established causal linkages between ES and their driving factors, incorporating insights from domain experts and the existing literature. Structural learning identified dependencies among nodes, while parametric learning quantified their conditional relationships [43,44]. ES are shaped by a combination of environmental, socioeconomic, and LU characteristics. The geographical and climatic conditions constitute key environmental determinants, whereas regional development levels represent important socioeconomic drivers. Consequently, we took CS, HQ, and WC as sub-nodes, and selected DEM, slope, precipitation, temperature, LU, potential evapotranspiration, road distance (to_roads), and GDP as parent nodes (Figure 4). The geometric interval method was employed to discretize the data above into three states: Low (L), Moderate (M), and High (H). The discretized states and their corresponding thresholds are detailed in Table S5. A total of 42,931 points data were uniformly generated across the study area. Using spatial overlay, the information at each node for both 2010 and 2020 was extracted. In total, 80% of the data were randomly selected as the training set, which was used to train the established DBN and fill the CPT. The remaining 20% of the data was used as the test set to verify the performance of the DBN.
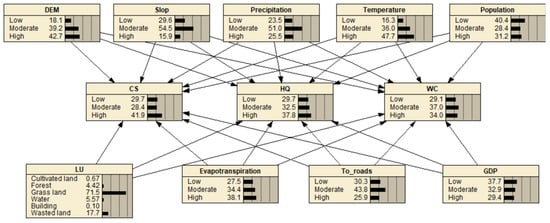
Figure 4.
The constructed DBN (Dynamic Bayesian Network) structure.
2.6.2. DBN Testing and Sensitivity Analysis
Following the establishment of the DBN, the model must undergo rigorous testing and sensitivity analysis to assess its predictive performance and determine influential variables. The predictive accuracy of the DBN was evaluated using the error rate, quadratic loss (QL), and spherical payoff (SP) derived from the state probability predictions for each test sample. The error rate spans 0–100%, while QL ranges from 0 to 2, with both metrics approaching 0, indicating optimal DBN performance. Conversely, the SP is bounded between 0 and 1, where proximity to 1 signifies higher predictive precision [45]. The QL and SP are computed using the following mathematical formulations:
In the equation, represents the predicted likelihood of the correct state for the target node in sample i; denotes the forecasting likelihood of state j for the target node in sample i; n is the number of samples in the test set; and m corresponds to the total number of the target node states.
Sensitivity analysis is a fundamental mathematical method for measuring the influence of the model parameters on target variables [46], providing a robust framework for performance evaluation. In the DBN, we identified the key variables influencing the target node based on sensitivity analysis. Sensitivity analysis in Netica is performed using the variance of belief (VB) metric, which quantifies the relative influence of network nodes through variance reduction. The analysis prioritized variables exhibiting elevated VB metrics as key determinants for each ES node. A VB value of more than 0.1% signifies that the node significantly affects the target node. One way to determine the VB value is as follows [47,48]:
where S is the target variable, I is another known variable, and s represents the states of S. V(S) denotes the variance of S, and stands for the variance of S given the condition of variable I.
2.6.3. DBN Prediction and Diagnostic Analysis of ES
The DBN prediction leverages probabilistic inference algorithms to derive the posterior distributions of the target variables from the observed driver variables. Using LU data and other environmental drivers as inputs, we projected the probability distributions of ES in the Sanjiangyuan region under three climate scenarios from 2030 to 2060 at decadal intervals. To assess the comparative advantages of ES across different climate scenarios, we quantified ES development levels and trends using the probability of the High state category. Therefore, the optimal development scenario for ES can be identified by probability, with higher-probability values corresponding to superior development levels.
DBN diagnosis is a reverse inference process based on probabilistic reasoning, deducing causes from outcomes. This study identifies the main states of critical variables that are crucial for influencing the status of each ES through the diagnostic function. The optimal zones for ES development emerged where critical environmental variables simultaneously reach their most favorable states. Spatial analysis identified these priority areas by overlaying the optimal conditions of key determinants influencing each ES category. We identified several essential variables for each ES using sensitivity analysis. These variables were then analyzed using DBN inference with CS, HQ, and WC states as observational evidence. The analysis computed posterior probability distributions for each key variable and determined their critical states based on maximum probability values. We performed spatial overlay analysis to integrate areas exhibiting high levels of CS, HQ, and WC, thereby identifying optimal ES distribution patterns across the Sanjiangyuan region.
3. Results
3.1. LU Area Estimation Using the SD Model
Validation of the SD model (Table 2) revealed distinct accuracy variations across LU categories, with water achieving the highest precision (0.0012% error) and unused lands displaying the greatest deviation (0.84% error) among the six classified types. The SD model demonstrated high predictive accuracy for LU in the Sanjiangyuan region, with all simulation errors remaining below 1% when compared to actual data. These results substantiate the robustness of the model in projecting LU dynamics across the study region, demonstrating its suitability for scenario predictions.
Table 2.
Test results of simulation accuracy of SD.
The overall trends of various land demand changes were roughly the same under different scenarios, but the change rates were various (Figure 5). The characteristics of the climate scenarios significantly influenced the evolution trends in LU with grassland, construction land, and water areas increasing across three scenarios. The SSP585 scenario showed the most substantial growth (38,968 km2, 2976.8 km2, and 24,424.1 km2, respectively), while SSP245 exhibited the smallest increments (20,946 km2, 963.9 km2, and 1184.4 km2, respectively). Cultivated and forest lands exhibited distinct change patterns across different scenarios. Under SSP585, cultivated land showed minimal degradation (381.3 km2), while forest decreased substantially (1880 km2). Conversely, SSP245 and SSP126 scenarios demonstrated rapid cultivated land reduction (924.4 km2 and 951.5 km2, respectively) accompanied by modest forest expansion (217.2 km2 and 182.7 km2, respectively). Unused land exhibited consistent declines across all climate scenarios, with the most substantial reduction (64,107.8 km2) under SSP585. The SSP245 and SSP126 scenarios showed comparable decreases of 22,386.8 km2 and 24,459.1 km2, respectively. These results demonstrate that the SSP585 scenario induced markedly more severe land degradation compared to both the SSP245 and SSP126 scenarios.
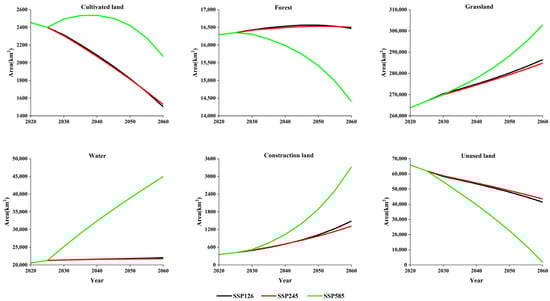
Figure 5.
Predicted areas of different LU (land use) types.
3.2. LU Distribution Simulation Based on the PLUS Model
The model validation results demonstrate high agreement between the simulated and observed 2020 LU data, achieving 95.40% overall accuracy and a Kappa coefficient of 0.90. These metrics confirm that coupling the SD model and the PLUS model accurately reproduce LU spatial patterns in the Sanjiangyuan Region.
To analyze the spatiotemporal dynamics of LUCC across various scenarios, we focused on two characteristic landscapes within the Sanjiangyuan Region. The region on the left encompasses the area centered around the grassland cluster in Zhidoi County, while the region on the right comprises the area centered around the unused land cluster in Guinan County (Figure 6). Under the SSP126 scenario, significant land conversion occurred from unused land to grassland, accompanied by the limited transformation of grassland to forest and water. This transition pattern effectively maintained ecological integrity by building upon existing conservation areas. The SSP245 scenario exhibited similar transformation patterns for unused land and grassland, as observed under SSP126. Forest and water demonstrated remarkable stability, indicating successful conservation outcomes. However, localized LU conversions were evident, particularly in Guinan County, where marginal grassland areas were reclaimed for agricultural use. The SSP585 scenario exhibited substantial ecological land conversion, with urban development leading to notable declines in cultivated land, forest, and unused land. This transformation process also involved partial forest degradation to grassland across the study region.
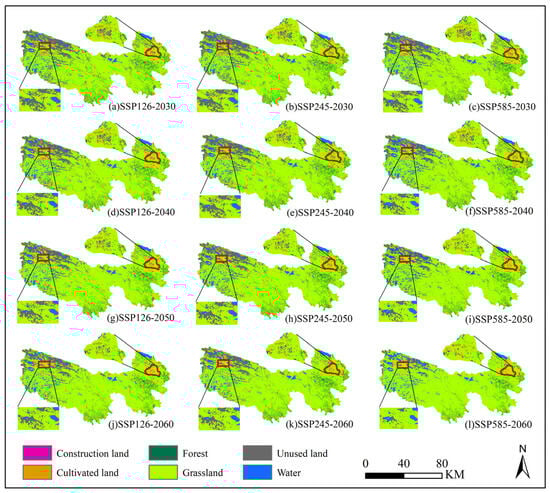
Figure 6.
LUCC under various scenarios.
3.3. Optimizing Spatial Pattern of ES with the DBN Model
3.3.1. DBN Validation and Sensitivity Analysis Evaluation
The validation outcomes shown in Table 3 confirmed that the DBN model demonstrated robust capability in generating probabilistic predictions of ES states across various future scenarios. The DBN displayed varying predictive capabilities across the three ES. CS predictions showed the highest accuracy, with a minimal error rate of 0.1863%, low QL of 0.02439, and excellent SP of 0.991. The model achieved moderate predictive performance for HQ. WC yielded comparatively less accurate results, presenting a higher error rate of 22.61%, increased QL of 0.3068, and reduced SP of 0.8277. The DBN model appeared to the intricate relationships between multiple factors and ES, as evidenced by the SP for all three ES above 0.8 and the statistically substantial reliability of the probabilistic inference results.
Table 3.
DBN model testing results.
Sensitivity analysis of the DBN (Figure 7) revealed that climatic and topographic factors exerted substantial influence on CS, HQ, and WC. CS demonstrated the highest sensitivity among these services, with VB values reaching 1.7364% for slope, 1.0185% for precipitation, 0.19% for temperature, and 0.1391% for DEM. HQ had a high sensitivity to DEM, slope, precipitation, and LU, with VB values achieving 1.7201%, 0.9872%, 0.6854%, and 0.0758%, respectively. Slope, DEM, precipitation, and temperature were the primary determinants affecting WC, with VB values being 1.2117%, 1.0489%, 0.8247%, and 0.8213%, respectively.
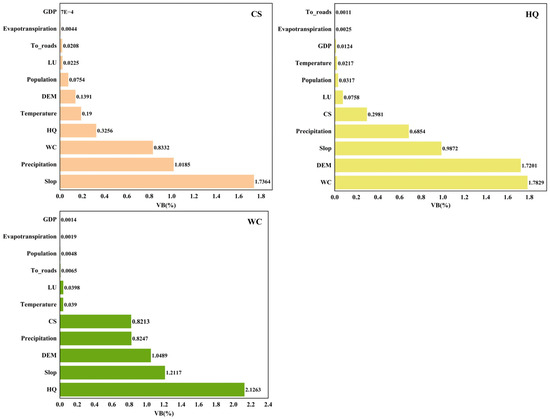
Figure 7.
Sensitivity analysis.
Our results reveal important interactions between different ES beyond their responses to environmental factors. The analysis shows that CS affected both WC and HQ, with influence levels of 0.8332% and 0.3256%, respectively. HQ, in turn, impacted WC and CS, showing influence values of 1.7829% and 0.2981%. Most importantly, WC appeared to be the most sensitive to changes in both HQ and CS, with the highest influence values observed at 2.1263% and 0.8213%, respectively. These findings demonstrate that ES were interconnected, with WC being particularly responsive to changes in other services.
3.3.2. Determination of the Optimal Development Scenario for ES
Projections revealed significant disparities in ES across the three scenarios in the Sanjiangyuan Region (Figure 8). The SSP126 scenario yielded the most favorable ES outcomes, followed by SSP245, while SSP585 resulted in the least favorable performance. Under SSP126, ES exhibited a nonlinear trend, characterized by an initial decline followed by partial recovery, although 2060 levels remained below baseline values. In contrast, ES changes under SSP245 and SSP585 were relatively stable over time. However, by 2060, CS and HQ declined across these scenarios, whereas WC improved. Overall, SSP126 emerged as the optimal scenario for sustainable ES development, balancing ecological conservation with socioeconomic progress.
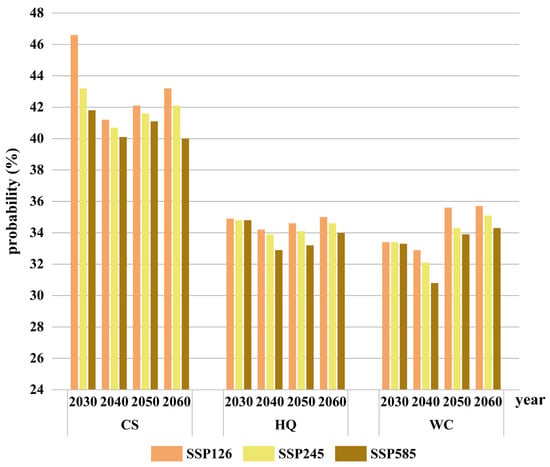
Figure 8.
Prediction results of the DBN.
3.3.3. Spatial Optimization of ES Under the Preferred Scenario
Important variables and their crucial states had an impact on the states of various ES (Table 4). Regions exhibiting high CS capacity predominantly occurred in central and northeastern areas characterized by moderate slopes, sufficient precipitation, and relatively warm temperatures. These optimal conditions for CS were particularly evident in several representative locations: the southwestern sector of Qumarleb County, the central zones of both Zhidoi County and Maduo County, eastern Xinghai County, and northwestern Tongde County. Grassland and forest constituted the dominant land cover types across these high CS zones. The spatial distribution of high HQ and optimal WC showed remarkable consistency across the Sanjiangyuan Region. These ES were predominantly distributed in the central high-altitude areas characterized by steep terrain and abundant rainfall. The most stable concentrations appeared in Qumarleb and Maduo Counties, with observable expansion into surrounding areas. Alpine grassland was the dominant land cover type in these regions, providing essential support for both HQ and WC functions. Suboptimal conditions for CS and HQ development in the western, central, and southern sectors of the study region were characterized by lower precipitation levels, higher temperatures, and steeper topographic gradients. Grassland represented the predominant land cover classification throughout these regions. Areas exhibiting low and moderate suitability for WC development predominantly occurred in the western Sanjiangyuan Region, where extreme elevation, steep slopes, and substantial precipitation prevailed. These suboptimal zones primarily consisted of water and unused land.
Table 4.
Key variables and key states of different states of ES.
The suitable development areas for different ES from 2030 to 2060 demonstrated distinct spatiotemporal variation patterns (Figure 9). These variations resulted from temporal changes in the spatial distribution of key environmental variables including elevation, slope, precipitation, and temperature. CS experienced an initial reduction followed by recovery in low-suitability zones, yet failed to regain its 2030 extent, contrasting with medium- and high-suitability zones, which demonstrated inverse trends culminating in greater coverage than their 2030 levels. HQ manifested a decline rebound dynamic in both low- and medium-suitability regions, finishing marginally below initial measurements, while high-suitability regions developed through more intricate spatial processes to achieve net expansion. WC witnessed expansion and then contraction in low-suitability areas which exceeded 2030 levels, a marked decline in medium-suitability areas, and complex but ultimately increased patterns in high-suitability areas compared to 2030.
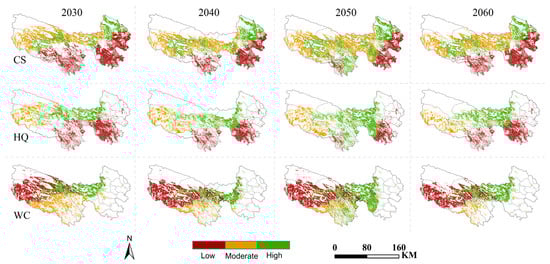
Figure 9.
Appropriate ES development areas in the SSP126 context (Note: CS, Carbon storage and sequestration; HQ, Habitat quality; WC, Water conservation).
The optimization analysis revealed significant spatial overlap among regions exhibiting high-level performance across multiple ES (Figure 10). These overlapping zones included areas where CS and HQ co-occurred at optimal levels, CS and WC jointly reached peak performance, HQ and WC simultaneously achieved high states, and all three ES collectively attained maximum development. Notably, the co-optimized areas for CS and HQ coincided precisely with those for CS and WC, as well as the tripartite optimization zones encompassing CS, HQ, and WC. These regions possessed optimal environmental characteristics and LU patterns that supported the integrated development of multiple ES. River confluence zones with gentle slopes, abundant rainfall, and moderate temperatures provided particularly favorable conditions for enhancing all three ES simultaneously. The most productive areas were located in specific geographic locations: western Qumarleb County, western Xinghai County, eastern Golmud City, central Maduo County, and central Zhidoi County.
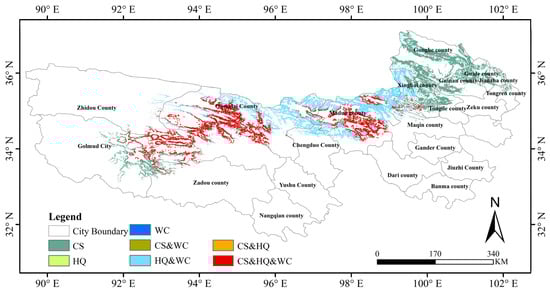
Figure 10.
Optimized areas of ES in 2030 (Note: CS, Carbon storage and sequestration; HQ, Habitat quality; WC, Water conservation).
4. Discussion
4.1. LUCC and ES Pattern Optimization Under Future Climate Scenarios
This study investigates the LU evolution dynamics and ES pattern optimization under SSPs and RCPs, revealing that LUCC profoundly influence ES functions. In line with the findings from prior studies, this study shows that the primary features of LUCC in the Sanjiangyuan region under various scenarios displayed an increase in water and construction, as well as a decrease in unused land [49]. All three SSP-RCP scenarios demonstrated analogous dynamics among six LU categories, marked by grassland expansion [50] and cultivated land reduction. Notably, SSP585 shows the least pronounced cultivated land loss due to intensified precipitation and temperature-driven runoff variations that counteract agricultural contraction [51], resulting in maximal cropland retention. LU patterns exhibit substantial spatial heterogeneity under various scenarios. Expanding ecological land is encouraged by slower economic development and stable climatic conditions [52,53]. This trend is particularly evident under the SSP126 scenario, where localized conservation policies, such as the integrated protection of mountain–river–forest–farmland–lake–grassland–desert systems, effectively maintain ecological integrity while minimizing non-ecological land. Conversely, the LU succession characteristics in the SSP585 scenario contrast with the other scenarios. Due to the increase in socioeconomic demands, non-ecological land dominated by construction land has been continuously expanding, resulting in the gradual degradation of ecological land represented by forest land [54]. SSP245 displays intermediate trends, reflecting its moderate socioeconomic intensity. These findings are consistent with previous research, indicating that larger scenario values correspond to more significant socioeconomic impacts, resulting in reduced ecological land [55].
The DBN sensitivity analysis results indicate that the three ES are not only interrelated, but also exhibit certain trade-offs or synergies, influencing their respective dynamic change processes. This complexity of interactions further underscores the necessity of comprehensively considering multiple factors in ES assessments to achieve more holistic and accurate predictions. The DBN diagnostic results suggest that SSP126 is the optimal scenario for developing ES [49,54,56], with the highest level of ES development under this scenario. This indicates that SSP126 provides the most favorable conditions for ES development over the coming decades, offering greater potential and advantages for ES.
Although this study uses the Sanjiangyuan region as a case study, the proposed multi-model coupling framework and multi-scenario analysis paradigm can provide valuable methodological insights and practical references for other ecologically vulnerable regions worldwide. These approaches are also applicable to other sensitive areas facing dual pressures from climate change and human activities, such as alpine meadow zones, arid watersheds, and coastal ecological barriers. Furthermore, the mechanisms of ecological land change and the principles of suitability zoning identified in this study may serve as a scientific foundation for adaptive land management and ecological restoration under diverse development pathways in similar regions.
4.2. Future Ecological Conservation Recommendations Based on ES Pattern Optimization
As a typical representative of inland ecological conservation areas in China, the Sanjiangyuan region serves as a vital barrier to ecological security in China and a sensitive zone for global climate change. During the process of economic growth, preventing the degradation of its ES has become a pressing issue that requires urgent resolution. Targeted and effective ES management in specific areas can maximize the benefits of regional ES.
To optimize ecological management in the Sanjiangyuan region, we classify areas into three protection categories based on ES potential: priority conservation zone, priority regulation zone, and key remediation zone. The priority conservation zone, exhibiting optimal ES development potential with superior ecological quality, benefits from favorable climatic and topographic conditions. These regions require stringent protection policies to prevent resource overuse and preserve vital grassland and forest ecosystems [57,58]. On the other hand, the advantageous natural and geographical conditions should be fully leveraged to optimize water resource management. The priority regulation zone encompasses areas with a moderate suitability development state where ecological restoration and sustainable development should be established as core objectives [59]. Efforts in this region should focus on the comprehensive recovery of ecosystems, strengthening the construction and protection of oasis ecological barriers, and establishing a robust ecological protection and management system [60,61]. Concurrently, the industrial structure should be scientifically optimized based on the regional water’s resource-carrying capacity, promoting the development and advancement of a green economy [62]. This approach aims to achieve efficient resource utilization and maximize ecological benefits, ensuring an organic integration of economic growth and ecological restoration, thereby contributing to the sustained improvement of regional ecological environmental quality [63]. A key remediation zone with a low suitability development state, characterized by high terrain, harsh climatic conditions, extremely low vegetation cover, and fragile ecological foundations, poses significant restoration challenges [64,65]. For this zone, priority should be given to strengthening ecological risk prevention mechanisms and establishing an early warning and response system to reduce the likelihood of further ecosystem degradation. Simultaneously, through scientific planning and phased implementation, vegetation cover should be gradually restored and soil conservation measures should be employed to improve soil conditions, creating an environment supportive of the natural resilience of the ecosystem.
4.3. Uncertainty Analysis and Research Prospects
This research developed an integrated modeling framework combining the SD model, PLUS model, InVEST model, and DBN model to simulate CS, HQ, and WC to explore the optimal development pattern of ES in the Sanjiangyuan region under different scenarios. The framework offers a methodological foundation for enhancing the overall quality of ES while providing new insights for optimizing ES patterns in other regions. However, the findings of this investigation are subject to certain uncertainties and limitations.
Firstly, the SD model effectively simulated land use demand and change by establishing mathematical relationships among four subsystems, as indicated by its extremely low error rates. However, this high accuracy may be partially attributed to the high adaptability of the model structure and parameter settings to historical data, a phenomenon that suggests the potential for overfitting or subjective intervention. Although the present study attempts to mitigate the dependence on a single developmental pathway through the implementation of multiple scenarios, future work should introduce participatory scenario construction and machine learning-assisted parameter optimization in order to enhance model transparency and robustness, thereby improving the identification and control of uncertainties arising from subjective factors. Additionally, the SD model still exhibits limitations in quantitatively representing complex external factors such as regional policies and cultural influences. Future studies could explore the integration of policy scenario parameters or hybrid qualitative–quantitative modeling approaches to enhance the model’s responsiveness to non-economic driving forces [66].
Secondly, the PLUS model demonstrated outstanding performance in high-resolution spatial simulation. Nevertheless, its reliance on fixed transition rules limited its ability to reflect the dynamic adaptability of land use decision-making over time. Subsequent research would benefit from the introduction of time-varying parameters or integration with machine learning methods to dynamically optimize these rules, thereby enhancing the model’s capacity to capture long-term evolutionary processes [12].
Furthermore, the InVEST model was widely applied in the spatial representation and scenario simulation of ES. However, at regional scales, its comprehensive assessment of synergistic effects from natural, climatic, and anthropogenic factors proved to be insufficient. Future efforts should focus on incorporating multi-source data and cross-scale coupled modeling methods to improve its applicability across diverse ecological contexts.
Lastly, although DBN showed considerable potential in the dynamic prediction of ecosystem services, its application was still constrained by data quality, computational efficiency, and model assumptions. Addressing these limitations will require advances in high-resolution remote sensing data fusion, uncertainty propagation modeling, and algorithm optimization. In subsequent research, we will aim to conduct in-depth explorations in these directions, with the goal of enhancing the comprehensive simulation and predictive capability of the model system.
In addition to model uncertainties, the parameters of future climate scenarios also exhibit certain limitations. This study explores the ES patterns under three commonly applied and typical SSP-RCP scenarios. However, the GDP, population, temperature, and precipitation data under different climate scenarios are constrained by spatial scale limitations, making them more appropriate for extensive research. Future research ought to assimilate refined climate scenario parameters to enhance the reliability of assessing the spatial patterns of ES. Furthermore, data resampling may introduce a certain degree of uncertainty into the results. Given the current limitations of the data sources, it is difficult to accurately assess the impact of these auxiliary resampling processes. Future research should aim to enhance the evaluation of this aspect.
5. Conclusions
This research establishes a novel modeling framework by combining the SD model, PLUS model, InVEST model, and DBN model. Utilizing future climate projections alongside LU and environmental datasets, we evaluated three critical ES in the Sanjiangyuan region. The proposed framework enables systematic optimization of ES spatial patterns. Key findings include the following:
- (1)
- The SD model predicted the LU quantity under SSP126, SSP245, and SSP585, with a maximum relative error of about 0.84%. Notably, cultivated land and unused land experienced substantial declines, whereas construction land, water, and grassland expanded markedly between 2030 and 2060 under the three climate scenarios. Forest exhibited scenario-dependent variations, reflecting the unique socioeconomic and climatic drivers associated with each scenario.
- (2)
- The PLUS model demonstrated strong performance in simulating LU patterns, achieving 95.40% overall accuracy and a Kappa coefficient of 0.90. Under the SSP126 scenario, ecological land expanded widely. In contrast, the SSP245 scenario exhibited minimal ecological land transitions but maintained stable conservation outcomes. The SSP585 scenario displayed pronounced construction land expansion, degrading ecological land integrity.
- (3)
- The DBN model demonstrated that the SSP126 scenario was the best development scenario. The central part of the Sanjiangyuan Region, with a moderate slope, abundant precipitation, and high temperature, was the most favorable area for the development of the three ES.
Supplementary Materials
The following supporting information can be downloaded at: https://www.mdpi.com/article/10.3390/rs17193357/s1, Figure S1: Trends in habitat quality index over time; Figure S2: Spatial distribution and succession of ES (ecosystem services); Figure S3: LUCC (land use/cover change) under various scenarios; Table S1: Main equations of SD model; Table S2: The neighborhood weights of each land type and the conversion cost matrix under different scenarios; Table S3: Prediction results of SD model on LU demand under different scenarios (km2); Table S4: Input parameters of habitat quality model; Table S5: Variable parameterization and state setting; Table S6: The result of DBN sensitivity analysis [67,68,69,70].
Author Contributions
Q.C., H.L., Z.W. and J.C.: Conceptualization. J.C., Q.C. and X.L.: data curation. H.L., X.L. and Q.C.: formal analysis. Z.W., Q.C. and X.H.: methodology. X.H., X.C., H.Y. and X.L.: supervision. J.Y., X.C., Q.H. and J.C.: validation. Q.C., J.L., Y.W. and H.Y.: writing—original draft preparation. Q.C., J.L., Q.H., Y.W. and J.Y.: writing—review and editing. All authors have read and agreed to the published version of the manuscript.
Funding
This study is supported by grants from the National Natural Science Foundation of China (42361023), Natural Science Foundation of Guangxi Province (2024GXNSFAA010268), the Guangxi Science and Technology Base and Talent Project (GuikeAD22035158), Guangxi Key Laboratory of Spatial Information and Geomatics under Grant (21-238-21-31), and Open Research Fund Program of Key Laboratory of Metallogenic Prediction of Nonferrous Metals and Geological Environment Monitoring (Central South University), Ministry of Education (2023YSJS05).
Data Availability Statement
Data is contained within the article.
Acknowledgments
The authors sincerely thank the editors and the anonymous reviewers for their constructive feedback and valuable suggestions, which have greatly contributed to the improvement of this manuscript.
Conflicts of Interest
The authors declare no conflicts of interest. The data presented in this study are not available due to privacy restrictions, but are available from the corresponding author on reasonable request.
References
- Costanza, R.; d’Arge, R.; De Groot, R.; Farber, S.; Grasso, M.; Hannon, B.; Limburg, K.; Naeem, S.; O’neill, R.V.; Paruelo, J. The value of the world’s ecosystem services and natural capital. Ecol. Econ. 1997, 387, 253–260. [Google Scholar] [CrossRef]
- Li, H.; Chen, J.; Ling, M.; Chen, Z.; Lan, Y.; Huang, Q.; Li, X.; You, H.; Wang, F.; Han, X.; et al. A framework for dynamic assessment of soil erosion and detection of driving factors in alpine grassland ecosystems using the RUSLE-InVEST (SDR) model and Geodetector: A case study of the source region of the Yellow River. Ecol. Inform. 2025, 85, 102928. [Google Scholar] [CrossRef]
- Fulford, R.; Russell, M.; Myers, M.; Malish, M.; Delmaine, A. Models help set ecosystem service baselines for restoration assessment. J. Environ. Manag. 2022, 317, 115411. [Google Scholar] [CrossRef] [PubMed]
- Luo, P.; Mu, Y.; Wang, S.; Zhu, W.; Mishra, B.K.; Huo, A.; Zhou, M.; Lyu, J.; Hu, M.; Duan, W.; et al. Exploring sustainable solutions for the water environment in Chinese and Southeast Asian cities. Ambio 2022, 51, 1199–1218. [Google Scholar] [CrossRef] [PubMed]
- Lan, Y.; Zhang, K.; Han, X.; Chen, Z.; Ling, M.; You, H.; Chen, J. The Spatiotemporal Variation in Biodiversity and Its Response to Different Future Development Scenarios: A Case Study of Guilin as an Internationally Renowned Tourist Destination in China. Appl. Sci. 2024, 14, 2101. [Google Scholar] [CrossRef]
- Zhao, X.; Ma, X.; Chen, B.; Shang, Y.; Song, M. Challenges toward carbon neutrality in China: Strategies and countermeasures. Resour. Conserv. Recycl. 2022, 176, 105959. [Google Scholar] [CrossRef]
- Yang, X.; Chen, R.; Zheng, X.Q. Simulating land use change by integrating ANN-CA model and landscape pattern indices. Geomat. Nat. Hazards Risk 2015, 7, 918–932. [Google Scholar] [CrossRef]
- Luo, G.; Yin, C.; Chen, X.; Xu, W.; Lu, L. Combining system dynamic model and CLUE-S model to improve land use scenario analyses at regional scale: A case study of Sangong watershed in Xinjiang, China. Ecol. Complex. 2010, 7, 198–207. [Google Scholar] [CrossRef]
- Zhu, G.; Qiu, D.; Zhang, Z.; Sang, L.; Liu, Y.; Wang, L.; Zhao, K.; Ma, H.; Xu, Y.; Wan, Q. Land-use changes lead to a decrease in carbon storage in arid region, China. Ecol. Indic. 2021, 127, 107770. [Google Scholar] [CrossRef]
- Ding, Q.; Chen, Y.; Bu, L.; Ye, Y. Multi-Scenario Analysis of Habitat Quality in the Yellow River Delta by Coupling FLUS with InVEST Model. Int. J. Environ. Res. Public Health 2021, 18, 2389. [Google Scholar] [CrossRef]
- CAO, Q.-w.; GU, C.-l.; GUAN, W.-h. China’s urbanization SD modelling and simulation based on land use. J. Nat. Resour. 2021, 36, 1062–1084. [Google Scholar] [CrossRef]
- Liang, X.; Guan, Q.; Clarke, K.C.; Liu, S.; Wang, B.; Yao, Y. Understanding the drivers of sustainable land expansion using a patch-generating land use simulation (PLUS) model: A case study in Wuhan, China. Comput. Environ. Urban Syst. 2021, 85, 101569. [Google Scholar] [CrossRef]
- Liang, X.; Liu, X.; Li, D.; Zhao, H.; Chen, G. Urban growth simulation by incorporating planning policies into a CA-based future land-use simulation model. Int. J. Geogr. Inf. Sci. 2018, 32, 2294–2316. [Google Scholar] [CrossRef]
- Zhai, H.; Lv, C.; Liu, W.; Yang, C.; Fan, D.; Wang, Z.; Guan, Q. Understanding Spatio-Temporal Patterns of Land Use/Land Cover Change under Urbanization in Wuhan, China, 2000–2019. Remote Sens. 2021, 13, 3331. [Google Scholar] [CrossRef]
- Guo, X.; Huang, J.; Luo, Y.; Zhao, Z.; Xu, Y. Projection of heat waves over China for eight different global warming targets using 12 CMIP5 models. Theor. Appl. Climatol. 2017, 128, 507–522. [Google Scholar] [CrossRef]
- Xiaochen, C.; Ying, X.; Chonghai, X.; Yao, Y. Assessment of precipitation simulations in China by CMIP5 multi-models. Adv. Clim. Change Res. 2014, 10, 217. [Google Scholar] [CrossRef]
- Eyring, V.; Cox, P.M.; Flato, G.M.; Gleckler, P.J.; Abramowitz, G.; Caldwell, P.; Collins, W.D.; Gier, B.K.; Hall, A.D.; Hoffman, F.M. Taking climate model evaluation to the next level. Nat. Clim. Change 2019, 9, 102–110. [Google Scholar] [CrossRef]
- ZHANG, L.-X.; Xiao-Long, C.; Xiao-Ge, X. Short commentary on CMIP6 scenario model intercomparison project (ScenarioMIP). Adv. Clim. Change Res. 2019, 15, 519. [Google Scholar] [CrossRef]
- LUO, N.; GUO, Y.; GAO, Z.; CHEN, K.; CHOU, J. Assessment of CMIP6 and CMIP5 model performance for extreme temperature in China. Atmos. Ocean. Sci. Lett. 2020, 13, 589–597. [Google Scholar] [CrossRef]
- Yang, X.; Zhou, B.; Xu, Y.; Han, Z. CMIP6 Evaluation and Projection of Temperature and Precipitation over China. Adv. Atmos. Sci. 2021, 38, 817–830. [Google Scholar] [CrossRef]
- Behboudian, M.; Anamaghi, S.; Mahjouri, N.; Kerachian, R. Enhancing the resilience of ecosystem services under extreme events in socio-hydrological systems: A spatio-temporal analysis. J. Clean. Prod. 2023, 397, 136437. [Google Scholar] [CrossRef]
- Li, C.; Wu, Y.; Gao, B.; Zheng, K.; Wu, Y.; Li, C. Multi-scenario simulation of ecosystem service value for optimization of land use in the Sichuan-Yunnan ecological barrier, China. Ecol. Indic. 2021, 132, 108328. [Google Scholar] [CrossRef]
- Martinez-Harms, M.J.; Bryan, B.A.; Figueroa, E.; Pliscoff, P.; Runting, R.K.; Wilson, K.A. Scenarios for land use and ecosystem services under global change. Ecosyst. Serv. 2017, 25, 56–68. [Google Scholar] [CrossRef]
- Wen, X.; Theau, J. Spatiotemporal analysis of water-related ecosystem services under ecological restoration scenarios: A case study in northern Shaanxi, China. Sci. Total Environ. 2020, 720, 137477. [Google Scholar] [CrossRef] [PubMed]
- Chen, J.; Zhong, P.-A.; An, R.; Zhu, F.; Xu, B. Risk analysis for real-time flood control operation of a multi-reservoir system using a dynamic Bayesian network. Environ. Model. Softw. 2019, 111, 409–420. [Google Scholar] [CrossRef]
- Furlan, E.; Slanzi, D.; Torresan, S.; Critto, A.; Marcomini, A. Multi-scenario analysis in the Adriatic Sea: A GIS-based Bayesian network to support maritime spatial planning. Sci. Total Environ. 2020, 703, 134972. [Google Scholar] [CrossRef] [PubMed]
- Sperotto, A.; Molina, J.L.; Torresan, S.; Critto, A.; Pulido-Velazquez, M.; Marcomini, A. Water quality sustainability evaluation under uncertainty: A multi-scenario analysis based on Bayesian networks. Sustainability 2019, 11, 4764. [Google Scholar] [CrossRef]
- Chang, J.; Bai, Y.; Xue, J.; Gong, L.; Zeng, F.; Sun, H.; Hu, Y.; Huang, H.; Ma, Y. Dynamic Bayesian networks with application in environmental modeling and management: A review. Environ. Model. Softw. 2023, 170, 105835. [Google Scholar] [CrossRef]
- Zinetullina, A.; Yang, M.; Khakzad, N.; Golman, B.; Li, X. Quantitative resilience assessment of chemical process systems using functional resonance analysis method and Dynamic Bayesian network. Reliab. Eng. Syst. Saf. 2021, 205, 107232. [Google Scholar] [CrossRef]
- Huang, Q.; Chen, J.; Li, X.; Li, H.; Chen, Z.; Lan, Y.; Ling, M.; You, H.; Han, X. A New Grazing-Vegetation Tradeoff and Coordination Indicator: The Grazing Intensity and Vegetation Cover Harmonization Index (GVCI). Agriculture 2025, 15, 27. [Google Scholar] [CrossRef]
- Li, X.; Chen, J.; Chen, Z.; Lan, Y.; Ling, M.; Huang, Q.; Li, H.; Han, X.; Yi, S. Explainable machine learning-based fractional vegetation cover inversion and performance optimization—A case study of an alpine grassland on the Qinghai-Tibet Plateau. Ecol. Inform. 2024, 82, 102768. [Google Scholar] [CrossRef]
- Zhao, C.; Su, S.; Gong, Z.; Lv, C.; Li, N.; Luo, Q.; Zhou, X.; Li, S. Effectiveness of protected areas in the Three-river Source Region of the Tibetan Plateau for biodiversity and ecosystem services. Ecol. Indic. 2023, 154, 110861. [Google Scholar] [CrossRef]
- Haase, D.; Haase, A.; Kabisch, N.; Kabisch, S.; Rink, D. Actors and factors in land-use simulation: The challenge of urban shrinkage. Environ. Model. Softw. 2012, 35, 92–103. [Google Scholar] [CrossRef]
- Liu, X.; Liang, X.; Li, X.; Xu, X.; Ou, J.; Chen, Y.; Li, S.; Wang, S.; Pei, F. A future land use simulation model (FLUS) for simulating multiple land use scenarios by coupling human and natural effects. Landsc. Urban Plan. 2017, 168, 94–116. [Google Scholar] [CrossRef]
- Guo, R.; Wu, T.; Wu, X.; Luigi, S.; Wang, Y. Simulation of urban land expansion under ecological constraints in Harbin-Changchun urban agglomeration, China. Chin. Geogr. Sci. 2022, 32, 438–455. [Google Scholar] [CrossRef]
- Zhang, Y.; Liao, X.; Sun, D. A Coupled InVEST-PLUS Model for the Spatiotemporal Evolution of Ecosystem Carbon Storage and Multi-Scenario Prediction Analysis. Land 2024, 13, 509. [Google Scholar] [CrossRef]
- Huang, D.; Huang, J.; Liu, T. Delimiting urban growth boundaries using the CLUE-S model with village administrative boundaries. Land Use Policy 2019, 82, 422–435. [Google Scholar] [CrossRef]
- Lin, W.; Sun, Y.; Nijhuis, S.; Wang, Z. Scenario-based flood risk assessment for urbanizing deltas using future land-use simulation (FLUS): Guangzhou Metropolitan Area as a case study. Sci. Total Environ. 2020, 739, 139899. [Google Scholar] [CrossRef]
- Liu, Z.; Ma, Q.; Cai, B.; Liu, Y.; Zheng, C. Risk assessment on deepwater drilling well control based on dynamic Bayesian network. Process Saf. Environ. Prot. 2021, 149, 643–654. [Google Scholar] [CrossRef]
- Khakzad, N. Application of dynamic Bayesian network to risk analysis of domino effects in chemical infrastructures. Reliab. Eng. Syst. Saf. 2015, 138, 263–272. [Google Scholar] [CrossRef]
- Kammouh, O.; Gardoni, P.; Cimellaro, G.P. Probabilistic framework to evaluate the resilience of engineering systems using Bayesian and dynamic Bayesian networks. Reliab. Eng. Syst. Saf. 2020, 198, 106813. [Google Scholar] [CrossRef]
- Liu, Z.; Han, Z.; Chen, Q.; Shi, X.; Ma, Q.; Cai, B.; Liu, Y. Risk assessment of marine oil spills using dynamic Bayesian network analyses. Environ. Pollut. 2023, 317, 120716. [Google Scholar] [CrossRef] [PubMed]
- Feng, Z.; Jin, X.; Chen, T.; Wu, J. Understanding trade-offs and synergies of ecosystem services to support the decision-making in the Beijing–Tianjin–Hebei region. Land Use Policy 2021, 106, 105446. [Google Scholar] [CrossRef]
- Zhu, W.; Gao, Y.; Zhang, H.; Liu, L. Optimization of the land use pattern in Horqin Sandy Land by using the CLUMondo model and Bayesian belief network. Sci. Total Environ. 2020, 739, 139929. [Google Scholar] [CrossRef] [PubMed]
- Duan, T.; Feng, J.; Chang, X.; Li, Y. Quantification of multiscale links of key factors with watershed nitrogen and sediment exports based on a Bayesian modelling approach. J. Clean. Prod. 2023, 399, 136586. [Google Scholar] [CrossRef]
- Marcot, B.G. Metrics for evaluating performance and uncertainty of Bayesian network models. Ecol. Model. 2012, 230, 50–62. [Google Scholar] [CrossRef]
- Grafius, D.R.; Corstanje, R.; Warren, P.H.; Evans, K.L.; Norton, B.A.; Siriwardena, G.M.; Pescott, O.L.; Plummer, K.E.; Mears, M.; Zawadzka, J.; et al. Using GIS-linked Bayesian Belief Networks as a tool for modelling urban biodiversity. Landsc. Urban Plan. 2019, 189, 382–395. [Google Scholar] [CrossRef]
- Zhou, S.; Peng, L. Applying Bayesian Belief Networks to Assess Alpine Grassland Degradation Risks: A Case Study in Northwest Sichuan, China. Front. Plant Sci. 2021, 12, 773759. [Google Scholar] [CrossRef]
- Wang, Z.; Li, X.; Mao, Y.; Li, L.; Wang, X.; Lin, Q. Dynamic simulation of land use change and assessment of carbon storage based on climate change scenarios at the city level: A case study of Bortala, China. Ecol. Indic. 2022, 134, 108499. [Google Scholar] [CrossRef]
- Huang, H.; Xue, J.; Feng, X.; Zhao, J.; Sun, H.; Hu, Y.; Ma, Y. Thriving arid oasis urban agglomerations: Optimizing ecosystem services pattern under future climate change scenarios using dynamic Bayesian network. J. Environ. Manag. 2024, 350, 119612. [Google Scholar] [CrossRef]
- Deng, W.; Song, J.; Sun, H.; Cheng, D.; Zhang, X.; Liu, J.; Kong, F.; Wang, H.; Khan, A.J. Isolating of climate and land surface contribution to basin runoff variability: A case study from the Weihe River Basin, China. Ecol. Eng. 2020, 153, 105904. [Google Scholar] [CrossRef]
- Angelsen, A.; Kaimowitz, D. Rethinking the causes of deforestation: Lessons from economic models. World Bank Res. Obser. 1999, 14, 73–98. [Google Scholar] [CrossRef]
- Noss, R.F. Beyond Kyoto: Forest management in a time of rapid climate change. Conserv. Biol. 2001, 15, 578–590. [Google Scholar] [CrossRef]
- Ling, M.; Feng, Z.; Chen, Z.; Lan, Y.; Li, X.; You, H.; Han, X.; Chen, J. Evaluation of driving effects of carbon storage change in the source of the Yellow River: A perspective with CMIP6 future development scenarios. Ecol. Inform. 2024, 83, 102790. [Google Scholar] [CrossRef]
- Schulp, C.J.; Veldkamp, A. Long-term landscape–land use interactions as explaining factor for soil organic matter variability in Dutch agricultural landscapes. Geoderma 2008, 146, 457–465. [Google Scholar] [CrossRef]
- Wu, J.; Luo, J.; Zhang, H.; Qin, S.; Yu, M. Projections of land use change and habitat quality assessment by coupling climate change and development patterns. Sci. Total Environ. 2022, 847, 157491. [Google Scholar] [CrossRef] [PubMed]
- Chen, S.; Deng, X.; Wu, L.; Zhao, K.; Huang, Z.; Chen, Q.; Zhang, X. Delineating Priority Areas for Preservation and Restoration across Production-Living-Ecological Spaces in Ganzi, China. Sustainability 2024, 16, 4327. [Google Scholar] [CrossRef]
- Li, S.; Yu, D.; Huang, T.; Hao, R. Identifying priority conservation areas based on comprehensive consideration of biodiversity and ecosystem services in the Three-River Headwaters Region, China. J. Clean. Prod. 2022, 359, 132082. [Google Scholar] [CrossRef]
- Ma, Y.; Chen, H.; Liu, D.; Zhang, J.; Yang, M.; Shi, J. Identification and management of priority regulation areas based on the supply-demand relationship of ecosystem services: A case study of the Loess Plateau. Ecol. Indic. 2024, 159, 111754. [Google Scholar] [CrossRef]
- Zhang, Z.; Li, T.; Li, L.; Li, S.; Rong, Y.; Bao, R.; Fu, X.; Tang, M.; Wu, G. Integrating ecosystem service importance and ecological sensitivity to identify priority areas for ecological conservation and restoration in Miyun Reservoir Basin. Int. J. Sustain. Dev. World Ecol. 2023, 30, 925–937. [Google Scholar] [CrossRef]
- Zhou, Q.; Zhu, Q.; Feng, Y.; Wang, J. Identification of Priority Areas for Ecological Restoration at a Small Watershed Scale: A Case Study in Dali Prefecture of Yunnan Province in China. Land 2025, 14, 1270. [Google Scholar] [CrossRef]
- Grossauer, F.; Stoeglehner, G. Bioeconomy-A Systematic Literature Review on Spatial Aspects and a Call for a New Research Agenda. Land 2023, 12, 234. [Google Scholar] [CrossRef]
- Yang, H.; Jiang, H.; Wu, R.; Hu, T.; Wang, H. Dynamic Evolution of Multi-Scale Ecosystem Services and Their Driving Factors: Rural Planning Analysis and Optimisation. Land 2024, 13, 995. [Google Scholar] [CrossRef]
- Chen, X.; Xu, D.; Fadelelseed, S.; Li, L. Spatiotemporal Analysis and Control of Landscape Eco-Security at the Urban Fringe in Shrinking Resource Cities: A Case Study in Daqing, China. Int. J. Environ. Res. Public Health 2019, 16, 4640. [Google Scholar] [CrossRef] [PubMed]
- Liu, Y.; Lian, J.; Chen, H. Assessment of the restoration potential for ecological sustainability in the Xijiang River basin, Southwest China: A comparative analysis of karst and non-karst areas. Sci. Total Environ. 2024, 912, 168929. [Google Scholar] [CrossRef]
- Schoenenberger, L.; Schmid, A.; Tanase, R.; Beck, M.; Schwaninger, M. Structural analysis of system dynamics models. Simul. Model. Pract. Theory 2021, 110, 102333. [Google Scholar] [CrossRef]
- He, C.; Zhang, D.; Huang, Q.; Zhao, Y. Assessing the potential impacts of urban expansion on regional carbon storage by linking the LUSD-urban and InVEST models. Environ. Model. Softw. 2016, 75, 44–58. [Google Scholar] [CrossRef]
- Zhao, M.; He, Z.; Du, J.; Chen, L.; Lin, P.; Fang, S. Assessing the effects of ecological engineering on carbon storage by linking the CA-Markov and InVEST models. Ecol. Indic. 2019, 98, 29–38. [Google Scholar] [CrossRef]
- Gao, Y.; Ma, L.; Liu, J.; Zhuang, Z.; Huang, Q.; Li, M. Constructing Ecological Networks Based on Habitat Quality Assessment: A Case Study of Changzhou, China. Sci. Rep. 2017, 7, 46073. [Google Scholar] [CrossRef]
- Bao, Y.; Li, T.; Liu, H.; Ma, T.; Wang, H.; Liu, K.; Shen, X.; Liu, X. Spatial and temporal changes of water conservation of Loess Plateau in northern Shaanxi province by InVEST model. Geogr. Res 2016, 35, 664–676. [Google Scholar]
Disclaimer/Publisher’s Note: The statements, opinions and data contained in all publications are solely those of the individual author(s) and contributor(s) and not of MDPI and/or the editor(s). MDPI and/or the editor(s) disclaim responsibility for any injury to people or property resulting from any ideas, methods, instructions or products referred to in the content. |
© 2025 by the authors. Licensee MDPI, Basel, Switzerland. This article is an open access article distributed under the terms and conditions of the Creative Commons Attribution (CC BY) license (https://creativecommons.org/licenses/by/4.0/).