Highlights
What are the main findings?
- We analyzed the sensitivity of seven snow depth retrieval algorithms (Chang, SPD, Foster, AMSR2, WESTDC, FY-3B, and FY-3D) to brightness temperature differences (TBDs) between passive microwave sensors (SSMIS, AMSR2, and MWRI).
- The SPD, WESTDC, FY-3B, and FY-3D algorithms exhibit relatively low sensitivity to TBDs, while the Foster algorithm demonstrates high sensitivity, especially in forested areas.
What is the implication of the main finding?
- Algorithms with low sensitivity to TBDs improve the consistency of multi-sensor snow depth retrievals and lay the foundation for developing more stable retrieval methods in the future.
- These findings contribute to building passive microwave virtual constellations and ensuring reliable long-term snow depth records for climatology and hydrology.
Abstract
Passive microwave remote sensing provides indispensable observations for constructing long-term snow depth records, which are critical for climatology, hydrology, and operational applications. Nevertheless, despite decades of snow depth monitoring, systematic evaluations of how inter-sensor brightness temperature differences (TBDs) propagate into retrieval uncertainties are still lacking. In this study, TBDs between DMSP-F18/SSMIS, FY-3D/MWRI, and AMSR2 sensors were quantified, and the sensitivity of seven snow depth retrieval algorithms to these discrepancies was systematically assessed. The results indicate that TBDs between SSMIS and AMSR2 are larger than those between MWRI and AMSR2, likely reflecting variations in sensor specifications such as frequency, observation angle, and overpass time. In terms of algorithm sensitivity, SPD, WESTDC, FY-3B, and FY-3D demonstrate less sensitivity across sensors, with standard deviations of snow depth differences generally below 2 cm. In contrast, the Foster algorithm exhibits pronounced sensitivity to TBDs, with standard deviations exceeding 11 cm and snow depth differences reaching over 20 cm in heavily forested regions (forest fracion >90%). This study provides guidance for SWE virtual constellation design and algorithm selection, supporting long-term, seamless, and consistent snow depth retrievals.
1. Introduction
In the Northern Hemisphere, snow covers more than half of the land during the snow season, playing a vital role in the Earth’s energy balance due to its high albedo and low thermal conductivity [1,2,3,4]. Additionally, snow serves as a crucial freshwater reservoir, with its meltwater supporting daily water use and agricultural irrigation, particularly in mountainous regions [5,6,7]. Long-term snow depth datasets are essential for hydrological and meteorological studies, providing valuable insights into climate change and hydrological processes [8,9,10].
There are currently two main approaches for producing long-term, consistent snow depth products: inter-calibration among different sensors, and the development of snow depth retrieval algorithms that are less sensitive to inter-sensor brightness temperature differences. Inter-calibration has been extensively studied for mainstream microwave radiometers, including the SSM/I(S) series, the AMSR series, and the MWRI series [11,12,13,14,15]. SSM/I(S) data, available since 1987, have been most widely used for inter-calibration and the generation of long-term snow depth products [16,17]. In contrast, AMSR-E/2 and MWRI were launched more recently; although their data generally offer higher quality, with smaller footprints and better stability, their shorter operational histories have limited their use in long-term studies [18]. Researchers have also begun exploring inter-calibration across different sensor series. With the growing number of satellite sensors and the expansion of satellite constellations, inter-calibration becomes increasingly labor-intensive, as each new or updated sensor requires additional calibration [19,20].
With the growing number of satellite sensors and the expansion of satellite constellations, inter-calibration remains an essential step to ensure data consistency across missions. Nevertheless, residual discrepancies in sensor characteristics can inevitably propagate into snow depth retrievals, even after rigorous cross-calibration. This underscores the importance of understanding how retrieval algorithms themselves respond to inter-sensor brightness temperature differences.
Currently, passive microwave snow depth retrieval algorithms are mainly categorized into four types: empirical algorithms [17,21,22,23,24,25,26], assimilation algorithms [16,27], physical statistical algorithms [28,29], and machine learning algorithms [30,31,32]. Empirical algorithms (such as Chang, SPD, Foster, standard AMSR2, WESTDC, FY-3B, and FY-3D) rely on statistical regression relationships between snow depth at meteorological stations and brightness temperature gradients, and some of them are widely used in the production of official snow depth products. Assimilation algorithms, such as the GlobSnow algorithm, have produced the GlobSnow snow depth product, which covers the Northern Hemisphere (>35°N) [16,33]. Physical statistical algorithms offer a straightforward retrieval approach with clear physical meaning, but as they currently account only for bare ground conditions, they have not yet been used to generate snow depth products [28,29]. Machine learning algorithms are capable of effective nonlinear regression [30,31,32,34]. Snow depth products based on machine learning include the NASA AMSR2 product and the FY-3F product [35,36]. To further enhance the efficiency of operational applications, the FY-3F algorithm employs a pixel-wise regression approach, which in essence still represents an empirical method [36]. As a first attempt, this study primarily evaluates the sensitivity of empirical algorithms to brightness temperature differences, without including the FY-3F algorithm.
While cross-calibration of sensors remains essential, understanding algorithm-specific sensitivities provides valuable prior information for the combined use of multiple algorithms and sensors. Each algorithm has its own characteristics, and each sensor has unique properties; assessing their interactions is crucial for optimizing multi-sensor snow depth retrieval. This perspective helps identify strategies for integrating algorithms and sensors to achieve more high-accuracy, seamless, and consistent snow depth products.
The structure of this paper is as follows: Section 2 introduces the data and methods; Section 3 analyzes the differences in brightness temperatures among different sensors and the sensitivity of snow depth retrieval algorithms to brightness temperature differences and the influence of seasonal snow variations, land cover types, and seasonal snow classifications on SD differences; Section 4 discusses the main findings; and Section 5 presents the conclusions of the study.
2. Data and Methods
2.1. Data
2.1.1. Passive Microwave Brightness Temperature Data
The primary sensors used for generating Climate Data Record (CDR) brightness temperature datasets belong to three series: (1) the SSM/I and SSMIS sensors onboard the DMSP satellites; (2) the AMSR-E and AMSR2 sensors onboard JAXA’s GCOM-W satellites; and (3) the MWRI sensors onboard the FY-3 series satellites operated by the China Meteorological Administration (CMA). The SSM/I and its successor SSMIS sensors have been observing since 1987, and the cross-calibrated brightness temperature data from SSM/I and SSMIS have been released as CDR datasets, available in two versions: one provided by Remote Sensing Systems (RSSs) and the other by Colorado State University (CSU). Although the overpass time of DMSP-F17/SSMIS is relatively stable, its 37 GHz V-polarized brightness temperature channel became anomalous after August 2016 [20]. Comparing the brightness temperature data from the DMSP series microwave radiometers provided by CSU, we found that the inter-sensor brightness temperature differences are relatively small (less than 0.6 K); see Figure 1. Therefore, this study selects the more recent DMSP-F18 sensor data for analysis (https://www.ncei.noaa.gov/, accessed on 24 May 2023). The AMSR-E and AMSR2 sensors have minor differences, and AMSR2 (https://www.earthdata.nasa.gov/data/instruments/amsr2, accessed on 12 May 2023), with a smaller footprint, has been providing observational data since 2012 [37]. The FY-3D/MWRI sensor (https://satellite.nsmc.org.cn/, accessed on 5 February 2023) from China has been continuously providing Earth observation data since its launch in 2017. The specifications of the DMSP-F18/SSMIS, GCOM-W/AMSR2, and FY-3D/MWRI sensors are listed in Table 1. The time range of the data used in this study is from 1 January 2018 to 31 December 2019. To mitigate the effects of wet snow, the TBs from SSMIS, MWRI, and AMSR2 are all from descending orbits.

Figure 1.
Histogram of brightness temperature differences at 18.7 (19.3) GHz between (a) DMSP-F15/SSMI and DMSP-F16/SSMIS, (b) DMSP-F16/SSMIS and DMSP-F17/SSMIS, and (c) DMSP-F17/SSMIS and DMSP-F18/SSMIS.

Table 1.
Comparison of satellite platforms, sensors, and specifications.
2.1.2. Auxiliary Data
The global land cover data is sourced from the MOD12Q1 dataset (500 m, yearly, https://lpdaac.usgs.gov/, accessed on 17 March 2023), which is used to calculate global forest fraction at 25 km resolution. For the Chinese region, the land cover information used in FY-3B and FY-3D retrieval algorithms is based on a 1 km dataset derived from 30 m TM (Thematic Mapper) imagery acquired in 2000, which is provided by the Resource and Environment Science Data Center (http://www.resdc.cn/, accessed on 17 March 2023). Forest density data are obtained from the MOD44B Vegetation Continuous Fields (VCF) dataset (500 m, yearly, https://lpdaac.usgs.gov/, last access: 17 March 2023). The spatial distribution of land cover types, forest fraction, and snow classification types used in this study is shown in Figure 2.

Figure 2.
Spatial distribution of land cover types (a), forest fraction (b), and Sturm snow classification types (c) in the Northern Hemisphere.
2.2. Methods
2.2.1. Dry Snow Detection
The Grody’s algorithm has been proven to exhibit high dry snow classification accuracy [38,39,40]. It is a decision tree-based algorithm for dry snow detection, which identifies dry snow by excluding precipitation, cold deserts, and frozen ground. Specifically, the Grody’s algorithm detects dry snow based on the following criteria:
Step 1. For scattering signature: or ;
Step 2. For rainfall: K or or and ;
Step 3. For cold deserts: and and ; and
Step 4. For frozen ground: and and .
Dry snow is classified as pixels that do not meet the criteria specified in Step 1 to Step 4.
2.2.2. Snow Depth Retrieval Algorithms
In this study, seven algorithms were selected for comparative analysis, namely the Chang, Foster, AMSR2, SPD, WESTDC, FY-3B, and FY-3D algorithms. Among these, the Chang, Foster, AMSR2, and SPD algorithms are globally applicable and can be widely used for snow depth retrieval in various regions. In contrast, the WESTDC, FY-3B, and FY-3D algorithms were specifically developed for application in China, taking into account the unique snow characteristics and climatic conditions of the region. Table 2 summarized the snow depth algorithms used in this study.

Table 2.
Summary of passive microwave snow depth retrieval algorithms.
The Chang algorithm assumes a snow grain size of 0.3 mm and a snow density of 300 kg/m3 [21]. Through linear regression analysis of simulated values from a radiative transfer model and ground station observations, a linear relationship between snow depth and the horizontal polarization brightness temperature difference (19 GHz vs. 37 GHz) is established. Foster et al. [22], in order to improve snow depth retrieval accuracy in forested regions, incorporated the forest fraction (ff) into the Chang algorithm and adjusted the regression coefficient accordingly. Aschbacher et al. [23] proposed the Spectral and Polarization Difference (SPD) algorithm based on the brightness temperature differences Tb19V-Tb37V and Tb19V-Tb19H, where the 19 GHz polarization difference reflects the vertical structural properties of the snow. Kelly [24] developed the standard snow depth retrieval algorithm for the AMSR2 sensor, hereafter referred to as the AMSR2 algorithm. This algorithm incorporates the logarithmic polarization difference at 19 GHz and 37 GHz to track the evaluation of snow grain size. Additionally, it incorporated forest fraction (ff) and forest density (fd) to correct snow depth retrieval for forest pixels. Che et al. [17] refined the Foster algorithm for the China region by updating the regression coefficients. The algorithm is also used to produce the WESTDC snow depth product. This algorithm will hereafter be referred to as the WESTDC algorithm. Jiang et al. [25] accounted for the impact of mixed pixels by establishing relationships between brightness temperature differences and snow depth for four pure pixel surface types: bareland, grassland, forest, and farmland. The snow depth for mixed pixels was then derived through a weighted combination based on the fractional coverage of these land cover types. This algorithm has also been adopted as the official snow depth retrieval method for the FY-3B satellite and will be referred to as the FY-3B algorithm hereafter. Building on previous studies, Yang et al. [26] developed a region-specific snow depth retrieval algorithm for China. This algorithm optimizes snow depth estimation separately for different regions based on their distinct snow characteristics. In Northeast China, it refines the Foster algorithm by adjusting the regression coefficients, while in Xinjiang, it derives regression coefficients based on Tb19V–Tb37H. For other regions, the FY-3B algorithm is applied. This method has been adopted as the official snow depth retrieval algorithm for the FY-3D satellite and will be referred to as the FY-3D algorithm hereafter.
2.2.3. Multi-Sensor Comparison and Sensitivity Assessment
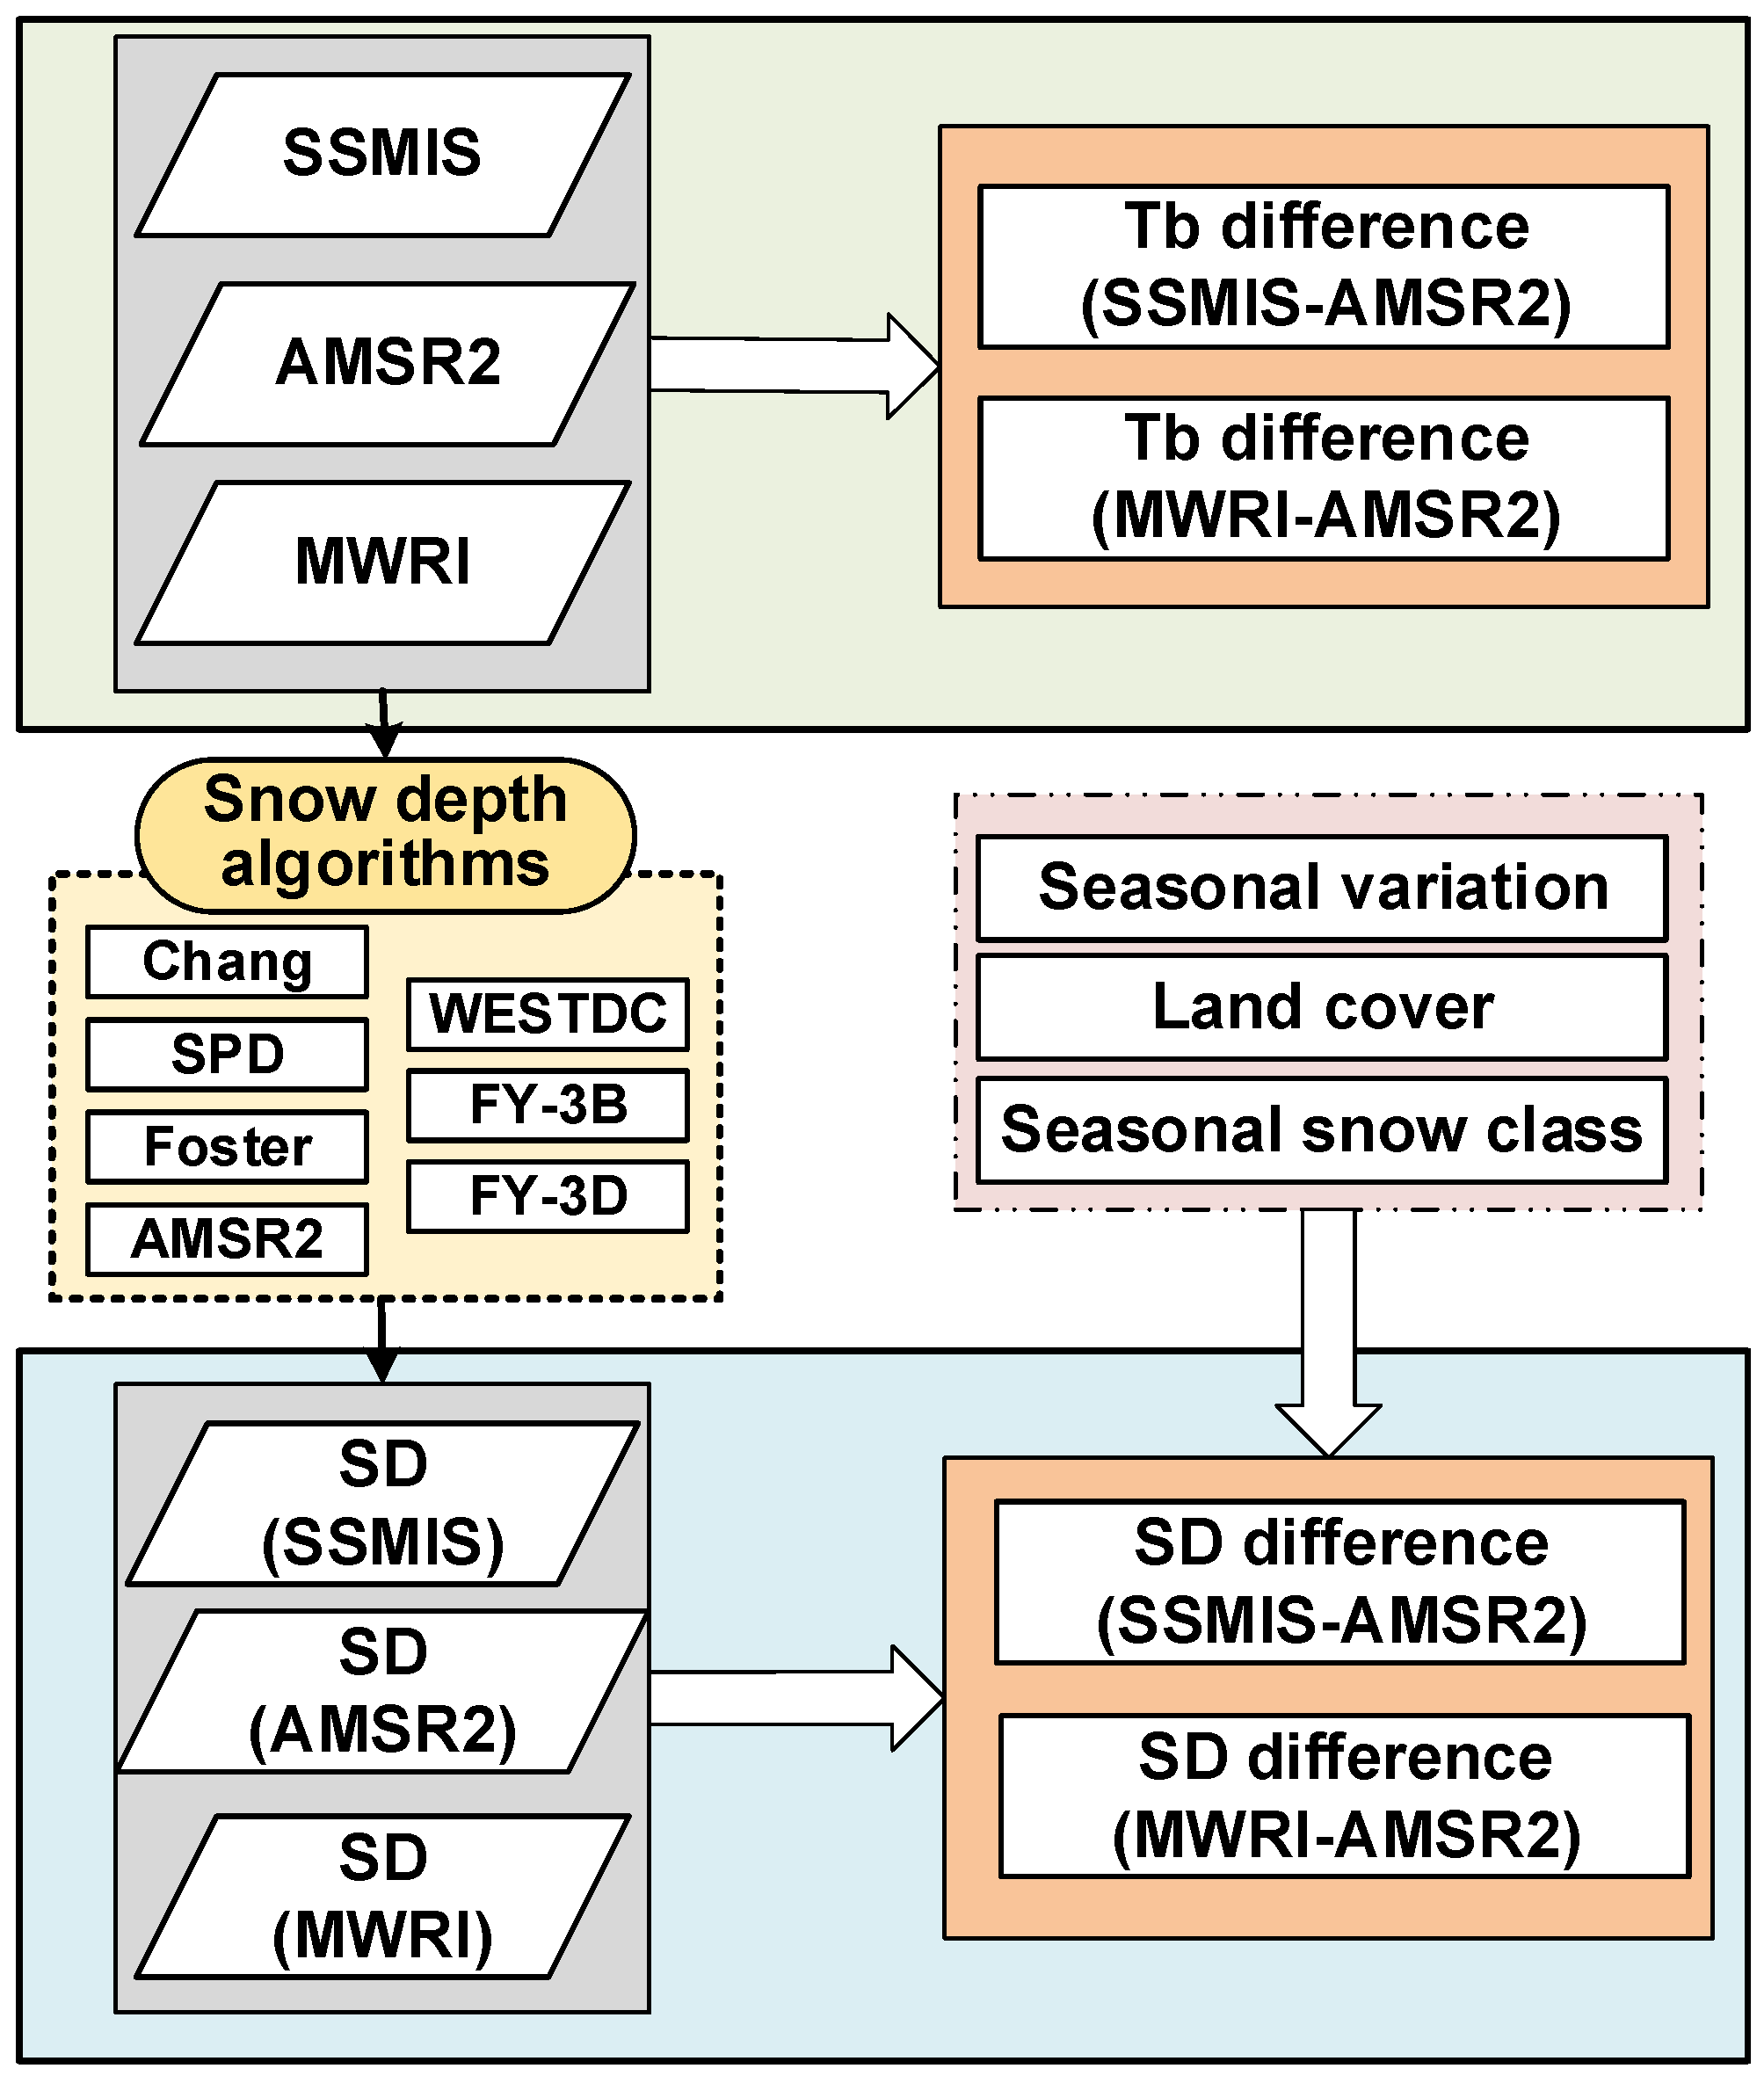
In this study, seven snow depth retrieval algorithms were applied to passive microwave observations from multiple sensors to estimate snow depth. The retrieved snow depths were compared across sensors for both the Northern Hemisphere and China. All dry snow masks in this study were generated based on AMSR2 brightness temperature using the Grody’s algorithm to ensure a common comparison area for snow depth retrieval. To systematically assess algorithm sensitivity, snow depth differences between sensors were quantified, and their dependence on seasonal variation, land cover types, and snow classifications was evaluated. The overall workflow of the study is illustrated in Figure 3 and can be summarized as follows:
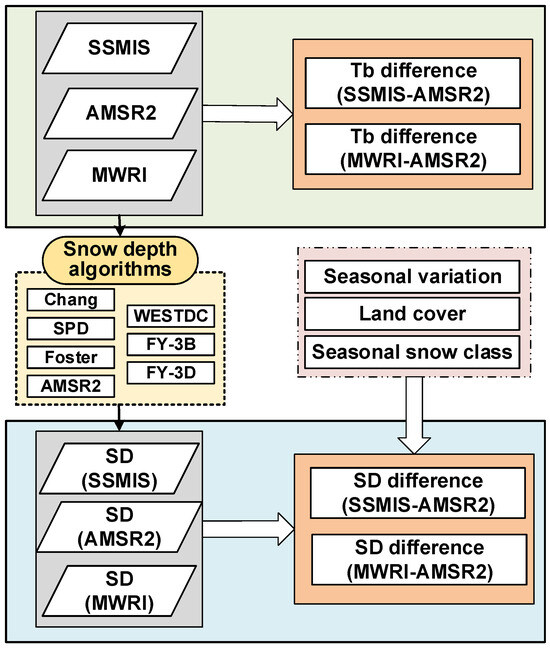
Figure 3.
Flowchart of this paper.
(1) Brightness temperature comparison: Brightness temperature observations from 2018 to 2019 were collected for DMSP-F18/SSMIS, AMSR2, and FY-3D/MWRI. Sensor pairs (SSMIS vs. AMSR2, MWRI vs. AMSR2) were compared to quantify TBDs, providing a baseline for assessing inter-sensor consistency.
(2) Snow depth retrieval: The Chang, Foster, SPD, and WESTDC snow depth retrieval algorithms were applied to all three sensor datasets (SSMIS, AMSR2, and MWRI), whereas the AMSR2, FY-3B, and FY-3D algorithms were applied only to AMSR2 and MWRI datasets. Global algorithms were applied across all study areas, while region-specific algorithms (WESTDC, FY-3B, and FY-3D) were applied over China.
(3) Inter-sensor snow depth differences: For each algorithm, snow depth differences (SDDs) between sensors were calculated for all pixels classified as dry snow. Quantitative metrics were computed as follows:
where N is the number of dry snow pixels, is the snow depth difference at pixel i, is the mean snow depth difference, and is the standard deviation of snow depth differences.
(4) Analysis under different conditions: The SDDs were further analyzed across seasonal periods, land cover types (e.g., forest, grassland, and bareland), and snow classifications to identify conditions that amplify sensitivity.
The quantitative assessment of the mean and standard deviation of SDDs across sensors and conditions provides a basis for evaluating algorithm performance and guiding the selection of robust snow depth retrieval methods for long-term, multi-sensor applications.
3. Results
3.1. Brightness Temperature Differences Between Sensors
3.1.1. Time Series of Brightness Temperature Differences Between Different Sensors
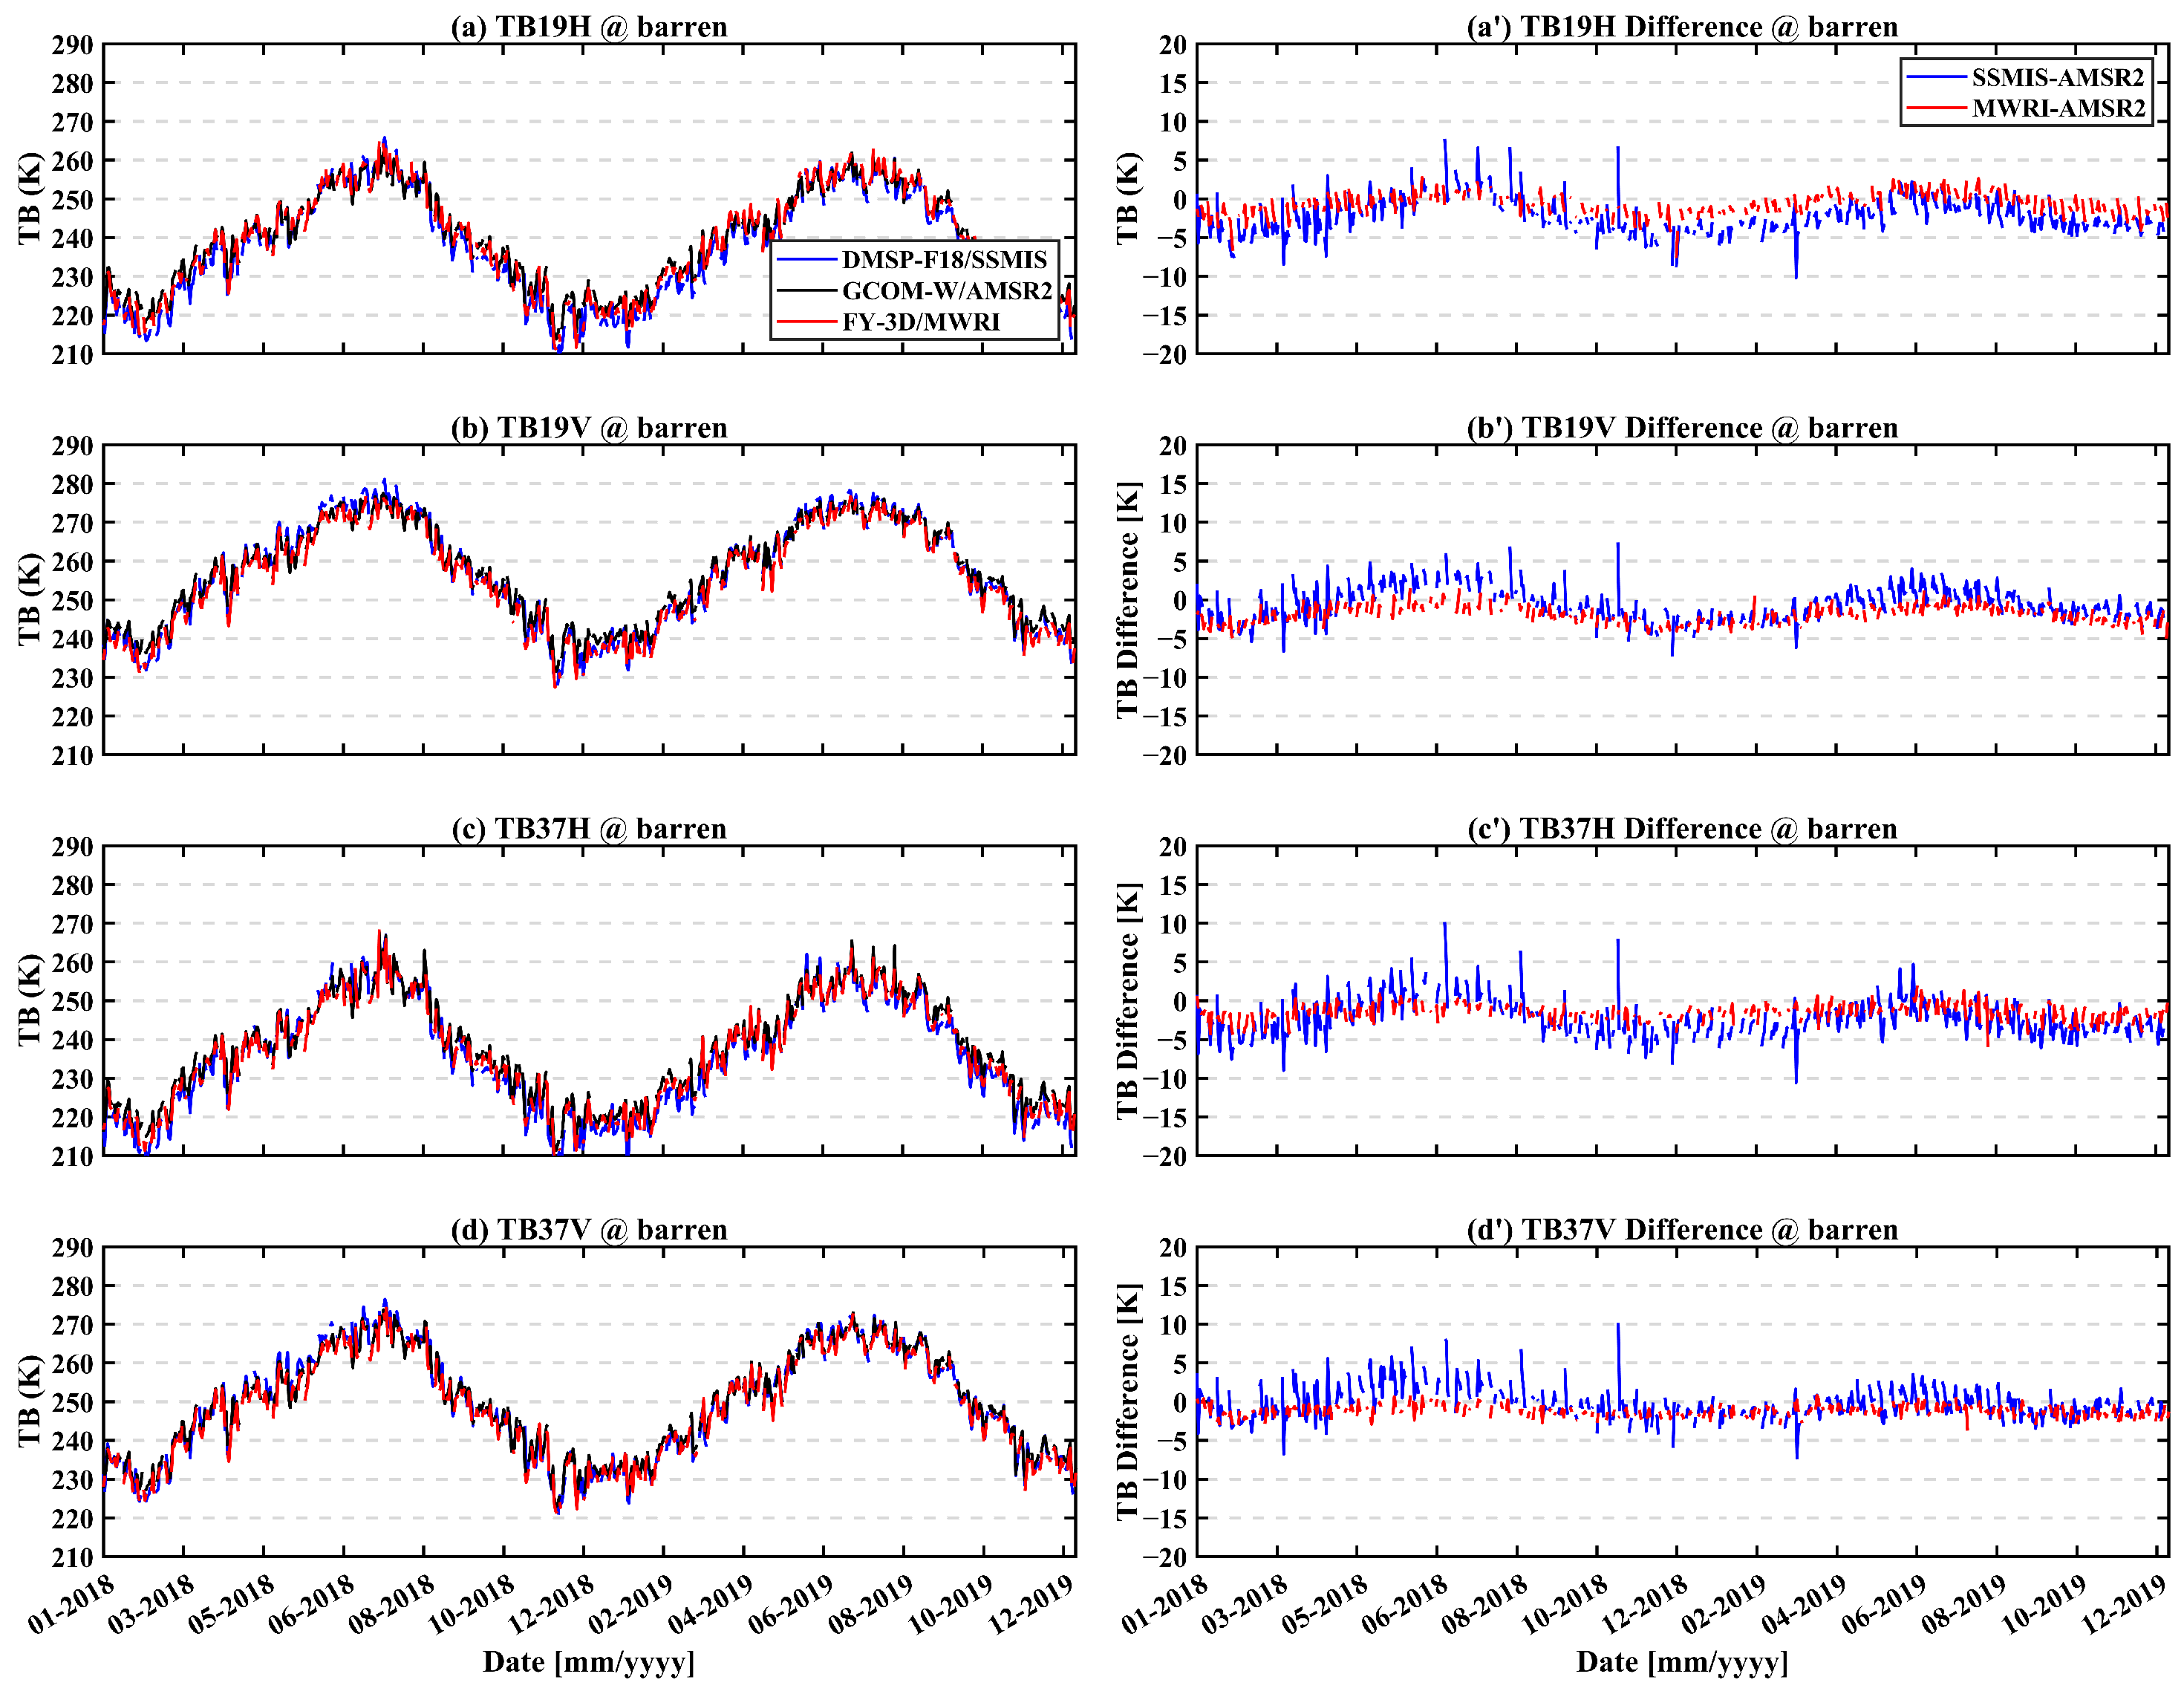
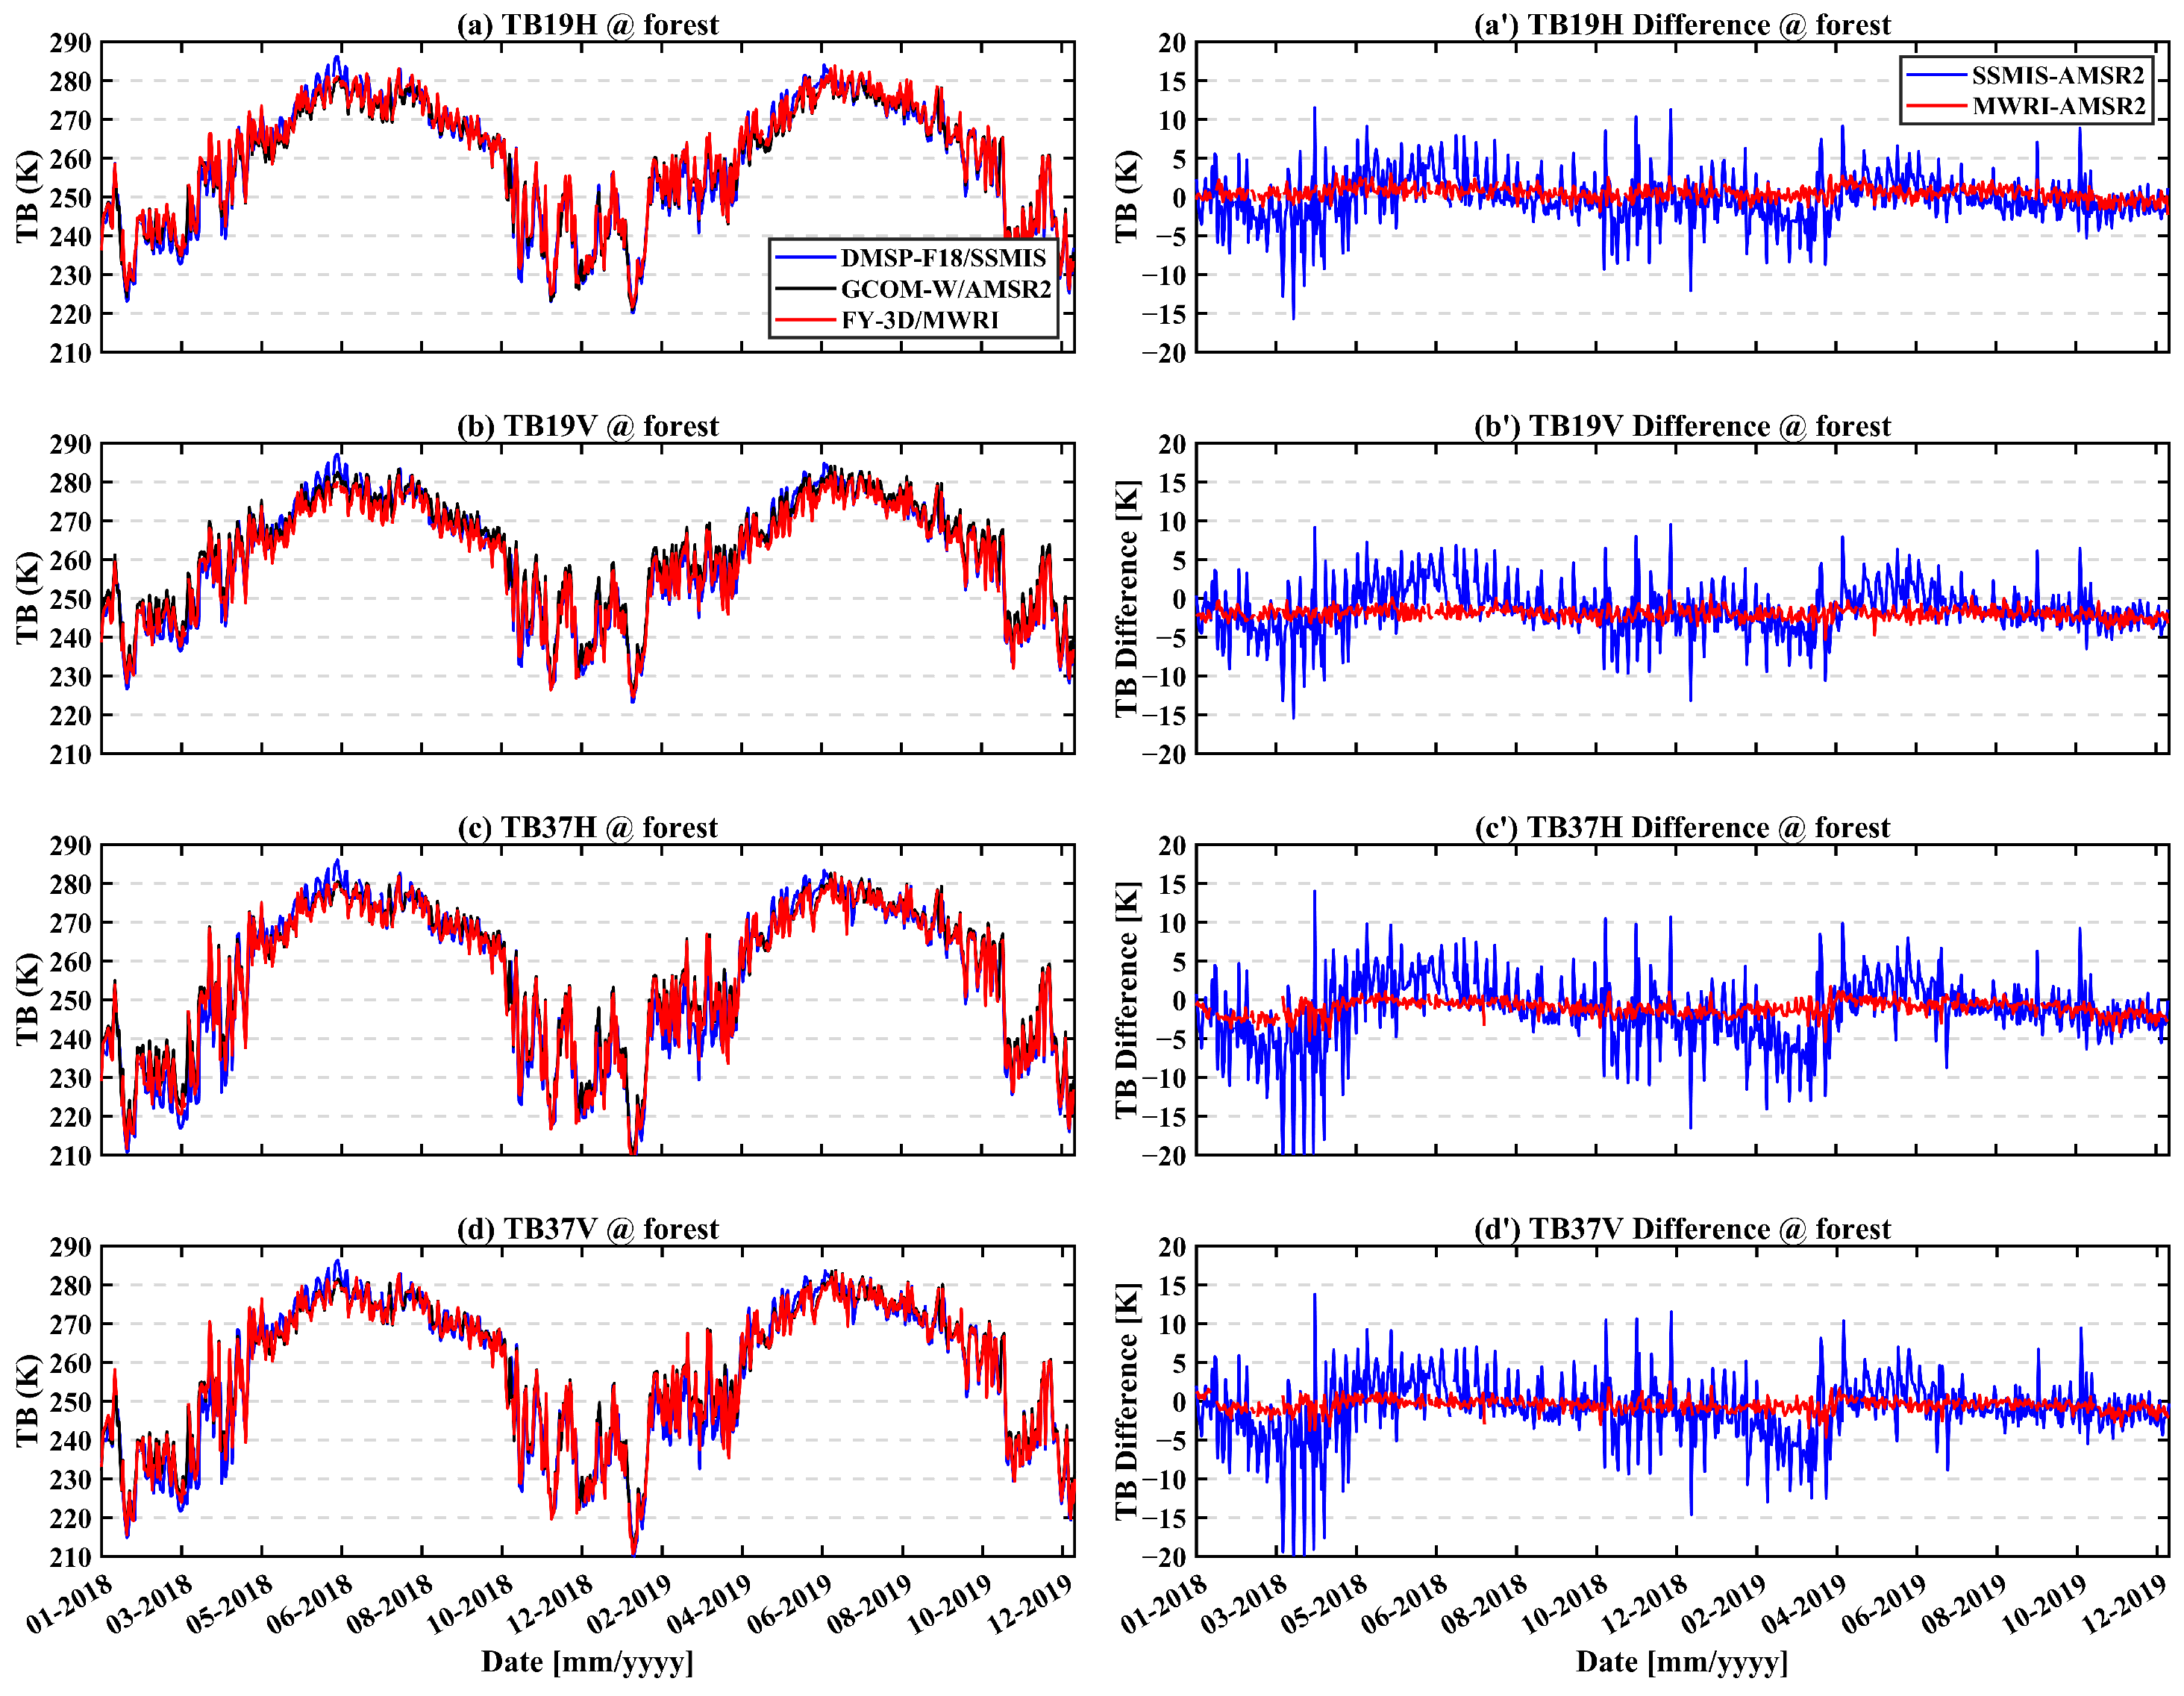
Figure 4 shows the time series of brightness temperature differences for barren pixels (lon: 98.62°E, lat: 43.12°N). Overall, the TBDs between SSMIS and AMSR2 are larger than that between FY-3D/MWRI and AMSR2. A seasonal pattern is observed in the TBDs between SSMIS and AMSR2, with values rising from January to June and declining from June to December. In contrast, Figure 5 displays the time series of TBDs for forest pixels (lon: 99.60°E, lat: 57.80°N; forest fraction: 100%), which exhibit a markedly different trend compared to barren pixels. Notably, the TBDs between SSMIS and AMSR2 show considerable fluctuation, possibly due to differences in overpass times [41].
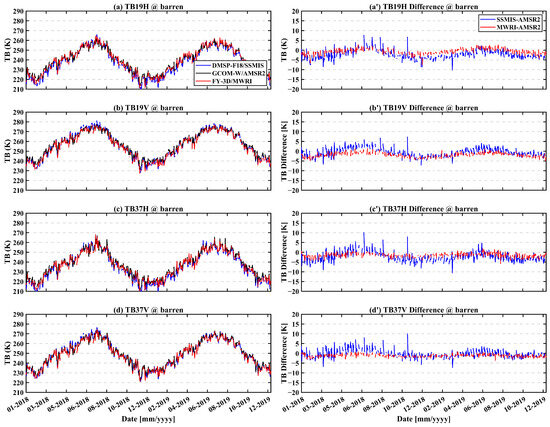
Figure 4.
Time series of brightness temperature differences for barren pixel from 1 January 2018 to 31 December 2019. (a–d) are the brightness temperature at 18.7(19) GHz H-pol, 18.7(19) GHz V-pol, 36.5(37) GHz H-pol, and 36.5(37) GHz V-pol, respectively. (a′–d′) are the brightness temperature difference at the same frequency and pol.
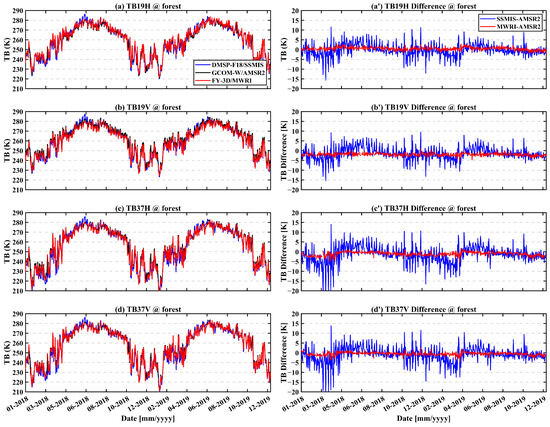
Figure 5.
Time series of brightness temperature differences for forest pixel from 1 January 2018 to 31 December 2019. (a–d) are the brightness temperature at 18.7(19) GHz H-pol, 18.7(19) GHz V-pol, 36.5(37) GHz H-pol, and 36.5(37) GHz V-pol, respectively. (a′–d′) are the brightness temperature difference at the same frequency and pol.
Table 3 presents the mean and standard deviation of TBDs across various frequency bands for a barren pixel and a forest pixel. For the forest pixel, the mean TBDs between SSMIS and AMSR2 range from −2.28 K to −0.6 K, with a standard deviation between 3.03 K and 4.47 K. In comparison, for the barren pixel, the mean TBDs fall within a similar range (−2.27 K to −0.2 K), but with a slightly lower standard deviation of 2.08 K to 2.46 K, indicating greater stability. For MWRI and AMSR2, the mean TBDs for the barren pixel ranges from −1.94 K to −0.65 K, with a standard deviation between 0.77 K and 1.46 K. In contrast, for the forest pixel, the mean brightness temperature difference varies from −2.06 K to 0.35 K, with a standard deviation of 0.8 K to 1.35 K. These results indicate that the TBDs over forest pixels exhibit greater variability, especially in the comparison between SSMIS and AMSR2.

Table 3.
Brightness temperature differences between SSMIS and AMSR2, and MWRI and AMSR2 (Unit: Kelvin) (Mean ± Std).
3.1.2. Spatial Distribution of Brightness Temperature Differences Between Sensors in the Northern Hemisphere Land Areas
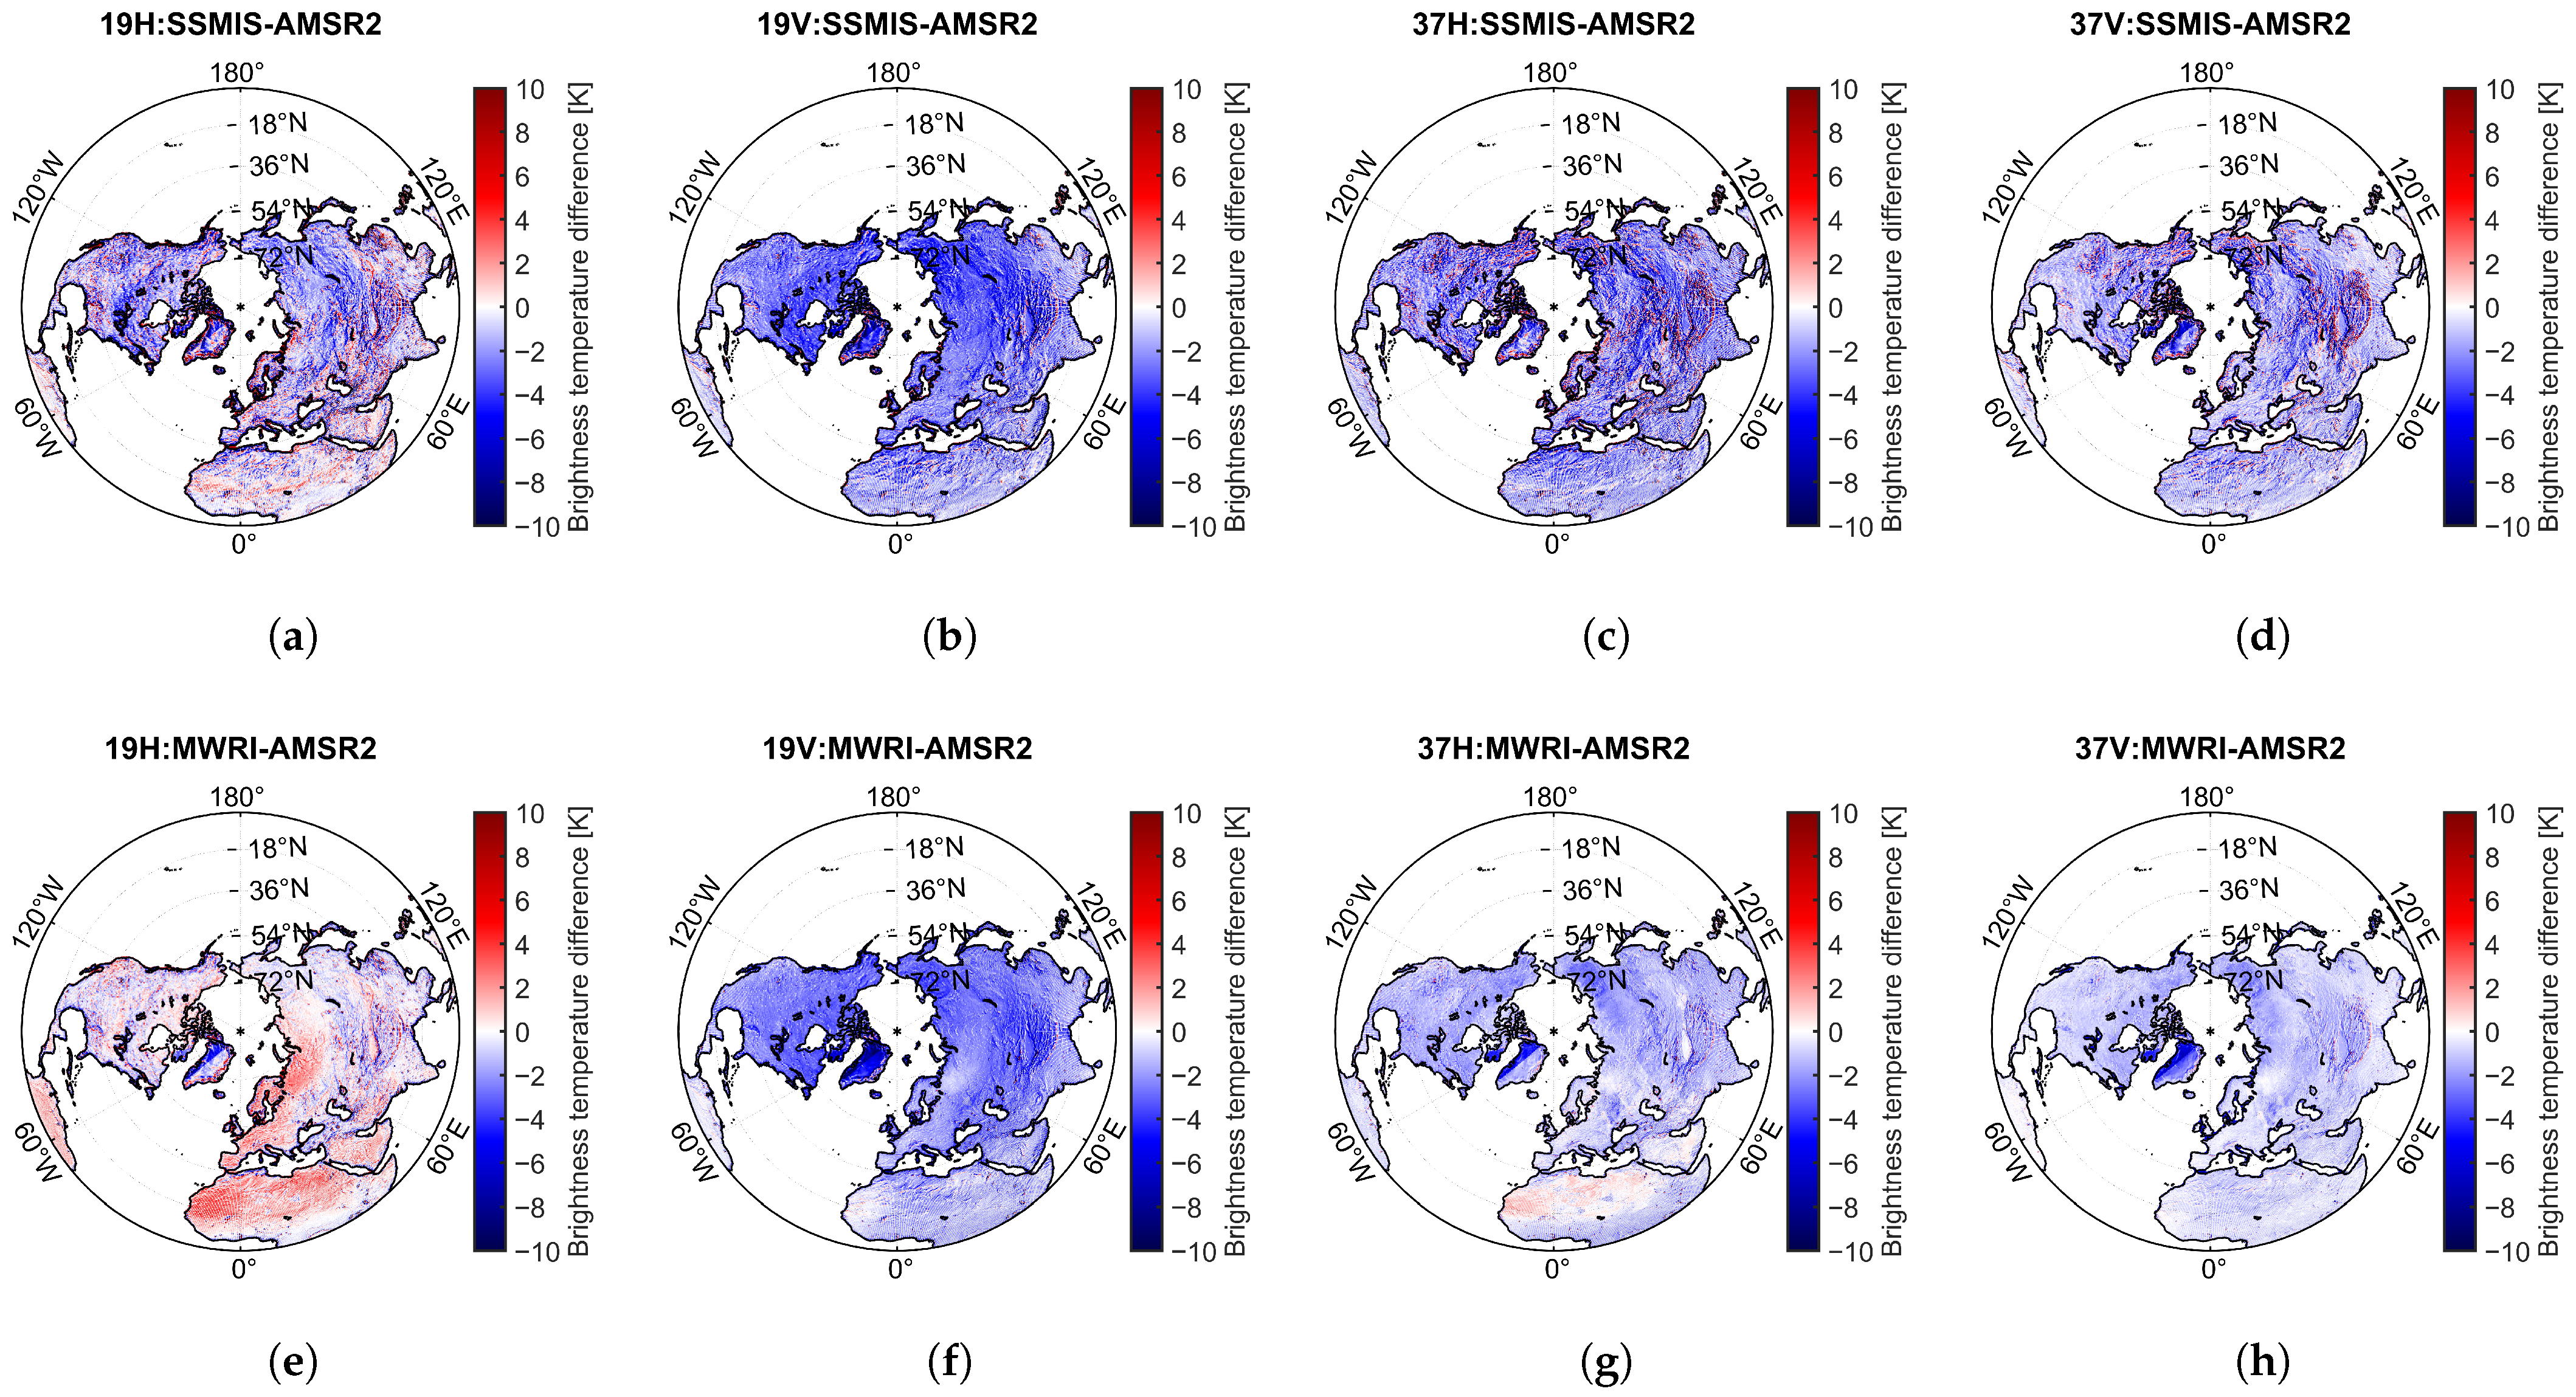
Figure 6a–d shows the spatial distribution and histogram of the mean brightness temperature differences between DMSP-F18/SSMIS and AMSR2 () in the Northern Hemisphere from 1 January 2018 to 31 December 2019. The results indicate that mean is lower than 0 K, and most of them range from −10 K to 10 K. Specifically, the mean (standard deviation) of TBDs for different channels are as follows: for 19 GHz H-pol, for 19 GHz V-pol, for 37 GHz H-pol, and for 37 GHz V-pol [see Table 4].
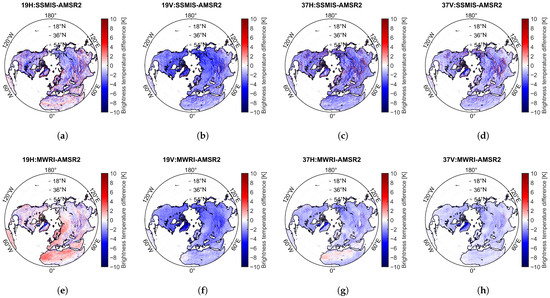
Figure 6.
Spatial distribution of the annual mean brightness temperature differences for 2018–2019: (a–d) represent the differences between DMSP-F18/SSMIS and AMSR2, (e–h) correspond to the differences between FY-3D/MWRI and AMSR2. (a,e) correspond to 18.7(19) GHz H-pol, (b,f) to 18.7(19) GHz V-pol, (c,g) to 36.5(37) GHz H-pol, and (d,h) to 36.5(37) GHz V-pol.

Table 4.
Brightness temperature differences between DMSP-F18/SSMIS and AMSR2, and FY-3D/MWRI and AMSR2 in the Northern Hemisphere land areas.
Figure 6e–h presents the spatial distribution of the mean TBDs between FY-3D/MWRI and AMSR2 () in the Northern Hemisphere over the same period. The results show that the 37 GHz TBDs are relatively small. MWRI brightness temperatures are generally lower than those of AMSR2 for 19 GHz V-pol, 37 GHz H-pol, and 37 GHz V-pol and higher in 19 GHz H-pol. Specifically, the mean (standard deviation) of the brightness temperature differences for different channels are as follows: for 19 GHz H-pol, for 19 GHz V-pol, for 37 GHz H-pol, and for 37 GHz V-pol. Although the absolute mean values of at 19 GHz V-pol and 37 GHz V-pol are greater than those of , their standard deviations are higher, indicating greater instability (see Table 4).
3.2. Sensitivity Analysis of Snow Depth Retrieval Algorithms to Brightness Temperature Differences
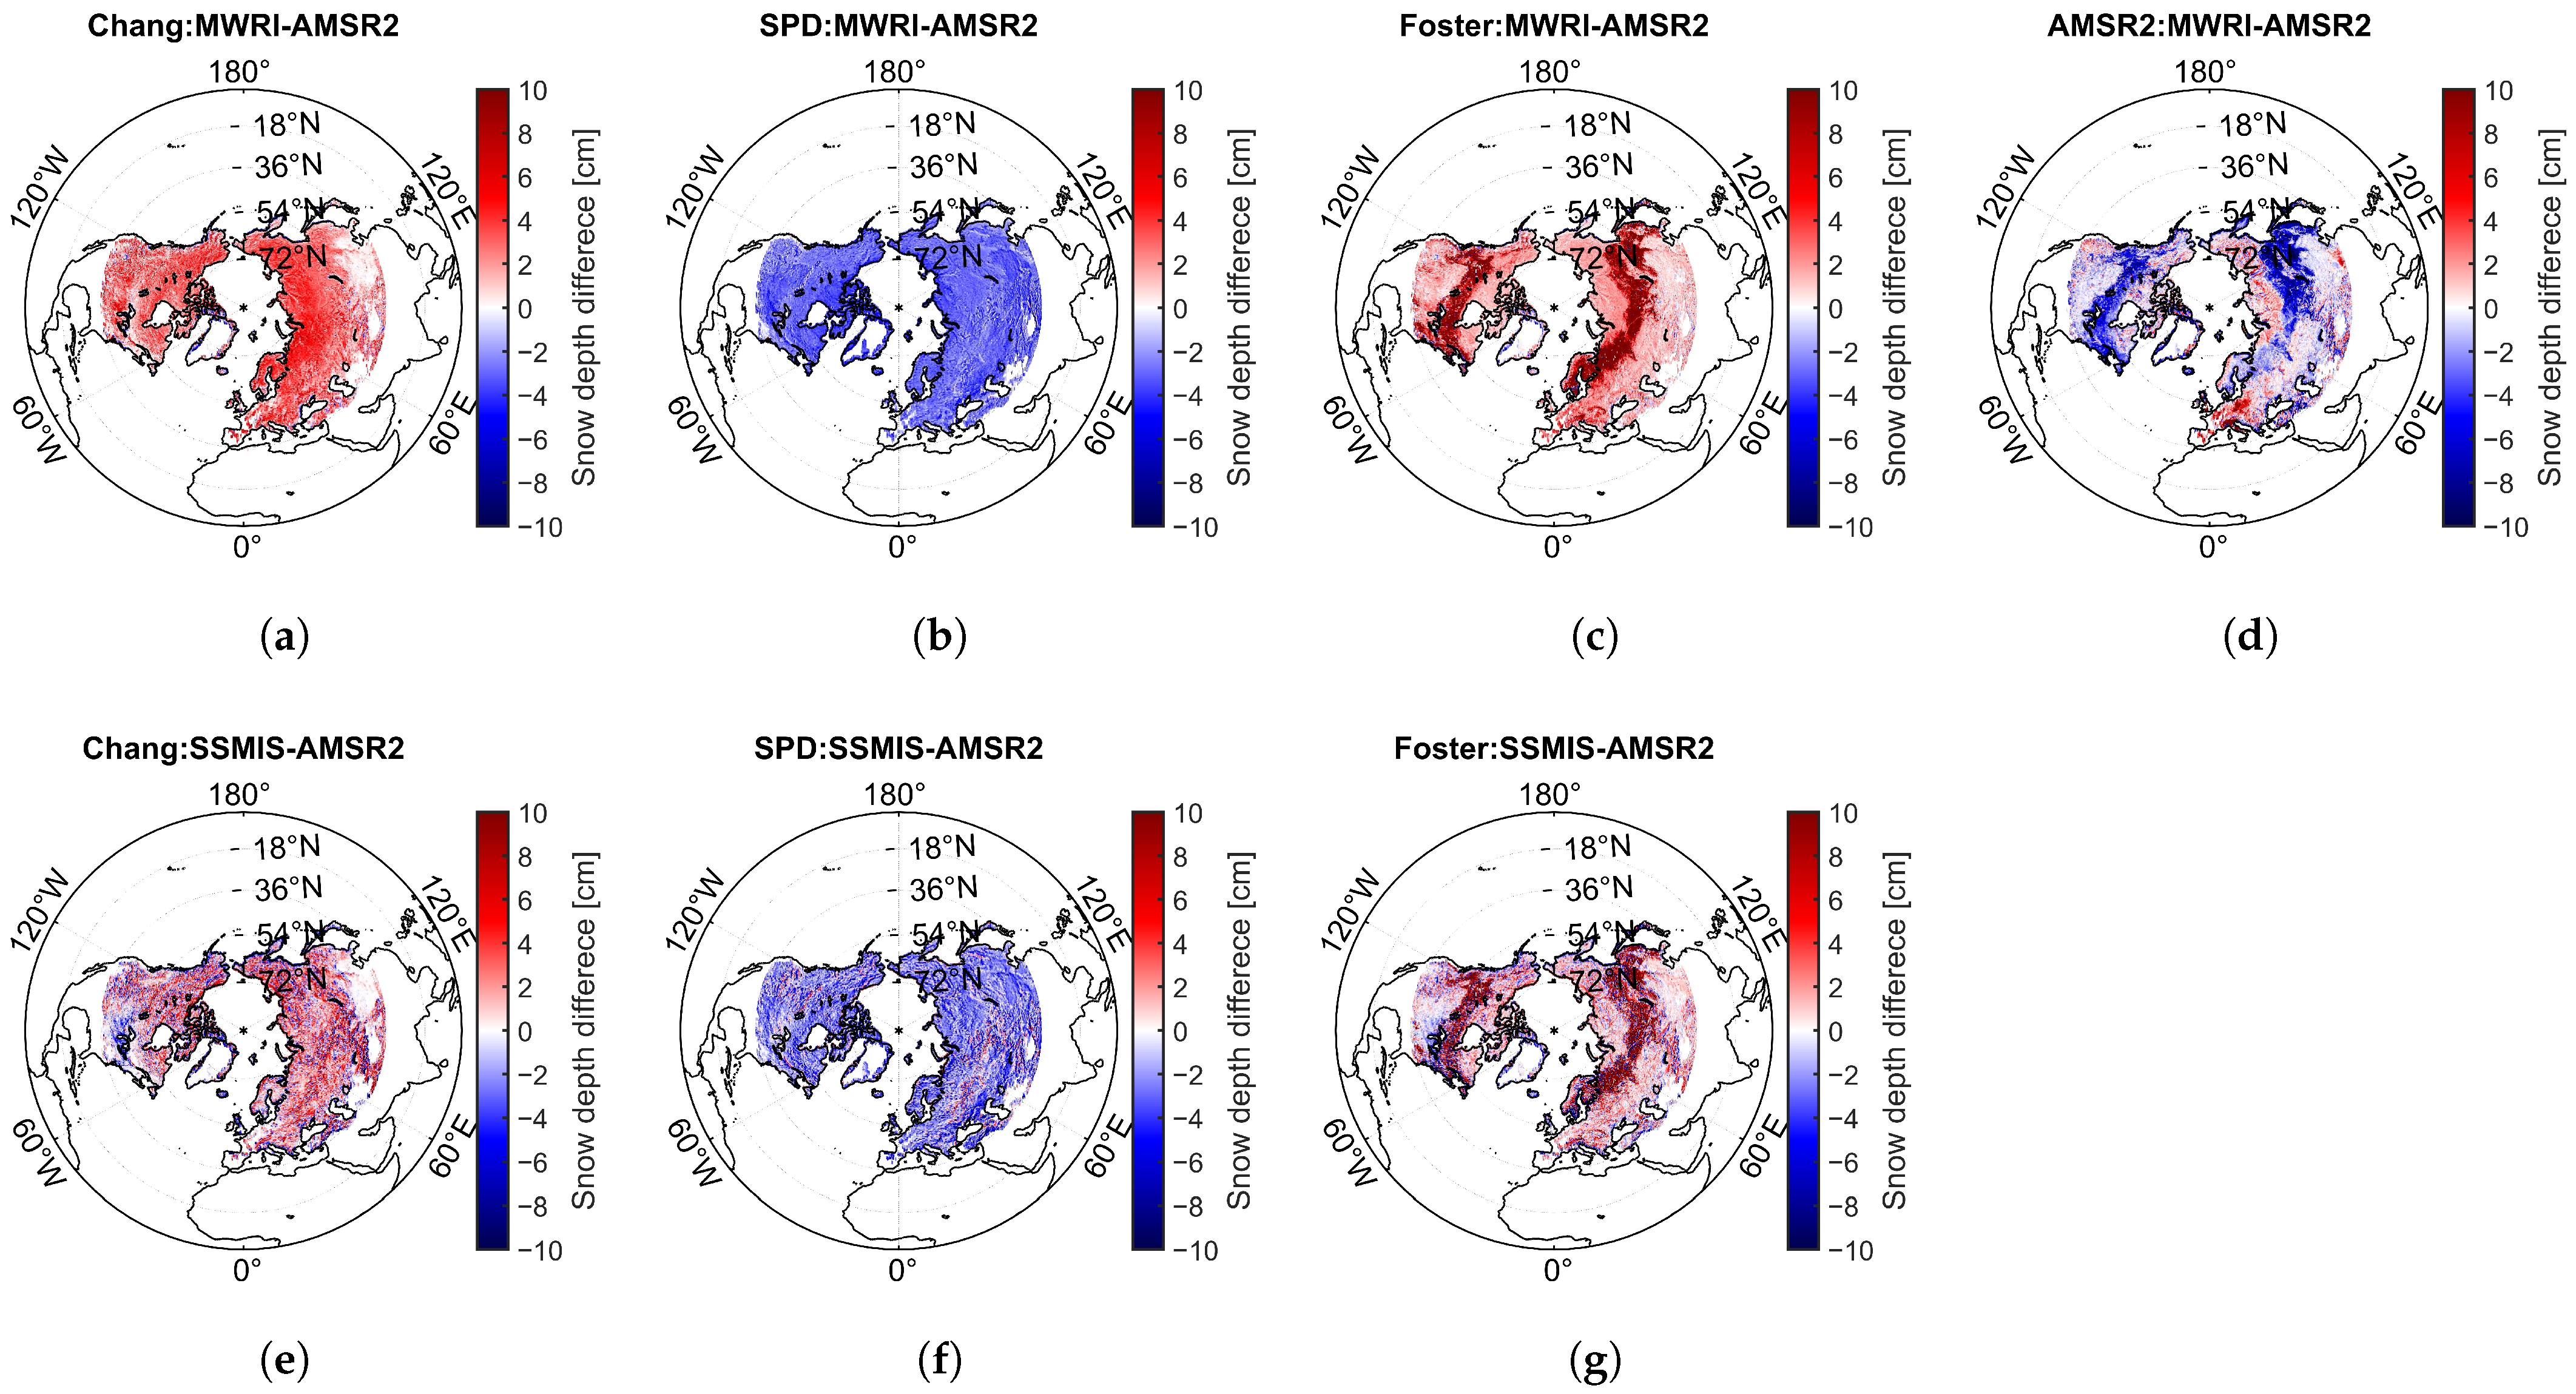
Figure 7 displays the SDDs retrieved using global snow depth retrieval algorithms based on different sensor data. The results show that, in most areas, the Chang and Foster algorithms exhibit positive biases in snow depth differences between various brightness temperature retrievals, while the SPD algorithm shows a negative bias. The AMSR2 algorithm shows both positive and negative biases. Notably, the regions with significant differences in snow depth retrievals using the Foster algorithm are mainly concentrated between 54°N and 72°N, suggesting that forest coverage might have a substantial impact on the algorithms.
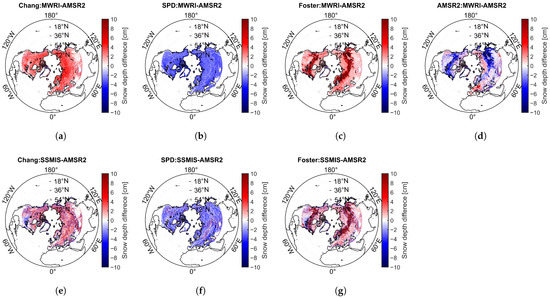
Figure 7.
Spatial distribution of mean snow depth differences estimated from different sensor datasets using the (a,e) Chang, (b,f) SPD, (c,g) Foster, and (d) AMSR2 algorithms in the Northern Hemisphere (>35°N). (a–d) represent the differences between snow depth retrieved from FY-3D/MWRI and AMSR2. (e–g) represent the differences between snow depth retrieved from DMSP-F18/SSMIS and AMSR2.
Table 5 summarizes the mean and std of SDDs between snow depth estimates from different sensors in North Hemisphere land (>35°N). The results show that, for both the Chang and SPD algorithms, the SDDs between MWRI and AMSR2 () exhibit smaller standard deviations but larger mean differences compared to those between SSMIS and AMSR2 (). In contrast, the snow depth estimates derived using the Foster algorithm show large discrepancies between different data sources, with a standard deviation of 16.84 cm between MWRI- and AMSR2-based results.

Table 5.
Snow depth differences derived from global snow depth retrieval algorithms using different brightness temperature data (DMSP-F18/SSMIS vs. AMSR2, and FY-3D/MWRI vs. AMSR2) in the Northern Hemisphere land (>35°N).
Figure 8 displays the snow depth differences in China derived from DMSP-F18/SSMIS and AMSR2 brightness temperature data using the same retrieval algorithm, with results shown for the Chang, SPD, Foster, and WESTDC methods. The results show that all algorithms except the SPD algorithm exhibit positive biases for . The Chang, Foster, and WESTDC algorithms all generally show positive biases. Among these, the Foster algorithms show a significant positive bias in the northeastern forest region.

Figure 8.
Spatial distribution of mean snow depth differences retrieved using (a) Chang, (b) SPD, (c) Foster, and (d) WESTDC algorithms estimated from DMSP-F18/SSMIS and AMSR2 brightness temperature data in China.
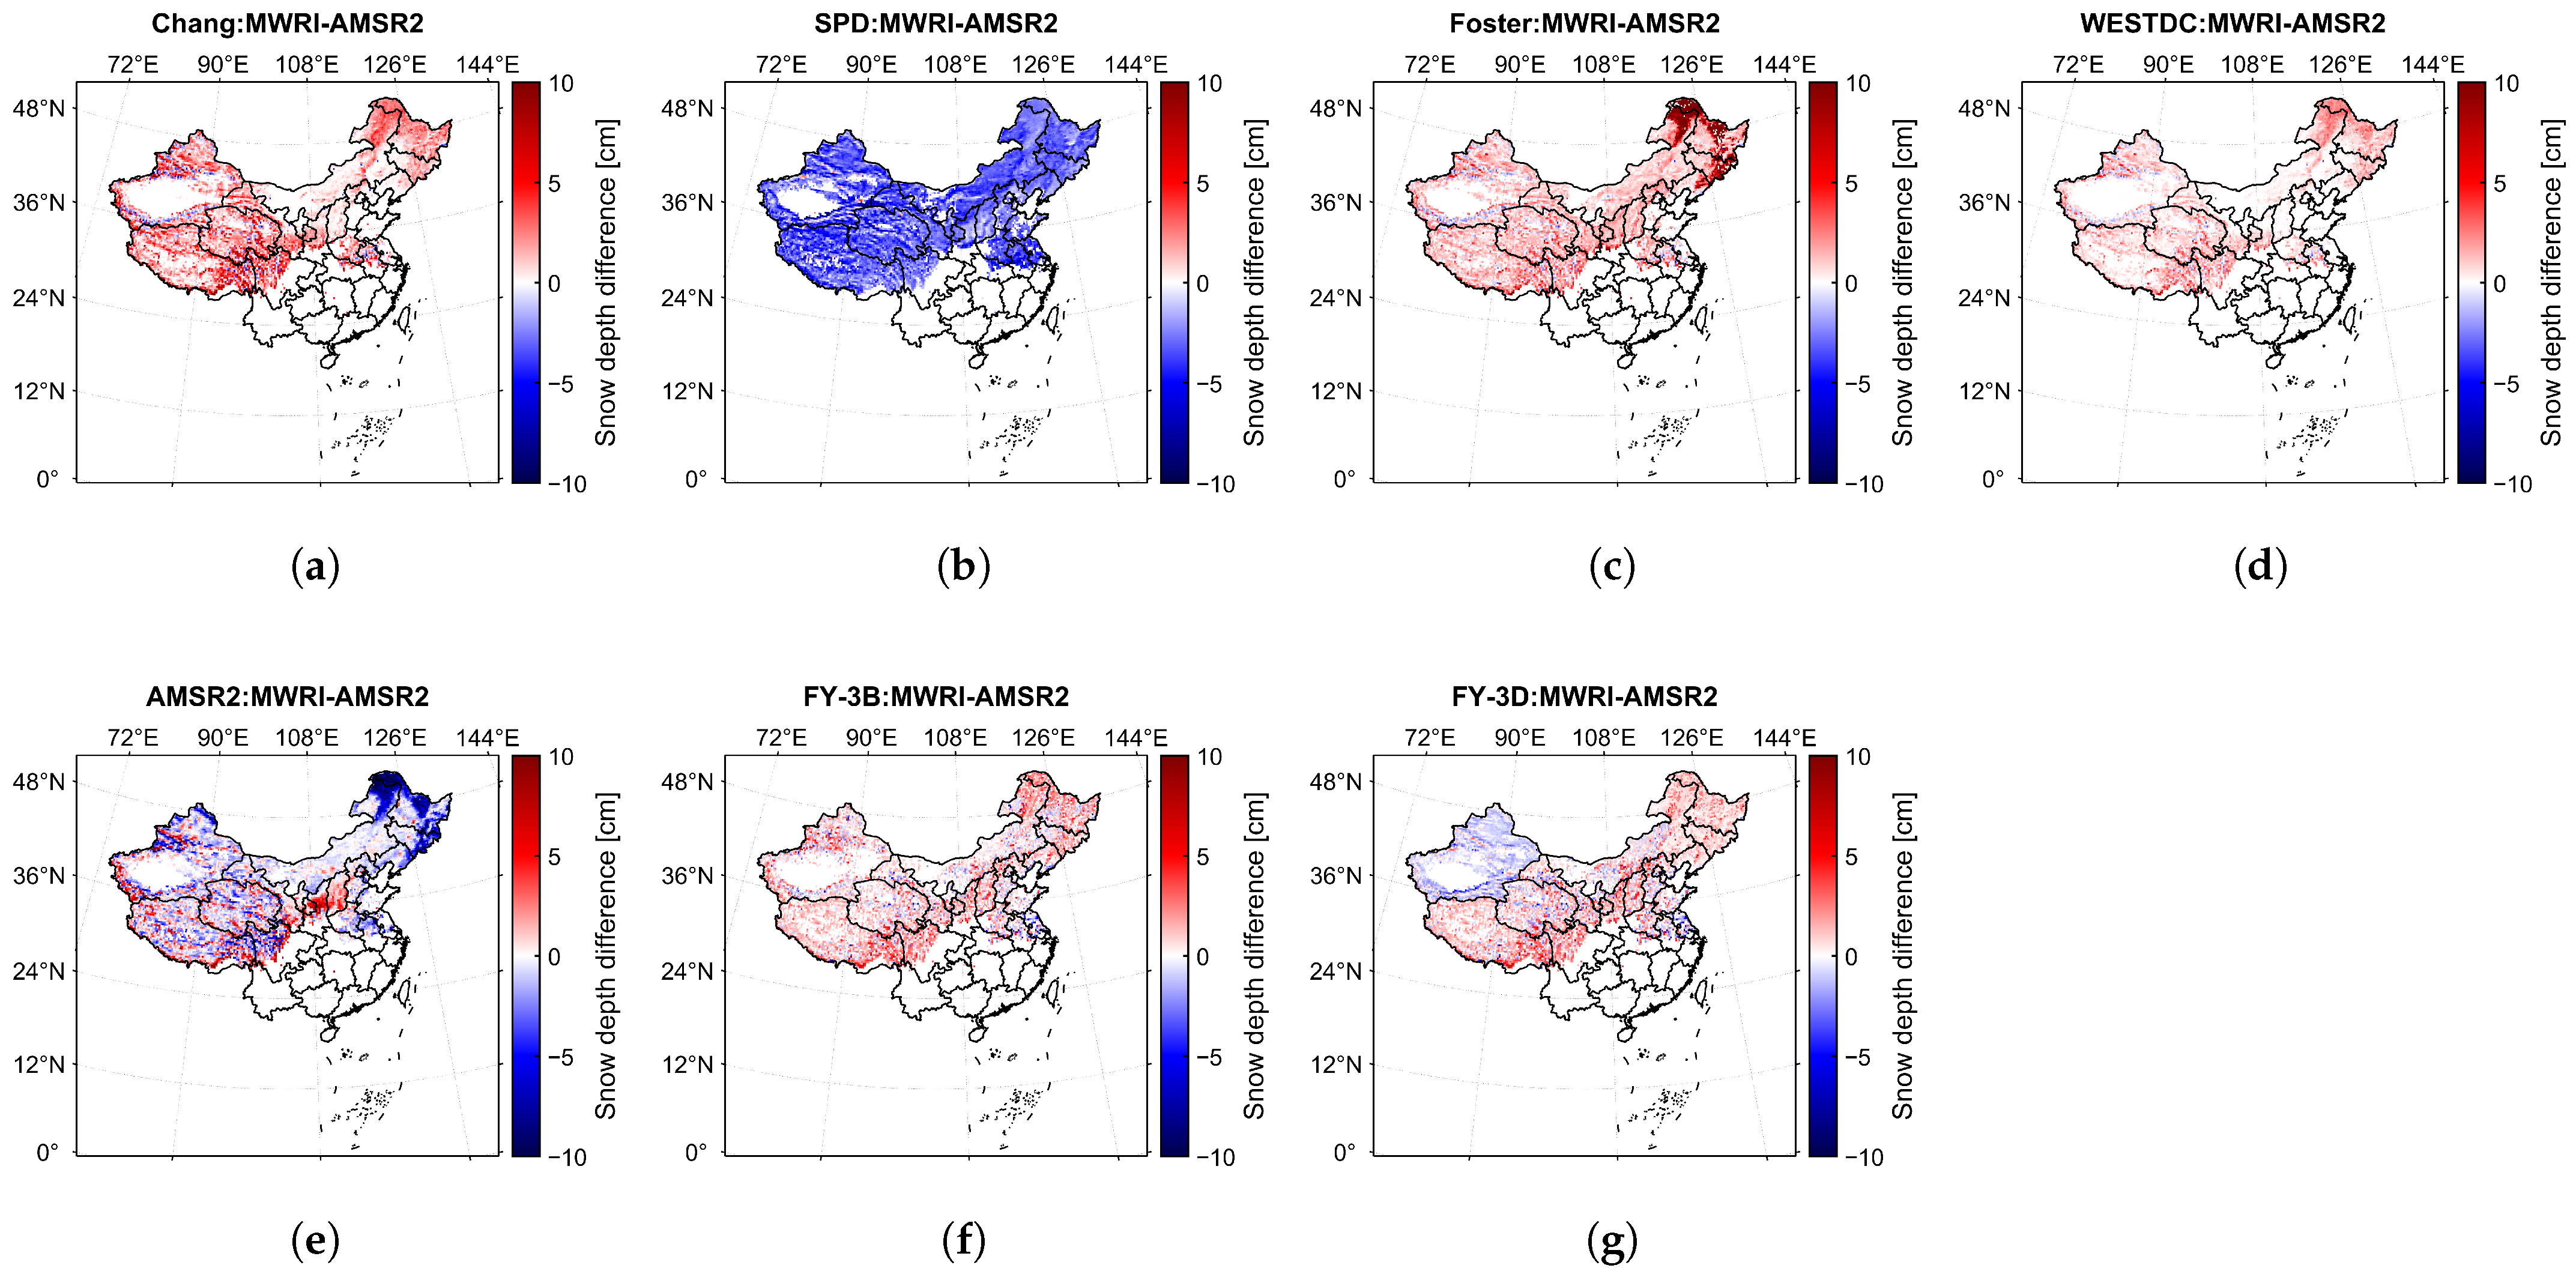
The spatial distribution of snow depth differences between MWRI- and AMSR2-derived estimates over China is presented in Figure 9, where the same empirical algorithm was used to retrieve snow depth from both datasets. The retrieval results from the Chang, SPD, Foster, and WESTDC algorithms for and exhibit similar patterns. In contrast, the AMSR2 algorithm produces both positive and negative snow depth biases, with negative biases primarily observed in the northeastern region. Finally, the FY-3B algorithm generally shows small positive biases, whereas the FY-3D algorithm exhibits significant negative biases in the Xinjiang region, which may be attributed to differences in algorithm performance specific to that region [26].
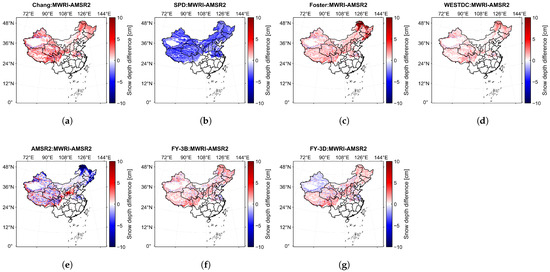
Figure 9.
Spatial distribution of snow depth differences retrieved using empirical algorithms based on FY-3D/MWRI and AMSR2 brightness temperature data in China. (a–g) represent Chang, SPD, Foster, WESTDC, AMSR2, FY-3B, and FY-3D algorithms, respectively.
Table 6 summarizes the mean and std of SDDs between snow depth estimates from different sensors in China. For , the WESTDC algorithm yields the smallest absolute mean bias (0.34 cm), followed by the Chang algorithm (0.76 cm), while the SPD algorithm has the largest absolute mean bias (2.57 cm). However, in terms of standard deviation, the WESTDC algorithm exhibits the smallest value (1.71 cm), whereas the SPD (2.35 cm) and Foster (11.41 cm) algorithms show relatively larger variations. For , the Foster algorithm produces the largest absolute mean bias, while the AMSR2 algorithm shows the smallest. Similarly, the Foster algorithm exhibit large standard deviation (11.18 cm). In contrast, the AMSR2, Chang, FY-3B, and FY-3D algorithms yield relatively smaller absolute mean biases. The SPD algorithm, in particular, demonstrates a relatively small standard deviation (1.44 cm) in snow depth differences compared to other global snow depth algorithms. Overall, the China-specific algorithm exhibits lower sensitivity to brightness temperature differences compared to the global algorithms.

Table 6.
Snow depth differences derived from snow depth retrieval algorithms using different brightness temperature data (DMSP-F18/SSMIS vs. AMSR2, and FY-3D/MWRI vs. AMSR2) in China.
3.3. Sensitivity of Snow Depth Retrieval Algorithms to Environmental and Snow Conditions
3.3.1. Influence of Seasonal Snow Period on Snow Depth Retrieval Algorithms Sensitivity
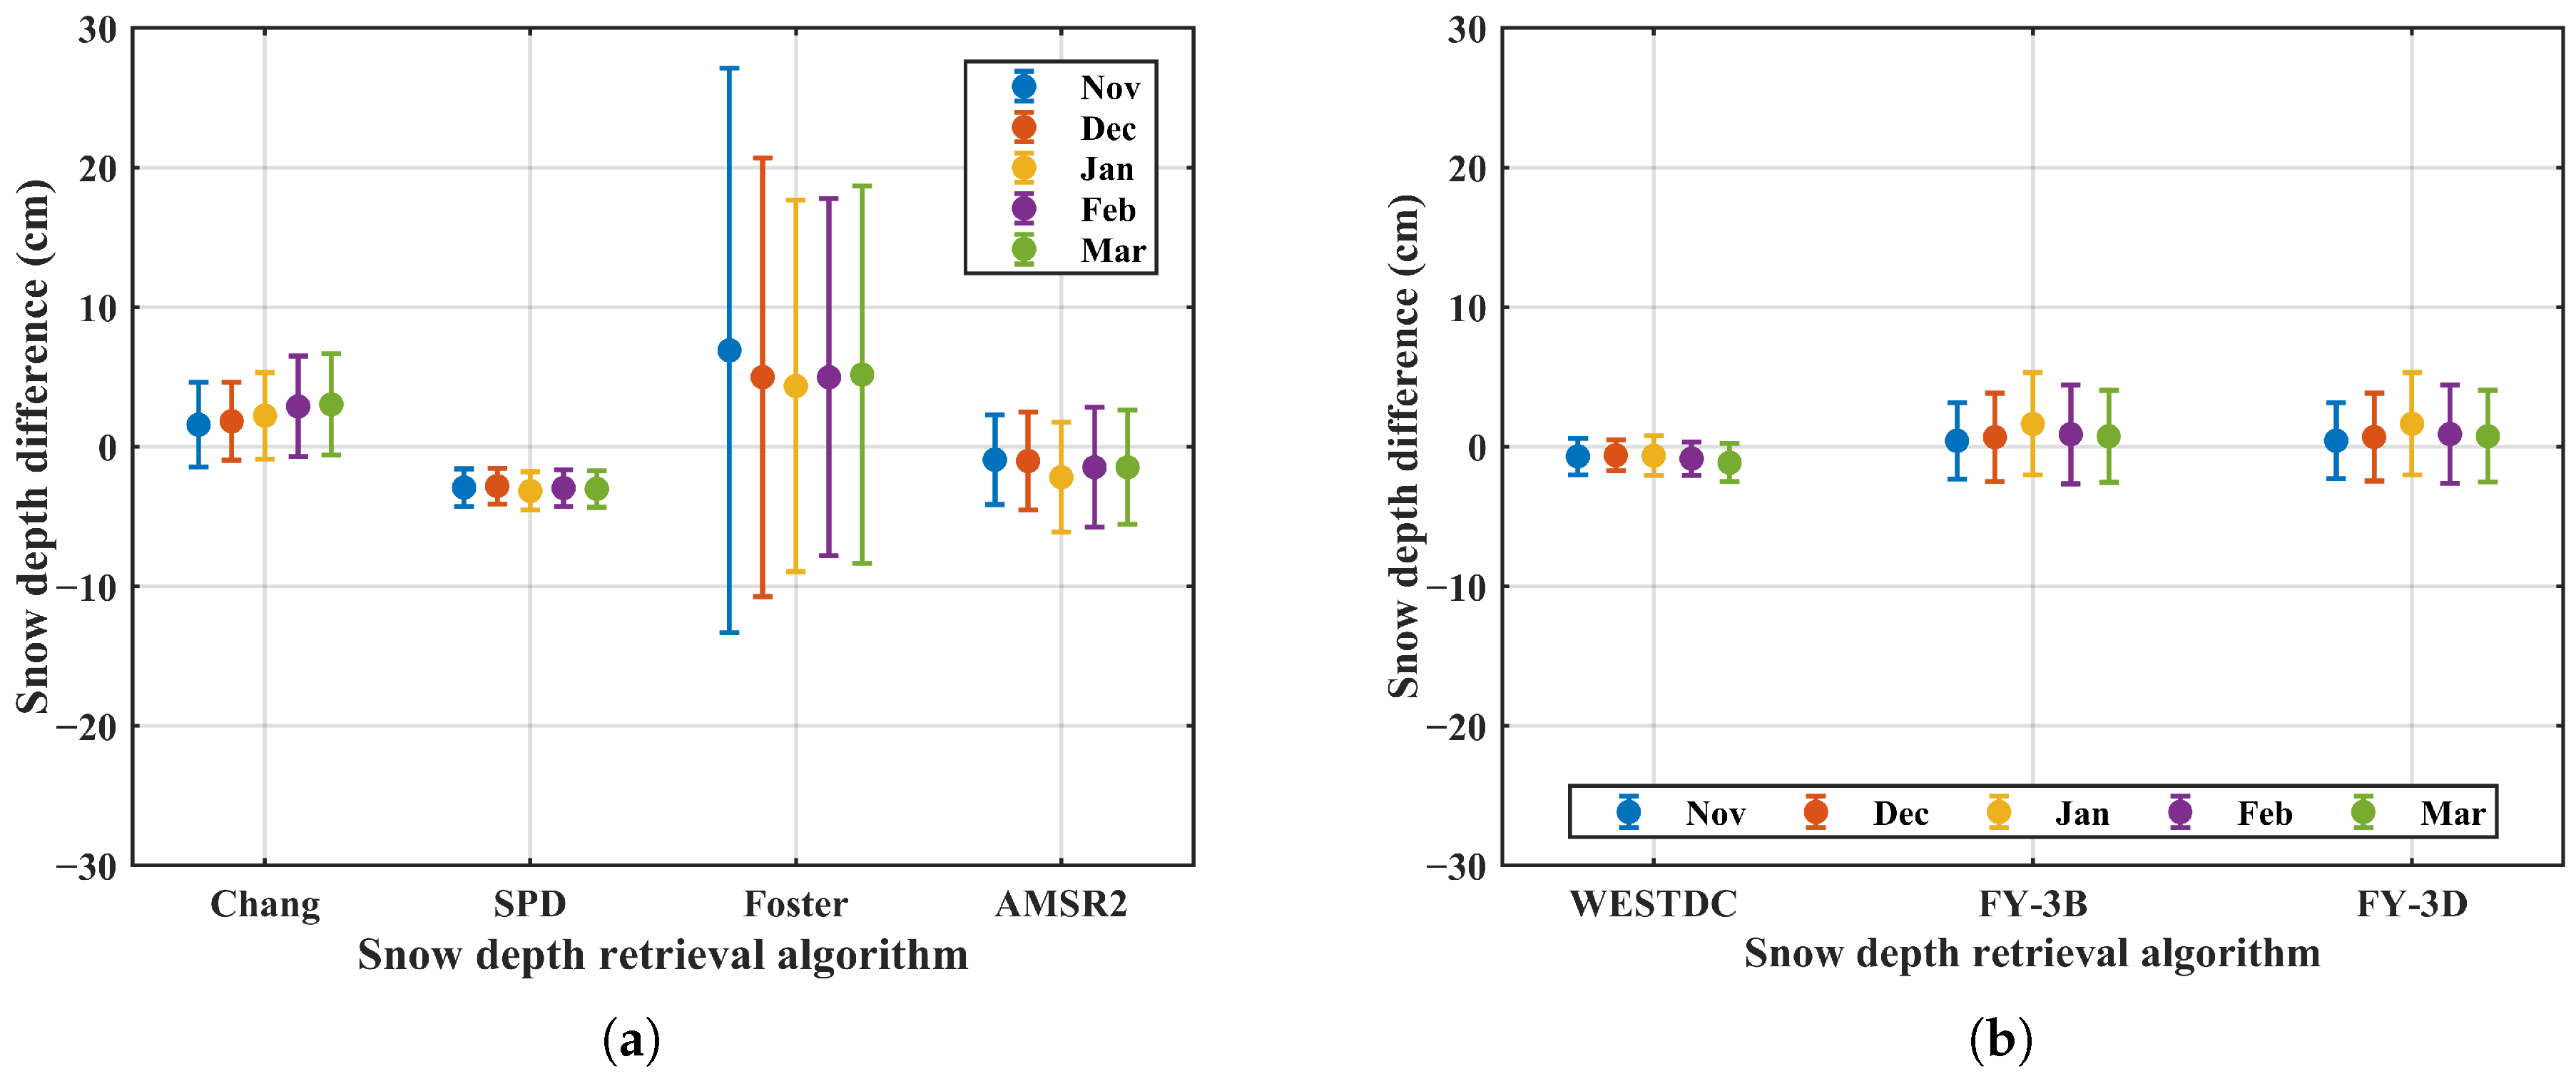
Figure 10 presents the monthly snow depth differences retrieved using MWRI and AMSR2 sensors. The results indicate that the SPD and WESTDC algorithms produce relatively stable snow depth differences across different months, with the standard deviation less than 3 cm. This stability may be attributed to the polarization difference approach of the SPD algorithm and the combined use of brightness temperature gradient and forest correction in the WESTDC algorithm [17,23]. In contrast, the Chang, AMSR2, FY-3B, and FY-3D algorithms show more consistent performance in November and December compared to January, February, and March, which might be explained by the shallower snowpack early in the season, leading to smaller retrieval differences. Conversely, the Foster algorithm exhibits more stable snow depth differences in January, February, and March than in November and December, which might be influenced by the forest [22]. Specifically, the snow cover is relatively thin in November and December, resulting in a larger proportion of exposed forest and a stronger forest influence, which increases retrieval errors. In contrast, the snow is relatively thick and more continuous in January and February, leading to more stable snow depth retrievals.
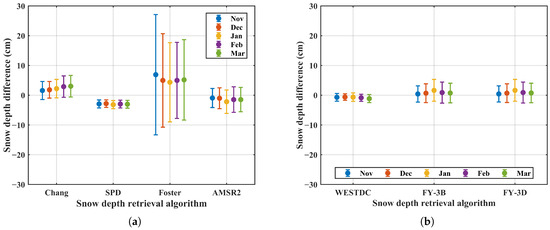
Figure 10.
Monthly snow depth differences retrieved using MWRI and AMSR2 sensors: (a) global retrieval algorithms; (b) China algorithms.
3.3.2. Influence of Land Cover on Snow Depth Retrieval Algorithms Sensitivity
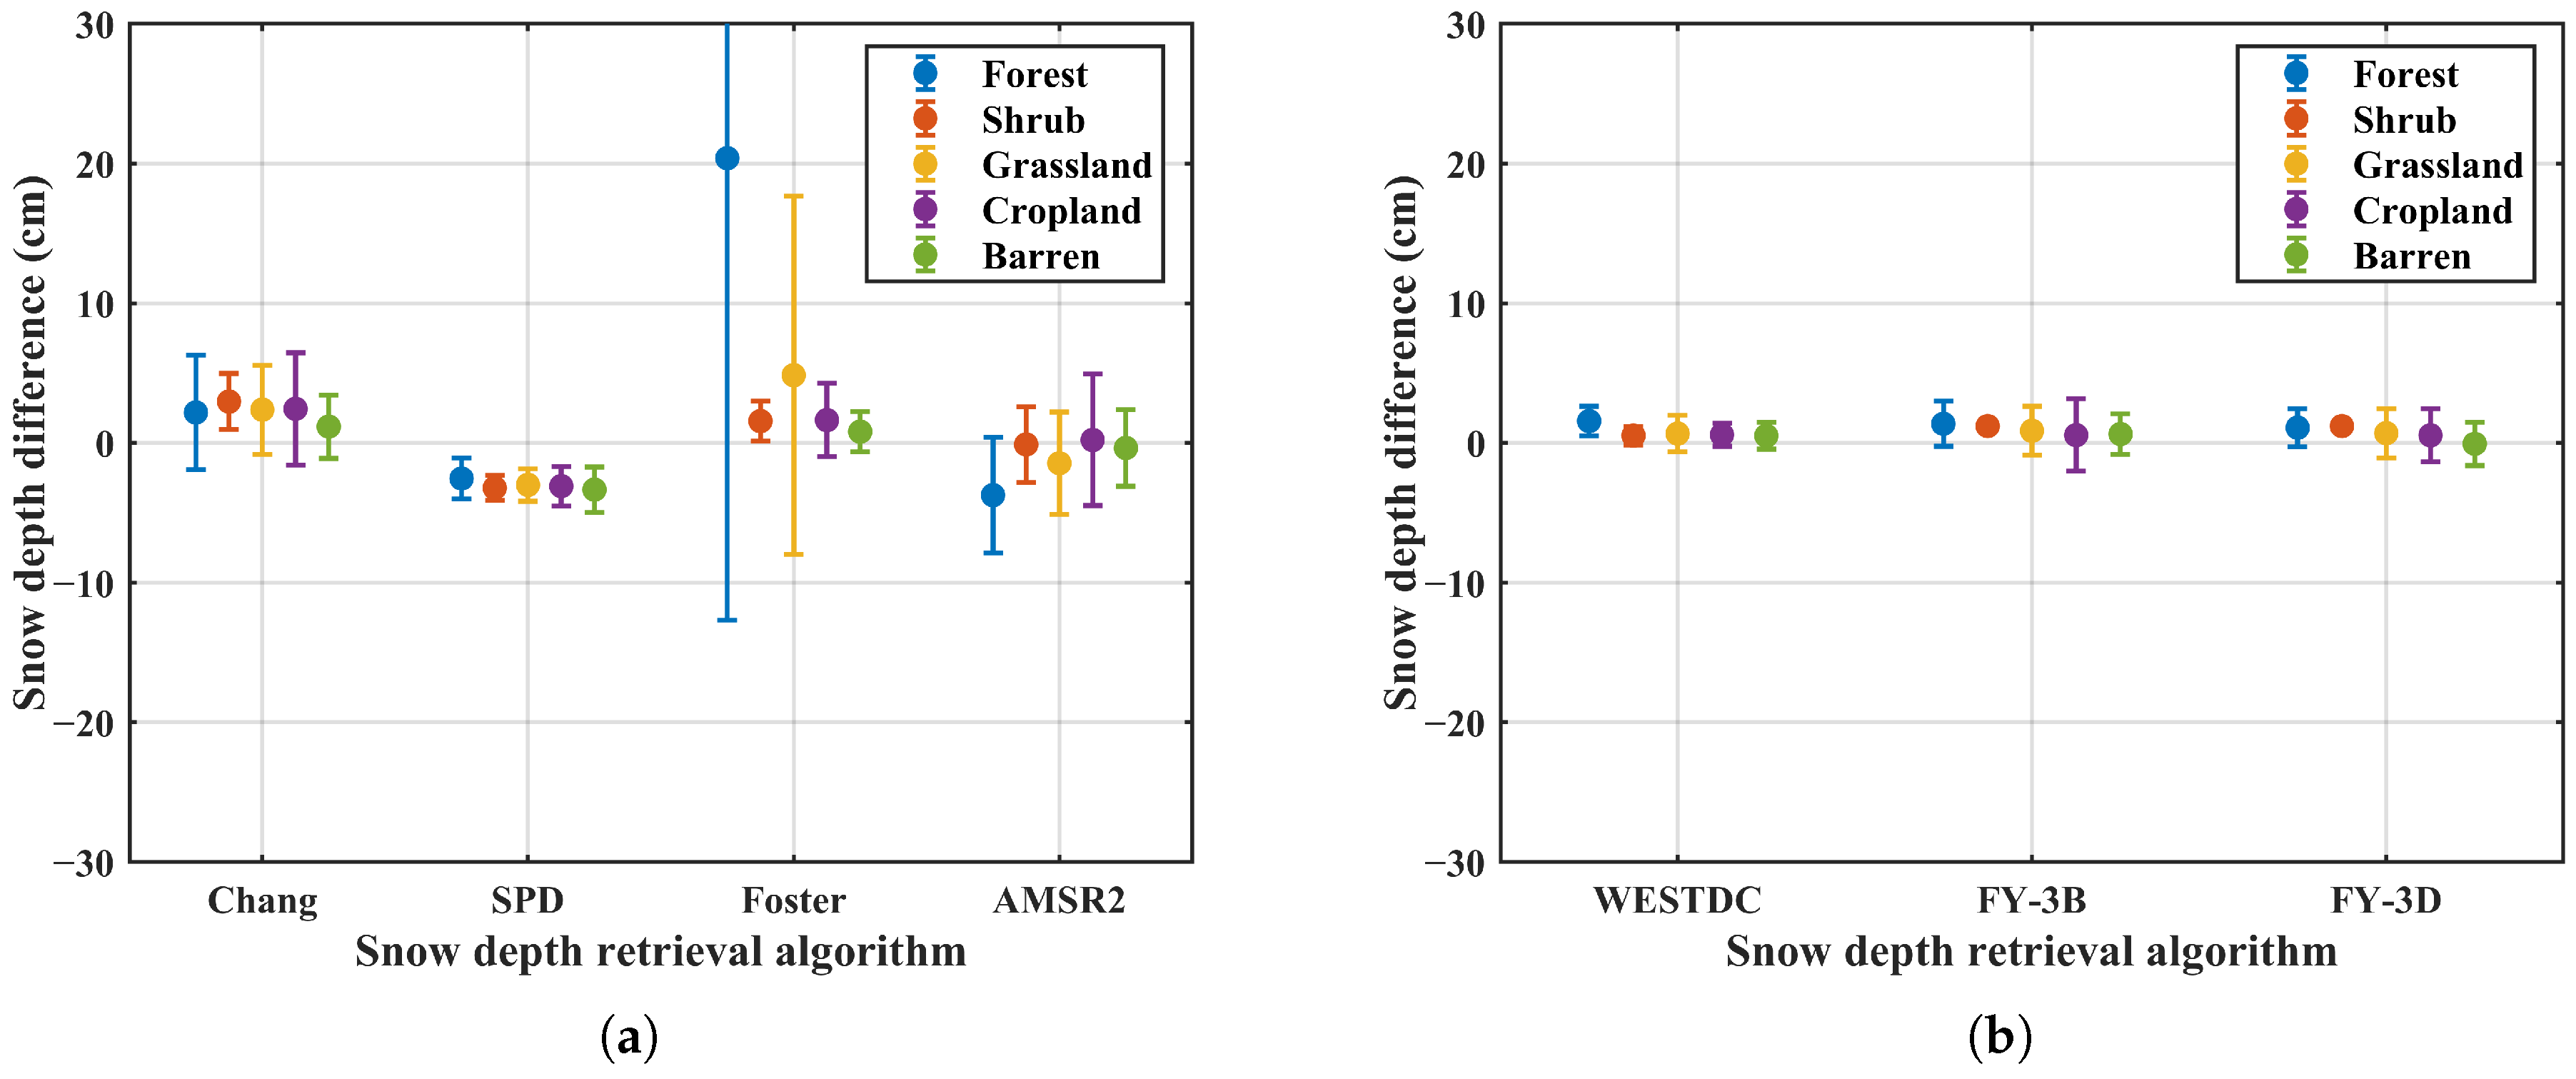
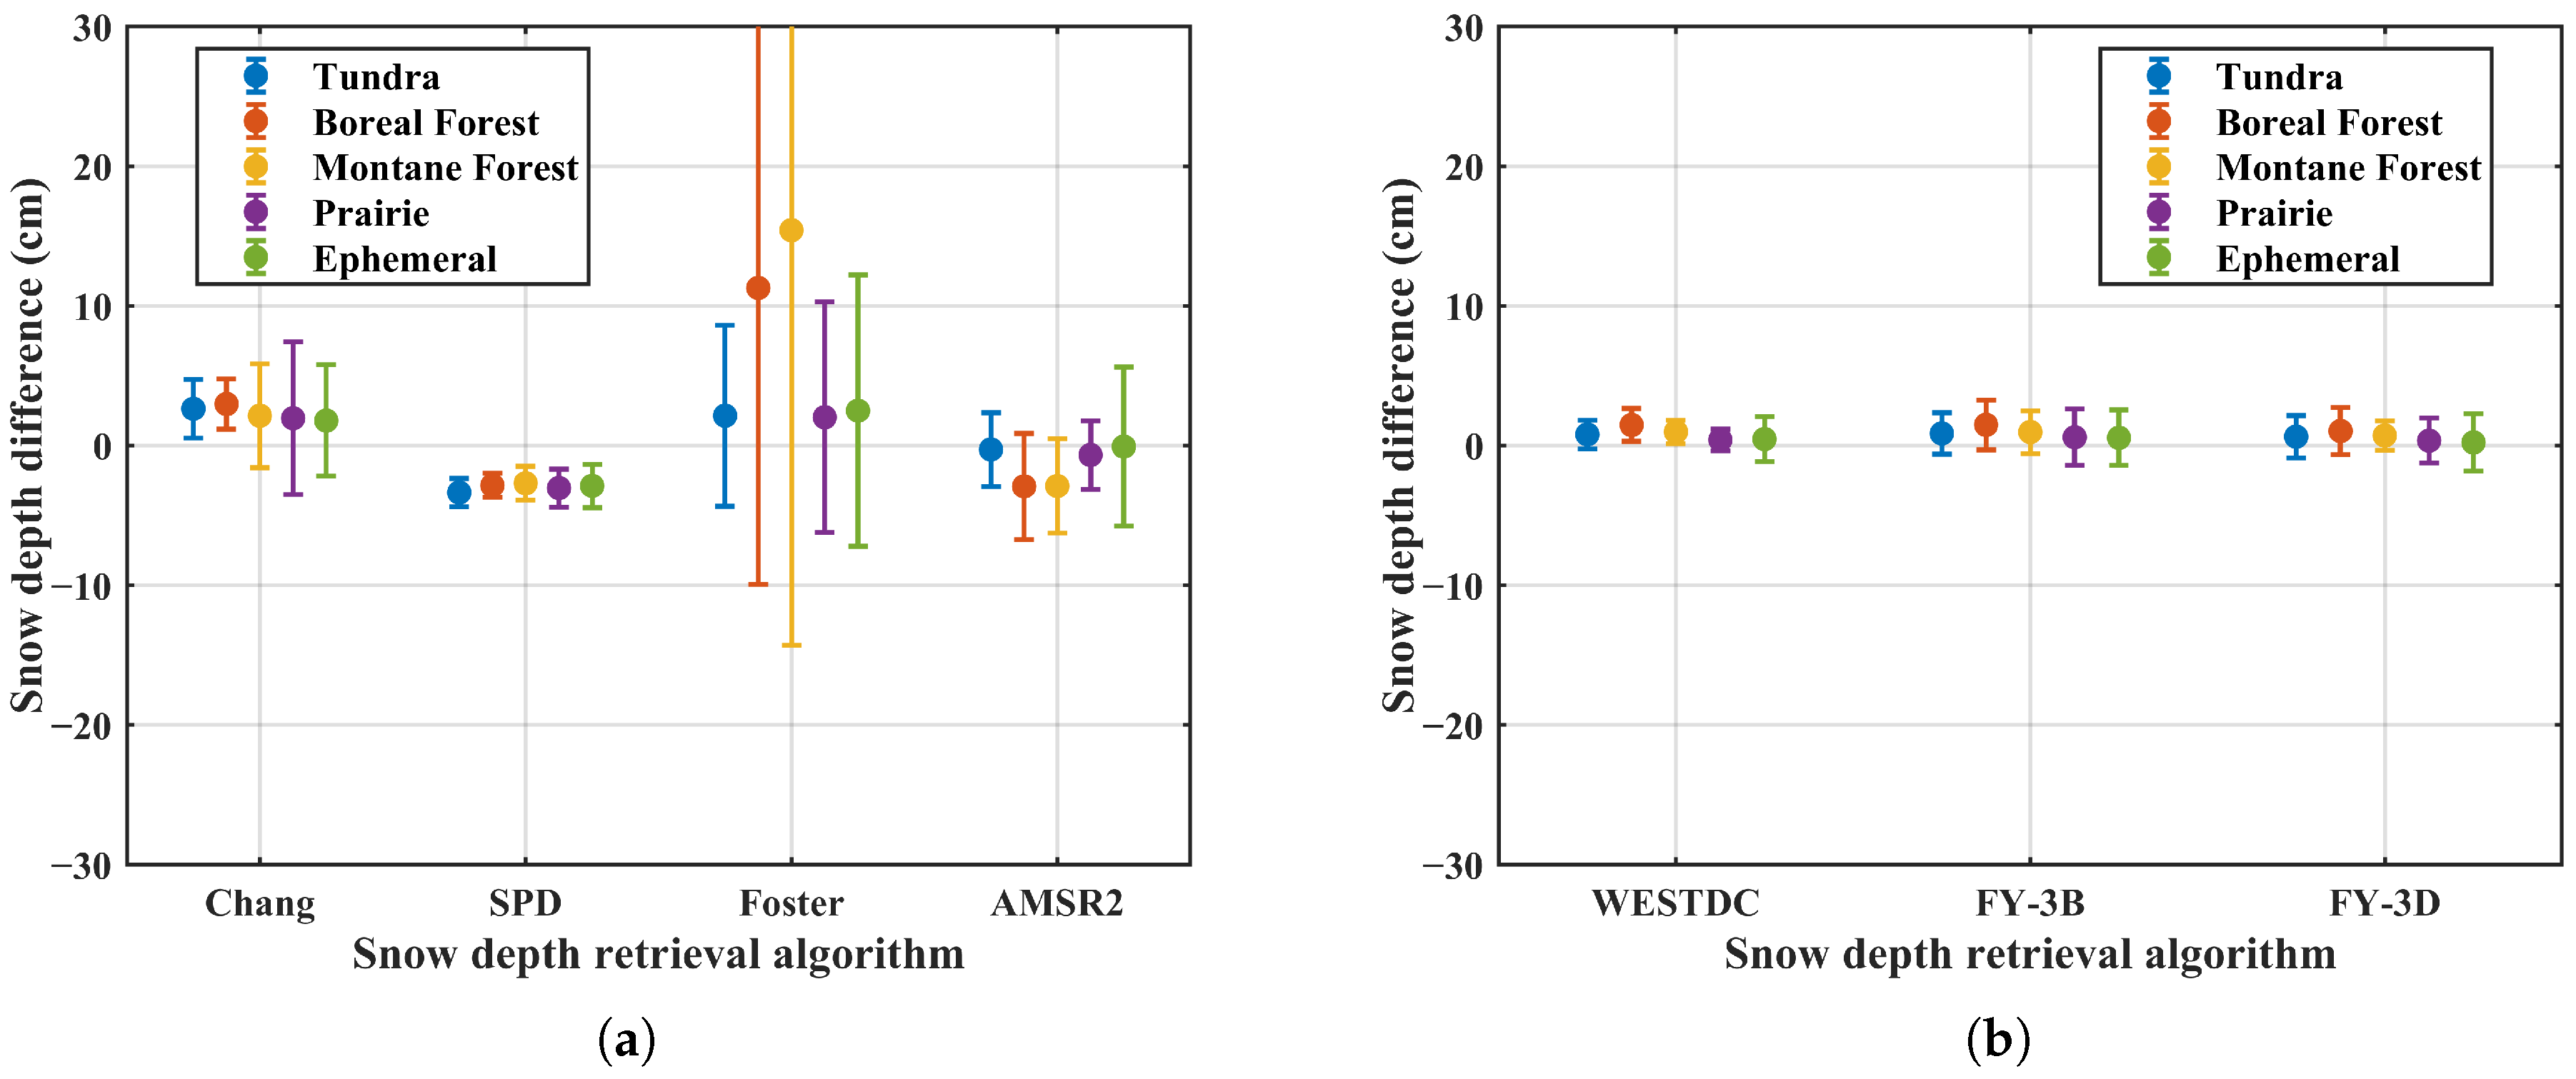
Figure 11 presents the snow depth differences retrieved using MWRI and AMSR2 under different land cover types. Overall, the SPD and China-specific algorithms exhibit relatively stable snow depth differences across various land cover types, with the standard deviation less than 5 cm. The results indicate that all algorithms show lower sensitivity to brightness temperature differences in shrub land compared to other land cover types. In addition, barren land exhibits the second-lowest sensitivity. In contrast, the Foster algorithm demonstrates higher sensitivity to SDDs in forest areas, where the standard deviation exceeds 10 cm.
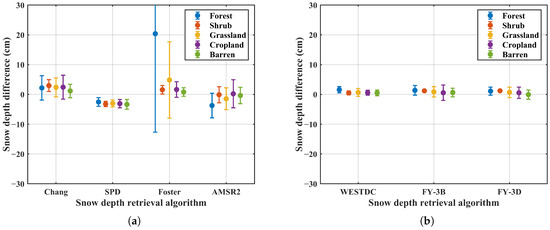
Figure 11.
Snow depth differences retrieved based on MWRI and AMSR2 under different land cover types. (a) Global algorithms, (b) China algorithms.
3.3.3. Influence of Seasonal Snow Classification on Snow Depth Retrieval Algorithms Sensitivity
Figure 12 shows the snow depth differences retrieved using MWRI and AMSR2 under different land snow classifications. Overall, the SPD and China-specific algorithms exhibit relatively stable snow depth differences across various snow classifications. For the Chang algorithm, lower sensitivity is observed in the Boreal Forest snow class, while higher sensitivity is found in the Prairie region. The Foster algorithm exhibits high sensitivity across forest-related snow classifications with the standard deviation exceeding 30 cm, likely due to its greater responsiveness to brightness temperature differences in forested areas. In contrast, the AMSR2 algorithm shows relatively lower sensitivity in the Prairie and Tundra snow types compared to other snow classifications.
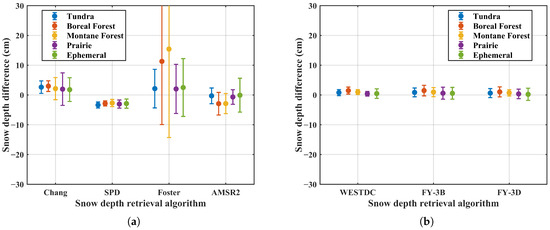
Figure 12.
Snow depth differences retrieved using MWRI and AMSR2 sensors under different snow classifications: (a) global retrieval algorithms; (b) China algorithms.
4. Discussion
4.1. Influence of Sensor Specification on the Brightness Temperature Difference Across Sensors
The generally larger brightness temperature differences (TBDs) observed between SSMIS and AMSR2 compared to those between MWRI and AMSR2 can be partly attributed to differences in sensor specifications, including bandwidth, frequency, observation angle, overpass time, and footprint.
AMSR2 and MWRI share nearly identical center frequencies and bandwidths, so their effective frequencies are almost the same [42]. In contrast, SSMIS has shifted center frequencies and wider bandwidths, which increase the effective frequency difference and lead to larger brightness temperature discrepancies; however, the resulting influence is relatively small (<1 K) [43,44].
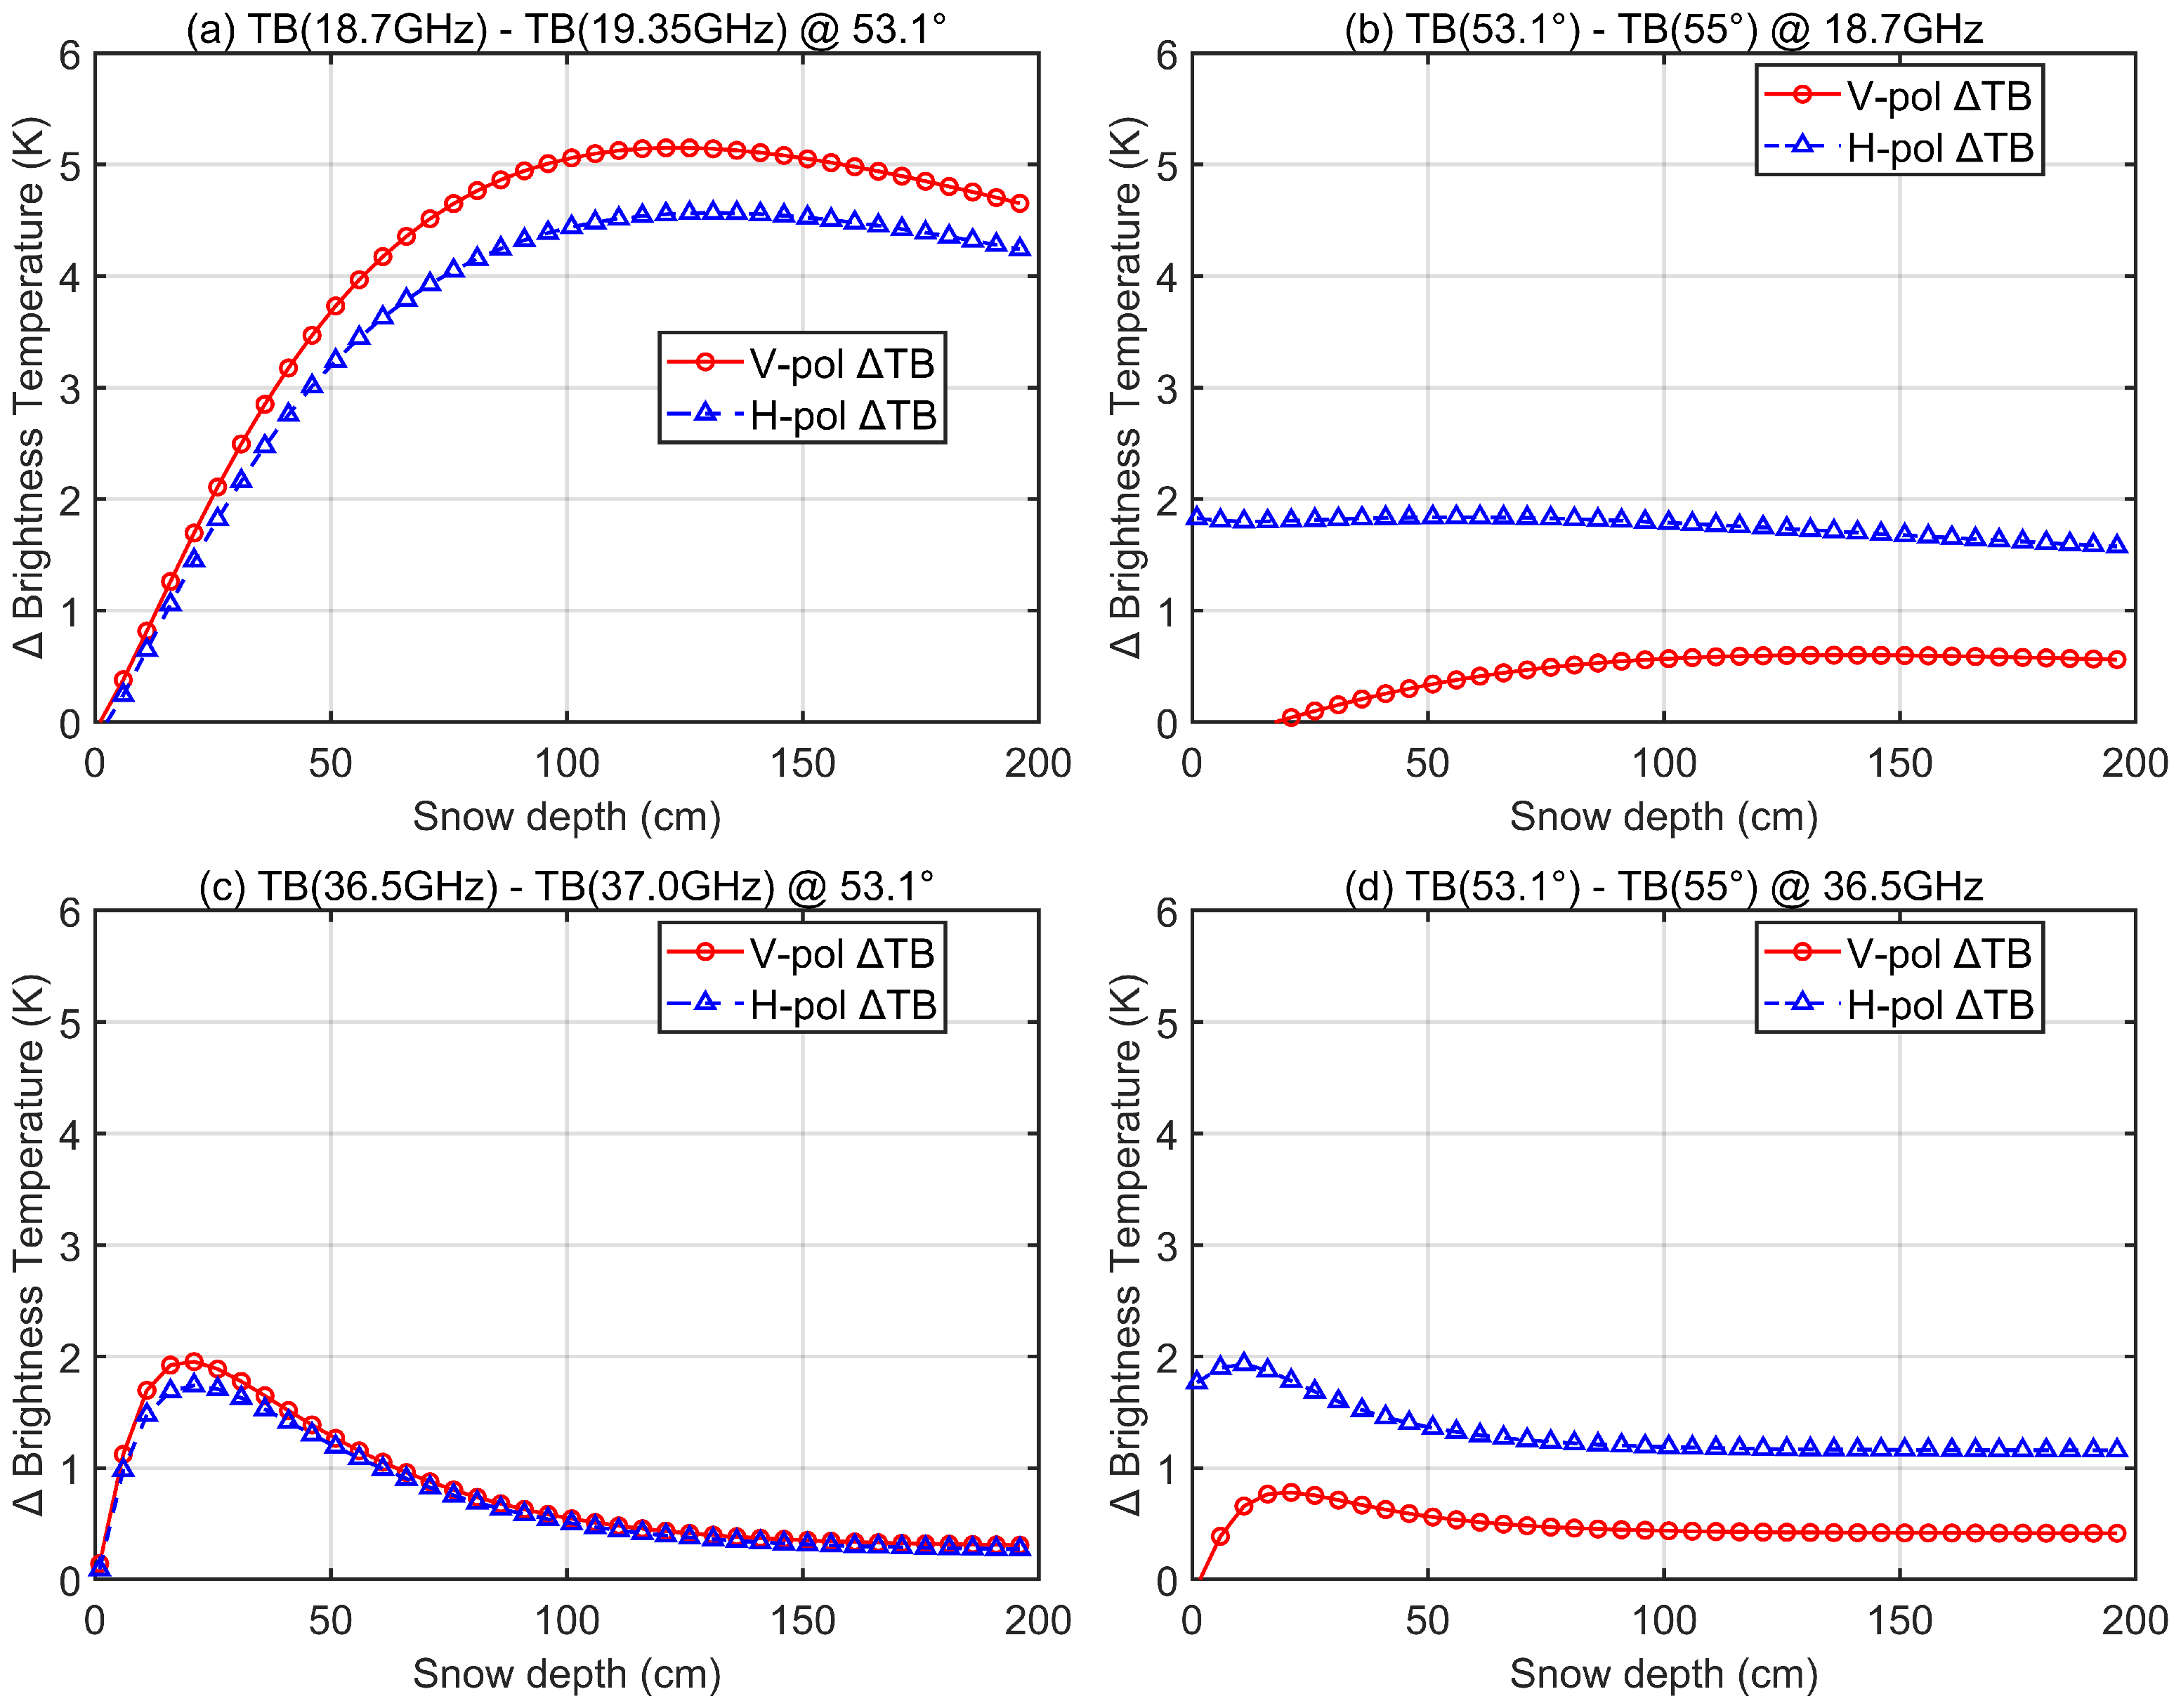
Figure 13 presents the simulated brightness temperature differences under different frequencies and observation angles. To isolate the effects of frequency and angle, other factors such as snow temperature were kept constant. Brightness temperatures were simulated using the snow microwave radiative transfer model DMRT, which has been widely validated and applied for snowpack studies [45,46]. The results show that the maximum brightness temperature difference between 18.7 GHz and 19.35 GHz reaches approximately 5 K for V-polarization and is slightly smaller for H-polarization. In comparison, the maximum brightness temperature difference between 36.5 GHz and 37.0 GHz is about 2 K. The effect of observation angle (53.1° versus 55°) is relatively modest, with maximum differences of ∼0.6 K for V-polarization and ∼1.8 K for H-polarization at 18.7 GHz, and less than 2 K at 36.5 GHz. These results indicate that brightness temperature differences due to frequency are more pronounced at lower frequencies, whereas angular effects are generally limited.
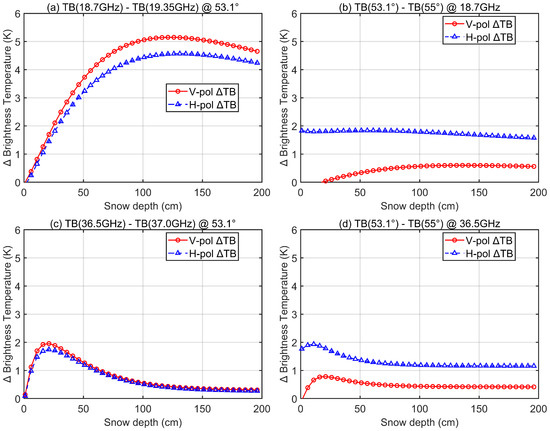
Figure 13.
Differences in brightness temperature simulated by the DMRT model. (a) TB(18.7 GHz)–TB(19.35 GHz) at 53.1°; (b) TB(53.1°)–TB(55°) at 18.7 GHz; (c) TB(36.5 GHz)–TB(37.0 GHz) at 53.1°; (d) TB(53.1°)–TB(55°) at 36.5 GHz. Panels (a,c) illustrate frequency-induced differences, while panels (b,d) show angle-induced differences.
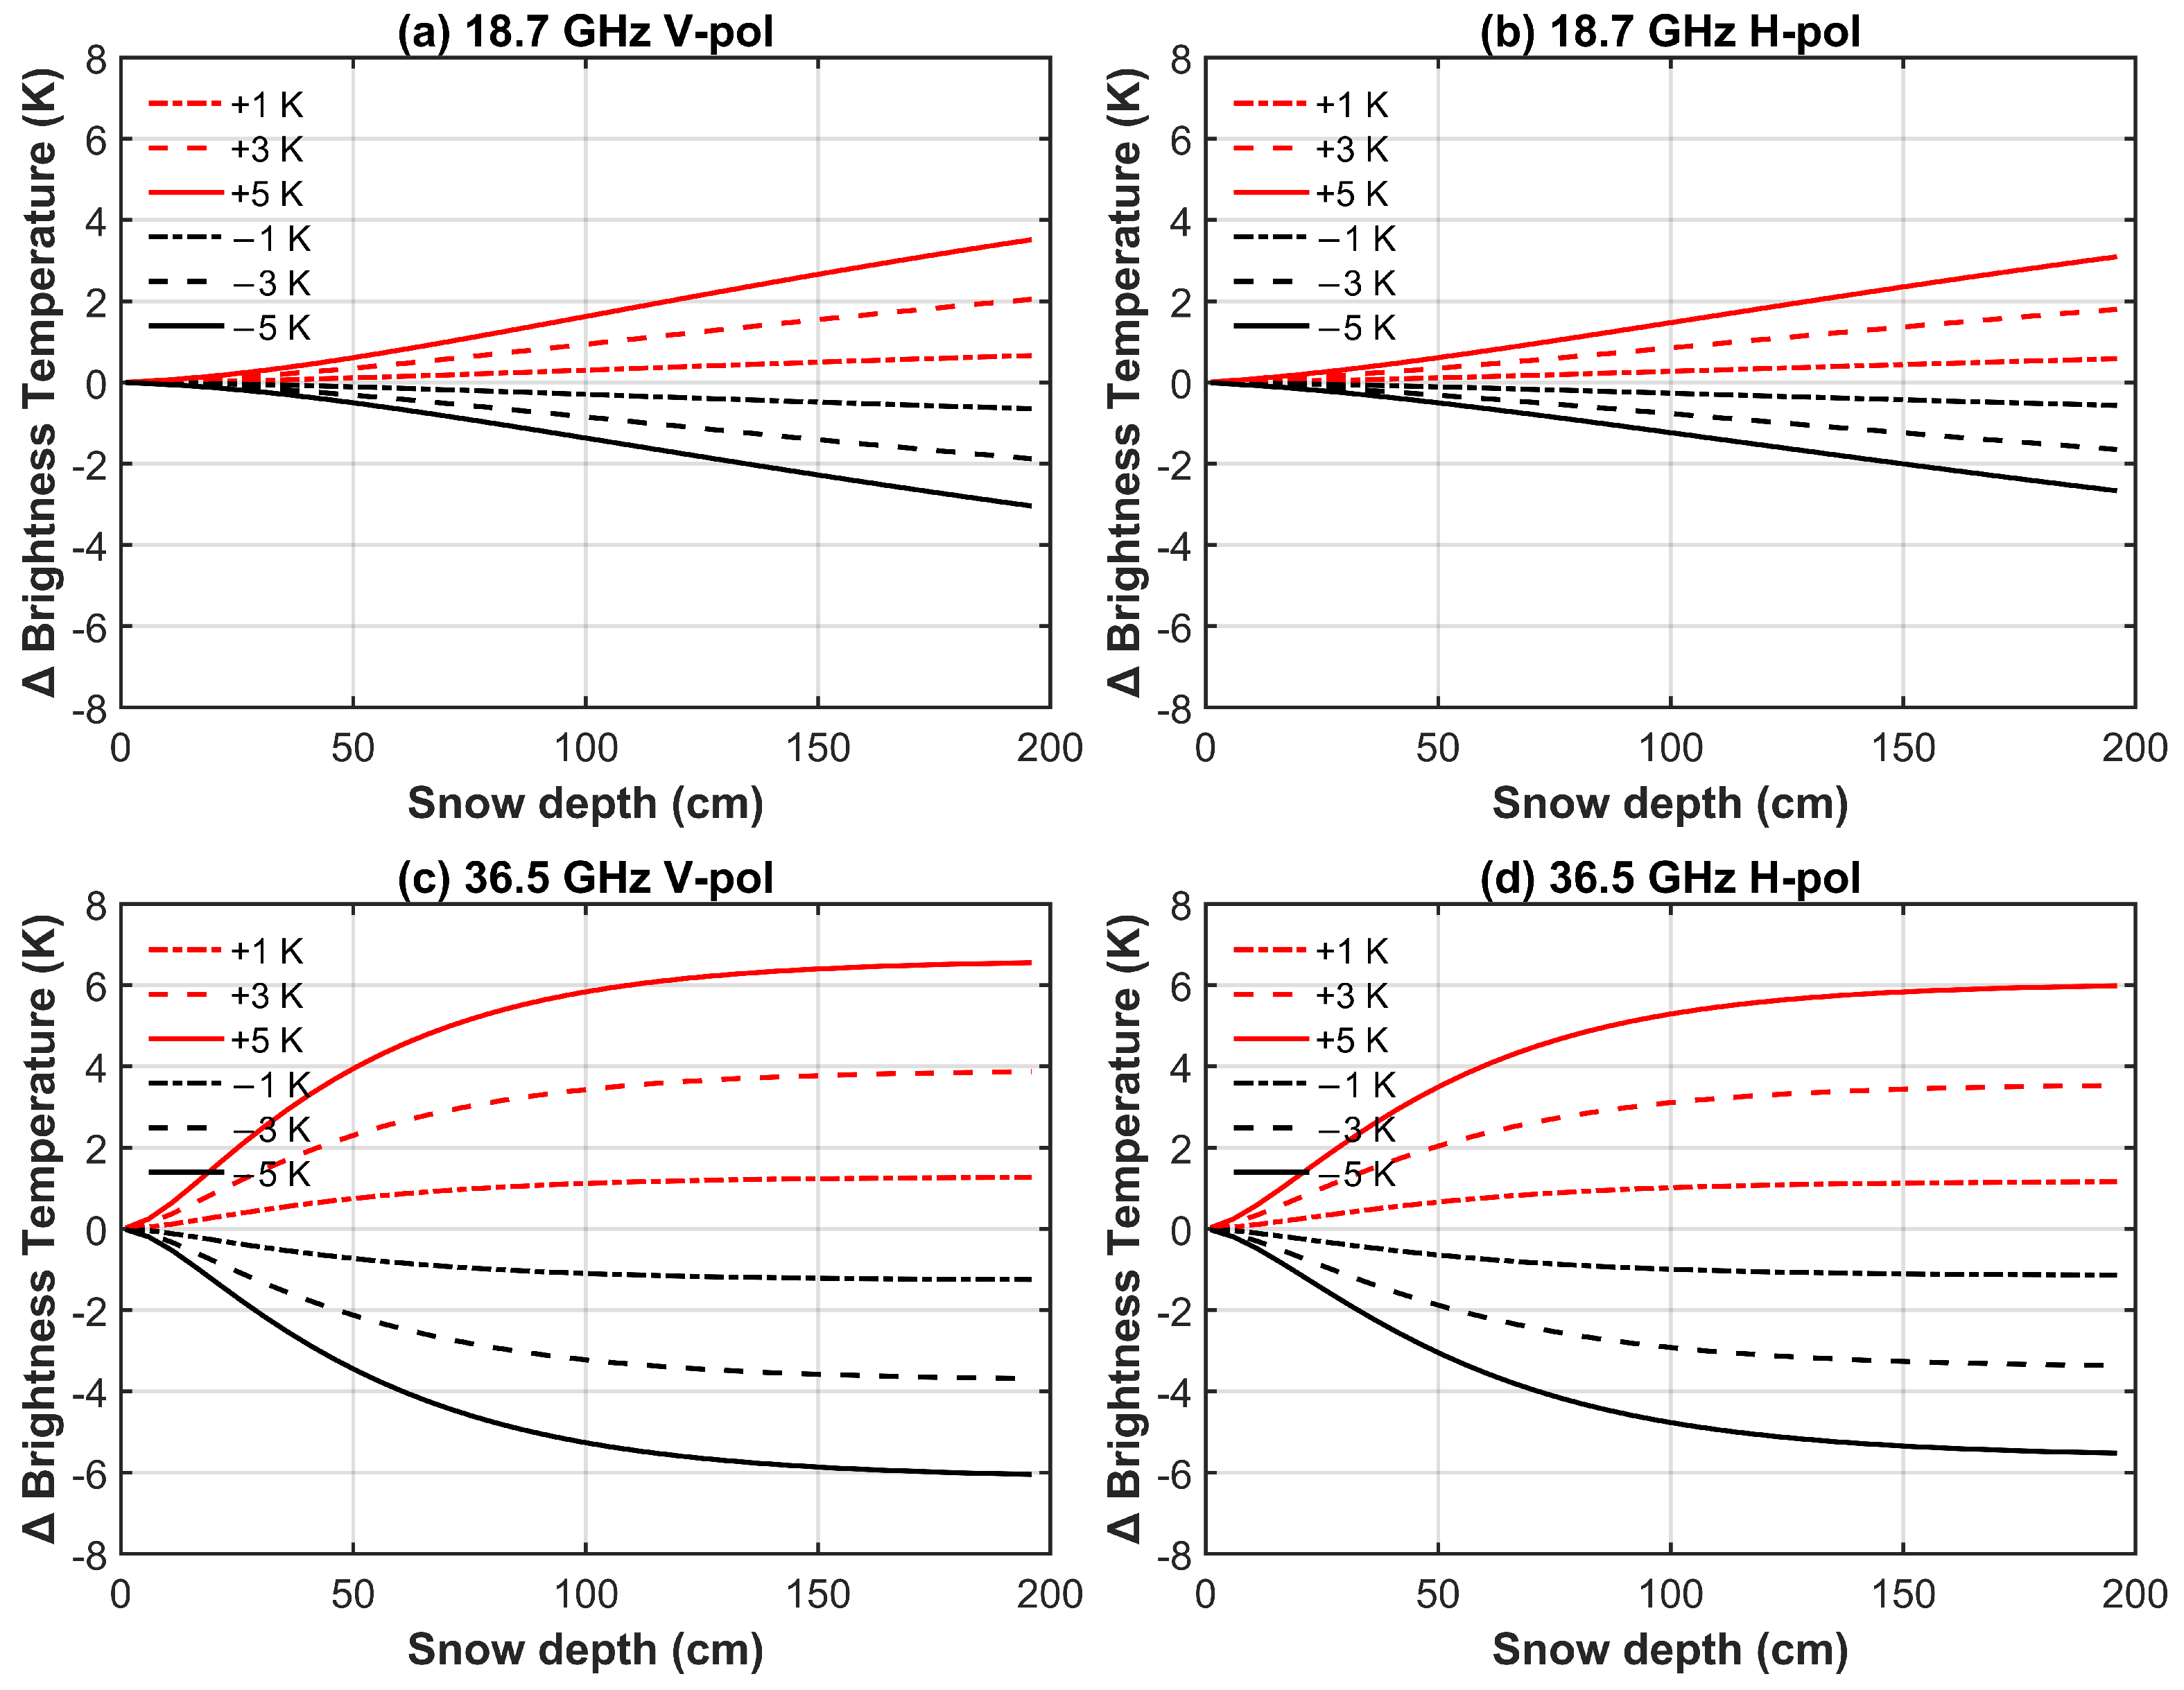
Overpass time mainly influences snow temperature, which is closely linked to air temperature. A 4 h difference in overpass time generally causes less than a 5 K change in air temperature, and given that snow temperature is highly sensitive to air temperature, it results in a similar variation in snow temperature [47]. To evaluate the potential impact of such variations on TBs, we tested whether ±1 K, ±3 K, and ±5 K changes in snow temperature could significantly affect the simulated signal. Simulations were conducted at 18.7 and 36.5 GHz with a 55° incidence angle. Figure 14 illustrates the influence of snow temperature differences on brightness temperature differences (ΔTB). The results indicate that at 18.7 GHz and snow depths ≤100 cm, a ±3 K change in snow temperature resulted in TB variations of less than 1 K, while a ±5 K change led to variations of less than 2 K. In contrast, at 36.5 GHz and snow depths ≤100 cm, the same snow temperature changes produced TB differences of up to 4 K and 6 K, respectively.
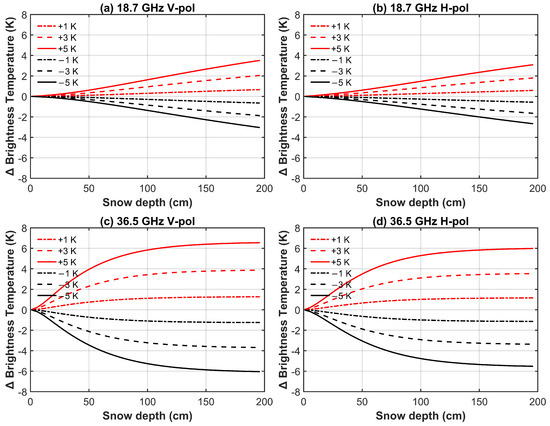
Figure 14.
Influence of snow temperature difference on brightness temperature difference. (a) 18.7 GHz V-pol; (b) 18.7 GHz H-pol; (c) 36.5 GHz V-pol; (d) 36.5 GHz H-pol.
AMSR2 has the smallest footprint, followed by MWRI, and then SSMIS. A smaller footprint indicates that the microwave radiometer observes a more homogeneous area, whereas a larger footprint integrates microwave signals over a wider area. The footprint difference between AMSR2 and MWRI is relatively small, while the difference between SSMIS and AMSR2 is much larger. This may be one of the reasons why the brightness temperature differences between SSMIS and AMSR2 are larger compared to those between MWRI and AMSR2. Considering both footprint size and overpass time, MWRI is more consistent with AMSR2, which results in smaller differences in retrieved snow depth and lower std SDD.
4.2. Influence Factor for Snow Depth Algorithm Sensitivity
The sensitivity of snow depth retrieval algorithms to inter-sensor brightness temperature (TB) differences largely depends on how retrieval schemes are formulated. Algorithms that explicitly account for key environmental and radiometric factors tend to show lower sensitivity. For example, the WESTDC algorithm reduces sensitivity by introducing a correction factor and re-fitting against regional snow characteristics in China, thereby mitigating the sensitivity [17]. The FY-3B algorithm incorporates land surface effects and mixed-pixel influences, which effectively decrease influence of observation angle and footprint variations [25]. The FY-3D retrieval adopts a partitioned strategy, applying a modified Foster algorithm in northeastern forests, a re-fitted regression in Xinjiang, and the FY-3B scheme elsewhere. This regional tailoring improves robustness and reduces sensitivity to cross-sensor TB inconsistencies [26]. Particularly noteworthy is the SPD algorithm, which yields a smaller standard deviation of SDDs. This enhanced stability can be attributed to its use of V-polarized TB differences and the 19 GHz polarization difference, which effectively reduce sensitivity to sensor-specific variations such as overpass time, incidence angle, and frequency [23]. Figure 15 illustrates the spatial distribution of snow depth differences retrieved by the Foster algorithm between the FY-3D/MWRI and AMSR2 sensors across the Northern Hemisphere, with respect to forest fraction. The results show that in areas with higher forest fraction, the snow depth differences retrieved from the Foster algorithm are significantly greater. Figure 15c presents the relationship between forest fraction and snow depth differences obtained using the Foster algorithm. The results indicate a positive correlation between snow depth differences and forest fraction, with differences increasing more rapidly as forest fraction increases. This might be due to the fact that in the Foster algorithm, () is used as the denominator, which makes the snow depth inversion more sensitive to brightness temperature changes when ff is close to 1 [22]. In contrast, the FY-3D algorithm is less sensitive to brightness temperature differences (see Figure 9g). This might be due to the fact that when establishing the regression relationship for Northeast China, the algorithm uses () as the denominator to correct for the impact of forest cover, thereby preventing the denominator from becoming too small [26].

Figure 15.
Distribution of (a) forest fraction, (b) snow depth differences retrieved using the Foster algorithm (FY-3D vs. AMSR2) in the Northern Hemisphere (>35°N), and (c) their relationship.
5. Conclusions
This study highlights the significant role of passive microwave remote sensing in establishing consistent long-term snow depth records, which are crucial for climatological and hydrological studies. The comparison of TBDs between various sensors, including DMSP-F18/SSMIS, AMSR2, and FY-3D/MWRI, reveals that FY-3D/MWRI and AMSR2 exhibit smaller TBDs compared to F18/SSMIS and AMSR2, suggesting better sensor consistency in the former pair. Furthermore, the sensitivity of different snow depth retrieval algorithms to TBDs was evaluated. Among the global algorithms, the SPD algorithm demonstrates comparatively lower sensitivity to brightness temperature differences, as reflected in the lower standard deviations of SDDs observed in both the Northern Hemisphere and China. In contrast, the Foster algorithm demonstrates high sensitivity to TBDs, with snow depth differences reaching up to 20 cm in regions with dense forest cover ( > 90 %), likely due to the absence of a forest fraction scaling factor. The WESTDC, FY-3B, and FY-3D algorithms exhibit lower sensitivity to TBDs across different land cover types and snow classifications, which enhances their robustness for snow depth retrieval. These findings highlight the importance of algorithms that minimize snow depth retrieval differences without inter-sensor calibration, facilitating the development of virtual constellations and improving the reliability of global climate and hydrological studies. In future work, we will further explore the sensitivity of nonlinear snow depth retrieval algorithms, including GlobSnow and machine learning-based approaches, and aim to develop methods that are less sensitive to inter-sensor differences.
Author Contributions
Conceptualization, L.J.; methodology, L.J. and G.L.; software, L.J. and G.L.; validation, G.L.; formal analysis, G.L., H.C., and L.J.; investigation, G.L., H.C., and L.J.; visualization, G.L.; supervision, L.J., G.L., H.C., J.P., J.Y., and M.W.; project administration, L.J.; funding acquisition, L.J. All authors have read and agreed to the published version of the manuscript.
Funding
This study is supported by the National Natural Science Foundation of China (42090014, 42171317).
Data Availability Statement
DMSP-F18/SSMIS data is available at https://www.ncei.noaa.gov/products/climate-data-records/ssmis-brightness-temperature-csu (last access: 24 May 2023). AMSR2 data can be downloaded from the JAXA G-Portal website at https://gportal.jaxa.jp/gpr/?lang=en (last access: 12 May 2023). FY-3D/MWRI data is accessible at https://satellite.nsmc.org.cn/ (last access: 5 February 2023). GHCN daily data can be obtained from https://www1.ncdc.noaa.gov/pub/data/ghcn/daily/ (last access: 19 August 2023). MOD12Q1 and MOD44B data are available at https://lpdaac.usgs.gov/ (last access: 17 March 2023).
Acknowledgments
We are grateful to the National Oceanic and Atmospheric Administration (NOAA) for providing the Special Sensor Microwave Imager (SSMI) and Special Sensor Microwave Imager/Sounder (SSMIS) data, the China Meteorological Administration (CMA) for providing the FY-3D Microwave Radiation Imager (MWRI) data, and the Japan Aerospace Exploration Agency (JAXA) for providing the Advanced Microwave Scanning Radiometer 2 (AMSR2) data.
Conflicts of Interest
The authors declare no conflicts of interest.
References
- Barnett, T.P.; Adam, J.C.; Lettenmaier, D.P. Potential impacts of a warming climate on water availability in snow-dominated regions. Nature 2005, 438, 303–309. [Google Scholar] [CrossRef] [PubMed]
- Fernandes, R.; Zhao, H.; Wang, X.; Key, J.; Qu, X.; Hall, A. Controls on Northern Hemisphere snow albedo feedback quantified using satellite Earth observations. Geophys. Res. Lett. 2009, 36, 2009GL040057. [Google Scholar] [CrossRef]
- Flanner, M.G.; Shell, K.M.; Barlage, M.; Perovich, D.K.; Tschudi, M.A. Radiative forcing and albedo feedback from the Northern Hemisphere cryosphere between 1979 and 2008. Nat. Geosci. 2011, 4, 151–155. [Google Scholar] [CrossRef]
- Pulliainen, J.; Luojus, K.; Derksen, C.; Mudryk, L.; Lemmetyinen, J.; Salminen, M.; Ikonen, J.; Takala, M.; Cohen, J.; Smolander, T.; et al. Patterns and trends of Northern Hemisphere snow mass from 1980 to 2018. Nature 2020, 581, 294–298. [Google Scholar] [CrossRef]
- Qin, Y.; Abatzoglou, J.T.; Siebert, S.; Huning, L.S.; AghaKouchak, A.; Mankin, J.S.; Hong, C.; Tong, D.; Davis, S.J.; Mueller, N.D. Agricultural risks from changing snowmelt. Nat. Clim. Change 2020, 10, 459–465. [Google Scholar] [CrossRef]
- Siirila-Woodburn, E.R.; Rhoades, A.M.; Hatchett, B.J.; Huning, L.S.; Szinai, J.; Tague, C.; Nico, P.S.; Feldman, D.R.; Jones, A.D.; Collins, W.D.; et al. A low-to-no snow future and its impacts on water resources in the western united states. Nat. Rev. Earth Environ. 2021, 2, 800–819. [Google Scholar] [CrossRef]
- Sturm, M.; Goldstein, M.A.; Parr, C. Water and life from snow: A trillion dollar science question. Water Resour. Res. 2017, 53, 3534–3544. [Google Scholar] [CrossRef]
- Schöner, W.; Auer, I.; Böhm, R. Long term trend of snow depth at sonnblick (austrian alps) and its relation to climate change. Hydrol. Process. 2009, 23, 1052–1063. [Google Scholar] [CrossRef]
- Reba, M.L.; Marks, D.; Seyfried, M.; Winstral, A.; Kumar, M.; Flerchinger, G. A long-term data set for hydrologic modeling in a snow-dominated mountain catchment. Water Resour. Res. 2011, 47, 2010WR010030. [Google Scholar] [CrossRef]
- Wegmann, M.; Orsolini, Y.; Dutra, E.; Bulygina, O.; Sterin, A.; Brönnimann, S. Eurasian snow depth in long-term climate reanalyses. Cryosphere 2017, 11, 923–935. [Google Scholar] [CrossRef]
- Yang, J.; Jiang, L.; Dai, L.; Pan, J.; Wu, S.; Wang, G. The Consistency of SSM/I vs. SSMIS and the Influence on Snow Cover Detection and Snow Depth Estimation over China. Remote Sens. 2019, 11, 1879. [Google Scholar] [CrossRef]
- Alsweiss, S.O.; Jelenak, Z.; Chang, P.S.; Park, J.D.; Meyers, P. Inter-calibration Results of the Advanced Microwave Scanning Radiometer-2 Over Ocean. IEEE J. Sel. Top. Appl. Earth Obs. Remote Sens. 2015, 8, 4230–4238. [Google Scholar] [CrossRef]
- Dai, L.; Che, T.; Ding, Y. Inter-Calibrating SMMR, SSM/I and SSMI/S Data to Improve the Consistency of Snow-Depth Products in China. Remote Sens. 2015, 7, 7212–7230. [Google Scholar] [CrossRef]
- Kroodsma, R.A.; McKague, D.S.; Ruf, C.S. Inter-Calibration of Microwave Radiometers Using the Vicarious Cold Calibration Double Difference Method. IEEE J. Sel. Top. Appl. Earth Obs. Remote Sens. 2012, 5, 1006–1013. [Google Scholar] [CrossRef]
- Chander, G.; Hewison, T.J.; Fox, N.; Wu, X.; Xiong, X.; Blackwell, W.J. Overview of Intercalibration of Satellite Instruments. IEEE Trans. Geosci. Remote Sens. 2013, 51, 1056–1080. [Google Scholar] [CrossRef]
- Takala, M.; Luojus, K.; Pulliainen, J.; Derksen, C.; Lemmetyinen, J.; Kärnä, J.P.; Koskinen, J.; Bojkov, B. Estimating northern hemisphere snow water equivalent for climate research through assimilation of space-borne radiometer data and ground-based measurements. Remote Sens. Environ. 2011, 115, 3517–3529. [Google Scholar] [CrossRef]
- Che, T.; Li, X.; Jin, R.; Armstrong, R.; Zhang, T. Snow depth derived from passive microwave remote-sensing data in China. Ann. Glaciol. 2008, 49, 145–154. [Google Scholar] [CrossRef]
- Imaoka, K.; Maeda, T.; Kachi, M.; Kasahara, M.; Ito, N.; Nakagawa, K. Status of AMSR2 instrument on GCOM-W1. In Proceedings of the Earth Observing Missions and Sensors: Development, Implementation, and Characterization II, Kyoto, Japan, 30 October–1 November 2012; SPIE: Bellingham, WA, USA, 2012; Volume 8528, pp. 201–206. [Google Scholar] [CrossRef]
- Berg, W.; Kroodsma, R.; Kummerow, C.; McKague, D. Fundamental Climate Data Records of Microwave Brightness Temperatures. Remote Sens. 2018, 10, 1306. [Google Scholar] [CrossRef]
- Kummerow, C.D.; Berg, W.K.; Kuo, C.P.; NOAA CDR Program. NOAA Climate Data Record (CDR) of SSMI(S) and AMSR2 Microwave Brightness Temperatures, CSU Version 2; NOAA National Centers for Environmental Information (NCEI): Asheville, NC, USA, 2022. [CrossRef]
- Chang, A.; Foster, J.; Hall, D. Nimbus-7 SMMR Derived Global Snow Cover Parameters. Ann. Glaciol. 1987, 9, 39–44. [Google Scholar] [CrossRef]
- Foster, J. Comparison of snow mass estimates from a prototype passive microwave snow algorithm, a revised algorithm and a snow depth climatology. Remote Sens. Environ. 1997, 62, 132–142. [Google Scholar] [CrossRef]
- Aschbacher, J. Land Surface Studies and Atmospheric Effects by Satellite Microwave Radiometry. Ph.D. Thesis, University of Innsbruck, Innsbruck, Austria, 1993; p. 1. [Google Scholar]
- Kelly, R. The AMSR-E Snow Depth Algorithm: Description and Initial Results. J. Remote Sens. Soc. Jpn. 2009, 29, 307–317. [Google Scholar] [CrossRef]
- Jiang, L.; Wang, P.; LiXin, Z.; Hu, Y.; JunTao, Y. Improvement of snow depth retrieval for FY3B-MWRI in China. Sci. China (Earth Sci.) 2014, 57, 1278–1292. [Google Scholar] [CrossRef]
- Yang, J.; Jiang, L.; Wu, S.; Wang, G.; Wang, J.; Liu, X. Development of a Snow Depth Estimation Algorithm over China for the FY-3D/MWRI. Remote Sens. 2019, 11, 977. [Google Scholar] [CrossRef]
- Che, T.; Li, X.; Jin, R.; Huang, C. Assimilating passive microwave remote sensing data into a land surface model to improve the estimation of snow depth. Remote Sens. Environ. 2014, 143, 54–63. [Google Scholar] [CrossRef]
- Jiang, L.; Shi, J.; Tjuatja, S.; Dozier, J.; Chen, K.; Zhang, L. A parameterized multiple-scattering model for microwave emission from dry snow. Remote Sens. Environ. 2007, 111, 357–366. [Google Scholar] [CrossRef]
- Jiang, L.; Shi, J.; Tjuatja, S.; Chen, K.S.; Du, J.; Zhang, L. Estimation of Snow Water Equivalence Using the Polarimetric Scanning Radiometer From the Cold Land Processes Experiments (CLPX03). IEEE Geosci. Remote Sens. Lett. 2011, 8, 359–363. [Google Scholar] [CrossRef]
- Xiao, X.; Zhang, T.; Zhong, X.; Shao, W.; Li, X. Support vector regression snow-depth retrieval algorithm using passive microwave remote sensing data. Remote Sens. Environ. 2018, 210, 48–64. [Google Scholar] [CrossRef]
- Bair, E.H.; Abreu Calfa, A.; Rittger, K.; Dozier, J. Using machine learning for real-time estimates of snow water equivalent in the watersheds of Afghanistan. Cryosphere 2018, 12, 1579–1594. [Google Scholar] [CrossRef]
- Yang, J.W.; Jiang, L.M.; Lemmetyinen, J.; Pan, J.M.; Luojus, K.; Takala, M. Improving snow depth estimation by coupling HUT-optimized effective snow grain size parameters with the random forest approach. Remote Sens. Environ. 2021, 264, 112630. [Google Scholar] [CrossRef]
- Pulliainen, J. Mapping of snow water equivalent and snow depth in boreal and sub-arctic zones by assimilating space-borne microwave radiometer data and ground-based observations. Remote Sens. Environ. 2006, 101, 257–269. [Google Scholar] [CrossRef]
- Yang, J.; Jiang, L.; Luojus, K.; Pan, J.; Lemmetyinen, J.; Takala, M.; Wu, S. Snow depth estimation and historical data reconstruction over China based on a random forest machine learning approach. Cryosphere 2020, 14, 1763–1778. [Google Scholar] [CrossRef]
- Tedesco, M.; Jeyaratnam, J. A New Operational Snow Retrieval Algorithm Applied to Historical AMSR-E Brightness Temperatures. Remote Sens. 2016, 8, 1037. [Google Scholar] [CrossRef]
- Yang, J.; Jiang, L.; Zheng, Z.; Pan, J.; Shayiran, A. A new operational northern hemisphere snow water equivalent retrieval algorithm for FY-3F/MWRI-II based on pixel-based regression coefficients. IEEE Trans. Geosci. Remote Sens. 2024, 62, 4302915. [Google Scholar] [CrossRef]
- Du, J.; Kimball, J.; Shi, J.; Jones, L.; Wu, S.; Sun, R.; Yang, H. Inter-calibration of satellite passive microwave land observations from AMSR-E and AMSR2 using overlapping FY3B-MWRI sensor measurements. Remote Sens. 2014, 6, 8594–8616. [Google Scholar] [CrossRef]
- Grody, N.; Basist, A. Global identification of snowcover using SSM/I measurements. IEEE Trans. Geosci. Remote Sens. 1996, 34, 237–249. [Google Scholar] [CrossRef]
- Liu, X.; Jiang, L.; Wu, S.; Hao, S.; Wang, G.; Yang, J. Assessment of methods for passive microwave snow cover mapping using FY-3C/MWRI data in China. Remote Sens. 2018, 10, 524. [Google Scholar] [CrossRef]
- Zschenderlein, L.; Luojus, K.; Takala, M.; Venäläinen, P.; Pulliainen, J. Evaluation of passive microwave dry snow detection algorithms and application to SWE retrieval during seasonal snow accumulation. Remote Sens. Environ. 2023, 288, 113476. [Google Scholar] [CrossRef]
- Derksen, C.; LeDrew, E.; Walker, A.; Goodison, B. Influence of Sensor Overpass Time on Passive Microwave-Derived Snow Cover Parameters. Remote Sens. Environ. 2000, 71, 297–308. [Google Scholar] [CrossRef]
- Kummerow, C.; Duncan, D.; Randel, D.; Brown, P. AMSR-E/AMSR2 Unified Algorithm – Ocean Suite: Algorithm Theoretical Basis Document. National Snow and Ice Data Center (NSIDC): Boulder, CO, USA, 2021. [Google Scholar]
- Li, D.; Zhang, Y.; Feng, X.; Song, K.; Fan, Y.; Xie, J.; Liao, Y. Multichannel radiometer frontend based on bandwidth synthetic technology. IEEE Trans. Microw. Theory Tech. 2017, 65, 632–640. [Google Scholar] [CrossRef]
- Meunier, V.; Löhnert, U.; Kollias, P.; Crewell, S. Biases caused by the instrument bandwidth and beam width on simulated brightness temperature measurements from scanning microwave radiometers. Atmos. Meas. Tech. 2013, 6, 1171–1187. [Google Scholar] [CrossRef]
- Tsang, L.; Pan, J.; Liang, D.; Li, Z.; Cline, D.W.; Tan, Y. Modeling Active Microwave Remote Sensing of Snow Using Dense Media Radiative Transfer (DMRT) Theory With Multiple-Scattering Effects. IEEE Trans. Geosci. Remote Sens. 2007, 45, 990–1004. [Google Scholar] [CrossRef]
- Liang, D.; Xu, X.; Tsang, L.; Andreadis, K.M.; Josberger, E.G. The Effects of Layers in Dry Snow on Its Passive Microwave Emissions Using Dense Media Radiative Transfer Theory Based on the Quasicrystalline Approximation (QCA/DMRT). IEEE Trans. Geosci. Remote Sens. 2008, 46, 3663–3671. [Google Scholar] [CrossRef]
- Lemmetyinen, J.; Derksen, C.; Toose, P.; Proksch, M.; Pulliainen, J.; Kontu, A.; Rautiainen, K.; Seppänen, J.; Hallikainen, M. Simulating seasonally and spatially varying snow cover brightness temperature using HUT snow emission model and retrieval of a microwave effective grain size. Remote Sens. Environ. 2015, 156, 71–95. [Google Scholar] [CrossRef]
Disclaimer/Publisher’s Note: The statements, opinions and data contained in all publications are solely those of the individual author(s) and contributor(s) and not of MDPI and/or the editor(s). MDPI and/or the editor(s) disclaim responsibility for any injury to people or property resulting from any ideas, methods, instructions or products referred to in the content. |
© 2025 by the authors. Licensee MDPI, Basel, Switzerland. This article is an open access article distributed under the terms and conditions of the Creative Commons Attribution (CC BY) license (https://creativecommons.org/licenses/by/4.0/).


