Article

Comparative Evaluation of SNO and Double Difference Calibration Methods for FY-3D MERSI TIR Bands Using MODIS/Aqua as Reference

1
School of Remote Sensing & Geomatics Engineering, Nanjing University of Information Science and Technology, Nanjing 210044, China
2
CMA Earth System Modeling and Prediction Centre (CEMC), China Meteorological Administration, Beijing 100081, China
3
National Satellite Meteorological Center, China Meteorological Administration, Beijing 100081, China
4
The Institute of Meteorological Sciences of Hunan Province, Changsha 410118, China
*
Author to whom correspondence should be addressed.
Remote Sens. 2025, 17(19), 3353; https://doi.org/10.3390/rs17193353
Submission received: 29 July 2025 / Revised: 30 September 2025 / Accepted: 30 September 2025 / Published: 2 October 2025

Abstract

Highlights

What are the main findings?
  • A systematic comparison of SNO and DD calibration for FY-3D MERSI TIR Bands 24 and 25.
  • Double-difference reduces mean bias to ±0.1 K and RMSE to 0.3–0.4 K under clear-sky conditions.
What is the implication of the main finding?
  • DD offers higher accuracy and scalability, while SNO provides stability under cloudy scenes.
  • These findings support improved cross-sensor calibration and enhance consistency of long-term climate data records.

Abstract

Radiometric consistency across satellite platforms is fundamental to producing high-quality Climate Data Records (CDRs). Because different cross-calibration methods have distinct advantages and limitations, comparative evaluation is necessary to ensure record accuracy. This study presents a comparative assessment of two widely applied calibration approaches—Simultaneous Nadir Overpass (SNO) and Double Difference (DD)—for the thermal infrared (TIR) bands of FY-3D MERSI. MODIS/Aqua serves as the reference sensor, while radiative transfer simulations driven by ERA5 inputs are generated with the Advanced Radiative Transfer Modeling System (ARMS) to support the analysis. The results show that SNO performs effectively when matchup samples are sufficiently large and globally representative but is less applicable under sparse temporal sampling or orbital drift. In contrast, the DD method consistently achieves higher calibration accuracy for MERSI Bands 24 and 25 under clear-sky conditions. It reduces mean biases from ~−0.5 K to within ±0.1 K and lowers RMSE from ~0.6 K to 0.3–0.4 K during 2021–2022. Under cloudy conditions, DD tends to overcorrect because coefficients derived from clear-sky simulations are not directly transferable to cloud-covered scenes, whereas SNO remains more stable though less precise. Overall, the results suggest that the two methods exhibit complementary strengths, with DD being preferable for high-accuracy calibration in clear-sky scenarios and SNO offering greater stability across variable atmospheric conditions. Future work will validate both methods under varied surface and atmospheric conditions and extend their use to additional sensors and spectral bands.

1. Introduction

Satellite-based Earth observation is indispensable for advancing climate science and environmental monitoring, providing long-term, spatially consistent datasets that support both research and decision-making [1]. Among remote sensing measurements, thermal infrared (TIR) observations are particularly valuable for retrieving geophysical parameters such as land surface temperature (LST), which are central to climate change detection, ecosystem modeling, and numerical weather prediction [2,3]. The scientific utility of these products depends strongly on their radiometric fidelity, especially when data from multiple missions are integrated into Climate Data Records (CDRs) for long-term analysis [4]. However, radiometric calibration of individual instruments alone is not sufficient; to ensure inter-sensor consistency and extend long-term climate records, cross-calibration becomes essential.
Pre-launch laboratory characterization and on-orbit monitoring provide a baseline for sensor accuracy, but discrepancies inevitably arise from differences in instrument design, orbital configuration, and temporal degradation [5,6]. Without rigorous cross-calibration, systematic biases propagate into CDRs and undermine the detection of subtle but climatically relevant signals [7].
Among cross-calibration techniques, the Simultaneous Nadir Overpass (SNO) method is widely adopted for its simplicity and operational efficiency. By exploiting near-simultaneous observations from two satellites with similar viewing geometries, SNO enables direct radiance comparisons under nearly identical conditions [8,9]. It has been successfully applied to sensors including MODIS, AVHRR, and VIIRS [10,11,12]. However, SNO calibration is limited by mismatches in overpass timing, spatial sampling, and spectral response [13]. These limitations are particularly significant for the FY-3D Medium Resolution Spectral Imager (MERSI) and MODIS/Aqua pair, where valid SNO opportunities are sparse in low- and mid-latitude regions (see Section 3.1). In addition, orbital drift and sensor aging further degrade temporal and geometric alignment, compromising the robustness of long-term calibration [14].
To address these issues, the Double Difference (DD) method provides a complementary alternative. Originally developed for microwave radiometers [15,16,17,18,19], DD integrates radiative transfer models (RTMs) with co-located atmospheric fields from numerical weather prediction (NWP) systems to simulate radiances for both reference and target sensors [20,21]. By differencing observed and simulated radiances for each instrument and then differencing the residuals, DD suppresses common atmospheric and geometric uncertainties while isolating sensor-specific biases [22]. This modeling-based approach provides greater flexibility under suboptimal sampling conditions. Its performance critically depends on RTM accuracy and the consistency of auxiliary inputs. Many uncertainties are common-mode and partly reduced by the double-difference formulation.
At the international level, the Global Space-based Inter-Calibration System (GSICS) has established widely recognized best practices for calibrating satellite infrared imagers [23,24,25]. These practices are broadly grouped into three methodological families: (i) Ray Matching (RM/SNO), which relies on strict spatiotemporal collocation of nadir observations; (ii) Radiative Transfer Modeling (RTM/Double Difference, DD), which integrates RTMs and NWP fields to suppress atmospheric and geometric uncertainties; and (iii) Hyperspectral Convolution (HSC), which uses hyperspectral sounders such as IASI or CrIS as benchmark instruments and convolves their spectra with broadband SRFs to minimize spectral mismatches. Among these, HSC is formally recommended by GSICS as the most traceable approach, but its application is limited by coarse spatial resolution and strict scene-homogeneity requirements [26].
This study focuses on comparing the SNO and DD approaches. Although they do not implement the hyperspectral convolution technique recommended by GSICS, both remain widely used. MODIS/Aqua is adopted as the practical reference, reflecting its longstanding role in the cross-calibration of FY-series sensors and its supporting climate applications. By systematically evaluating the strengths and limitations of SNO and DD, this study aims to inform current practice and offer guidance for future applications.
Despite widespread use, direct comparative evaluations of SNO and DD are limited, particularly for FY-3D MERSI and MODIS/Aqua [27]. Addressing this gap is critical given the growing role of the FY-3 constellation in global Earth observation and its contribution to long-term climate monitoring [28,29].
Accordingly, this study assesses the SNO and DD methods for cross-calibrating the TIR bands of FY-3D MERSI, using MODIS/Aqua as the proxy reference. The workflow is informed by GSICS principles, emphasizing strict spatiotemporal collocation and transparent treatment of uncertainties. The objectives are twofold: (i) to quantify the relative strengths and limitations of both techniques under realistic orbital and environmental conditions and (ii) to provide practical calibration guidance that enhances cross-platform radiometric consistency and ensures the long-term climate applicability of FY-3 infrared products.
The remainder of this paper is organized as follows: Section 2 introduces the Advanced Radiative Transfer Modeling System (ARMS) and the datasets used; Section 3 describes the calibration methodologies; Section 4 presents comparative results; Section 5 provides discussion; and Section 6 concludes with a summary.

2. Model and Datasets

2.1. Advanced Radiative Transfer Modeling System (ARMS)

The Advanced Radiative Transfer Modeling System (ARMS) offers significant improvements over traditional radiative transfer models, both in algorithmic design and software architecture [30]. ARMS achieves higher simulation accuracy for infrared radiances, greater adaptability to complex atmospheric conditions, and improved computational efficiency [31,32,33,34]. These features make ARMS particularly suitable for remote sensing applications.
In this study, ARMS serves as the core engine for infrared radiative transfer simulations. It utilizes atmospheric profiles from ERA5—including temperature, humidity, and ozone concentration—along with oceanic parameters such as sea surface temperature, wind speed, and wind direction. By incorporating each sensor’s spectral response functions (SRFs) and observational geometry, ARMS simulates brightness temperatures for the thermal infrared (TIR) bands of both MODIS and MERSI [30,35]. The resulting double-difference values are critical intermediates in the DD-based calibration, enabling effective suppression of systematic errors and precise determination of calibration coefficients. By comprehensively accounting for the atmospheric state, viewing geometry, and model biases, ARMS reduces uncertainties while enhancing the robustness and scene independence of calibration results.

2.2. FY-3D/MERSI and MODIS/Aqua Datasets

The second-generation Medium Resolution Spectral Imager (MERSI-II) aboard FY-3D features six thermal infrared (TIR) bands, offering enhanced capabilities for land surface temperature retrieval, water body detection, and cloud property characterization compared to its predecessor [36,37,38]. FY-3D/MERSI-II Level-1 products provide radiance measurements and 1 KM_GEO files, which are used to extract TIR band radiometric information as well as geolocation, viewing geometry, and land–sea mask data. Additionally, Level-2 cloud mask products are used to filter cloudy pixels, ensuring that simulated and calibrated scenes represent clear-sky conditions. All FY-3D/MERSI-II data utilized in this study are publicly available from the National Satellite Meteorological Center of China http://satellite.nsmc.org.cn (accessed on 20 September 2025).
MODIS, aboard Aqua, is widely recognized as one of the most stable and accurately calibrated satellite sensors, featuring a robust onboard calibration system and high radiometric accuracy. It serves as a reliable reference for MERSI cross-calibration and supports climate-scale consistency assessments [39,40]. The TIR band configurations and spectral response functions (SRFs, see Figure 1) of MODIS and MERSI are closely matched, providing a robust physical foundation for cross-calibration. In this study, MODIS Level-1 products—including MYD021KM (1 km TIR radiance) and MYD03 (geolocation and viewing geometry)—as well as Level-2 cloud mask products (MYD35_L2), are used for sample selection, pixel matching, and calibration error analysis. All MODIS data are obtained from the NASA LAADS DAAC (https://ladsweb.modaps.eosdis.nasa.gov (accessed on 20 September 2025).
The selection of FY-3D MERSI Bands 24 (10.5–11.3 µm) and 25 (11.5–12.5 µm), together with MODIS Bands 31 and 32, is motivated by their physical and operational importance (Table 1). These channels correspond to the atmospheric window region in the thermal infrared, which is widely used for retrieving land surface temperature (LST) and other climate-relevant geophysical parameters. They have therefore been the focus of long-term monitoring in both MODIS and FY-3 calibration frameworks. In addition, among all available TIR channels, these band pairs provide the closest spectral correspondence between MERSI and MODIS, which minimizes SRF-induced biases and makes them the most suitable candidates for robust cross-calibration.

2.3. ERA5 Atmospheric Reanalysis Data

ERA5 released by the European Centre for Medium-Range Weather Forecasts (ECMWF) is a global reanalysis dataset spanning from 1979 to the present. It provides a comprehensive range of atmospheric and surface variables and is extensively used in weather analysis, environmental monitoring, and climate research [41]. With an hourly temporal resolution and a spatial resolution of 0.25°, ERA5 offers detailed information on atmospheric and surface conditions. In this study, ERA5 reanalysis data are used as input to the ARMS radiative transfer model for radiance simulations in the Double Difference (DD) calibration. To ensure consistency with satellite observations, ERA5 profiles of temperature, humidity, and ozone, together with surface variables (e.g., SST and surface pressure), are collocated to the geolocations of satellite footprints using a nearest-neighbor strategy, and cases with large observation-minus-simulation (OMB) differences are filtered out. These steps help reduce the impact of spatial resolution mismatches, control uncertainties from model–observation inconsistencies, and improve the physical consistency of the simulations. All ERA5 data are publicly available from the Copernicus Climate Data Store https://cds.climate.copernicus.eu (accessed on 20 September 2025).

2.4. Dataset Overview

Calibration coefficients for both SNO and DD are derived from matchup datasets in July 2020 and July 2023. For SNO, all valid orbital overlap matchups throughout July are used; for DD, a single-day global oceanic matchup dataset (1 July of each year) is generated using radiative transfer simulations. Independent verification is performed using two oceanic regions: the eastern North Atlantic (30–40°N, 30–40°W, 23 July 2021) and the southwestern Indian Ocean (20–30°S, 50–60°E, 29 July 2022). These sites are selected for their radiometric homogeneity and frequent clear-sky conditions. Calibration and validation samples are strictly non-overlapping.
Details on validation regions, matchup distributions, and fitted coefficients are presented in Section 3 and Section 4.

3. Methodology

3.1. Calibration Workflow and Validation Framework

Building on the dataset overview, this section outlines the calibration workflow and validation framework (Figure 2). For the SNO method, pixel-level matchups are extracted from orbital overlap regions under strict thresholds. To ensure sufficient sample size and statistical robustness, all valid SNO matchups from July are used for coefficient fitting. For the DD method, radiative transfer simulations enable global matchup generation without the temporal or orbital constraints inherent in SNO. In this study, the analysis is restricted to oceanic surfaces to ensure a consistent method comparison under homogeneous surface conditions. Homogeneous ocean regions minimize emissivity variability and radiometric heterogeneity, thereby providing a controlled environment for a clearer, method-focused comparison between SNO and DD. To improve representativeness while maintaining computational efficiency, a latitude-based stratification scheme is adopted. The ocean is divided into several latitude bands defined by gradients in water vapor and brightness temperature, and samples are selected from each band. Although stratified sampling is applied, a unified regression relationship is ultimately derived to maintain internal consistency. These complementary strategies ensure both robustness and comparability in the overall calibration framework.

3.2. Simultaneous Nadir Overpass (SNO)-Based Cross-Calibration

The Simultaneous Nadir Overpass (SNO) method was originally proposed to meet the stringent requirements of radiometric consistency and calibration traceability across satellite platforms for long-term climate monitoring [42]. This method utilizes near-simultaneous observations from two satellites over orbital overlap regions to perform pixel-level matching, thereby constructing inter-sensor radiometric response relationships and enabling high-accuracy onboard cross-calibration. The technique relies critically on temporal, spatial, and geometric consistency within the overlap region, which helps minimize radiometric discrepancies arising from surface and atmospheric variability. SNO remains one of the most effective strategies for improving radiometric consistency among observations from multiple satellite sensors [43,44].
To minimize matching errors due to temporal gaps, spatial mismatches, and differences in viewing geometry—and to ensure physical consistency between matched pixels—this study adopts the following criteria, adapted from previous literature [3,7]:
  • Temporal threshold: within 10 min, to limit the impact of atmospheric thermal variations on brightness temperature consistency;
  • Spatial colocation: within 1 km, to reduce errors from surface heterogeneity;
  • Zenith angle difference: less than 1°, to suppress the effects of atmospheric path length.
These thresholds influence the calibration uncertainty: stricter settings reduce random errors but greatly limit the number of valid matchups, while looser settings increase representativeness but risk introducing biases. Following previous inter-calibration studies [10,11,13], and considering the 1 km native resolution of both MERSI and MODIS, the adopted values represent a practical compromise between accuracy and sample size.
A linear regression model was employed to establish the cross-calibration relationship between MERSI and MODIS brightness temperatures. This assumes a first-order linear form, which is widely adopted in satellite inter-calibration studies:
T m o d i s o b s = a T m e r s i o b s + b ,
where T m o d i s o b s and T m e r s i o b s represent the observed brightness temperatures from MODIS and MERSI, respectively, and a and b are the calibration coefficients.
Despite its theoretical soundness and operational simplicity, the SNO method is highly sensitive to satellite orbital configurations and crossover stability. According to orbital forecast data from the National Satellite Meteorological Center of China, the number of valid SNO overpasses between FY-3D MERSI and MODIS/Aqua has progressively declined from 2019 to 2023. By 2023, accumulated orbital drift results in overpass time differences exceeding 10 min in low- and mid-latitude regions, greatly limiting the availability of usable matchups.
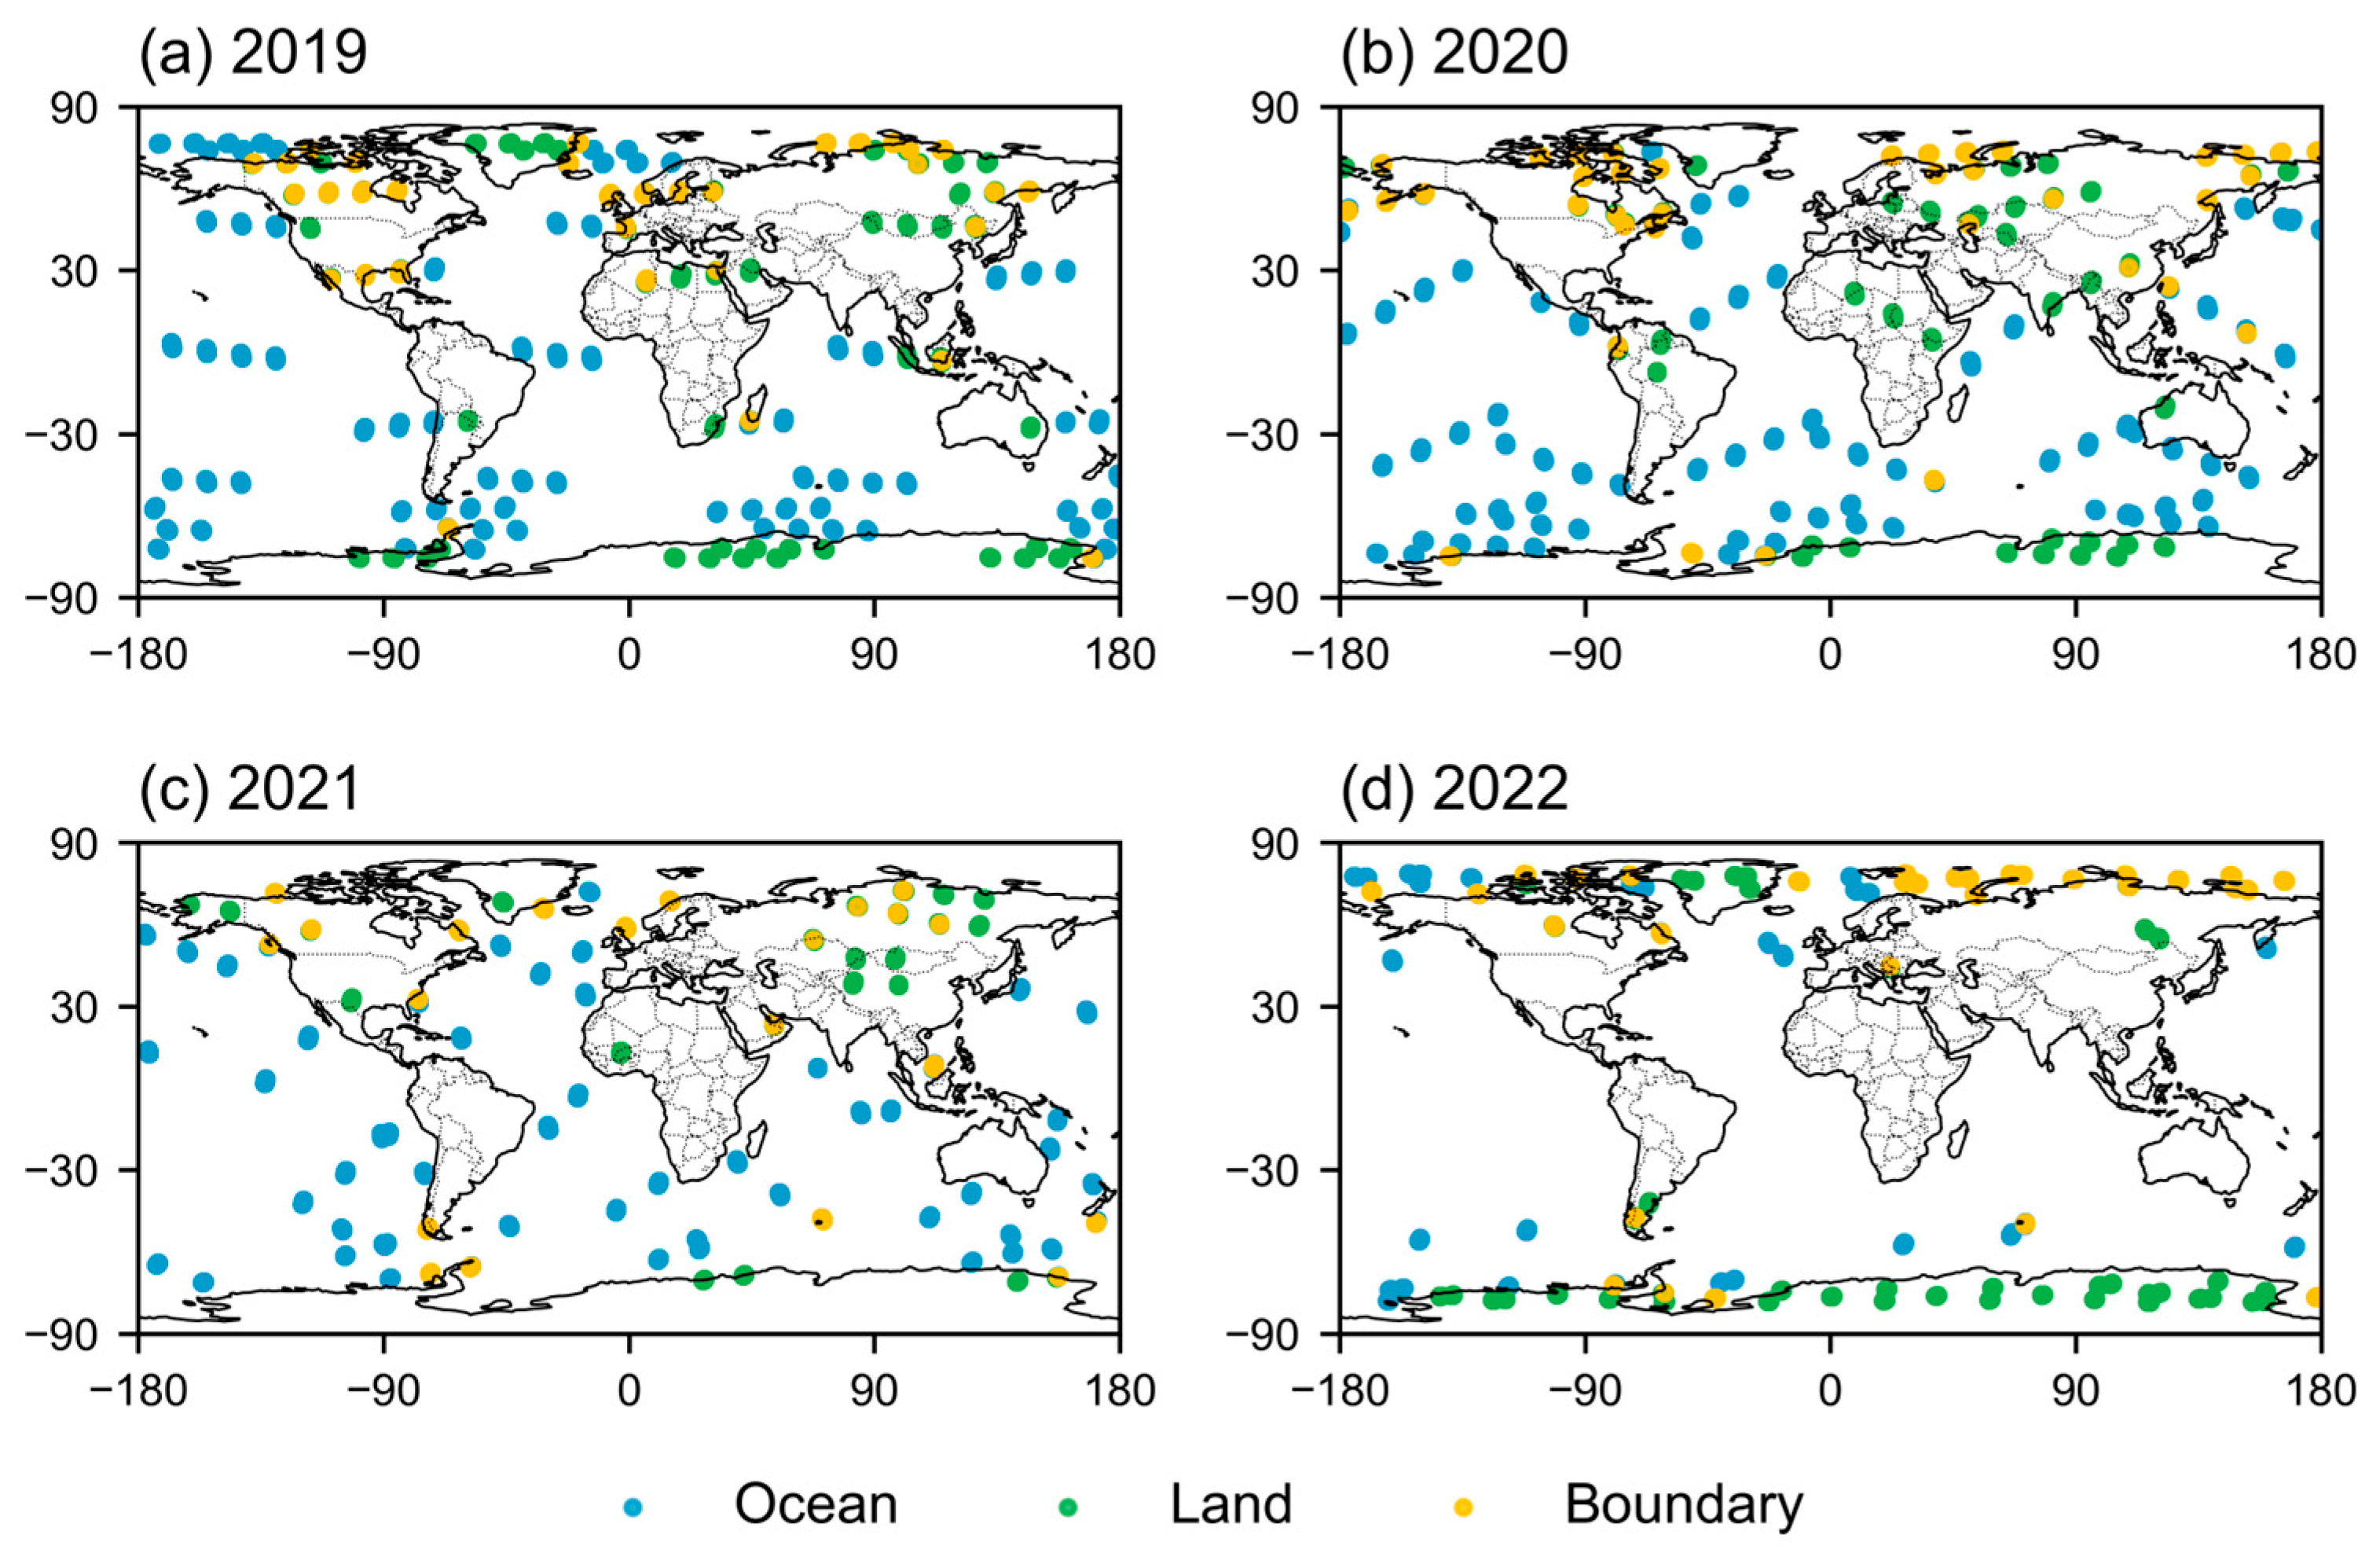
This temporal–spatial degradation significantly compromises the representativeness of calibration samples, making it increasingly difficult to derive coefficients applicable across diverse surface types. As a result, calibration coefficients derived primarily from high-latitude land or ocean scenes may lead to significant biases when applied to subtropical or heterogeneous surface types. Figure 3 shows the interannual variation in the number of valid SNO pixels in July from 2019 to 2023, based on the criteria described above, and Figure 4 shows their spatial distribution.

3.3. Double Difference (DD) Cross-Calibration Method

The Double Difference (DD) method was originally developed for the cross-calibration of microwave radiometers but has recently gained momentum in infrared sensor calibration, particularly over the past five years [27,44]. The approach begins by extracting matched brightness temperature (BT) observations from both sensors under clear-sky conditions. Simultaneously, atmospheric background profiles consistent with the observation time and location—including temperature (T), specific humidity (q), and ozone concentration (O3)—are retrieved from ERA5 reanalysis data.
These environmental variables are then input into the Advanced Radiative Transfer Modeling System (ARMS) to generate simulated brightness temperatures T s i m for each sensor band. For both FY-3D/MERSI and MODIS, the Observations-Minus-Simulations (OMB) is calculated as follows:
O M B m e r s i = T m e r s i o b s T m e r s i s i m ,
O M B m o d i s = T m o d i s o b s T m o d i s s i m ,
The double difference (DD) is defined as
D D = O M B m e r s i O M B m o d i s ,
The DD value is then used to correct the MERSI observation:
T m e r s i t h e o r e t i c a l = T m e r s i o b s D D ,
Subsequently, a linear regression model is fitted between the corrected MERSI and MODIS BT values to derive calibration coefficients a and b:
T m e r s i c o r r e c t e d = a T m e r s i o b s + b ,
where   T m e r s i   o b s   a n d     T m o d i s o b s are the observed brightness temperatures (BTs) from FY-3D/MERSI and MODIS, respectively.   T m e r s i s i m   a n d   T m o d i s s i m are the simulated BTs generated using the ARMS radiative transfer model. Here, OMB represents the difference between observed and simulated BTs for each sensor, and DD is the difference between the MERSI and MODIS OMBs.   T m e r s i c o r r e c t e d is the final bias-corrected brightness temperature for MERSI.

4. Result Analysis

4.1. Calibration Results Using the SNO Method

SNO matchups between FY-3D MERSI and Aqua MODIS are evaluated for July 2020 and July 2023. Linear regressions for the six thermal infrared bands (CH20–CH25) are presented in Figure 5. In 2020, the SNO sample size was large and geographically balanced, resulting in strong linearity (R2 > 0.97 for all bands) and robust calibration performance. In contrast, the 2023 samples are sparse and uneven—especially at the brightness temperature (BT) extremes—leading to weaker linearity, particularly for Bands 20 and 22.
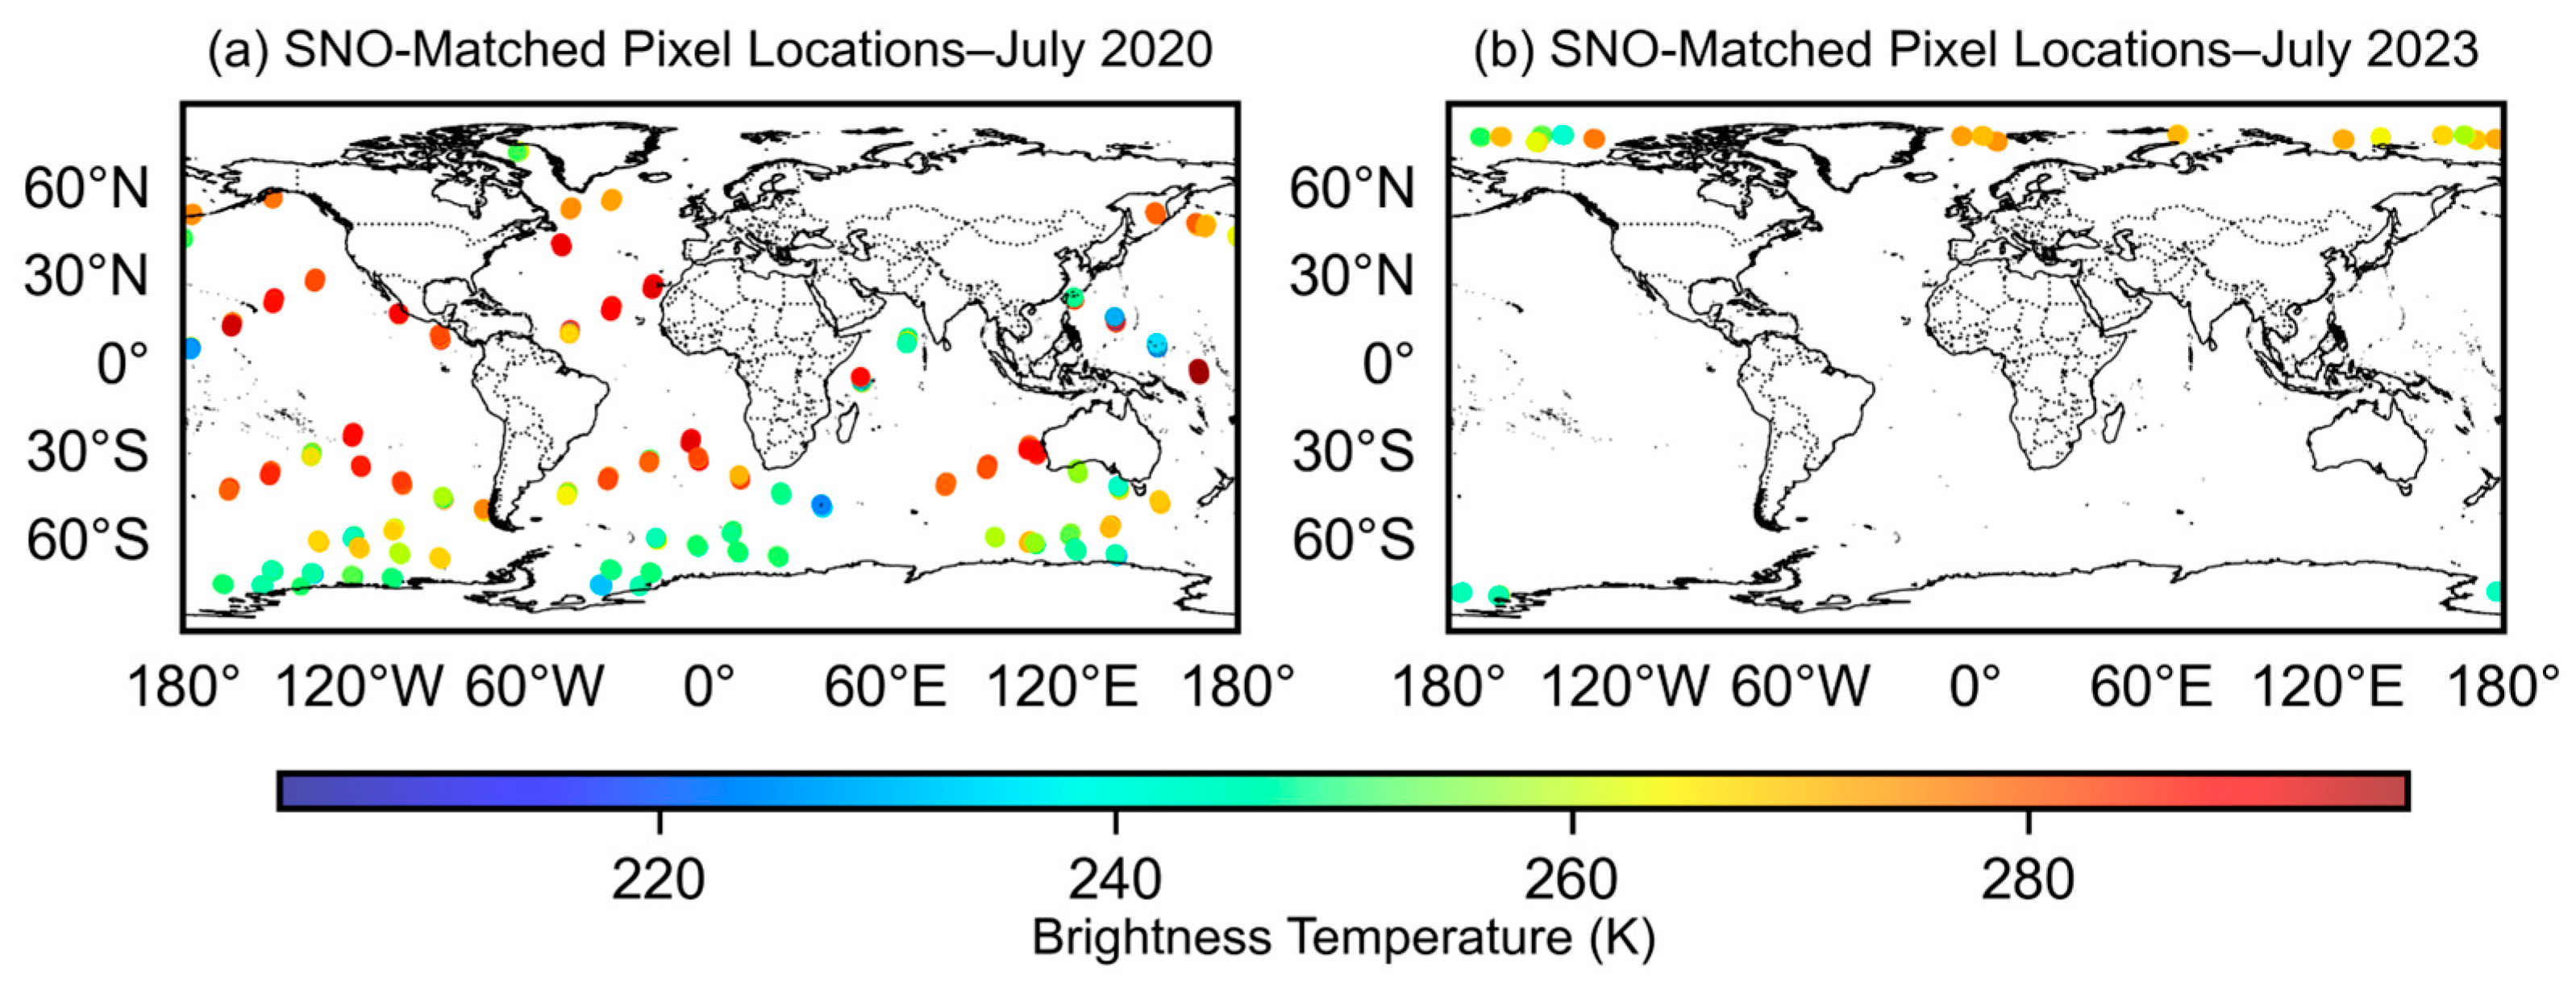
As illustrated in Figure 6, the limited representativeness of the 2023 samples amplified the influence of outliers and edge cases, thereby increasing calibration uncertainty and the risk of systematic bias.
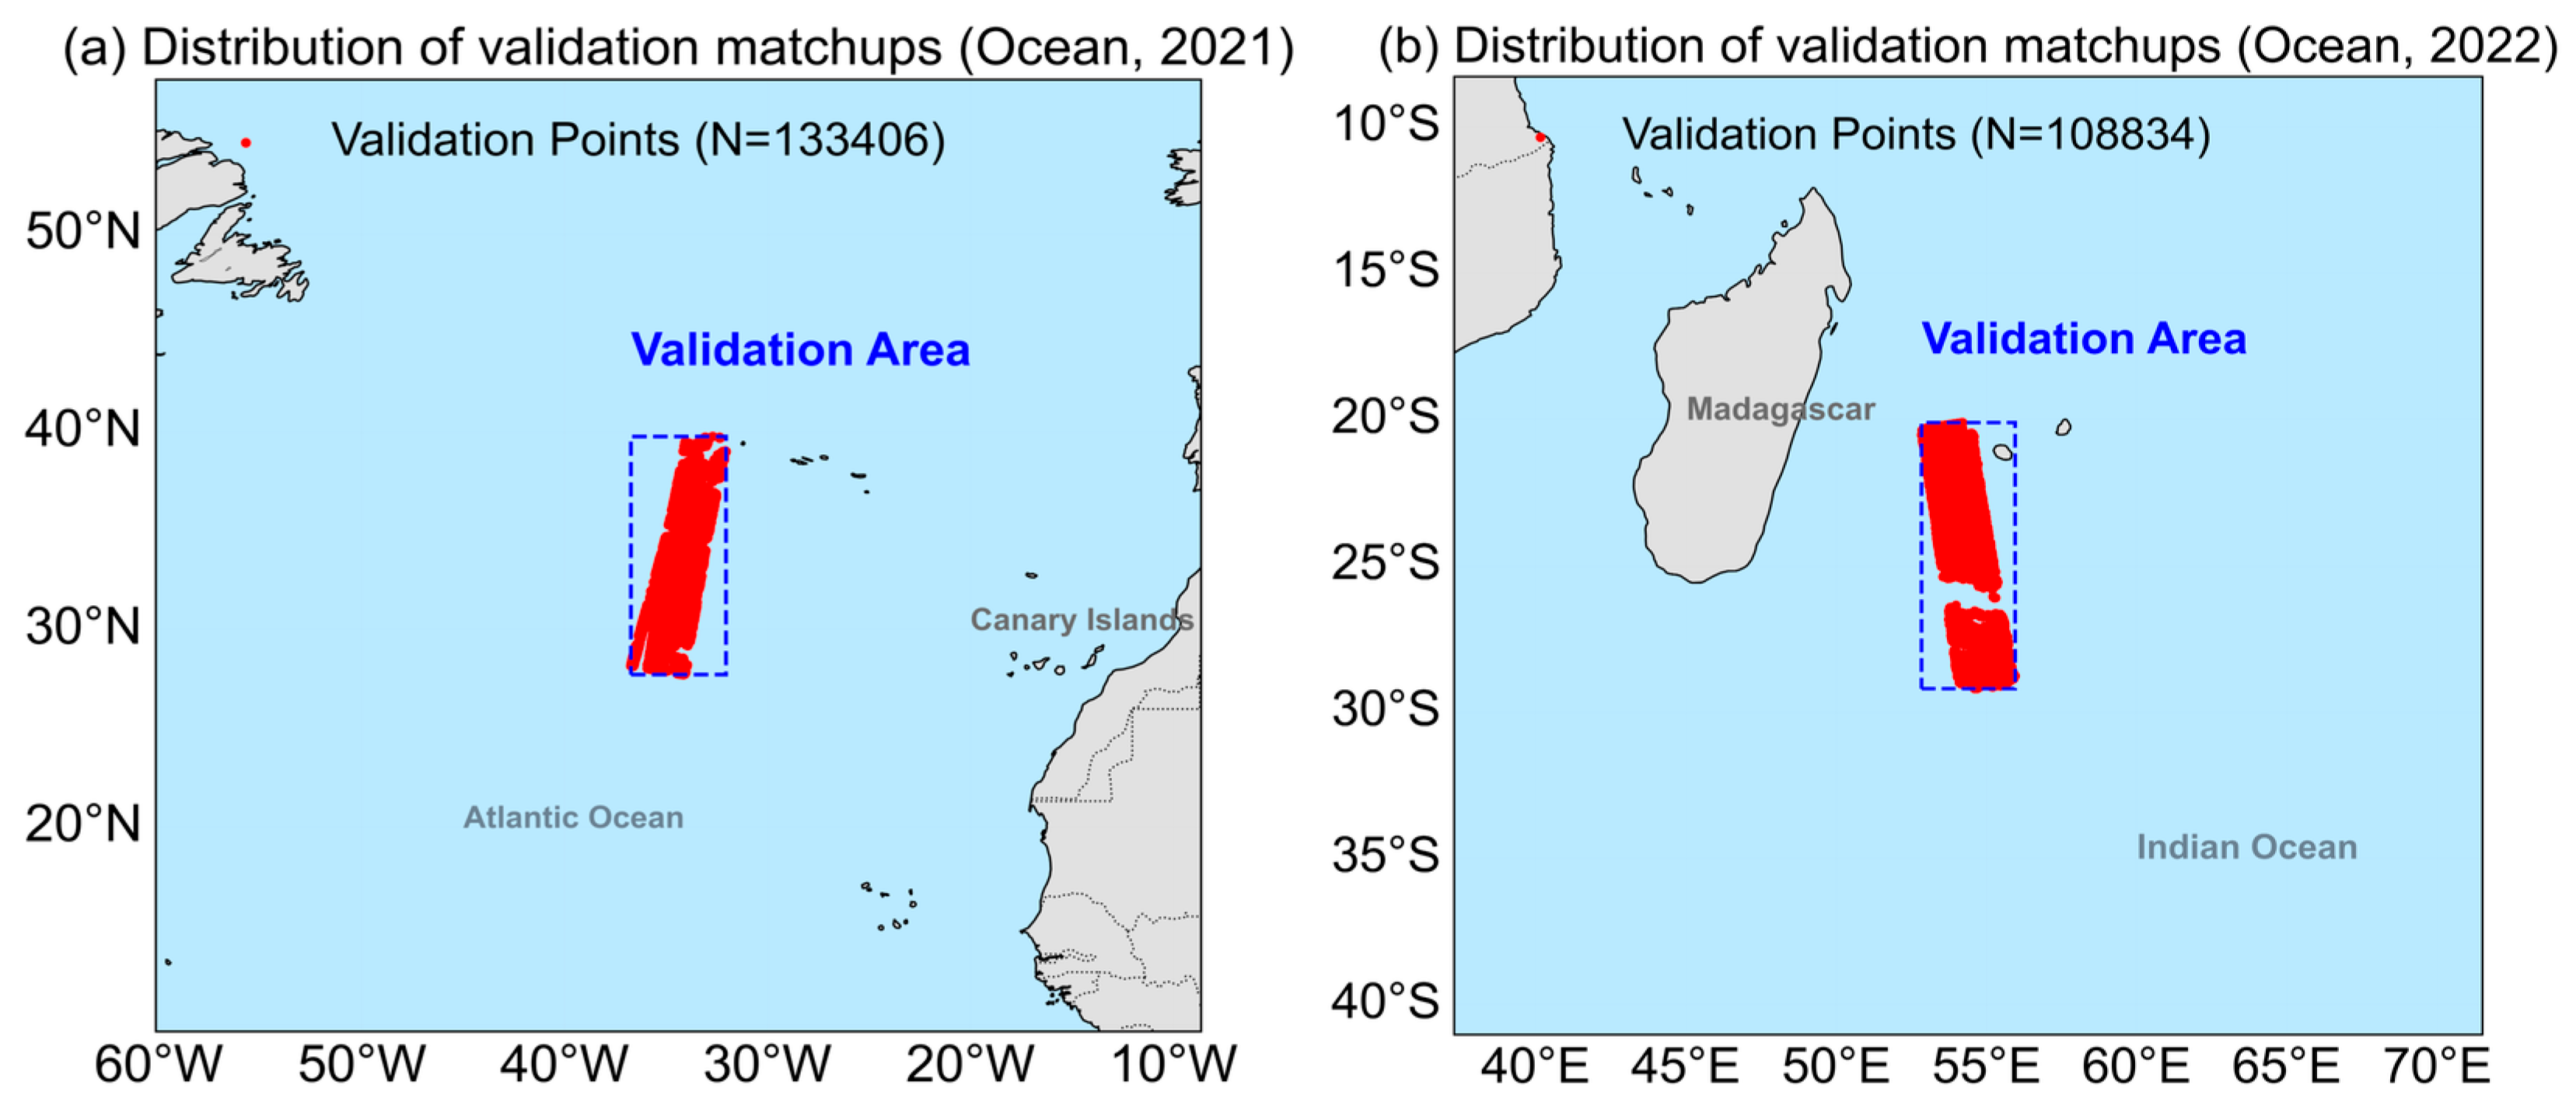
To assess the transferability of the SNO-derived coefficients, independent validation was conducted over ocean regions on 23 July 2021 and 29 July 2022. The 2021 site was located in the eastern North Atlantic near the Azores (30–40°N, 30–40°W), while the 2022 site was in the southwestern Indian Ocean east of Madagascar (20–30°S, 50–60°E), as shown in Figure 7. These locations are selected for their radiometric homogeneity and frequent clear-sky conditions, minimizing surface effects and ensuring high-quality matchups. Using both Northern and Southern Hemisphere regions also enabled cross-climatic evaluation. The raw BT mean biases between years showed similar patterns, supporting the consistency of the validation datasets.
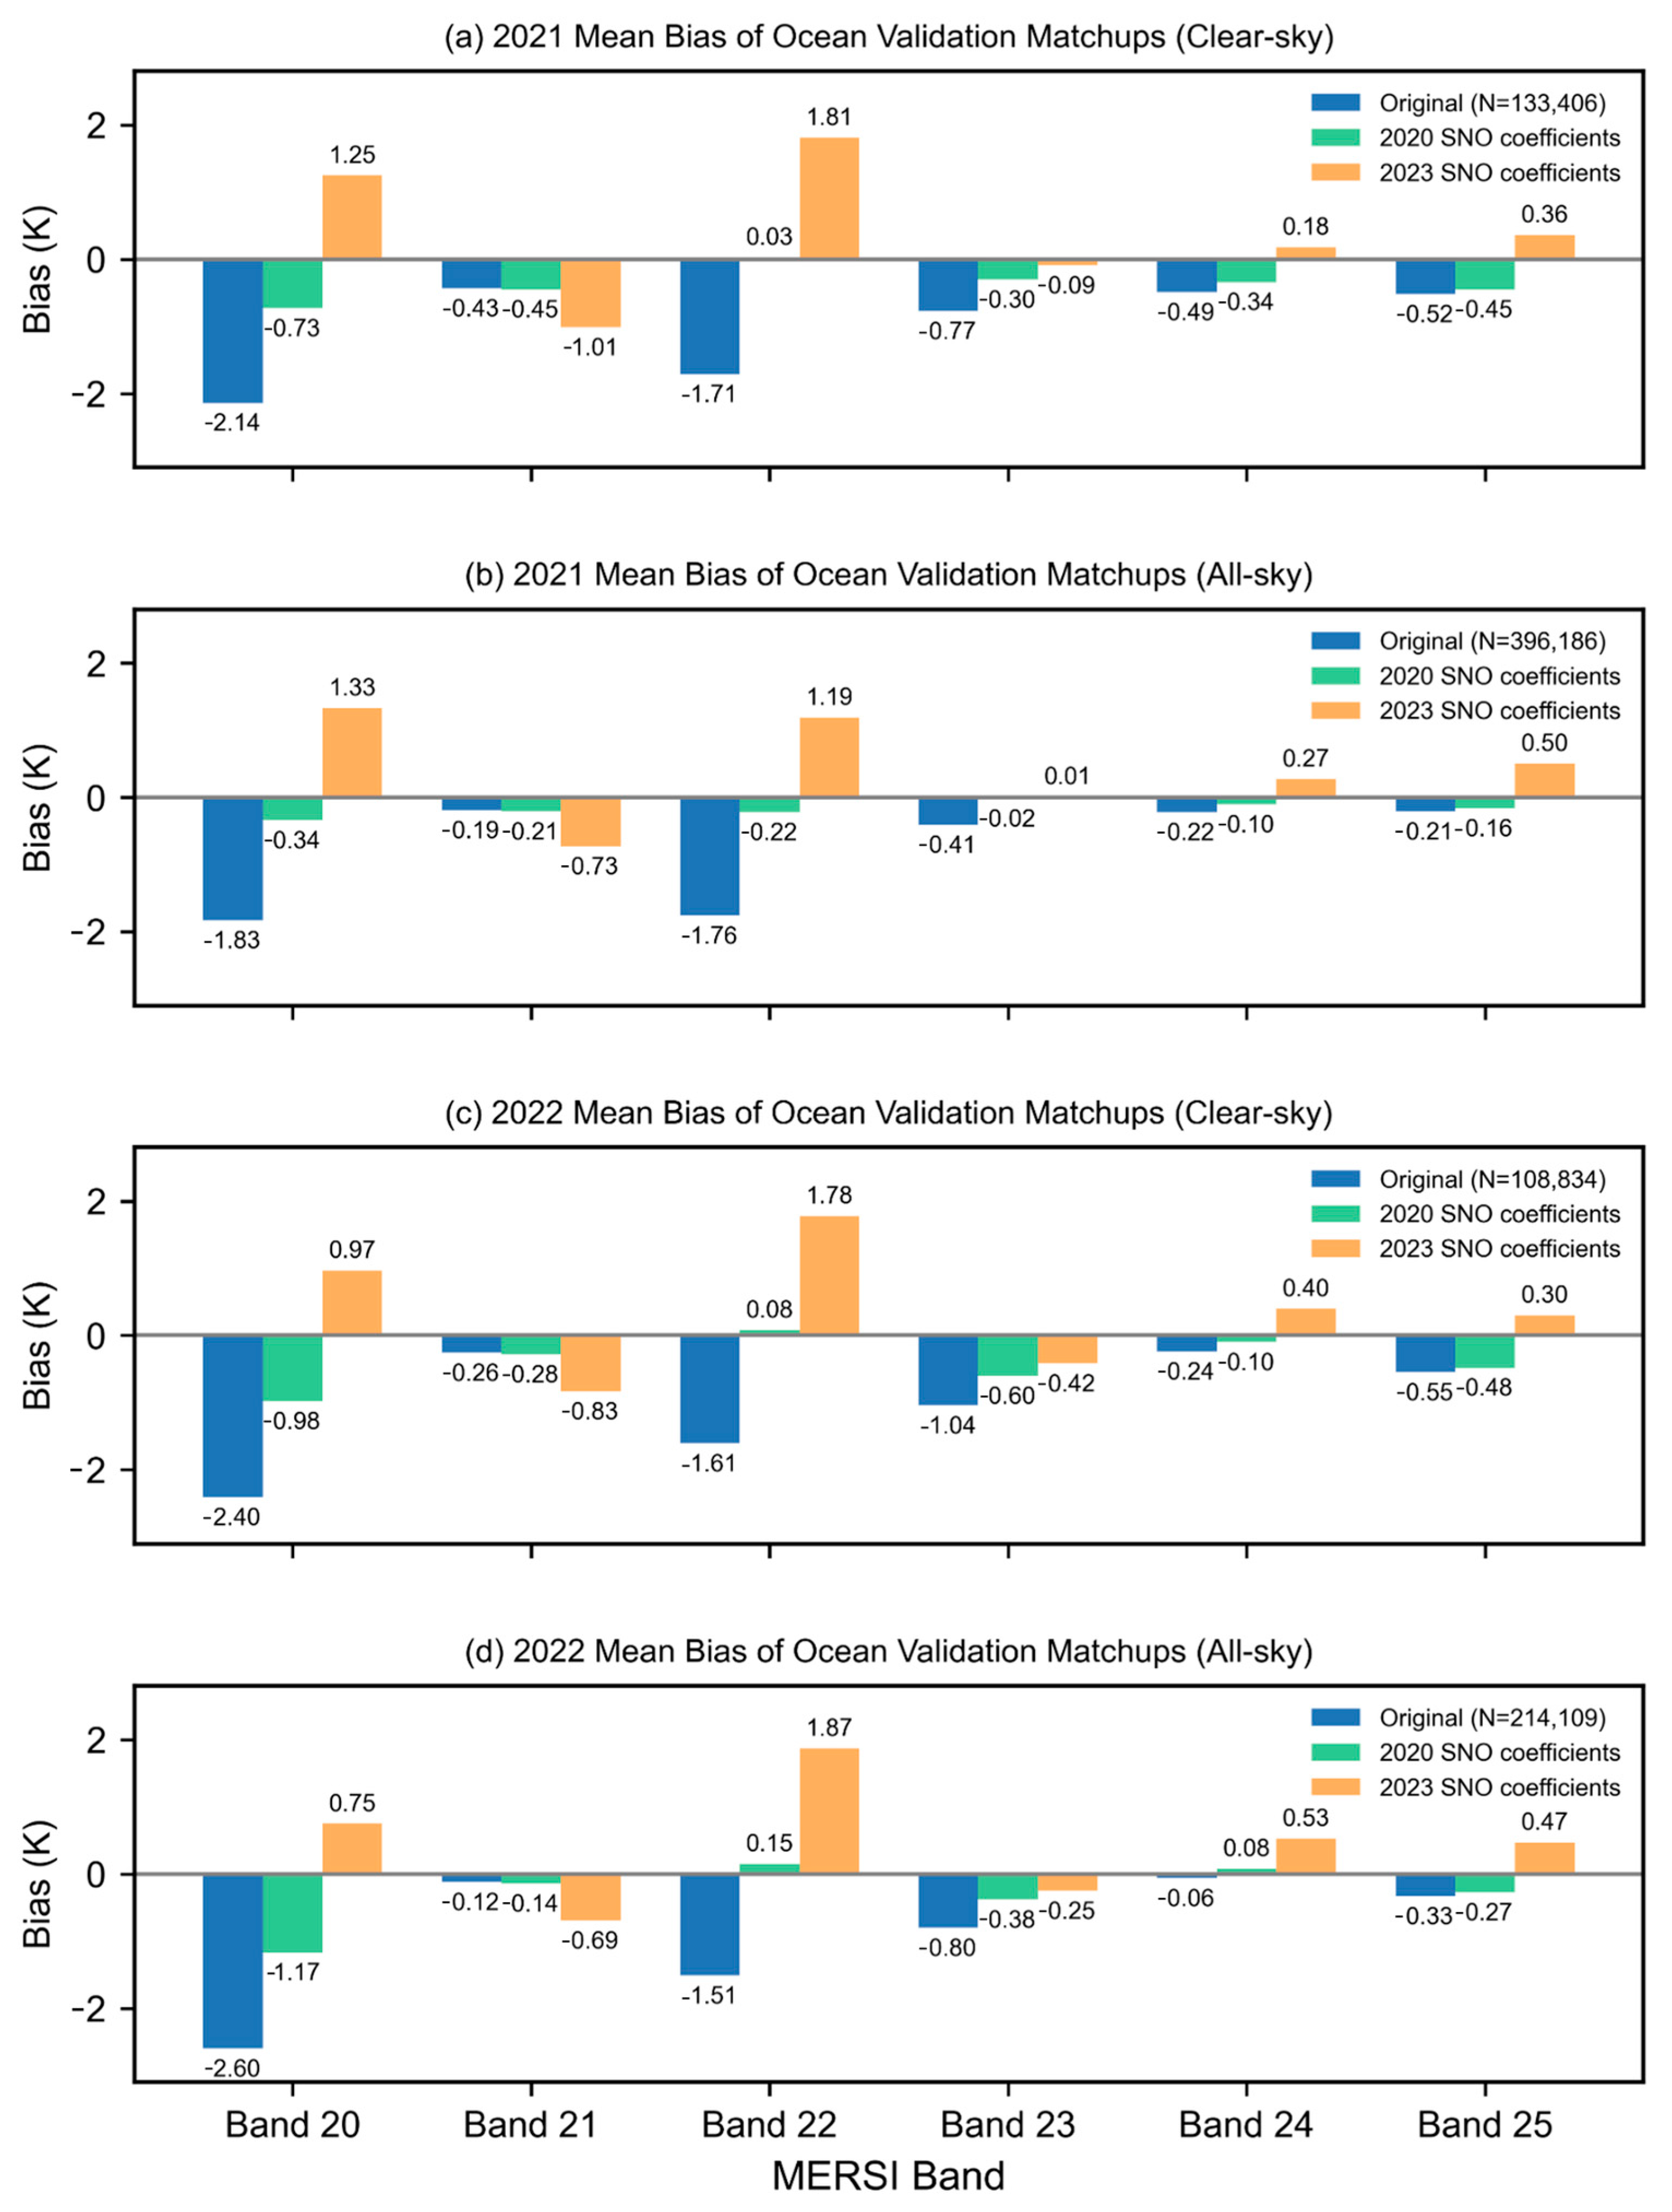
Figure 8 presents the mean BT biases for matched ocean pixels. Figure 8a,c focuses on clear-sky samples, while Figure 8b,d presents results for all matched pixels. Blue bars indicate original BT biases, green bars represent the application of 2020 SNO coefficients, and orange bars correspond to 2023 SNO coefficients. In both years, uncalibrated MERSI data consistently exhibit cold biases across all TIR bands, most notably in Bands 20 and 22 (often below −1.5 K). Applying the 2020 SNO coefficients substantially reduces these biases and generally limits residual errors to within ±0.5 K for both all-sky and clear-sky scenarios, demonstrating the importance of large and representative training samples.
By contrast, the 2023 SNO coefficients perform less effectively. Some bands, especially 20 and 22, exhibit bias reversals or increased mean errors after calibration, a sign of overfitting due to limited and heterogeneous matchups. Importantly, these reversals do not indicate a radiance-dependent bias, but rather reflect the sparse and uneven distribution of the 2023 ocean matchup dataset across the brightness temperature range. As shown in Figure 6b, the 2023 samples are concentrated in the mid-range BTs with fewer extreme values, leading to reduced representativeness. This uneven distribution caused instability in the fitted coefficients, whereas the 2020 dataset—with broader BT coverage—yielded more robust and stable calibration results.
In summary, the effectiveness of the SNO method depends strongly on the temporal and spatial coverage of valid matchups. Coefficients derived from limited or biased samples lack generalizability and may degrade data quality when applied to independent or climatologically different scenes. This limitation underscores the need for complementary strategies—such as the Double Difference method—for long-term and climate-scale cross-calibration.

4.2. Double Difference Fitting Analysis Based on ARMS Simulation

To minimize the influence of surface heterogeneity, this study restricts the Double Difference (DD) analysis to open-ocean regions, where radiometric conditions are highly homogeneous and atmospheric profiles relatively simple. Within these domains, brightness temperature (BT) simulations for FY-3D MERSI and MODIS are performed using the ARMS radiative transfer model, focusing on two key thermal infrared window bands: Band 24 (10.8 µm) and Band 25 (12.0 µm).
Figure 9 and Figure 10 present observed and ARMS-simulated BTs for MERSI Bands 24/25 and MODIS Bands 31/32, together with histograms of observation-minus-simulation (OMB) residuals for 2020 and 2023. In both years, simulated and observed BTs agree closely, with OMB residuals tightly clustered around zero. Mean biases are below 1 K across all bands, with standard deviations typically between 0.6 and 0.9 K. More than 90% of oceanic samples fall within ±2 K, confirming the accuracy of ARMS simulations and the radiometric consistency between MERSI and MODIS.
Figure 11 and Figure 12 further examine the dependence of OMB residuals on observed BT and sensor zenith angle. Across all bands and both years, residuals remain stable throughout the BT range, with only slight increases in bias and variability at temperature extremes. No systematic dependence on zenith angle is observed, confirming the robustness of the radiative transfer modeling under varying observation geometries. For completeness, residuals are also analyzed as a function of scan angle, yielding similarly consistent results. These findings support the use of ARMS-driven simulations as a reliable basis for physically based cross-calibration.
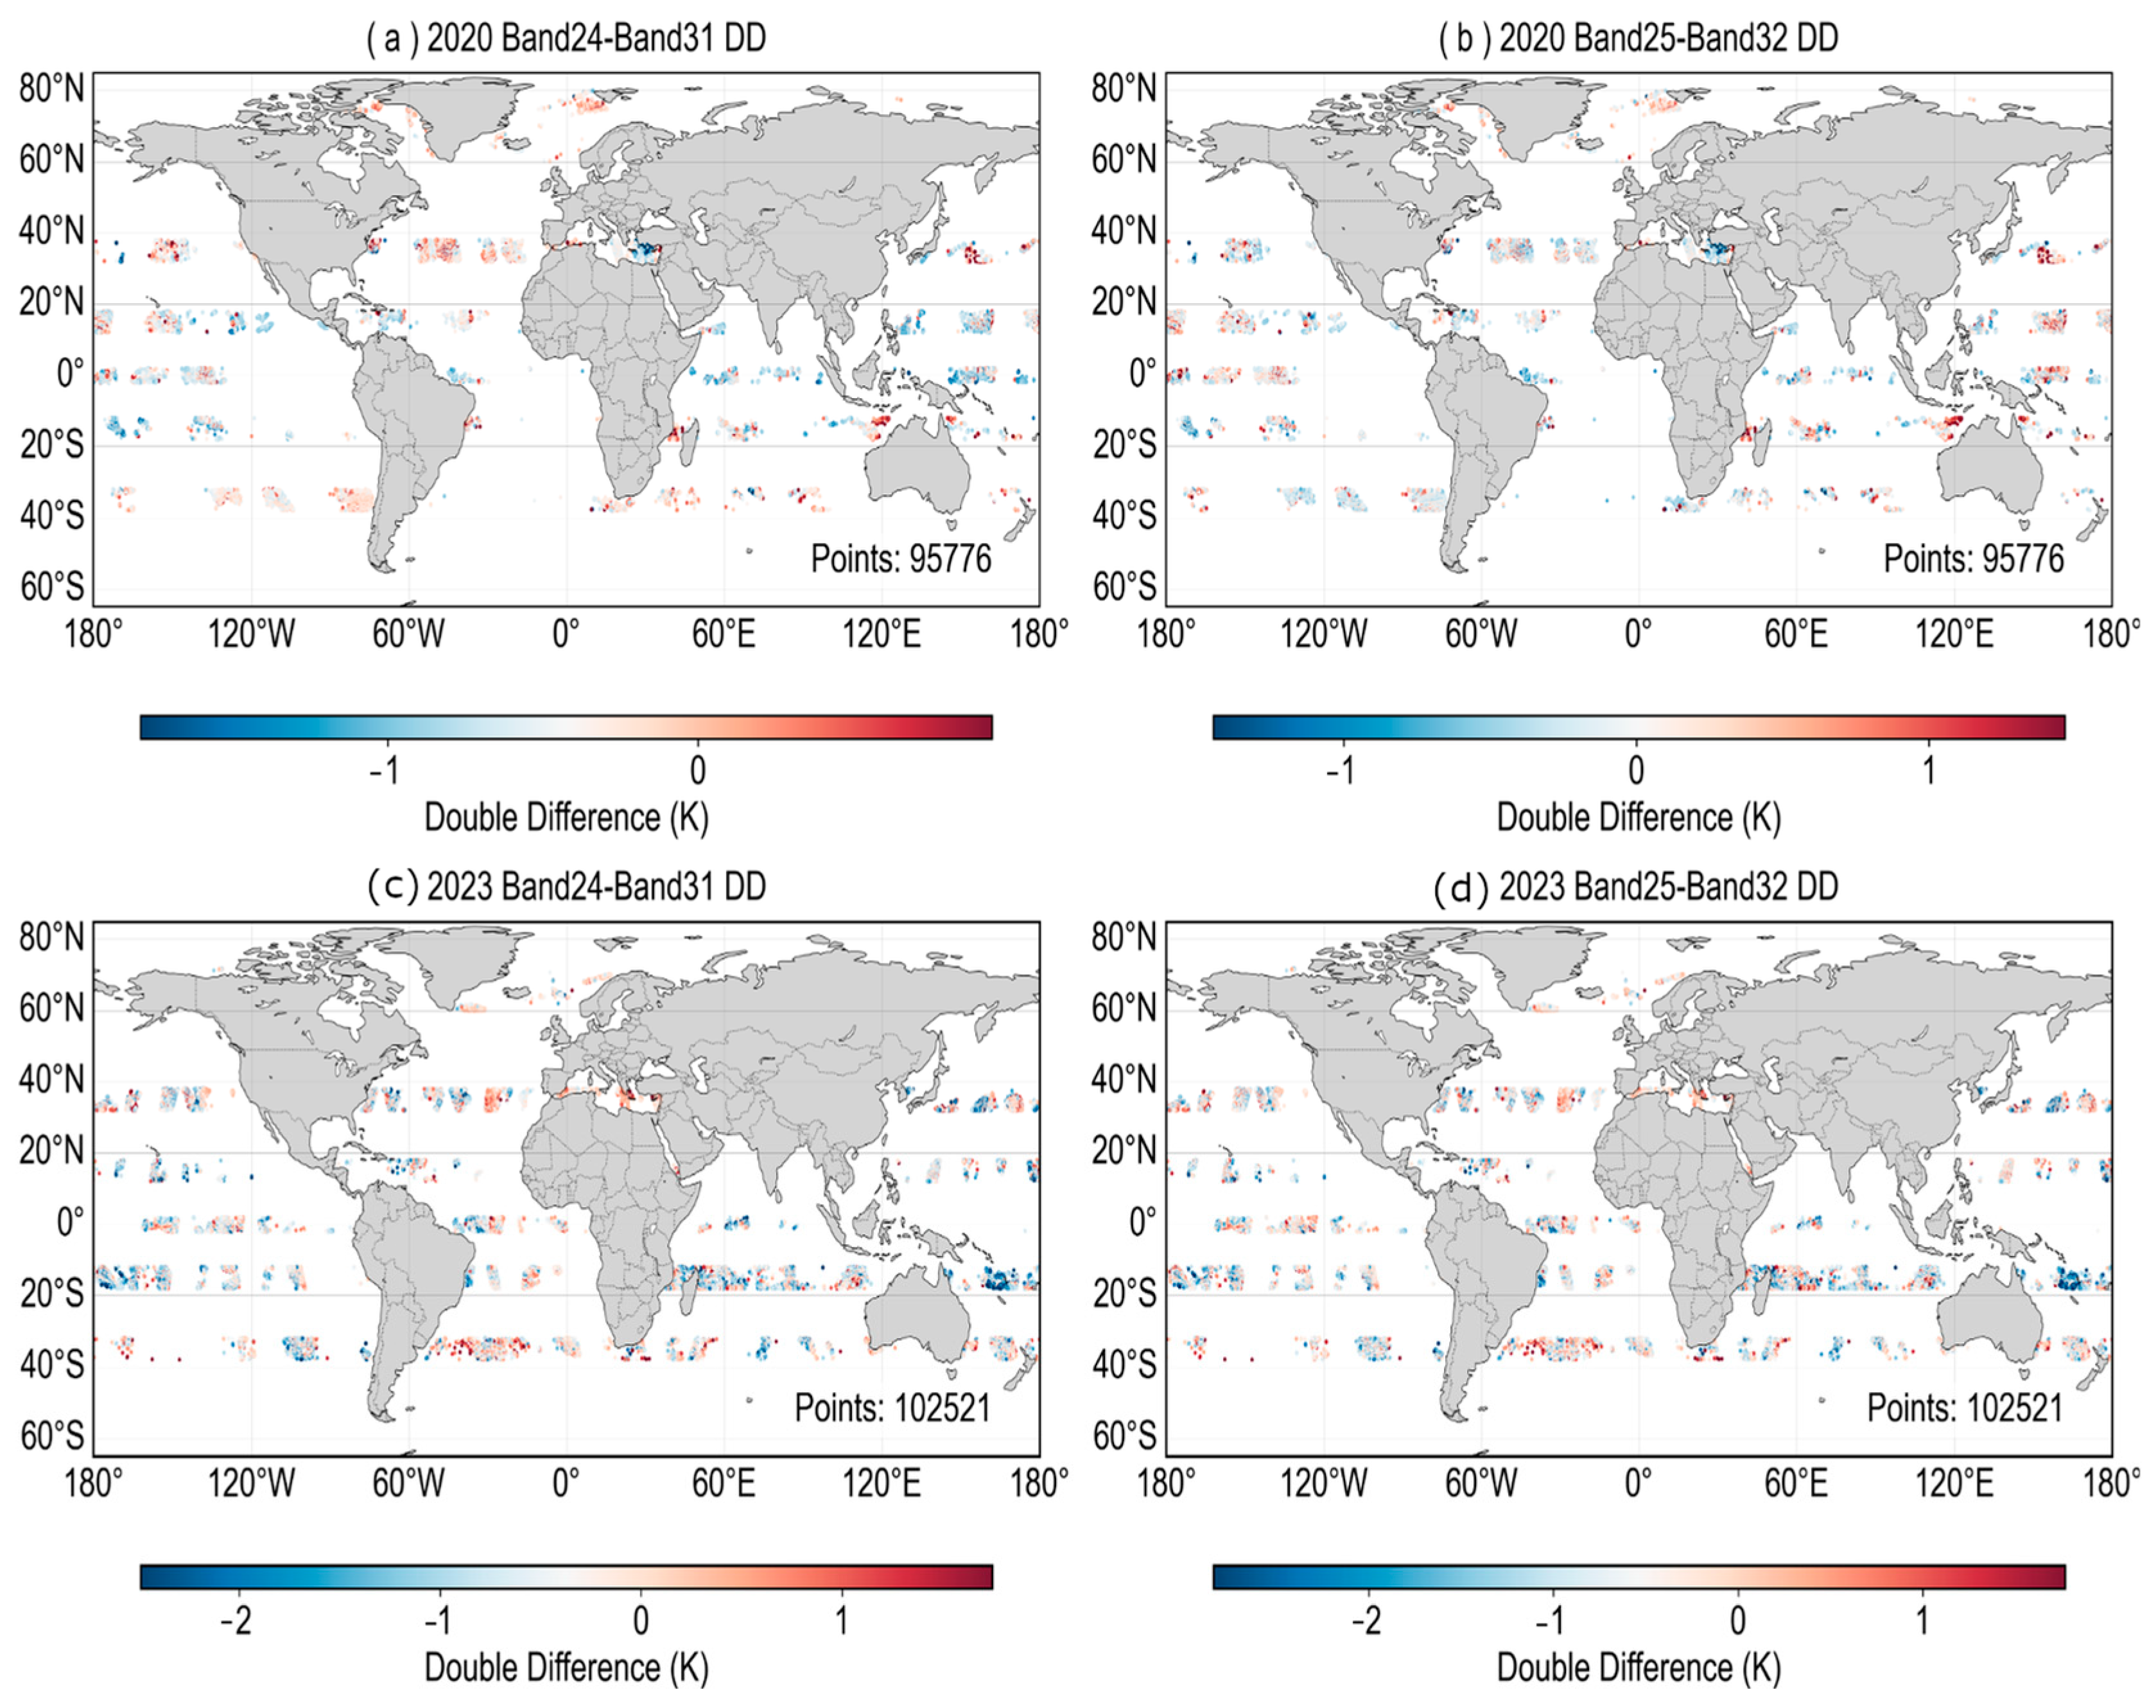
Although 2020 provides more valid oceanic samples, their spatial distribution is uneven, with dense coverage in some regions and large gaps in others—particularly in the Southern Ocean and eastern Pacific. In contrast, the 2023 samples are fewer but more evenly distributed across the oceans, improving the representativeness and stability of the DD calibration.
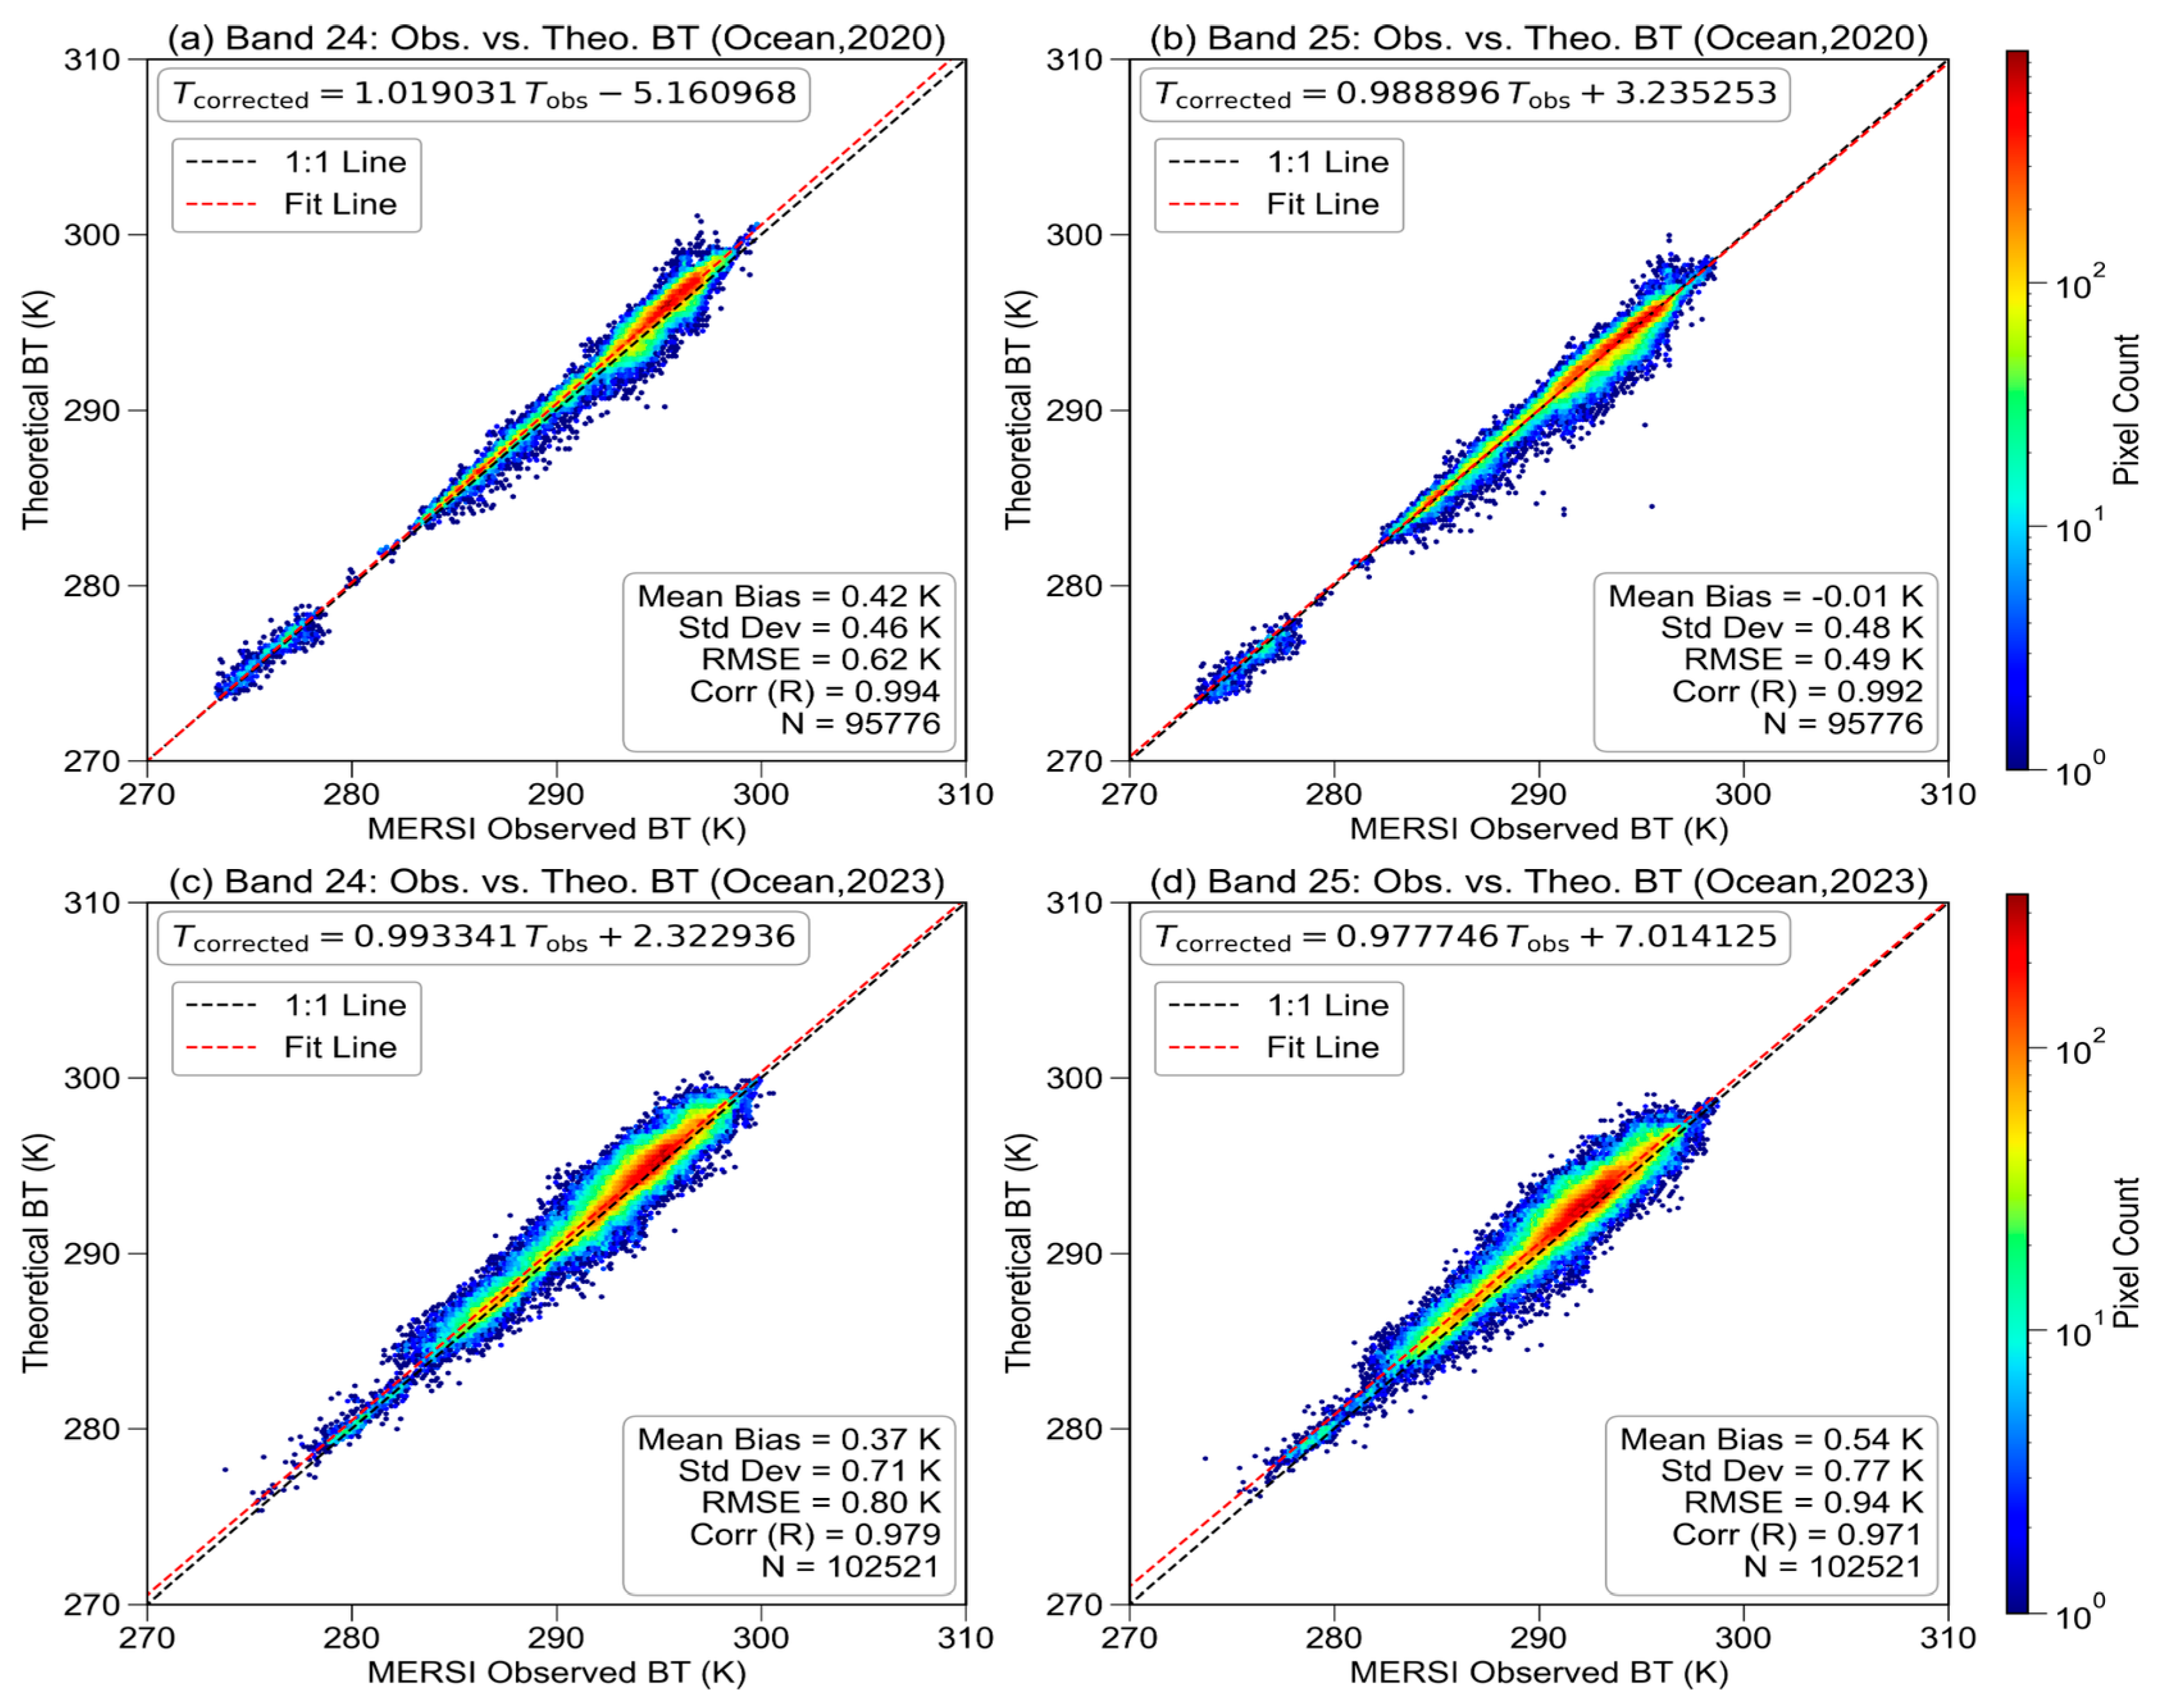
Building on these representative samples, linear regression analysis is conducted using ARMS-simulated BTs and collocated observations from FY-3D MERSI and MODIS. To preserve spatial and spectral integrity, a nearest-neighbor search within 0.001° (~110 m) is applied. To ensure physical consistency, only pixels with |diff₍24₎| < 3 K are retained, and from these, the 100,000 samples with the closest observation–simulation agreement are selected for coefficient fitting. Band 24 (10.8 µm), which exhibits low sensitivity to water vapor, is used as the filtering reference to ensure sample quality. This single-band selection strategy supports robust coefficient derivation applicable to both window bands. Figure 13 and Figure 14 present the final DD sample distributions and regression scatter plots used for coefficient estimation.
Because the regression slopes deviate from unity, the estimated mean bias is affected not only by calibration performance but also by the radiance distribution of the observed scenes. Consequently, regional or temporal variations in mean bias may partly reflect differences in scene radiance distributions in addition to calibration effects. These considerations underscore the importance of jointly evaluating both slope and mean bias when assessing the accuracy and applicability of cross-calibration coefficients.

4.3. Comparative Analysis of Calibration Performance: SNO vs. DD Methods

To evaluate cross-calibration performance, we compare the Simultaneous Nadir Overpass (SNO) and Double Difference (DD) methods using clear-sky oceanic matchups between FY-3D MERSI and MODIS for 2021 and 2022. Because valid SNO matchups in 2023 declined substantially due to orbital drift, the 2020 SNO calibration coefficients are adopted to avoid sampling-related biases.
The two methods differ fundamentally in their filtering strategies and matchup flexibility. SNO applies strict temporal, spatial, and angular thresholds to ensure pixel-level consistency, whereas DD relies on radiative transfer simulations combined with stratified oceanic sampling, without imposing identical filters. Despite these methodological differences, both approaches significantly reduce the MERSI cold bias and RMSE relative to the uncalibrated baseline. Additional analyses in Section 5 confirm that the performance gains observed with DD are not artifacts of filtering, but reflect genuine improvements.
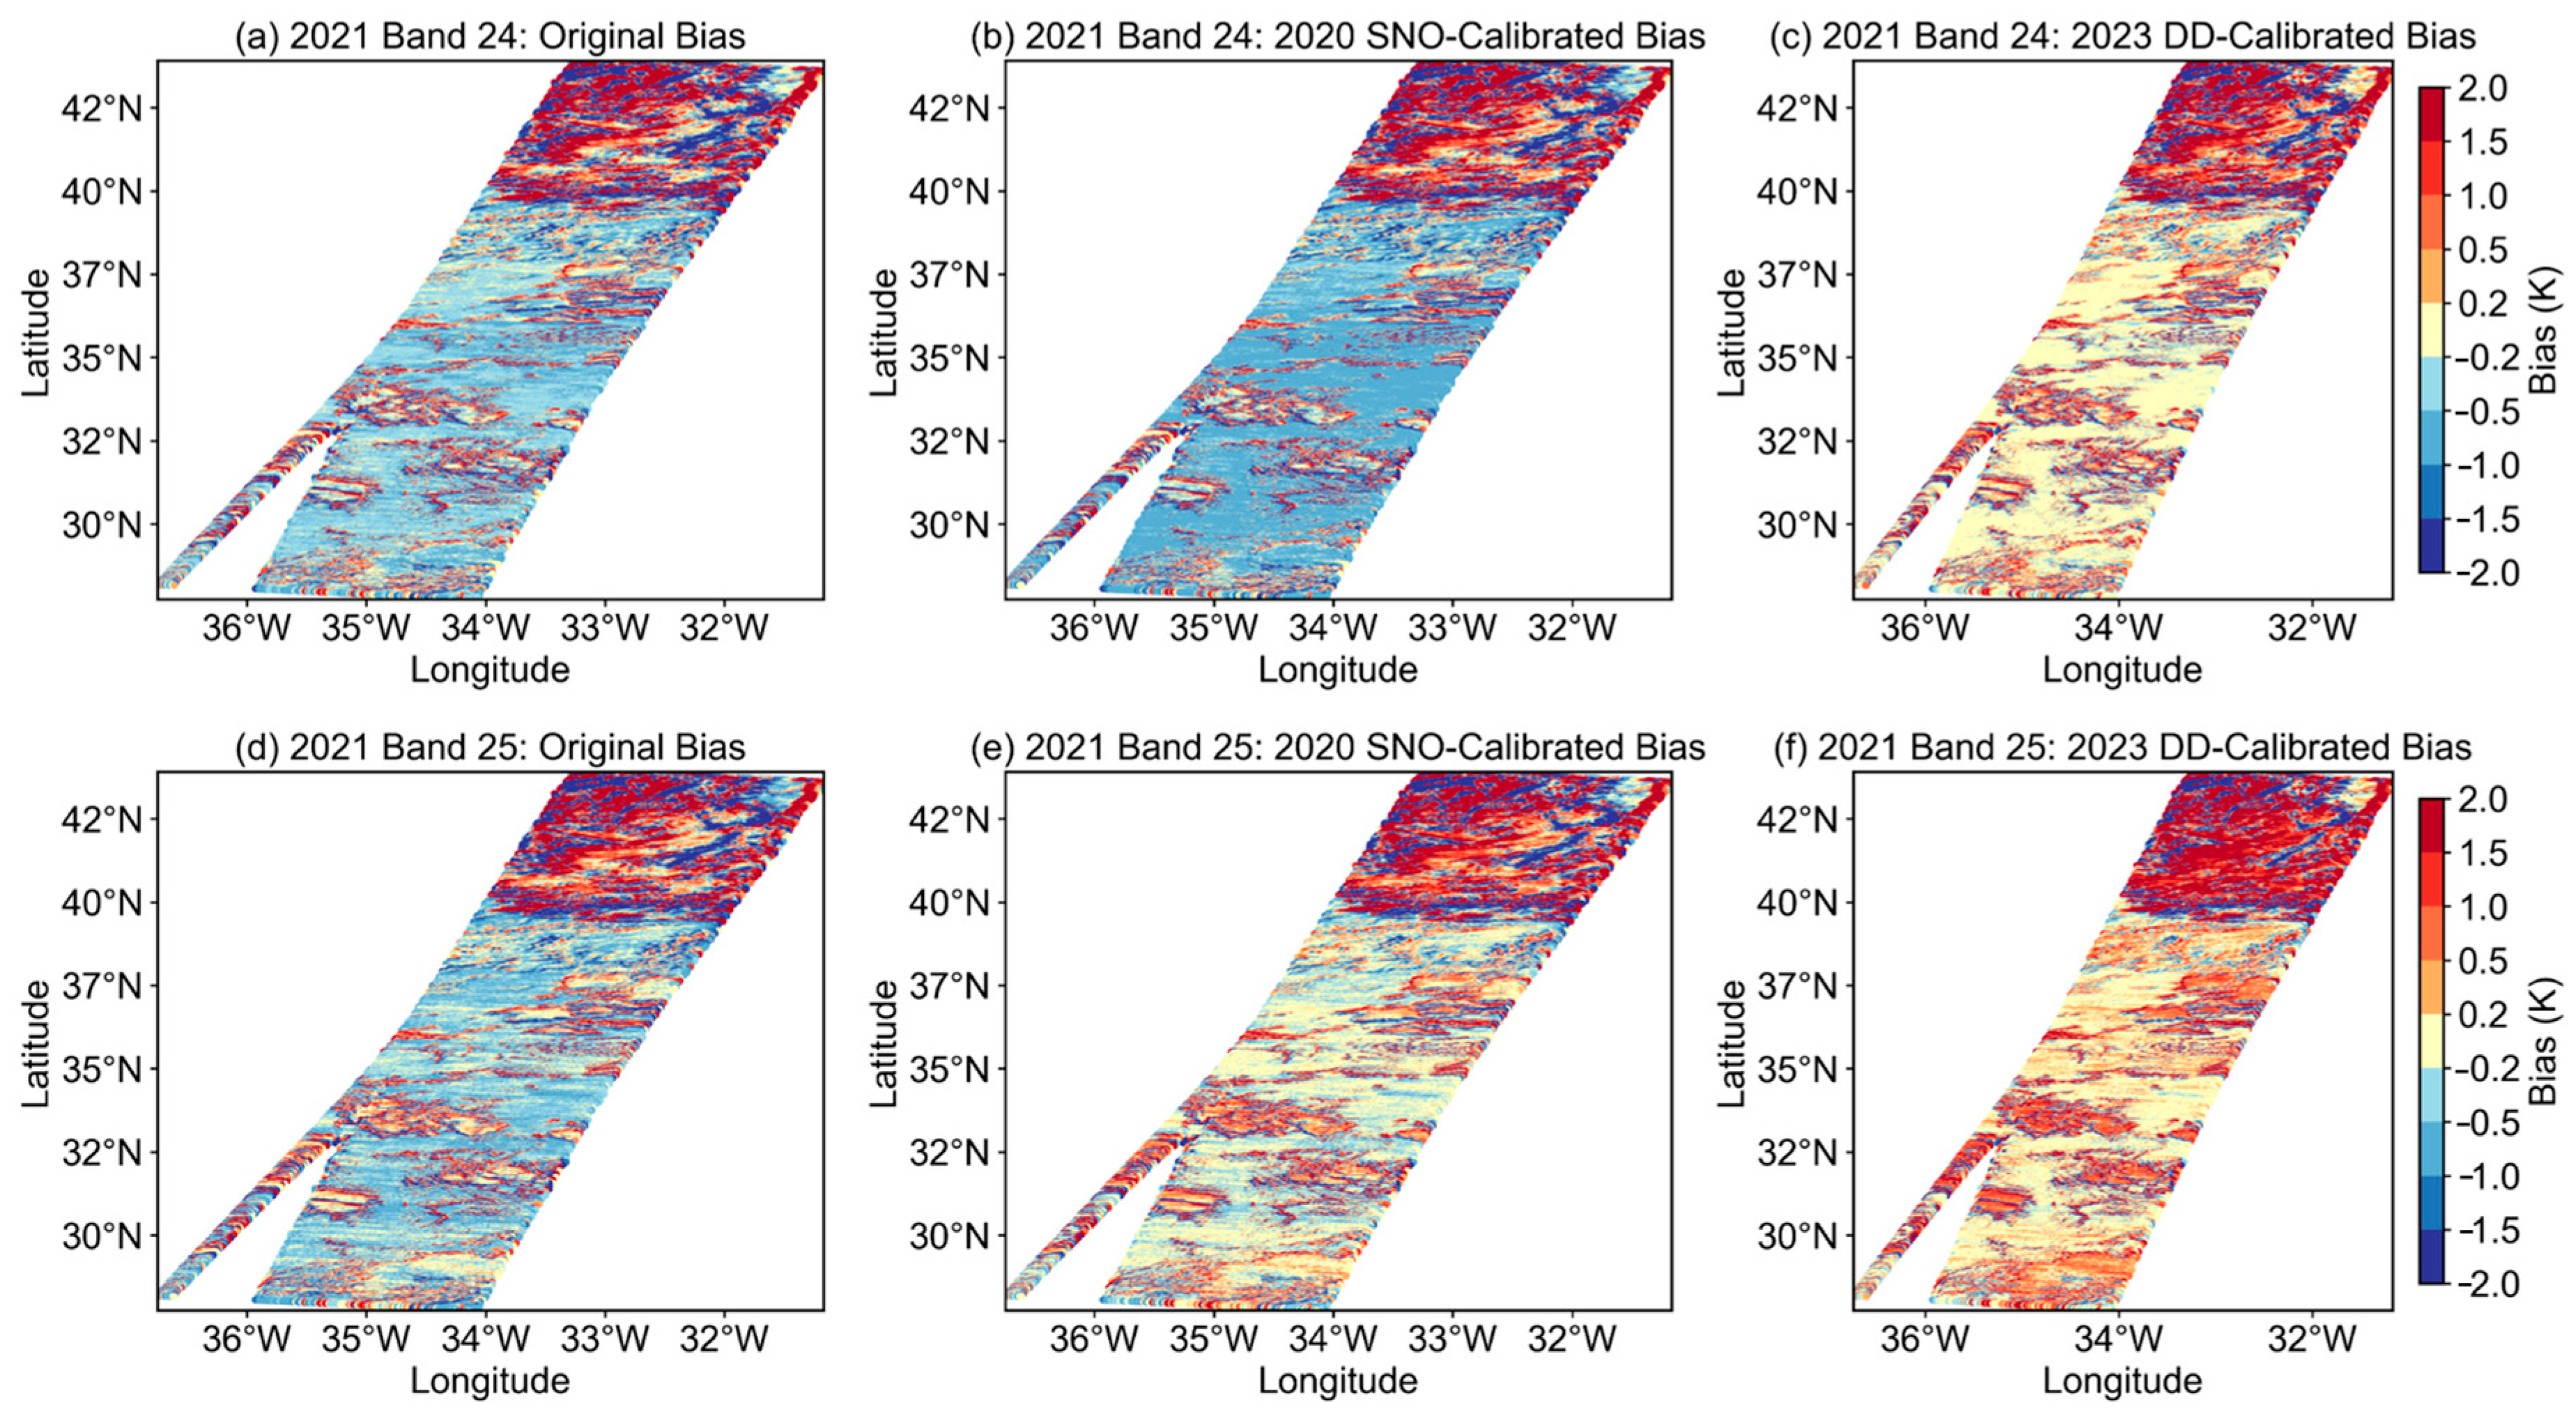
Although the DD correction is implemented as a simple linear function of radiance (Equation (6)), spatial bias maps provide essential diagnostics. They reveal geographic patterns in residuals that may be masked by global statistics. Consequently, difference maps (e.g., Figure 15) are included to provide spatial context and highlight regional calibration behavior.
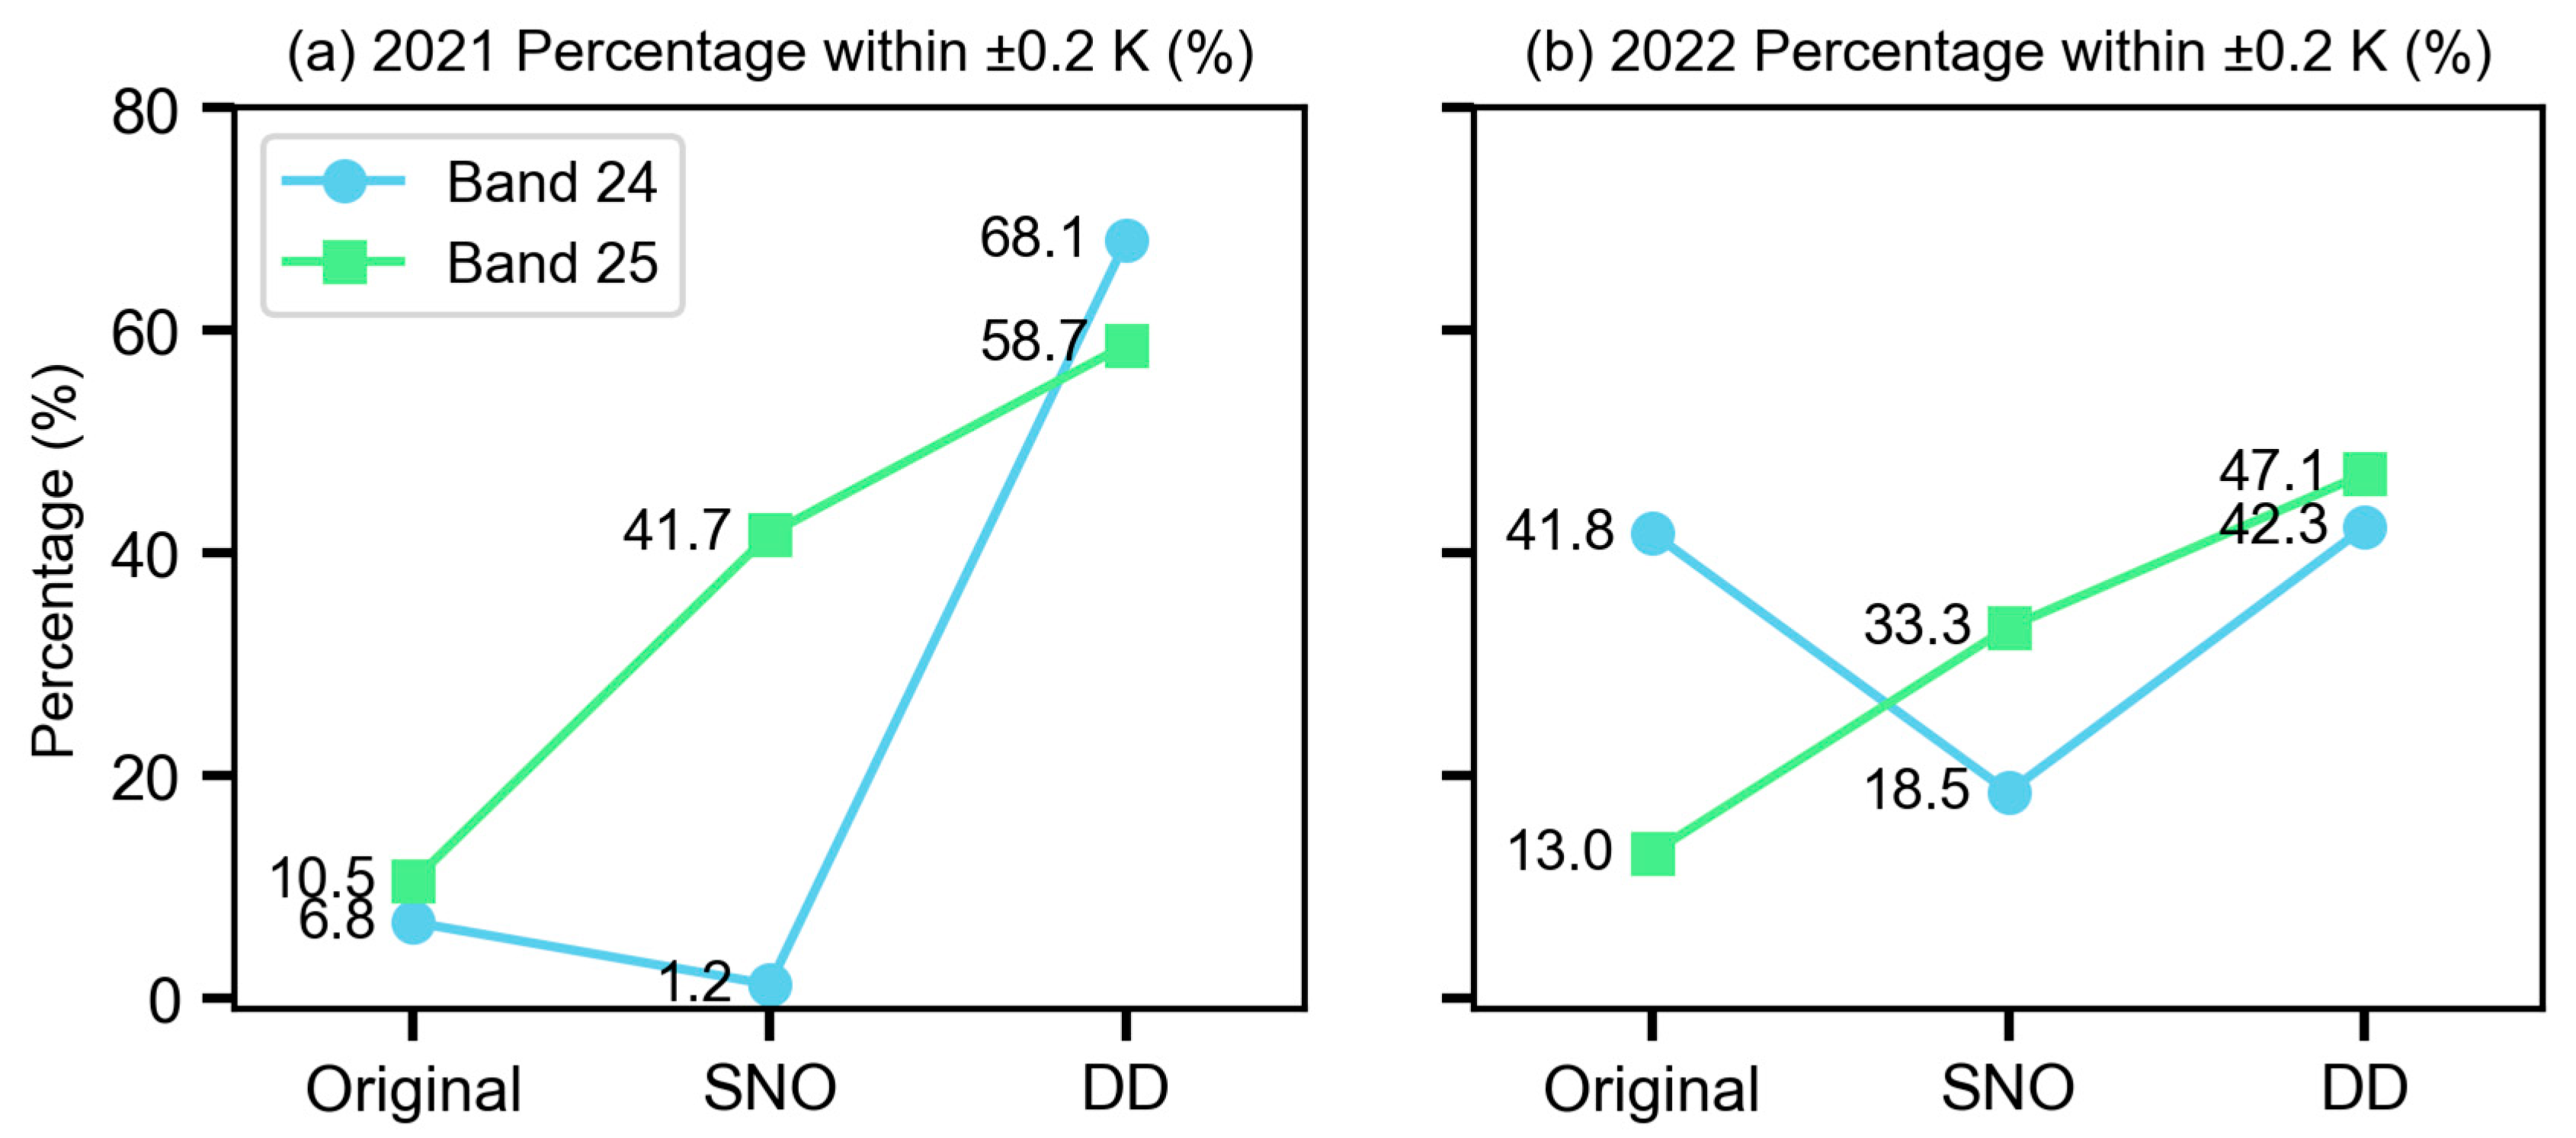
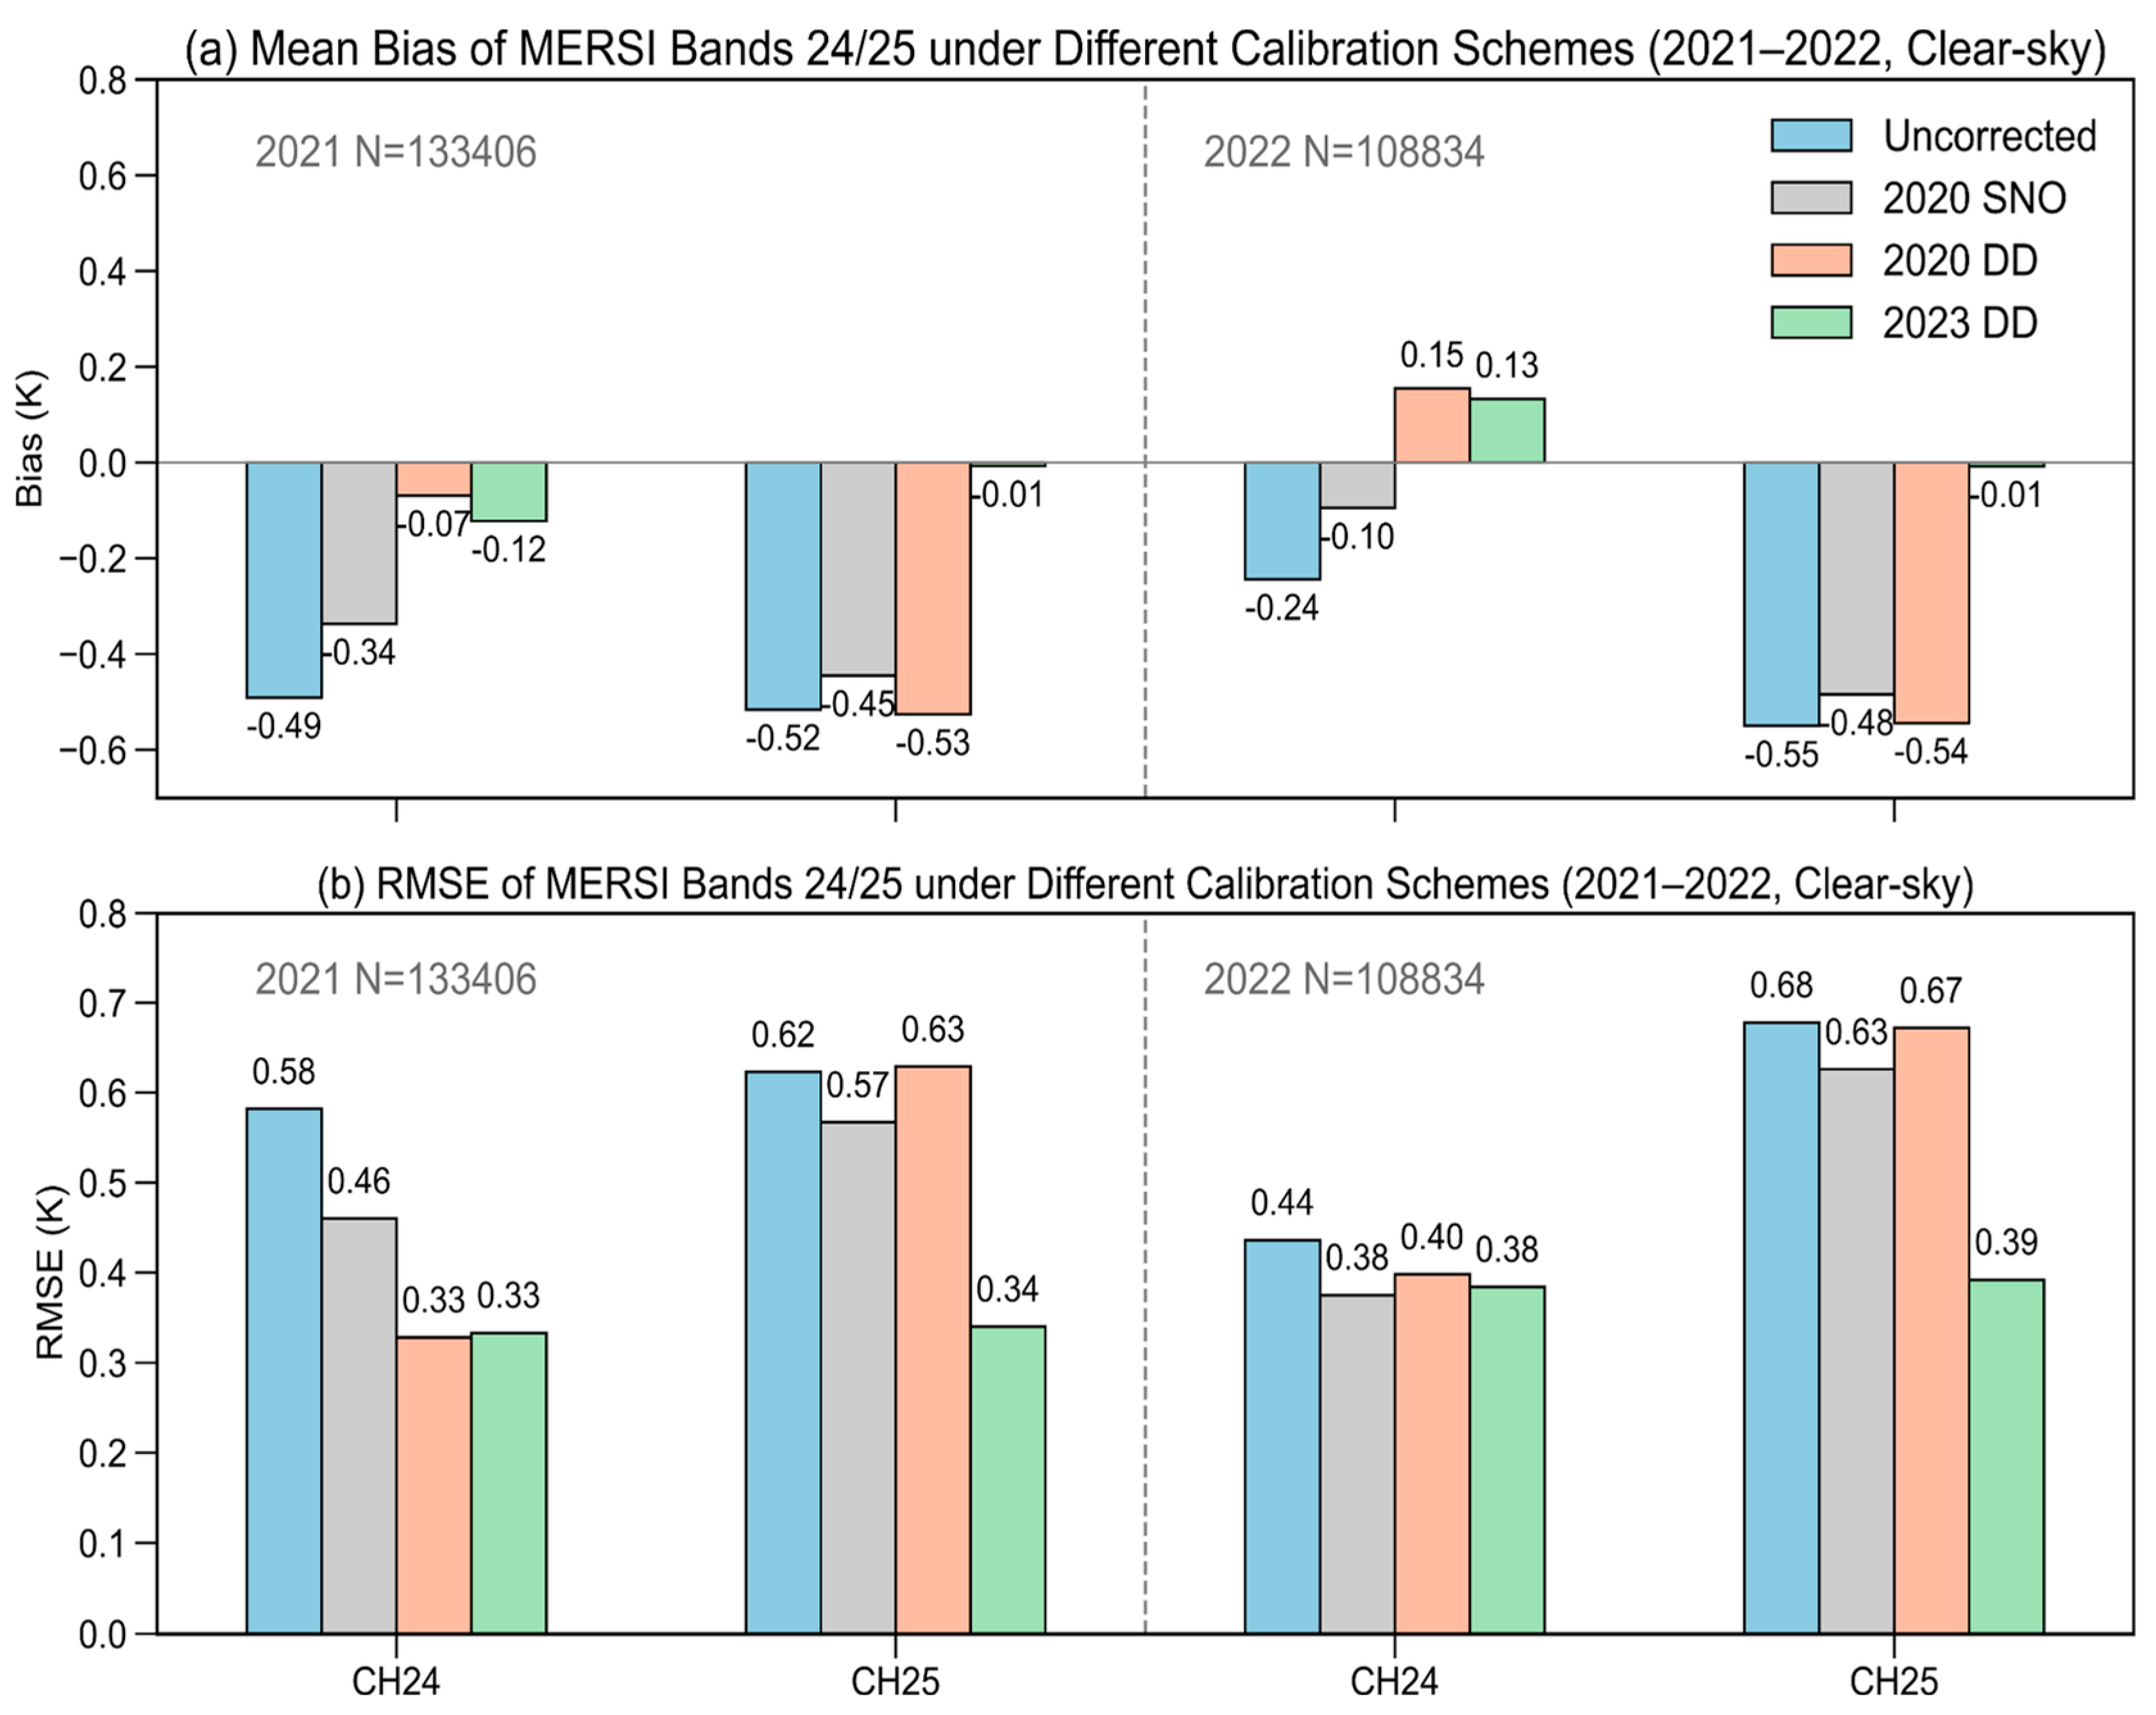
As shown in Figure 15, Figure 16 and Figure 17, the DD calibration based on 2023 coefficients achieves the best overall performance across both years. DD substantially increases the proportion of pixels with residuals within ±0.2 K, while SNO-calibrated data exhibit more persistent negative biases. For instance, in 2021, the CH25 bias decreases from −0.52 K (uncalibrated) to −0.45 K (SNO), and further to −0.01 K (DD), with RMSE reduced from 0.62 K to 0.57 K (SNO) and 0.34 K (DD). Similar improvements are seen in 2022, with CH25 DD biases close to −0.01 K and RMSE around 0.39 K. By contrast, DD coefficients derived from the 2020 dataset show less consistent improvements, occasionally performing worse than SNO due to limited sample representativeness.
These results demonstrate that DD calibration based on the 2023 dataset provides more stable and transferable coefficients across years, whereas the 2020-based DD calibration is less reliable. The effectiveness of the DD method therefore depends strongly on the spatial representativeness of its training dataset. Ensuring well-distributed samples is critical for maintaining the stability, accuracy, and generalizability of cross-sensor calibration results.

5. Discussion

Previous inter-calibration studies (e.g., GSICS reports and MODIS–AVHRR and FY-3 series analyses) have generally confirmed the effectiveness of both SNO- and model-based methods in reducing sensor biases, though each approach has clear limitations. Our results align with these findings but extend them through a direct, side-by-side comparison of the SNO and DD methods for FY-3D MERSI infrared bands, with radiative transfer simulations provided by the ARMS model. This assessment highlights the relative advantages of the two approaches under realistic sampling conditions and offers new insights into their practical applicability.
The regression coefficients for the DD method are derived solely from clear-sky radiative transfer simulations. Applying DD-derived coefficients directly to cloudy scenes introduces physical inconsistency, given the fundamentally different radiative transfer processes involved. This mismatch explains the tendency of DD to over-correct in cloud-contaminated areas. As illustrated in Figure 18, omitting cloud screening produces spurious over-corrections in regions with cloud cover. Therefore, while DD performs best under clear-sky conditions, its application to cloudy scenes should be approached cautiously, and further refinement is needed to ensure accuracy under all-sky conditions.

5.1. Uncertainty Considerations

Uncertainty in cross-sensor calibration arises not only from algorithmic design but also from observational conditions. In this study, we evaluate the major sources of uncertainty affecting the SNO and DD methods, including (i) spectral response function (SRF) mismatch, (ii) threshold sensitivity of the DD method, (iii) representativeness of SNO samples, and (iv) angular dependence of residual biases.
(i) SRF mismatch
Differences between the spectral response functions (SRFs) of MODIS and MERSI inevitably introduce additional uncertainty in brightness temperature calculations. Radiative transfer simulations using ARMS (Figure 19) show that the mean ΔBT is +0.16 K for MERSI Band 24 versus MODIS Band 31 and −0.38 K for MERSI Band 25 versus MODIS Band 32 (total sample size = 26,750,445). For Band 25, the effect appears mainly as a nearly constant offset, whereas for Band 24 the discrepancies vary across the dynamic range, resembling a gain-like adjustment that can influence slope estimates. While part of these systematic differences is absorbed during the regression processes of both SNO and DD, SRF mismatch remains an intrinsic factor that can affect calibration accuracy and should be explicitly recognized. In this study, its impact is quantitatively characterized and considered in the uncertainty analysis, and future GSICS-compliant frameworks incorporating hyperspectral references (e.g., IASI/CrIS) are expected to further mitigate this source of uncertainty.
(ii) Threshold sensitivity
Calibration performance is evaluated for DD thresholds ranging from 0.5 K to 3 K (Figure 20). A clear trade-off emerges. Stricter thresholds (e.g., 0.5 K) significantly reduce RMSE and mean bias, but they also severely limit the number of valid matchups, thereby compromising statistical robustness. Looser thresholds (>2 K) retain more samples but introduce larger biases and distort the regression slope. The 1.0–1.5 K range provides the optimal balance, minimizing RMSE and bias while preserving sufficient matchup volume for stable regression, as illustrated by the 1 July 2023 case study. In practice, the threshold choice may be flexibly adjusted depending on the specific application requirements, such as prioritizing accuracy or sample size.
Beyond threshold selection, the effectiveness of the DD method also depends strongly on the spatial representativeness of its training dataset. Ensuring well-distributed samples is critical for maintaining stability, accuracy, and generalizability of cross-sensor calibration results. Our findings indicate that DD coefficients derived from representative 2023 samples generalize better across years. In contrast, the 2020-based DD calibration suffers from spatial clustering and regional gaps, leading to reduced robustness and potential overfitting. Therefore, before performing DD regression, it is advisable to evaluate the spatial distribution of matchups on the selected reference date. If clustering or voids are evident—as observed on 1 July 2020—an alternative date with more uniform and representative coverage should be selected.
(iii) Representativeness of SNO samples
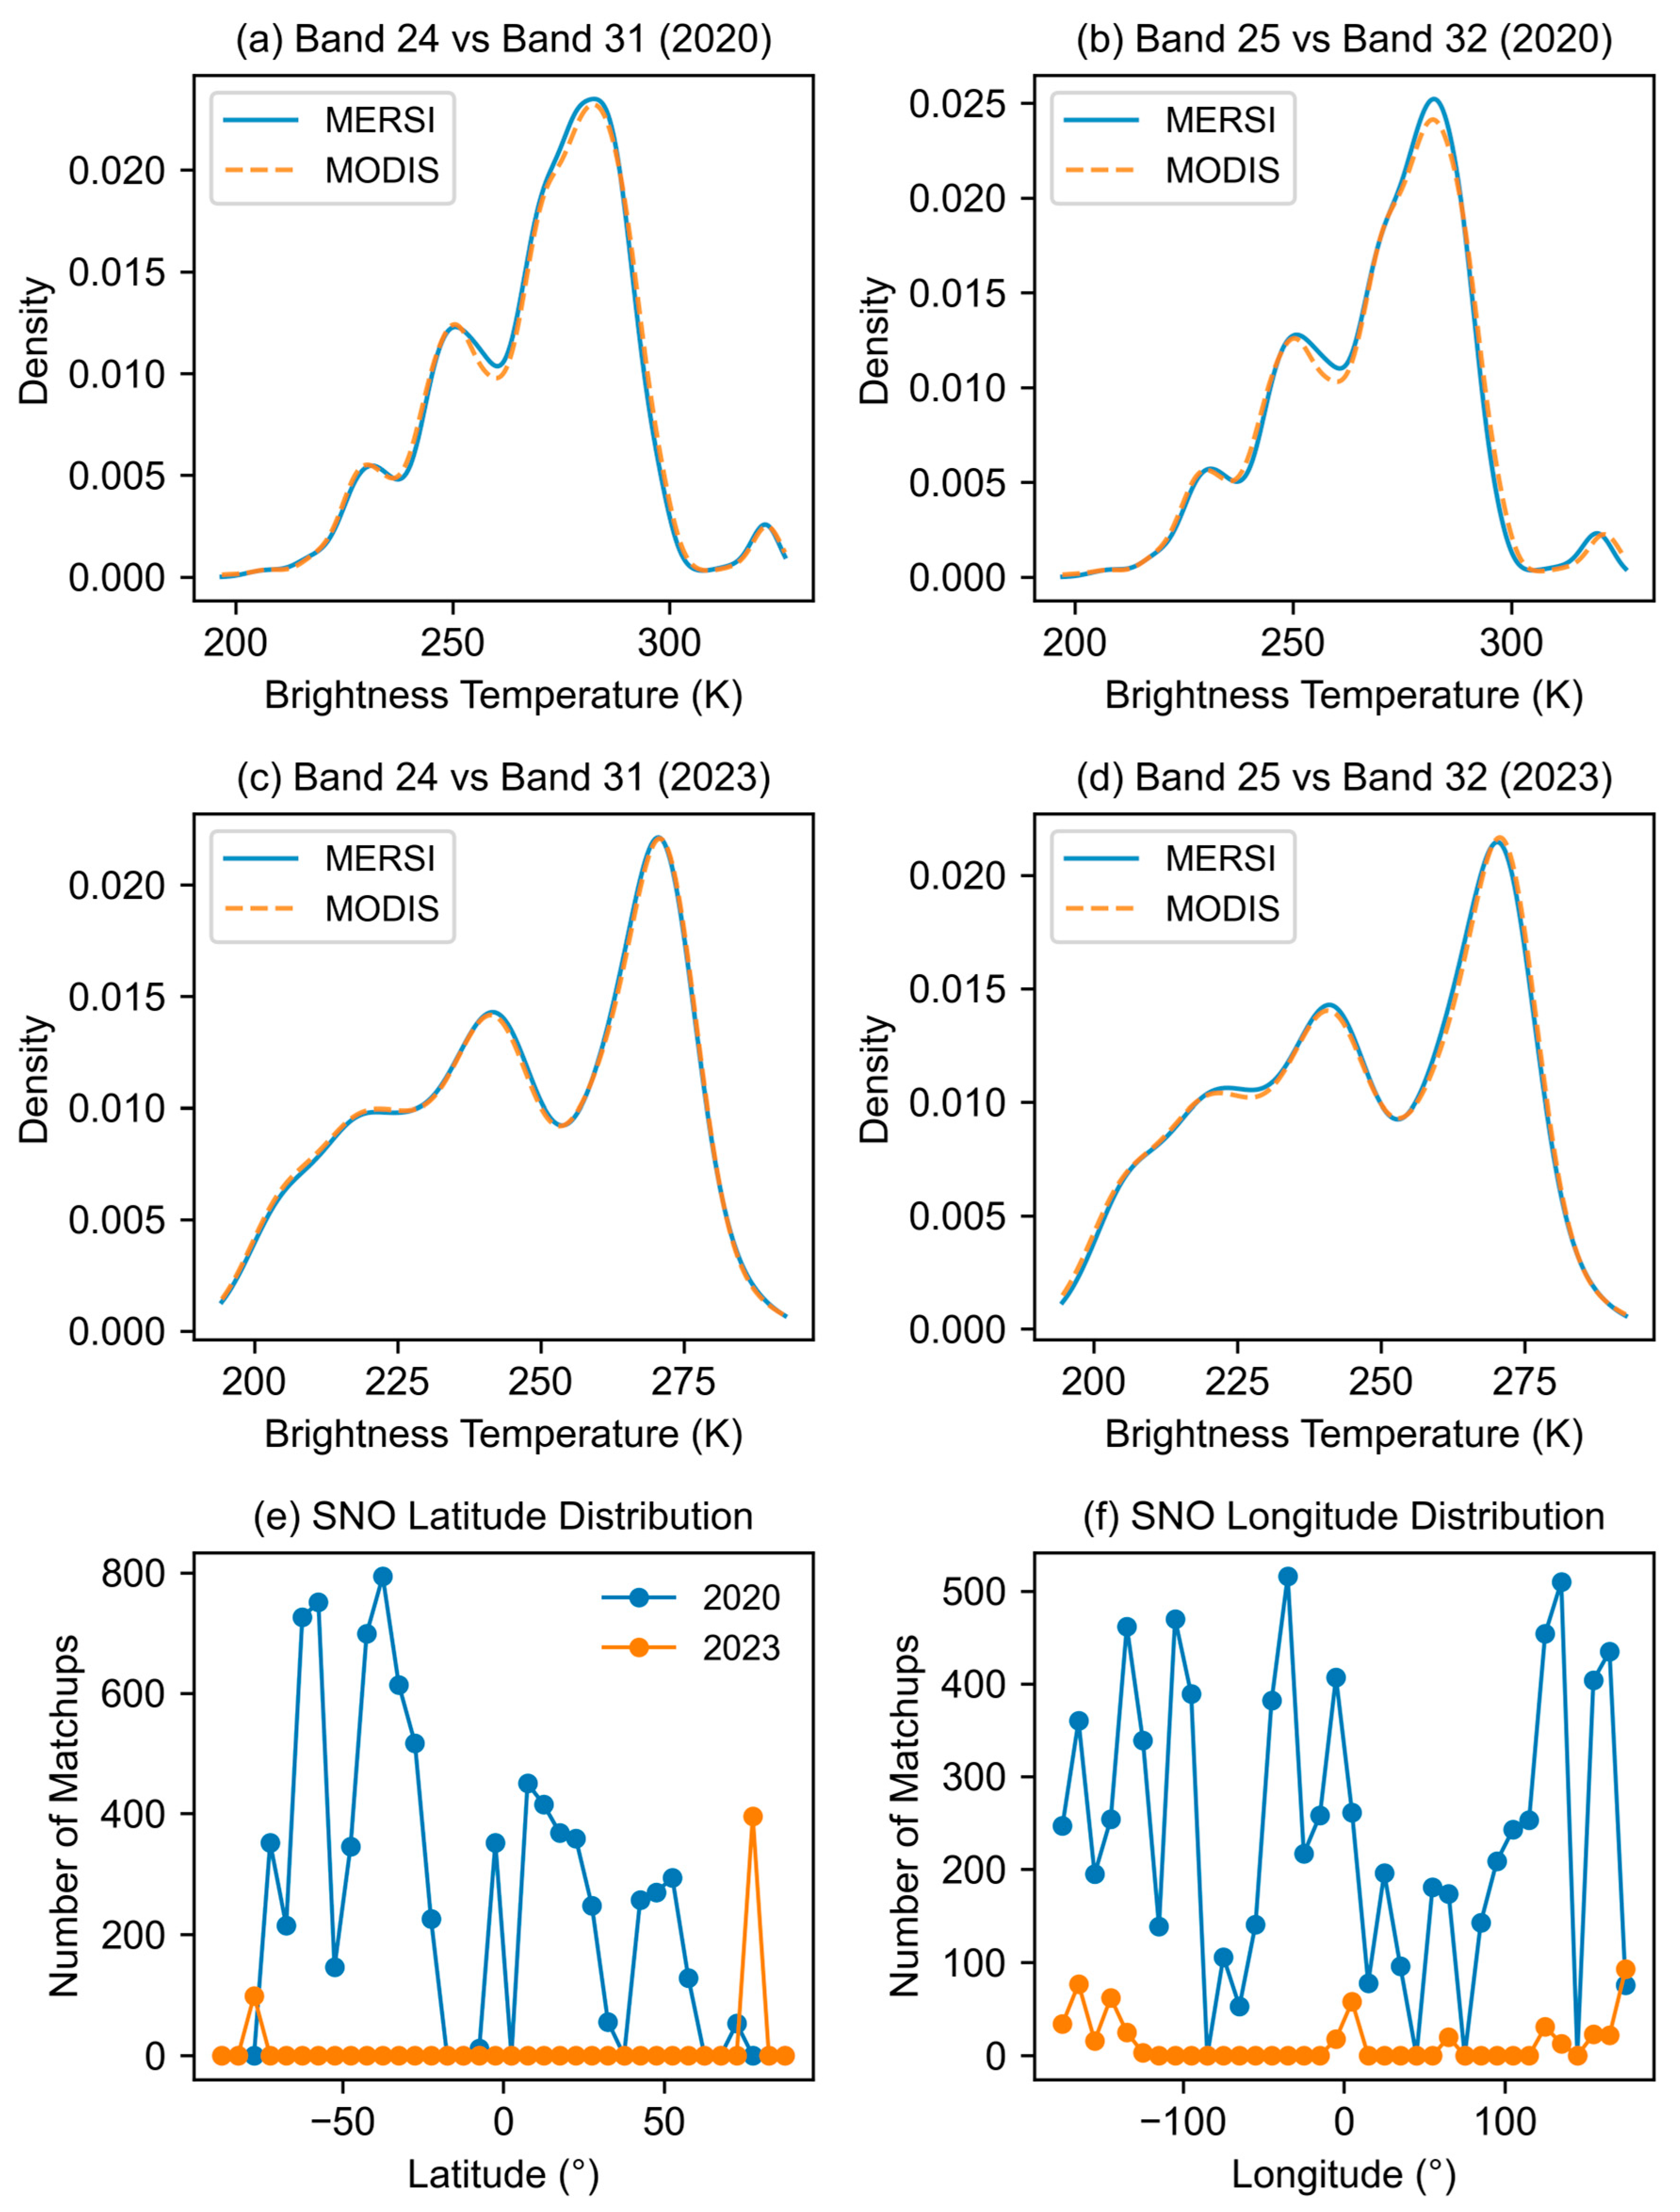
The radiometric and spatial representativeness of SNO matchups is equally critical. KDE distributions (Figure 21a–d) show that MERSI and MODIS samples are well-aligned in 2020, indicating no systematic radiometric bias. The spatial distributions (Figure 21e–f) further confirm near-global coverage in 2020. However, in 2023, matchups became more clustered and exhibited narrower brightness temperature ranges, leading to unstable regressions and occasional bias reversals. This degradation is attributed primarily to loss of sample representativeness, not inherent radiometric errors.
(iv) Angular dependence
Sensor geometry introduces residual uncertainty even after calibration. Figure 22 demonstrates MERSI–MODIS biases as a function of MERSI zenith angle. While both methods reduce overall biases, angle-dependent residuals persist—particularly for Band 25 vs. 32 at larger zenith angles. This behavior reflects uncorrected effects from atmospheric path length and surface anisotropy. Consequently, refined angular correction schemes are required in future cross-calibration workflows.
Collectively, these analyses highlight the complementary nature of SNO and DD. SNO offers broader coverage but suffers from sample representativeness loss, while DD provides higher precision under stricter conditions but is sensitive to threshold selection. By quantifying the impacts of SRF mismatch, threshold sensitivity, sample representativeness, and angular dependence, this study provides a structured uncertainty assessment and identifies pathways to enhance the robustness of future cross-sensor calibration.

5.2. Advances and Contributions

This study advances cross-calibration of FY-3D MERSI TIR Bands 24 and 25 against MODIS/Aqua in three key aspects. First, we provide a systematic like-for-like comparison of SNO and DD under consistent conditions, avoiding the inconsistencies of earlier studies and establishing a reproducible framework for future applications. Second, the analysis is supported by large matchup datasets and ARMS simulations, ensuring robust statistics and stable performance even at larger view zenith angles. With more than 100,000 real samples per band and 26 million forward simulations, uncertainties are quantified with high confidence. Third, we explicitly assess SRF-induced differences, identifying mean offsets of +0.16 K for Band 24 and −0.38 K for Band 25 and incorporating these effects into the uncertainty assessment. Collectively, these advances achieve biases within ±0.1 K, RMSE of 0.3–0.4 K, and flatter angular and thermal dependencies, delivering calibration that is more accurate, stable, and transferable than existing approaches.

6. Conclusions

Building on these advances beyond the current state of the art under the tested conditions, this study presents a systematic evaluation of two cross-calibration methods—Simultaneous Nadir Overpass (SNO) and Double Difference (DD)—for FY-3D MERSI thermal infrared Bands 24 and 25 against Aqua MODIS. Using regression modeling, ARMS radiative transfer simulations, and validation under clear-sky conditions, we highlight the relative strengths and limitations of each approach. The key findings are as follows.
(1) DD shows clear superiority under clear-sky conditions
The DD method significantly reduces bias and RMSE for both bands and increases the proportion of retrievals within ±0.2 K relative to MODIS. This fraction rises from 7–42% (uncalibrated) and 1–33% (SNO) to 42–68% (DD), confirming DD’s advantage in high-accuracy applications such as land surface temperature retrieval and long-term climate monitoring.
(2) Larger training samples enhance regression robustness
A major strength of DD is its ability to exploit large matchup datasets—exceeding 100,000 samples per band—compared to the few thousand available for SNO. This improves statistical stability, reduces sensitivity to outliers, and enhances generalization across spatial and temporal domains.
(3) SNO faces intrinsic limitations
While effective in correcting cold biases under all-sky conditions, SNO suffers from a progressive loss of sample representativeness due to orbital drift and cloud screening. This limits regression stability and long-term reliability.
(4) DD offers operational flexibility and scalability
DD calibration coefficients demonstrate robust performance across multiple years (2021–2022), even when derived from a single reference date (e.g., 1 July 2023), highlighting their strong generalizability. This flexibility enables routine, scalable cross-sensor calibration and long-term radiometric monitoring.
In summary, the DD method provides a high-accuracy, scalable complement to the SNO approach, particularly when SNO opportunities are limited. However, threshold sensitivity and angular dependencies remain challenges that warrant further methodological refinement. By integrating SNO’s ability to provide calibration opportunities under cloudy conditions with DD’s high precision, this study delivers the first side-by-side evaluation of FY-3D MERSI infrared calibration strategies. The findings provide a foundation for improving radiometric consistency, preserving climate records, and advancing global Earth observation systems.
Future work should aim to (i) validate DD and SNO under diverse surface and atmospheric regimes, (ii) conduct multi-year assessments to monitor coefficient stability, (iii) extend the framework to additional sensors and bands, and (iv) incorporate hyperspectral references (e.g., IASI/CrIS) with spectral convolution to achieve fuller alignment with GSICS best practices.

Author Contributions

Conceptualization, S.A. and F.W.; methodology, S.A.; validation, S.A.; writing—original draft preparation, S.A.; writing—review and editing, F.W. and X.H., and C.Y.; supervision, F.W. and X.H. All authors have read and agreed to the published version of the manuscript.

Funding

This research was supported by the Hunan Provincial Natural Science Foundation of China (grant number 2021JC0009).

Data Availability Statement

The FY-3D/MERSI Level-1 and Level-2 datasets used in this study are publicly available from the National Satellite Meteorological Center of China (http://satellite.nsmc.org.cn, accessed on 20 July 2025); MODIS Level-1 and Level-2 products are available from the NASA LAADS DAAC (https://ladsweb.modaps.eosdis.nasa.gov, accessed on 20 July 2025); ERA5 reanalysis data are obtained from the Copernicus Climate Data Store (https://cds.climate.copernicus.eu, accessed on 20 July 2025). All additional data and simulation code used in this study are available from the corresponding author upon reasonable request.

Acknowledgments

The authors would like to express their sincere gratitude to the anonymous reviewers for their valuable and insightful comments and constructive suggestions, which greatly helped to improve the quality and clarity of this manuscript.

Conflicts of Interest

The authors declare no conflicts of interest.

Abbreviations

The following abbreviations are used in this manuscript:
FY-3DFengyun-3D (Chinese Polar-Orbiting Meteorological Satellite)
MERSIMedium Resolution Spectral Imager
MODISModerate Resolution Imaging Spectroradiometer
SNOSimultaneous Nadir Overpass
DDDouble Difference
TIRThermal Infrared
SRFSpectral Response Function
BTBrightness Temperature
LSTLand Surface Temperature
OMBObservation minus Background (or Simulation)
RMSERoot Mean Square Error
ARMSAdvanced Radiative Transfer Modeling System
ERA5Fifth-Generation ECMWF Atmospheric Reanalysis
NASANational Aeronautics and Space Administration
ECMWFEuropean Centre for Medium-Range Weather Forecasts
RTMRadiative Transfer Model
NWPNumerical Weather Prediction
GSICSGlobal Space-based Inter-Calibration System
IASIInfrared Atmospheric Sounding Interferometer
CrISCross-track Infrared Sounder

References

  1. Minnis, P.; Nguyen, L.; Doelling, D.R.; Young, D.F.; Miller, W.F.; Kratz, D.P. Rapid calibration of operational and research meteorological satellite imagers. Part II: Comparison of infrared channels. J. Atmos. Oceanic Technol. 2002, 19, 1250–1266. [Google Scholar] [CrossRef]
  2. Li, Z.-L.; Tang, B.-H.; Wu, H.; Ren, H.; Yan, G.; Wan, Z.; Trigo, I.F.; Sobrino, J.A. Satellite-derived land surface temperature: Current status and perspectives. Remote Sens. Environ. 2013, 131, 14–37. [Google Scholar] [CrossRef]
  3. Li, Z.; Wu, H.; Duan, S.; Zhao, W.; Ren, H.; Liu, X.; Leng, P.; Tang, R.; Ye, X.; Zhu, J.; et al. Satellite remote sensing of global land surface temperature: Definition, methods, products, and applications. Rev. Geophys. 2023, 61, e2022RG000777. [Google Scholar] [CrossRef]
  4. Giering, R.; Quast, R.; Mittaz, J.P.D.; Hunt, S.E.; Harris, P.M.; Woolliams, E.R.; Merchant, C.J. A novel framework to harmonise satellite data series for climate applications. Remote Sens. 2019, 11, 1002. [Google Scholar] [CrossRef]
  5. Xiong, X.; Barnes, W. An overview of MODIS radiometric calibration and characterization. Adv. Atmos. Sci. 2006, 23, 69–79. [Google Scholar] [CrossRef]
  6. Xiong, X.; Chiang, K.; Esposito, J.; Guenther, B.; Barnes, W. MODIS on-orbit calibration and characterization. Metrologia 2003, 40, S89–S92. [Google Scholar] [CrossRef]
  7. Chander, G.; Hewison, T.J.; Fox, N.; Wu, X.; Xiong, X.; Blackwell, W.J. Overview of intercalibration of satellite instruments. IEEE Trans. Geosci. Remote Sens. 2013, 51, 1056–1080. [Google Scholar] [CrossRef]
  8. Gil, J.; Rodrigo, J.F.; Salvador, P.; Gómez, D.; Sanz, J.; Casanova, J.L. An empirical radiometric intercomparison methodology based on global simultaneous nadir overpasses applied to Landsat 8 and Sentinel-2. Remote Sens. 2020, 12, 2736. [Google Scholar] [CrossRef]
  9. Uprety, S.; Cao, C.; Xiong, X.; Blonski, S.; Wu, A.; Shao, X. Radiometric intercomparison between Suomi-NPP VIIRS and Aqua MODIS reflective solar bands using simultaneous nadir overpass in the low latitudes. J. Atmos. Oceanic Technol. 2013, 30, 2720–2736. [Google Scholar] [CrossRef]
  10. Xu, N.; Chen, L.; Hu, X.; Zhang, L.; Zhang, P. Assessment and correction of on-orbit radiometric calibration for FY-3 VIRR thermal infrared channels. Remote Sens. 2014, 6, 2884–2897. [Google Scholar] [CrossRef]
  11. Cao, C.; Uprety, S.; Blonski, S. Establishing radiometric consistency among VIIRS, MODIS, and AVHRR using SNO and SNOx methods. In Proceedings of the 2012 IEEE International Geoscience and Remote Sensing Symposium (IGARSS), Munich, Germany, 22–27 July 2012; IEEE: New York, NY, USA; pp. 6928–6931. [Google Scholar]
  12. Ye, X.; Ren, H.; Liang, Y.; Zhu, J.; Guo, J.; Nie, J.; Zeng, H.; Zhao, Y.; Qian, Y. Cross-calibration of Chinese Gaofen-5 thermal infrared images and its improvement on land surface temperature retrieval. Int. J. Appl. Earth Obs. Geoinf. 2021, 101, 102357. [Google Scholar] [CrossRef]
  13. Gu, Z.; Chen, L.; Dai, H.; Tian, L.; Hu, X.; Zhang, P. The uncertainty of SNO cross-calibration for satellite infrared channels. Remote Sens. 2023, 15, 3313. [Google Scholar] [CrossRef]
  14. Gorroño, J.; Banks, A.C.; Fox, N.P.; Underwood, C. Radiometric inter-sensor cross-calibration uncertainty using a traceable high accuracy reference hyperspectral imager. ISPRS J. Photogramm. Remote Sens. 2017, 130, 393–417. [Google Scholar] [CrossRef]
  15. Kroodsma, R.A.; McKague, D.S.; Ruf, C.S. Inter-calibration of microwave radiometers using the vicarious cold calibration double difference method. IEEE J. Sel. Top. Appl. Earth Obs. Remote Sens. 2012, 5, 1006–1013. [Google Scholar] [CrossRef]
  16. Zec, J.; Jones, W.; Alsabah, R.; Al-Sabbagh, A. RapidScat cross-calibration using the double difference technique. Remote Sens. 2017, 9, 1160. [Google Scholar] [CrossRef]
  17. Zhang, Y.-F.; Jiang, G.-M. Intercalibration of FY-3D MWHS-II water vapor absorption channels against S-NPP ATMS channels using the double difference method. In Proceedings of the IGARSS 2024–2024 IEEE International Geoscience and Remote Sensing Symposium, Athens, Greece, 7 July 2024; IEEE: New York, NY, USA; pp. 6255–6258. [Google Scholar]
  18. Alsweiss, S.O.; Jelenak, Z.; Chang, P.S.; Park, J.D.; Meyers, P. Inter-calibration results of the Advanced Microwave Scanning Radiometer-2 over ocean. IEEE J. Sel. Top. Appl. Earth Obs. Remote Sens. 2015, 8, 4230–4238. [Google Scholar] [CrossRef]
  19. Wu, S.; Sun, F.; Gu, S.; Zhang, P. Re-calibration of MWRI onboard FY series satellites. In Proceedings of the IGARSS 2023–2023 IEEE International Geoscience and Remote Sensing Symposium, Pasadena, CA, USA, 16 July 2023; IEEE: New York, NY, USA; pp. 4384–4387. [Google Scholar]
  20. Jiang, G.-M.; Zou, Y.; Chen, H. Assessment and correction of the on-orbit radiometric calibration in FY-3D MERSI-2 thermal infrared channels. IEEE Trans. Geosci. Remote Sens. 2022, 60, 1–10. [Google Scholar] [CrossRef]
  21. Jiang, G.-M.; Xin, Y.-C. Intercalibration of FY-4A AGRI thermal infrared channels against AHI channels using the double difference method. IEEE Geosci. Remote Sens. Lett. 2023, 20, 1–5. [Google Scholar] [CrossRef]
  22. Zhang, C.; Qi, C.; Yang, T.; Gu, M.; Zhang, P.; Lee, L.; Xie, M.; Hu, X. Evaluation of FY-3E/HIRAS-II radiometric calibration accuracy based on OMB analysis. Remote Sens. 2022, 14, 3222. [Google Scholar] [CrossRef]
  23. He, X.; Xu, N.; Feng, X.; Hu, X.; Xu, H.; Peng, Y. Assessing radiometric calibration of FY-4A/AGRI thermal infrared channels using CrIS and IASI. IEEE Trans. Geosci. Remote Sens. 2022, 60, 1–12. [Google Scholar] [CrossRef]
  24. Goldberg, M.; Ohring, G.; Butler, J.; Cao, C.; Datla, R.; Doelling, D.; Gärtner, V.; Hewison, T.; Iacovazzi, B.; Kim, D.; et al. The Global Space-Based Inter-Calibration System. Bull. Am. Meteorol. Soc. 2011, 92, 467–475. [Google Scholar] [CrossRef]
  25. Hewison, T.J.; Doelling, D.R.; Lukashin, C.; Tobin, D.; John, V.O.; Joro, S.; Bojkov, B. Extending the Global Space-Based Inter-Calibration System (GSICS) to tie satellite radiances to an absolute scale. Remote Sens. 2020, 12, 1782. [Google Scholar] [CrossRef]
  26. Hewison, T.J.; Wu, X.; Yu, F.; Tahara, Y.; Hu, X.; Kim, D.; Koenig, M. GSICS inter-calibration of infrared channels of geostationary imagers using Metop/IASI. IEEE Trans. Geosci. Remote Sens. 2013, 51, 1160–1170. [Google Scholar] [CrossRef]
  27. Wang, S.; Yin, X.; Zhou, W.; Bao, Q.; Li, Y.; Kong, J.; He, M. Intercalibration of HY-2B SMR using double difference method based on GPM GMI. IEEE Trans. Geosci. Remote Sens. 2024, 62, 1–18. [Google Scholar] [CrossRef]
  28. Zou, X. Studies of FY-3 observations over the past 10 years: A review. Remote Sens. 2021, 13, 673. [Google Scholar] [CrossRef]
  29. Yang, Z.; Zhang, P.; Gu, S.; Hu, X.; Tang, S.; Yang, L.; Xu, N.; Zhen, Z.; Wang, L.; Wu, Q.; et al. Capability of Fengyun-3D satellite in Earth system observation. J. Meteorol. Res. 2019, 33, 1113–1130. [Google Scholar] [CrossRef]
  30. Tang, F.; Zhuge, X.; Zeng, M.; Li, X.; Dong, P.; Han, Y. Applications of the Advanced Radiative Transfer Modeling System (ARMS) to characterize the performance of Fengyun–4A/AGRI. Remote Sens. 2021, 13, 3120. [Google Scholar] [CrossRef]
  31. Yang, J.; Ding, S.; Dong, P.; Bi, L.; Yi, B. Advanced Radiative Transfer Modeling System developed for satellite data assimilation and remote sensing applications. J. Quant. Spectrosc. Radiat. Transf. 2020, 251, 107043. [Google Scholar] [CrossRef]
  32. Shi, Y.-N.; Yang, J.; Weng, F. Discrete Ordinate Adding Method (DOAM), a new solver for Advanced Radiative Transfer Modeling System (ARMS). Opt. Express 2021, 29, 4700. [Google Scholar] [CrossRef] [PubMed]
  33. Weng, F.; Yu, X.; Duan, Y.; Yang, J.; Wang, J. Advanced Radiative Transfer Modeling System (ARMS): A new-generation satellite observation operator developed for numerical weather prediction and remote sensing applications. Adv. Atmos. Sci. 2020, 37, 131–136. [Google Scholar] [CrossRef]
  34. Weng, F. Advances in radiative transfer modeling in support of satellite data assimilation. J. Atmos. Sci. 2007, 64, 3799–3807. [Google Scholar] [CrossRef]
  35. Peng, W.; Weng, F.; Ye, C. The impact of MERRA-2 and CAMS aerosol reanalysis data on FengYun-4B geostationary interferometric infrared sounder simulations. Remote Sens. 2025, 17, 761. [Google Scholar] [CrossRef]
  36. Wang, H.; Mao, K.; Mu, F.; Shi, J.; Yang, J.; Li, Z.; Qin, Z. A split window algorithm for retrieving land surface temperature from FY-3D MERSI-2 data. Remote Sens. 2019, 11, 2083. [Google Scholar] [CrossRef]
  37. Yan, L.; Hu, Y.; Zhang, Y.; Li, X.-M.; Dou, C.; Li, J.; Si, Y.; Zhang, L. Radiometric calibration evaluation for FY-3D MERSI-II thermal infrared channels at Lake Qinghai. Remote Sens. 2021, 13, 466. [Google Scholar] [CrossRef]
  38. Chen, H.; Meng, X.; Li, L.; Ni, K. Quality assessment of FY-3D/MERSI-II thermal infrared brightness temperature data from the Arctic region: Application to ice surface temperature inversion. Remote Sens. 2022, 14, 6392. [Google Scholar] [CrossRef]
  39. Xiong, X.; Angal, A.; Chang, T.; Aldoretta, E.; Geng, X.; Link, D.; Sun, J.; Twedt, K.; Wu, A. Aqua MODIS: 20 years of on-orbit calibration and performance. J. Appl. Remote Sens. 2023, 17, 037501. [Google Scholar] [CrossRef]
  40. Xiong, X.; Chiang, K.; Sun, J.; Barnes, W.L.; Guenther, B.; Salomonson, V.V. NASA EOS Terra and Aqua MODIS on-orbit performance. Adv. Space Res. 2009, 43, 413–422. [Google Scholar] [CrossRef]
  41. Bell, B.; Hersbach, H.; Simmons, A.; Berrisford, P.; Dahlgren, P.; Horányi, A.; Muñoz-Sabater, J.; Nicolas, J.; Radu, R.; Schepers, D.; et al. The ERA5 global reanalysis: Preliminary extension to 1950. Q. J. R. Meteorol. Soc. 2021, 147, 4186–4227. [Google Scholar] [CrossRef]
  42. Cao, C.; Weinreb, M.; Xu, H. Predicting simultaneous nadir overpasses among polar-orbiting meteorological satellites for the intersatellite calibration of radiometers. J. Atmos. Oceanic Technol. 2004, 21, 537–542. [Google Scholar] [CrossRef]
  43. Yang, W.; Meng, H.; Ferraro, R.R.; Chen, Y. Inter-calibration of AMSU-A window channels. Remote Sens. 2020, 12, 2988. [Google Scholar] [CrossRef]
  44. Wang, L.; Goldberg, M.; Wu, X.; Cao, C.; Iacovazzi, R.A.; Yu, F.; Li, Y. Consistency assessment of Atmospheric Infrared Sounder and Infrared Atmospheric Sounding Interferometer radiances: Double differences versus simultaneous nadir overpasses. J. Geophys. Res. 2011, 116, D11111. [Google Scholar] [CrossRef]
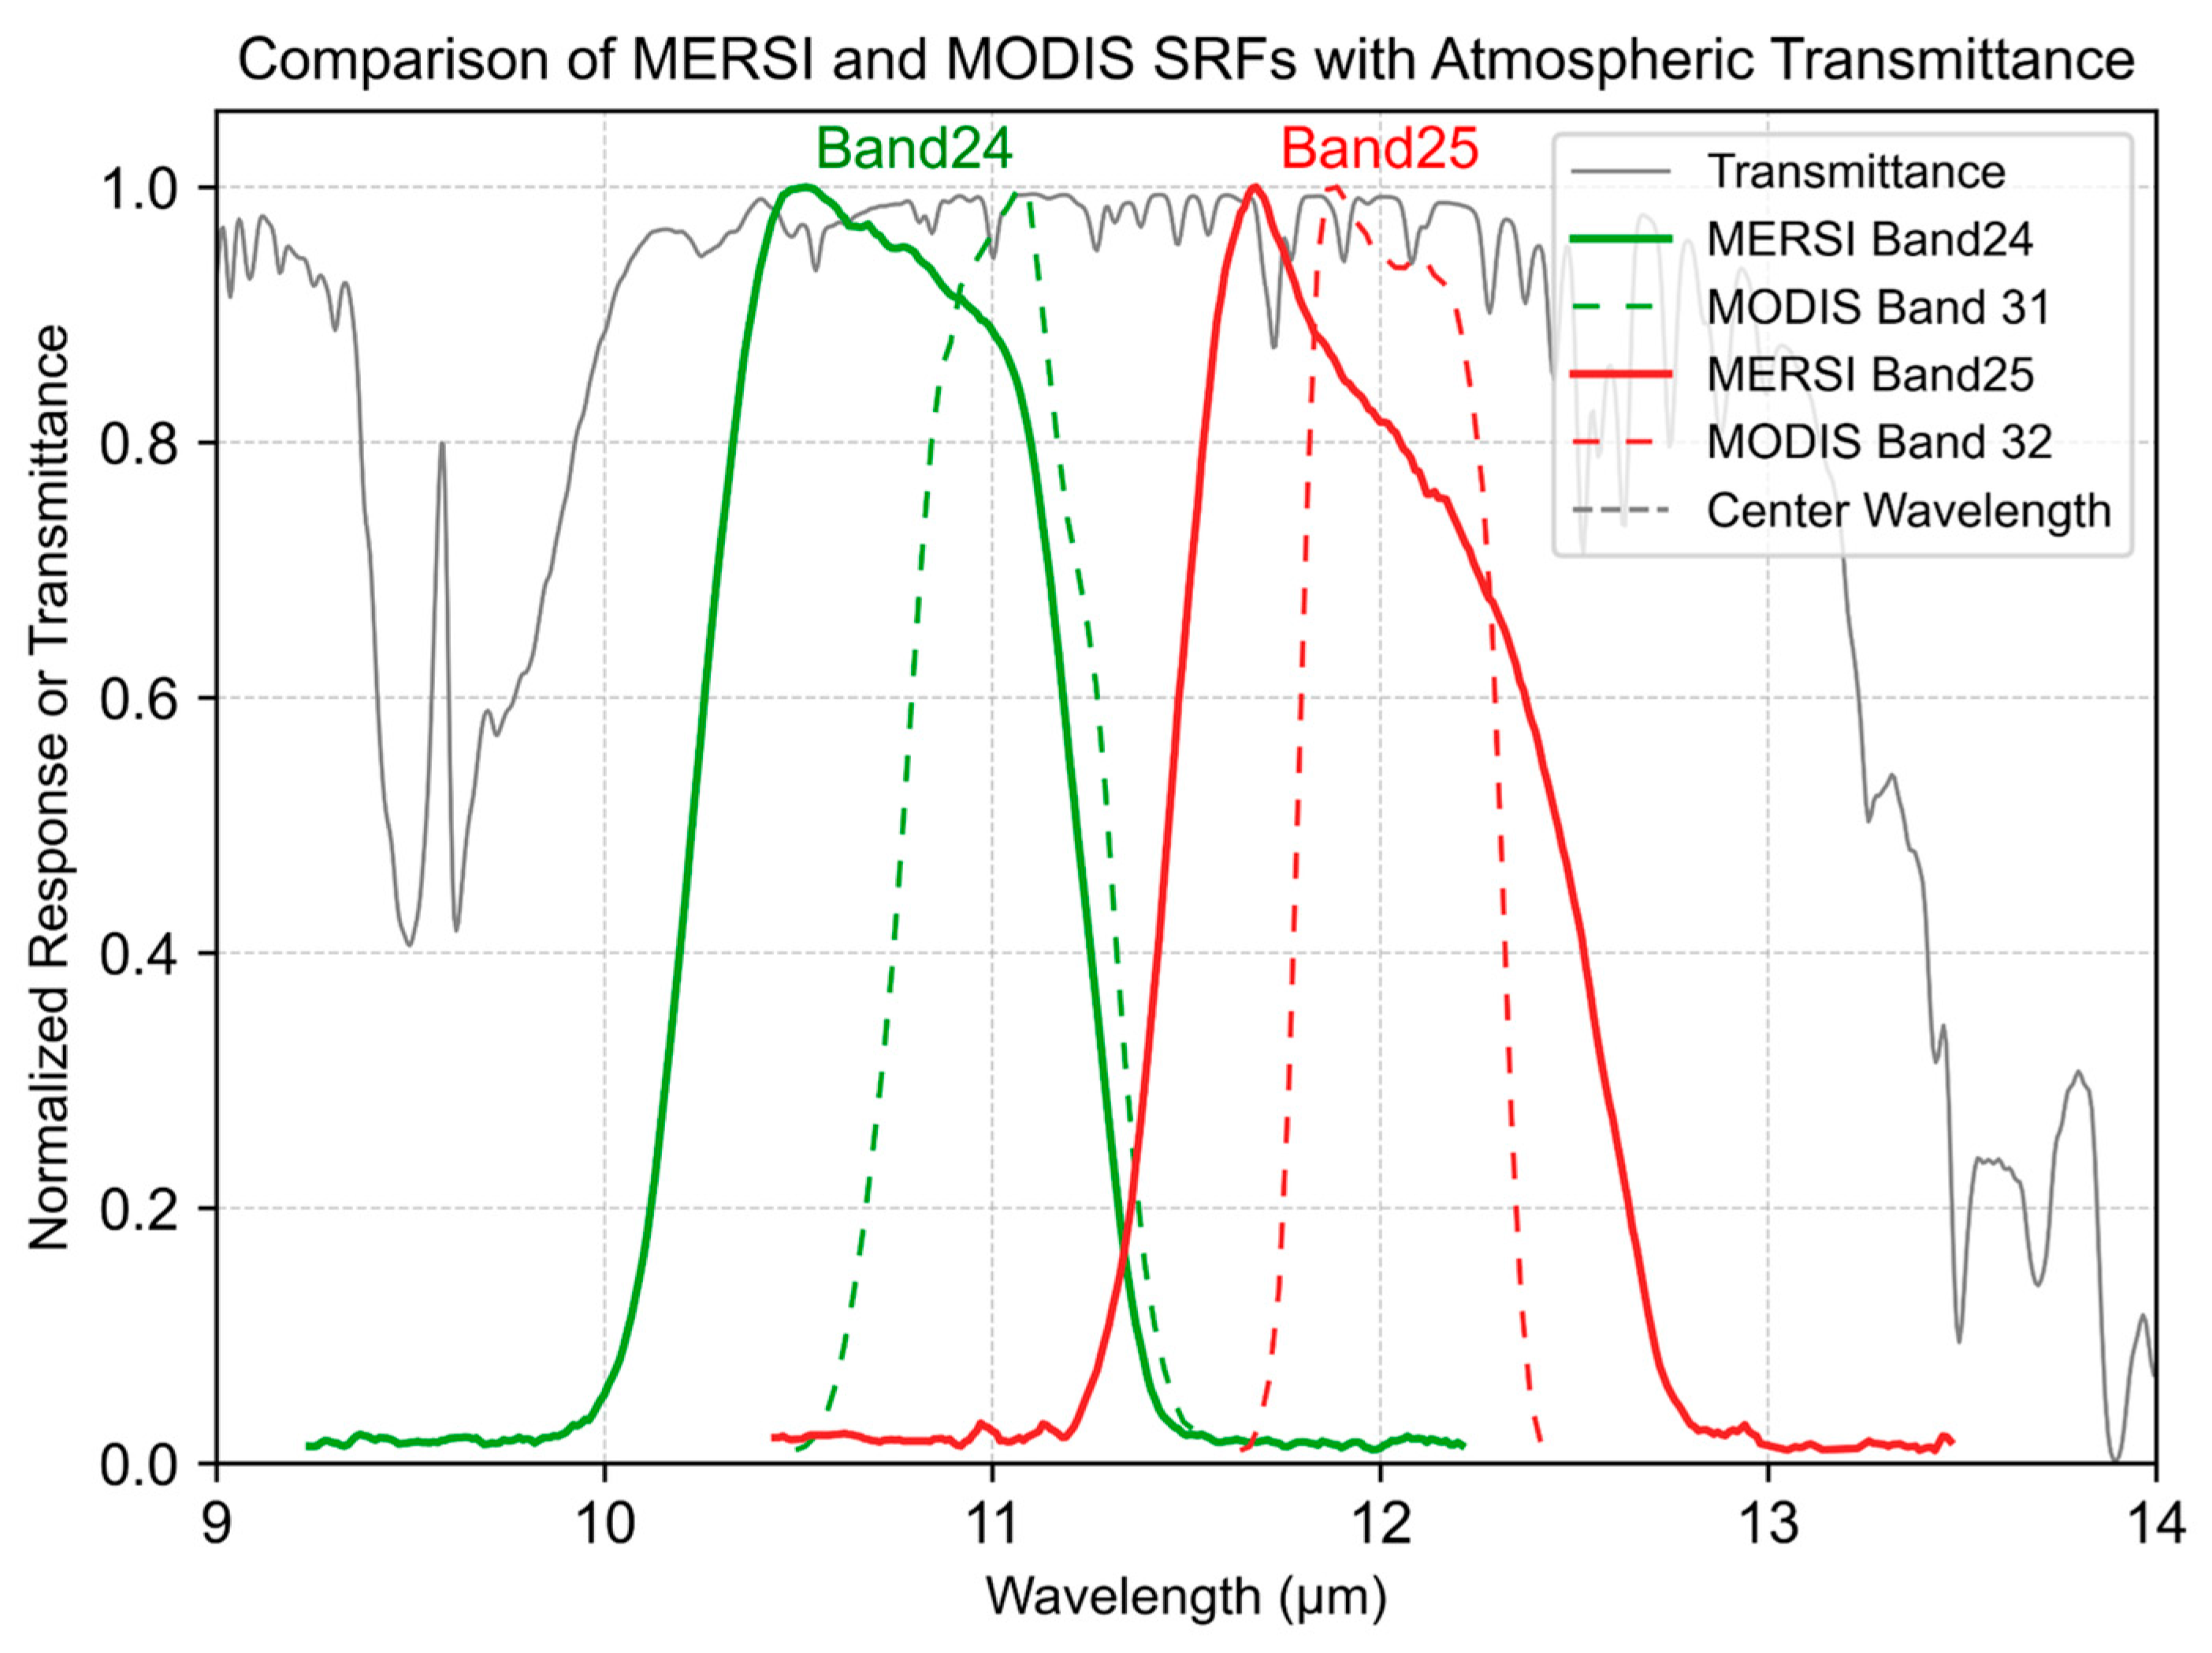
Figure 1. Spectral response functions (SRFs) of FY-3D MERSI (Bands 24/25) and MODIS (Bands 31/32). Green and red curves indicate the window bands. The atmospheric transmittance spectrum is from the SKYCALC Sky Model https://www.eso.org/observing/etc/skycalc/ (accessed on 20 September 2025).
Remotesensing 17 03353 g001
Figure 2. Overview of SNO and DD cross-calibration workflows, including dataset inputs, coefficient fitting, validation, and ocean performance comparison.
Remotesensing 17 03353 g002
Figure 3. Annual matched SNO pixel counts between FY-3D MERSI and MODIS/Aqua during July from 2019 to 2023, categorized as Ocean (LandseaMask = 7), Land (LandSeaMask = 1), and Boundary & others (LandSeaMask = 0, 2–5).
Remotesensing 17 03353 g003
Figure 4. Geographic distribution of matched SNO pixels during July of 2019–2022. Pixel categories (Ocean, Land, and Boundary & others) follow the LandSeaMask definition described in Figure 3.
Remotesensing 17 03353 g004
Figure 5. Scatter plots of BT regressions between FY-3D MERSI and MODIS for CH20–CH25 using the SNO method. (af): July 2020; (gl): July 2023.
Remotesensing 17 03353 g005
Figure 6. Spatial distribution of SNO-matched ocean pixels. (a) July 2020 (n = 8648); (b) July 2023 (n = 495). Pixel count decreased by ~94% in 2023, with most matches concentrated in high-latitude regions.
Remotesensing 17 03353 g006
Figure 7. Spatial distribution of validation matchups over ocean in (a) 2021 and (b) 2022.
Remotesensing 17 03353 g007
Figure 8. Mean BT biases across CH20–CH25 under different SNO calibration schemes for 2021 and 2022. (a,c) Clear-sky; (b,d) all matchups. Sample sizes are indicated in the legends.
Remotesensing 17 03353 g008
Figure 9. Observed and ARMS-simulated BTs and OMB (observation minus simulation) histograms for MERSI 24/25 and MODIS 31/32 in 2020. Right panels show OMB distributions and summary statistics.
Remotesensing 17 03353 g009
Figure 10. Same as Figure 9, but for 2023 oceanic data.
Remotesensing 17 03353 g010
Figure 11. Dependence of O–B residuals on observed BT (left) and sensor zenith angle (right) for MERSI and MODIS ocean samples in 2020.
Remotesensing 17 03353 g011
Figure 12. Same as Figure 11, but for 2023 ocean samples.
Remotesensing 17 03353 g012
Figure 13. Spatial distribution of double difference (DD) values for oceanic matchups: (a) 2020 Band 24–31, (b) 2020 Band 25–32, (c) 2023 Band 24–31, (d) 2023 Band 25–32. Color indicates DD in Kelvin; number of valid points shown.
Remotesensing 17 03353 g013
Figure 14. Scatter plots of observed vs. simulated BT for FY-3D MERSI over ocean: (a) Band 24, 2020; (b) Band 25, 2020; (c) Band 24, 2023; (d) Band 25, 2023. The 1:1 line (black) and fit line (red) are shown; statistics are inset.
Remotesensing 17 03353 g014
Figure 15. Spatial distribution of brightness temperature (BT) bias between FY-3D MERSI and MODIS for 2021 (af) and 2022 (gl) over ocean. Panels show Band 24 (top) and Band 25 (bottom) under three calibration conditions: original (left), SNO-calibrated (middle), and DD-calibrated (right). Bias is defined as MERSI minus MODIS (K); color range: [–2, 2] K.
Remotesensing 17 03353 g015
Figure 16. Percentage of FY-3D MERSI Bands 24 and 25 observations within ±0.2 K of MODIS reference under different calibration schemes (Original, SNO, and 2023 DD) for (a) 2021 and (b) 2022.
Remotesensing 17 03353 g016
Figure 17. Mean bias (a) and RMSE (b) of FY-3D MERSI Bands 24 and 25 under different calibration schemes using clear-sky ocean matchups from 2021 and 2022. The 2023 DD calibration yields the lowest errors across both years.
Remotesensing 17 03353 g017
Figure 18. Bias maps of FY-3D MERSI Bands 24 and 25 against MODIS on 23 July 2021 without cloud screening.
Remotesensing 17 03353 g018
Figure 19. Probability density distributions of brightness temperatures for FY-3D MERSI Bands 24 and 25, simulated with the native MERSI SRFs (blue) and with MODIS SRFs (orange).
Remotesensing 17 03353 g019
Figure 20. Sensitivity of the Double Difference (DD) calibration to thresholds (0.5–3 K) for Band 24 vs. 31 and Band 25 vs. 32.
Remotesensing 17 03353 g020
Figure 21. Radiometric and spatial representativeness of SNO matchups. (ad) KDE distributions of brightness temperatures for MERSI (blue) and MODIS (orange) in 2020 and 2023. (ef) Latitude and longitude distributions of matchup counts, comparing 2020 (blue) and 2023 (orange).
Remotesensing 17 03353 g021
Figure 22. Angular dependence of MERSI–MODIS brightness temperature biases for (a) Band 24 vs. 31 and (b) Band 25 vs. 32 after calibration in 2021.
Remotesensing 17 03353 g022
Table 1. Matched thermal infrared (TIR) bands between FY-3D MERSI and Aqua MODIS, including corresponding wavelength ranges and primary geophysical applications.
MERSI
Band
Wavelength (µm)Primary
Application
MODIS BandWavelength (µm)Primary
Application
203.60–3.90Land and cloud temperature203.66–3.84Land and cloud temperature
214.00–4.10Fire detection/high-temp anomaly234.02–4.08Fire detection/high-temp anomaly
227.15–7.25Atmospheric water vapor287.18–7.48Atmospheric water vapor
238.45–8.65Surface emissivity/cloud phase298.40–8.70Surface emissivity/cloud phase
2410.60–11.00Land and cloud temperature3110.78–11.28Land and cloud temperature
2511.80–12.20Land and cloud temperature3211.77–12.27Land and cloud temperature
Disclaimer/Publisher’s Note: The statements, opinions and data contained in all publications are solely those of the individual author(s) and contributor(s) and not of MDPI and/or the editor(s). MDPI and/or the editor(s) disclaim responsibility for any injury to people or property resulting from any ideas, methods, instructions or products referred to in the content.