Highlights
What are the main findings?
- A novel global 500 m vegetation productivity phenology (VPP) dataset (2001–2020) was developed from the GLASS GPP product.
- The dataset shows substantially higher accuracy and spatial integrity than the widely used MCD12Q2 VGP product.
What is the implication of the main finding?
- GLASS VPP provides a more ecologically meaningful representation of vegetation phenology and carbon dynamics.
- It offers a valuable resource for phenology modeling, carbon cycle research, and ecological forecasting under climate change.
Abstract
Accurate monitoring of vegetation phenology is vital for understanding climate change impacts on terrestrial ecosystems. While global vegetation greenness phenology (VGP) products are widely available, vegetation productivity phenology (VPP), which better reflects ecosystems’ carbon dynamics, remains largely inaccessible. This study introduces a novel global 500 m VPP dataset (GLASS VPP) from 2001 to 2020, derived from the GLASS gross primary productivity (GPP) product. Validation against three ground-based datasets—Fluxnet 2015, PhenoCam V2.0, and PEP725—demonstrated the dataset’s superior accuracy. Compared to the widely used MCD12Q2 VGP product, GLASS VPP reduced RMSE and bias by 35% and 63%, respectively, when validated against Fluxnet data. It also showed stronger correlations than MCD12Q2 when compared with PhenoCam (195 sites) and PEP725 (99 sites) observations, and it captured spatial and altitudinal phenology patterns more effectively. Overall, GLASS VPP exhibits a higher spatial integrity, stronger ecological interpretability, and improved consistency with ground observations, making it a valuable dataset for phenology modeling, carbon cycle research, and ecological forecasting under climate change.
1. Introduction
As fundamental components of terrestrial ecosystems, plants exhibit high sensitivity to environmental fluctuations [1]. Vegetation phenology, representing the temporal patterns of plants’ physiological responses and adaptations to environmental conditions [2], has been widely employed as a critical proxy for investigating long-term climate changes [3,4]. Over the past decades, vegetation phenology studies have evolved from traditional ground-based observations, such as those collected by the Pan European Phenology Project (PEP725) [5] and eddy covariance flux towers [6], to satellite-based remote sensing approaches. Compared to traditional ground-based phenology observations, remote sensing phenology offers the distinct advantage of extensive spatial coverage, making it particularly suitable for large-scale climate change analyses [7]. Consequently, it has been broadly applied in various research fields, including land cover classification [8,9,10,11], climate change detection [7,12,13], crop yield prediction [14,15], and quantification and determination of water cycles, energy balance, and carbon fluxes [16,17].
Significant efforts have been dedicated to generating land surface phenology (LSP) products using diverse remote sensing observations, substantially advancing the study of vegetation phenology (Table 1). Primarily derived from spectrally reflected information captured by remote sensors [18], these data sources exhibit varying characteristics of vegetation physiological processes, leading to distinct phenological interpretations [19]. Early satellite-based phenology research predominantly utilized the Normalized Difference Vegetation Index (NDVI), owing to its ease of calculation and robustness against variations in topography, illumination, cloud interference, and atmospheric conditions [20]. However, NDVI exhibits reduced sensitivity in dense vegetation due to its tendency to saturate under high biomass conditions [21]. To mitigate the influence of soil background and reduce the saturation effects associated with NDVI, the Enhanced Vegetation Index (EVI) was developed and has since been widely applied in LSP studies [22,23]. However, it also presents limitations, including a sensitivity to sun-sensor geometry that leads to BRDF effects, reduced responsiveness in low-biomass regions, and dependency on specific sensor configurations [24,25,26]. The Leaf Area Index (LAI), as a biophysical parameter indicative of canopy structure and vegetation density, provides higher ecological relevance and has been shown to yield more accurate and reliable phenological estimates than traditional vegetation indices-based approaches [27]. However, to effectively retrieve LSP from LAI time series, temporal smoothing is required to reduce noise and extract seasonal signals, and differences between LAI products must be carefully considered to ensure consistency [28]. Despite their respective limitations, these indicators remain central to the development of global phenology products (Table 1). Unlike previous indicators that primarily reflect canopies’ greenness or structure, both gross primary productivity (GPP) and sun-induced chlorophyll fluorescence (SIF) are more directly linked to photosynthetic activity, offering improved sensitivity to vegetation phenology [29]. Field observations have shown strong consistency between canopy phenology and GPP-derived phenological metrics [30,31], while SIF exhibits a robust linear relationship with GPP throughout the growing season, supporting its capacity to bridge canopy and satellite measurements [32,33]. Moreover, SIF has demonstrated superior accuracy in capturing key phenological transitions such as the onset of spring and the decline in photosynthetic activity in autumn across various biomes and regions [34,35]. These findings highlight the need to better utilize photosynthesis-based metrics with a focus on GPP, to improve our understanding of vegetation phenology and its role in the terrestrial carbon cycle.
GPP, which is defined as the rate of carbon dioxide uptake by plants through photosynthesis and the subsequent conversion of light energy into chemical energy [36], is a critical parameter in carbon cycle modeling [37]. Annual terrestrial GPP is highly sensitive to plant phenology metrics, such as the start and end of the growing season (SOS and EOS) [38,39]. Vegetation productivity phenology (VPP) metrics, nowadays primarily extracted from ground-based GPP time series using flux tower observations [40], provides valuable insights into terrestrial carbon cycle dynamics due to its clear ecological interpretability [41,42,43,44]. Xu et al. analyzed long-term trends in phenological and productivity metrics—such as the start, end, and length of the growing season, peak GPP, and seasonal/annual cumulative GPP—using a dataset comprising 440 site-years of eddy covariance measurements. Based on these metrics, they developed a phenological–physiological statistical model to predict long-term variations in annual GPP [45]. Wu et al. examined the interannual anomalies of net ecosystem productivity (NEP) across 212 site-years of flux observations in North America and Europe. Their findings highlighted that autumn phenological indicators derived from carbon fluxes play a more significant role than spring indicators in determining year-to-year variability in forest NEP [46]. Migliavacca et al. demonstrated that incorporating canopy-level productivity phenology substantially improves the modeling performance of respiration dynamics in deciduous forest ecosystems, especially regarding the temporal patterns of ecosystem respiration [47]. Given the greater sensitivity of vegetation photosynthesis to climate variations compared to greenness [48], VPP is more suitable for assessing the ecosystem’s carbon uptake duration and climate anomaly-induced changes in the terrestrial carbon cycle than VGP [49]. Ground-based VPP metrics have been extensively employed to validate remote sensing-derived LSP datasets [19,50,51,52,53]. Compared to traditional VGP, which primarily reflects changes in canopy color or structure, VPP offers a more ecophysiologically relevant representation of plants’ functional dynamics [1]. Ground-based flux tower observations have demonstrated that GPP-derived phenological metrics—such as the timing of photosynthetic onset and cessation—align more closely with carbon flux variations than VI-based phenology [39]. While VGP products are widely available and useful for large-scale ecosystem monitoring, they tend to lag behind or misrepresent true photosynthetic activity due to their indirect relationship with carbon assimilation [54]. In contrast, VPP captures vegetation responses that are more directly linked to carbon uptake, thus providing a stronger explanatory power in carbon budget modeling and climate feedback assessments [55]. Increasing evidence from site-level and regional studies supports the integration of VPP metrics as a more accurate and meaningful indicator in terrestrial carbon cycle research [56]. However, a systematic validation and comparative evaluation between VPP and VGP using ground-based datasets remains essential for understanding their respective strengths and limitations across spatial and temporal scales [57]. The VPP dataset developed by Xu et al. is limited in that phenological parameters were inferred through a modeling framework based on MODIS GPP rather than being directly extracted from the GPP time series [57]. Despite ongoing efforts to develop satellite-based VPP products, the absence of a publicly accessible, long-term global dataset significantly limits our understanding of the large-scale responses of vegetation’s carbon uptake capacity to climate change.
The increasing demand for GPP data, coupled with advancements in GPP retrieval algorithms, has facilitated the production of large-scale GPP datasets [58]. These developments enable the generation of global, long-term satellite-based VPP products. This study proposes a synthesized productivity phenology derivation scheme. Applying this scheme to the GPP product of the Global Land Surface Satellite (GLASS) products suite [59], which was proven to perform stably across different ecosystems [37,60,61], we generated a global 500 m GLASS VPP dataset spanning 2001 to 2020. To rigorously assess the accuracy of our VPP product, we conducted a comprehensive validation using ground-based observations from Fluxnet, PhenoCam, and the PEP725 (Pan European Phenology Project) network. Additionally, an intercomparison with the widely used MCD12Q2 vegetation phenology product was performed to evaluate their respective capabilities in characterizing surface plant growth patterns.

Table 1.
Several representative global LSP products and their key characteristics.
Table 1.
Several representative global LSP products and their key characteristics.
| Product | Period | Spatial Extent | Spatial Resolution | Data Source | Methodology | References |
|---|---|---|---|---|---|---|
| MCD12Q2 v061 | 2001–2021 | Global | 500 m | MODIS NBAR-EVI2 | Threshold | [62] |
| VIPPHEN_NDVI v004 | 1981–2014 | Global | 0.05° | AVHRR LTDR-V4 NDVI (1981–1999) MODIS C5 NDVI (2000–2014) | Threshold | [12] |
| VIPPHEN_EVI2 v004 | 1981–2014 | Global | 0.05° | AVHRR LTDR-V4 EVI2 (1981–1999) MODIS C5 EVI2 (2000–2014) | Threshold | [12] |
| VNP22Q2 v001 | 2013–present | Global | 500 m | VIIRS NBAR EVI2 | Derivative | [63] |
| VNP22C2 v001 | 2013–present | Global | 0.05° | VIIRS NBAR EVI2 | Derivative | [63] |
| MOD09A1P_NDVI | 2001–2020 | America | 500 m | MOD09A1 NDVI | Threshold | [64] |
| MOD09A1P_EVI | 2001–2020 | America | 500 m | MOD09A1 EVI | Threshold | |
| MOD09Q1P_NDVI | 2001–2020 | America | 250 m | MOD09A1 NDVI | Threshold | |
| MOD09Q1P_EVI | 2001–2020 | America | 250 m | MOD09A1 EVI | Threshold | |
| MOD15PHN | 2001–2020 | America | 1 km | MCD15A2 LAI | Threshold | [64] |
| MSLSP30NA1 | 2016–2018 | North America | 30 m | HLS EVI | Threshold | [65] |
| ChinaCropPhen | 2000–2015 | China | 1 km | GLASS LAI | Threshold/Derivative | [66] |
| Qinghai–Tibet Plateau Phenology Dataset | 2000–2016 | Qinghai–Tibet Plateau | 500 m | MOD09A1 EVI | Threshold | [67] |
| MODIS Sanjiangyuan Phenological Phase Dataset | 2001–2020 | Sanjiangyuan | 250 m | MOD13A2 NDVI | Threshold/Derivative | [68] |
2. Materials and Methods
2.1. Data
2.1.1. GLASS GPP Product
We used the GLASS GPP V60 dataset from 2000 to 2021 as the basic data source to derive the key phenology metrics and generate the global VPP product in this study [69]. The GLASS GPP dataset has a spatial resolution of 500 m and provides vegetation productivity information for the global land surface every eight days. The GLASS GPP dataset was generated with the improved EC-LUE model, which was proven to perform stably across different ecosystems [37,60,61]. The GLASS GPP product integrates multiple satellite-derived datasets. Specifically, it utilizes net radiation (Rn), air temperature (T), relative humidity (Rh), and photosynthetically active radiation (PAR) obtained from MERRA (Modern-Era Retrospective Analysis for Research and Applications). Additionally, global 8-day MODIS LAI data (MOD15A2) and 16-day MODIS NDVI data (MOD13A2) are incorporated to support vegetation-related inputs. These data were obtained from a total of 54 flux tower sites provided by the AmeriFlux (http://public.ornl.gov/ameriflux (accessed on 26 August 2025)) and EuroFlux networks (https://www.europe-fluxdata.eu/ (accessed on 26 August 2025)) [37]. The GLASS GPP products and their generation algorithms are extensively used in determining spatiotemporal variations in ecosystem productivity and global carbon sink assessments [70,71,72].
2.1.2. Ground Observations
To comprehensively assess the quality of the GLASS VPP product generated in this study, we collected three kinds of ground observations, including the in situ measured GPP from the Fluxnet program, the PhenoCam Dataset V2.0, and the plant phenology observations from PEP725 network. The spatial distribution of these ground observation sites is shown in Figure 1.
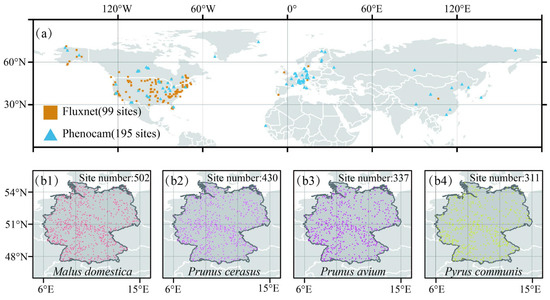
Figure 1.
Distribution of ground observation sites from Fluxnet, PhenoCam (a), and PEP25 network (b1–b4).
Fluxnet sites and phenology from daily GPP. To assess the quality of the GLASS VPP metrics, we leveraged the daily GPP observation from the latest Fluxnet 2015 dataset. The Fluxnet program employs the eddy covariance technique to measure the exchange of water, carbon, and energy between ecosystems and the atmosphere [40,73], providing valuable daily GPP observations. We applied the phenology extraction algorithm outlined in Section 2.2.2 and Section 2.2.3 to the Fluxnet GPP time series to derive ground vegetation productivity phenology (VPPGround). Using the daily GPP data from 2001 to 2014, a total of 574 Fluxnet phenology metric samples over 102 sites were obtained and employed to assess the accuracy of the satellite-derived phenology products. It is worth noting that although the GLASS GPP product was calibrated using 54 flux tower sites (mainly from AmeriFlux and EuroFlux), our study utilized a total of 102 sites from the FLUXNET2015 dataset for validation. The majority of these sites were not involved in the GLASS GPP model’s development, ensuring a high degree of independence between the validation data and the original calibration dataset. However, we also acknowledge that the spatial distribution of high-quality flux sites is uneven globally. In particular, sites located in the Southern Hemisphere and tropical regions are relatively sparse and often suffer from issues such as short observation periods, data discontinuities, or inconsistent temporal quality. These limitations constrain the representativeness of ground-based validation in these regions and highlight the need for enhanced flux observation capacity in future global phenology research.
PhenoCam and phenology from daily GCC (Green Chromatic Coordinate). This study employed the digital image statistics product from the PhenoCam dataset v2.0, which provides a time series of visible band reflected information at various global sites from 2000 to 2014. For each site, the dataset provides statistical values of a predefined region of interest (ROI) for a specific vegetation type. We calculated the GCC index with these three visible bands [74] to characterize the vegetation greenness dynamics, where R, G and B represent the red, green, and blue color channel values, respectively. This index normalizes green intensity against total brightness, thereby minimizing the effects of varying illumination conditions. For each image, we extracted the region of interest (ROI) and calculated the average GCC value across all pixels within the ROIs. The GCC time series was smoothed, and low-quality data were manually removed to extract ground vegetation greenness phenology (VGPGround). Finally, a total of 745 PhenoCam VGPGround samples over 195 camera sites were obtained.
The plant phenology observation from the PEP725 network. Plant phenological data were obtained from the PEP725 network. This ground-based European database provides long-term, spatially dense observations of key plant phenophases, including leaf unfolding, flowering’s onset, and leaf fall [5,71,75]. Phenological stages were determined using the BBCH (Biologische Bundesanstalt, Bundessortenamt und Chemische Industrie) scale. The BBCH scale is a standardized phenological coding system that describes the growth stages of plants throughout their entire life cycle, from germination to senescence [76]. The full flowering periods of four fruit trees in Germany, Malus domestica, Prunus cerasus, Prunus avium, and Pyrus communis, were selected in this study, due to their relatively concentrated and brief flowering periods, ensuring high data quality. Full flowering was defined as the stage at which 50% of flowers were open, with the possibility of initial petal fall. PEP725 serves as a reliable benchmark for evaluating the quality of various remote sensing phenology products and enables robust inter-dataset comparisons [77].
2.1.3. MCD12Q2 Phenology Dataset
To assess the performance of the GLASS VPP product, we conducted an intercomparison with the satellite-derived vegetation greenness phenology (VGP) from the MCD12Q2 v6.1 product. The MCD12Q2 phenology metrics were derived from the Enhanced Vegetation Index (EVI) using a threshold-based method [62]. The MCD12Q2 VGP product has been widely utilized for determining long-term changes in vegetation phenology [78,79,80]. Since the definition of phenology parameters of MCD12Q2 differs from our VPP metrics, the corresponding relationships between the two products’ phenology metrics are outlined in Figure 2 and Table 2.
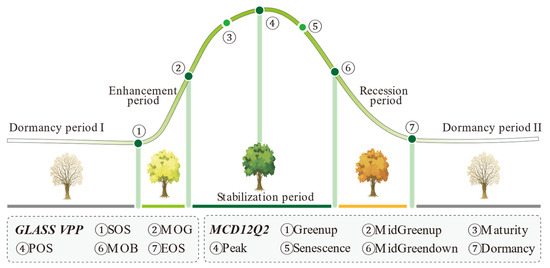
Figure 2.
Conceptual illustration of the correspondence between phenology from MCD12Q2 and GLASS VPP.

Table 2.
The correspondence definition of phenology metrics between VGP (MCD12Q2) and VPP.
2.2. Method
Our objective is to generate the global VPP by integrating two independent methods based on the GLASS GPP product. To achieve this goal, we designed a framework composed of several steps (Figure 3). The detailed technical processes are introduced in the following sections.
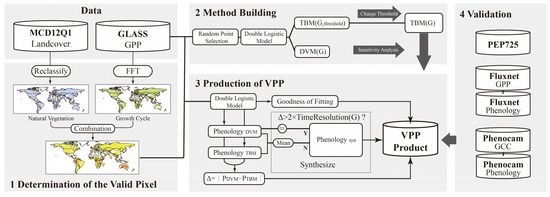
Figure 3.
Flowchart of this study for generating the global VPP from the GLASS GPP product.
2.2.1. Identification of Natural Vegetation with a Single Growing Season
In order to minimize the influence of non-vegetative and agricultural pixels on the GLASS VPP mapping, we used the MCD12Q1 land cover product (University of Maryland classification criteria) to identify natural vegetation distributions [81]. Pixels classified as water bodies, urban and built-up lands, barren, and croplands were excluded. To eliminate pixels with indistinct growing seasons, such as tropical rainforests exhibiting a minimal GPP seasonal variability, we applied a Fast Fourier Transform (FFT) to pixel-level GPP time series to analyze the frequency characteristics. Pixels with a dominant frequency that matched the temporal coverage of the GPP time series from 2000 to 2021 were classified as “seasonally clear” and retained for subsequent phenology extraction. To address asynchronous vegetation growth cycles in the Northern and Southern Hemispheres, the original GPP time series was partitioned based on the characteristics of its maximum amplitude component, ensuring each segment represented a complete growing season. It is important to note that in this study, the term “tropical forest” does not refer to a specific land cover classification (e.g., evergreen, semi-deciduous, or monsoon forests) but rather to areas with persistently high GPP values and no apparent seasonal cycles as determined by frequency–domain analysis. This functional definition is based on vegetation productivity dynamics rather than static land cover labels.
2.2.2. GPP Time-Series Fitting
To derive GLASS VPP metrics, the temporal variation in the GPP time-series dataset for an entire growing cycle required modeling into a continuous function. We employed the double logistic function (DL, Equation (2)), a commonly used curve-fitting method in VI-based LSP determination studies, to simulate continuous vegetation growth variations.
where f(t) is the observed GPP at a day of the year (DOY), and α1, α2, α3, β1, β2, α1, and α2 are the parameters of the DL function, which together control the shape of the planted growth curve [82]. The DL function is characterized by seven parameters, allowing for distinct background values on either side of the non-growth season and broader applicability [83].
To evaluate the accuracy of the DL function in capturing observed GPP seasonal variations, we used the coefficient of determination (R2) to measure the reliability of the fitted curve.
2.2.3. VPP Metrics Extraction
Vegetation productivity phenology (VPP) is defined as the transition dates marking changes in the state of vegetation productivity. With the DL fitted function and GPP time series, five key phenology metrics were extracted in this study, including start of growing season (SOS), end of growing season (EOS), mid of green-up (MOG), mid of brown-down (MOB), and peak of growth season (POS). To take advantage of different phenology extraction algorithms to enhance the robustness of VPP’s determination, we developed a synthesized scheme by combining results from the derivative extremum method (DVM) and the threshold-based method (TBM).
VPP metrics’ determination with DVM. Following the method proposed by Gonsamo et al. [83], the five key VPP metrics could be derived from the fitted DL function with these algorithms in Equations (4)–(8). SOS and EOS were identified as the transition dates of the first maximum value and last minimum value of third-order derivation of the fitted DL function, respectively. MOG and MOB were identified as the transition dates of the first maximum value and last minimum value of first-order derivation of the fitted DL function, respectively. POS was calculated as the mean of MOG and MOB.
VPP metrics’ determination with TBM. The VPP metrics from TBM were derived with the simulated daily GPP time series by the DL fitting model for an entire growing season. As outlined in Equations (9) and (10), f(t) represents the simulated GPP on a given day (t); Fm denotes the maximum daily GPP value within the annual GPP time series, with its corresponding date designated as Tm; and Fdl and Fdr represent the mean dormancy productivity before and after the growing season, respectively. The phenology metric, PTBM, is defined as the date when the simulated GPP time series reaches a specified threshold Kp.
Generation of synthesized scheme. Reasonable selection of Kp is crucial for extracting PTBM and effectively synthesizing results from both TBM and DVM. The fundamental principle of Kp‘s determination is to ensure that the phenology metrics extracted by TBM closely correspond to those derived from DVM. This alignment allows for a more robust composition of the phenology metrics from both methods. To establish Kp values for the derivation SOS, EOS, MOG and MOB, a random selection of 100,000 GPP time-series points from regions north of 50°N in 2018 was conducted. Prioritizing pixels (8641) with high goodness of fitting (R2 ≥ 0.99) values from the DL model fitting ensured the reliability of these GPP time-series samples. Subsequently, a comparative analysis identified the Kp values that yielded the highest consistency between PTBM and PDVM for each phenology metric, establishing the final thresholds.
Given the complementary strengths and limitations of the DVM and TBM in phenology metric determination [84], we developed a hybrid approach to optimize VPP’s estimation. Using the methods outlined in the previous steps, pixel-level phenology metrics were extracted separately from both DVM (PDVM) and DBM (PTBM). The absolute difference (Δ) between these metrics was then calculated for each pixel. If the Δ exceeded twice the temporal resolution of the original input GPP time series (8-day in this study), the uncertainty of PDVM was deemed excessive, and only the PTBM result was retained. Otherwise, the mean value of PDVM and PTBM was used as the final synthesized VPP estimate.
2.2.4. Validation of VPP Metrics
To assess the accuracy of our VPP product, phenology metrics were validated against ground observations from Fluxnet, PhenoCam V2.0, and PEP725. Numerous studies have used PhenoCam and Fluxnet datasets to validate remote sensing phenology [74,85,86,87,88,89]. Correlation coefficients (R), root mean square error (RMSE), and bias were calculated using Equations (11)–(13). The widely used MCD12Q2 VGP dataset was also synchronously evaluated and compared to VPP. For VPP pixels with multiple ground observations, mean values were calculated to represent the ground data.
3. Results
We firstly developed the VPP metric extraction scheme by combining two independent methods. Then, using the synthesized algorithm, we produced the global VPP product from 2001 to 2020 based on the GLASS GPP data. Both GLASS VPP and MCD12Q2 VGP metrics were subsequently validated against ground phenology observations.
3.1. Determination of the Synthesized Phenology Extraction Scheme
Based on the scheme depicted in Section 2.2.3, a sensitivity analysis was conducted to assess impact of varying Kp values on the consistency of phenology metrics derived from both methods. The results, presented in Figure 4 and Table 3, indicate that the optimal Kp values for SOS, MOG, EOS, and MOB are 9.5% (left), 48.8% (left), 8.8% (right), and 46.6% (right), respectively.
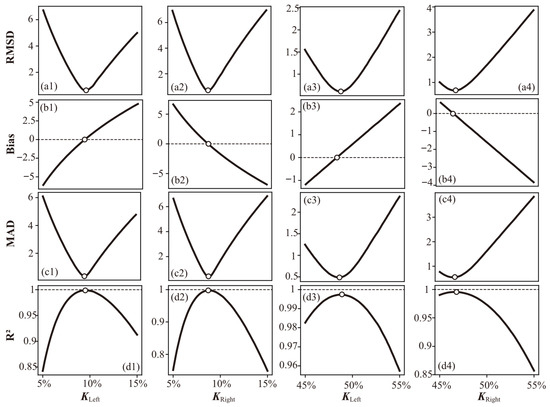
Figure 4.
The consistency of phenology metrics between PTBM and PDVM in terms of RMSD, bias, MAD, and R2 with the variation in KP. (a1–a4), (b1–b4), (c1–c4), (d1–d4) represent the intercomparison of both methods for SOS, EOS, MOG, and MOB, respectively.

Table 3.
Comparative analysis of phenology metrics extracted using TBM and DVM, employing both optimal and final determined Kp values.
To ensure comparability with existing vegetation phenology studies while maintaining the accuracy of our metrics, we adopted commonly used thresholds of 10% and 50% for deriving the start/end and middle status of vegetation green-up and brown-down, respectively. While optimal Kp values might offer slightly improved performance, adhering to these common thresholds facilitates comparison with other studies. As indicated in Table 3, adjusting the Kp values to these standard thresholds had a minimal effect on the model’s performance, as measured by R2, bias, mean absolute deviation (MAD), and root mean square deviation (RMSD). Moreover, the consistency of phenology metrics derived from both methods remained within a two-day margin, indicating that our approach effectively balances accuracy and comparability.
3.2. VPP Validation
3.2.1. VPP Metrics’ Validation Against Fluxnet Observations
Figure 5 presents a comparative analysis of our GLASS VPP and MCD12Q2 VGP datasets validated against 574 Fluxnet ground phenology metric samples. The results unequivocally demonstrate the superior accuracy of all five GLASS VPP metrics derived in this study compared to MCD12Q2 VGP. Correlation coefficients between GLASS VPP metrics and Fluxnet observations ranged from 0.59 to 0.82, significantly exceeding the range of 0.45 to 0.73 observed for MCD12Q2 VGP metrics. Moreover, GLASS VPP metrics achieved much lower RMSEs and biases, indicative of improved accuracy and reduced systematic errors. The validating RMSEs of VPP are 23.3, 17.2, 9.5, 17.4, and 22.0 days for SOS, MOG, POS, MOB, and EOS, respectively, with a mean decrease of 35% compared to MCD12Q2 VGP. Additionally, GLASS VPP metrics exhibited significantly lower biases against Fluxnet ground observations, with a mean decrease of 63% compared to MCD12Q2 VGP. The regression lines of GLASS VPP metrics against Fluxnet observations exhibited a closer proximity to the 1:1 line, further underscoring their superior performance relative to the MCD12Q2 VGP dataset.
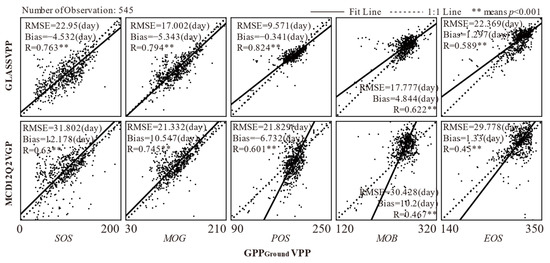
Figure 5.
Validation results of the phenology metrics (SOS, MOG, POS, MOB, EOS) for the GLASS VPP and MCD12Q2 VGP datasets against Fluxnet observations. The top row displays the validation results of GLASS VPP metrics, while the bottom row presents the validation results of MCD12Q2 VGP metrics.
To mitigate the potential impact of unstable GPP measurements, attributable to environmental noise and interannual variability, on the validation results, we calculated multi-year mean ground phenology metrics (VPPGround) and corresponding satellite-derived phenology metrics from GLASS VPP and MCD12Q2 VGP for each site. This approach significantly enhanced the reliability of the validation process. Figure 6 presents the validation results for these five phenology metrics. The results demonstrate that both products exhibited improved accuracy, with GLASS VPP metrics consistently outperforming MCD12Q2 VGP metrics. Correlation coefficients between GLASS VPP metrics and Fluxnet observations ranged from 0.72 to 0.88, significantly exceeding the range of 0.47 to 0.86 for MCD12Q2 VGP metrics. Moreover, GLASS VPP metrics achieved lower RMSEs and biases, indicative of superior accuracy and reduced systematic errors.
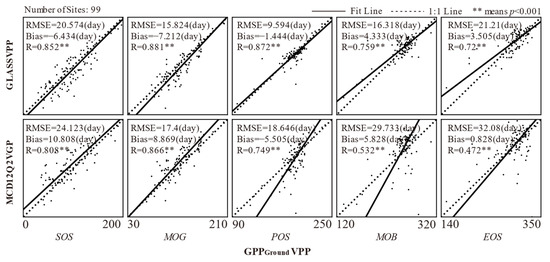
Figure 6.
Same as Figure 5 but based on the multi-year mean phenology metrics at 99 Fluxnet sites.
3.2.2. VPP Metrics Validation Against PhenoCam Observations
The GLASS VPP and MCD12Q2 VGP metrics were further validated against 745 phenology camera observation samples from PhenoCam 2.0. Ground vegetation greenness phenology metrics were derived from daily GCC time series calculated within predefined regions of interest (ROIs) on PhenoCam images. While MCD12Q2 VGP metrics were theoretically more aligned with PhenoCam observations, GLASS VPP metrics still demonstrated a competitive performance (Figure 7). Correlation coefficients between GLASS VPP and PhenoCam observations consistently exceeded those observed for MCD12Q2 VGP for all five phenology metrics. The validation results for RMSEs and biases revealed a divergent performance among the five metrics. GLASS VPP metrics exhibited lower RMSEs and biases for MOG, POS, and MOB but slightly higher RMSEs and biases for SOS and EOS compared to MCD12Q2 VGP metrics. The lower consistency of thee GLASS VPP SOS and EOS against PhenoCam observations may be primarily attributed to theoretical differences between VPP and VGP, leading to larger biases and subsequently higher RMSE values.
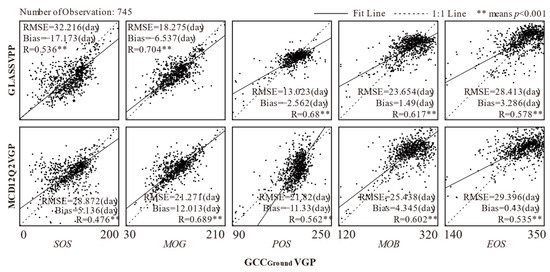
Figure 7.
Validation results of the phenology metrics (SOS, MOG, POS, MOB, EOS) for the GLASS VPP and MCD12Q2 VGP datasets against PhenoCam observations. The top row displays the validation results of GLASS VPP metrics, while the bottom row presents the validation results of MCD12Q2 VGP metrics.
The multi-year mean phenology metrics were also calculated at each PhenoCam site and employed to validate the GLASS VPP and MCD12Q2 VGP dataset (Figure 8). Although both products demonstrated improved validation accuracy after accounting for interannual variability, the improvements were not substantial. The validation results revealed that GLASS VPP metrics exhibited slightly superior performance compared to MCD12Q2 VGP, particularly for the three metrics of MOG, POS, and MOB.
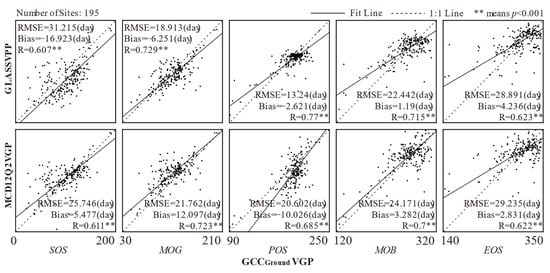
Figure 8.
Same as Figure 7 but based on the multi-year mean phenology metrics at 195 PhenoCam sites.
3.2.3. VPP Metrics’ Validation Against PEP725 Observations
The GLASS VPP and MCD12Q2 VGP metrics were further validated against ground phenology records from the PEP725 network. Unlike the other two ground observation datasets, PEP725 provides direct plant phenology records. Given the inherent challenges of directly comparing satellite-derived phenology metrics and ground phenology records for absolute values, this study focused on assessing the consistency of the two datasets in spatial–temporal variations. Full flowering date records for four fruit trees (Malus domestica, Prunus cerasus, Prunus avium, and Pyrus communis) observed from 2001 to 2015 in Germany were used to evaluate the accuracy of SOS and MOG metrics from GLASS VPP and MCD12Q2 VGP. Figure 9 presents the validation results, demonstrating the superior consistency of VPP metrics with PEP725 phenology records compared to MCD12Q2 VGP. Correlation coefficients between GLASS VPP metrics and PEP725 records ranged from 0.58 to 0.64 for SOS and from 0.60 to 0.63 for MOG, significantly exceeding the range of 0.16 to 0.19 for SOS and 0.27 to 0.29 for MOG observed for MCD12Q2 VGP metrics. Moreover, the regression lines of GLASS VPP metrics against PEP725 records exhibited a much closer proximity to the 1:1 line, further underscoring their superior performance relative to the MCD12Q2 VGP dataset. Compared with SOS, the satellite-derived vegetation MOG was more consistent with the full flowering phenology records.
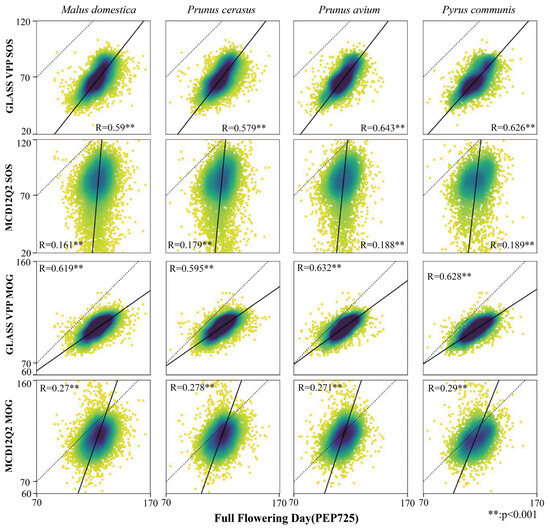
Figure 9.
Validation of the phenology metrics (SOS, MOG) for four kinds of fruit tree species for GLASS VPP and MCD12Q2 VGP datasets against PEP725 plant phenology observations. The first and third row display the validation results of the GLASS VPP SOS and MOG, respectively. And the second and forth row present the validation results of the MCD12Q2 VGP SOS and MOG, respectively.
To assess the consistency of phenology metrics between satellite products and ground observations in interannual variations, the GLASS VPP and MCD12Q2 VGP metrics were further compared against the PEP725 ground phenology records. To eliminate the impact of spatial variations, the 10th, 50th and 90th percentiles of phenology records for these four plants across all sites in Germany were chosen, along with the corresponding satellite-derived metrics. The results shown in Figure 10 and Table 4 demonstrate that the interannual variations in the GLASS VPP SOS and MOG are highly consistent with those of plant phenology records for the full flowering period. Although certain biases exist due to the different ecological significance between ground and satellite phenology metrics, the correlation coefficient between the GLASS VPP SOS/MOG and PEP725 plant full flowering records are all nearly 0.9, significantly higher than those of MCD12Q2, demonstrating the significant improvement of GLASS VPP in depicting phenology variations. In general, the satellite-derived MOG is more consistent with the plant full flowering record.
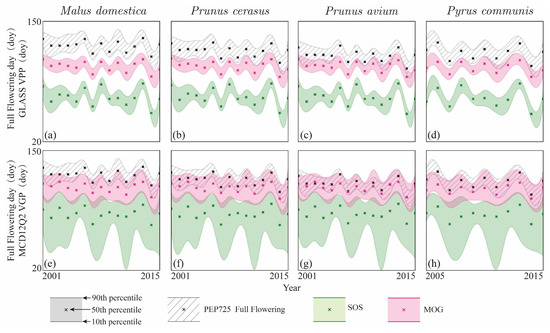
Figure 10.
The annual changes in full flowering day, VPP, and VGP in Germany from 2001 to 2015. (a) Malus domestica and GLASS VPP, (b) Prunus cerasus and GLASS VPP, (c) Prunus avium and GLASS VPP, (d) Pyrus communis and GLASS VPP, (e) Malus domestica and MCD12Q2, (f) Prunus cerasus and MCD12Q2, (g) Prunus avium and MCD12Q2, (h) Pyrus communis and MCD12Q2.

Table 4.
Correlation coefficient between the 10th, 50th, and 90th percentile of the ground observations and the 10th, 50th and 90th percentile of two LSPs.
The consistency of satellite-derived phenology with ground observations was further assessed at each site of the PEP725 network. The spatial distribution of correlation coefficients between GLASS VPP, MCD12Q2 VGP, and PEP725 plant observations for all available sites in Germany is shown in Figure 11. The results shown in Figure 11 indicate that over 55% and 68% of the PEP725 sites exhibit significant correlation coefficients greater than 0.7 between ground full flowing records and the GLASS VPP SOS and MOG, respectively. In contrast, only 5% and 16% of the records over these sites show correlation coefficients greater than 0.7 with the corresponding MCD12Q2 VGP metrics. Notably, over 10% of these sites even show negative correlation coefficients with MCD12Q2 VGP metrics.
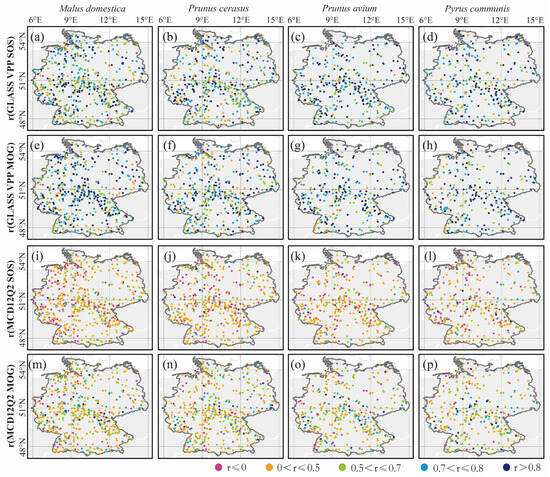
Figure 11.
Spatial distribution of correlation coefficients between satellite-derived phenology metrics and plant full flowering records at all PEP725 sites over Germany. (a–d) and (e–h) are the results for the GLASS SOS and MOG, respectively. (i–l) and (m–p) are the results for the MCD12Q2 SOS and MOG, respectively.
3.3. Spatial Pattern Comparison of GLASS VPP and MCD12Q2 VPP
To assess the spatial rationality and integrity of GLASS VPP and MCD12Q2 VPP metrics, we compared their phenology mapping results. Figure 12 illustrates the spatial distribution of phenology metrics derived from both products in 2018 over two representative regions: the Ural Mountains, with a significant vertical vegetation distribution (h20v02), and the Tibetan Plateau with sparse vegetation coverage (h25v05). As depicted in Figure 12(b1–b5,c1–c5), the GLASS VPP SOS more accurately captures the delayed vegetation green-up and advanced brown-down at higher elevations compared to MCD12Q2 VGP. Moreover, GLASS VPP metrics exhibit greater spatial continuity than MCD12Q2 VGP, which frequently determines anomalous phenology metrics in numerous pixels. The spatial patterns of phenology metrics in the Tibetan Plateau (Figure 12(e1–e5,f1–f5)) demonstrate GLASS VPP’s superior integrity in sparsely vegetated areas. In this tile, MCD12Q2 VGP has lost over 50% of phenology information over vegetated areas, while GLASS VPP has preserved it effectively.
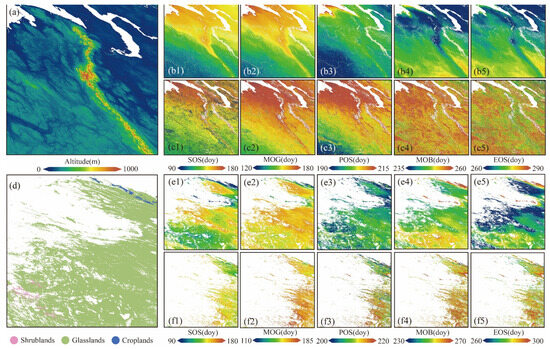
Figure 12.
The distribution of VPP (b1–b5,e1–e5), VGP (c1–c5,f1–f5), DEM (a), and land cover (d) at two standard geographical tiles, h20v02 (a,b1–b5,c1–c5) and h25v05 (d,e1–e5,f1–f5). h20h02 represents an area over the Ural Mountains, and h25h05 represents a sparsely vegetated area over the Tibetan Plateau.
3.4. Global Mapping of VPP Metrics
Based on the synthesized vegetation phenology determination scheme, global natural vegetation phenology was derived from the GLASS GPP dataset for the period 2001–2020. Figure 13 illustrates the spatial distribution of the five GLASS VPP metrics (SOS, MOG, POS, MOB, EOS) for 2018. In the Southern Hemisphere, phenology metrics of POS, MOB, and EOS were determined for the previous growing season (2017–2018), while SOS and MOG were derived for the current growing season (2018–2019). The resulting phenology maps demonstrate the rationality of GLASS VPP in capturing the latitudinal, vertical, and ecological zonality variations in natural vegetation phenology. For instance, the gradual delay in SOS and advancement in EOS of Northern Hemisphere vegetation with increasing latitude is accurately reflected by GLASS VPP. Moreover, the later SOS and earlier EOS observed in Tibetan Plateau vegetation compared to lower-elevation regions at similar latitudes are also rationally represented.
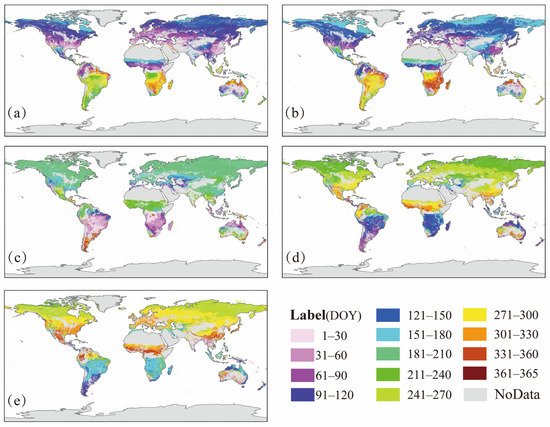
Figure 13.
Global mapping of VPP metrics in 2018. (a–e) present the distribution of SOS, MOG, POS, MOB, and EOS, respectively.
This study employed the goodness of fit and the absolute difference between two independent algorithms as indicators of the data quality (Figure 14). Regions with a poor model fit goodness were primarily concentrated in arid regions and low-latitude rainforest areas, which is related to the weaker vegetation seasonal growth signals. Besides rainforests and deserts, areas with a high goodness of fit but large discrepancies between the results of two independent algorithms were observed. These regions were mainly concentrated near the Congo basin and South China, where the growing season of vegetation is relatively long and the rate of growth and decline of plant productivity is slower, leading to large uncertainties.
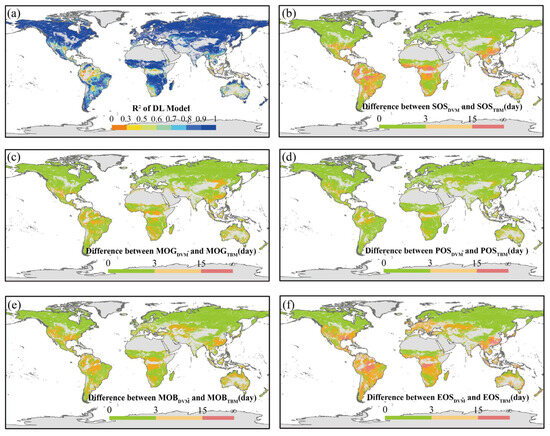
Figure 14.
The goodness of GPP time-series fitting with the DL model (a) and the differences in 2018 global VPP between the DVM and TBM algorithm for SOS (b), MOG (c), POS (d), MOB (e), and EOS (f), respectively.
4. Discussion
Vegetation productivity phenology, which can directly characterize vegetation’s growing process and CO2 uptake duration, is crucial for assessing the variation in territorial productivity and carbon stock [39]. Compared with traditional greenness phenology derived from canopy greenness indices such as NDVI and EVI, productivity phenology has greater advantages in ecological modeling [17] and can better characterize the carbon uptake processes of vegetation. Traditional satellite-based LSP products, primarily derived from vegetation canopy greenness indices like NDVI and EVI, often fall short in accurately characterizing vegetation’s carbon uptake process. While some concurrent VPP metrics can be obtained from flux tower-based Gross Primary Productivity (GPP) measurements, their spatial coverage is limited. To address this gap, we developed a novel global VPP dataset from 2001 to 2020 based on the GLASS GPP product. We employed a hybrid approach, combining the strengths of the popularly used DVM and TBM models, to optimize VPP’s estimation from a time series of satellite observations. This synergistic method effectively leverages the advantages of both models, resulting in a more reliable VPP product.
To assess the quality of our VPP product, we conducted a comprehensive validation with three kinds of ground-based observations. Our results demonstrate that GLASS VPP significantly outperforms the widely used MCD12Q2 VGP product. Specifically, when validated against the Fluxnet ground observations, GLASS VPP exhibited a 35% reduction in mean RMSE and a 63% reduction in mean Bias, along with substantially higher correlation coefficients compared to MCD12Q2 VGP. Even when validated against PhenoCam ground observations, which are inherently more aligned with vegetation greenness-based phenology metrics, GLASS VPP consistently demonstrated superior performance to MCD12Q2 VGP.
A longstanding challenge in LSP research has been the comparability between satellite-derived and in situ phenology records [2]. Traditional LSP products have often struggled to align with ground-based plant phenology records, as exemplified by the poor validation of MCD12Q2 VGP against the PEP725 dataset. In contrast, GLASS VPP exhibits superior alignment with PEP725 records, both in terms of overall validation and spatiotemporal variations. Validation results of GLASS VPP against PEP725 records consistently demonstrate strong comparability, with correlation coefficients approaching 0.9 for SOS/MOG and plant full flowering records. Over 68% of PEP725 sites in Germany exhibit significant correlations greater than 0.7 between the GLASS VPP MOG and plant full flowering records. These findings highlight the substantial potential of GLASS VPP in bridging the gap between satellite-derived and in situ plant phenology observations. These results underscore the broader ecological relevance of VPP metrics. While traditional phenology studies mainly focus on leaf development, recent research suggests that flowering phenology may better represent ecosystems’ reproductive cycles and seasonal carbon allocation [90]. In this regard, the strong consistency between GLASS VPP and flowering dates further highlights the ecological representativeness of GPP-based phenology products.
In addition to improved performance in temperate regions, GLASS GPP also demonstrates advantages in extreme and complex environments. For example, in high-altitude areas such as the Tibetan Plateau, traditional NDVI- and EVI-based methods often suffer from spectral noise caused by snow cover and bare soil, resulting in discontinuous or invalid MCD12Q2 outputs [91,92]. In contrast, the GLASS GPP product, with its enhanced sensitivity to weak photosynthetic signals, significantly increases the valid pixel coverage for phenology extraction and improves the spatial completeness of VPP in such regions [26].
Moreover, certain LSP products like VNP22Q2 face challenges with missing values in areas with high background noise, due to algorithm instability [93,94]. Our hybrid fitting approach, combining the derivative-based method (DVM) and the threshold-based method (TBM), successfully mitigates these issues by balancing sensitivity and robustness. This improves both the accuracy and completeness of phenological event detection [95]. To ensure methodological consistency with flux tower-derived phenology studies, we adopted a double logistic function previously applied by Gonsamo et al. in FluxNet studies, which provides a stable and interpretable basis for VPP extraction. Future improvements may involve tailoring smoothing and extraction techniques to the temporal dynamics of GPP across different ecosystems [96].
Despite these improvements, passive optical remote sensing still faces limitations in capturing phenology in tropical evergreen broadleaf forests (EBFs), where seasonal variations are subtle. MODIS-derived products often perform poorly in such contexts [62,97]. Although we filtered out pixels lacking clear seasonal signals to reduce noise, the remaining EBF phenology curves remained noisy or indistinct, reflecting fundamental sensor limitations rather than data or algorithm flaws. Multi-sensor data fusion strategies could help amplify interannual signals and enhance phenology detection in EBF regions [97]. Future studies could explore whether VPP and VGP exhibit complementarity in characterizing terrestrial vegetation activity and, on this basis, consider their combined use to improve the accuracy of vegetation monitoring. The reliability of GLASS VPP metrics is strongly ecosystem-dependent. Specifically, the dataset performs most robustly in ecosystems with a pronounced seasonality (e.g., temperate and boreal forests, croplands, grasslands), while phenological estimates in arid and tropical evergreen regions are associated with higher uncertainty due to weak or irregular seasonal dynamics. In such regions, VPP-derived SOS/EOS may reflect episodic or noisy signals rather than clear biological transitions and should therefore be interpreted with caution, ideally in combination with complementary datasets (e.g., precipitation records, multi-sensor fusion, or ground observations). These limitations reflect both an ecological reality and a methodological challenge, delineating the scope of applicability of GLASS VPP and providing a direction for future improvement.
5. Conclusions
Based on high-quality GLASS GPP data and a synthesized robust phenology extraction algorithm developed in this study, a global VPP product from 2001 to 2020 was generated, addressing the scarcity of global VPP products. Validation against three independent ground-based phenology datasets demonstrates that the GLASS VPP product significantly outperformed the currently widely used MCD12Q2VGP product. Compared to MCD12Q2 VGP, validating accuracy of GLASS VPP against Fluxnet ground observations exhibited an approximately 35% and 63% reduction in mean RMSE and bias, respectively. Even against the canopy greenness-based PhenoCam phenology ground observation, GLASS VPP also show slightly better performance than the MCD12Q2 VGP product. More notably, GLASS VPP exhibited a high degree of alignment with in situ phenology records, significantly overcoming the limitations faced by traditional VGP products. GLASS VPP is the first global dataset directly characterizing the key phases and duration of vegetation’s photosynthesis and productivity. It provides a valuable foundational data source for analyzing the impact of climate change on terrestrial ecosystems’ carbon uptake.
Author Contributions
Y.C. designed the study and led the data analysis. B.R. and M.Y. performed the data analysis. B.R., Y.C., and J.T. wrote the manuscript. S.L. advised on interpretation, manuscript preparation, and funding acquisition. All authors have read and agreed to the published version of the manuscript.
Funding
This study is partially supported by the Open Research Program of the International Research Center of Big Data for Sustainable Development Goals (CBAS2022ORP01), the National Key Research and Development Program of China (2023YFD2201702-3), and National Natural Science Foundation of China (42330507).
Data Availability Statement
The GLASS GPP products are openly available from http://glass-product.bnu.edu.cn/introduction/gpp.html (accessed on 1 September 2022) or www.glass.hku.hk (accessed on 1 September 2022). The Fluxnet ground GPP data was collected from the website of https://fluxnet.org/data/download-data/ (accessed on 1 December 2023). The PhenoCam ground data was collected from the website of https://phenocam.nau.edu/webcam/ (accessed on 1 December 2023). The pep725 2.0 dataset can be collected from http://www.pep725.eu/ (accessed on 1 May 2024). The MCD12Q2 product was downloaded from https://lpdaac.usgs.gov/products/mcd12q2v061/ (accessed on 1 December 2023).
Conflicts of Interest
The authors declare no conflicts of interest.
Abbreviations
The following abbreviations are used in this manuscript:
| LSP | land surface phenology |
| VIs | vegetation indices |
| BIs | biophysical indices |
| NDVI | normalized difference vegetation index |
| EVI | enhanced vegetation index |
| LAI | leaf area index |
| GPP | gross primary productivity |
| SIF | sun-induced chlorophyll fluorescence |
| VPP | vegetation productivity phenology |
| NEP | net ecosystem productivity |
| GLASS | Global Land Surface Satellite |
| PEP725 | Pan European Phenology Project |
| GCC | green chromatic coordinate |
| ROI | region of interest |
| VGP | vegetation greenness phenology |
| SOS | start of season |
| MOG | mid of green-up |
| POS | peak of season |
| MOB | mid of brown-down |
| EOS | end of season |
| DL | double logistic function |
| DVM | derivative extremum method |
| TBM | threshold-based method |
| RMSE | root mean square error |
| MAD | mean absolute deviation |
| RMSD | root mean square deviation |
References
- Richardson, A.D.; Keenan, T.F.; Migliavacca, M.; Ryu, Y.; Sonnentag, O.; Toomey, M. Climate change, phenology, and phenological control of vegetation feedbacks to the climate system. Agric. For. Meteorol. 2013, 169, 156–173. [Google Scholar] [CrossRef]
- Piao, S.; Liu, Q.; Chen, A.; Janssens, I.A.; Fu, Y.; Dai, J.; Liu, L.; Lian, X.; Shen, M.; Zhu, X. Plant phenology and global climate change: Current progresses and challenges. Glob. Change Biol. 2019, 25, 1922–1940. [Google Scholar] [CrossRef] [PubMed]
- Menzel, A.; Yuan, Y.; Matiu, M.; Sparks, T.; Scheifinger, H.; Gehrig, R.; Estrella, N. Climate change fingerprints in recent European plant phenology. Glob. Change Biol. 2020, 26, 2599–2612. [Google Scholar] [CrossRef] [PubMed]
- Xu, X.; Riley, W.J.; Koven, C.D.; Jia, G.; Zhang, X. Earlier leaf-out warms air in the north. Nat. Clim. Change 2020, 10, 370–375. [Google Scholar] [CrossRef]
- Templ, B.; Koch, E.; Bolmgren, K.; Ungersböck, M.; Paul, A.; Scheifinger, H.; Rutishauser, T.; Busto, M.; Chmielewski, F.-M.; Hájková, L. Pan European Phenological database (PEP725): A single point of access for European data. Int. J. Biometeorol. 2018, 62, 1109–1113. [Google Scholar] [CrossRef]
- Rebmann, C.; Aubinet, M.; Schmid, H.; Arriga, N.; Aurela, M.; Burba, G.; Clement, R.; De Ligne, A.; Fratini, G.; Gielen, B. ICOS eddy covariance flux-station site setup: A review. Int. Agrophys. 2018, 32, 471–494. [Google Scholar] [CrossRef]
- White, K.; Pontius, J.; Schaberg, P. Remote sensing of spring phenology in northeastern forests: A comparison of methods, field metrics and sources of uncertainty. Remote Sens. Environ. 2014, 148, 97–107. [Google Scholar] [CrossRef]
- Li, Z.; Zhou, G.; Song, Q. A temporal group attention approach for multitemporal multisensor crop classification. Infrared Phys. Technol. 2020, 105, 103152. [Google Scholar] [CrossRef]
- Yan, E.; Wang, G.; Lin, H.; Xia, C.; Sun, H. Phenology-based classification of vegetation cover types in Northeast China using MODIS NDVI and EVI time series. Int. J. Remote Sens. 2015, 36, 489–512. [Google Scholar] [CrossRef]
- Nogueira, K.; dos Santos, J.A.; Menini, N.; Silva, T.S.; Morellato, L.P.C.; Torres, R.d.S. Spatio-temporal vegetation pixel classification by using convolutional networks. IEEE Geosci. Remote Sens. Lett. 2019, 16, 1665–1669. [Google Scholar] [CrossRef]
- Cai, Y.; Guan, K.; Peng, J.; Wang, S.; Seifert, C.; Wardlow, B.; Li, Z. A high-performance and in-season classification system of field-level crop types using time-series Landsat data and a machine learning approach. Remote Sens. Environ. 2018, 210, 35–47. [Google Scholar] [CrossRef]
- White, M.A.; De Beurs, K.M.; Didan, K.; Inouye, D.W.; Richardson, A.D.; Jensen, O.P.; O’Keefe, J.; Zhang, G.; Nemani, R.R.; Van Leeuwen, W.J.D.; et al. Intercomparison, interpretation, and assessment of spring phenology in North America estimated from remote sensing for 1982–2006. Glob. Change Biol. 2009, 15, 2335–2359. [Google Scholar] [CrossRef]
- Pastor-Guzman, J.; Dash, J.; Atkinson, P.M. Remote sensing of mangrove forest phenology and its environmental drivers. Remote Sens. Environ. 2018, 205, 71–84. [Google Scholar] [CrossRef]
- Bolton, D.K.; Friedl, M.A. Forecasting crop yield using remotely sensed vegetation indices and crop phenology metrics. Agric. For. Meteorol. 2013, 173, 74–84. [Google Scholar] [CrossRef]
- Diao, C. Remote sensing phenological monitoring framework to characterize corn and soybean physiological growing stages. Remote Sens. Environ. 2020, 248, 111960–111977. [Google Scholar] [CrossRef]
- Nurda, N.; Noguchi, R.; Ahamed, T. Forest productivity and carbon stock analysis from vegetation phenological indices using satellite remote sensing in Indonesia. Asia-Pac. J. Reg. Sci. 2020, 4, 657–690. [Google Scholar] [CrossRef]
- Richardson, A.D.; Black, T.A.; Ciais, P.; Delbart, N.; Friedl, M.A.; Gobron, N.; Hollinger, D.Y.; Kutsch, W.L.; Longdoz, B.; Luyssaert, S.; et al. Influence of spring and autumn phenological transitions on forest ecosystem productivity. Philos. Trans. R. Soc. B Biol. Sci. 2010, 365, 3227–3246. [Google Scholar] [CrossRef] [PubMed]
- Caparros-Santiago, J.A.; Rodriguez-Galiano, V.; Dash, J. Land surface phenology as indicator of global terrestrial ecosystem dynamics: A systematic review. ISPRS J. Photogramm. Remote Sens. 2021, 171, 330–347. [Google Scholar] [CrossRef]
- Tian, F.; Cai, Z.; Jin, H.; Hufkens, K.; Scheifinger, H.; Tagesson, T.; Smets, B.; Van Hoolst, R.; Bonte, K.; Ivits, E.; et al. Calibrating vegetation phenology from Sentinel-2 using eddy covariance, PhenoCam, and PEP725 networks across Europe. Remote Sens. Environ. 2021, 260, 112456–112470. [Google Scholar] [CrossRef]
- Huete, A.; Didan, K.; Miura, T.; Rodriguez, E.P.; Gao, X.; Ferreira, L. Overview of the radiometric and biophysical performance of the MODIS vegetation indices. Remote Sens. Environ. 2002, 83, 195–213. [Google Scholar] [CrossRef]
- Davi, H.; Soudani, K.; Deckx, T.; Dufrene, E.; Le Dantec, V.; Francois, C. Estimation of forest leaf area index from SPOT imagery using NDVI distribution over forest stands. Int. J. Remote Sens. 2006, 27, 885–902. [Google Scholar] [CrossRef]
- Che, M.; Chen, B.; Zhang, H.; Fang, S.; Xu, G.; Lin, X.; Wang, Y. A new equation for deriving vegetation phenophase from time series of leaf area index (LAI) data. Remote Sens. 2014, 6, 5650–5670. [Google Scholar] [CrossRef]
- Valderrama-Landeros, L.H.; España-Boquera, M.L.; Baret, F. Deforestation in Michoacan, Mexico, from CYCLOPES-LAI time series (2000–2006). IEEE J. Sel. Top. Appl. Earth Obs. Remote Sens. 2016, 9, 5398–5405. [Google Scholar] [CrossRef]
- Galvão, L.S.; Breunig, F.M.; dos Santos, J.R.; de Moura, Y.M. View-illumination effects on hyperspectral vegetation indices in the Amazonian tropical forest. Int. J. Appl. Earth Obs. Geoinf. 2013, 21, 291–300. [Google Scholar] [CrossRef]
- Jiang, Z.; Huete, A.R.; Didan, K.; Miura, T. Development of a two-band enhanced vegetation index without a blue band. Remote Sens. Environ. 2008, 112, 3833–3845. [Google Scholar] [CrossRef]
- Wang, M.; Luo, Y.; Zhang, Z.; Xie, Q.; Wu, X.; Ma, X. Recent advances in remote sensing of vegetation phenology: Retrieval algorithm and validation strategy. Natl. Remote Sens. Bull. 2022, 26, 431–455. [Google Scholar] [CrossRef]
- Verger, A.; Filella, I.; Baret, F.; Peñuelas, J. Vegetation baseline phenology from kilometric global LAI satellite products. Remote Sens. Environ. 2016, 178, 1–14. [Google Scholar] [CrossRef]
- Fang, H.; Baret, F.; Plummer, S.; Schaepman-Strub, G. An overview of global leaf area index (LAI): Methods, products, validation, and applications. Rev. Geophys. 2019, 57, 739–799. [Google Scholar] [CrossRef]
- Wang, X.; Sun, Z.; Lu, S.; Zhang, Z. Comparison of phenology estimated from monthly vegetation indices and solar-induced chlorophyll fluorescence in China. Front. Earth Sci. 2022, 10, 802763. [Google Scholar] [CrossRef]
- Richardson, A.D.; Braswell, B.H.; Hollinger, D.Y.; Jenkins, J.P.; Ollinger, S.V. Near-surface remote sensing of spatial and temporal variation in canopy phenology. Ecol. Appl. 2009, 19, 1417–1428. [Google Scholar] [CrossRef]
- Ahrends, H.E.; Etzold, S.; Kutsch, W.L.; Stoeckli, R.; Bruegger, R.; Jeanneret, F.; Wanner, H.; Buchmann, N.; Eugster, W. Tree phenology and carbon dioxide fluxes: Use of digital photography for process-based interpretation at the ecosystem scale. Clim. Res. 2009, 39, 261–274. [Google Scholar] [CrossRef]
- Damm, A.; Guanter, L.; Paul-Limoges, E.; Van der Tol, C.; Hueni, A.; Buchmann, N.; Eugster, W.; Ammann, C.; Schaepman, M.E. Far-red sun-induced chlorophyll fluorescence shows ecosystem-specific relationships to gross primary production: An assessment based on observational and modeling approaches. Remote Sens. Environ. 2015, 166, 91–105. [Google Scholar] [CrossRef]
- Yang, H.; Yang, X.; Zhang, Y.; Heskel, M.A.; Lu, X.; Munger, J.W.; Sun, S.; Tang, J. Chlorophyll fluorescence tracks seasonal variations of photosynthesis from leaf to canopy in a temperate forest. Glob. Change Biol. 2017, 23, 2874–2886. [Google Scholar] [CrossRef] [PubMed]
- Joiner, J.; Yoshida, Y.; Vasilkov, A.; Schaefer, K.; Jung, M.; Guanter, L.; Zhang, Y.; Garrity, S.; Middleton, E.; Huemmrich, K. The seasonal cycle of satellite chlorophyll fluorescence observations and its relationship to vegetation phenology and ecosystem atmosphere carbon exchange. Remote Sens. Environ. 2014, 152, 375–391. [Google Scholar] [CrossRef]
- Huang, K.; Zhang, Y.; Tagesson, T.; Brandt, M.; Wang, L.; Chen, N.; Zu, J.; Jin, H.; Cai, Z.; Tong, X. The confounding effect of snow cover on assessing spring phenology from space: A new look at trends on the Tibetan Plateau. Sci. Total Environ. 2021, 756, 144011. [Google Scholar] [CrossRef]
- Gebremichael, M.; Barros, A. Evaluation of MODIS Gross Primary Productivity (GPP) in tropical monsoon regions. Remote Sens. Environ. 2006, 100, 150–166. [Google Scholar] [CrossRef]
- Yuan, W.; Liu, S.; Yu, G.; Bonnefond, J.-M.; Chen, J.; Davis, K.; Desai, A.R.; Goldstein, A.H.; Gianelle, D.; Rossi, F. Global estimates of evapotranspiration and gross primary production based on MODIS and global meteorology data. Remote Sens. Environ. 2010, 114, 1416–1431. [Google Scholar] [CrossRef]
- Zhou, S.; Zhang, Y.; Caylor, K.K.; Luo, Y.; Xiao, X.; Ciais, P.; Huang, Y.; Wang, G. Explaining inter-annual variability of gross primary productivity from plant phenology and physiology. Agric. For. Meteorol. 2016, 226–227, 246–256. [Google Scholar] [CrossRef]
- Xia, J.; Niu, S.; Ciais, P.; Janssens, I.A.; Chen, J.; Ammann, C.; Arain, A.; Blanken, P.D.; Cescatti, A.; Bonal, D.; et al. Joint control of terrestrial gross primary productivity by plant phenology and physiology. Proc. Natl. Acad. Sci. USA 2015, 112, 2788–2793. [Google Scholar] [CrossRef]
- Friend, A.D.; Arneth, A.; Kiang, N.Y.; Lomas, M.; Ogee, J.; Rödenbeck, C.; Running, S.W.; Santaren, J.D.; Sitch, S.; Viovy, N. FLUXNET and modelling the global carbon cycle. Glob. Change Biol. 2007, 13, 610–633. [Google Scholar] [CrossRef]
- Wu, C.; Chen, J.M.; Gonsamo, A.; Price, D.T.; Black, T.A.; Kurz, W.A. Interannual variability of net carbon exchange is related to the lag between the end-dates of net carbon uptake and photosynthesis: Evidence from long records at two contrasting forest stands. Agric. For. Meteorol. 2012, 164, 29–38. [Google Scholar] [CrossRef]
- Gonsamo, A.; Chen, J.M.; Wu, C.; Dragoni, D. Predicting deciduous forest carbon uptake phenology by upscaling FLUXNET measurements using remote sensing data. Agric. For. Meteorol. 2012, 165, 127–135. [Google Scholar] [CrossRef]
- D’Odorico, P.; Gonsamo, A.; Gough, C.M.; Bohrer, G.; Morison, J.; Wilkinson, M.; Hanson, P.J.; Gianelle, D.; Fuentes, J.D.; Buchmann, N. The match and mismatch between photosynthesis and land surface phenology of deciduous forests. Agric. For. Meteorol. 2015, 214–215, 25–38. [Google Scholar] [CrossRef]
- Balzarolo, M.; Vicca, S.; Nguy-Robertson, A.L.; Bonal, D.; Elbers, J.A.; Fu, Y.H.; Grünwald, T.; Horemans, J.A.; Papale, D.; Peñuelas, J.; et al. Matching the phenology of Net Ecosystem Exchange and vegetation indices estimated with MODIS and FLUXNET in-situ observations. Remote Sens. Environ. 2016, 174, 290–300. [Google Scholar] [CrossRef]
- Xu, X.; Du, H.; Fan, W.; Hu, J.; Mao, F.; Dong, H. Long-term trend in vegetation gross primary production, phenology and their relationships inferred from the FLUXNET data. J. Environ. Manag. 2019, 246, 605–616. [Google Scholar] [CrossRef] [PubMed]
- Wu, C.; Chen, J.M.; Black, T.A.; Price, D.T.; Kurz, W.A.; Desai, A.R.; Gonsamo, A.; Jassal, R.S.; Gough, C.M.; Bohrer, G. Interannual variability of net ecosystem productivity in forests is explained by carbon flux phenology in autumn. Glob. Ecol. Biogeogr. 2013, 22, 994–1006. [Google Scholar] [CrossRef]
- Migliavacca, M.; Reichstein, M.; Richardson, A.D.; Mahecha, M.D.; Cremonese, E.; Delpierre, N.; Galvagno, M.; Law, B.E.; Wohlfahrt, G.; Andrew Black, T. Influence of physiological phenology on the seasonal pattern of ecosystem respiration in deciduous forests. Glob. Change Biol. 2015, 21, 363–376. [Google Scholar] [CrossRef]
- Anniwaer, N.; Li, X.; Wang, K.; Xu, H.; Hong, S. Shifts in the trends of vegetation greenness and photosynthesis in different parts of Tibetan Plateau over the past two decades. Agric. For. Meteorol. 2024, 345, 109851–109861. [Google Scholar] [CrossRef]
- Fu, Z.; Stoy, P.C.; Luo, Y.; Chen, J.; Sun, J.; Montagnani, L.; Wohlfahrt, G.; Rahman, A.F.; Rambal, S.; Bernhofer, C.; et al. Climate controls over the net carbon uptake period and amplitude of net ecosystem production in temperate and boreal ecosystems. Agric. For. Meteorol. 2017, 243, 9–18. [Google Scholar] [CrossRef]
- Zhou, L.; Zhou, W.; Chen, J.; Xu, X.; Wang, Y.; Zhuang, J.; Chi, Y. Land surface phenology detections from multi-source remote sensing indices capturing canopy photosynthesis phenology across major land cover types in the Northern Hemisphere. Ecol. Indic. 2022, 135, 108579–108589. [Google Scholar] [CrossRef]
- Panwar, A.; Migliavacca, M.; Nelson, J.A.; Cortes, J.; Bastos, A.; Forkel, M.; Winkler, A.J. Methodological challenges and new perspectives of shifting vegetation phenology in eddy covariance data. Sci. Rep. 2023, 13, 13885. [Google Scholar] [CrossRef]
- Peng, D.; Wu, C.; Li, C.; Zhang, X.; Liu, Z.; Ye, H.; Luo, S.; Liu, X.; Hu, Y.; Fang, B. Spring green-up phenology products derived from MODIS NDVI and EVI: Intercomparison, interpretation and validation using National Phenology Network and AmeriFlux observations. Ecol. Indic. 2017, 77, 323–336. [Google Scholar] [CrossRef]
- Yuan, H.; Wang, X.; Jassal, R.S.; Lu, L.; Peng, J.; Wu, C. Remote Sensing of Autumn Phenology by Including Surface Soil Temperature: Algorithm Development, Calibration, and Validation. IEEE J. Sel. Top. Appl. Earth Obs. Remote Sens. 2022, 15, 6485–6494. [Google Scholar] [CrossRef]
- Wang, S.; Zhang, L.; Huang, C.; Qiao, N. An NDVI-based vegetation phenology is improved to be more consistent with photosynthesis dynamics through applying a light use efficiency model over boreal high-latitude forests. Remote Sens. 2017, 9, 695. [Google Scholar] [CrossRef]
- Migliavacca, M.; Musavi, T.; Mahecha, M.D.; Nelson, J.A.; Knauer, J.; Baldocchi, D.D.; Perez-Priego, O.; Christiansen, R.; Peters, J.; Anderson, K. The three major axes of terrestrial ecosystem function. Nature 2021, 598, 468–472. [Google Scholar] [CrossRef] [PubMed]
- Wang, J.; Wu, C.; Zhang, C.; Ju, W.; Wang, X.; Chen, Z.; Fang, B. Improved modeling of gross primary productivity (GPP) by better representation of plant phenological indicators from remote sensing using a process model. Ecol. Indic. 2018, 88, 332–340. [Google Scholar] [CrossRef]
- Xu, X.; Tang, Y.; Qu, Y.; Zhou, Z.; Hu, J. Global vegetation photosynthetic phenology products based on MODIS vegetation greenness and temperature: Modeling and evaluation. Remote Sens. 2021, 13, 5080. [Google Scholar] [CrossRef]
- Zhang, Y.; Ye, A. Would the obtainable gross primary productivity (GPP) products stand up? A critical assessment of 45 global GPP products. Sci. Total Environ. 2021, 783, 146965. [Google Scholar] [CrossRef]
- Liang, S.; Cheng, J.; Jia, K.; Jiang, B.; Liu, Q.; Xiao, Z.; Yao, Y.; Yuan, W.; Zhang, X.; Zhao, X. The global land surface satellite (GLASS) product suite. Bull. Am. Meteorol. Soc. 2021, 102, E323–E337. [Google Scholar] [CrossRef]
- Yuan, W.; Cai, W.; Xia, J.; Chen, J.; Liu, S.; Dong, W.; Merbold, L.; Law, B.; Arain, A.; Beringer, J. Global comparison of light use efficiency models for simulating terrestrial vegetation gross primary production based on the LaThuile database. Agric. For. Meteorol. 2014, 192, 108–120. [Google Scholar] [CrossRef]
- Yuan, W.; Liu, S.; Zhou, G.; Zhou, G.; Tieszen, L.L.; Baldocchi, D.; Bernhofer, C.; Gholz, H.; Goldstein, A.H.; Goulden, M.L. Deriving a light use efficiency model from eddy covariance flux data for predicting daily gross primary production across biomes. Agric. For. Meteorol. 2007, 143, 189–207. [Google Scholar] [CrossRef]
- Zhang, X.; Friedl, M.A.; Schaaf, C.B.; Strahler, A.H.; Hodges, J.C.; Gao, F.; Reed, B.C.; Huete, A. Monitoring vegetation phenology using MODIS. Remote Sens. Environ. 2003, 84, 471–475. [Google Scholar] [CrossRef]
- Zhang, X.; Wang, J.; Henebry, G.M.; Gao, F. Development and evaluation of a new algorithm for detecting 30 m land surface phenology from VIIRS and HLS time series. ISPRS J. Photogramm. Remote Sens. 2020, 161, 37–51. [Google Scholar] [CrossRef]
- Tan, B.; Morisette, J.T.; Wolfe, R.E.; Gao, F.; Ederer, G.A.; Nightingale, J.; Pedelty, J.A. An enhanced TIMESAT algorithm for estimating vegetation phenology metrics from MODIS data. IEEE J. Sel. Top. Appl. Earth Obs. Remote Sens. 2010, 4, 361–371. [Google Scholar] [CrossRef]
- Friedl, M. MuSLI Multi-Source Land Surface Phenology Yearly North America 30 m V011; NASA Land Processes Distributed Active Archive Center: Sioux Falls, SD, USA, 2021. [Google Scholar] [CrossRef]
- Luo, Y.; Zhang, Z.; Chen, Y.; Li, Z.; Tao, F. ChinaCropPhen1km: A high-resolution crop phenological dataset for three staple crops in China during 2000–2015 based on leaf area index (LAI) products. Earth Syst. Sci. Data 2020, 12, 197–214. [Google Scholar] [CrossRef]
- Xia, J.; Yi, G.; Zhang, T.; Zhou, X.; Miao, J.; Bie, X. Interannual variation in the start of vegetation growing season and its response to climate change in the Qinghai–Tibet Plateau derived from MODIS data during 2001 to 2016. J. Appl. Remote Sens. 2019, 13, 048506. [Google Scholar] [CrossRef]
- Wang, X.; Xiao, J.; Li, X.; Cheng, G.; Ma, M.; Che, T.; Dai, L.; Wang, S.; Wu, J. No consistent evidence for advancing or delaying trends in spring phenology on the Tibetan Plateau. J. Geophys. Res. Biogeosci. 2017, 122, 3288–3305. [Google Scholar] [CrossRef]
- Zheng, Y.; Shen, R.; Wang, Y.; Li, X.; Liu, S.; Liang, S.; Chen, J.M.; Ju, W.; Zhang, L.; Yuan, W. Improved estimate of global gross primary production for reproducing its long-term variation, 1982–2017. Earth Syst. Sci. Data 2020, 12, 2725–2746. [Google Scholar] [CrossRef]
- Li, F.; Xiao, J.; Chen, J.; Ballantyne, A.; Jin, K.; Li, B.; Abraha, M.; John, R. Global water use efficiency saturation due to increased vapor pressure deficit. Science 2023, 381, 672–677. [Google Scholar] [CrossRef]
- Wu, C.; Peng, J.; Ciais, P.; Peñuelas, J.; Wang, H.; Beguería, S.; Andrew Black, T.; Jassal, R.S.; Zhang, X.; Yuan, W.; et al. Increased drought effects on the phenology of autumn leaf senescence. Nat. Clim. Change 2022, 12, 943–949. [Google Scholar] [CrossRef]
- Wang, S.; Zhang, Y.; Ju, W.; Chen, J.M.; Ciais, P.; Cescatti, A.; Sardans, J.; Janssens, I.A.; Wu, M.; Berry, J.A.; et al. Recent global decline of CO(2) fertilization effects on vegetation photosynthesis. Science 2020, 370, 1295–1300. [Google Scholar] [CrossRef] [PubMed]
- Baldocchi, D.; Falge, E.; Gu, L.; Olson, R.; Hollinger, D.; Running, S.; Anthoni, P.; Bernhofer, C.; Davis, K.; Evans, R.; et al. FLUXNET: A New Tool to Study the Temporal and Spatial Variability of Ecosystem–Scale Carbon Dioxide, Water Vapor, and Energy Flux Densities. Bull. Am. Meteorol. Soc. 2001, 82, 2415–2434. [Google Scholar] [CrossRef]
- Richardson, A.D. PhenoCam: An evolving, open-source tool to study the temporal and spatial variability of ecosystem-scale phenology. Agric. For. Meteorol. 2023, 342, 109751. [Google Scholar] [CrossRef]
- Berra, E.F.; Gaulton, R. Remote sensing of temperate and boreal forest phenology: A review of progress, challenges and opportunities in the intercomparison of in-situ and satellite phenological metrics. For. Ecol. Manag. 2021, 480, 118663–118679. [Google Scholar] [CrossRef]
- Meier, U.; Bleiholder, H.; Buhr, L.; Feller, C.; Hack, H.; Heß, M.; Lancashire, P.D.; Schnock, U.; Stauß, R.; Van Den Boom, T. The BBCH system to coding the phenological growth stages of plants–history and publications. J. Kult. 2009, 61, 41–52. [Google Scholar]
- Ye, Y.; Zhang, X.; Shen, Y.; Wang, J.; Crimmins, T.; Scheifinger, H. An optimal method for validating satellite-derived land surface phenology using in-situ observations from national phenology networks. ISPRS J. Photogramm. Remote Sens. 2022, 194, 74–90. [Google Scholar] [CrossRef]
- Zhang, J.; Tong, X.; Zhang, J.; Meng, P.; Li, J.; Liu, P. Dynamics of phenology and its response to climatic variables in a warm-temperate mixed plantation. For. Ecol. Manag. 2021, 483, 118785. [Google Scholar] [CrossRef]
- Zhang, R.; Guo, J.; Liang, T.; Feng, Q. Grassland vegetation phenological variations and responses to climate change in the Xinjiang region, China. Quat. Int. 2019, 513, 56–65. [Google Scholar] [CrossRef]
- Gonsamo, A.; Chen, J.M. Circumpolar vegetation dynamics product for global change study. Remote Sens. Environ. 2016, 182, 13–26. [Google Scholar] [CrossRef]
- Sulla-Menashe, D.; Friedl, M.A. User Guide to Collection 6 MODIS Land Cover (MCD12Q1 and MCD12C1) Product; USGS: Reston, VA, USA, 2018; Volume 1. [Google Scholar]
- Gonsamo, A.; Chen, J.M.; Price, D.T.; Kurz, W.A.; Wu, C. Land surface phenology from optical satellite measurement and CO2 eddy covariance technique. J. Geophys. Res. Biogeosci. 2012, 117, 32–39. [Google Scholar] [CrossRef]
- Gonsamo, A.; Chen, J.M.; D’Odorico, P. Deriving land surface phenology indicators from CO2 eddy covariance measurements. Ecol. Indic. 2013, 29, 203–207. [Google Scholar] [CrossRef]
- Zeng, L.; Wardlow, B.D.; Xiang, D.; Hu, S.; Li, D. A review of vegetation phenological metrics extraction using time-series, multispectral satellite data. Remote Sens. Environ. 2020, 237, 111511–111530. [Google Scholar] [CrossRef]
- Klosterman, S.; Hufkens, K.; Gray, J.; Melaas, E.; Sonnentag, O.; Lavine, I.; Mitchell, L.; Norman, R.; Friedl, M.; Richardson, A. Evaluating remote sensing of deciduous forest phenology at multiple spatial scales using PhenoCam imagery. Biogeosciences 2014, 11, 4305–4320. [Google Scholar] [CrossRef]
- Richardson, A.D.; Jenkins, J.P.; Braswell, B.H.; Hollinger, D.Y.; Ollinger, S.V.; Smith, M.-L. Use of digital webcam images to track spring green-up in a deciduous broadleaf forest. Oecologia 2007, 152, 323–334. [Google Scholar] [CrossRef] [PubMed]
- Soudani, K.; Hmimina, G.; Delpierre, N.; Pontailler, J.-Y.; Aubinet, M.; Bonal, D.; Caquet, B.; De Grandcourt, A.; Burban, B.; Flechard, C. Ground-based Network of NDVI measurements for tracking temporal dynamics of canopy structure and vegetation phenology in different biomes. Remote Sens. Environ. 2012, 123, 234–245. [Google Scholar] [CrossRef]
- Peng, D.; Zhang, X.; Wu, C.; Huang, W.; Gonsamo, A.; Huete, A.R.; Didan, K.; Tan, B.; Liu, X.; Zhang, B. Intercomparison and evaluation of spring phenology products using National Phenology Network and AmeriFlux observations in the contiguous United States. Agric. For. Meteorol. 2017, 242, 33–46. [Google Scholar] [CrossRef]
- Richardson, A.D.; Hufkens, K.; Li, X.; Ault, T.R. Testing Hopkins’ bioclimatic law with PhenoCam data. Appl. Plant Sci. 2019, 7, e01228. [Google Scholar] [CrossRef]
- Shen, M.; Zhao, W.; Jiang, N.; Liu, L.; Cao, R.; Yang, W.; Zhu, X.; Wang, C.; Chen, X.; Chen, J.; et al. Challenges in remote sensing of vegetation phenology. Innov. Geosci. 2024, 2, 100070. [Google Scholar] [CrossRef]
- Wang, S.; Lu, X.; Cheng, X.; Li, X.; Peichl, M.; Mammarella, I. Limitations and challenges of MODIS-derived phenological metrics across different landscapes in pan-Arctic regions. Remote Sens. 2018, 10, 1784. [Google Scholar] [CrossRef]
- Zhou, X.; Wang, X.; Zhang, S.; Zhang, Y.; Bai, X. Combining phenological camera photos and modis reflectance data to predict GPP daily dynamics for alpine meadows on the tibetan plateau. Remote Sens. 2020, 12, 3735. [Google Scholar] [CrossRef]
- Yin, P.; Li, X.; Heiskanen, J.; Pellikka, P. Comparative analysis of global urban land surface phenology between the MODIS and VIIRS products and extraction methods. J. Environ. Manag. 2025, 375, 124326. [Google Scholar] [CrossRef]
- Htitiou, A.; Boudhar, A.; Chehbouni, A.; Benabdelouahab, T. National-scale cropland mapping based on phenological metrics, environmental covariates, and machine learning on Google Earth Engine. Remote Sens. 2021, 13, 4378. [Google Scholar] [CrossRef]
- Tian, J.; Zhu, X.; Chen, J.; Wang, C.; Shen, M.; Yang, W.; Tan, X.; Xu, S.; Li, Z. Improving the accuracy of spring phenology detection by optimally smoothing satellite vegetation index time series based on local cloud frequency. ISPRS J. Photogramm. Remote Sens. 2021, 180, 29–44. [Google Scholar] [CrossRef]
- Cai, Z.; Jönsson, P.; Jin, H.; Eklundh, L. Performance of smoothing methods for reconstructing NDVI time-series and estimating vegetation phenology from MODIS data. Remote Sens. 2017, 9, 1271. [Google Scholar] [CrossRef]
- Guanter, L.; Zhang, Y.; Jung, M.; Joiner, J.; Voigt, M.; Berry, J.A.; Frankenberg, C.; Huete, A.R.; Zarco-Tejada, P.; Lee, J.-E. Global and time-resolved monitoring of crop photosynthesis with chlorophyll fluorescence. Proc. Natl. Acad. Sci. USA 2014, 111, E1327–E1333. [Google Scholar] [CrossRef]
Disclaimer/Publisher’s Note: The statements, opinions and data contained in all publications are solely those of the individual author(s) and contributor(s) and not of MDPI and/or the editor(s). MDPI and/or the editor(s) disclaim responsibility for any injury to people or property resulting from any ideas, methods, instructions or products referred to in the content. |
© 2025 by the authors. Licensee MDPI, Basel, Switzerland. This article is an open access article distributed under the terms and conditions of the Creative Commons Attribution (CC BY) license (https://creativecommons.org/licenses/by/4.0/).