Highlights
What are the main findings?
- We proposed a lightweight network, S2M-Net, for accurate small-ship recognition.
- We optimized convolution and attention mechanisms to reduce computational cost and model parameters.
What are the implications of the main findings?
- We constructed a multi-scale fusion module to enhance small-ship perception.
- We demonstrated superior accuracy and a more lightweight design versus state-of-the-art methods.
Abstract
Synthetic aperture radar (SAR) provides all-weather and all-day imaging capabilities and can penetrate clouds and fog, playing an important role in ship detection. However, small ships usually contain weak feature information in such images and are easily affected by noise, which makes detection challenging. In practical deployment, limited computing resources require lightweight models to improve real-time performance, yet achieving a lightweight design while maintaining high detection accuracy for small targets remains a key challenge in object detection. To address this issue, we propose a novel lightweight network for accurate small-ship recognition in SAR images, named S2M-Net. Specifically, the Space-to-Depth Convolution (SPD-Conv) module is introduced in the feature extraction stage to optimize convolutional structures, reducing computation and parameters while retaining rich feature information. The Mixed Local-Channel Attention (MLCA) module integrates local and channel attention mechanisms to enhance adaptation to complex backgrounds and improve small-target detection accuracy. The Multi-Scale Dilated Attention (MSDA) module employs multi-scale dilated convolutions to fuse features from different receptive fields, strengthening detection across ships of various sizes. The experimental results show that S2M-Net achieved mAP50 values of 0.989, 0.955, and 0.883 on the SSDD, HRSID, and SARDet-100k datasets, respectively. Compared with the baseline model, the F1 score increased by 1.13%, 2.71%, and 2.12%. Moreover, S2M-Net outperformed other state-of-the-art algorithms in FPS across all datasets, achieving a well-balanced trade-off between accuracy and efficiency. This work provides an effective solution for accurate ship detection in SAR images.
1. Introduction
Ships serve as vital carriers for both maritime economy and military activities, playing key roles in marine transportation, resource exploitation, and national defense [1,2,3,4]. Accurate ship detection directly affects the effectiveness of marine resource management and the capability to safeguard sovereignty. It is also of great importance for building a global maritime intelligent monitoring network and for rapidly locating affected ships during marine disasters such as typhoons and oil spills [5,6,7,8]. Synthetic aperture radar (SAR) maintains robust imaging capabilities even under extreme meteorological conditions [9], thereby offering unique advantages for maritime vessel detection and emerging as a focal point of recent research [10,11,12,13]. However, small vessels occupy only limited pixels [14] and are further obscured by speckle noise, which severely constrains their feature representation and compromises detection accuracy. In practical deployments, operational flexibility additionally demands models that remain lightweight and energy-efficient while ensuring real-time performance. These challenges underscore the urgent need for innovative strategies that simultaneously enhance small-target feature representation and advance the design of efficient detection architectures.
Traditional ship detection methods largely rely on handcrafted features and rule-based designs. Among them, the constant false alarm rate (CFAR) approach is the most representative [15]. However, such methods depend heavily on manual parameter tuning and exhibit limited generalization ability. They are prone to missed detections and false alarms in complex backgrounds, such as nearshore areas or dense ship clusters [16,17]. Another category employs handcrafted feature extraction methods such as SIFT [18] and HOG [19]. Due to limited multi-scale adaptability, their performance in detecting small targets remains unsatisfactory [20]. In addition, physical priors can further enhance vessel feature representation. For example, Wang et al. [21] developed a particle swarm optimization-based fine polarimetric decomposition method that effectively characterizes vessel scattering mechanisms, thereby providing essential physical support for detection in complex environments. Meanwhile, the advent of deep learning, particularly the widespread application of convolutional neural networks (CNNs) to SAR image analysis [22,23,24], has markedly advanced object detection technologies [25,26,27,28,29]. The rise of deep learning, especially the wide application of convolutional neural networks (CNNs), has brought revolutionary advances to object detection. Existing approaches are mainly divided into two-stage and one-stage algorithms. Two-stage methods achieve high detection accuracy by generating region proposals followed by refined classification and localization. However, they involve high computational cost, making real-time deployment difficult. Typical representatives include R-CNN [30], Fast R-CNN [31], Faster R-CNN [32], Libra R-CNN [33], and Cascade R-CNN [34]. In contrast, one-stage methods such as YOLO [35], RetinaNet [36], and SSD [37] eliminate the region proposal step, performing localization and classification directly, and thus offer advantages in speed and deployment efficiency. In recent years, the introduction of Transformer-based architectures, such as ViTDet [38], has further advanced object detection. Leveraging self-attention mechanisms, Transformers can model global contextual information and demonstrate strong feature extraction ability in complex scenes. Nevertheless, these models usually require high computational cost and powerful hardware, which limits their deployment on resource-constrained platforms.
In real-world applications such as maritime surveillance, navigational security, and satellite remote sensing, vessel detection systems must achieve high accuracy while operating under stringent constraints on computational resources and power consumption. These requirements render lightweight detection a critical challenge for real-time deployment. To address this, researchers have pursued multiple strategies: optimizing network architectures [39], compressing redundant parameters [40,41], and refining convolutional operations [42] to markedly reduce computational complexity without sacrificing accuracy [43,44]. In parallel, techniques such as multi-scale feature fusion, attention mechanisms, and receptive field expansion have been integrated into lightweight networks to strengthen feature representation for small vessels and enhance robustness in cluttered maritime backgrounds [45,46]. Zhang et al. [47] proposed ShipDeNet-20, which integrates depthwise separable convolutions with feature fusion and enhancement modules to achieve an ultra-lightweight architecture. However, despite notable progress in speed and model compactness, these approaches still face limitations in small-object detection and in handling complex environments. For instance, reducing network depth or simplifying convolutional operations to lower computational cost can weaken global context modeling, thereby diminishing robustness in cluttered backgrounds.
In SAR-based object detection, small vessels represent one of the most challenging targets [25,26,48]. Owing to their limited size, they exhibit weak backscatter in SAR imagery and are highly susceptible to sea clutter and speckle noise. To address this challenge, researchers have primarily introduced attention mechanisms or expanded receptive fields to highlight salient features and enhance long-range contextual modeling. For example, Gong et al. [49] introduced SSPNet, which leverages contextual attention and scale enhancement modules to optimize small-target features. Xiao et al. [50] improved detection accuracy by employing recursive prediction feature enhancement and switchable atrous convolution. Li et al. [51] proposed a global–local Transformer architecture that combines multi-scale feature enhancement with local attention to refine bounding box localization. Zhao et al. [52] enhanced small-target perception through denoising, receptive field expansion, and adaptive multi-scale feature fusion. Li et al. [53] improved small-target representation by introducing channel feature enhancement and cross-scale feature selection fusion. Xu et al. [54] presented MC-ASFF-ShipYOLO, which integrates Monte Carlo attention with adaptive spatial feature fusion to improve dense small-target detection. Yu et al. [55] proposed a single-stage feature network based on YOLOX-s, using residual asymmetric atrous convolution modules to expand the receptive field while reducing computational cost. These studies demonstrate that lightweight improvements to YOLO-based models hold great potential for balancing detection accuracy and speed, particularly in small-target scenarios. Although the aforementioned approaches achieve some success in small-object detection, they remain constrained in several aspects. First, while feature enhancement modules and attention mechanisms can improve accuracy, they often incur increased computational cost, limiting deployment on resource-constrained embedded platforms. Second, lightweight networks frequently provide insufficient feature representation for small vessels or dense ship formations, leading to missed or false detections. Finally, substantial variations in small-object distributions across datasets mean that the generalization ability of existing methods has yet to be fully validated. Developing a detection approach that combines high accuracy with operational efficiency, thus, remains a critical challenge.
The YOLO series has undergone continuous iterations [56], with YOLOv11 [35] being the latest product in the Ultralytics real-time object detection series. It achieves significant improvements in speed, accuracy, and structural optimization, providing a solid baseline for lightweight ship detection. Although existing studies have made notable progress in enhancing SAR ship detection, most approaches focus solely on either improving small-target accuracy or reducing model complexity. Few works provide a systematic framework that balances both aspects simultaneously. To address this gap, we propose a novel lightweight network for accurate small-ship recognition in SAR images, named S2M-Net. Built upon YOLOv11, S2M-Net enhances feature representation and multi-scale fusion and introduces detection enhancement modules tailored for SAR small targets. This design achieves a balance between high detection accuracy and efficient deployment. The main contributions of this paper are as follows:
- We propose a novel lightweight SAR small-ship detection network, named S2M-Net. By optimizing the network structure and convolutional strategy, S2M-Net effectively reduces computational cost and parameter size while maintaining high detection accuracy, providing a feasible solution for practical deployment.
- We designed a processing strategy consisting of feature extraction, feature enhancement, and feature selection. The Space-to-Depth Convolution (SPD-Conv) module preserves fine-grained information during downsampling. The Mixed Local-Channel Attention (MLCA) module integrates local and channel attention mechanisms, while the output stage finely models the positional and categorical relationships of small targets. This design achieves a balanced trade-off between detection accuracy and inference speed, enabling superior performance in SAR small-ship recognition tasks.
- We constructed the Multi-Scale Dilated Attention (MSDA) module to enhance the perception of small targets of different sizes during multi-scale feature fusion, while simultaneously suppressing noise in SAR images. This significantly improves detection accuracy in complex backgrounds.
S2M-Net was systematically evaluated on three benchmark SAR ship datasets: SSDD, HRSID, and SARDet-100K. The remainder of this paper is organized as follows. Section 2 introduces the network design, datasets, and experimental environment. Section 3 presents both quantitative and qualitative analyses of the proposed method, focusing on detection accuracy and model lightweighting. Section 4 discusses key findings and the applicability of the approach. Section 5 concludes this paper and outlines future work.
2. Materials and Methods
Compared with previous YOLO versions, YOLOv11 [35] introduces optimizations in network structure, feature extraction, and attention mechanisms. The C3k2 module replaces C2f, a multi-head attention C2PSA structure is added after SPPF, and the DWConv in the detection head is updated. These improvements enhance feature representation while reducing model parameters, achieving both high accuracy and fast inference. YOLOv11n is the minimal version of YOLOv11, with network parameters controlled at the smallest scale. The trained weight file is less than 7 MB, making it highly suitable for terminal deployment and real-time object detection scenarios.
Building on this framework, our method comprises three principal stages. In the first stage, feature extraction, convolutional structures are optimized to minimize information loss during downsampling while maintaining computational efficiency, yielding a lightweight architecture. In the second stage, feature selection, local and channel attention mechanisms precisely localize and classify small targets, enhancing detection accuracy. In the final stage, feature enhancement, a multi-scale dilated attention mechanism reinforces small-target representations and improves adaptability to complex backgrounds. The overall architecture of S2M-Net is depicted in Figure 1.
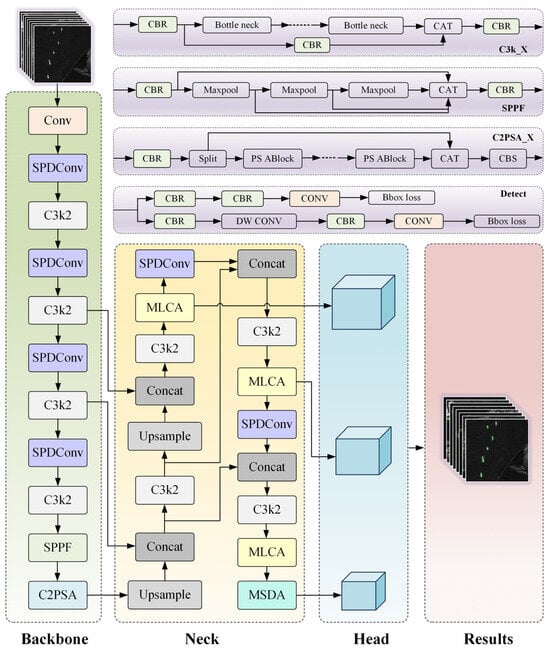
Figure 1.
S2M-Net network architecture.
2.1. Space-to-Depth Convolution
In SAR images, detecting small-ship targets often faces challenges, such as limited resolution, sparse feature information, and strong speckle noise. In traditional CNNs, commonly used strided convolutions and pooling layers may lose fine-grained features during downsampling, reducing detection accuracy for small targets. Inspired by [57,58,59,60], we introduced the SPD-Conv module (Figure 2). This module preserves critical features while reducing redundant computation through a lossless downsampling approach, satisfying the lightweight design requirement.
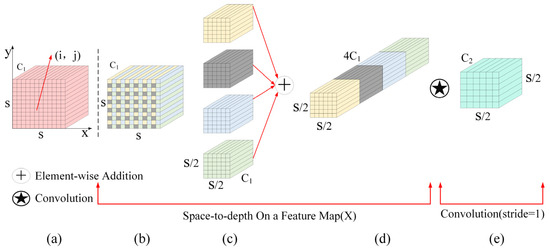
Figure 2.
Structure of the SPD-Conv module. (a) Original feature map, (b) feature map after partitioning, (c) feature map after space-to-depth transformation, (d) feature map after channel-wise block concatenation, and (e) final feature map obtained through stride-1 convolution.
The SPD-Conv structure consists mainly of two parts connected in series: one part is the spatial-to-depth layer (SPD), as shown in Figure 2b–d, and the other part is the non-strided convolution layer, as shown in Figure 2d,e.
The SPD layer divides the input feature map into subfeature maps, denoted as . Each subfeature map consists of pixels that satisfy the conditions and , with a size of . Subsequently, all subfeature maps are concatenated along the channel dimension to generate a new feature map , achieving spatial dimensionality reduction and structured integration of channel information. Immediately afterward, a non-strided convolution (with ) is appended after , which contains filters (where ). This convolution further transforms into , yielding the final output feature map.
The main reason for using a non-strided convolution layer is that directly using a convolution with a stride greater than 1 leads to asymmetric sampling, where different pixel positions are sampled different numbers of times. Although this seemingly compresses the spatial dimension, it implicitly loses fine-grained discriminative information. Using a convolution with stride = 1 can maximize the retention of the structured information from the concatenated subfeature maps after the SPD transformation. Meanwhile, it extracts features through convolution kernel weight learning, achieving reasonable compression of the number of channels. The design adopts a cascaded structure of block downsampling, channel concatenation, and non-strided convolution. It not only achieves spatial dimensionality reduction and channelized integration of multi-scale block information through the SPD stage but also avoids information loss from traditional large-stride operations by relying on non-strided convolution. Ultimately, it outputs a feature map that is spatially compact, channel-refined, and sufficiently discriminative.
2.2. Mixed Local-Channel Attention
In small-target detection tasks, traditional attention mechanisms face three main challenges. First, mainstream channel attention methods, such as SE and ECA, model only global channel relationships and tend to ignore spatial feature information, resulting in insufficient spatial localization for small targets. Second, hybrid attention modules, such as CBAM, introduce spatial attention but involve high parameter counts and computational complexity, making them difficult to adapt to lightweight networks. Third, existing lightweight spatial attention methods, such as CA, capture only long-range dependencies and lack the ability to capture local details, while accurate recognition of small-ship targets highly depends on local textures and contour features. To address these challenges and inspired by [61], we propose the MLCA module. By using a dual-branch structure to jointly model local and global features, MLCA enhances feature representation while maintaining a lightweight design.
As shown in Figure 3, the MLCA module first decomposes the input feature map into local blocks (default ) using local average pooling (LAP), generating local spatial features . In the global branch, global average pooling (GAP) is applied to compress the spatial dimensions, producing channel weights . Cross-channel interactions are then modeled using a one-dimensional convolution (Conv1d), where the convolution kernel size k is adaptively determined by the number of channels C, as expressed in Equation (1).
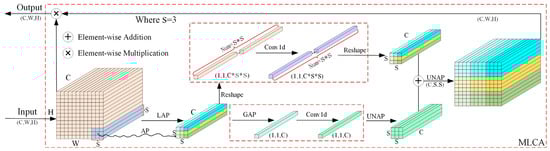
Figure 3.
MLCA module.
Here, and b = 2 are hyperparameters, and ensures that k is an odd number. In the local branch, a one-dimensional convolution is applied to along the spatial dimension to produce local spatial-channel weights . The outputs of the two branches are then upsampled using unpooling (UNAP) to restore the original resolution and directly summed. A sigmoid activation is applied to generate the attention mask (Equation (2)).
Here, represents the sigmoid function. This design preserves spatial details through local block partitioning while reducing the number of parameters by using one-dimensional convolution.
Importantly, UNAP serves as the core operation within the MLCA module for restoring feature map resolution, executed subsequent to the dual-branch processing. Specifically, the local branch employs LAP to capture fine-grained spatial details of the input features, followed by reshaping and a 1D convolution to generate local weights. Concurrently, the global branch applies GAP to compress spatial dimensions, deriving global channel weights that are further refined via 1D convolution. UNAP then performs unpooling on the outputs of both branches, adaptively restoring the feature maps to their original spatial resolution, and fuses local and global features through element-wise addition [61,62]. Notably, this process avoids additional channel dimensionality reduction, thereby preserving feature integrity. In the context of small-target SAR image detection, UNAP maintains vessel texture and contour details while, in conjunction with MLCA attention mechanisms, effectively suppressing background noise. The cooperative interplay between LAP and GAP ensures that restored features retain critical spatial structures, providing robust support for subsequent multi-scale feature fusion and object detection.
2.3. Multi-Scale Dilated Attention
In SAR small-ship detection, targets are typically small and heavily obscured by complex sea clutter and speckle noise, posing significant challenges for conventional convolutional neural networks in capturing critical features. While global attention mechanisms can model long-range dependencies, their computational cost scales quadratically with image resolution, leading to inefficiency, particularly for high-resolution SAR imagery. Existing approaches for multi-scale target handling often rely on complex network architectures or incur additional computational overhead, making it difficult to balance accuracy and efficiency. To overcome these limitations, we introduced the MSDA module, which leverages layered dilation rates to enable sparse sampling and efficient multi-scale feature fusion [63], as illustrated in Figure 4.
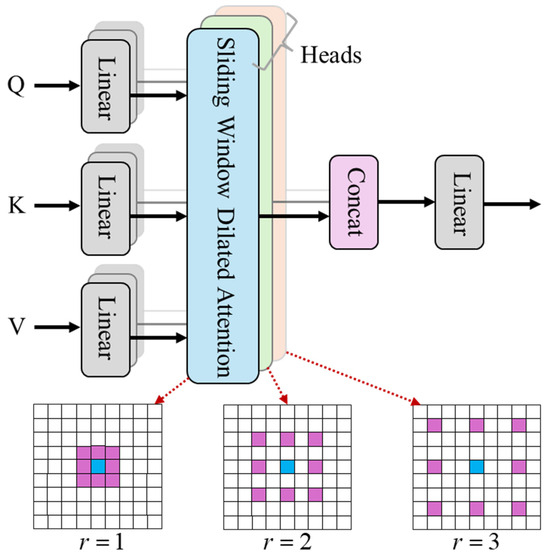
Figure 4.
MSDA module.
The MSDA module first takes the input feature map A and, through linear projection, decomposes it into Query (), Key (), and Value () matrices. The channel dimension is divided into n heads, with each head independently performing Sliding Window Dilated Attention (SWDA). The computation process is shown in Equation (3).
Here, is the dilation rate of the -th head, controlling the sparsity of feature sampling. For a query position , SWDA sparsely selects key-value pairs within a sliding window according to the dilation rate , with the coordinate set given by
The attention weights are computed as shown in Equation (5):
By setting different dilation rates (e.g., = 1, 2, and 3), MSDA simultaneously captures features with 3 × 3, 5 × 5, and 7 × 7 receptive fields within a single layer. Finally, the outputs of all heads are concatenated and fused through a linear transformation to produce multi-scale features, denoted as
The capabilities of MSDA are reflected in two aspects. First, by adjusting the dilation rates, sparsity is controlled, avoiding the redundant computation of global attention. Second, the multi-scale design enhances robustness to variations in target size.
3. Experiments
3.1. Experimental Details
The detailed configuration of the experimental environment is shown in Table 1. The operating system was Ubuntu 20.04, with an Intel i9-13900K processor and an NVIDIA GeForce RTX 3060 GPU. The server was equipped with 256 GB of RAM and 16 GB of GPU memory. CUDA version 11.8 was used, and the deep learning framework was PyTorch 2.6.0. The programming language was Python 3.9.

Table 1.
Experimental environment configuration.
The proposed method underwent fine-grained parameter tuning and a carefully designed training process, as detailed in Table 2. The SGD optimizer was employed with an initial learning rate of 1 × 10⁻³, which was linearly warmed up from 0 to the target value over the first 500 steps. The training process consisted of 200 epochs, with a batch size of 16. An early stopping threshold of 50 epochs was set to prevent overfitting and conserve resources. Leveraging hardware acceleration and well-configured training parameters ensured stable and effective model training. In addition, during training, mosaic data augmentation was applied with a 50% probability, combined with multiple SAR-specific augmentation techniques, including Gaussian speckle noise, random rotation, and horizontal and vertical flipping. All augmentations were disabled during validation and testing to fully reflect the data augmentation strategy.
Table 2.
Training parameter settings.
3.2. Datasets
To validate the effectiveness of the proposed method, three publicly available SAR ship datasets were used: SSDD [64], HRSID [65], and SARDet-100k [66].
The SSDD dataset contains 1160 SAR images with resolutions ranging from 1 to 15 m, annotated with 2540 ships. The images were sourced from RadarSat-2, TerraSAR-X, and Sentinel-1 satellites, and were split into training and validation sets at an 8:2 ratio.
The HRSID dataset consists of 5604 SAR images of size 800 × 800 pixels, with spatial resolutions of 0.5 m, 1 m, and 3 m. Images were obtained from TerraSAR-X and Sentinel-1 satellites, and the dataset was divided into training and validation sets at an 8:2 ratio. All datasets contain only a single category, i.e., ships. Covering different resolutions, imaging modes, and maritime environments, these datasets provide a comprehensive basis for evaluating and optimizing ship detection models.
The SARDet-100k dataset, released in 2024, is the first COCO-scale large-scale multi-class SAR object detection dataset, comprising more than 110,000 SAR images. It includes six categories: harbor, aircraft, car, bridge, ship, and tank, with ships accounting for 46.7% of the total annotations. To evaluate the generalization performance of S2M-Net, we selected 1000 SAR images containing only ships and divided them into training and validation sets at an 8:2 ratio to perform a quantitative comparison.
To mitigate the potential bias introduced by random data partitioning and ensure the robustness of performance evaluation, this study adopted a five-fold cross-validation strategy in addition to the conventional 8:2 train–test split on the SDDD, HRSID, and SARDet-100k datasets. Specifically, the training set obtained from the initial split was further divided into five equally sized subsets. In each iteration, four subsets were used for training and one for validation, and this process was repeated five times. The final performance metrics of the model were reported as the average across the five runs.
3.3. Evaluation Metrics
The proposed method was comprehensively evaluated using multiple metrics, including precision (P), recall (R), F1 score (F1), average precision (AP), mean average precision (mAP), mAP50, mAP50:95, and frames per second (FPS). The definitions of these metrics are consistent with those in MS COCO [54]. Precision, P, represents the proportion of correctly predicted positive samples among all predicted positive results; a higher value indicates fewer false positives. Recall, R, represents the proportion of true-positive samples that are correctly detected; a higher value indicates fewer missed detections. The calculation formulas for P and R are given by
Here, TP denotes the number of correctly detected ships, FP denotes the number of false positives, and FN denotes the number of missed detections. The F1 score, as the harmonic mean of precision and recall, reflects both the accuracy and completeness of the model. Its calculation is given by
Average precision (AP) is defined as the area under the P–R curve, where recall is plotted on the x-axis and precision on the y-axis for a fixed class. Its calculation is given by
Mean average precision (mAP) is the average of AP values across all classes and is used to measure the overall performance of the model in multi-class object detection tasks. Its calculation is given by
mAP50 refers to the mAP at an IoU threshold of 0.5, calculated based on the mAP formula with the IoU set to 0.5. Its calculation is given by
In addition, the evaluation also included model computational complexity (floating point operations (FLOPs)), number of parameters (Params), and model size (Size) to assess the overall performance of our model.
FPS measures the inference speed of the detection model, representing the number of images the model can process per second. A higher FPS indicates better real-time performance. Its calculation is given by
where represents the preprocessing time, represents the inference time, and represents the post-processing time per image.
4. Results
4.1. Ablation Experiments
To validate the effectiveness of our method, different modules and their combinations were progressively added to the baseline model. Detection performance was evaluated in multiple ways, including quantitative ablation results, training curves of P and mAP, and heatmaps. All models were trained and tested under the same experimental environment and hyperparameter settings. In Table 3, “√” indicates that the corresponding module was used, while “–” indicates it was not used.
Table 3.
Ablation experiment results on the SSDD, HRSID, and SARDet-100k datasets.
As shown in Table 3, the ablation studies on the SSDD dataset highlighted the distinct contributions of each module to both efficiency and detection performance. The baseline model demonstrated stable detection, with 2.582 M parameters, 6.3 G FLOPs, an mAP50 of 0.976, an F1 of 0.971, and 250 FPS, yet incurred a substantial computational cost. Introducing SPD-Conv reduced parameters to 2.212 M and FLOPs to 5.4 G, achieving an mAP50 of 0.978, an F1 of 0.960, and 244 FPS, illustrating that optimized convolutions minimize redundancy while preserving core features. MLCA alone maintained the baseline computational load but improved feature discrimination, yielding an mAP50 of 0.986, an F1 of 0.975, and 400 FPS. MSDA alone enhanced multi-scale representation, achieving an mAP50 of 0.987, an F1 of 0.981, and 345 FPS, albeit with increased parameters of 3.269 M and FLOPs of 8.3 G. Combining SPD-Conv with MLCA or MSDA delivered further improvements; SPD-Conv with MLCA reached an mAP50 of 0.991, an F1 of 0.975, and 385 FPS, while SPD-Conv with MSDA attained an mAP50 of 0.988, an F1 of 0.972, and 357 FPS. The integration of MLCA and MSDA achieves mAP50 of 0.988, F1 of 0.977, and 263 FPS, reflecting complementary gains at a moderate computational cost. The joint configuration of all three modules achieved an mAP50 of 0.989, an F1 of 0.982, 2.475 M parameters, 5.7 G FLOPs, and 385 FPS, confirming that S2M-Net effectively balances lightweight design, detection accuracy, and real-time performance, making it highly suitable for scenarios with sparse small-ship features and limited computational resources.
To visually validate the effectiveness of the proposed method, representative scenes from the SSDD and HRSID datasets were selected to generate heatmaps for comparison, as shown in Figure 5. Both the baseline model and S2M-Net were used for inference, and Grad-CAM was applied to reveal the attention distribution over target regions. The visualization overlays a color gradient on the original images, where warm colors denote high confidence and cool colors denote low confidence, with ground-truth bounding boxes provided as references. On the SSDD dataset (Figure 5), S2M-Net produced more concentrated responses in small-target regions (Scenarios 1 and 2). Heat values were localized within the ground-truth boxes, while spurious activations in background clutter were notably suppressed. This improvement stems from SPD-Conv, which refines feature extraction, and the MLCA attention mechanism, which suppresses interference from complex environments, leading to clearer activations for small targets. The MSDA multi-scale fusion module further enhanced sensitivity to ships of different sizes; for example, in the fourth row (Scenario 4), the heat distribution of clustered ships aligns closely with the ground-truth boxes, with sharper edge contours. In contrast, the heatmaps of the baseline model exhibit dispersed responses, such as warm regions in non-target areas in the second row (Scenario 2), resulting in missed detections or overlapping responses in dense small-target scenes. Together with the results in Table 3 and Figure 5, these visualizations demonstrate that S2M-Net effectively captures small-ship features while maintaining a lightweight design, confirming its advantages in feature focusing and background suppression.
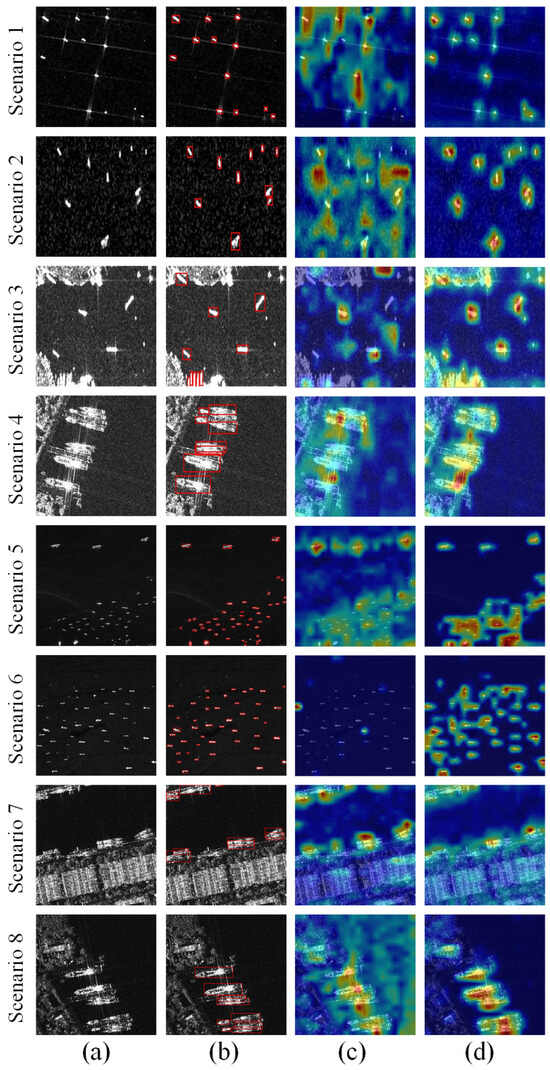
Figure 5.
Comparison of heatmaps on the SSDD dataset. (a) Original image, (b) ground-truth bounding boxes, (c) baseline model, YOLOv11n, and (d) our method, S2M-Net. Scenes 1–4 from SSDD and scenes 5–8 from HRSID; 1–2: small targets, 3: inland high reflectivity, 4: nearshore ships, 5: dense multi-scale ships, 6: dense scene, and 7–8: nearshore.
The visualization results of the ablation study on the SSDD dataset indicate that our method demonstrates notable performance advantages in SAR ship scenarios. However, since SSDD primarily contains sea-surface targets with relatively simple backgrounds, it is insufficient to comprehensively assess the model’s robustness and generalization under complex conditions. To further evaluate the model’s performance under higher resolution, more complex backgrounds, and a wider range of target scales, we conducted the same ablation experiments on the more challenging HRSID dataset.
As shown in Table 3, the ablation experiments on the HRSID dataset revealed complementary contributions of each module in enhancing both model efficiency and detection accuracy. The baseline model exhibited stable performance with 2.582 M parameters, 6.3 G FLOPs, an mAP50 of 0.930, an F1 of 0.884, and 256 FPS, yet it incurred a substantial computational cost. Incorporating SPD-Conv reduced parameters to 2.212 M and FLOPs to 5.4 G while increasing the F1 to 0.898 and the mAP50 to 0.932, and sustaining 250 FPS, demonstrating that optimized convolution structures minimize redundant computations and preserve fine-grained small-ship features. MLCA alone maintained a lightweight profile while enhancing feature discrimination, achieving an mAP50 of 0.943, an F1 of 0.897, and 400 FPS, reflecting improved separation of targets from complex backgrounds. MSDA emphasized multi-scale feature integration, improving the F1 to 0.895 and the mAP50 to 0.944, and sustaining 385 FPS, although with increased parameters of 3.269 M and FLOPs of 8.3 G. Combining SPD-Conv with MLCA or MSDA delivered further gains. SPD-Conv with MLCA achieved an mAP50 of 0.948, an F1 of 0.904, 2.212 M parameters, 5.5 G FLOPs, and 385 FPS, while SPD-Conv with MSDA reached an mAP50 of 0.947, an F1 of 0.901, 2.475 M parameters, 5.6 G FLOPs, and 357 FPS, balancing lightweight design with multi-scale detection. The joint integration of all three modules attained optimal performance with an mAP50 of 0.955, an F1 of 0.908, 2.475 M parameters, 5.7 G FLOPs, and 385 FPS, confirming that S2M-Net effectively harmonizes computational efficiency, detection accuracy, and real-time inference for practical small-ship detection scenarios.
Figure 5 presents the Grad-CAM visualization on the HRSID dataset. In the original images, dense small ships were influenced by SAR noise and complex backgrounds, leading to blurred feature representation. The ground-truth bounding boxes indicated the presence of multi-scale targets. Compared with the baseline model, S2M-Net achieved substantially higher overlap between response regions and the ground-truth boxes. In dense scenes (Scenario 6), the activation maps of S2M-Net showed discrete and well-localized warm spots, while the baseline model generated diffuse false responses and failed to detect several target ships. In nearshore scenes (Scenarios 7 and 8), the baseline model produced blurred object edges, with activation regions overflowing beyond the ground-truth boxes, and often misclassified high-reflectivity areas on land or sea clutter as ships. In contrast, the heatmap contours of S2M-Net aligned closely with the geometric structure of ships, displaying sharper edges, particularly evident for the ships in the fourth row. This improvement resulted from the MLCA attention mechanism in S2M-Net, which effectively suppressed land clutter and concentrated activation on true ship regions.
As shown in Table 3, the ablation studies on the SARDet-100k dataset revealed the distinct contributions of each module. The baseline model achieved moderate performance with 2.582 M parameters, 6.3 G FLOPs, an mAP50 of 0.874, an F1 of 0.851, and 240 FPS, reflecting stable detection but a substantial computational cost. Incorporating SPD-Conv reduced parameters to 2.212 M and FLOPs to 5.4 G, while increasing FPS to 260, although the mAP50 and F1 decreased slightly to 0.870 and 0.836, indicating that optimized convolutions minimize redundant computation while slightly affecting precision. MLCA enhanced feature discrimination in cluttered backgrounds, raising the mAP50 to 0.879 and the F1 to 0.852, and sustaining 238 FPS, without additional computational overhead. MSDA emphasized multi-scale feature integration, improving the F1 to 0.872 and maintaining the mAP50 at 0.875, but with an increased resource demand of 3.269 M parameters and 8.3 G FLOPs. Combining SPD-Conv with MLCA or MSDA balanced lightweight design and detection performance, producing moderate gains in accuracy and FPS. Enabling all three modules simultaneously achieved an mAP50 of 0.883, an F1 of 0.869, 2.475 M parameters, 5.7 G FLOPs, and 258 FPS, demonstrating that S2M-Net synergistically leverages convolution optimization, attention mechanisms, and multi-scale processing to maximize both efficiency and detection robustness in large-scale SAR ship imagery.
4.2. Comparison Experiments
4.2.1. Quantitative Comparison
To comprehensively evaluate the detection performance of S2M-Net, we conducted comparative experiments on the SSDD and HRSID datasets against multiple mainstream ship detection algorithms. The comparison included representative two-stage methods, as well as various lightweight or single-stage detection frameworks, such as Faster R-CNN, RetinaNet, FCOS, YOLOX-tiny, YOLOv8, YOLOv10, YOLOv12n, and ShipDeNet-20.
Table 4 reports the performance of different detectors on the SSDD dataset. Two-stage detectors such as Faster R-CNN and RetinaNet achieved an mAP50 of 0.943 with FPS values of 12 and 14, but required hundreds of millions of parameters and FLOPs, which makes them impractical for real-time deployment. Among single-stage models, YOLOX tiny reached 200 FPS while maintaining a lightweight design, and YOLOv5n achieved 263 FPS with an mAP50 of 0.961 and an F1 of 0.965, demonstrating competitive accuracy and efficiency. The YOLOv8 and YOLOv12 series further enhanced detection precision, but their FPS decreased significantly due to larger model sizes. For instance, YOLOv8s reached an mAP50 of 0.985 but only 55 FPS, which limits its real-time applicability. In contrast, S2M-Net integrated SPDConv to reduce redundant computations, MLCA to improve target-to-background separation, and MSDA to strengthen multi-scale feature representation, achieving 385 FPS with only 2.475 M parameters and 5.7 G FLOPs. It attained an mAP50 of 0.989 and an F1 of 0.982, outperforming all comparison models in both accuracy and inference speed. Compared with YOLOv5n, S2M-Net achieved higher precision and recall while substantially increasing FPS. Compared with medium-sized models such as YOLOv8s and YOLOv12s, it delivered superior accuracy with a markedly reduced computational cost. Compared with ShipDeNet-20, our method achieved improvements of 1.8% in the mAP50 and 5.8% in the F1 score on the SSDD dataset, while the inference speed increased from 233 FPS to 385 FPS, significantly enhancing both detection accuracy and real-time performance. Although the number of parameters and FLOPs is relatively higher, the model remains fully capable of supporting real-time applications under current hardware conditions, thereby demonstrating its superiority for practical engineering deployment. This comparison indicates that S2M-Net achieves an optimal balance between lightweight design, detection accuracy, and real-time performance across models of different scales.
Table 4.
Comparison of S2M-Net with mainstream methods on the SSDD, HRSID, and SARDet-100k datasets.
In the experiments on the HRSID dataset, we systematically evaluated detection accuracy, robustness, and computational efficiency in highly complex maritime environments. Unlike SSDD, which primarily contains open-sea scenes, HRSID incorporates nearshore, port, and island environments that introduce strong background interference and impose stricter requirements on lightweight detection models. Table 4 shows that conventional two-stage methods achieved high accuracy, with the average mAP50 reaching 0.936 and the F1 reaching 0.894, but their inference speed remained limited to 11–13 FPS. The excessive model size and computational cost of these methods prevent real-time deployment. In contrast, YOLO-based lightweight models provide better efficiency in terms of parameters and FLOPs but often compromise stability. For example, YOLOv12n achieved 213 FPS with a model scale comparable to ours, yet its limited capacity for fine-grained feature representation reduced the F1 to 0.885. S2M-Net addresses these challenges through a synergistic design: SPD-Conv removes redundant convolutions to capture fine ship structures, MLCA suppresses background clutter to enhance target–clutter separation, and MSDA enriches multi-scale feature representation to ensure robust detection across varying ship sizes. With these innovations, S2M-Net achieved a 0.955 mAP50, a 0.908 F1, and 385 FPS, with only 2.475 M parameters and 5.7 G FLOPs. This performance not only exceeds that of heavier architectures such as YOLOv8s and YOLOv11s in both accuracy and efficiency but also ensures stability under complex real-world conditions. These results demonstrate the strong potential of the method for large-scale, real-time maritime monitoring and deployment in safety-critical scenarios.
On the SARDet100k dataset, which features large-scale SAR imagery with densely distributed and complex ship targets, detection requires both high accuracy and computational efficiency. As shown in Table 4, traditional two-stage detectors achieved an mAP50 of 0.880 and an F1 of 0.855 but operated at only 8 to 9 FPS, which makes them unsuitable for real-time applications. Lightweight YOLO models provide higher inference speed but often at the expense of accuracy. For example, YOLOv5n achieved 238 FPS but only a 0.862 F1, while YOLOv8s reached 208 FPS with a 0.863 F1. In contrast, S2M-Net achieved a more favorable trade-off across all metrics. SPDConv reduces redundant computations while preserving fine-scale ship features, MLCA improves target-to-background discrimination in cluttered SAR scenes, and MSDA enhances multi-scale representation for ships of different sizes. This integrated design achieved a 0.883 mAP50, a 0.869 F1, and 258 FPS, with only 2.475 M parameters and 5.7 G FLOPs, demonstrating that higher accuracy and faster inference can be attained with a lower computational cost. These results establish S2M-Net as a robust and scalable solution for real-time large-scale SAR ship detection.
4.2.2. Qualitative Comparison
To assess the model’s performance in representative maritime scenarios, we conducted a visual comparison using typical scenes from the SSDD and HRSID datasets. Given the higher complexity of HRSID, small targets and nearshore conditions were analyzed separately to provide a systematic evaluation of S2M-Net’s applicability. Figure 6 illustrates the detection results across multiple representative SSDD scenarios. In nearshore discrete ship scenes (Scenario 1), comparison models misinterpreted sea-surface objects as ships because background textures and scattered reflections were incorrectly recognized as structural ship features. In contrast, our method avoided such false detections since SPDConv preserves fine-grained target structures, while MLCA suppresses clutter responses, ensuring that activations remain concentrated on true ships rather than background artifacts. In isolated small-target scenes, S2M-Net accurately identified ships through its fine-grained feature preservation. In densely clustered regions (Scenarios 4 and 5), comparison models, such as YOLOv8s, produced missed detections and duplicate bounding boxes, while the MLCA module in S2M-Net suppressed background interference, resulting in cleaner and more precise localization. In nearshore large-ship scenarios with high reflectivity (Scenarios 2 and 3), land-induced interference caused comparison models to generate false positives or missed detections due to insufficient feature extraction. The MSDA module in S2M-Net employs multi-scale dilated convolutions that adapt effectively to ship contours, producing bounding boxes closely aligned with the ground truth. Overall, S2M-Net addressed the challenges of sparse small-target features and complex backgrounds, consistently reducing miss rates and enhancing localization accuracy, thereby validating its effectiveness for SAR small-ship detection.
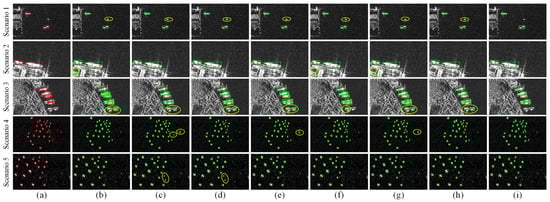
Figure 6.
The comparison of detection results in different scenarios of the SSDD dataset, where (a) represents GT, the ground-truth bounding boxes. (b) YOLOv5n, (c) YOLOv8s, (d) YOLOv10n, (e) YOLOv11n, (f) Faster R-CNN, (g) RetinaNet, (h) FCOS, and (i) ours (S2M-Net). Scenario 1: nearshore discrete ships; Scenario 2: nearshore high-reflectivity areas; Scenario 3: nearshore large ships in complex backgrounds; Scenario 4: highly dense small-ship clusters; and Scenario 5: multi-scale ships. Yellow circles indicate false detections.
The SSDD dataset covers limited scenarios, so representative scenes from HRSID were selected to comprehensively evaluate detection capability. Figure 7 and Figure 8 present the results in small-target and nearshore scenarios. S2M-Net consistently detected ships more completely and accurately than other models. While occasional misdetections occurred, particularly in high-reflectivity nearshore regions, they were substantially fewer than those produced by comparison methods. Small ships and nearshore scenes pose challenges such as weak features, dense clustering, and complex backgrounds. In dense small-ship scenarios (Figure 7), lightweight models, including YOLOv5n and YOLOv11n, failed to detect numerous weakly scattering ships due to coarse feature representation. Even high-capacity models like Faster R-CNN missed weak edge targets because of misaligned receptive fields or computational redundancy. In regions containing piers and nearshore structures (Figure 8), comparison models frequently produced misaligned bounding boxes or incorrectly captured background textures. S2M-Net excelled under these conditions: SPDConv optimizes convolutional structures to preserve fine-grained features, capturing weakly scattering ships and small boats near shore while minimizing feature loss to background or shadows. MLCA integrates local and channel attention mechanisms to suppress shoreline clutter and building textures, producing bounding boxes that closely conform to true contours. MSDA employs multi-scale dilated convolutions to flexibly accommodate ships of varying sizes, preserving large target contours and subtle details of small targets, thereby reducing missed detections. These results highlight the capability of S2M-Net to balance efficiency and accuracy in real-world SAR small-ship detection tasks.
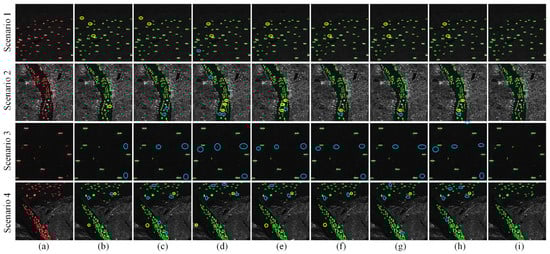
Figure 7.
The detection results in small-ship scenarios from the HRSID dataset. (a) GT represents the ground-truth bounding boxes. (b) YOLOv5n. (c) YOLOv8s. (d) YOLOv10n. (e) YOLOv11n. (f) Faster R-CNN. (g) RetinaNet. (h) FCOS. (i) Our method (S2M-Net). Scenario 1 represents dense small targets, Scenario 2 represents inland dense multi-scale ships, Scenario 3 represents scattered multi-scale ships, and Scenario 4 represents multi-scale ships against complex backgrounds. Yellow circles indicate false detections, while blue circles indicate missed detections.
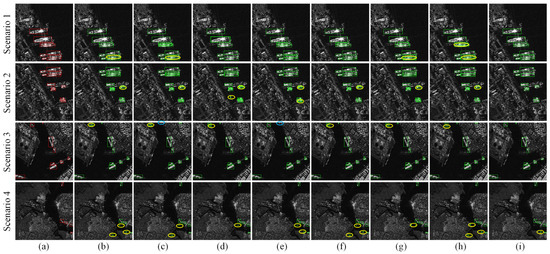
Figure 8.
The detection results in nearshore complex scenarios from the HRSID dataset. (a) GT represents the ground-truth bounding boxes. (b) YOLOv5n. (c) YOLOv8s. (d) YOLOv10n. (e) YOLOv11n. (f) Faster R-CNN. (g) RetinaNet. (h) FCOS. (i) Our method (S2M-Net). Scenes 1 and 2 represent large nearshore vessels, while Scenes 3 and 4 represent small nearshore vessels. Yellow circles indicate false detections, while blue circles indicate missed detections.
5. Discussion
Precision detection of small ships in SAR imagery has long been a significant challenge in the fields of remote sensing and computer vision, particularly against complex backgrounds and noise interference. Traditional methods often struggle to balance detection accuracy with computational efficiency. The proposed S2M-Net addresses this by employing the SPD-Conv module to optimize feature extraction, effectively mitigating information loss during downsampling. The MLCA module integrates local and channel attention mechanisms, enhancing the model’s adaptability to complex backgrounds. The experimental results demonstrate that S2M-Net achieved mAP50 scores of 0.989, 0.955, and 0.883 on the SSDD, HRSID, and SARDet-100k datasets, respectively, representing a substantial improvement over baseline models across all three benchmarks. Notably, S2M-Net also surpassed all comparison methods in inference speed, achieving 385, 385, and 258 FPS on the SSDD, HRSID, and SARDet-100k datasets, respectively, confirming its suitability for real-time deployment. Despite the typical trade-off in lightweight designs, our method reduced the parameter count by 3.9% while still improving detection accuracy. This improvement is closely related to the introduction of the Multi-Scale Dilated Attention (MSDA) module, which employs layered dilation rates to achieve sparse sampling and efficient multi-scale feature fusion. This design not only lowers computational costs but also enhances the model’s sensitivity to small targets. Compared with existing models, S2M-Net performed particularly well in nearshore scenarios, where Grad-CAM visualizations showed more concentrated target responses and significantly suppressed background noise.
6. Conclusions
The proposed S2M-Net offers an efficient solution for lightweight detection of small ships in SAR imagery. Its core lies in integrating spatial information preservation, attention mechanisms, and multi-scale feature fusion into a unified framework. Ablation studies and comparative analyses confirmed that the SPD-Conv module reduces redundant computation while retaining critical details. The MLCA module achieves a balanced modeling of local and global features through its dual-branch structure, and the MSDA module enhances adaptability to target size variations via flexible dilation rate configuration. Comprehensive testing on the SSDD, HRSID, and SARDet-100k datasets demonstrated that the method consistently surpassed existing algorithms in both detection accuracy and inference speed, outperforming the latest YOLO variants while maintaining a lightweight design of only 2.475 M parameters. This makes real-time deployment on resource-constrained platforms feasible. It should be noted that in real-world applications, ship scales and background complexity may exceed the coverage of existing datasets. Therefore, future research could explore adaptive dilation rate mechanisms and cross-modal data fusion to further improve the model’s generalization capability.
Author Contributions
All the authors participated in editing and reviewing this manuscript. Conceptualization, G.W., R.Z. and Y.H.; methodology, G.W., R.Z. and Y.H.; investigation, G.W., R.Z., J.H. and Y.W.; data curation, G.W., R.Z., Y.H. and Y.T.; software, J.H. and X.G.; writing—original draft preparation, G.W., R.Z. and J.H.; writing—review and editing, G.W., R.Z. and Y.H.; visualization, J.H. and X.G.; supervision, Y.H. and J.Y.; project administration, Y.H. and J.Y.; funding acquisition, R.Z. All authors have read and agreed to the published version of the manuscript.
Funding
This research was jointly funded by the National Natural Science Foundation of China (42371460, U22A20565, 42171355, and 42401535); the National Key Research and Development Program of China (2023YFB2604001); the Major Scientific Research Project of China State Railway Group (grant no. K2024G004); and the Tibet Autonomous Region Key Research and Development Program (XZ202401ZY0057).
Data Availability Statement
The datasets utilized in this study are openly accessible and can be obtained from public repositories without restriction.
Acknowledgments
The authors would like to express their sincere gratitude to the providers of the publicly available SAR ship imagery datasets used in this study.
Conflicts of Interest
The authors declare no conflicts of interest.
References
- Shi, Q.; Li, W.; Tao, R.; Sun, X.; Gao, L. Ship Classification Based on Multifeature Ensemble with Convolutional Neural Network. Remote Sens. 2019, 11, 419. [Google Scholar] [CrossRef]
- Domala, V.; Lee, W.; Kim, T. Wave Data Prediction with Optimized Machine Learning and Deep Learning Techniques. J. Comput. Des. Eng. 2022, 9, 1107–1122. [Google Scholar] [CrossRef]
- Kanjir, U.; Greidanus, H.; Oštir, K. Vessel Detection and Classification from Spaceborne Optical Images: A Literature Survey. Remote Sens. Environ. 2018, 207, 1–26. [Google Scholar] [CrossRef]
- Leng, X.; Ji, K.; Zhou, S.; Xing, X.; Zou, H. An Adaptive Ship Detection Scheme for Spaceborne SAR Imagery. Sensors 2016, 16, 1345. [Google Scholar] [CrossRef]
- Wang, X.; Yang, L.T.; Meng, D.; Dong, M.; Ota, K.; Wang, H. Multi-UAV Cooperative Localization for Marine Targets Based on Weighted Subspace Fitting in SAGIN Environment. IEEE Internet Things J. 2022, 9, 5708–5718. [Google Scholar] [CrossRef]
- Chen, X.; Bi, H.; Yue, R.; Chen, Z.; An, C. Effects of Oil Characteristics on the Performance of Shoreline Response Operations: A Review. Front. Environ. Sci. 2022, 10, 1033909. [Google Scholar] [CrossRef]
- Jafarzadeh, H.; Mahdianpari, M.; Homayouni, S.; Mohammadimanesh, F.; Dabboor, M. Oil Spill Detection from Synthetic Aperture Radar Earth Observations: A Meta-Analysis and Comprehensive Review. GIScience Remote Sens. 2021, 58, 1022–1051. [Google Scholar] [CrossRef]
- Li, S.; Grifoll, M.; Estrada, M.; Zheng, P.; Feng, H. Optimization on Emergency Materials Dispatching Considering the Characteristics of Integrated Emergency Response for Large-Scale Marine Oil Spills. J. Mar. Sci. Eng. 2019, 7, 214. [Google Scholar] [CrossRef]
- Wang, X.; Li, G.; Jiang, Z.; Liu, Y.; He, Y. Density-Based Ship Detection in SAR Images: Extension to a Self-Similarity Perspective. Chin. J. Aeronaut. 2024, 37, 168–180. [Google Scholar] [CrossRef]
- Sun, Z.; Meng, C.; Cheng, J.; Zhang, Z.; Chang, S. A Multi-Scale Feature Pyramid Network for Detection and Instance Segmentation of Marine Ships in SAR Images. Remote Sens. 2022, 14, 6312. [Google Scholar] [CrossRef]
- Zha, C.; Min, W.; Han, Q.; Xiong, X.; Wang, Q.; Xiang, H. SAR Ship Detection Based on Salience Region Extraction and Multi-Branch Attention. Int. J. Appl. Earth Obs. Geoinf. 2023, 123, 103489. [Google Scholar] [CrossRef]
- Yasir, M.; Liu, S.; Pirasteh, S.; Xu, M.; Sheng, H.; Wan, J.; De Figueiredo, F.A.P.; Aguilar, F.J.; Li, J. YOLOShipTracker: Tracking Ships in SAR Images Using Lightweight YOLOv8. Int. J. Appl. Earth Obs. Geoinf. 2024, 134, 104137. [Google Scholar] [CrossRef]
- Li, Z.; Ma, H.; Guo, Z. MAEE-Net: SAR Ship Target Detection Network Based on Multi-Input Attention and Edge Feature Enhancement. Digit. Signal Process. 2025, 156, 104810. [Google Scholar] [CrossRef]
- Mohanty, S.P.; Czakon, J.; Kaczmarek, K.A.; Pyskir, A.; Tarasiewicz, P.; Kunwar, S.; Rohrbach, J.; Luo, D.; Prasad, M.; Fleer, S.; et al. Deep Learning for Understanding Satellite Imagery: An Experimental Survey. Front. Artif. Intell. 2020, 3, 534696. [Google Scholar] [CrossRef] [PubMed]
- Gao, G.; Liu, L.; Zhao, L.; Shi, G.; Kuang, G. An Adaptive and Fast CFAR Algorithm Based on Automatic Censoring for Target Detection in High-Resolution SAR Images. IEEE Trans. Geosci. Remote Sens. 2009, 47, 1685–1697. [Google Scholar] [CrossRef]
- Liu, T.; Zhang, J.; Gao, G.; Yang, J.; Marino, A. CFAR Ship Detection in Polarimetric Synthetic Aperture Radar Images Based on Whitening Filter. IEEE Trans. Geosci. Remote Sens. 2020, 58, 58–81. [Google Scholar] [CrossRef]
- An, W.; Xie, C.; Yuan, X. An Improved Iterative Censoring Scheme for CFAR Ship Detection with SAR Imagery. IEEE Trans. Geosci. Remote Sens. 2014, 52, 4585–4595. [Google Scholar] [CrossRef]
- Lowe, D.G. Distinctive Image Features from Scale-Invariant Keypoints. Int. J. Comput. Vis. 2004, 60, 91–110. [Google Scholar] [CrossRef]
- Dalal, N.; Triggs, B. Histograms of Oriented Gradients for Human Detection. In Proceedings of the 2005 IEEE Computer Society Conference on Computer Vision and Pattern Recognition (CVPR’05), San Diego, CA, USA, 20–25 June 2005; Volume 1, pp. 886–893. [Google Scholar]
- Xie, C.; Wang, R.; Zhang, J.; Chen, P.; Dong, W.; Li, R.; Chen, T.; Chen, H. Multi-Level Learning Features for Automatic Classification of Field Crop Pests. Comput. Electron. Agric. 2018, 152, 233–241. [Google Scholar] [CrossRef]
- Wang, J.; Quan, S.; Xing, S.; Li, Y.; Wu, H.; Meng, W. PSO-Based Fine Polarimetric Decomposition for Ship Scattering Characterization. ISPRS J. Photogramm. Remote Sens. 2025, 220, 18–31. [Google Scholar] [CrossRef]
- Hu, B.; Miao, H. An Improved Deep Neural Network for Small-Ship Detection in SAR Imagery. IEEE J. Sel. Top. Appl. Earth Obs. Remote Sens. 2024, 17, 2596–2609. [Google Scholar] [CrossRef]
- Lv, J.; Zhang, R.; Bao, X.; Wu, R.; Hong, R.; He, X.; Liu, G. Time-Series InSAR Landslide Three-Dimensional Deformation Prediction Method Considering Meteorological Time-Delay Effects. Eng. Geol. 2025, 350, 107986. [Google Scholar] [CrossRef]
- Lv, J.; Zhang, R.; Shama, A.; Hong, R.; He, X.; Wu, R.; Bao, X.; Liu, G. Exploring the Spatial Patterns of Landslide Susceptibility Assessment Using Interpretable Shapley Method: Mechanisms of Landslide Formation in the Sichuan-Tibet Region. J. Environ. Manag. 2024, 366, 121921. [Google Scholar] [CrossRef]
- Ma, Y.; Guan, D.; Deng, Y.; Yuan, W.; Wei, M. 3SD-Net: SAR Small Ship Detection Neural Network. IEEE Trans. Geosci. Remote Sens. 2024, 62, 5221613. [Google Scholar] [CrossRef]
- Zhang, Y.; Ye, M.; Zhu, G.; Liu, Y.; Guo, P.; Yan, J. FFCA-YOLO for Small Object Detection in Remote Sensing Images. IEEE Trans. Geosci. Remote Sens. 2024, 62, 5611215. [Google Scholar] [CrossRef]
- Ren, Z.; Tang, Y.; Yang, Y.; Zhang, W. SASOD: Saliency-Aware Ship Object Detection in High-Resolution Optical Images. IEEE Trans. Geosci. Remote Sens. 2024, 62, 5611115. [Google Scholar] [CrossRef]
- Yasir, M.; Shanwei, L.; Mingming, X.; Jianhua, W.; Nazir, S.; Islam, Q.U.; Dang, K.B. SwinYOLOv7: Robust Ship Detection in Complex Synthetic Aperture Radar Images. Appl. Soft Comput. 2024, 160, 111704. [Google Scholar] [CrossRef]
- Liu, S.; Chen, P.; Zhang, Y. A Multiscale Feature Pyramid SAR Ship Detection Network with Robust Background Interference. IEEE J. Sel. Top. Appl. Earth Obs. Remote Sens. 2023, 16, 9904–9915. [Google Scholar] [CrossRef]
- Girshick, R.; Donahue, J.; Darrell, T.; Malik, J. Rich Feature Hierarchies for Accurate Object Detection and Semantic Segmentation. In Proceedings of the IEEE Conference on Computer Vision and Pattern Recognition, Columbus, OH, USA, 23–28 June 2014. [Google Scholar]
- Girshick, R. Fast R-CNN. arXiv 2015, arXiv:1504.08083. [Google Scholar] [CrossRef]
- Ren, S.; He, K.; Girshick, R.; Sun, J. Faster R-CNN: Towards Real-Time Object Detection with Region Proposal Networks. IEEE Trans. Pattern Anal. Mach. Intell. 2017, 39, 1137–1149. [Google Scholar] [CrossRef]
- Pang, J.; Chen, K.; Shi, J.; Feng, H.; Ouyang, W.; Lin, D. Libra R-CNN: Towards Balanced Learning for Object Detection. arXiv 2019, arXiv:1904.02701. [Google Scholar] [CrossRef]
- Cai, Z.; Vasconcelos, N. Cascade R-CNN: Delving into High Quality Object Detection. arXiv 2017, arXiv:1712.00726. [Google Scholar] [CrossRef]
- Khanam, R.; Hussain, M. YOLOv11: An Overview of the Key Architectural Enhancements. arXiv 2024, arXiv:2410.17725. [Google Scholar] [CrossRef]
- Lin, T.-Y.; Goyal, P.; Girshick, R.; He, K.; Dollar, P. Focal Loss for Dense Object Detection. arXiv 2018, arXiv:1708.02002. [Google Scholar] [CrossRef]
- Liu, W.; Anguelov, D.; Erhan, D.; Szegedy, C.; Reed, S.; Fu, C.-Y.; Berg, A.C. SSD: Single Shot MultiBox Detector. arXiv 2016, arXiv:1512.02325. [Google Scholar] [CrossRef]
- Li, Y.; Mao, H.; Girshick, R.; He, K. Exploring Plain Vision Transformer Backbones for Object Detection. In Computer Vision—ECCV 2022; Avidan, S., Brostow, G., Cissé, M., Farinella, G.M., Hassner, T., Eds.; Lecture Notes in Computer Science; Springer Nature Switzerland: Cham, Switzerland, 2022; Volume 13669, pp. 280–296. ISBN 978-3-031-20076-2. [Google Scholar]
- Zhou, S.; Zhang, M.; Wu, L.; Yu, D.; Li, J.; Fan, F.; Zhang, L.; Liu, Y. Lightweight SAR Ship Detection Network Based on Transformer and Feature Enhancement. IEEE J. Sel. Top. Appl. Earth Obs. Remote Sens. 2024, 17, 4845–4858. [Google Scholar] [CrossRef]
- Hu, B.; Miao, H. A Lightweight SAR Ship Detection Network Based on Deep Multiscale Grouped Convolution, Network Pruning, and Knowledge Distillation. IEEE J. Sel. Top. Appl. Earth Obs. Remote Sens. 2025, 18, 2190–2207. [Google Scholar] [CrossRef]
- Yu, J.; Chen, J.; Wan, H.; Zhou, Z.; Cao, Y.; Huang, Z.; Li, Y.; Wu, B.; Yao, B. SARGap: A Full-Link General Decoupling Automatic Pruning Algorithm for Deep Learning-Based SAR Target Detectors. IEEE Trans. Geosci. Remote Sens. 2024, 62, 5202718. [Google Scholar] [CrossRef]
- Hao, Y.; Zhang, Y. A Lightweight Convolutional Neural Network for Ship Target Detection in SAR Images. IEEE Trans. Aerosp. Electron. Syst. 2024, 60, 1882–1898. [Google Scholar] [CrossRef]
- Pan, H.; Guan, S.; Jia, W. EMO-YOLO: A Lightweight Ship Detection Model for SAR Images Based on YOLOv5s. Signal Image Video Process. 2024, 18, 5609–5617. [Google Scholar] [CrossRef]
- Li, Y.; Zhang, S.; Wang, W.-Q. A Lightweight Faster R-CNN for Ship Detection in SAR Images. IEEE Geosci. Remote Sens. Lett. 2022, 19, 4006105. [Google Scholar] [CrossRef]
- Liu, S.; Kong, W.; Chen, X.; Xu, M.; Yasir, M.; Zhao, L.; Li, J. Multi-Scale Ship Detection Algorithm Based on a Lightweight Neural Network for Spaceborne SAR Images. Remote Sens. 2022, 14, 1149. [Google Scholar] [CrossRef]
- Dai, D.; Wu, H.; Wang, Y.; Ji, P. LHSDNet: A Lightweight and High-Accuracy SAR Ship Object Detection Algorithm. Remote Sens. 2024, 16, 4527. [Google Scholar] [CrossRef]
- Zhang, T.; Zhang, X. ShipDeNet-20: An Only 20 Convolution Layers and <1-MB Lightweight SAR Ship Detector. IEEE Geosci. Remote Sens. Lett. 2021, 18, 1234–1238. [Google Scholar] [CrossRef]
- Li, J.; Huo, H.; Guo, L.; Zhang, D.; Feng, W.; Lian, Y.; He, L. Small Ship Detection Based on Improved Neural Network Algorithm and SAR Images. Remote Sens. 2025, 17, 2586. [Google Scholar] [CrossRef]
- Gong, Y.; Zhang, Z.; Wen, J.; Lan, G.; Xiao, S. Small Ship Detection of SAR Images Based on Optimized Feature Pyramid and Sample Augmentation. IEEE J. Sel. Top. Appl. Earth Obs. Remote Sens. 2023, 16, 7385–7392. [Google Scholar] [CrossRef]
- Xiao, X.; Xue, X.; Zhao, Z.; Fan, Y. A Recursive Prediction-Based Feature Enhancement for Small Object Detection. Sensors 2024, 24, 3856. [Google Scholar] [CrossRef]
- Li, C.; Hei, Y.; Xi, L.; Li, W.; Xiao, Z. GL-DETR: Global-to-Local Transformers for Small Ship Detection in SAR Images. IEEE Geosci. Remote Sens. Lett. 2024, 21, 4016805. [Google Scholar] [CrossRef]
- Zhao, C.; Fu, X.; Dong, J.; Cao, S.; Zhang, C. MLC-Net: A Robust SAR Ship Detector with Speckle Noise and Multiscale Targets. IEEE J. Sel. Top. Appl. Earth Obs. Remote Sens. 2024, 17, 19260–19273. [Google Scholar] [CrossRef]
- Li, C.; Xi, L.; Hei, Y.; Li, W.; Xiao, Z. Efficient Feature Focus Enhanced Network for Small and Dense Object Detection in SAR Images. IEEE Signal Process. Lett. 2025, 32, 1306–1310. [Google Scholar] [CrossRef]
- Xu, Y.; Pan, H.; Wang, L.; Zou, R. MC-ASFF-ShipYOLO: Improved Algorithm for Small-Target and Multi-Scale Ship Detection for Synthetic Aperture Radar (SAR) Images. Sensors 2025, 25, 2940. [Google Scholar] [CrossRef] [PubMed]
- Yu, W.; Wang, Z.; Li, J.; Luo, Y.; Yu, Z. A Lightweight Network Based on One-Level Feature for Ship Detection in SAR Images. Remote Sens. 2022, 14, 3321. [Google Scholar] [CrossRef]
- Tian, Y.; Ye, Q.; Doermann, D. YOLOv12: Attention-Centric Real-Time Object Detectors. arXiv 2025, arXiv:2502.12524. [Google Scholar]
- Sunkara, R.; Luo, T. No More Strided Convolutions or Pooling: A New CNN Building Block for Low-Resolution Images and Small Objects. arXiv 2022, arXiv:2208.0364. [Google Scholar] [CrossRef]
- Li, J.; Yuan, C.; Wang, X. Real-Time Instance-Level Detection of Asphalt Pavement Distress Combining Space-to-Depth (SPD) YOLO and Omni-Scale Network (OSNet). Autom. Constr. 2023, 155, 105062. [Google Scholar] [CrossRef]
- Gu, Z.; Zhu, K.; You, S. YOLO-SSFS: A Method Combining SPD-Conv/STDL/IM-FPN/SIoU for Outdoor Small Target Vehicle Detection. Electronics 2023, 12, 3744. [Google Scholar] [CrossRef]
- Zhu, W.; Han, X.; Zhang, K.; Lin, S.; Jin, J. Application of YOLO11 Model with Spatial Pyramid Dilation Convolution (SPD-Conv) and Effective Squeeze-Excitation (EffectiveSE) Fusion in Rail Track Defect Detection. Sensors 2025, 25, 2371. [Google Scholar] [CrossRef]
- Wan, D.; Lu, R.; Shen, S.; Xu, T.; Lang, X.; Ren, Z. Mixed Local Channel Attention for Object Detection. Eng. Appl. Artif. Intell. 2023, 123, 106442. [Google Scholar] [CrossRef]
- Groenendijk, R.; Dorst, L.; Gevers, T. MorphPool: Efficient Non-Linear Pooling & Unpooling in CNNs. arXiv 2022, arXiv:2211.14037. [Google Scholar]
- Jiao, J.; Tang, Y.-M.; Lin, K.-Y.; Gao, Y.; Ma, J.; Wang, Y.; Zheng, W.-S. DilateFormer: Multi-Scale Dilated Transformer for Visual Recognition. IEEE Trans. Multimed. 2023, 25, 8906–8919. [Google Scholar] [CrossRef]
- Zhang, T.; Zhang, X.; Li, J.; Xu, X.; Wang, B.; Zhan, X.; Xu, Y.; Ke, X.; Zeng, T.; Su, H.; et al. SAR Ship Detection Dataset (SSDD): Official Release and Comprehensive Data Analysis. Remote Sens. 2021, 13, 3690. [Google Scholar] [CrossRef]
- Wei, S.; Zeng, X.; Qu, Q.; Wang, M.; Su, H.; Shi, J. HRSID: A High-Resolution SAR Images Dataset for Ship Detection and Instance Segmentation. IEEE Access 2020, 8, 120234–120254. [Google Scholar] [CrossRef]
- Li, Y.; Li, X.; Li, W.; Hou, Q.; Liu, L.; Cheng, M.-M.; Yang, J. SARDet-100K: Towards Open-Source Benchmark and ToolKit for Large-Scale SAR Object Detection. arXiv 2024, arXiv:2403.06534. [Google Scholar]


Disclaimer/Publisher’s Note: The statements, opinions and data contained in all publications are solely those of the individual author(s) and contributor(s) and not of MDPI and/or the editor(s). MDPI and/or the editor(s) disclaim responsibility for any injury to people or property resulting from any ideas, methods, instructions or products referred to in the content. |
© 2025 by the authors. Licensee MDPI, Basel, Switzerland. This article is an open access article distributed under the terms and conditions of the Creative Commons Attribution (CC BY) license (https://creativecommons.org/licenses/by/4.0/).