Highlights
What are the main findings?
- Variations in hazard-prone environments dominate the spatial heterogeneity of multi-hazard distribution.
- Thermal hazard susceptibility is expected to increase greatly by the end of the century due to permafrost degradation.
What is the implication of the main findings?
- Segmented assessment can effectively improve evaluation accuracy and model interpretability.
- Thermal hazards exhibit significant sensitivity to climate change, while gravity hazards do not.
Abstract
With climate change, the Qinghai–Tibet Highway (QTH) is facing increasingly severe risks of natural hazards, posing a significant threat to its normal operation. However, the types, distribution, and future risks of hazards along the QTH are still unclear. In this study, we established an inventory of multi-hazards along the QTH by remote sensing interpretation and field validation, including landslides, debris flows, thaw slumps, and thermokarst lakes. The QTH was segmented into three sections based on hazard distribution and environmental factors. Susceptibility modelling was performed for each hazard within each section using machine learning models, followed by further evaluation of hazard susceptibility under future climate change scenarios. The results show that, at present, approximately 15.50% of the area along the QTH exhibits high susceptibility to multi-hazards, with this proportion projected to increase to 20.85% and 23.32% under the representative concentration pathways (RCP) 4.5 and RCP 8.5 distant future scenarios, respectively. Variations in hazard-prone environments dominate the spatial heterogeneity of multi-hazard distribution. Gravity hazards demonstrate limited sensitivity to climate change, whereas thermal hazards exhibit a more pronounced response. Our geomorphology-based segmented assessment framework effectively enhances evaluation accuracy and model interpretability. The results can provide critical insights for the operation, maintenance, and hazard risk management of the QTH.
1. Introduction
Road networks play a crucial role in supporting economic activities and fostering social connectivity for the development of a nation [1]. However, these essential infrastructures are under constant threat due to frequent natural hazards, such as the 2024 Meilong Expressway landslide and Lanhua Village debris flow in China, and the 2021 Chamoli ice avalanche in India [2,3,4], which have caused huge economic losses and numerous casualties. The Golmud–Nagqu section of the Qinghai–Tibet highway (QTH) serves as a critical transportation corridor linking the Chinese mainland to the Tibetan Plateau, traversing a series of tectonically active mountain ranges and approximately 550 km of permafrost zones. In the context of global climate change, thermally related hazards have rapidly increased on the plateau, thereby significantly impacting the stability of the QTH embankment [5,6,7,8]. Consequently, the incidence of permafrost-related engineering problems of the QTH has exceeded 30% [9,10,11,12]. Additionally, the QTH crosses tectonically active mountain ranges, including the Kunlun Mountains, Bayan Har Mountains, and Tanggula Mountains, which feature complex geological conditions, steep terrain, and strong weathering [13,14,15,16], making them highly susceptible to geohazards. Constructed within such a challenging geomorphic and geological setting, the QTH has witnessed the emergence of a multitude of hazards that severely impede the construction and development of infrastructure and major projects in the Tibet region.
In order to prevent irreversible damage to the highway, extensive studies have been conducted on the operation and maintenance of the QTH, including continuous monitoring of highway embankment stability [17,18], engineering techniques to mitigate thaw settlement [19,20,21], and regional hazard risk assessment [22,23,24]. Among these approaches, infrastructure management based on hazard susceptibility mapping is far more economically efficient than later maintenance and reconstruction [25,26]. Therefore, assessing the susceptibility of multi-hazards along the QTH and analyzing possible risks are of great significance. Susceptibility assessments can be knowledge-, process-, or data-driven [26], and data-driven statistical methods are generally considered more suitable for regional-scale research. With advancements in computer science, more and more machine learning and even deep learning technologies have been widely used in hazard assessments in many countries and regions [27,28,29,30,31]. However, current studies mainly focus on single-hazard types, particularly thermally related hazards, while neglecting gravity hazards and their associated risks in regions like the Kunlun Mountains, resulting in limited knowledge about the spatial distribution and controlling factors of multi-hazards.
Permafrost systems exhibit high vulnerability to climate perturbations. Affected by global warming, the Arctic, Alaskan, and Siberian regions are all facing serious problems with permafrost degradation [32]. Moreover, the Tibetan Plateau has a rate of temperature increase over the past 40 years that is about twice that during the same period in the rest of the world [33,34,35]. Projections indicate a potential degradation of 30–80% in plateau permafrost coverage by 2100 under different emission trajectories [36]. Permafrost degradation is usually accompanied by an increase in the active layer thickness and the thawing of ground ice [37,38,39], which will directly lead to the risk of thermal hazards [40,41]. Furthermore, the intense warming and humidification on the Tibetan Plateau may cause a surge in extreme rainfall events, thereby amplifying the risk of landslides and debris flows along the QTH. However, the relevant studies only focus on the evolution of hazards in the past and the assessment of their risks in the current situation [22,23,24,37,38,39,40,41]. Therefore, addressing these threats necessitates developing dynamic predictive frameworks to quantify the spatiotemporal evolution of multi-hazard susceptibility along the QTH under the future climate change scenarios.
This study aims to construct a susceptibility assessment method for the coupling of multi-hazards under climate change scenarios. Firstly, we established a detailed inventory of multi-hazards along the QTH and divided the QTH into three evaluation sections based on the distribution characteristics of hazard-prone environments and hazards. Then, we selected the optimal machine learning method to build hazard susceptibility assessment models based on a comparison of the accuracy of different models, and finally applied the optimal model in predictions of multi-hazard susceptibility under future climate change scenarios. We also discuss the major factors controlling different hazards, as well as the complexity of the QTH compared to other roads. The results could assist decision-makers in assessing the integrated risk from multi-hazards and implementing precautionary measures for the QTH.
2. Study Area
The study area is defined by a 10 km buffer zone along the Golmud–Nagqu section of the QTH, representing a typical high-altitude region in the central Tibetan Plateau (Figure 1). Elevations within the study area range from 2800 m to 6800 m, with the average elevation exceeding 4800 m. The mean annual air temperature remains below −6 °C, while annual precipitation varies from less than 50 mm/yr in the north to 480 mm/yr in the south [23]. Such a high and cold environment supports extensive permafrost, predominantly characterized by semi-stable and transitional types, which are vulnerable to degradation under the influence of climate change [42]. This region is characterized by the predominance of high plains interspersed with mountainous regions such as the Kunlun Mountains and Tanggula Mountains. It is also the source of the Yangtze River, with many large rivers such as the Chumaer River, Tuotuo River, and Buqu River [43,44]. Due to the India–Asia plate collision, the tectonic setting of the study area is highly complex, with the QTH traversing the East Kunlun–Qaidam block, Bayan Har block, and Qiangtang block, intersecting a series of NWW-trending faults. The lithology of the East Kunlun–Qaidam plate is predominantly granite and limestone, the Bayan Har block consists mainly of clastic rocks and quaternary sediments, and the Qiangtang block comprises primarily carbonate rocks and metamorphic rocks [16]. It is precisely because of the diverse geomorphic conditions, complex tectonic background, and wide distribution of permafrost in this region that there are various hazards along the QTH.
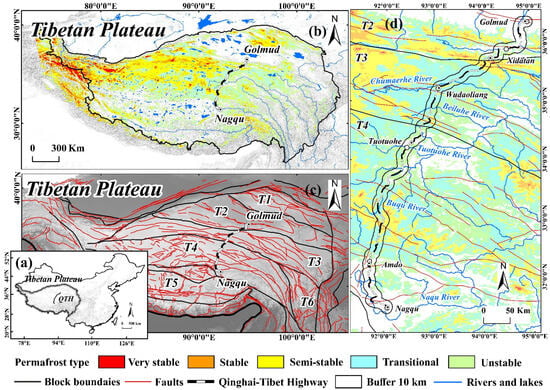
Figure 1.
Permafrost distribution and tectonic conditions of the study area. (a) Location of the Tibetan Plateau; (b) Thermal stability and distribution of permafrost in the Tibetan Plateau; (c) Tectonic background of the Tibetan Plateau; (d) Location, permafrost distribution, and tectonic conditions of the QTH. T1—Qilian Mountain block, T2—East Kunlun–Qaidam clock, T3—Bayan Har block, T4—Qiangtang block, T5—Lhasa block. The permafrost data are sourced from Ran et al. [42], and the tectonic data are from Zhao et al. [16].
3. Materials and Methods
3.1. Multi-Hazard Mapping in the QTH
Based on literature reviews and field investigations, four major hazards along the QTH are identified, namely landslides, debris flows, thaw slumps, and thermokarst lakes. Notably, thaw slumps are generally regarded as a type of landslide [45]; however, the term “landslide” in this study specifically refers to the slides/falls that occur in non-permafrost environments, as their failure mechanisms and controlling factors are significantly different from those of thaw slumps [46]. Based on these considerations, we defined the two hazards that occur in permafrost areas as thermal hazards (thaw slumps and thermokarst lakes), while the hazards that occur in non-permafrost environments are classified as gravity hazards (landslides and debris flows).
High-resolution images from Google Earth (resolution ≤ 1 m) and Gaofen-1 satellite (resolution of 2 m) were obtained to interpret these hazards, and their boundaries were mapped in ArcGIS 10.6 software. We used Google Earth images captured between 2008 and 2014 to delineate the multi-hazards around 2010. Since the QTH is located in the remote region of western China (Figure 1a), the latest Google Earth images are not available for the entire QTH, so we added Gaofen-1 images from 2023 to cover areas that have not been updated in Google Earth. Combining Google Earth images from 2018 to 2021 and Gaofen-1 images, we updated the multi-hazards database around 2020 to account for the evolution of these hazards over the past decade. In addition, we also compiled and integrated the existing hazards database into our database [43,44]. We finally conducted field surveys to validate our multi-hazards database (Figure 2).
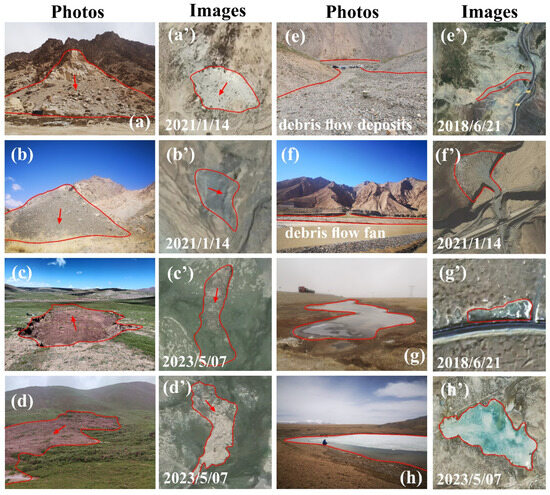
Figure 2.
Examples of multi-hazards in field photos (a–h) and remote sensing images (a’–h’). (a,b) landslides ((a): 35.906756°N, 94.437578°E; (b): 35.851746°N, 94.349646°E); (c,d) thaw slumps ((c): 34.712136°N, 92.890481°E; (d): 34.706583°N, 92.883869°E); (e,f) debris flows ((e): 35.689133°N, 94.053734°E; (f): 35.873835°N, 94.577466°E); (g,h) thermokarst lakes ((g): 35.526195°N, 93.792754°E; (h): 35.499499°N, 93.694865°E).
3.2. Controlling Factors of the Multi-Hazards
Since the controlling factors of each hazard are often different, based on the reference to existing research on these hazards [22,47,48,49], we determined an evaluation indicator system for multi-hazards. A database of 14 environmental factors was established in ArcGIS 10.6 software, including regional topography, hydrology, geology, ecology, climate, human activity, and permafrost conditions (Figure 3). All of these data were then transformed into grid data with a resolution of 30 × 30 m. We assumed that the topographical, hydrological, and geological conditions would not change over a ten-year period; however, ecological, climate, human activity, and permafrost factors are expected to undergo certain changes, so we obtained these factors for the two periods of 2010 and 2020. More details of the factors introduced and their data sources can be found in Text S1 and Figures S1, S2 and S4 of the Supplementary Materials.
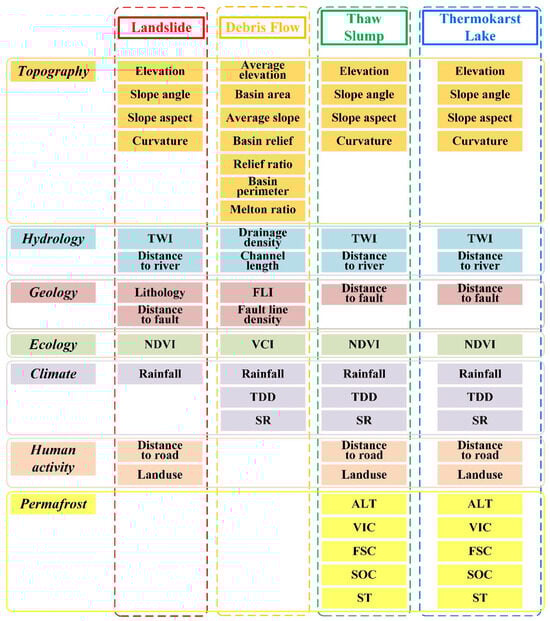
Figure 3.
Evaluation index system of the multi-hazard susceptibility assessment.
3.3. Future Climate Change Scenarios
In order to evaluate the susceptibility of multi-hazards along the QTH under future climate change, it is essential to predict the climate and permafrost degradation for future scenarios. Hu et al. [50] have compared the applicability of the fifth phase and sixth phase of the Coupled Model Intercomparison Project (CMIP) on the plateau, and indicated that CMIP6 exhibits only limited improvements but displays a more severe cold bias than CMIP5, while the temperature simulation is critical for predicting thermal-hazards; conversely, CMIP5 possesses more mature datasets and richer application cases. Specifically, Pan et al. [51] utilized the latest regional climate model, RegCM4.6, which effectively simulates climatology over northwest China, provides finer-scale climate information in complex terrains, and includes an improved correction of the cold bias within the temperature bias in most regions in west China to within ±2.5 °C. Based on the above considerations, we finally chose the climate change data provided by Pan et al. [51] (https://data.tpdc.ac.cn/en/, accessed on 6 January 2025). We compared the simulation data with the historical data from 2007 to 2020: the root mean square error (RMSE) of the temperature is 3.03, while the deviation of rainfall is slightly larger, with an RMSE of 11.76. The results confirm the applicability of the climate change simulation data to this region (see Figure S3 of Supplemental Materials). We obtained the temperature, rainfall, and soil temperature under representative concentration pathways (RCP) 4.5 and 8.5 of climate change scenarios, representing medium and high emission pathways, respectively. Then, these data were classified into three stages, namely the near future (2030–2050), middle future (2055–2075), and distant future (2080–2100), basically covering the climate change situation up to the end of this century, which facilitates the comparison of hazard susceptibility evolution.
3.4. Susceptibility Assessment Model Construction
Before constructing the susceptibility assessment model, it is necessary to process the factors. We used Pearson Correlation Analysis (PCA) to evaluate the correlation among the factors; the highly correlated factors (r > 0.8) were then removed to reduce the influence of multicollinearity. After standardizing these parameters, we then inputted the factors into three machine learning models for modeling. We used Random Forest (RF), Support Vector Machine (SVM), and Logistic Regression (LR) models to construct the initial evaluation model for hazard susceptibility. These represent the most classic and commonly used tree model, nonlinear model, and linear model, respectively. We conducted a grid search to explore the optimal hyperparameters of each model, and then selected the best-performing parameters among them. We employed the 10-fold cross-validation method to evaluate model performance, with 70% of the data being randomly selected for model training, and the remaining 30% used as test data; this process was repeated 10 times. Finally, the receiver operating characteristic (ROC) curve was used to compare the performance of these models. This method determines the accuracy of the model based on the Area under the Curve (AUC) value, and the optimal model with the highest AUC value was found for the final modeling. This work was performed in Python using the Scikit-learn library (https://scikit-learn.org/, accessed on 1 February 2010). More details of factor preprocessing, model algorithms, and model validation can be found in Text S2 of the Supplementary Materials.
4. Results
4.1. Distribution of Multi-Hazards and Hazard-Prone Environment
A multi-hazards database in the QTH was compiled (Figure 4a). In 2010, a total of 199 landslides were found in the QTH, increasing to 202 by 2020, with only three new landslides identified during this decade (Figure 4b,c). Most of the landslides were concentrated in the Kunlun Mountains, characterized by significant topographic relief and steep slopes; a small number of landslides developed along highway slopes in the Tanggula Mountains. Debris flows increased from eight cases in 2010 to ten cases in 2020 (Figure 4d,e), all of which occurred in the Xidatan area, an elevated region covered by glaciers year-round, where meltwater is the main water source triggering the debris flows. The number of thaw slumps increased from 49 in 2010 to 125 in 2020, with their total area expanding from 0.57 km2 to 1.69 km2, representing nearly a threefold increase (Figure 4f,g). These thaw slumps developed in the relict mountainous area between Wudaoliang and Tuotuohe. Thermokarst lakes represent the most abundant hazard type in the study area, with 3489 lakes identified in 2010, and this number increasing to 4678 by 2020. The total lake area expanded from 39.9 km2 in 2010 to 56.2 km2 in 2020 (Figure 4h,i). These thermokarst lakes are widely distributed across permafrost areas, particularly in the Chumaerhe High Plain, Beiluhe Basin, Tuotuohe Basin, and Buqu Basin.
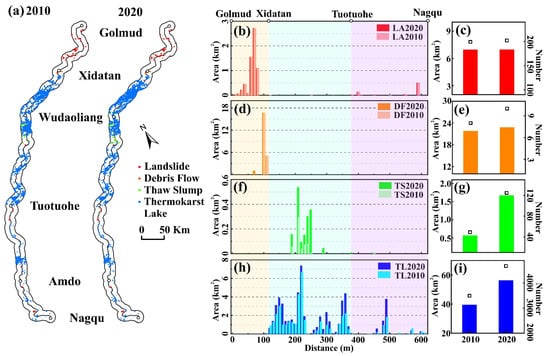
Figure 4.
Development characteristics of multi-hazards in 2010 and 2020. (a) Multi-hazards distribution in the 10 km buffer of the QTH; area distribution profiles of (b) landslides, (d) debris flows, (f) thaw slumps, and (h) thermokarst lakes along the QTH; changes in area and number of (c) landslides, (e) debris flows, (g) thaw slumps, and (i) thermokarst lakes between 2010 and 2020.
The development of various hazards along the QTH is characterized by clustering and spatial heterogeneity, which are determined by the hazard-prone environment of this region. Spanning over 800 km and traversing numerous geomorphic units and tectonic plates, the QTH exhibits significant variations in topography, geology, meteorology, and permafrost properties across its different sections. According to the characteristics of the hazard-prone environment and hazard development of the QTH, it can be roughly divided into three sections (Figure 5):
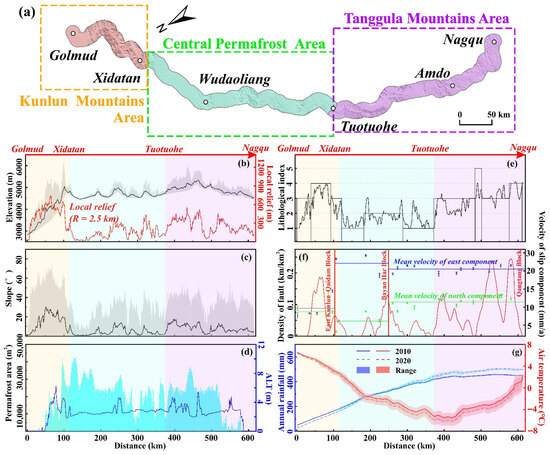
Figure 5.
Geomorphic division and environmental characteristics along the QTH. (a) Division of geomorphic units of the QTH. Environmental characteristics along the QTH: (b) elevation and relief, (c) slope, (d) permafrost area and ALT, (e) lithologies, (f) fault line density and GPS velocity, (g) annual rainfall and temperature. The GPS data are sourced from Zhao et al. [52].
(1) The Kunlun Mountain Area (KMA): This section extends from the Qaidam Basin, crossing the East Kunlun Mountains, and features the greatest relief and steepest slopes over the entire QTH. Compared with other sections, the most significant difference in this area is that permafrost distribution is sparse, appearing only at elevations above 4500 m. Therefore, gravity hazards such as landslides and debris flows dominate in the KMA, rather than thermal hazards. Additionally, the KMA predominantly consists of hard limestone and sandstone, and receives little rainfall, leading to the formation of small-scale rockfalls and glacial debris flows caused by freeze–thaw cycles.
(2) The Central Permafrost Area (CPA): This section, located between Xidatan and Tuotuohe, represents the typical high-altitude plain landform in the QTH, characterized by relatively gentle terrain with an average elevation exceeding 4500 m. The CPA area is composed of soft Quaternary sediments and is almost entirely covered by permafrost, where thaw slumps and thermokarst lakes constitute the primary hazards. Over the past decade, due to intensified warming and humidification, these thermal hazards have increased rapidly.
(3) The Tanggula Mountain Area (TMA): This section crosses the Tanggula Mountain range from Tuotuohe to Nagqu, and features low-relief mountainous terrain with numerous fault basins. Permafrost is distributed only between Tuotuohe and Amdo. This area is not as distinct in its features as the previous two sections. The hazards here are mainly composed of widespread thermokarst lakes, along with a few landslides resulting from the construction of roads.
These results indicate that the distinct hazard-prone environment significantly determines the main types of hazards along the QTH. To quantitatively reveal the link between the hazard-prone environment and the associated multi-hazards, and to reduce the uncertainty of multi-hazard susceptibility caused by environmental spatial heterogeneity, the entire QTH was divided into three evaluation segments as above: the KMA, CPA, and TMA. Two major hazards in each segment were selected as objects for susceptibility assessment.
4.2. Susceptibility of Multi-Hazards in the Present Scenario
A parameter grid search was used to fit the three models, and the AUC (area under the receiver operating characteristic curve) value was used to search for the best model. According to the optimal hyperparameters of each model, given in Table 1, 10-fold cross-validation was performed during the model training, and the optimal models were selected according to the AUC value of the test data (Figure 6).

Table 1.
Model optimal hyperparameters results.
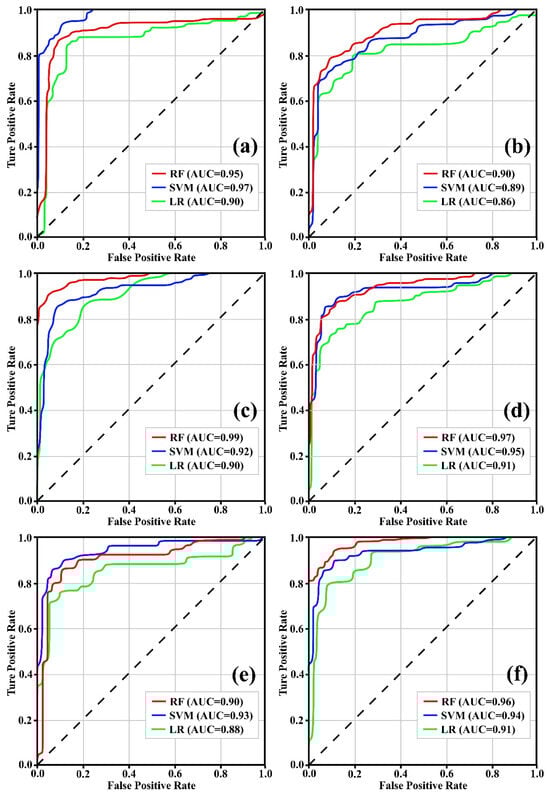
Figure 6.
The ROC curves of multi-hazard susceptibility models. (a) Landslide susceptibility model in the KMA; (b) debris flow susceptibility model in the KMA; (c) thaw slump susceptibility model in the CPA; (d) thermokarst lake susceptibility model in the CPA; (e) thermokarst lake susceptibility model in the TMA; (f) landslide susceptibility model in the TMA.
The two primary hazards in the KMA are landslides and debris flows. According to the assessment results, the SVM model shows the highest performance for landslide susceptibility assessment, with an AUC value of 0.97 (Figure 6a); meanwhile, the RF model exhibits the highest accuracy for debris flow susceptibility, with an AUC value of 0.90 (Figure 6b). Susceptibility was categorized into five levels using the natural breaks method, which respectively correspond to very low, low, moderate, high, and very high susceptibility levels. This classification method maximizes the difference between classes according to the grouping inherent in the data and provides an optimal grouping of similar values. The high and very high landslide susceptibility areas account for 5.82% of the total area (Table 2) and are mainly located on the steep slopes near faults, roads, and rivers (Figure 7a). There are 35 basins with high and very high susceptibility to debris flows, accounting for 19.33% of the total number of sub-basins. These basins are primarily concentrated in the Xidatan area (Figure 7b), which features a relatively high altitude and is covered in snow and ice year-round; thus, the meltwater compensates for the lack of rainfall in the area.
Table 2.
The proportions of different susceptibility levels of multi-hazards.
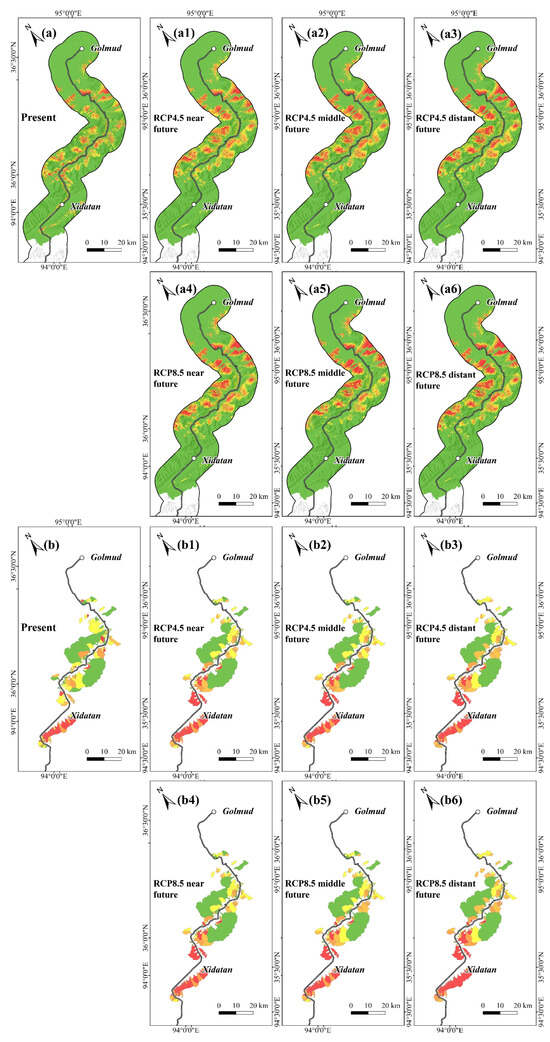
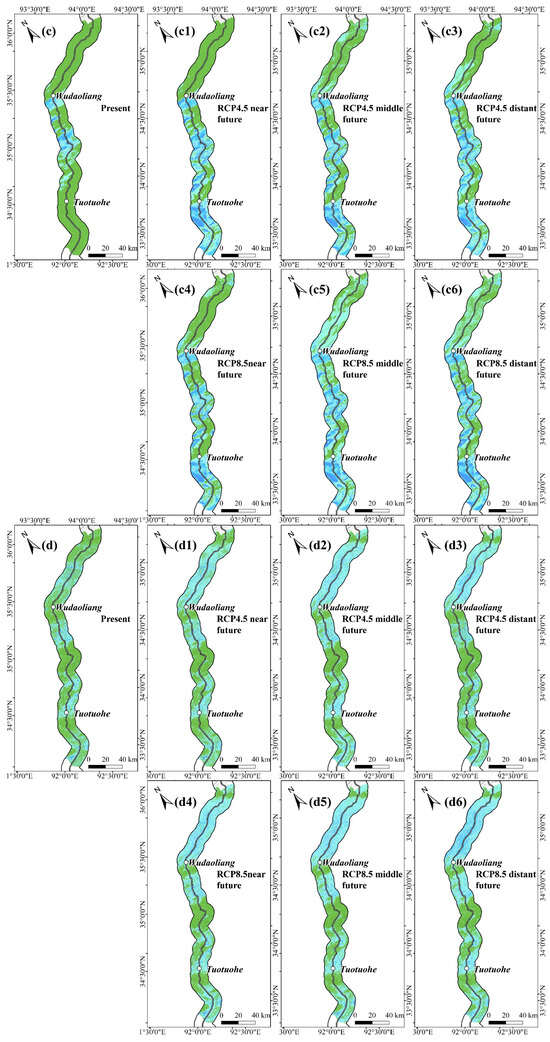
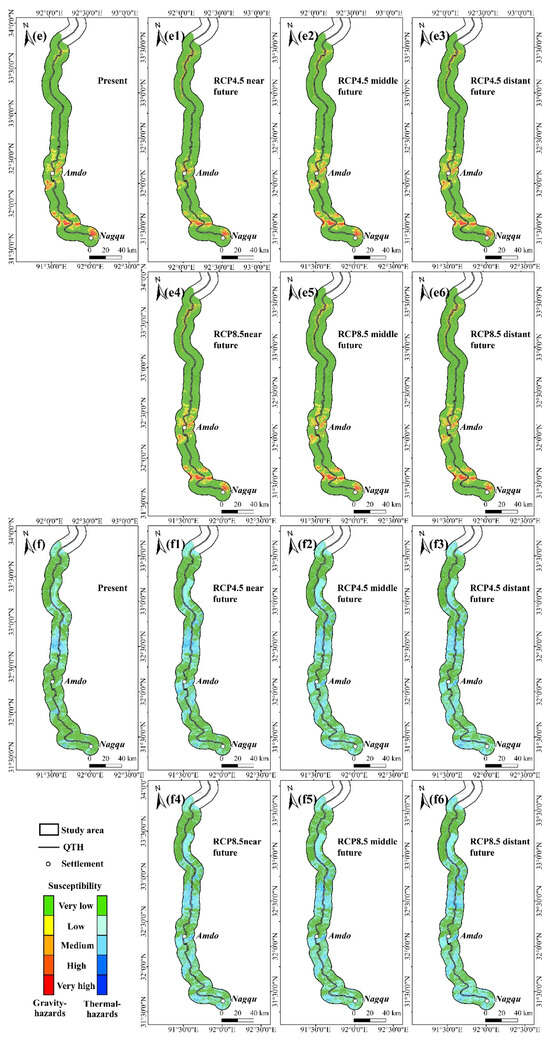
Figure 7.
Multi-hazard susceptibility maps in present and future climate change scenarios. (a–a6) Landslide susceptibility maps in the KMA; (b–b6) debris flow susceptibility maps in the KMA; (c–c6) thaw slump susceptibility maps in the CPA; (d–d6) thermokarst lake susceptibility maps in the CPA; (e–e6) landslide susceptibility in the TMA; (f–f6) thermokarst lake susceptibility maps in the TMA. Labels only with letters (e.g., a, b…) correspond to the evaluation results under the present climate scenario, labels with numerical suffixes (e.g., a1, a2…) represent the evaluation results in future climate change scenarios.
In the CPA, the RF model achieves the highest accuracy for both thaw slump and thermokarst lake assessments, with respective AUC values are 0.99 and 0.97 (Figure 6c,d). Among these, areas with high and very high susceptibility to thaw slumps account for 5.03% of the total area, and are mainly concentrated in relict hills such as Kekexili Mountain, Fenghuo Mountain, and Wuli Mountain (Figure 7c). High and very high susceptibility areas for thermokarst lakes are widely distributed across the Chumaerhe High Plain, Beiluhe Basin, and Tuotuohe Basin (Figure 7d), accounting for 7.79% of the total CPA area.
In the TMA, the SVM model demonstrates the highest accuracy for thermokarst lake susceptibility, with an AUC value of 0.93 (Figure 6e), while the RF model yields the highest accuracy for landslide susceptibility, achieving an AUC value of 0.96 (Figure 6f). High and very high landslide susceptibility areas are mainly distributed on the road slopes, accounting for 3.58% of the total area (Figure 7d). Compared with the KMA, the TMA has a gentler terrain and thicker cover layers, with most landslides in this region being caused by slope excavation during road construction. High and very high thermokarst lake susceptibility areas are concentrated in the Amdo fault basin, characterized by having flat terrain and extensive permafrost, accounting for 3.67% of the total area (Figure 7f).
4.3. Susceptibility of Multi-Hazards in Future Climate Change Scenarios
Under future climate change scenarios, a continued increase in both precipitation and temperature leads to progressively worsening permafrost degradation, manifested in rising soil temperatures, thickening of the active layer, and melting of ground ice. More details of changes in rainfall, TDD, ALT, VIC, and ST can be found in Text S3 and Figure S5 of the Supplementary Materials.
In the KMA, the susceptibility to landslides and debris flows is not expected to greatly improve in the future. Under the near, middle, and distant future scenarios of RCP 4.5, the proportions of areas with high and very high landslide susceptibility increase only to 8.29%, 9.69%, and 10.15%, respectively; these proportions rise further to 9.80%, 9.90%, and 11.55% under the RCP 8.5 scenarios (Table 2). Areas with increasing susceptibility are concentrated in hillslopes near roads, faults, and rivers (Figure 7a1–a6). For debris flows, under the near, middle, and distant future scenarios of RCP 4.5, there will be 10, 15, and 24 basins that can be upgraded to high and very high susceptibility; these numbers will increase to 13, 21, and 29 under the RCP 8.5 scenarios (Figure 7b1–b6).
In the CPA, due to the projected increases in rainfall and temperature, the susceptibility to thermal hazards is expected to rise significantly. Under the RCP 4.5 scenarios, the proportions of areas with high and very high thermokarst lake susceptibility will increase to 9.37%, 10.40%, and 10.87% in the near, middle, and distant future, respectively; for the RCP 8.5 scenarios, these proportions will increase to 10.82%, 11.42%, and 15.57%, respectively. Thermokarst lake susceptibility is greatly increased in the Chumaerhe High Plain (Figure S6), but only slightly in the Beiluhe Basin and Tuotuohe Basin (Figure 7d1–d6). Thaw slumps are more sensitive to climate change than thermokarst lakes. In the near, middle, and distant future scenarios of RCP 4.5, the proportions of areas with high and very high thaw slump susceptibility will increase to 17.72%, 19.14%, and 20.36%, respectively, and these proportions will increase to 17.30%, 20.19%, and 24.56% (Figure 7c1–c6). Notably, the Tuotuohe area, currently characterized by low thaw slump susceptibility, is projected to become the most vulnerable region to thaw slumps due to the rapid permafrost degradation (Figure S7).
In the TMA, the thermokarst lakes are expected to respond significantly to climate change, the proportions of areas with high and very high susceptibility increasing to 8.84%, 9.02%, and 9.70% in the near, middle, and distant future scenarios of RCP 4.5, respectively; and these proportions will increase to 9.58%, 9.92%, and 10.98% under the RCP 8.5 scenarios. Areas of increasing susceptibility are mainly distributed along the Buqu River valley and Amdo fault basin (Figure 7f1–f6). Conversely, the proportions of areas with high and very high landslide susceptibility areas will only increase to 4.47% and 4.60% under distant future scenarios of RCP 4.5 and RCP 8.5, respectively (Figure 7e1–e6). Therefore, in this section, thermokarst lakes are likely to pose a significant threat in the future.
4.4. Fusion Mapping of Multi-Hazard Susceptibility Along the QTH in Climate Change Scenarios
We found that the distribution of gravity and thermal hazards differs considerably, and the susceptibility map shows mutually exclusive and complementary characteristics. For example, gravity hazards tend to develop on high and steep terrains, whereas thermal hazards are more likely to occur on gentler terrain. In addition, the presence of permafrost and the hardness of lithology play significant roles in hazard development. As a result, highly susceptible areas of the same hazard type often overlap, while highly susceptible areas between gravity and thermal hazards remain distinctly separated. To intuitively represent multi-hazard susceptibility in the study area, we integrated the assessment results from different sections and different hazard types using a judgment matrix (Figure 8), producing a fusion susceptibility map of multi-hazards for the entire QTH (Figure 9).
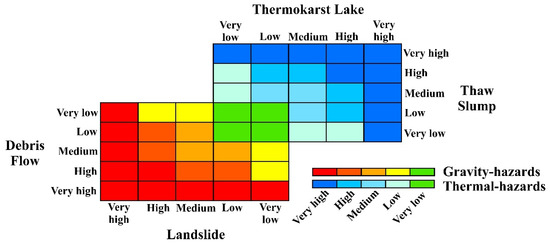
Figure 8.
Judgment matrix of fusion mapping for multi-hazard susceptibility.
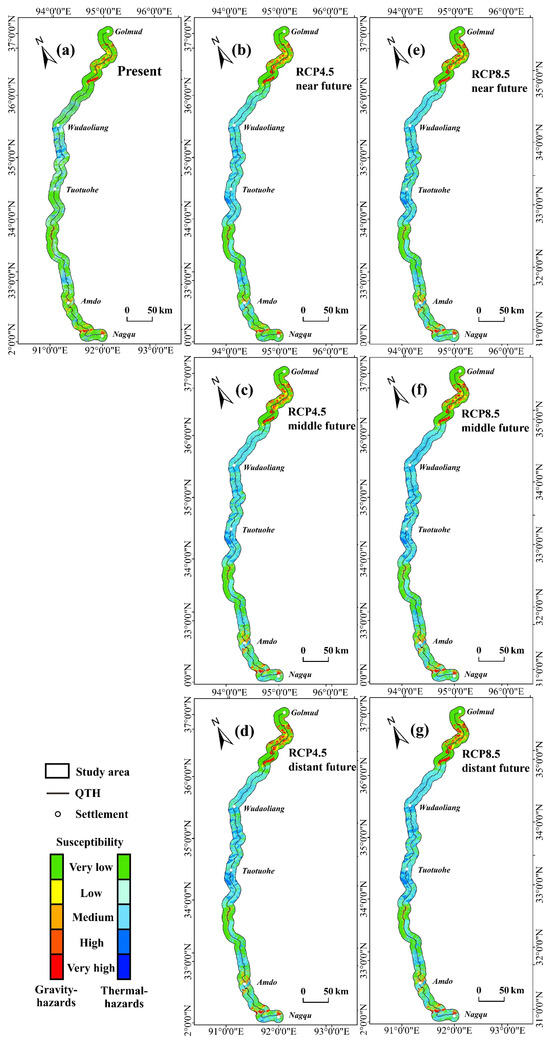
Figure 9.
Fusion susceptibility maps of multi-hazards in present and future climate change scenarios. (a) Fusion susceptibility map in the present scenario; (b–g) fusion susceptibility map in future climate change scenarios.
In the present scenario, high and very high areas for gravity hazard susceptibility are mainly distributed in the KMA and TMA, particularly on steep slopes, accounting for 2.90% of the total study area; thermal hazards, meanwhile, are concentrated in the CPA and fault basins of the TMA, with high and very high susceptibility areas accounting for 12.60%. Overall, high and very high susceptibility areas for multi-hazards account for 15.50% (Table 3). Under future climate change scenarios, the proportions of areas with high and very high susceptibility for multi-hazards is projected to increase to 17.70%, 19.19%, and 20.85% under the near, middle, and distant future scenarios of RCP 4.5, respectively; under RCP 8.5, these proportions increase to 17.74%, 20.51%, and 23.32% (Figure 9b–g).
Table 3.
The proportions of different susceptibility levels of fusion susceptibility maps.
According to the assessment results, the susceptibility to gravity hazards in the high-altitude mountainous area of the KMA is expected to rise from the low ~ medium class to the high~very high class, due to the possibility that some small sub-basins could be transformed into potential debris flows in the future. Thermal hazard susceptibility in the CPA will also face a significant increase, driven by potential thermokarst lake expansion and thaw slump proliferation. For the TMA, the susceptibilities of both gravity hazards and thermal hazards are unlikely to increase in the future. As a result, thermal hazards exhibit significant sensitivity to future climate change: the permafrost region of the QTH will face a serious threat from thermal hazards.
5. Discussion
5.1. Controlling Factors of Multi-Hazards
Based on the feature importance analysis of SHapley Additive exPlanations (SHAP), a game-theoretical approach that utilizes Shapley values to interpret the local predictions of machine/deep learning models was applied [53]. We revealed the controlling factors of each hazard in each section between 2010 and 2020 (Figure 10). Here, we analyze the controlling factors that rank highly and have changed over the past decade.
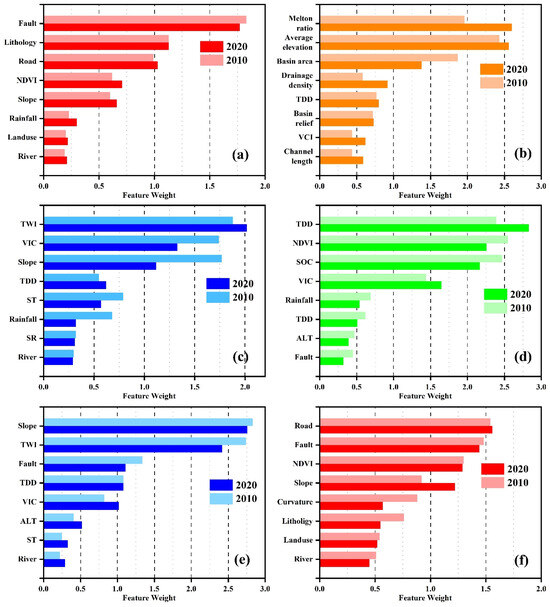
Figure 10.
The relative importance of environmental factors controlling the occurrences of multi-hazards. (a) Controlling factors of landslides in the KMA; (b) controlling factors of debris flows in the KMA; (c) controlling factors of thaw slumps in the CPA; (d) controlling factors of thermokarst lakes in the CPA; (e) controlling factors of landslides in the TMA; (f) controlling factors of thermokarst lakes in the TMA.
Landslides mainly occurred in the KMA and TMA areas. In the KMA, distance to fault and lithology were identified as the two most important factors, highlighting the dominant role of geological factors in this section. Distance to road ranks third, followed by other ecological, topographical, and hydrological factors. The main lithologies in the KMA include hard granite and limestone. In general, only strong tectonic activities and human transformation can induce fracturing of the rock mass [54,55], coupled with the effects of freeze–thaw cycles at high altitudes [56], eventually resulting in slope instability. In contrast, the TMA has relatively lower relief, better vegetation cover, and thicker regolith. Consequently, distance to road is the most important factor, followed by other geological, ecological, and topographical factors. Landslides in the TMA mainly occurred on the artificial slopes near the QTH, attributed to the fact that the angle and internal stress state of the slope are altered after slope excavation [57,58]. Additionally, it should be noted that fewer new landslides occurred between 2010 and 2020, resulting in no change in the ranking of controlling factors for landslides during this period.
For debris flow, the top five factors in 2020 were the Melton ratio, average elevation, basin area, drainage density, and TDD. Topographical factors were identified as the most important factors affecting debris flows, consistent with findings from other regions such as the Sichuan–Tibet Highway and China–Pakistan Highway [59,60]. However, rainfall exhibited a limited contribution to the development of debris flows in this area. This is attributed to the extremely low annual rainfall in the KMA, where glacial meltwater became the main water source of debris flows. Therefore, average elevation and TDD, which reflect the development and melting of glaciers, have replaced rainfall as key factors.
Thaw slumps mainly developed in the CPA, with thaw degree days (TDD) being the most significant factor in 2020, followed by NDVI, SOC, VIC, and rainfall; however, in 2010, the top three most important factors were NDVI, SOC, and TDD. In fact, thaw slumps typically develop on northern slopes [46,61], which receive lower solar radiation and contain higher amounts of ground ice; therefore, northern slopes usually have better NDVI, and better vegetation growth is always associated with higher SOC levels, which further affect soil temperature and moisture, making these areas more susceptible to thaw slumps. TDD is an indicator of the melting of ground ice; permafrost areas with higher TDD are more prone to thawing, thereby increasing the likelihood of thaw slumps. The increased importance of TDD in 2020 illustrates the impact of climate change on thaw slump hazards.
In the CPA, TWI was the most important factor controlling thermokarst lakes in both 2010 and 2020, with its importance obviously exceeding that of other factors. TWI reflects the low-lying terrain and area of a catchment, both of which are closely related to the thermokarst lake formation. VIC determines the water source during the formation and recharge of lakes, thus ranking second in importance. The high ranking of slope indicates that lakes were only formed on flatland. Furthermore, the increase in TDD, ST, and rainfall driven by global warming effectively recharged the lakes [22]. In the TMA, the top two factors are slope and TWI, highlighting that topographical and catchment conditions are still the most important in the development of lakes. Distance to fault ranked third, as most of the thermokarst lakes were concentrated in fault basins, and underground structures, such as cracks and fissures, facilitate the accommodation and storage of groundwater. This was followed by other climate and permafrost-related factors, which play the same roles as those of the KMA.
5.2. Superiority of the Segmented Assessment
In this study, the QTH was divided into three sections to consider the spatial heterogeneity of hazard-prone environments and hazard distribution. This approach produced a more accurate assessment result. Landslides and thermokarst lakes, which are among the most widely distributed hazards in the study area, were selected as examples. As shown in Figure 11a,b, rainfall has an insignificant effect on landslides in both the KMA and TMA; however, when the entire QTH is considered as the assessment section, rainfall becomes significantly important and negatively influences landslide development due to most landslides being concentrated in the KMA, which experiences the least rainfall (Figure 11c). This phenomenon obviously contrasts with common knowledge. For thermokarst lakes, factors reflecting permafrost properties, such as ALT, VIC, and ST, gain prominence in segmented assessments. Conversely, the contributions of topography and rainfall may be overestimated when the entire QTH is assessed as a single unit (Figure 11d–f). These results demonstrate that segmented assessment can effectively avoid errors caused by spatial heterogeneity in hazard-prone environments and hazard distribution, leading to more refined assessment results and model interpretation.
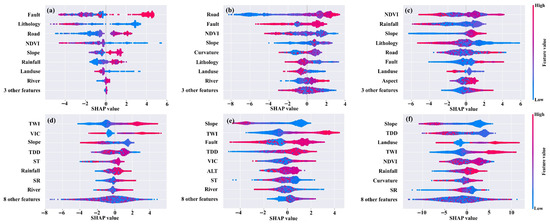
Figure 11.
Beeswarm plots of feature weights. Comparison of feature weights for landslide susceptibility models based on different evaluation sections, (a) in the KMA, (b) in the TMA, and (c) in the entire QTH; comparison of feature weights for thermokarst lake assessment models based on different evaluation sections, (d) in the CPA, (e) in the TMA, and (f) in the entire QTH.
Beyond the QTH, the Sichuan–Tibet transportation corridor (STTC), another important passage into Tibet in China, has also been the subject of numerous hazard assessment studies. These studies encompass not only traditional geohazards like landslides and debris flows [62,63] but also engineering-related disasters such as tunnel geothermal and rock bursts [64,65]. Generally, these studies treat the entire corridor as the assessment section. The topographical and geological background in the STTC is complicated but does not exhibit significant spatial heterogeneity, differing from the QTH (Figure 12). Except for the section from Chengdu to Ya’an, which lies within the Sichuan Basin, approximately 90% of the corridor traverses the Hengduan Mountains, maintaining consistent terrain characteristics overall. Furthermore, although this corridor traverses four tectonic plates, there is no distinct variation in the fault active rates and lithological composition. Therefore, when the hazard-prone environment is relatively uniform, the development and distribution of hazards will not produce significant variability, so it is unnecessary to process the segmented assessments.
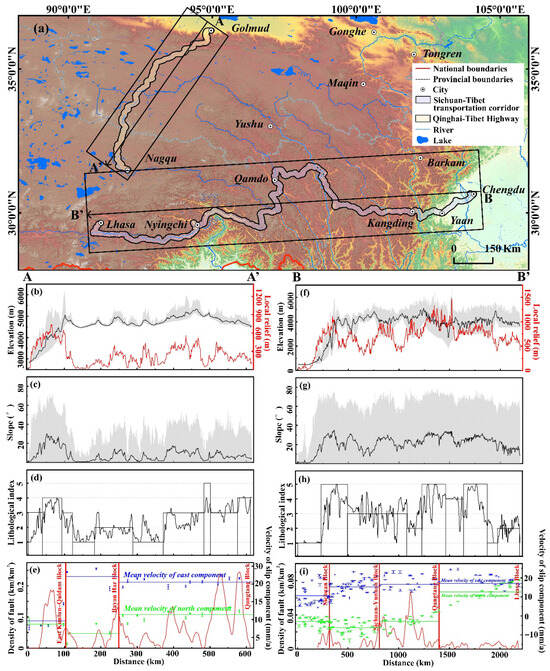
Figure 12.
Comparison of topographic and geological background between the STTC and QTH. (a) Location of the STTC and QTH; (b) elevation and relief, (c) slope, (d) lithological condition, and (e) fault line density and GPS velocity profiles along the QTH; (f) elevation and relief, (g) slope, (h) lithological condition, and (i) fault line density and GPS velocity profiles along the STTC. The GPS data are sourced from Zhao et al. [52].
5.3. Limitations of the Model
The purpose of this study was to evaluate and map the coupling susceptibility of multi-hazards along the QTH. By comparing various machine learning methods, we selected the optimal model and performed a segmented assessment, thereby enhancing the reliability and reasonableness of the evaluation results. However, several limitations remain in this study: (1) The cataloging work of multi-hazard data involves the interpretation of high-resolution remote sensing images and field investigation. However, due to the lack of sufficient multi-temporal satellite images in such remote areas, the inventory of multi-hazards in this study only covers two periods: 2010 and 2020. Longer and more detailed time-scale data are required for a more complicated spatiotemporal evolution analysis of these hazards. (2) Spatial resolution and data quality play an important role in hazard susceptibility assessment [66,67]. Approximately 70% of thermokarst lakes in the QTH are smaller than 1000 m2; however, the resolution of our susceptibility mapping is limited to 30 m × 30 m, representing the highest resolution currently available from open-source data. This limitation precludes the consideration of small-scale variability and leads to insufficient weighting of small-scale hazards in regional evaluations. Therefore, more accurate data acquisition technology is needed. (3) Our study is still a data-driven work; although we calculated the changes in permafrost environment under present and future climate change scenarios, this does not yet account for the underlying physical processes associated with permafrost degradation, such as water–heat exchange and surface–subsurface heat flux conduction. (4) Given the strong spatial autocorrelation of the hazards and hazard-prone environments of this study, the use of the spatial cross-validation method may further enhance the quality of the evaluation results table [68,69]. However, considering the issue of the huge volume of data, this idea was not realized. (5) In the fusion matrix, 3774 grid cells (~0.01% of the total area) simultaneously exhibit high gravity and thermal hazard susceptibility. We selected the hazard type with the higher susceptibility level to cover the types with lower susceptibility levels. (6) During the modeling process, we focused more on the accuracy of the model, neglecting the evaluation of its uncertainty.
6. Conclusions
In this study, we presented a modeling approach for hazard susceptibility based on geomorphic division and multi-hazard coupling, and fusion maps of multi-hazard susceptibility along the QTH were generated under three scenarios, namely present, RCP 4.5, and RCP 8.5, with a spatial resolution of 30 m. Based on the findings, the following conclusions could be drawn:
(1) Controlled by the hazard-prone environment, the distribution of gravity and thermal hazards along the QTH was characterized by aggregation and spatial heterogeneity. We, therefore, divided the study area into the Kunlun Mountain Area, the Central Permafrost Area, and the Tanggula Mountain Area. There are significant differences in geomorphic condition, permafrost distribution, and hazard types in the three sections, and the segmented assessment approach effectively enhanced the accuracy of multi-hazard susceptibility.
(2) The factors controlling the development of gravity hazards in this region are mainly the geological and topographical factors, which exhibit low sensitivity to climate change. As such, their susceptibility is expected to increase slightly under future climate change scenarios. In contrast, factors controlling the development of thermal hazards are mainly the climate and permafrost-related factors, which are extremely sensitive to climate change. Thus, they not only increased rapidly in the last decade, but also will be more responsive to climate change in the future. Therefore, thermal hazards will be the main threat to the QTH in the future.
(3) The multi-hazard coupled susceptibility map shows that approximately 10.2% of the total QTH area is at the high and very high susceptibility levels, and under the distant future scenarios of RCP 4.5 and RCP 8.5, this proportion will increase to 20.85% and 23.32%, respectively. The Kunlun Mountain Area and the Central Permafrost Area are the areas where multi-hazard susceptibility will dramatically increase in the future, and more attention should be paid to the maintenance of the QTH. This susceptibility map is a promising tool for engineering support of the QTH but also for developing new insights into the response of natural hazards to environmental conditions and climate change in the Tibet Plateau.
Supplementary Materials
The following supporting information can be downloaded at: https://www.mdpi.com/article/10.3390/rs17193333/s1, Text S1: Selection and acquisition of controlling factors; Text S2: Susceptibility assessment model construction; Text S3: Change of climate and permafrost factors under future climate change scenarios; Figure S1: Environmental factors for the multi-hazard susceptibility modeling; Figure S2: The location of the meteorological stations around the QTH; Figure S3: The anomalies of temperature and precipitation versus historical data (1985–2004) in different scenarios and future periods; Figure S4: Validation for the ALT and VIC versus borehole data; Figure S5: Average changes in climate factors and permafrost factors along the QTH between present and future climate change scenarios; Figure S6: Thermokarst lake susceptibility under present and future climate change scenarios in the Chumaerhe high plain; Figure S7: Thaw slump susceptibility under present and future climate change scenarios in the Beiluhe Basin and Tuotuohe Basin; Table S1: Lithologies in the study area and their hardness classification. References [70,71,72,73,74,75,76,77,78,79,80,81,82,83,84,85,86,87,88,89,90,91,92,93,94,95,96,97,98,99] are cited in the Supplementary Materials.
Author Contributions
Conceptualization, J.J. and G.C.; methodology, J.J.; software, J.J.; validation, G.C. and X.M.; investigation, J.J., G.C. and Y.Z.; data curation, J.J. and D.C.; writing—original draft preparation, J.J.; writing—review and editing, G.C. and Y.C.; project administration, G.C., Y.Z. and X.M.; funding acquisition, G.C. and X.M. All authors have read and agreed to the published version of the manuscript.
Funding
This research was funded by the National Natural Science Foundation of China, grant numbers. 42377193 and 42130709; Second Tibetan Plateau Scientific Expedition and Research Program (STEP), grant number 2021QZKK0201; Central Guiding Local Science and Technology Development Fund Projects, grant number 24ZYQA046.
Data Availability Statement
The multi-hazards dataset compiled in this study is available at https://doi.org/10.11888/SolidEar.tpdc.302808, accessed on 11 June 2025. The code used in this study can be found at https://doi.org/10.5281/zenodo.17010759, accessed on 31 August 2025.
Acknowledgments
The authors would like to thank the National Tibetan Plateau Data Center for providing the environmental factors and CMIP5 data.
Conflicts of Interest
The authors declare no conflicts of interest.
References
- Rivera-Royero, D.; Galindo, G.; Jaller, M.; Betancourt Reyes, J. Road network performance: A review on relevant concepts. Comput. Ind. Eng. 2022, 165, 107927. [Google Scholar] [CrossRef]
- Li, Q.; Zhao, J.; Zuo, J.; Ji, F.; Deng, J.; Liu, S.; Lai, Q. Investigation of the slope-type debris flow disaster chain triggered by a landslide-induced road blockage in Yingpan Township, Shuicheng, Guizhou, on July 27, 2023. Landslides 2024, 21, 1899–1913. [Google Scholar] [CrossRef]
- Xia, Z.; Zhou, C.; Wang, W.; Peng, M.; Dong, D.; He, X.; Tan, G. Collapse of Meilong Expressway as Seen from Space: Detecting Precursors of Failure with Satellite Remote Sensing. J. Earth Sci. 2025, 36, 835–838. [Google Scholar] [CrossRef]
- Shugar, D.H.; Jacquemart, M.; Shean, D.; Bhushan, S.; Upadhyay, K.; Sattar, A.; Westoby, M.J. A massive rock and ice avalanche caused the 2021 disaster at Chamoli, Indian Himalaya. Science 2021, 373, 300–306. [Google Scholar] [CrossRef] [PubMed]
- Wu, Q.; Zhang, T. Changes in active layer thickness over the Qinghai-Tibetan Plateau from 1995 to 2007. J. Geophys. Res. Atmos. 2010, 115, D09107. [Google Scholar] [CrossRef]
- Guo, D.; Wang, H. Simulated historical (1901–2010) changes in the permafrost extent and active layer thickness in the Northern Hemisphere. J. Geophys. Res. Atmos. 2017, 122, 12285–12295. [Google Scholar] [CrossRef]
- Peng, X.; Zhang, T.; Frauenfeld, O.W.; Wang, K.; Luo, D.; Cao, B.; Su, H.; Jin, H.; Wu, Q. Spatiotemporal changes in active layer thickness under contemporary and projected climate in the Northern Hemisphere. J. Clim. 2018, 31, 251–266. [Google Scholar] [CrossRef]
- Ran, Y.; Li, X.; Cheng, G. Climate warming over the past half century has led to thermal degradation of permafrost on the Qinghai–Tibet Plateau. Cryosphere 2018, 12, 595–608. [Google Scholar] [CrossRef]
- Ma, W.; Mu, Y.; Wu, Q.; Sun, Z.; Liu, Y. Characteristics and mechanisms of embankment deformation along the Qinghai-Tibet Railway in permafrost regions. Cold Reg. Sci. Technol. 2011, 67, 178–186. [Google Scholar] [CrossRef]
- Peng, H.; Ma, W.; Mu, Y.; Jin, L.; Yuan, K. Degradation characteristics of permafrost under the effect of climate warming and engineering disturbance along the Qinghai-Tibet Highway. Nat. Hazards 2015, 75, 2589–2605. [Google Scholar] [CrossRef]
- Niu, F.; Luo, J.; Lin, Z.; Fang, J.; Liu, M. Thaw-induced slope failures and stability analyses in permafrost regions of the Qinghai-Tibet Plateau, China. Landslides 2015, 13, 55–65. [Google Scholar] [CrossRef]
- Chai, M.; Mu, Y.; Zhang, J.; Ma, W.; Liu, G.; Chen, J. Characteristics of asphalt pavement damage in degrading permafrost regions: Case study of the Qinghai–Tibet highway, China. J. Cold Reg. Eng. 2018, 32, 05018003. [Google Scholar] [CrossRef]
- Tapponnier, P.; Xu, Z.Q.; Roger, F.; Meyer, B.; Arnaud, N.; Wittlinger, G.; Yang, J.S. Oblique stepwise rise and growth of the Tibet Plateau. Science 2011, 294, 1671–1677. [Google Scholar] [CrossRef] [PubMed]
- Densmore, A.L.; Ellis, M.A.; Li, Y.; Zhou, R.; Hancock, G.S.; Richardson, N. Active tectonics of the Beichuan and Pengguan faults at the eastern margin of the Tibetan Plateau. Tectonics 2007, 26, 3–24. [Google Scholar] [CrossRef]
- Chen, N.; Tian, S.; Wang, F.; Shi, P.; Liu, L.; Xiao, M.; Liu, E.; Tang, W.; Rahman, M.; Somos-Valenzuela, M. Multi-wing butterfly effects on catastrophic rockslides. Geosci. Front. 2023, 14, 101627. [Google Scholar] [CrossRef]
- Zhao, B.; Su, L.; Xu, Q.; Li, W.; Xu, C.; Wang, Y. A review of recent earthquake-induced landslides on the Tibetan Plateau. Earth-Sci. Rev. 2023, 244, 104534. [Google Scholar] [CrossRef]
- Wen, Z.; Zhelezniak, M.; Wang, D.; Ma, W.; Wu, Q.; Yang, Z.; Zhirkov, A.; Gao, Q. Thermal interaction between a thermokarst lake and a nearby embankment in permafrost regions. Cold. Reg. Sci. Technol. 2018, 155, 214–224. [Google Scholar] [CrossRef]
- Wu, Q.; Zhao, H.; Zhang, Z.; Chen, J.; Liu, Y. Long-term role of cooling the underlying permafrost of the crushed rock structure embankment along the Qinghai–Xizang railway. Permafr. Periglac. Process. 2020, 31, 172–183. [Google Scholar] [CrossRef]
- Tai, B.; Wu, Q.; Zhang, Z.; Xu, X. Cooling performance and deformation behavior of crushed-rock embankments on the Qinghai-Tibet Railway in permafrost regions. Eng. Geol. 2020, 265, 105453. [Google Scholar] [CrossRef]
- Li, S.; Pei, W.; Wang, C.; Lai, Y.; Shi, L. Thermo-seismic performances of a unilateral two-phase closed thermosyphon (TPCT) embankment in earthquake-prone permafrost regions. Transp. Geotech. 2021, 27, 100456. [Google Scholar] [CrossRef]
- Zhong, W.; Zhang, T.; Chen, J.; Shang, J.; Wang, S.; Mu, C.; Fan, C. Seasonal deformation monitoring over thermokarst landforms using terrestrial laser scanning in Northeastern Qinghai-Tibetan Plateau. Int. J. Appl. Earth Obs. Geoinf. 2021, 103, 102501. [Google Scholar] [CrossRef]
- Yin, G.; Luo, J.; Niu, F.; Lin, Z.; Liu, M. Machine learning-based thermokarst landslide susceptibility modeling across the permafrost region on the Qinghai-Tibet Plateau. Landslides 2021, 18, 2639–2649. [Google Scholar] [CrossRef]
- Ni, J.; Wu, T.; Zhu, X.; Wu, X.; Pang, Q.; Zou, D.; Chen, J.; Li, R.; Hu, G.; Du, Y.; et al. Risk assessment of potential thaw settlement hazard in the permafrost regions of Qinghai-Tibet Plateau. Sci. Total Environ. 2021, 776, 145855. [Google Scholar] [CrossRef] [PubMed]
- Li, R.; Zhang, M.; Konstantinov, P.; Pei, W.; Tregubov, O.; Li, G. Permafrost degradation induced thaw settlement susceptibility research and potential risk analysis in the Qinghai-Tibet Plateau. Catena 2022, 214, 106239. [Google Scholar] [CrossRef]
- Reichenbach, P.; Rossi, M.; Malamud, B.D.; Mihir, M.; Guzzetti, F. A review of statistically-based landslide susceptibility models. Earth-Sci. Rev. 2018, 180, 60–91. [Google Scholar] [CrossRef]
- Merghadi, A.; Yunus, A.P.; Dou, J.; Whiteley, J.; ThaiPham, B.; Bui, D.T.; Avtar, R.; Abderrahmane, B. Machine learning methods for landslide susceptibility studies: A comparative overview of algorithm performance. Earth-Sci. Rev. 2020, 207, 103225. [Google Scholar] [CrossRef]
- Cheng, G.; Wang, Z.; Huang, C.; Yang, Y.; Hu, J.; Yan, X.; Tan, Y.; Liao, L.; Zhou, X.; Li, Y.; et al. Advances in Deep Learning Recognition of Landslides Based on Remote Sensing Images. Remote Sens. 2024, 16, 1787. [Google Scholar] [CrossRef]
- Mandal, K.; Saha, S.; Mandal, S. Applying deep learning and benchmark machine learning algorithms for landslide susceptibility modelling in Rorachu river basin of Sikkim Himalaya, India. Geosci. Front. 2021, 12, 101203. [Google Scholar] [CrossRef]
- Achu, A.L.; Aju, C.D.; Di Napoli, M.; Prakash, P.; Gopinath, G.; Shaji, E.; Chandra, V. Machine-learning based landslide susceptibility modelling with emphasis on uncertainty analysis. Geosci. Front. 2023, 14, 101657. [Google Scholar] [CrossRef]
- Guo, W.; Ye, J.; Liu, C.; Lv, Y.; Zeng, Q.; Huang, X. An approach for predicting landslide susceptibility and evaluating predisposing factors. Int. J. Appl. Earth Obs. Geoinf. 2024, 135, 104217. [Google Scholar] [CrossRef]
- Martinello, C.; Delchiaro, M.; Iacobucci, G.; Cappadonia, C.; Rotigliano, E.; Piacentini, D. Exploring the geomorphological adequacy of the landslide susceptibility maps: A test for different types of landslides in the Bidente river basin (northern Italy). Catena 2024, 238, 107835. [Google Scholar] [CrossRef]
- Chen, H.; Gao, X.; Wang, Q. Research progress and prospect of frozen soil engineering disasters. Cold Reg. Sci. Technol. 2023, 212, 103901. [Google Scholar] [CrossRef]
- Turner, A.; Annamalai, H. Climate change and the South Asian summer monsoon. Nat. Clim. Change 2012, 2, 587–595. [Google Scholar] [CrossRef]
- Biskaborn, B.K.; Smith, S.L.; Noetzli, J.; Matthes, H.; Vieira, G.; Streletskiy, D.A.; Schoeneich, P.; Romanovsky, V.E.; Lewkowicz, A.G.; Abramov, A. Permafrost is warming at a global scale. Nat. Commun. 2019, 10, 264. [Google Scholar] [CrossRef] [PubMed]
- Kang, S.; Xu, Y.; You, Q.; Flügel, W.; Pepin, N.; Yao, T. Review of climate and cryospheric change in the Tibetan Plateau. Environ. Res. Lett. 2010, 5, 015101. [Google Scholar] [CrossRef]
- Guo, D.; Wang, H. CMIP5 permafrost degradation projection: A comparison among different regions. J. Geophys. Res. Atmos. 2016, 121, 4499–4517. [Google Scholar] [CrossRef]
- Chen, J.I.; Zhao, L.; Sheng, Y.U.; Li, J.; Wu, X.-D.; Du, E.-J.; Liu, G.-Y.; Pang, Q.-Q. Some Characteristics of Permafrost and Its Distribution in the Gaize Area on the Qinghai—Tibet Plateau, China. Arct. Antarct. Alp. Res. 2016, 48, 395–409. [Google Scholar] [CrossRef]
- Guo, D.; Wang, H. Permafrost degradation and associated ground settlement estimation under 2 °C global warming. Clim. Dyn. 2016, 49, 2569–2583. [Google Scholar] [CrossRef]
- Lu, P.; Han, J.; Li, Z.; Xu, R.; Li, R.; Hao, T.; Qiao, G. Lake outburst accelerated permafrost degradation on Qinghai-Tibet Plateau. Remote Sens. Environ. 2020, 249, 112011. [Google Scholar] [CrossRef]
- Sun, Z.; Wang, Y.; Sun, Y.; Niu, F.; Guo, Y.; Gao, Z. Creep characteristics and process analyses of a thaw slump in the permafrost region of the Qinghai-Tibet Plateau, China. Geomorphology 2017, 293, 1–10. [Google Scholar] [CrossRef]
- Wang, Y.; Sun, Z.; Sun, Y. Effects of a thaw slump on active layer in permafrost regions with the comparison of effects of thermokarst lakes on the Qinghai–Tibet Plateau, China. Geoderma 2018, 314, 47–57. [Google Scholar] [CrossRef]
- Ran, Y.; Li, X.; Cheng, G.; Nan, Z.; Che, J.; Sheng, Y.; Wu, Q.; Jin, H.; Luo, D.; Tang, Z.; et al. Mapping the permafrost stability on the Tibetan Plateau for 2005–2015. Sci. China Earth Sci. 2021, 64, 62–79. [Google Scholar] [CrossRef]
- Luo, J.; Niu, F.; Lin, Z.; Liu, M.; Yin, G.; Gao, Z. Abrupt increase in thermokarst lakes on the central Tibetan Plateau over the last 50 years. Catena 2022, 217, 106497. [Google Scholar] [CrossRef]
- Luo, J.; Niu, F.; Lin, Z.; Liu, M.; Yin, G.; Gao, Z. Inventory and Frequency of Retrogressive Thaw Slumps in Permafrost Region of the Qinghai–Tibet Plateau. Geophys. Res. Lett. 2022, 49, e2022GL099829. [Google Scholar] [CrossRef]
- Hungr, O.; Leroueil, S.; Picarelli, L. The Varnes classification of landslide types, an update. Landslides 2013, 11, 167–194. [Google Scholar] [CrossRef]
- Yu, F.; Luo, J.; Niu, F.; Lin, Z.; Li, B.; Mu, Y.; Ju, X.; Liu, M.; Yin, G.; Gao, Z.; et al. Spatiotemporal dynamics of retrogressive thaw slumps on the Qinghai-Tibet Plateau: Integrating UAV-LiDAR and GPR. Landslides 2025, 22, 3351–3363. [Google Scholar] [CrossRef]
- Chen, W.; Pourghasemi, H.R.; Panahi, M.; Kornejady, A.; Wang, J.; Xie, X.; Cao, S. Spatial prediction of landslide susceptibility using an adaptive neuro-fuzzy inference system combined with frequency ratio, generalized additive model, and support vector machine techniques. Geomorphology 2017, 297, 69–85. [Google Scholar] [CrossRef]
- Zhao, Y.; Meng, X.; Qi, T.; Chen, G.; Li, Y.; Yue, D.; Qing, F. Modeling the Spatial Distribution of Debris Flows and Analysis of the Controlling Factors: A Machine Learning Approach. Remote Sens. 2021, 13, 4813. [Google Scholar] [CrossRef]
- Li, R.; Zhang, M.; Pei, W.; Melnikov, A.; Zhang, Z.; Li, G. Risk evaluation of thaw settlement using machine learning models for the Wudaoliang-Tuotuohe region, Qinghai-Tibet Plateau. Catena 2023, 220, 106700. [Google Scholar] [CrossRef]
- Hu, Q.; Hua, W.; Yang, K.; Ming, J.; Ma, P.; Zhao, Y.; Fan, G. An assessment of temperature simulations by CMIP6 climate models over the Tibetan Plateau and differences with CMIP5 climate models. Theor. Appl. Climatol. 2022, 148, 223–236. [Google Scholar] [CrossRef]
- Pan, X.; Zhang, L.; Huang, C. Future climate projection in Northwest China with RegCM4.6. Earth Space Sci. 2020, 7, e2019EA000819. [Google Scholar] [CrossRef]
- Zhao, B.; Huang, Y.; Zhang, C.; Wang, W.; Tan, K.; Du, R. Crustal deformation on the Chinese mainland during 1998–2014 based on GPS data. Geod. Geodyn. 2015, 6, 7–15. [Google Scholar] [CrossRef]
- Lundberg, S.; Nair, B.; Vavilala, M.; Horibe, M.; Eisses, M.; Adams, T.; Liston, D.; Low, D.; Newman, S.; Kim, J.; et al. Explainable machine-learning predictions for the prevention of hypoxaemia during surgery. Nat. Biomed. Eng. 2018, 8632, 749–760. [Google Scholar] [CrossRef]
- Wang, X.; Crosta, G.; Stead, D.; Qi, S.; Clague, J.; Sun, J.; Liu, H. Fault controls spatial variation of fracture density and rock mass strength within the Yarlung Tsangpo Fault damage zone (southern Tibet). Eng. Geol. 2020, 291, 106238. [Google Scholar] [CrossRef]
- Qi, T.; Meng, X.; Zhao, Y.; Su, X.; Chen, G.; Zeng, R.; Zhang, Y.; Li, Y.; Yue, D. Formation and distribution of landslides controlled by thrust-strike-slip fault zones and fluvial erosion in the Western Qinling Mountains, China. Eng. Geol. 2023, 323, 107209. [Google Scholar] [CrossRef]
- Gong, Y.; Song, J.; Wu, S.; Zhang, Y. Evolution of pore structure and analysis of freeze damage in granite during cyclic freeze-thaw using NMR technique. Eng. Geol. 2024, 335, 107545. [Google Scholar] [CrossRef]
- Troncone, A.; Conte, E.; Donato, A. Two and three-dimensional numerical analysis of the progressive failure that occurred in an excavation-induced landslide. Eng. Geol. 2014, 183, 265–275. [Google Scholar] [CrossRef]
- Cao, C.; Zhu, K.; Xu, P.; Shan, B.; Yang, G.; Song, S. Refined landslide susceptibility analysis based on InSAR technology and UAV multi-source data. J. Clean. Prod. 2022, 368, 133146. [Google Scholar] [CrossRef]
- Qing, F.; Zhao, Y.; Meng, X.; Su, X.; Qi, T.; Yue, D. Application of Machine Learning to Debris Flow Susceptibility Mapping along the China–Pakistan Karakoram Highway. Remote Sens. 2020, 12, 2933. [Google Scholar] [CrossRef]
- Sun, Y.; Ge, Y.; Chen, X.; Zeng, Z.; Tang, Q.; Liang, X.; Yang, L. Analysis of the trigger conditions and activity trend in debris flow along Sichuan-Tibet traffic corridor (Xinduqiao-Changdu section) under environmental changes. Bull. Eng. Geol. Environ. 2024, 83, 189. [Google Scholar] [CrossRef]
- Fan, X.; Li, W.; Wu, X.; Yao, M.; Niu, F.; Lin, Z. Heterogeneity of Surface Heat Exchange of Slopes and Potential Drivers of the Initiation of Thaw Slump, Qinghai-Tibet Plateau. Int. J. Disaster. Risk. Sci. 2023, 14, 549–565. [Google Scholar] [CrossRef]
- Ye, C.; Wei, R.; Ge, Y.; Li, Y.; Junior, J.; Li, J. GIS-based spatial prediction of landslide using road factors and random forest for Sichuan-Tibet Highway. J. Mt. Sci. 2022, 19, 461–476. [Google Scholar] [CrossRef]
- You, Y.; Wang, D.; Liu, J.; Sun, H.; Wang, Z.; Zhang, W.; Yang, H. Assessment of the distribution and hazard tendency of debris flows along the Chengdu–Changdu section of the Sichuan–Tibet traffic corridor. Bull. Eng. Geol. Environ. 2023, 82, 253. [Google Scholar] [CrossRef]
- Liu, D.; Ling, K.; Guo, C.; He, P.; He, M.; Sun, J.; Yan, X. Experimental simulation study of rockburst characteristics of Sichuan–Tibet granite: A case study of the Zheduoshan tunnel. Eng. Geol. 2022, 305, 106701. [Google Scholar] [CrossRef]
- Chen, Z.; Chang, R.; Pei, X.; Yu, Z.; Guo, H.; He, Z.; Zhao, W.; Zhang, Q.; Chen, Y. Tunnel geothermal disaster susceptibility evaluation based on interpretable ensemble learning: A case study in Ya’an–Changdu section of the Sichuan–Tibet traffic corridor. Eng. Geol. 2023, 313, 106985. [Google Scholar] [CrossRef]
- van Westen, C.; Castellanos, E.; Kuriakose, S. Spatial data for landslide susceptibility, hazard, and vulnerability assessment: An overview. Eng. Geol. 2008, 102, 112–131. [Google Scholar] [CrossRef]
- Dou, J.; Yunus, A.P.; Merghadi, A.; Shirzadi, A.; Nguyen, H.; Hussain, Y.; Avtar, R.; Chen, Y.; Pham, B.T.; Yamagishi, H. Different sampling strategies for predicting landslide susceptibilities are deemed less consequential with deep learning. Sci. Total Environ. 2020, 720, 137320. [Google Scholar] [CrossRef]
- Pohjankukka, J.; Pahikkala, T.; Nevalainen, P.; Heikkonen, J. Estimating the prediction performance of spatial models via spatial k-fold cross validation. Int. J. Geogr. Inf. Sci. 2017, 31, 2001–2019. [Google Scholar] [CrossRef]
- Roberts, D.R.; Bahn, V.; Ciuti, S.; Boyce, M.S.; Elith, J.; Guillera-Arroita, G.; Hauenstein, S.; Lahoz-Monfort, J.J.; Schröder, B.; Thuiller, W.; et al. Cross-validation strategies for data with temporal, spatial, hierarchical, or phylogenetic structure. Ecography 2017, 40, 913–929. [Google Scholar] [CrossRef]
- Yalcin, A.; Reis, S.; Aydinoglu, A.; Yomralioglu, T. A GIS-based comparative study of frequency ratio, analytical hierarchy process, bivariate statistics and logistics regression methods for landslide susceptibility mapping in Trabzon, NE Turkey. Catena 2011, 85, 274–287. [Google Scholar] [CrossRef]
- Chen, W.; Chai, H.; Sun, X.; Wang, Q.; Ding, X.; Hong, H. A GIS-based comparative study of frequency ratio, statistical index and weights-of-evidence models in landslide susceptibility mapping. Arab. J. Geosci. 2016, 9, 204. [Google Scholar] [CrossRef]
- Lei, S.; Chen, H.; Bian, Z.; Liu, Z. Evaluation of integrating topographic wetness index with backscattering coefficient of TerraSAR-X image for soil moisture estimation in a mountainous region. Ecol. Ind. 2016, 61, 624–633. [Google Scholar] [CrossRef]
- Pourali, S.; Arrowsmith, C.; Chrisman, N.; Matkan, A.; Mitchell, D. Topography wetness index application in flood-risk-based land use planning. Appl. Spatial Anal. Policy 2016, 9, 39–54. [Google Scholar] [CrossRef]
- Pham, B.T.; Tien Bui, D.; Prakash, I.; Dholakia, M. Hybrid integration of Multilayer Perceptron Neural Networks and machine learning ensembles for landslide susceptibility assessment at Himalayan area (India) using GIS. Catena 2017, 149, 52–63. [Google Scholar] [CrossRef]
- Zhou, W.; Tang, C.; Van Asch, T.W.J.; Chang, M. A rapid method to identify the potential of debris flow development induced by rainfall in the catchments of the Wenchuan earthquake area. Landslides 2016, 13, 1243–1259. [Google Scholar] [CrossRef]
- Hong, H.; Pourghasemi, H.; Pourtaghi, Z. Landslide susceptibility assessment in Lianhua County (China): A comparison between a random forest data mining technique and bivariate and multivariate statistical models. Geomorphology 2016, 259, 105–118. [Google Scholar] [CrossRef]
- Pourghasemi, H.R.; Kerle, N. Random forests and evidential belief function-based landslide susceptibility assessment in Western Mazandaran Province, Iran. Environ. Earth Sci. 2016, 75, 185. [Google Scholar] [CrossRef]
- Cui, S.; Wu, H.; Pei, X.; Yang, Q.; Huang, R.; Guo, B. Characterizing the spatial distribution, frequency, geomorphological and geological controls on landslides triggered by the 1933 Mw 7.3 Diexi Earthquake, Sichuan, China. Geomorphology 2022, 403, 108177. [Google Scholar] [CrossRef]
- Wang, S.; Meng, X.; Chen, G.; Guo, P.; Xiong, M.; Zeng, R. Effects of vegetation on debris flow mitigation: A case study from Gansu province, China. Geomorphology 2017, 282, 64–73. [Google Scholar] [CrossRef]
- Cao, C.; Zhang, W.; Chen, J.; Shan, B.; Song, S.; Zhan, J. Quantitative estimation of debris flow source materials by integrating multi-source data: A case study. Eng. Geol. 2021, 291, 106222. [Google Scholar] [CrossRef]
- Wang, P.; de Jager, J.; Nauta, A.; van Huissteden, J.; Trofim, M.C.; Limpens, J. Exploring near-surface ground ice distribution in patterned-ground tundra: Correlations with topography, soil and vegetation. Plant Soil 2019, 444, 251–265. [Google Scholar] [CrossRef]
- Chen, G.; Meng, X.; Tan, L.; Zhang, F.; Qiao, L. Comparison and combination of different models for optimal landslide susceptibility zonation. Q. J. Eng. Geol. Hydrogeol. 2014, 47, 283–306. [Google Scholar] [CrossRef]
- Wen, Z.; Niu, F.; Yu, Q.; Wang, D.; Feng, W.; Zheng, J. The role of rainfall in the thermal-moisture dynamics of the active layer at Beiluhe of Qinghai-Tibetan plateau. Environ. Earth Sci. 2014, 71, 1195–1204. [Google Scholar] [CrossRef]
- Karjalainen, O.; Aalto, J.; Luoto, M.; Westermann, S.; Romanovsky, V.E.; Nelson, F.E.; Etzelmüller, B.; Hjort, J. Circumpolar permafrost maps and geohazard indices for near-future infrastructure risk assessments. Sci. Data 2019, 6, 190037. [Google Scholar] [CrossRef] [PubMed]
- Nasiri Aghdam, I.; Varzandeh, M.H.M.; Pradhan, B. Landslide susceptibility mapping using an ensemble statistical index (Wi) and adaptive neuro-fuzzy inference system (ANFIS) model at Alborz Mountains (Iran). Environ. Earth Sci. 2016, 75, 553. [Google Scholar] [CrossRef]
- Leventhal, A.R.; Kotze, G.P. Landslide susceptibility and hazard mapping in Australia for land-use planning—with reference to challenges in metropolitan suburbia. Eng. Geol. 2008, 102, 238–250. [Google Scholar] [CrossRef]
- Reichenbach, P.; Busca, C.; Mondini, A.C.; Rossi, M. Influence of land use change on landslide susceptibility zonation: The Briga catchment test site (Messina, Italy). Environ. Manag. 2014, 54, 1372–1384. [Google Scholar] [CrossRef]
- Daanen, R.P.; Ingeman-Nielsen, T.; Marchenko, S.S.; Romanovsky, V.E.; Foged, N.; Stendel, M.; Christensen, J.H.; Hornbech Svendsen, K. Permafrost degradation risk zone assessment using simulation models. Cryosphere 2011, 5, 1043–1056. [Google Scholar] [CrossRef]
- Xu, X.; Fu, L. Determine the Maximum Depth of Seasonal Thawing of Permafrost Based on the Revised Stephen Formula, Qinghai–Tibet Permafrost Research; Science Press: Beijing, China, 1983; pp. 165–168. [Google Scholar]
- Zhang, Z.; Wu, Q. Thermal hazards zonation and permafrost change over the Qinghai–Tibet Plateau. Nat. Hazards 2012, 61, 403–423. [Google Scholar] [CrossRef]
- Zhao, L.; Zou, D.; Hu, G.; Wu, T.; Du, E.; Liu, G.; Xiao, Y.; Li, R.; Pang, Q.; Qiao, Y.; et al. A synthesis dataset of permafrost thermal state for the Qinghai–Tibet (Xizang) Plateau, China. Earth Syst. Sci. Data 2021, 13, 4207–4218. [Google Scholar] [CrossRef]
- Guo, D.; Wang, H. Simulation of permafrost and seasonally frozen ground conditions on the Tibetan Plateau, 1981–2010. J. Geophys. Res. Atmos. 2013, 118, 5216–5230. [Google Scholar] [CrossRef]
- Wang, D.; Wu, T.; Zhao, L.; Mu, C.; Li, R.; Wei, X.; Hu, G.; Zou, D.; Zhu, X.; Chen, J.; et al. A 1 km resolution soil organic carbon dataset for frozen ground in the Third Pole. Earth Syst. Sci. Data 2021, 13, 3453–3465. [Google Scholar] [CrossRef]
- Guo, D.; Sun, J. Permafrost Thaw and Associated Settlement Hazard Onset Timing over the Qinghai-Tibet Engineering Corridor. Int. J. Disaster Risk Sci. 2015, 6, 347–358. [Google Scholar] [CrossRef]
- Hall, M.A.; Holmes, G. Benchmarking attribute selection techniques for discrete class data mining. IEEE Trans. Knowl. Data Eng. 2003, 15, 1437–1447. [Google Scholar] [CrossRef]
- Cortes, C.; Vapnik, V. Support-vector networks. Mach. Learn. 1995, 20, 273–297. [Google Scholar] [CrossRef] [PubMed]
- Allion, P.D. Logistic Regression Using SAS System: Theory and Application; Wiley Interscience: New York, NY, USA, 2001; p. 288. [Google Scholar]
- Atkinson, P.M.; Massari, R. Generalised linear modelling of susceptibility to landsliding in the central Apennines, Italy. Comput. Geosci. 1998, 24, 373–385. [Google Scholar] [CrossRef]
- Bui, D.; Ngo, P.; Pham, T.; Jaafari, A.; Minh, N.; Hoa, P.; Samui, P. A novel hybrid approach based on a swarm intelligence optimized extreme learning machine for flash flood susceptibility mapping. Catena 2019, 179, 184–196. [Google Scholar] [CrossRef]
Disclaimer/Publisher’s Note: The statements, opinions and data contained in all publications are solely those of the individual author(s) and contributor(s) and not of MDPI and/or the editor(s). MDPI and/or the editor(s) disclaim responsibility for any injury to people or property resulting from any ideas, methods, instructions or products referred to in the content. |
© 2025 by the authors. Licensee MDPI, Basel, Switzerland. This article is an open access article distributed under the terms and conditions of the Creative Commons Attribution (CC BY) license (https://creativecommons.org/licenses/by/4.0/).