Article

WetSegNet: An Edge-Guided Multi-Scale Feature Interaction Network for Wetland Classification

1
Hunan Agricultural Forestal and Industrial Prospective Design Institute Co., Ltd., Changsha 410007, China
2
Hunan Provincial Key Laboratory of Forestry Remote Sensing Based Big Data & Ecological Security, Central South University of Forestry & Technology, Changsha 410004, China
*
Author to whom correspondence should be addressed.
Remote Sens. 2025, 17(19), 3330; https://doi.org/10.3390/rs17193330
Submission received: 14 August 2025 / Revised: 24 September 2025 / Accepted: 26 September 2025 / Published: 29 September 2025

Abstract

Highlights

What are the main findings?
  • The proposed WetSegNet model significantly improves wetland classification accuracy, achieving an overall accuracy of 90.81% and a Kappa coefficient of 0.88 on GF-2 imagery from Dongting Lake wetlands.
  • It attains classification accuracies of over 90% for key habitat types such as water, sedge, and reeds, outperforming the U-Net baseline by 3.3% in overall accuracy and 0.05 in Kappa.
What is the implication of the main finding?
  • The integration of CNN and Swin Transformer within an edge-guided multi-scale network effectively combines local texture and global semantic information, enhancing the model’s ability to handle complex wetland landscapes.

Abstract

Wetlands play a crucial role in climate regulation, pollutant filtration, and biodiversity conservation. Accurate wetland classification through high-resolution remote sensing imagery is pivotal for the scientific management, ecological monitoring, and sustainable development of these ecosystems. However, the intricate spatial details in such imagery pose significant challenges to conventional interpretation techniques, necessitating precise boundary extraction and multi-scale contextual modeling. In this study, we propose WetSegNet, an edge-guided Multi-Scale Feature Interaction network for wetland classification, which integrates a convolutional neural network (CNN) and Swin Transformer within a U-Net architecture to synergize local texture perception and global semantic comprehension. Specifically, the framework incorporates two novel components: (1) a Multi-Scale Feature Interaction (MFI) module employing cross-attention mechanisms to mitigate semantic discrepancies between encoder–decoder features, and (2) a Multi-Feature Fusion (MFF) module that hierarchically enhances boundary delineation through edge-guided spatial attention (EGA). Experimental validation on GF-2 satellite imagery of Dongting Lake wetlands demonstrates that WetSegNet achieves state-of-the-art performance, with an overall accuracy (OA) of 90.81% and a Kappa coefficient of 0.88. Notably, it achieves classification accuracies exceeding 90% for water, sedge, and reed habitats, surpassing the baseline U-Net by 3.3% in overall accuracy and 0.05 in Kappa. The proposed model effectively addresses heterogeneous wetland classification challenges, validating its capability to reconcile local–global feature representation.

1. Introduction

Wetlands, as some of Earth’s most biodiverse and ecologically critical ecosystems, not only play essential roles in environmental conservation and policymaking [1,2,3], biodiversity conservation, and sustainable ecosystem management, but also serve as a key component in remote sensing research. Studies on wetland ecology and management have underscored the urgent need for accurate classification and monitoring to support habitat conservation, water resource regulation, and policy formulation [4]. Conventional field surveys, while valuable, suffer from high costs and time constraints, and frequently lack the temporal resolution required for dynamic wetland management [5]. Modern remote sensing technologies address these limitations through high-resolution optical systems that reveal intricate landscape details, surpassing medium/low-resolution alternatives. While such enhanced spatial granularity improves wetland mapping precision, it also introduces complexities in image analysis workflows [3,6,7].
Traditional machine learning methods, such as Random Forest (RF) and Support Vector Machine (SVM), have also been widely applied in wetland classification tasks. Random Forest is widely adopted due to its robustness to noise and ability to handle high-dimensional data, and it has achieved encouraging results in land cover mapping and wetland mapping [8,9]. Similarly, Support Vector Machine, by maximizing the separability between different classes, performs excellently in remote sensing classification, and plays a key role especially in wetland vegetation and habitat mapping studies [10]. In addition, tree-based ensemble methods such as Extreme Gradient Boosting (XGB) and Extra-Trees (ET) also show good performance in the field of wetland classification [11]: Conventional Extreme Gradient Boosting (CXGB) has higher overall accuracy and better performance than Conventional Random Forest (CRF); when Extra-Trees is integrated into the deep forest framework (DF-ET), the wetland classification model can improve efficiency and shorten training time while ensuring classification accuracy. These traditional classifiers usually rely on manually designed spectral features and texture features, which limits their ability to fully utilize the spatial correlation and complex boundary information contained in high-resolution remote sensing images. With the popularization of ultra-high-resolution satellite data, deep learning methods—especially Convolutional Neural Networks (CNN) and Transformer models—have effectively broken through the limitations of traditional methods by automatically learning hierarchical feature representations and capturing local and global contextual information. Therefore, Deep Learning holds potential in the field of wetland classification.
Deep learning has revolutionized computer vision and demonstrated exceptional potential in wetland classification through remote sensing. Convolutional neural network (CNN)-based models now dominate this field [12,13,14,15]. The UNet architecture [16], a seminal semantic segmentation network, excels in medical and remote sensing applications by bridging encoder–decoder features to recover the spatial details lost during down-sampling [17]. Despite these successes, CNN-based UNet variants face two key limitations in wetland analysis [18,19]: First, conventional convolution operations with limited receptive fields prioritize local patterns over global contexts, hindering wetland feature extraction [20,21,22,23]. Second, simplistic encoder–decoder concatenation in standard skip connections does not adequately addresses multi-scale semantic discrepancies, particularly for heterogeneous wetland environments [24,25].
The Transformer architecture has emerged as a powerful tool for remote sensing semantic segmentation, leveraging self-attention mechanisms to overcome the limited global perception of convolutional neural networks [26]. Specifically, Swin Transformer [27]—a hierarchical visual optimization variant—demonstrates particular efficacy in processing high-resolution imagery [28,29,30]. Hybrid approaches integrating CNNs and Transformers show promising results. For instance, Gao et al. [12] developed a multi-stage framework combining the local feature extraction of CNNs with Transformer’s ability to model the global context across semantic scales. He et al. [31] further enhanced this integration by embedding Swin Transformer blocks into the U-Net architecture, effectively capturing both detailed textures and landscape-level patterns. These hybrid systems merge CNNs’ localized processing with Transformers’ long-range dependency modeling, enabling precise feature distribution analysis in complex environments and improving the segmentation accuracy.
However, most current remote sensing image segmentation architectures combining CNNs and Transformers almost always feature a simple parallel or tandem structure in the encoder, subsequently simply splicing features of different scales after using the skip connection of U-Net. This ignores the semantic gap before feature fusion and leads to ineffective interaction with features extracted at different stages [32]. In addition, high-resolution remote sensing images of wetlands usually have complex geometries and boundaries [33] due to features such as the intricate shapes of water bodies (e.g., lakes, rivers). In order to compensate for the lack of pure CNNs in global modeling and to narrow the semantic gap between the encoder and decoder, we developed a cross-attention mechanism for Transformers [34] to interact with different feature extraction phases on the basis of hybrid CNNs and Swin Transformer. In addition, we enhanced the shape feature information in wetland remote sensing image segmentation based on edge gray maps, proposing an edge-guided multi-scale information interaction model.
Despite the remarkable success of advanced networks like U-Net++ [33], DeepLabv3+ and HRNet in semantic segmentation, they still face significant limitations when applied to wetland classification. While skip connections were improved in U-Net++, semantic inconsistencies between multi-scale features were not explicitly addressed. DeepLabv3+ employs dilated convolutions for context aggregation but struggles to preserve fine boundary details in high-resolution wetland images, while HRNet maintains high-resolution representations but lacks explicit mechanisms to enhance edge features, resulting in a poor performance in the presence of heterogeneous wetland boundaries. WetSegNet features two custom modules: (1) A Multi-Scale Feature Interaction (MFI) module, which explicitly reduces the semantic gaps between encoder and decoder features through cross-attention, and (2) a Multi-Feature Fusion (MFF) module, in which edge-guided spatial attention is integrated to enhance boundary delineation. These innovations directly address the problems of boundary blurring and category similarity that are unique to wetland ecosystems, distinguishing WetSegNet from existing architectures.
The contributions of the study are as follows: (1) A hybrid encoder combining Swin Transformer and ResNet enhances global context-awareness capability and local feature capturing. (2) The Multi-Scale Feature Interaction (MFI) module achieves effective multi-level feature fusion and reduces the semantic gaps in jump connections. (3) The edge features are integrated via the Multi-Feature Fusion (MFF) module to improve the classification accuracy. The proposed model is validated on wetland images from Dongting Lake.

2. Materials

2.1. Study Area

Dongting Lake wetland is one of the first internationally recognized wetlands in China and is an important ecosystem in the middle and lower reaches of the Yangtze River. Geographically located between 28°30′–29°31′N and 110°40′–113°10′E, it is one of the largest freshwater lake wetlands in China [35]. The Dongting Lake wetland is invaluable for maintaining biodiversity, protecting rare species, and mitigating floods, with a variety of water features including rivers/lakes, sedges, and reeds (Figure 1). Studies have shown that in recent years, the lake ecosystem and natural resources in the Dongting Lake region have faced excessive development pressures, triggering a series of prominent ecological and environmental issues such as wetland shrinkage, forest degradation, and declining soil and water conservation capacity. Land use changes in this area are primarily concentrated in the surrounding urban areas and lakeshore plains, characterized by a continuous reduction in cultivated land area and a persistent intensification of land use [36]. Therefore, conducting precise classification and dynamic monitoring of regional land cover can help investigate the mechanisms by which land use changes impact wetland ecosystem services. This is crucial for scientifically assessing regional ecological health and formulating targeted sustainable management strategies.

2.2. Data Sources

GF-2 satellite imagery (acquired in April 2020) covering Dongting Lake wetlands was analyzed in this study. As a key component of China’s High-Resolution Earth Observation System, GF-2 delivers 0.8 m panchromatic and 2 m multispectral data, providing optimal inputs for automated wetland mapping [37]. The preprocessing pipeline comprised five sequential steps: (1) ENVI 5.3-based radiometric calibration and atmospheric correction of multispectral bands to minimize sensor and atmospheric distortions; (2) relative radiometric normalization of panchromatic data; (3) geometric registration aligning multispectral and panchromatic datasets; (4) pan-sharpening fusion combining 0.8 m spatial detail with multispectral spectral information to generate 1 m resolution imagery; and (5) mosaic composition to ensure seamless coverage across the study area.
Based on geomorphological characteristics, six primary land cover types were identified in Dongting Lake wetlands: reeds, water, sedges, mudflats, farmland, and forests (Figure 2). To ensure the deep learning model had a robust and diverse training dataset, additional imagery from areas surrounding Dongting Lake was selected for annotation. eCognition9.0, a powerful remote sensing image analysis tool, was utilized in the annotation process, which enabled efficient and precise labeling of large-scale datasets. The visual interpretation results were incorporated into the process, and manual corrections were conducted to ensure the accuracy and quality of the annotations. These meticulously prepared samples provided a solid foundation for model training and validation, ensuring reliable classification outcomes.

3. Methodology

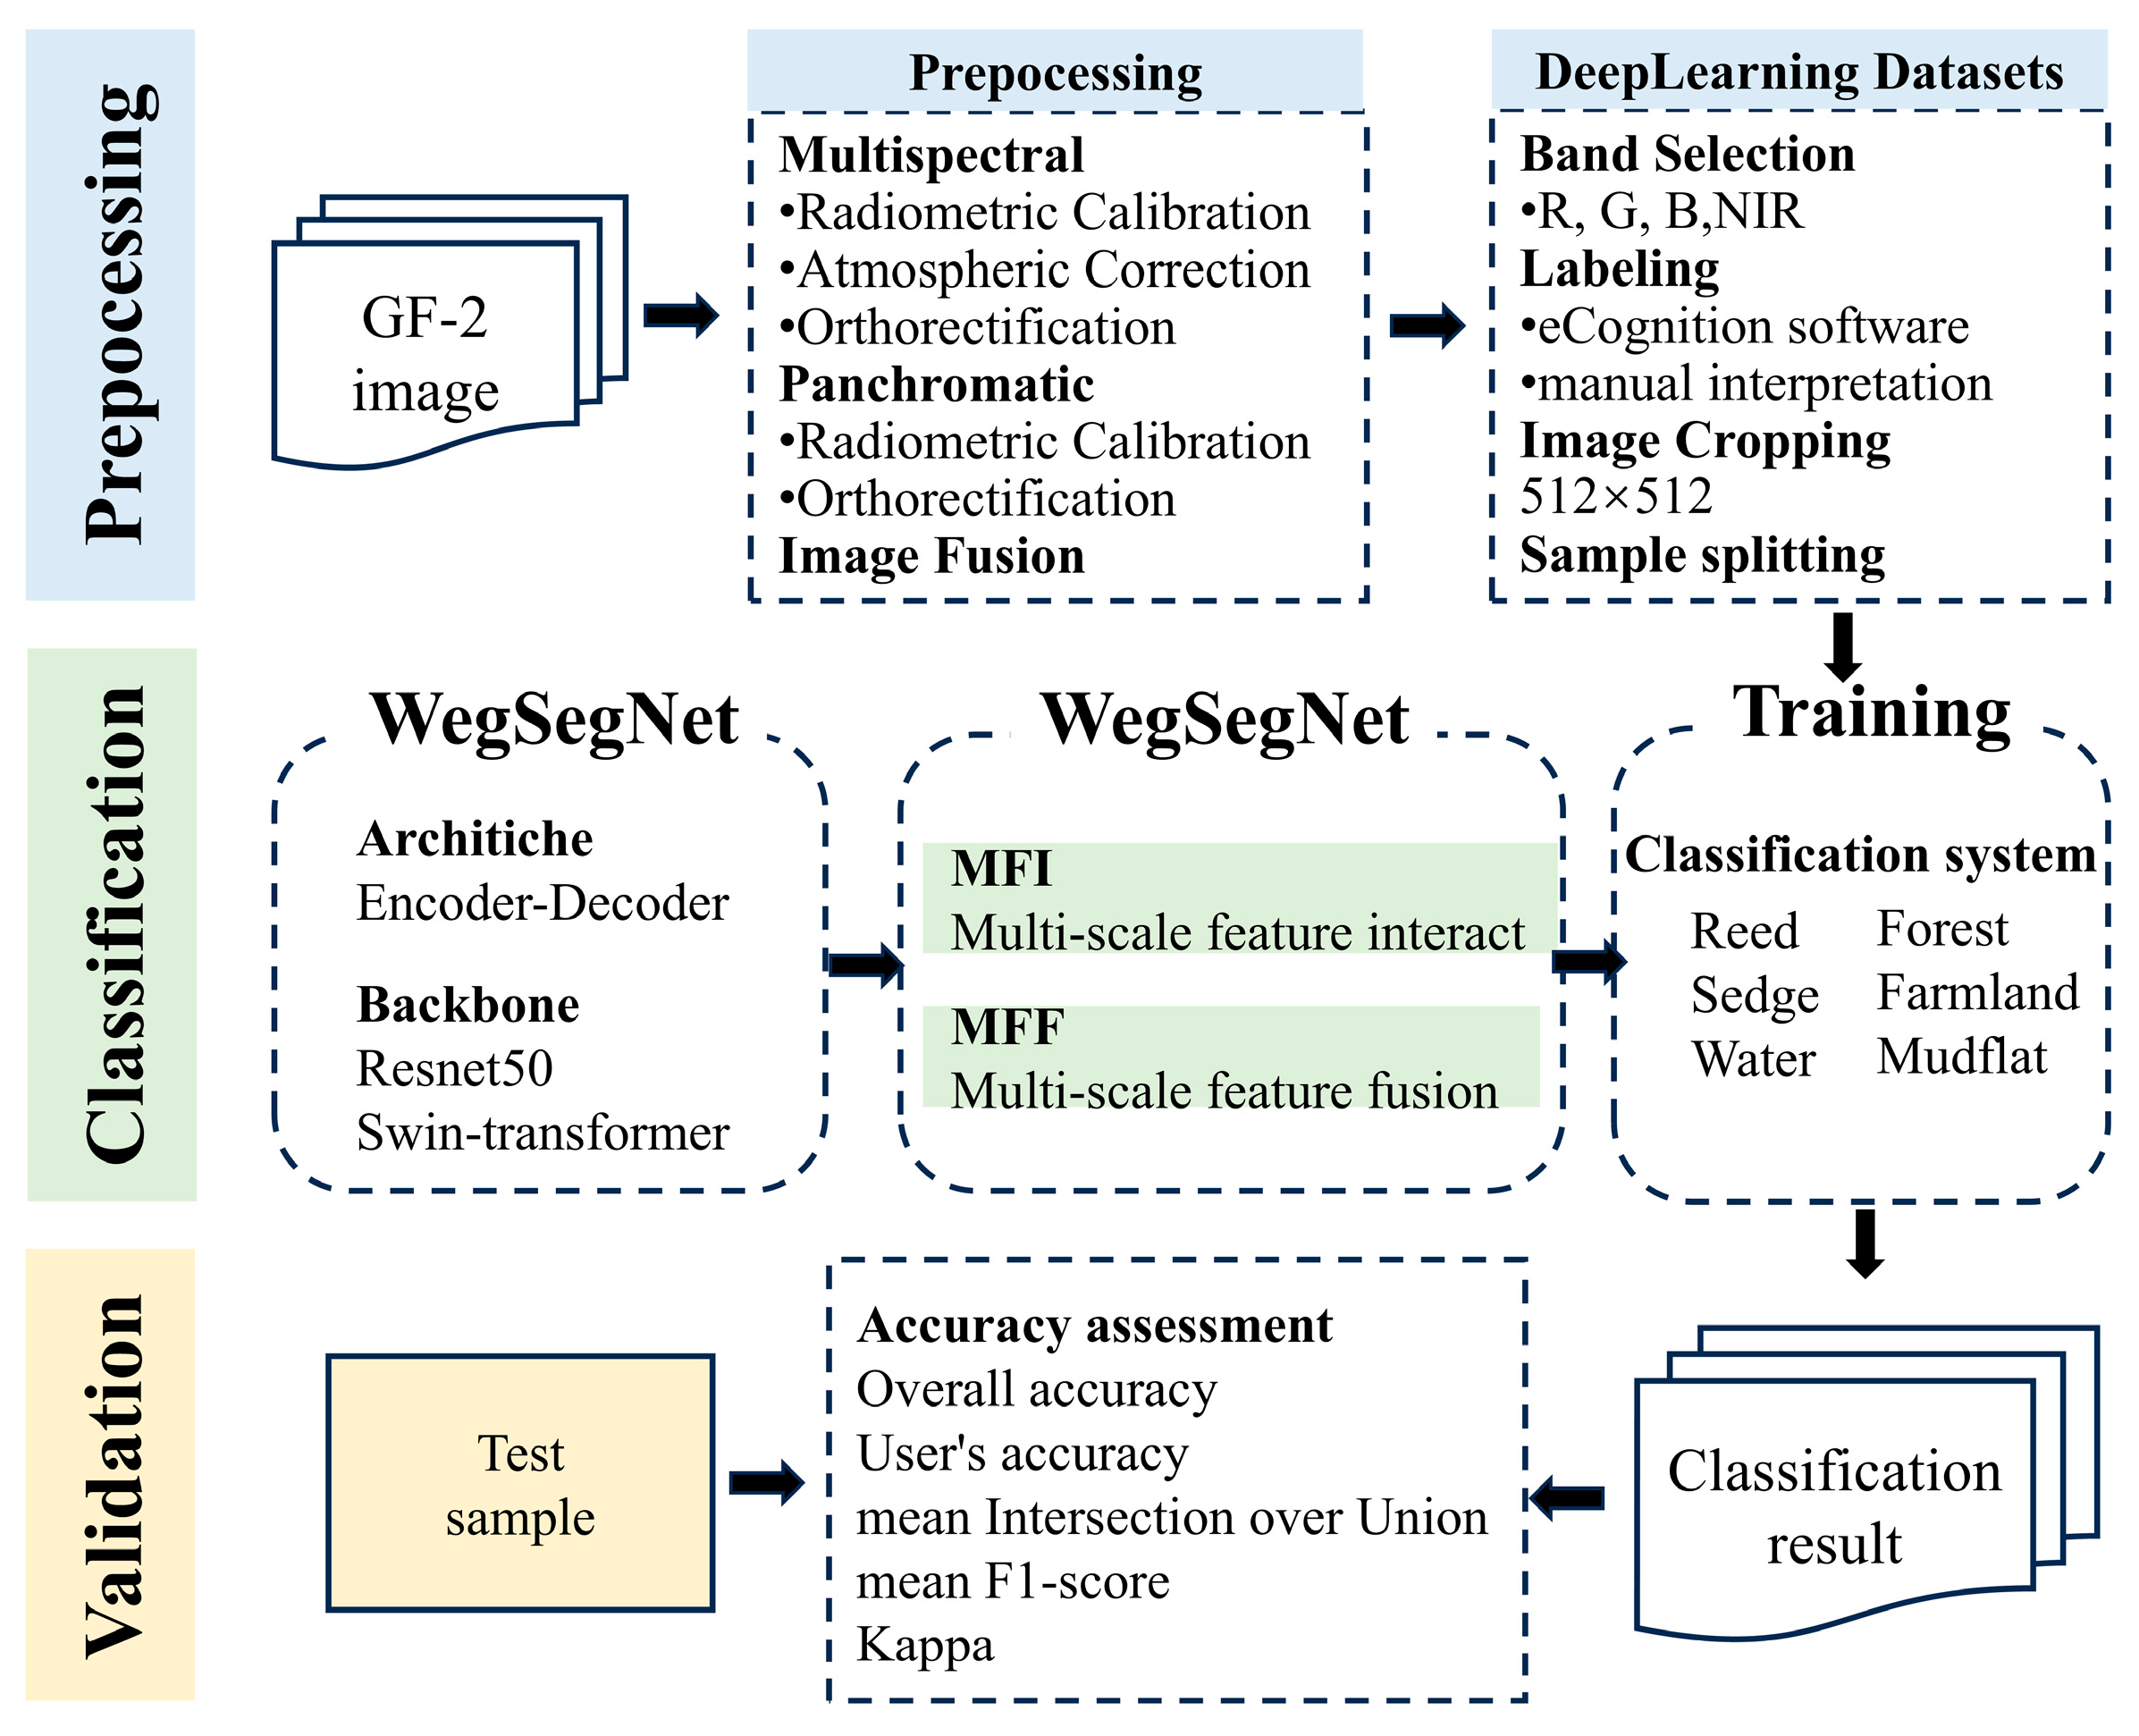
The implementation process of the technical method used in our study is shown in Figure 3. Firstly, GF-2 images were obtained by preprocessing and converted into a dataset suitable for deep learning training. Secondly, the main structures of the model training and backbone networks were determined, and WetSegNet was constructed to improve the model. The latter was trained using the training samples. Finally, the model was tested based on the training results.

3.1. Framework and Design of WetSegNet

The edge-guided multi-scale information interaction-based wetland classification network, shown in Figure 4, features a structure similar to U-Net. WetSegNet has an encoder–decoder design and can effectively fuse high- and low-level features through skip connections. Multiple advanced components are integrated into the network to address the challenges of wetland classification. First, it employs a residual module for efficient feature extraction, ensuring robust and detailed representation of spatial features. Additionally, the Swin Transformer module is incorporated to enhance the capture of global contextual information, addressing the limitations of conventional convolutional operations in modeling long-term dependencies.
To further refine feature representation, WetSegNet presents a Multi-Feature Fusion (MFF) module, which facilitates the interaction of multi-scale feature information. This design mitigates the semantic gap commonly arising from the direct connection between encoder and decoder features, thereby improving the consistency and accuracy of feature integration. Moreover, the Canny operator is applied to detect edges within the original images, extracting critical wetland boundary features. These edge features are subsequently refined and amplified using spatial attention mechanisms, which ensures that the model places greater emphasis on boundary details.
For a high-resolution wetland remote sensing image X R H × W × C , the low-level feature F c ( H 2 , W 2 , 32 ) is first extracted via standard convolution and group normalization, while the edge map F e ( H , W , 1 ) is extracted by the Canny algorithm. Subsequently, F c ( H 2 , W 2 , 32 ) is subjected to deeper feature extraction using four residual modules to obtain the feature map F i ( H 2 ( i + 1 ) , H 2 ( i + 1 ) , 2 ( i + 6 ) ) , where i = 1 , 2 , 3 , 4 . The feature map F i extracted by four residual modules will be passed through the MFI module for information interaction to obtain M i , where i = 1 , 2 , 3 , 4 , in order to eliminate the semantic gaps generated in the jump-connection phase. In order to enhance the model’s ability to capture long-distance dependencies and global contextual information, in the last stage of the encoder, F 4 is passed through a Swin Transformer module to obtain F s ( H 64 , H 64 , 2048 ) , which further improves the model’s ability to capture high-level semantic information as the network deepens.
Next, F s enters the encoder, where it undergoes feature fusion, where the features M i are processed by the Multi-Scale Feature Interaction (MFI) module. The fused features are then up-sampled, while the number of channels is halved using a convolutional layer and the resolution of the feature map is expanded to twice its original size to gradually recover spatial information. This process is repeated three times, progressively restoring both image details and semantic information, resulting in the final feature map F h ( H 4 , W 4 , 128 ) . For F h , F c , and the edge feature map F e , we apply the Multi-Feature Fusion (MFF) module for feature fusion. Specifically, edge features F e are injected into F c and an attention mechanism is employed to highlight important spatial information, enhancing the model’s sensitivity to fine boundary details. Finally, the fused features are combined with F c to obtain F o ( 32 , H , W ) . In the final stage of the network, convolutional layers and bilinear interpolation are used to up-sample the feature map and generate the wetland classification prediction mask S e g ( c l a s s e s , H , W ) , achieving high-resolution wetland classification.

3.2. Components of WetSegNet

3.2.1. ResNet

ResNet [38] is a classical CNN architecture for semantic segmentation, with its key component being the residual unit designed to address the challenges faced when training very deep networks. This unit was introduced to alleviate the gradient vanishing problem, enabling the successful training of deep networks with hundreds or even thousands of layers. It also features a mechanism for skip-connecting. The structure of the residual unit is shown in Figure 5, and the output of the residual unit is computed as:
Y = F ( x ) + x
where x is the input to the residual unit, and F ( x ) is a function consisting of an activation function and a normalization operation. The jump connection of the residual unit allows the gradient to flow directly through the shortcut path, which solves the problem of gradient vanishing in the backpropagation process.

3.2.2. Swin Transformer

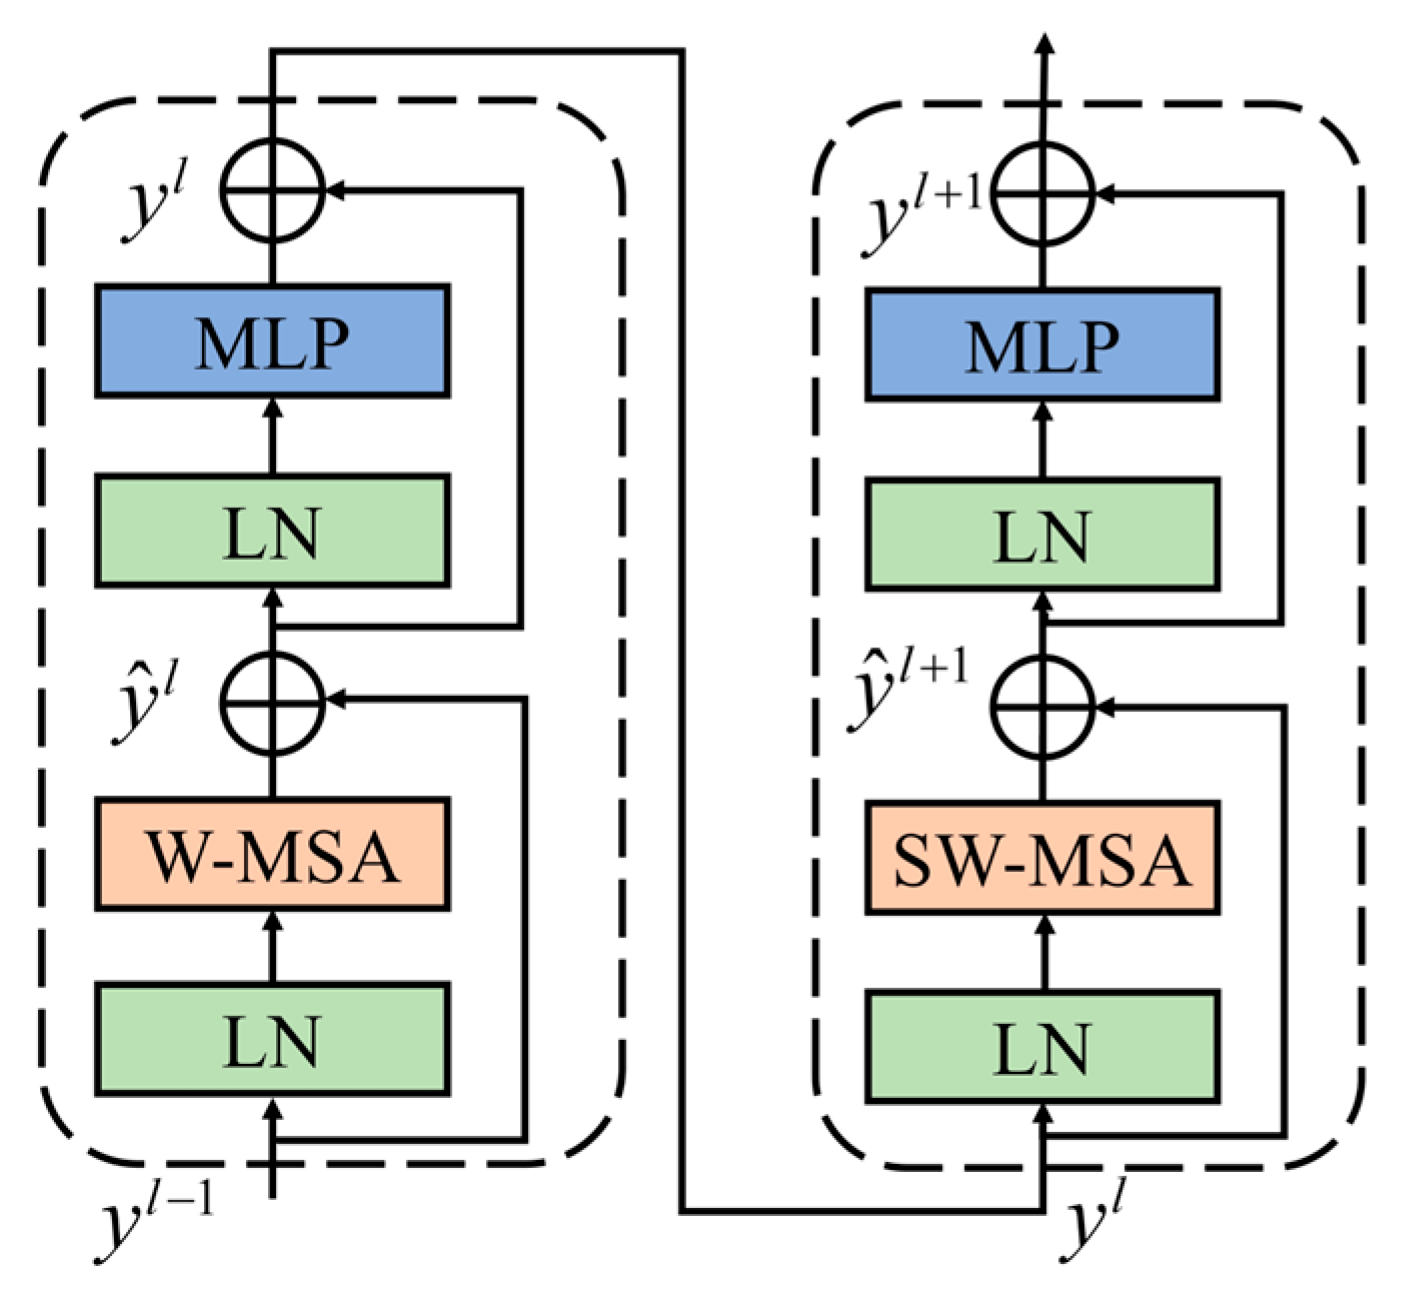
The Swin Transformer is a hierarchical Transformer structure designed for the visual domain. The Swin Transformer Block is a key component of the Swin Transformer [23] consisting of a W-MSA block, Layer Normalization (LN), and a Multi-Layer Perceptron (MLP) layer, as shown in Figure 6.
The W-MSA block plays an important role in the Swin Transformer module by capturing long-range dependencies in sequence data. It uses a self-attention mechanism to compute the correlation between each position and other positions in the input sequence, thereby modeling the relationships between positions. However, calculating global dependencies across the entire sequence in long sequences increases both the computation and storage costs. To mitigate this issue, a fixed-size window was introduced in W-MSA that only calculates the correlation between positions within the same window, reducing the computational complexity. By using a sliding window approach, W-MSA is able to progressively compute attention weights for corresponding positions across the entire sequence. In this case, the computational complexity of the global MSA module and the window-based image block calculation is as follows:
Ω ( MSA ) = 4 h w C 2 + 2 ( h w ) 2 C
Ω ( W - MSA ) = 4 h w C 2 + 2 M 2 h w C
The window-based self-focused modules have limited modeling capabilities and lack connections between windows. In order to introduce cross-window connectivity while maintaining efficient computation of non-overlapping windows, a moving-window partitioning approach was proposed. This method alternates between two partitioning configurations in successive blocks of Swin Transformers. The output is computed as follows:
y l = W - MSA ( LN ( y l 1 ) ) + y l 1
y l = MLP ( LN ( z l ) ) + y l
y l + 1 = SW - MSA ( LN ( y l ) ) + y l
y l + 1 = MLP ( LN ( y l + 1 ) ) + y l + 1
where y l and y l are the outputs of the first block’s W-MSA and MLP, respectively, and y l + 1 and y l + 1 are the outputs of the second block’s SW-MSA and MLP, respectively.

3.2.3. Multi-Scale Feature Interaction Module

In WetSegNet, in order to optimize the skip connection in UNet and solve the semantic gap problem in the process of feature fusion, we developed a Multi-Scale Feature Interaction (MFI) module (Figure 7), which employs a cross-attention mechanism [18] to achieve information interaction between features of different scales. This strategy not only compensates for the deficiencies of UNet in capturing the global context, but also significantly improves the performance and classification accuracy of the model. The MFI module adopts a hierarchical multi-head cross-attention design, with the number of attention heads set to [3,6,12,24] across the four stages. The query, key, and value vectors are initialized with a dimension of 96, and layer normalization is applied before attention operations to stabilize training.
Specifically, for feature maps of different scales obtained in the four stages of the encoder, F i ( H 2 ( i + 1 ) , H 2 ( i + 1 ) , 2 ( i + 6 ) ) , where i = 1 , 2 , 3 , 4 . First, to ensure that these feature maps of different scales are processed in the same spatial dimension, we scale them to the same spatial dimension n × n using 2D average pooling:
P i = A d a p t i v e A v g P o o l 2 d ( F i )  
After pooling the features P i ( n , n , 2 ( i + 6 ) ) , where i = 1 , 2 , 3 , 4 , we project the three-dimensional feature map P i into two-dimensional sequence data T i , where i = 1 , 2 , 3 , 4 , to accommodate the computational approach of the cross-attention mechanism.
P i = A d a p t i v e A v g P o o l 2 d ( F i )
T i = F l a t t e n (   P i   )
The next step is to compute the cross-attention for the above four feature vectors, which are layer-normalized in order to ensure that each feature vector has a similar distribution. In the computation of the cross-attention mechanism, we splice the four feature vectors into a single feature T c o n c a t according to the channel dimension, which is used to map the keys (K, Key) and values (V, Value) required for generating the attention mechanism. For each sequence of data T i , linear variation is applied to generate the query Q i :
T c o n c a t = C o n c a t ( T 1 , T 2 , T 3 , T 4 , dim = C )
K = T c o n c a t n W K
V = T c o n c a t n W V
Q i = T i n W q
The similarity scores of each query Q i with all keys K are computed. These scores are then normalized using the softmax function to obtain attention weights, allowing the current feature graph to extract relevant information from other feature graphs. This globalized information exchange mechanism allows individual feature maps to borrow important semantic information from each other. Subsequently, the computed attention weights are weighted and averaged over the value V to obtain the final output, helping the model to effectively fuse wetland data from different scales and levels.
A t t e n t i o n S c o r e i , j = Q i K j T d k
A t t e n t i o n W e i g h t s i , j = S o f t max ( A t t e n t i o n S c o r e i , j )
O u t p u t i = j A t t e n t i o n W e i g h t s i , j ×   V i
where d k denotes the latitude of each feature vector. Using this method, the cross-attention mechanism can effectively capture the relationship between feature maps, thus enhancing the ability to focus on important features.
In order to facilitate the subsequent decoding step, we reshape the output corresponding to each query Q into a feature matrix of shape ( C , H , W ) . In addition, the corresponding spatial resolution of different stages is recovered after the up-sampling operation. Finally, after the pooling operation, this output is added to the original input F i to obtain the final output M i .
The introduction of cross-attention to the wetland remote sensing classification task enhances the model’s ability to process multi-scale information, enabling the decoder to obtain richer semantic information while still retaining detail information. This design improves the model’s ability to capture complex wetland scenes. Through the effective integration of features from different scales via MFF, the cross-attention mechanism not only improves the model’s ability to retain details, but also optimizes its understanding of global semantics, which leads to a better performance in the wetland classification task.

3.2.4. Multi-Feature Fusion Module

During high-resolution wetland classification, reeds and sedges are often mixed together. In addition, mudflats and water bodies are generally similar; therefore, edge shape information should not be ignored in remote sensing images. Retaining the boundary information of salient wetlands in the decoding stage, as well as contextual semantic information, improves the accuracy of recognizing different wetland types. The aim of the MFF module (Figure 8) is to introduce the boundary grayscale maps of the image to enhance the edge features. It also uses the spatial attention mechanism [39] to enhance feature representation and to fuse multiple features.
In the encoder part of the model, the original image X R H × W × C is processed in grayscale, and the Canny operator is used to generate the binarized edge map F e ( H , W , 1 ) . At the same time, convolution and normalization operations are used to extract the low-level features F c ( H 2 , H 2 , 32 ) that contain rich detail information. In order to align the spatial resolution of F e with F c , it is down-sampled using maximum pooling, and the down-sampled edge map F e is multiplied element by element with F c and then added to F c to obtain the new feature F c :
F c = F c + ( F e n F c )
The above processing stages not only enhance the boundary-related information in F c but also preserve the original feature information.
In high-resolution remote sensing images, there is a lot of background noise and irrelevant information; thus, for the feature map F c , which contains more detailed information, average pooling and maximum pooling are used to obtain the global and local feature information, respectively. The final spatial attention weights are obtained through the convolution operation, which suppresses the irrelevant background information in F c , obtaining F c . The fused edge features are combined with high-level semantic features through convolution operations, achieving simultaneous enhancement of boundary details and contextual semantics. Finally, in order to more fully combine the low-level detail information with the high-level semantic features, the result F h of the last jump join of the encoder is fused with F c after the resolution is recovered through several convolutional operations.
M f = c o n c a t ( M L P ( A v g P o o l ( F c ) ) + M L P ( M a x P o o l ( F c ) ) )
M s = σ ( C o n v ( M f ) )
F c = M s F c

3.3. Experimental Settings

In the experiments, we constructed a high-resolution wetland remote sensing dataset based on GF-2 satellite imagery of the Dongting Lake region and its surrounding areas. The dataset was generated with a spatial resolution of 1 m, cropped into patches of 512 × 512 pixels, and refined through filtering, resulting in a total of 5384 image–label pairs. The dataset covers six wetland-related categories: mudflats, water, forests, farmland, sedges, and reeds. As shown in Figure 9, sedges and reeds occupy the largest proportion of pixels, reflecting their dominance in the Dongting Lake landscape, while the coverage of mudflats and forests is relatively sparse. To enhance data diversity and mitigate class imbalance, we incorporated samples from the GID dataset, which was also constructed from GF-2 imagery with a 1 m resolution, GID samples were only used during the training phase to supplement the underrepresented forest class and were not included in validation or testing. Specifically, we selected large GID scenes rich in forest samples, divided them into 512 × 512 patches, and retained those in which forest pixels accounted for more than 80%, thereby supplementing the underrepresented forest category. The Dongting Lake dataset and the selected GID samples were then combined and randomly partitioned into training, validation, and testing sets at a ratio of 8:1:1, yielding 4307, 538, and 539 images, respectively. The training set was used to optimize the model parameters, the validation set for hyperparameter tuning, and the testing set for final performance evaluation.
In this study, all of the experiments were conducted using the PyTorch v.2.1.2 deep learning framework on an NVIDIA RTX3060 GPU graphics card (NVIDIA Corporation, Santa Clara, CA, USA) with a batch size of 8. The Stochastic Gradient Descent (SGD) optimizer with an initial learning rate of 1 × 10⁻⁴ was employed in the training process and decayed using a cosine annealing scheduler. To avoid overfitting, L2 weight decay and dropout were applied. Data augmentation strategies such as random cropping, flipping, and rotation were used to improve generalization. Weighted cross-entropy loss was adopted to address class imbalance, ensuring that underrepresented categories such as mudflats and forests were properly considered during training. The experimental setup in this study is detailed in Table 1.

3.4. Evaluation Metrics

In this study, we used the overall accuracy (OA), kappa coefficient (Kappa), and mean intersection over union ratio (mIoU) as metrics to assess the model performance. These metrics were evaluated based on the four basic elements of the confusion matrix: true positives (TPs), false positives (FPs), true negatives (TNs) and false negatives (FNs). Each evaluation metric was calculated as follows:
O A = T P + T N T P + F P + T N + F N
P E = ( T P + F N ) ( T P + F P ) + ( T N + F P ) ( T N + F N ) ( T P + F P + T N + F N ) 2
K a p p a = O A P E 1 P E
m I o U = 1 n i = 1 n ( T P i T P i + F P i + F N i )

4. Results

4.1. Results and Analysis

WetSegNet performs well in the Dongting Lake wetland classification task, with the Kappa, OA and mIoU metrics of both the training and validation sets increasing rapidly and stabilizing (Figure 10), reaching about 90%, 92% and 84%, respectively, on the validation set.
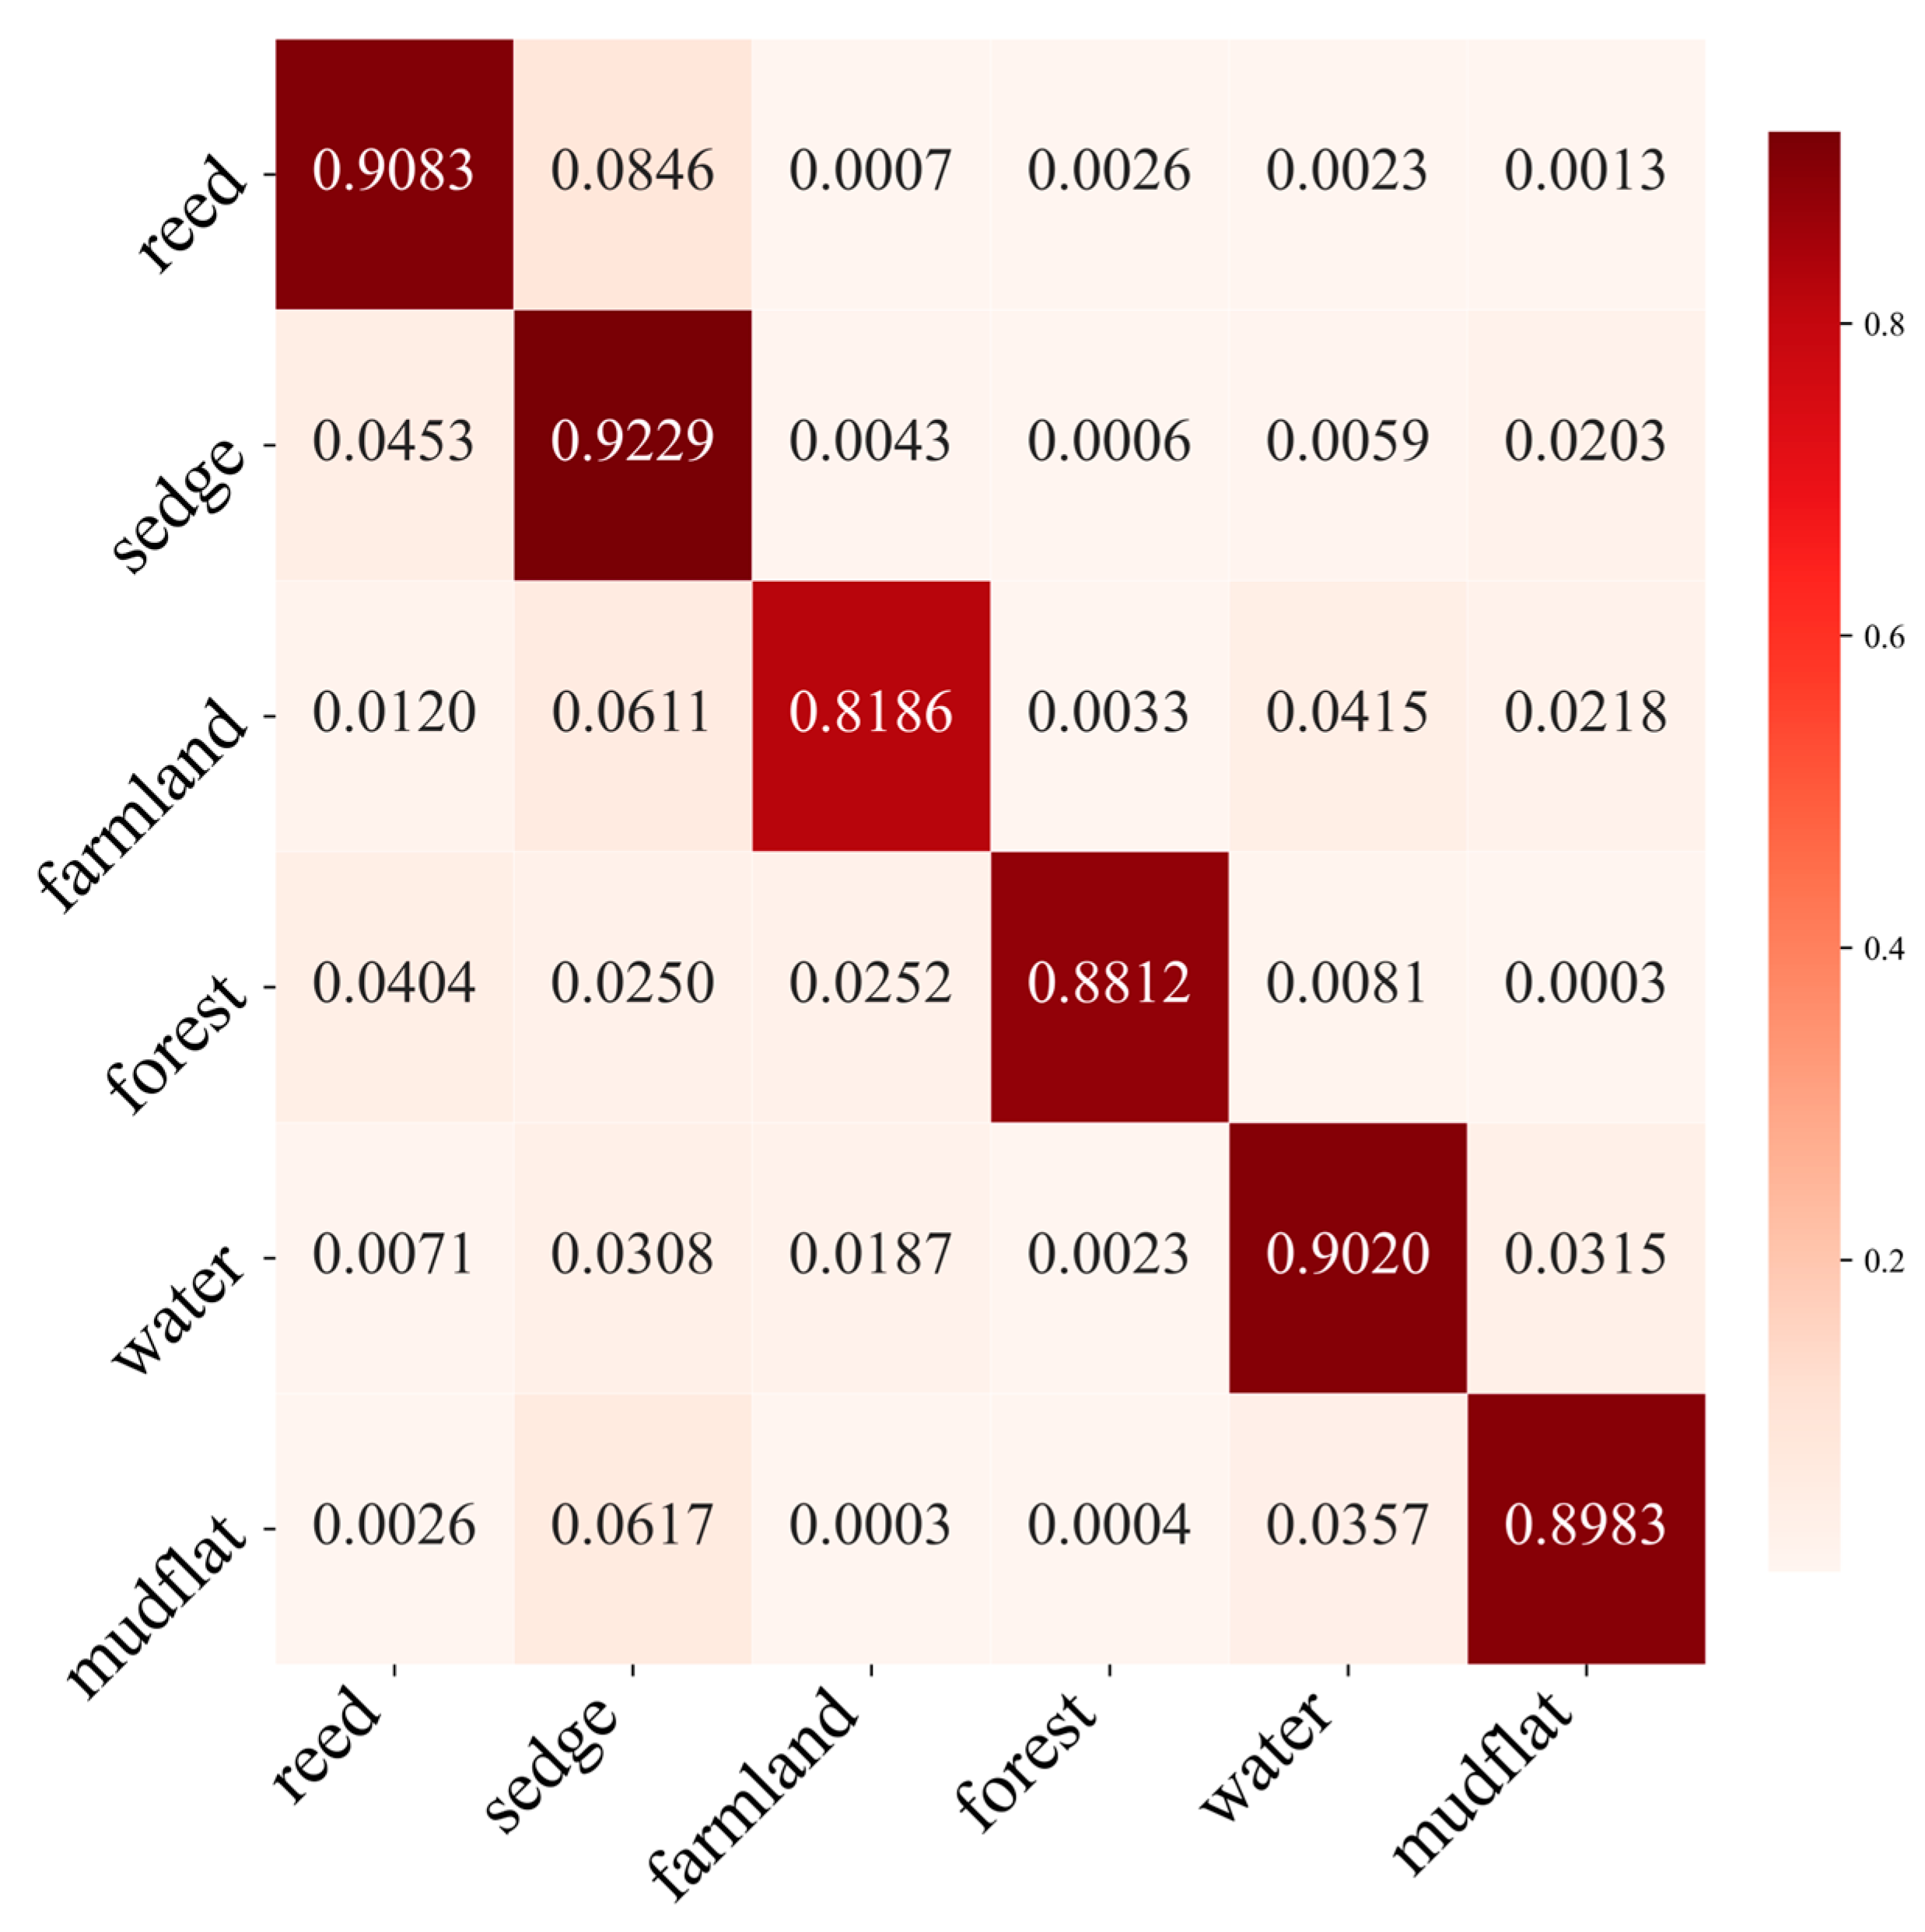
From the confusion matrix of the test set (Figure 11), it was found that most categories (e.g., reeds, forests, and water) had high classification accuracies along the diagonal; however, there was confusion between some categories, such as reeds and sedges and sedges and farmland, which may be due to the similarity in their spectral properties or spatial distributions. Mudflats in particular were confused with other categories (e.g., water and farmland), despite the high overall classification accuracy.
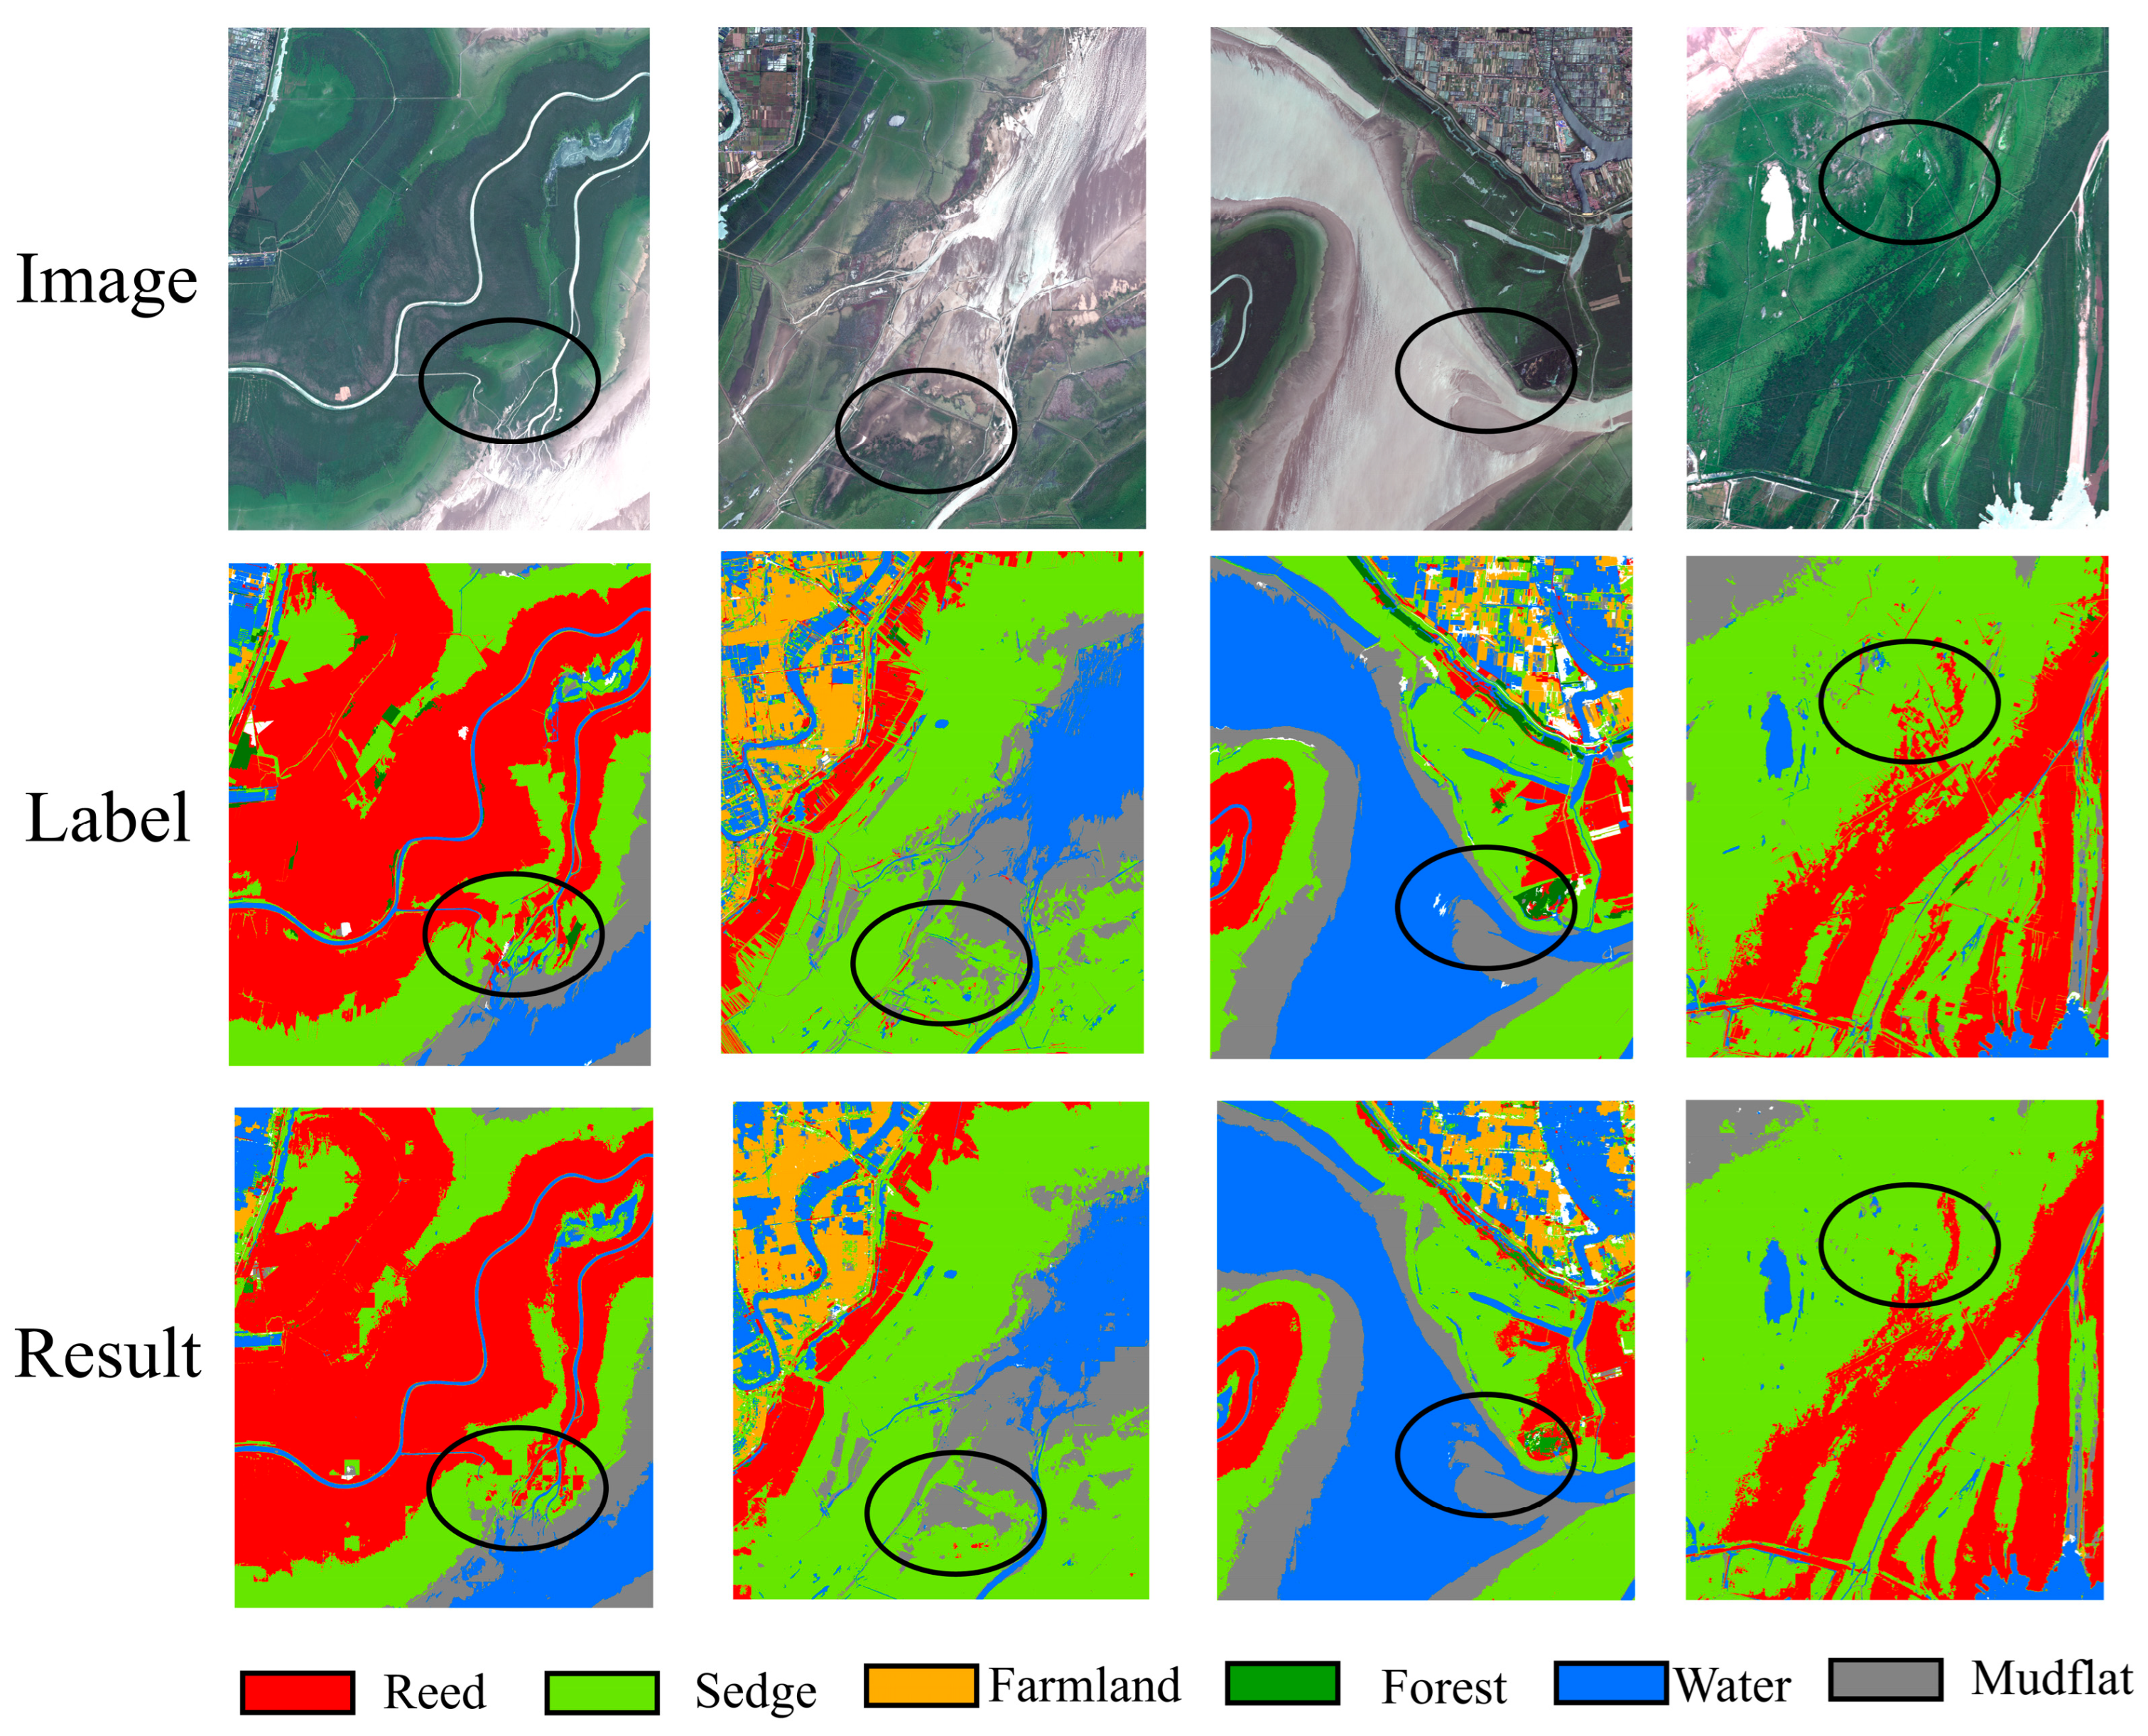
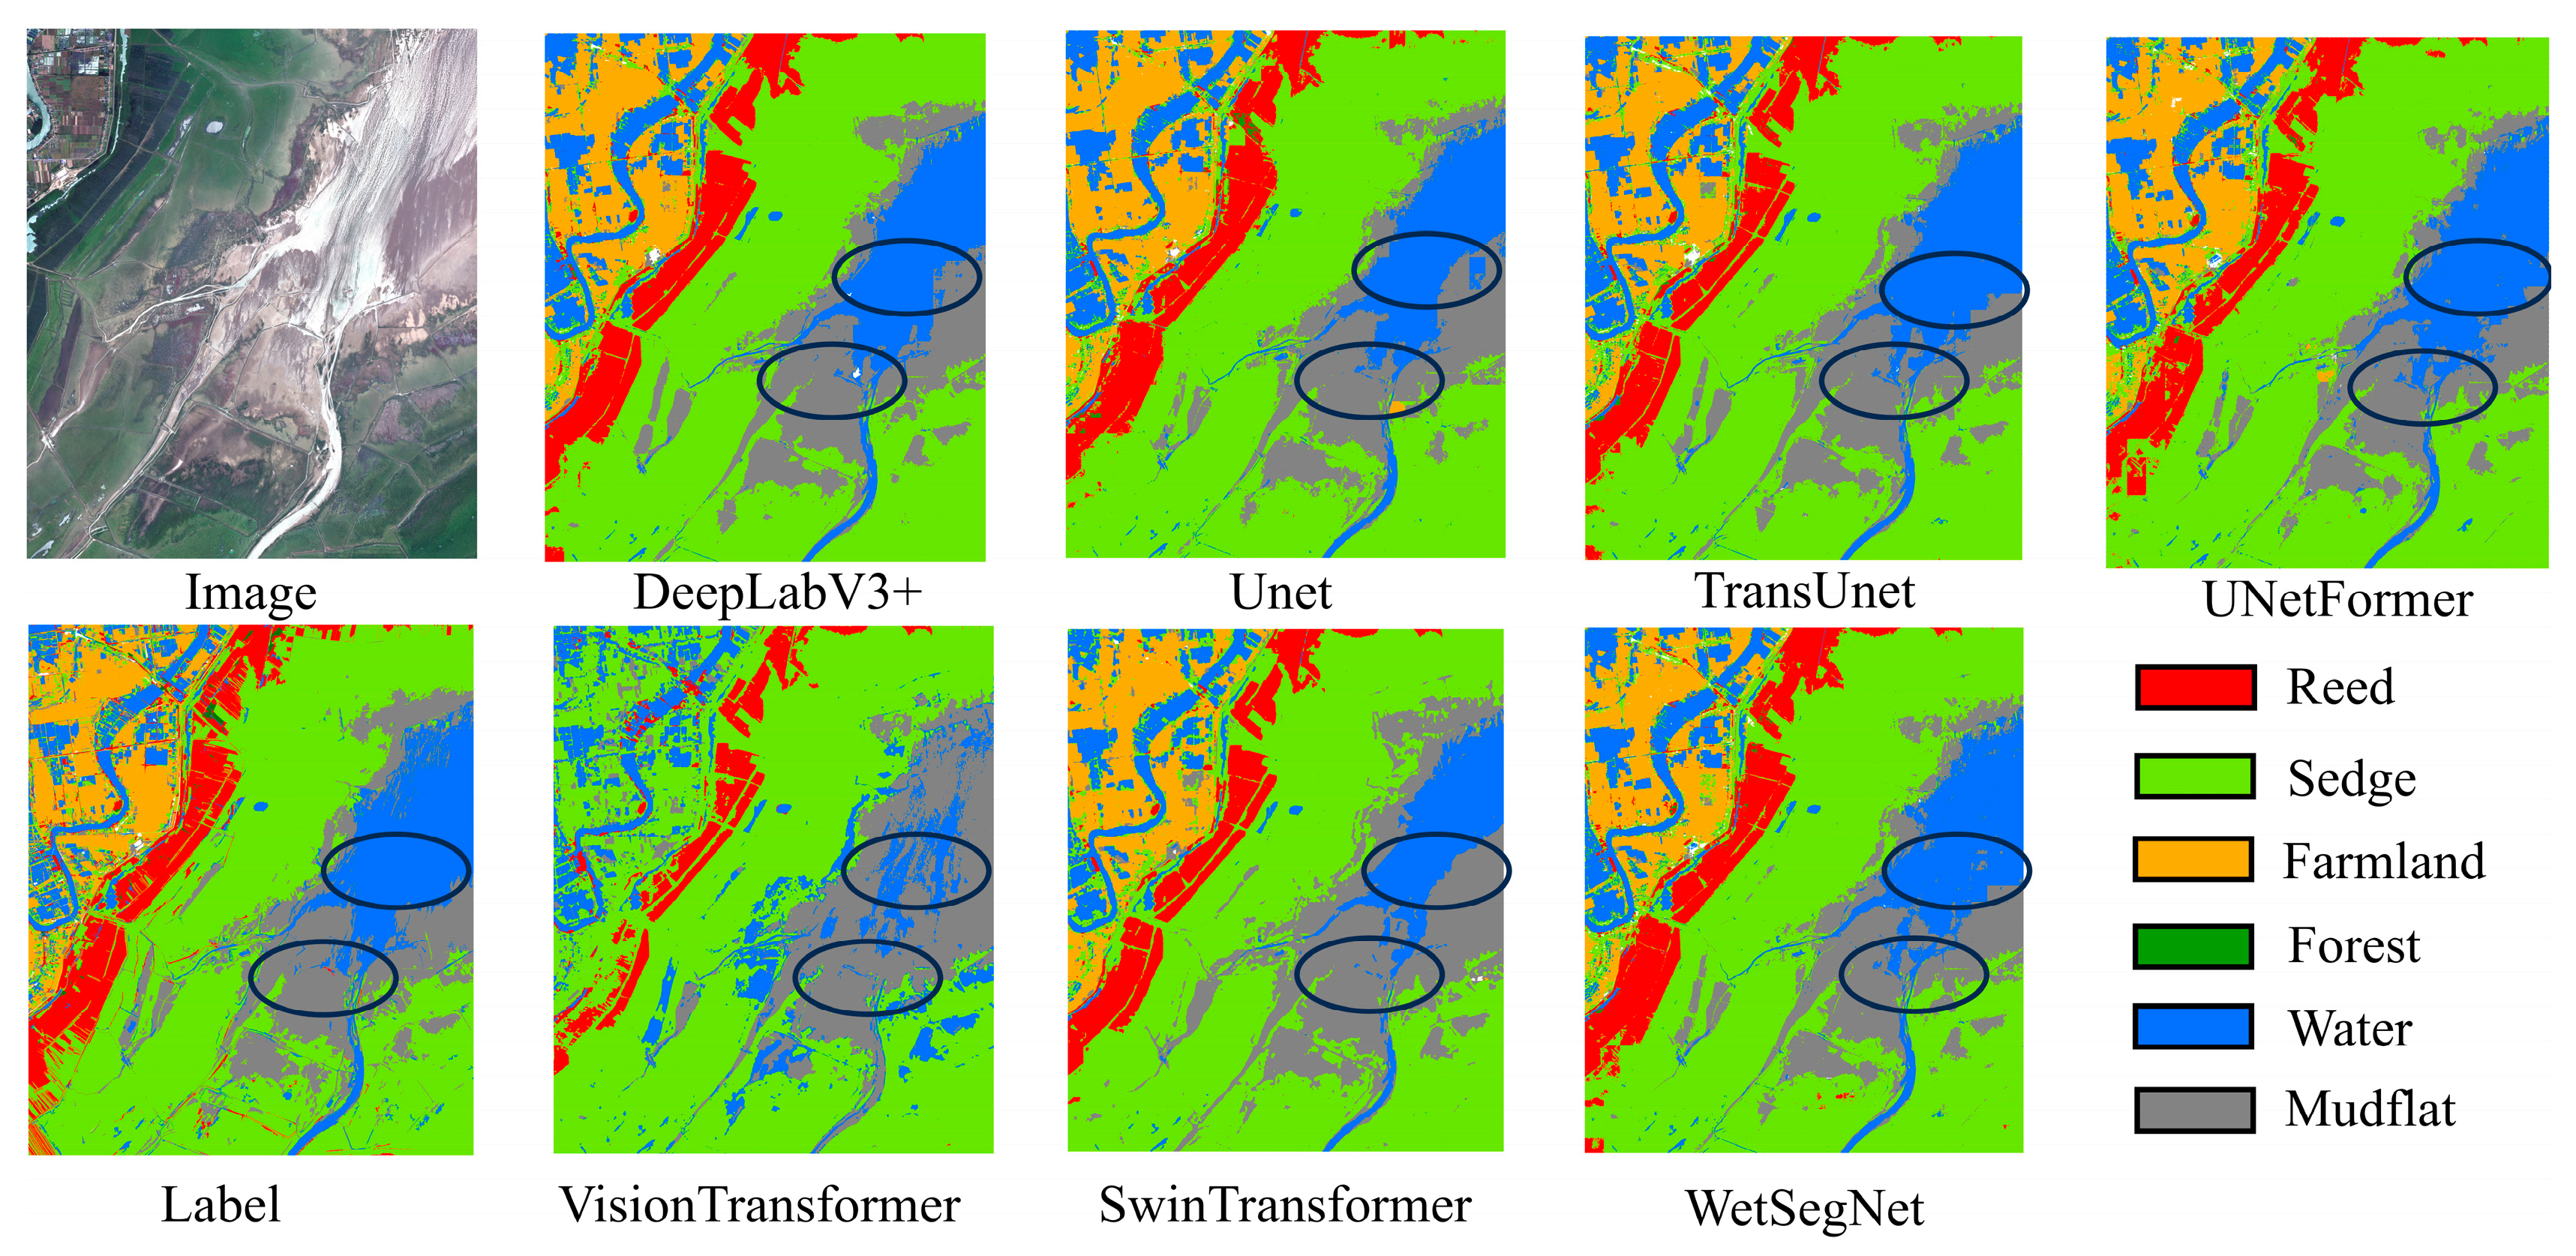
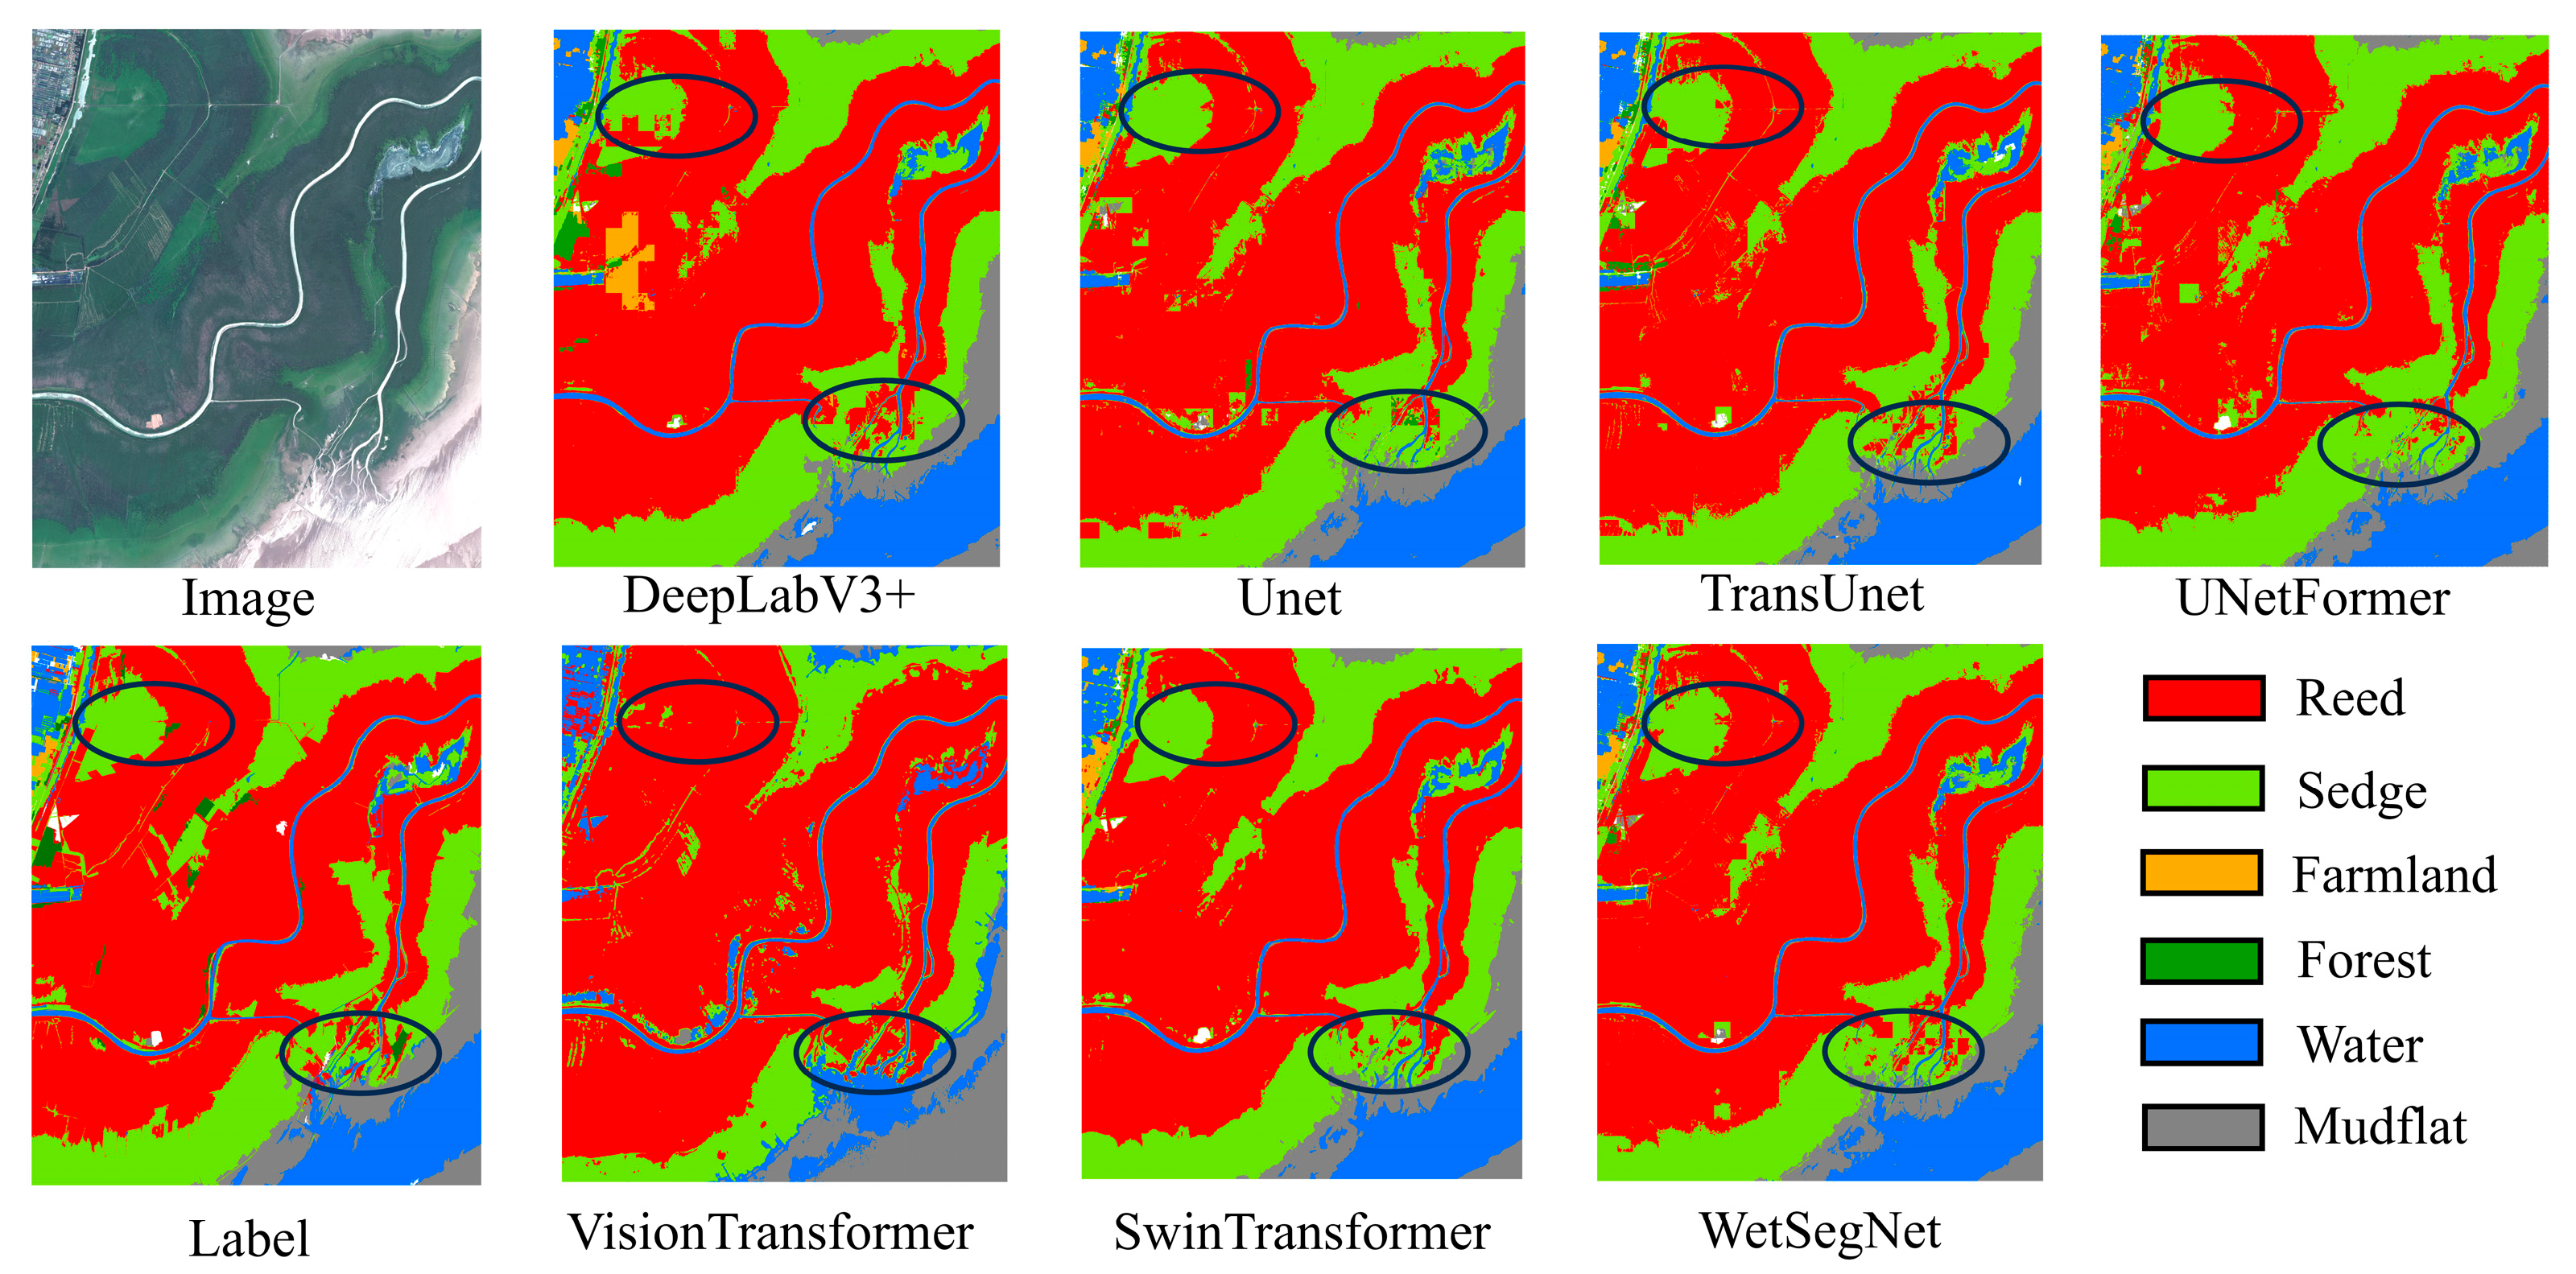
Figure 12 shows the mapping results of WetSegNet in four GF-2 images. WetSegNet shows a high accuracy in wetland classification at Dongting Lake, with few misclassifications and smooth and coherent classification results. The patch effect in the labels is also avoided; for example, some labels in the first column were incorrectly shown as forests instead of reeds, but the model accurately identified the true distribution of forests. The classification boundary at the end of the watershed was also clear and natural, with no scattered misclassifications in the labels. Similarly, the sedge–mudflat junction in the second column exhibits a fragmented and blurred distribution due to inaccurate labeling, but WetSegNet accurately segmented both wetland types. The mudflat area in the third column is particularly evident, and WetSegNet was able to accurately identify and classify it more accurately than when labeled using the original image. Overall, WetSegNet achieves accurate classification of different wetlands through multi-scale feature extraction and effective guidance of edge information. It also exhibits smooth spatial transitions and the ability to correct labeling errors, while the classification results are more complete.

4.2. Comparison of Wetland Classification Results with Different Models

To verify the superiority of the WetSegNet model proposed in this study on the wetland dataset, we compared it with six models (UNet [16], DeepLabv3+ [40], Vision Transformer [41], Swin Transformer [27], TransUNet [42] and UNetFormer [43]). Table 2 shows that the overall accuracy (OA) of the WetSegNet model reaches 90.81%, the mIoU is 82.91%, and the Kappa coefficient reaches 0.88, which demonstrate improvements of 3.3%, 5.90%, and 0.05 compared with the baseline model UNet, respectively.
From several sets of wetland classification results, WetSegNet shows clear advantages compared to the other models compared in the experiments. Classical convolutional neural network (CNN) models such as UNet and DeepLabv3+ often suffer from category confusion due to the similarities in spectral features and spatial distributions for three wetland types—sedge, reed and farmland—resulting in a decrease in the classification accuracy. In contrast, WetSegNet effectively guides and strengthens the boundaries between neighboring categories by introducing edge information and the cross-attention mechanism (as shown in Figure 13), which results in clearer boundaries between categories such as sedges and reeds and improves the classification accuracy.
Compared with convolutional neural networks, which can effectively focus on local details, the Transformer-based model has a stronger advantage in global feature extraction and can classify the main areas of the river better. However, there are still problems related to misclassification and confusion for specific local areas (e.g., branches at the end of the river). To solve this problem, a Transformer and a CNN are combined in WetSegNet’s feature extraction stage, which significantly improves the accuracy and consistency of classification (as shown in Figure 14).

4.3. Ablation Study

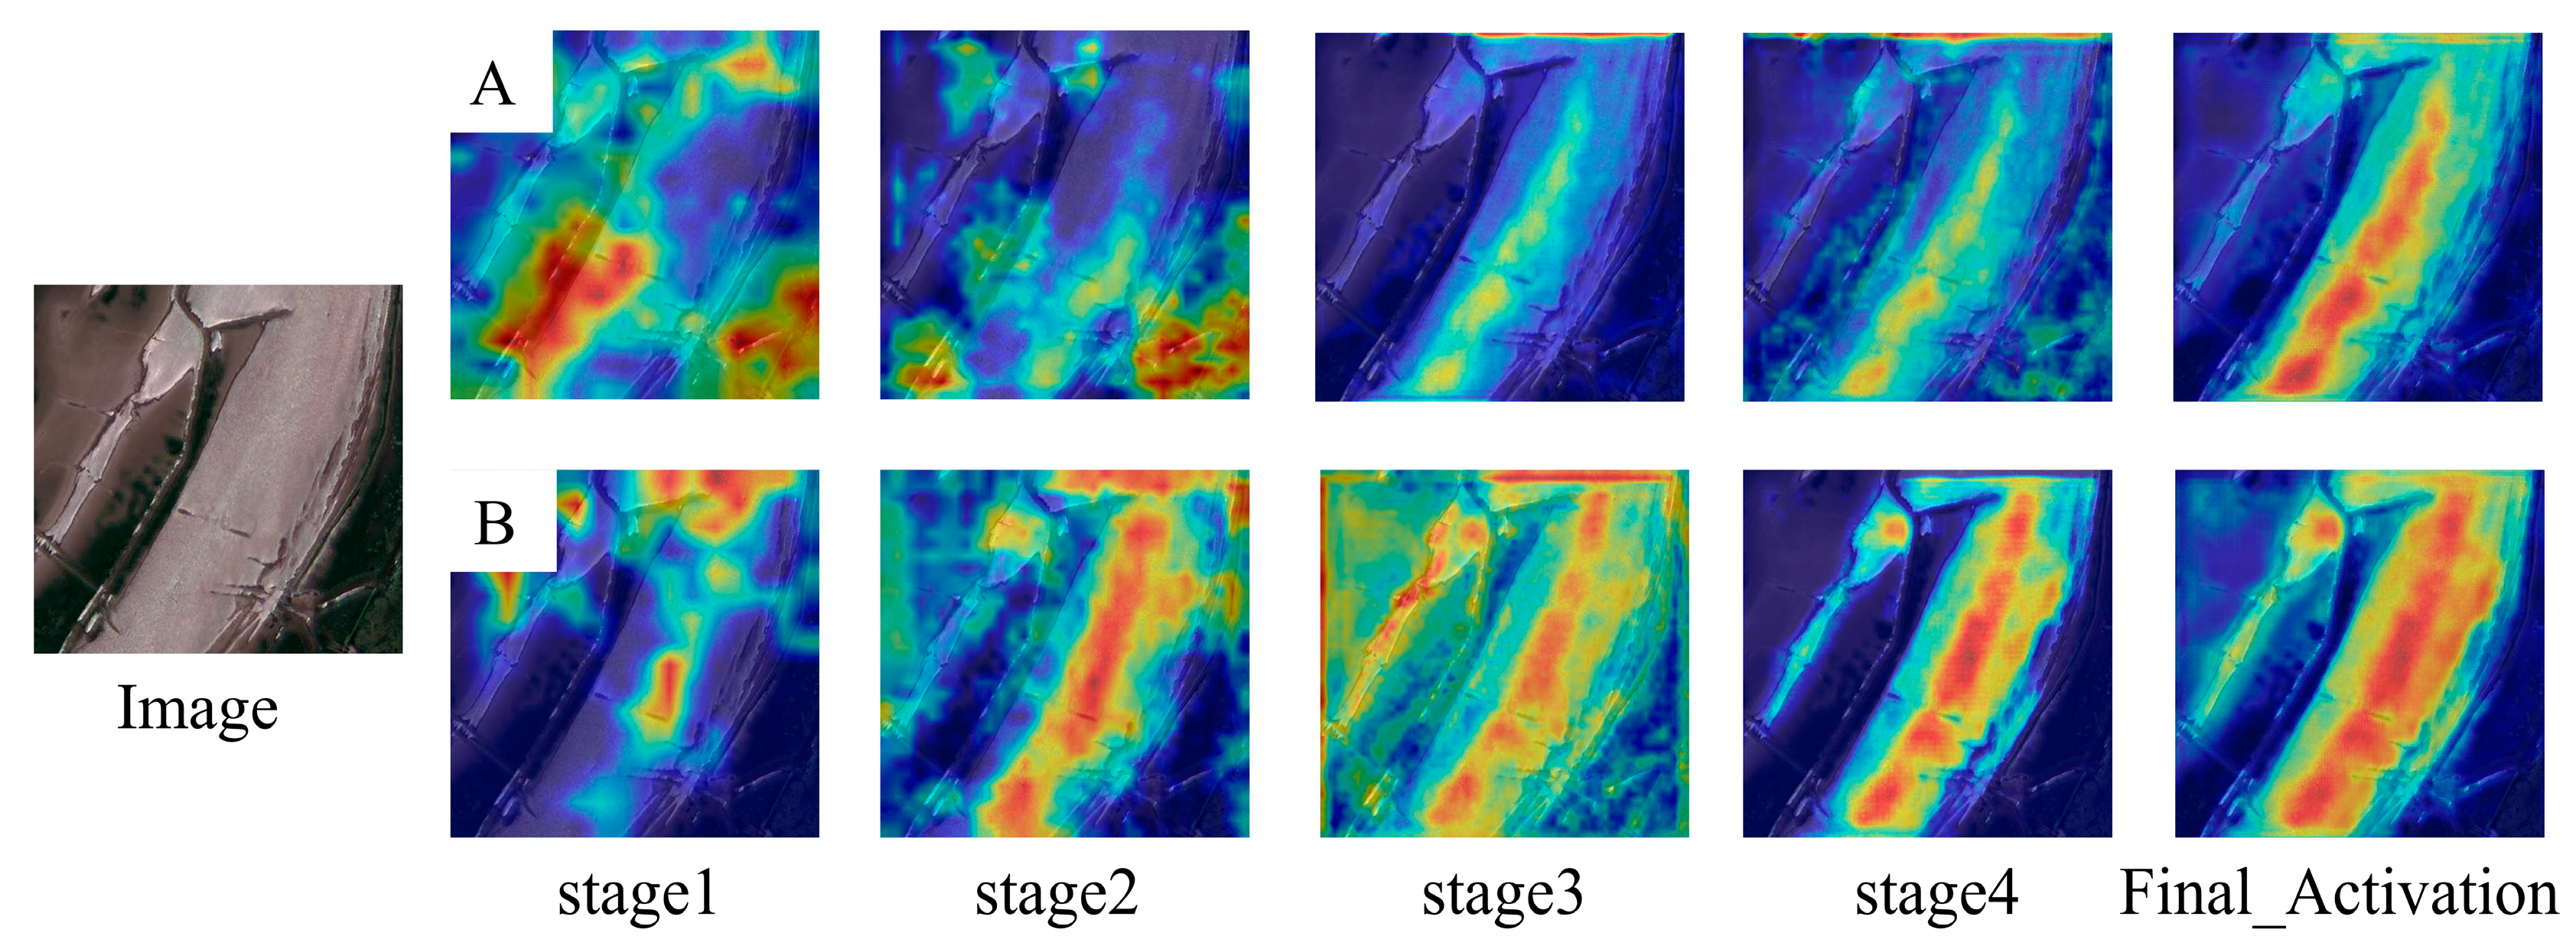
WetSegNet, which includes the MFI module, exhibits clearer and more accurate feature representation in each stage (stage1 to stage4) and a better final activation result (Last_class_activate) compared with no_MFI (Figure 15). Specifically, WetSegNet is able to effectively capture boundary details and multi-scale information at different stages, and high-response regions in the feature map are more concentrated in the target region, with less noise and smoother boundary transitions compared with no_MFI. In contrast, in the no_MFI model, the high-response areas of the feature maps in each stage are more scattered and the target boundary is blurred, which indicates that its ability to interact and integrate multi-scale features is insufficient. The MFI module effectively enhances the model’s perception of the target area by interacting and integrating features of different scales, which improves the accuracy of wetland classification.
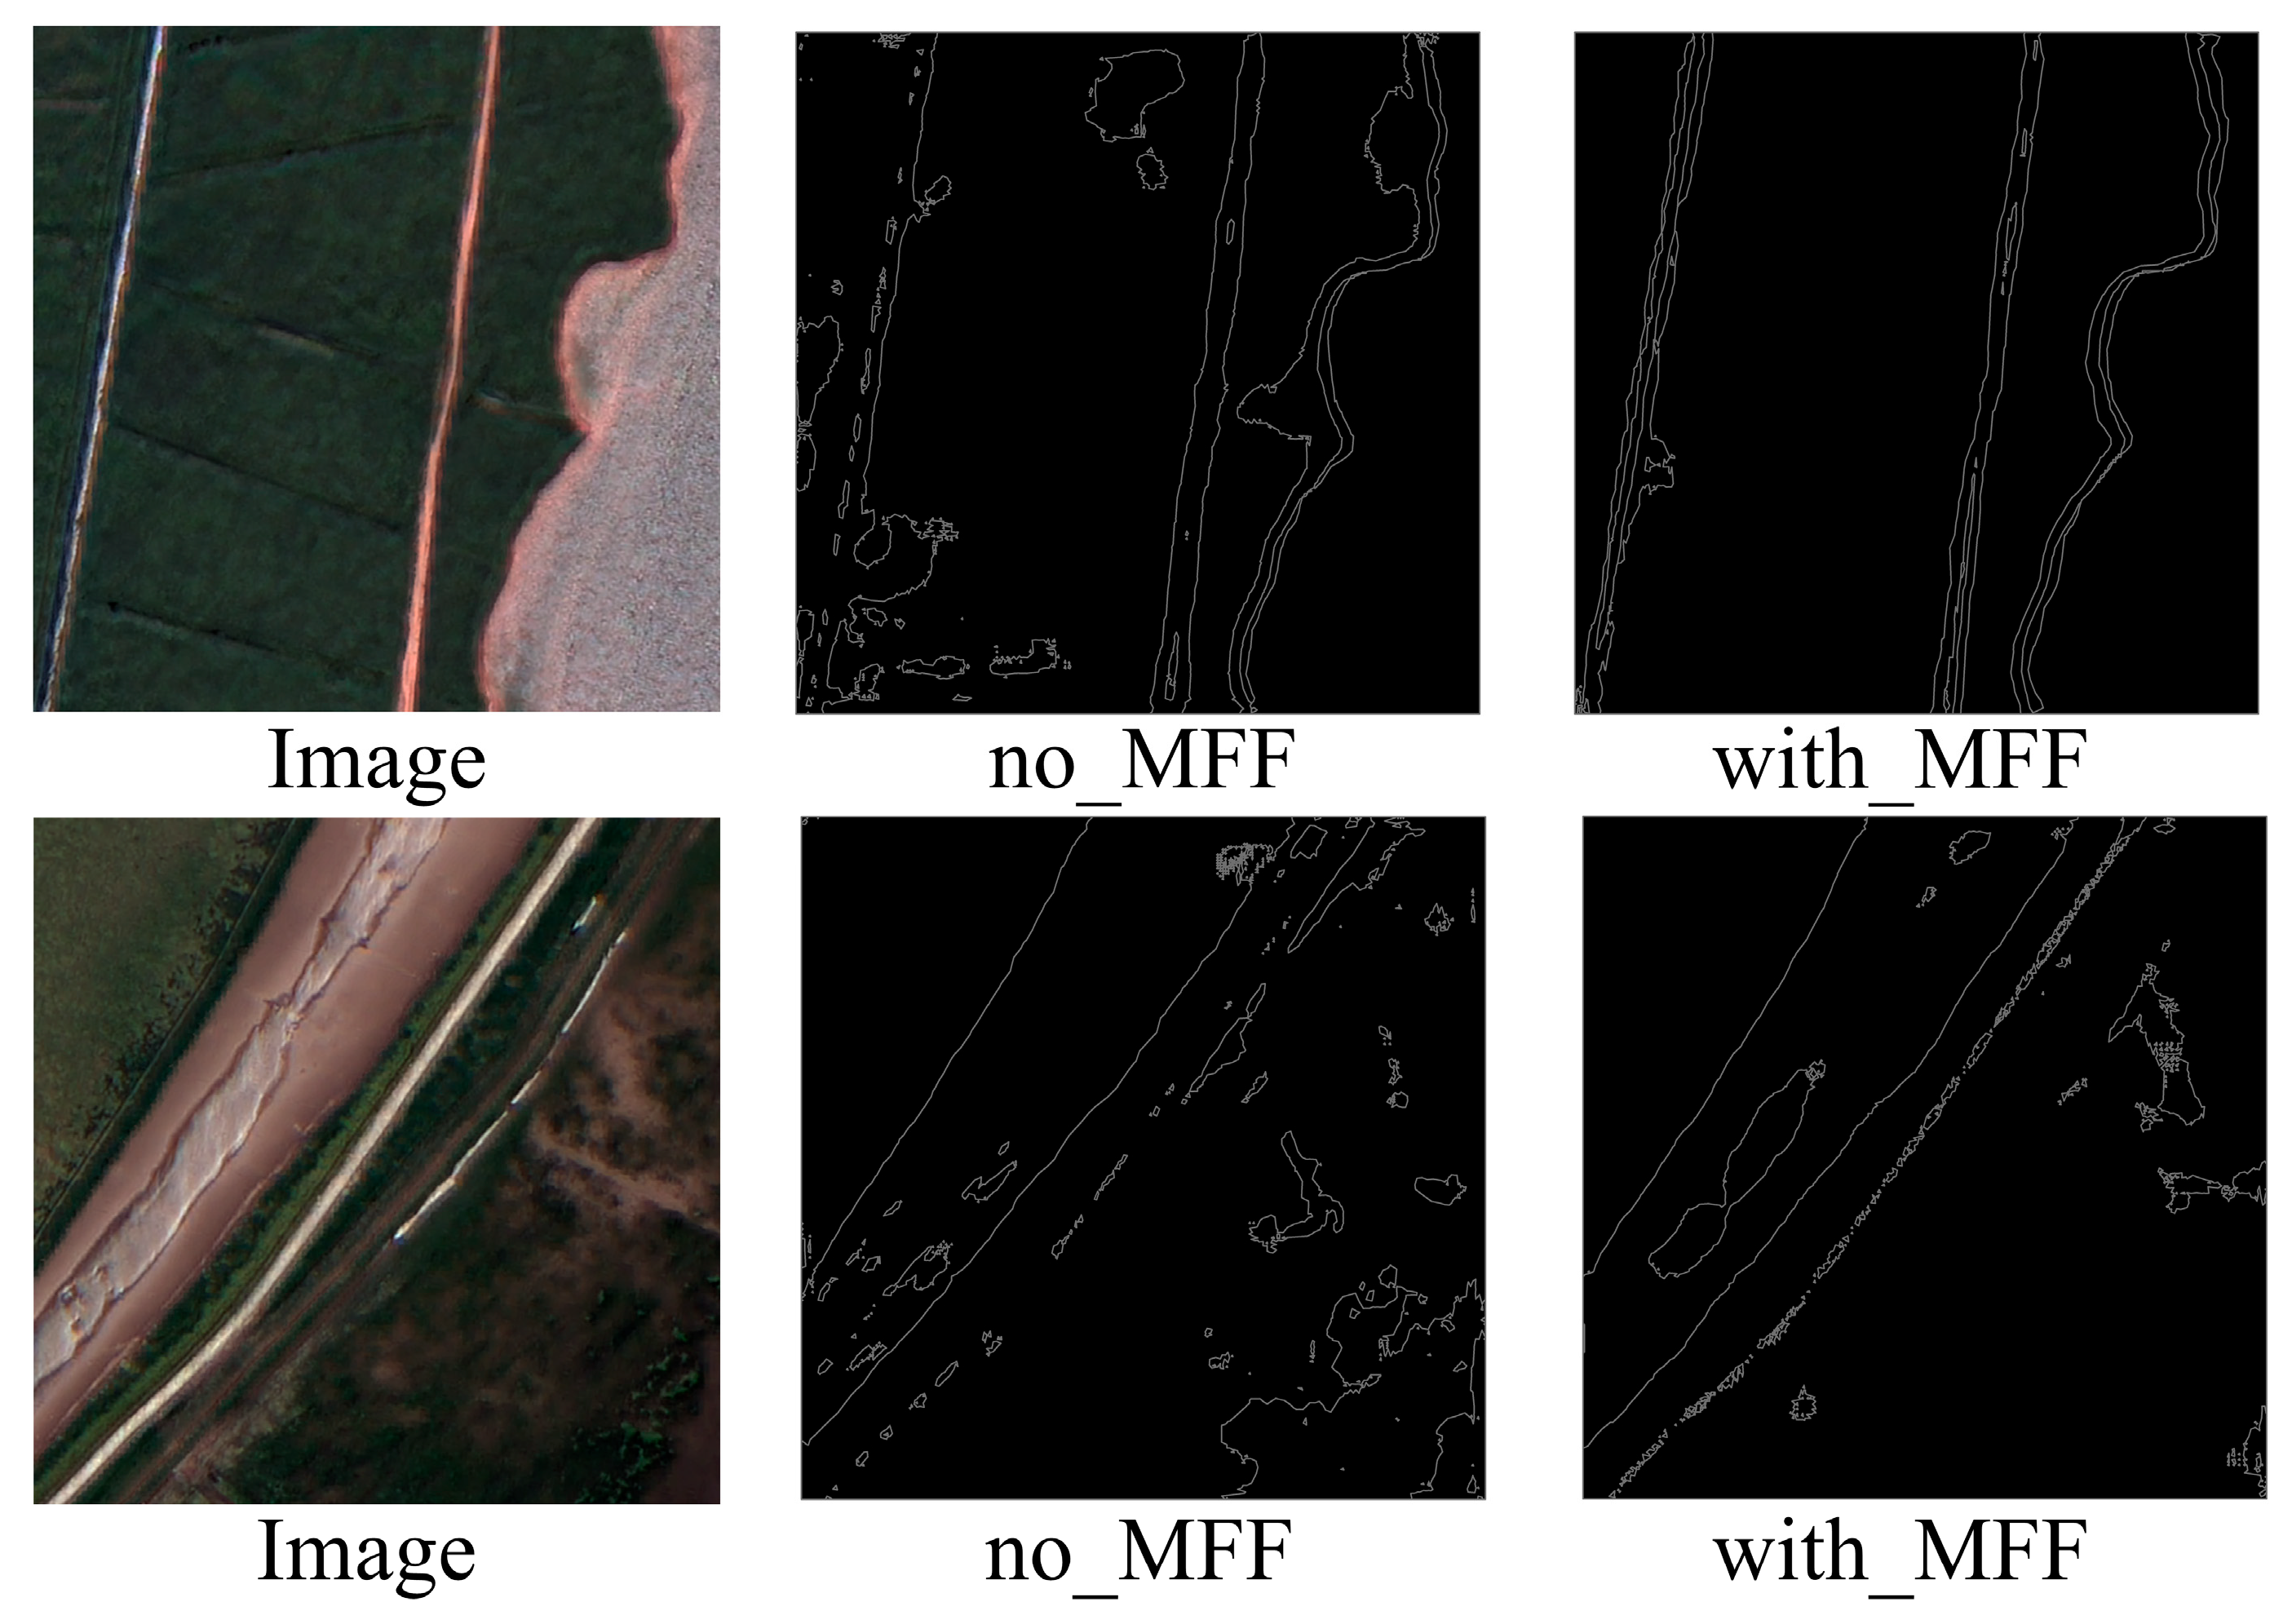
Figure 16 demonstrates the enhancement in the boundary extraction effect in remote sensing images achieved using MFF module. When MFF is not used (no_MFF), there are obvious breaks and blurring in the extracted boundaries, especially in the complex region where it is difficult to accurately determine edge details. Compared with no_MFF, the boundaries extracted by WetSegNet with the MFF module are more continuous and clearer, more accurately portraying the boundaries between different feature types. This suggests that the MFF module plays an important role in enhancing the edge information and improving the representation of boundary features, contributing to the improvement in accuracy for the wetland classification task, especially when differentiating feature types with complex boundaries (e.g., rivers and mudflats).
To verify the effectiveness of WetSegNet, we performed ablation experiments to evaluate the performance of each module. The results in Table 3 show that WetSegNet with both MFI and MFF modules exhibits the strongest accuracy in the wetland classification task. After a comprehensive evaluation of the indexes, it was shown that the mIoU of WetSegNet reaches 82.91% when the MFI and MFF modules are enabled at the same time, which is 3.69% and 2.70% better than that when only using MFI (79.22%) and MFF (80.21%), respectively. The Kappa coefficient (0.88) and OA (90.81%) are also highest when the MFI and MFF modules are used at the same time, which reflects the synergistic effect of the two modules.
In terms of the classification performance of each category, for mudflats, a challenging category, the classification accuracy increases from 83.59–85.88% for the single modules to 89.83% after combining the two modules, which indicates that the interaction of multi-scale features and the fusion of global features can effectively alleviate the problem of the blurred mudflat boundaries (Figure 17).
Table 4 shows that the inference time of WetSegNet is 41.98 ms, with a parameter count of 297.75 M. It demonstrates a notably shorter inference time than DeepLabV3+ (95.99 ms) and TransUNet (144.72 ms), while still being quicker than Swin Transformer (19.99 ms) and ViT (66.93 ms). This indicates that WetSegNet achieves a reasonable balance between inference speed and model complexity.
However, the parameter count of WetSegNet is significantly higher than that of the other models, particularly Vision Transformer (7.00 M) and Swin Transformer (10.02 M).

5. Discussion

Our results match those of recent research using deep learning for wetland classification with remote sensing data. These studies show that hybrid models combining CNNs and Transformers often perform better than traditional methods. For example, models like Wet-ConViT [44] and CVTNet [45] have reported over 90% accuracy in complex wetland areas, supporting WetSegNet’s 90.81% OA and its effectiveness in capturing global contexts alongside local details. Similarly, convolutional neural networks like U-Net [46] and DeepLabv3+ [47] have been widely applied to high-resolution wetland mapping, achieving OAs of 85–93% in various ecosystems. WetSegNet builds on these by incorporating edge-guided attention, resulting in a 3.3% OA improvement over the baseline U-Net and superior boundary precision, particularly for heterogeneous features like mudflats and reed–marsh mixtures. This addresses a common limitation in prior work, where pure CNN models often fail to model long-range dependencies, leading to blurred boundaries in intricate wetland environments [48,49]. However, our model differs from some lightweight approaches that prioritize efficiency over accuracy, as WetSegNet’s parameter-heavy design (297.75 M) trades computational cost for enhanced performance in challenging scenarios, unlike more streamlined Transformer variants that may underperform in fine-scale delineation [50,51].
From an application perspective, WetSegNet provides new insights into the Dongting Lake wetlands, one of China’s largest freshwater ecosystems facing significant environmental pressures [52]. The model’s high classification accuracies—exceeding 90% for water, sedge, and reed habitats—enable precise mapping of land cover types, revealing dynamics that were previously difficult to quantify at 1 m resolution [53,54]. WetSegNet’s accurate delineation offers novel information by quantifying these shifts at a finer scale than medium-resolution data (e.g., Sentinel-1/2), allowing for better assessment of biodiversity loss, flood mitigation capacity, and soil degradation—issues not fully captured in earlier mappings [55,56,57]. This supports targeted interventions, such as restoration projects to enhance climate resilience, and informs policy for sustainable management in the Yangtze River basin [58].
In summary, WetSegNet advances methodological precision in wetland classification by combining edge-guided spatial attention with Multi-Scale Feature Interaction, enhancing boundary delineation and reducing semantic discrepancies across different scales. These design choices enable more robust classification in complex wetland environments, particularly for challenging categories such as mudflats and reed–marsh mixtures, while contributing actionable data for addressing Dongting Lake’s ecological challenges and filling gaps in high-resolution monitoring that previous literature has identified as critical for conservation, thereby providing a reliable framework for ecological monitoring.
However, WetSegNet’s parameter count (approximately 298 M) far exceeds that of existing models based on convolutional neural networks (CNNs) or Transformers. While the increased complexity contributes to improved accuracy, it also poses challenges in practical applications with limited computational resources. To address this issue, future research could focus on lightweighting strategies such as knowledge distillation and parameter pruning and efficient backbone architectures like MobileNet and Mamba. Furthermore, exploring hardware acceleration and model quantization will help reduce the inference latency and energy consumption, making WetSegNet more suitable for near-real-time monitoring and large-scale wetland management tasks.
Beyond improving efficiency, a key direction is to evaluate and enhance the transferability of WetSegNet. We will conduct cross-seasonal and cross-regional experiments (training and testing on non-overlapping time/regions and cross-sensor images) and explore domain generalization/adaptation strategies such as multi-seasonal training, adversarial feature alignment, and test-time adaptation to strengthen out-of-distribution performance.

6. Conclusions

In this paper, an edge-guided multi-scale information interaction wetland classification model (WetSegNet) is proposed to solve the boundary ambiguity and category similarity problems prevalent in wetland classification tasks. Classification mapping of Dongting Lake using this model may provide corresponding data support for researchers investigating the impact of land use/land cover changes on the ecological services of the Dongting Lake wetland ecosystem. Based on this, it offers more scientific decision-making references for areas such as land use planning formulation and ecological environment governance and regulation in the lake region. By combining edge detection with multi-scale feature extraction, the model’s ability to capture fine-grained boundary information is effectively improved, and it utilizes a multi-scale information interaction mechanism to achieve efficient fusion of features at different semantic levels. The experimental results show that the model proposed in this study exhibits significant classification performance improvements on the GF-2 dataset; the classification accuracy of WetSegNet is higher than that of some existing models at 90.81%. Ablation experiments also prove the practicality of the proposed MFI and MFF modules. However, despite the fact that our proposed WetSegNet exhibits high accuracy in wetland classification tasks, its multiple-module design leads to a large number of model parameters, which not only increases the storage space required, but also puts a higher demand on computational resources. In the future, we will continue to explore the application of deep learning in wetland classification, focusing on balancing accuracy with the number of model parameters and optimizing the model’s structural design in order to improve the computational efficiency, reduce resource demands and thus better adapt to practical application requirements.

Author Contributions

L.C.: conceptualization, methodology, software, formal analysis, project administration, investigation, writing—original draft, and writing—review and editing; S.X.: data curation, investigation, and funding acquisition; X.L.: data curation, investigation; Z.X.: data curation, investigation; H.C.: data curation, investigation; F.L.: data curation, investigation; Y.W.: data curation, investigation; M.Z.: data curation, investigation, funding acquisition, and writing—original draft. All authors have read and agreed to the published version of the manuscript.

Funding

This study was funded by the Furong Plan for Science and Technology Innovation Project (2025RC3184) and the Dr. Innovation Station of Hunan Province (Xiangkexitong [2024] No. 56).

Data Availability Statement

Data are contained within the article.

Conflicts of Interest

Authors Li Chen, Shaogang Xia, Xun Liu, Zhan Xie, Haohong Chen, and Feiyu Long were employed by the Hunan Agricultural Forestal and Industrial Prospective Design Institute Co., Ltd. The remaining authors declare that the research was conducted in the absence of any commercial or financial relationships that could be construed as a potential conflict of interest.

Abbreviations

The following abbreviations are used in this manuscript:
CNNConvolutional neural network
MFImultiscale feature interaction
MFFmulti-feature fusion
LNLayer Normalization
MLPMulti-Layer Perceptron
K, Keykeys
V, Valuevalues
OAoverall accuracy
Kappakappa coefficient
mIoUmean intersection over union ratio
TPtrue positives
FPfalse positives
TNtrue negatives
FNfalse negatives
no_MFFnot using MFF
WetSegNetwetland classification model

References

  1. Gardner, R.C.; Finlayson, C.M. Global wetland outlook: State of the world’s wetlands and their services to people. In Proceedings of the Ramsar Convention Secretariat, Dubai, United Arab Emirates, 22 October 2018; Ramsar Convention Secretariat: Gland, Switzerland, 2018; pp. 2020–2025. [Google Scholar]
  2. Huo, X.; Niu, Z.; Liu, L.; Jing, Y. Integration of ecological knowledge with Google Earth Engine for diverse wetland sampling in global mapping. Int. J. Appl. Earth Obs. Geoinf. 2024, 134, 104249. [Google Scholar] [CrossRef]
  3. Klemas, V. Using remote sensing to select and monitor wetland restoration sites: An overview. J. Coast. Res. 2013, 29, 958–970. [Google Scholar] [CrossRef]
  4. Zhou, N.; Chen, S.; Zhou, M.; Sui, H.; Hu, L.; Li, H.; Hua, L.; Zhou, Q. DepthSeg: Depth prompting in remote sensing semantic segmentation. arXiv 2025, arXiv:2506.14382. [Google Scholar] [CrossRef]
  5. Sun, W.; Chen, D.; Li, Z.; Li, S.; Cheng, S.; Niu, X.; Cai, Y.; Shi, Z.; Wu, C.; Yang, G. Monitoring wetland plant diversity from space: Progress and perspective. Int. J. Appl. Earth Obs. Geoinf. 2024, 130, 103943. [Google Scholar] [CrossRef]
  6. Lian, Z.; Li, J.-Z.; Liu, Y.; Jiang, Z.-L.; Li, X.-J.; Wang, J.-H. High Spatial Resolution Remote Sensing Monitoring of Artificial Wetlands: A Case Study of the Yuqiao Reservoir Estuary Wetland. In Proceedings of the IGARSS 2024–2024 IEEE International Geoscience and Remote Sensing Symposium, Athens, Greece, 7–12 July 2024; pp. 5104–5107. [Google Scholar]
  7. Wang, M.; Mao, D.; Wang, Y.; Xiao, X.; Xiang, H.; Feng, K.; Luo, L.; Jia, M.; Song, K.; Wang, Z. Wetland mapping in East Asia by two-stage object-based Random Forest and hierarchical decision tree algorithms on Sentinel-1/2 images. Remote Sens. Environ. 2023, 297, 113793. [Google Scholar] [CrossRef]
  8. Corcoran, J.M.; Knight, J.F.; Gallant, A.L. Influence of multi-source and multi-temporal remotely sensed and ancillary data on the accuracy of random forest classification of wetlands in Northern Minnesota. Remote Sens. 2013, 5, 3212–3238. [Google Scholar] [CrossRef]
  9. Pal, M. Random forest classifier for remote sensing classification. Int. J. Remote Sens. 2005, 26, 217–222. [Google Scholar] [CrossRef]
  10. Mountrakis, G.; Im, J.; Ogole, C. Support vector machines in remote sensing: A review. ISPRS J. Photogramm. Remote Sens. 2011, 66, 247–259. [Google Scholar] [CrossRef]
  11. Jamali, A.; Mahdianpari, M.; Brisco, B.; Granger, J.; Mohammadimanesh, F.; Salehi, B. Deep Forest classifier for wetland mapping using the combination of Sentinel-1 and Sentinel-2 data. GISci. Remote Sens. 2021, 58, 1072–1089. [Google Scholar] [CrossRef]
  12. Gao, L.; Liu, H.; Yang, M.; Chen, L.; Wan, Y.; Xiao, Z.; Qian, Y. STransFuse: Fusing swin transformer and convolutional neural network for remote sensing image semantic segmentation. IEEE J. Sel. Top. Appl. Earth Obs. Remote Sens. 2021, 14, 10990–11003. [Google Scholar] [CrossRef]
  13. Liu, T.; Liu, Y.; Zhang, C.; Yuan, L.; Sui, X.; Chen, Q. Hyperspectral image super-resolution via dual-domain network based on hybrid convolution. IEEE Trans. Geosci. Remote Sens. 2024, 62, 5512518. [Google Scholar] [CrossRef]
  14. Xu, M.; Liu, M.; Liu, Y.; Liu, S.; Sheng, H. Dual-branch Feature Interaction Network for Coastal Wetland Classification Using Sentinel-1 and 2. IEEE J. Sel. Top. Appl. Earth Obs. Remote Sens. 2024, 17, 14368–14379. [Google Scholar] [CrossRef]
  15. Yin, Z.; Wu, P.; Li, X.; Hao, Z.; Ma, X.; Fan, R.; Liu, C.; Ling, F. Super-resolution water body mapping with a feature collaborative CNN model by fusing Sentinel-1 and Sentinel-2 images. Int. J. Appl. Earth Obs. Geoinf. 2024, 134, 104176. [Google Scholar] [CrossRef]
  16. Ronneberger, O.; Fischer, P.; Brox, T. U-net: Convolutional networks for biomedical image segmentation. In Proceedings of the Medical Image Computing and Computer-Assisted Intervention–MICCAI 2015: 18th International Conference, Munich, Germany, 5–9 October 2015; Proceedings, Part III 18. pp. 234–241. [Google Scholar]
  17. Lv, Z.; Huang, H.; Sun, W.; Lei, T.; Benediktsson, J.A.; Li, J. Novel enhanced UNet for change detection using multimodal remote sensing image. IEEE Geosci. Remote Sens. Lett. 2023, 20, 2505405. [Google Scholar] [CrossRef]
  18. Ates, G.C.; Mohan, P.; Celik, E. Dual cross-attention for medical image segmentation. Eng. Appl. Artif. Intell. 2023, 126, 107139. [Google Scholar] [CrossRef]
  19. Wang, H.; Cao, P.; Wang, J.; Zaiane, O.R. Uctransnet: Rethinking the skip connections in u-net from a channel-wise perspective with transformer. In Proceedings of the AAAI Conference on Artificial Intelligence, Virtual, 22 February–1 March 2022; pp. 2441–2449. [Google Scholar]
  20. Qi, W.; Huang, C.; Wang, Y.; Zhang, X.; Sun, W.; Zhang, L. Global–local 3-D convolutional transformer network for hyperspectral image classification. IEEE Trans. Geosci. Remote Sens. 2023, 61, 1–20. [Google Scholar] [CrossRef]
  21. Wang, W.; Tang, C.; Wang, X.; Zheng, B. A ViT-based multiscale feature fusion approach for remote sensing image segmentation. IEEE Geosci. Remote Sens. Lett. 2022, 19, 1–5. [Google Scholar] [CrossRef]
  22. Wang, Z.; Liao, Z.; Zhou, B.; Yu, G.; Luo, W. SwinURNet: Hybrid transformer-cnn architecture for real-time unstructured road segmentation. IEEE Trans. Instrum. Meas. 2024, 73, 5035816. [Google Scholar] [CrossRef]
  23. Zhang, C.; Jiang, W.; Zhang, Y.; Wang, W.; Zhao, Q.; Wang, C. Transformer and CNN hybrid deep neural network for semantic segmentation of very-high-resolution remote sensing imagery. IEEE Trans. Geosci. Remote Sens. 2022, 60, 4408820. [Google Scholar] [CrossRef]
  24. Ibtehaz, N.; Rahman, M.S. MultiResUNet: Rethinking the U-Net architecture for multimodal biomedical image segmentation. Neural Netw. 2020, 121, 74–87. [Google Scholar] [CrossRef]
  25. Zhou, Z.; Siddiquee, M.M.R.; Tajbakhsh, N.; Liang, J. Unet++: Redesigning skip connections to exploit multiscale features in image segmentation. IEEE Trans. Med. Imaging 2019, 39, 1856–1867. [Google Scholar] [CrossRef]
  26. Vaswani, A.; Shazeer, N.; Parmar, N.; Uszkoreit, J.; Jones, L.; Gomez, A.N.; Kaiser, Ł.; Polosukhin, I. Attention is all you need. arXiv 2017, arXiv:1706.03762. [Google Scholar] [CrossRef]
  27. Liu, Z.; Lin, Y.; Cao, Y.; Hu, H.; Wei, Y.; Zhang, Z.; Lin, S.; Guo, B. Swin transformer: Hierarchical vision transformer using shifted windows. arXiv 2021, arXiv:2103.14030. [Google Scholar] [CrossRef]
  28. Aleissaee, A.A.; Kumar, A.; Anwer, R.M.; Khan, S.; Cholakkal, H.; Xia, G.-S.; Khan, F.S. Transformers in Remote Sensing: A Survey. Remote Sens. 2023, 15, 1860. [Google Scholar] [CrossRef]
  29. Song, P.; Li, J.; An, Z.; Fan, H.; Fan, L. CTMFNet: CNN and transformer multiscale fusion network of remote sensing urban scene imagery. IEEE Trans. Geosci. Remote Sens. 2022, 61, 5900314. [Google Scholar] [CrossRef]
  30. Zhou, N.; Xu, M.; Shen, B.; Hou, K.; Liu, S.; Sheng, H.; Liu, Y.; Wan, J. ViT-UNet: A Vision Transformer Based UNet Model for Coastal Wetland Classification Based on High Spatial Resolution Imagery. IEEE J. Sel. Top. Appl. Earth Obs. Remote Sens. 2024, 17, 19575–19587. [Google Scholar] [CrossRef]
  31. He, X.; Zhou, Y.; Zhao, J.; Zhang, D.; Yao, R.; Xue, Y. Swin transformer embedding UNet for remote sensing image semantic segmentation. IEEE Trans. Geosci. Remote Sens. 2022, 60, 4408715. [Google Scholar] [CrossRef]
  32. Guo, D.; Fu, Y.; Zhu, Y.; Wen, W. Semantic Segmentation of Remote Sensing Image via Self-Attention-Based Multi-Scale Feature Fusion. J. Comput.-Aided Des. Comput. Graph. 2023, 35, 1259–1268. [Google Scholar] [CrossRef]
  33. Takikawa, T.; Acuna, D.; Jampani, V.; Fidler, S. Gated-scnn: Gated shape cnns for semantic segmentation. In Proceedings of the IEEE/CVF International Conference on Computer Vision, Seoul, Republic of Korea, 27 October–2 November 2019; pp. 5229–5238. [Google Scholar]
  34. Lin, H.; Cheng, X.; Wu, X.; Shen, D. Cat: Cross attention in vision transformer. In Proceedings of the 2022 IEEE International Conference on Multimedia and Expo (ICME), Taipei, Taiwan, 18–22 July 2022; pp. 1–6. [Google Scholar]
  35. Zhang, M.; Lin, H.; Long, X. Wetland classification method using fully convolutional neural network and Stacking algorithm. Trans. Chin. Soc. Agric. Eng. 2020, 36, 257–264. [Google Scholar]
  36. Zhao, J.; Liu, S.; Wang, Z.; Gao, H.; Feng, S.; Wei, B.; Hou, Z.; Xiao, F.; Jing, L.; Liao, X. The impact of land use and landscape pattern on ecosystem services in the Dongting lake region, China. Remote Sens. 2023, 15, 2228. [Google Scholar] [CrossRef]
  37. Zhang, D.-D.; Xie, F.; Zhang, L. Preprocessing and fusion analysis of GF-2 satellite Remote-sensed spatial data. In Proceedings of the 2018 International Conference on Information Systems and Computer Aided Education (ICISCAE), Changchun, China, 6–8 July 2018; pp. 24–29. [Google Scholar]
  38. He, K.; Zhang, X.; Ren, S.; Sun, J. Deep residual learning for image recognition. In Proceedings of the IEEE Conference on Computer Vision and Pattern Recognition, Las Vegas, Nevada, USA, 27–30 June 2016; pp. 770–778. [Google Scholar]
  39. Jaderberg, M.; Simonyan, K.; Zisserman, A.; Kavukcuoglu, K. Spatial Transformer Networks. arXiv 2016, arXiv:1506.02025. [Google Scholar] [PubMed]
  40. Chen, L.-C.; Zhu, Y.; Papandreou, G.; Schroff, F.; Adam, H. Encoder-decoder with atrous separable convolution for semantic image segmentation. In Proceedings of the European Conference on Computer Vision (ECCV), Munich, Germany, 8–14 September 2018; pp. 801–818. [Google Scholar]
  41. Dosovitskiy, A.; Beyer, L.; Kolesnikov, A.; Weissenborn, D.; Zhai, X.; Unterthiner, T.; Dehghani, M.; Minderer, M.; Heigold, G.; Gelly, S. An image is worth 16x16 words: Transformers for image recognition at scale. arXiv 2020, arXiv:2010.11929. [Google Scholar]
  42. Chen, J.; Lu, Y.; Yu, Q.; Luo, X.; Adeli, E.; Wang, Y.; Lu, L.; Yuille, A.L.; Zhou, Y. Transunet: Transformers make strong encoders for medical image segmentation. arXiv 2021, arXiv:2102.04306. [Google Scholar] [CrossRef]
  43. Wang, L.; Li, R.; Zhang, C.; Fang, S.; Duan, C.; Meng, X.; Atkinson, P.M. UNetFormer: A UNet-like transformer for efficient semantic segmentation of remote sensing urban scene imagery. ISPRS J. Photogramm. Remote Sens. 2022, 190, 196–214. [Google Scholar] [CrossRef]
  44. Radman, A.; Mohammadimanesh, F.; Mahdianpari, M. Wet-ConViT: A Hybrid Convolutional–Transformer Model for Efficient Wetland Classification Using Satellite Data. Remote Sens. 2024, 16, 2673. [Google Scholar]
  45. Marjani, M.; Mahdianpari, M.; Mohammadimanesh, F.; Gill, E.W. CVTNet: A fusion of convolutional neural networks and vision transformer for wetland mapping using sentinel-1 and sentinel-2 satellite data. Remote Sens. 2024, 16, 2427. [Google Scholar] [CrossRef]
  46. Li, H.; Wang, C.; Cui, Y.; Hodgson, M. Mapping salt marsh along coastal South Carolina using U-Net. ISPRS J. Photogramm. Remote Sens. 2021, 179, 121–132. [Google Scholar] [CrossRef]
  47. Chen, Z.; Chen, J.; Yue, Y.; Lan, Y.; Ling, M.; Li, X.; You, H.; Han, X.; Zhou, G. Tradeoffs among multi-source remote sensing images, spatial resolution, and accuracy for the classification of wetland plant species and surface objects based on the MRS_DeepLabV3+ model. Ecol. Inform. 2024, 81, 102594. [Google Scholar]
  48. Xiao, T.; Liu, Y.; Huang, Y.; Li, M.; Yang, G. Enhancing multiscale representations with transformer for remote sensing image semantic segmentation. IEEE Trans. Geosci. Remote Sens. 2023, 61, 5605116. [Google Scholar] [CrossRef]
  49. Li, J.; Cai, Y.; Li, Q.; Kou, M.; Zhang, T. A review of remote sensing image segmentation by deep learning methods. Int. J. Digit. Earth 2024, 17, 2328827. [Google Scholar] [CrossRef]
  50. Xiong, Y.; Xiao, X.; Yao, M.; Cui, H.; Fu, Y. Light4Mars: A lightweight transformer model for semantic segmentation on unstructured environment like Mars. ISPRS J. Photogramm. Remote Sens. 2024, 214, 167–178. [Google Scholar] [CrossRef]
  51. Chen, S.; Yun, L.; Liu, Z.; Zhu, J.; Chen, J.; Wang, H.; Nie, Y. LightFormer: A lightweight and efficient decoder for remote sensing image segmentation. arXiv 2025, arXiv:2504.10834. [Google Scholar] [CrossRef]
  52. Long, X.; Lin, H.; An, X.; Chen, S.; Qi, S.; Zhang, M. Evaluation and analysis of ecosystem service value based on land use/cover change in Dongting Lake wetland. Ecol. Indic. 2022, 136, 108619. [Google Scholar] [CrossRef]
  53. Xing, L.; Chi, L.; Han, S.; Wu, J.; Zhang, J.; Jiao, C.; Zhou, X. Spatiotemporal Dynamics of Wetland in Dongting Lake Based on Multi-Source Satellite Observation Data during Last Two Decades. Int. J. Environ. Res. Public Health 2022, 19, 14180. [Google Scholar] [CrossRef]
  54. Xing, L.; Tang, X.; Wang, H.; Fan, W.; Wang, G. Monitoring monthly surface water dynamics of Dongting Lake using Sentinel-1 data at 10 m. PeerJ 2018, 6, e4992. [Google Scholar] [CrossRef] [PubMed]
  55. Zhang, Y.; Huang, D.; Jin, X.; Li, L.; Wang, C.; Wang, Y.; Pellissier, L.; Johnson, A.C.; Wu, F.; Zhang, X. Long-term wetland biomonitoring highlights the differential impact of land use on macroinvertebrate diversity in Dongting Lake in China. Commun. Earth Environ. 2024, 5, 32. [Google Scholar] [CrossRef]
  56. Huth, J.; Gessner, U.; Klein, I.; Yesou, H.; Lai, X.; Oppelt, N.; Kuenzer, C. Analyzing water dynamics based on Sentinel-1 time series—A study for Dongting lake wetlands in China. Remote Sens. 2020, 12, 1761. [Google Scholar] [CrossRef]
  57. Peng, H.; Tang, Z.; Chen, Z.; Wu, Y.; Yuan, Y.; Shi, Q.; Li, L.; Chen, H. Geospatial perspective for monitoring SDG 6.6.1 based on spatial and temporal analysis of lake water storage variations in Dongting Lake, China. J. Hydrol. Reg. Stud. 2025, 57, 102175. [Google Scholar] [CrossRef]
  58. Zhu, Y.; Li, C.; Feng, J. The protected areas system policy enhances habitat quality conservation effectiveness in Dongting Lake Eco-Economic Zone. J. Clean. Prod. 2025, 504, 145425. [Google Scholar] [CrossRef]
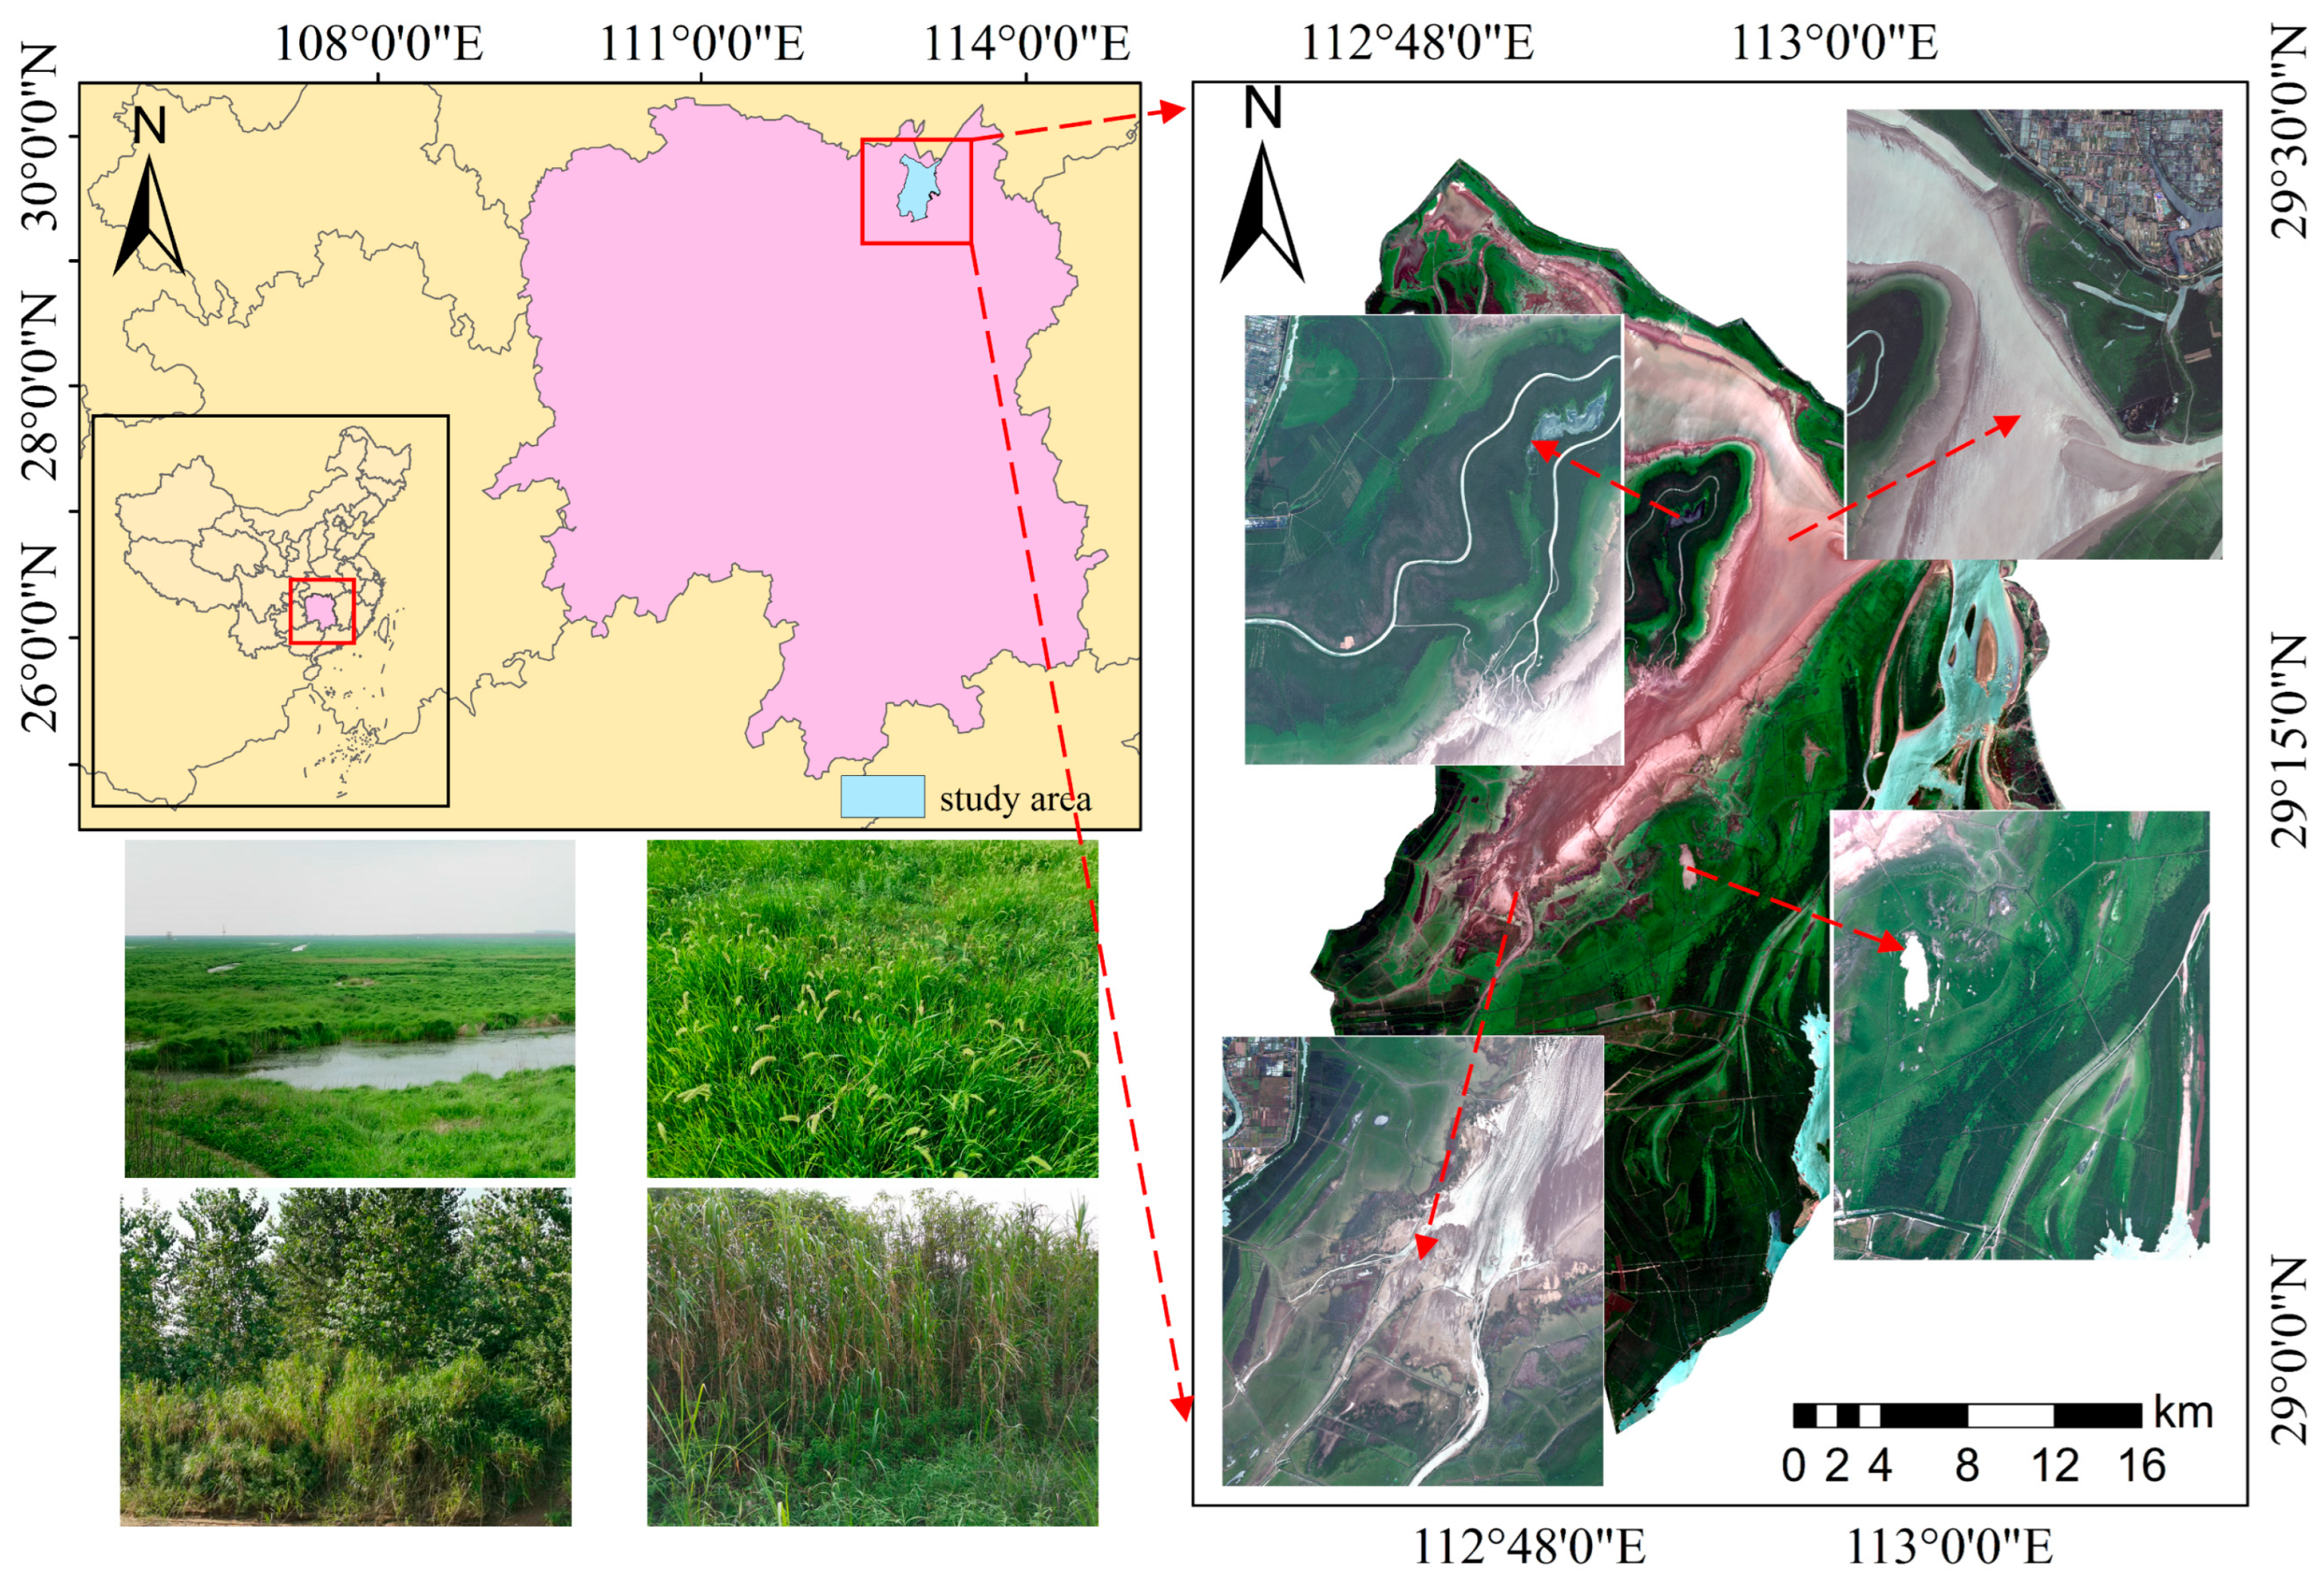
Figure 1. Overview map of the Dongting Lake wetland study area, showing its geographic location and major land cover types.
Remotesensing 17 03330 g001
Figure 2. Wetland categories in the dataset: reeds, sedges, farmland, forests, water, and mudflats.
Remotesensing 17 03330 g002
Figure 3. Flowchart of the study, illustrating the data preprocessing, dataset construction, model training, and evaluation processes.
Remotesensing 17 03330 g003
Figure 4. Structure of WetSegNet.
Remotesensing 17 03330 g004
Figure 5. Structure of a residual unit in ResNet, showing the skip connection that enables deep network training.
Remotesensing 17 03330 g005
Figure 6. Two successive Swin Transformer Blocks.
Remotesensing 17 03330 g006
Figure 7. Structure of the Multi-Scale Feature Interaction (MFI) module, which employs cross-attention to integrate multi-level features.
Remotesensing 17 03330 g007
Figure 8. Structure of the Multi-Feature Fusion (MFF) module, in which edge maps and spatial attention are combined to enhance boundary features.
Remotesensing 17 03330 g008
Figure 9. Distribution of pixel counts across six wetland categories in the Dongting Lake dataset, highlighting class imbalance between dominant (sedges, reeds) and less dominant (farmland, forests) types.
Remotesensing 17 03330 g009
Figure 10. Training and validation convergence curves of WetSegNet, showing Kappa, OA, and mIoU.
Remotesensing 17 03330 g010
Figure 11. Confusion matrix of WetSegNet on the test set, illustrating classification accuracy and misclassifications among wetland categories.
Remotesensing 17 03330 g011
Figure 12. Example classification results of WetSegNet on GF-2 images, comparing reference labels and predictions across different wetland types.
Remotesensing 17 03330 g012
Figure 13. Comparative results with other models, showing that WetSegNet achieves clearer category boundaries.
Remotesensing 17 03330 g013
Figure 14. Results of second comparative experiment.
Remotesensing 17 03330 g014
Figure 15. Comparison chart showing the effect of the MFI module (A) is the WetSegNet category activation map without the MFI module, (B) is the WetSegNet category activation map with the MFI module).
Remotesensing 17 03330 g015
Figure 16. Effect of the MFF module, showing WetSegNet produces more continuous and accurate boundaries compared to the no-MFF variant.
Remotesensing 17 03330 g016
Figure 17. Effect of the MFI module, showing WetSegNet captures multi-scale features and clearer boundaries compared to the no-MFI variant. (a) Highly fragmented region; (b) Less fragmented region.
Remotesensing 17 03330 g017
Table 1. Experimental settings.
SettingDetail
FrameworkPyTorch
GPUNVIDIA RTX3060
Learning rate0.0001
OptimizerSGD
Batch size8
Epoch300
Table 2. The performance of different models on the test set.
Metric
UA (%)mIoU
(%)
KappaOA
(%)
Model ReedSedgeFarmlandForestWaterMudflat
CNNDeepLabV3+79.8482.8277.8462.8459.8730.3863.500.7883.61
UNet88.9789.4281.6180.0789.4880.2177.010.8387.51
TransformerVision Transformer53.7176.2427.4245.2859.8730.3834.030.3856.32
Swin Transformer71.9886.5472.3964.5675.6886.4564.320.7279.11
CNN+
Transformer
TransUNet84.9491.2681.7082.0490.9380.8776.920.8588.38
UNetFormer88.8487.4888.8790.2787.9183.1977.690.8487.65
WetSegNet90.8392.2981.8688.1290.2089.8382.910.8890.81
Table 3. Ablation study: Performance of WetSegNet with different module configurations on the test set.
ModuleUA (%)mIoU
(%)
KappaOA
(%)
MFFMFIReedSedgeFarmlandForestWaterMudflat
-88.2589.8281.8483.8487.3783.5980.210.8588.46
-89.5289.9581.3384.3088.7285.8879.220.8689.43
90.8392.2981.8688.1290.2089.8382.910.8890.81
Table 4. Efficiency comparison of models.
MethodBackboneInference Time (ms)Parameters (M)
UNetResNet-5045.9927.48
DeepLabV3+ResNet-5095.9939.64
Vision TransformerViT66.937.00
Swin TransformerSwin-T19.9910.02
TransUNetResNet-50144.7293.23
WetSegNetResNet-5041.98297.75
Disclaimer/Publisher’s Note: The statements, opinions and data contained in all publications are solely those of the individual author(s) and contributor(s) and not of MDPI and/or the editor(s). MDPI and/or the editor(s) disclaim responsibility for any injury to people or property resulting from any ideas, methods, instructions or products referred to in the content.