1. Introduction
Clouds play a crucial role in regulating Earth’s radiation balance and maintaining the global water cycle. However, uncertainties in their vertical structure and spatiotemporal evolution remain key challenges that limit the accuracy of climate simulations and forecasts [
1,
2]. Due to its high sensitivity and fine vertical resolution, Ka-band cloud radar has become a pivotal observational tool for monitoring cloud structure and precipitation evolution processes, serving as a key payload in various platforms including CloudSat [
3], Cloudnet [
4,
5,
6], and multiple ground-based observational networks. While Ka-band radar systems exhibit high sensitivity to meteorological hydrometeors (e.g., cloud droplets, ice crystals, and raindrops) [
7,
8,
9,
10,
11], they also frequently detect echoes from non-meteorological targets such as insects, atmospheric turbulence, and refractive layers [
7,
12,
13,
14,
15]. These clear-air echoes often appear as weak returns similar to low-level liquid clouds in radar observations. If inaccurately identified and removed, they can significantly distort products such as cloud fraction, cloud-base height, and hydrometeor classification. Zou et al. (2025) [
16] indicated that clear-air echoes could constitute approximately 16.7% of total radar returns within 0–6 km altitude. False classification of these echoes reduces the accuracy of cloud-radiation coupling analysis, quantitative precipitation estimation, and hydrometeor lifecycle evaluation [
17,
18,
19].
Although clear-air echoes differ physically from hydrometeors, their signal characteristics often overlap in real observations, creating classification challenges. Insect echoes usually show low reflectivity (−40 to −10 dBZ), near-zero velocity, narrow Doppler spectra (<0.2 m/s), and relatively high LDR (>−17 dB) [
7,
8]. Refractive layers also produce weak, layered reflectivity, while weak precipitation or melting ice may mimic insect signatures in both reflectivity and LDR [
5,
6,
18]. Meanwhile, LDR signals frequently experience missing values due to attenuation with distance and weak target reflectivity of cross-polarization. Particularly at cloud boundaries or edges of precipitation, weak signals often fall below system polarization detection thresholds. Additionally, when insects and meteorological targets coexist within a range gate, insect polarization signals may mask the true meteorological signal, causing misleading LDR enhancements.
Cloudnet is a European-led multi-sensor cloud observation collaborative platform [
5], part of the European Research Infrastructure ACTRIS, and has integrated a standardized radar echo classification framework within the data processing chain [
20]. It employs a fuzzy logic method that integrates radar reflectivity, spectral width, LDR, and atmospheric temperature variables to achieve pixel-level classification of meteorological and non-meteorological echoes. Under ideal conditions with complete LDR observations, this algorithm exhibits good stability and interpretability across various scenarios. Nevertheless, the algorithm faces limitations when LDR data are incomplete: firstly, in weak precipitation or cloud-edge regions, low reflectivity (<−30 dBZ) often causes LDR below system sensitivity, resulting in the fuzzy logic model misclassifying genuine meteorological signals as clear-air echoes, thus missing precipitation events. Secondly, in high-altitude or winter conditions where LDR is missing, Cloudnet heavily relies on ambient temperature, defaulting to classifying signals as meteorological echoes. This excessive reliance on temperature in the absence of LDR data often leads to the misclassification of clear-air echoes as meteorological echoes at high altitudes near 0 °C, where the echo textures are scattered and discontinuous.
It is worth noting that these weak, discrete clear-air echoes around 0 °C could originate from residual insect activity in low-temperature conditions or from large aerosol particles, dust, or atmospheric refraction [
9,
15,
21]. Typically characterized by spatial discontinuity, missing LDR, and the absence of clear lidar signals due to the lidar’s low sensitivity to insects and narrow field of view, such echoes are generally considered clear-air echoes [
9,
22]. Zou et al. (2025) highlighted that spatial continuity and textural features demonstrate greater robustness in distinguishing meteorological echoes compared to incomplete LDR signals [
16]. Excessive reliance on LDR or temperature, neglecting spatial structural characteristics, tends to cause misclassifications in current fuzzy logic algorithms [
20].
Prior research by Zou et al. (2025), based on joint observations from China’s national observation net of Ka-band radar and multi-wavelength lidar, created a dataset encompassing various meteorological scenarios and proposed a deep-learning-based echo classification method [
16]. Utilizing the U-Net architecture—a convolutional neural network designed for image segmentation with an encoder–decoder structure and skip connections—this approach significantly enhanced the capability to capture echo continuity and morphological features, considerably reducing reliance on complete LDR channels [
16]. In tests where LDR data were missing, the proposed U-Net with the Squeeze-and-Excitation (SE) block (UNet + SE) model achieved a mean Intersection-over-Union (mIoU) of 0.958 and a Dice coefficient of 0.978, improving approximately 31.7% and 23.3%, respectively, over the fuzzy logic method (mIoU = 0.727, Dice = 0.793). Furthermore, its GPU inference time was 0.562 s—only 3.2% of the fuzzy logic algorithm—substantially enhancing computational efficiency while maintaining high accuracy.
Although the previous study demonstrated deep learning’s strong potential in this task, its validation was primarily conducted with cloud radar observations from Chinese meteorological stations. To further evaluate this method’s applicability across international observational platforms, we adapted and fine-tuned the deep learning method and implemented it for the Cloudnet dataset, conducting systematic validation with various typical observational cases. By comparing with existing Cloudnet classification products, this study aims to identify potential limitations in current clear-air echo classification, assess the generalization capability and physical consistency of the deep learning algorithm under complex observational conditions, and specifically discuss the role of temperature in clear-air echo detection and related shortcomings in current fuzzy logic approaches. These findings provide insights into the limitations of current schemes and highlight key aspects for refining the Cloudnet classification algorithm.
This paper is organized as follows:
Section 1 introduces the research background;
Section 2 details the data sources and instrumentation parameters;
Section 3 describes the deep learning classification method and Cloudnet’s existing classification strategy;
Section 4.1 analyzes Cloudnet’s classification issues and the deep learning model’s improvements using typical case studies with multi-source observations;
Section 4.2 evaluates model robustness based on multi-site and varying meteorological conditions;
Section 4.3 discusses clear-air echo spatial-temporal distribution patterns and the rationale of relying heavily on temperature as a classification criterion using long-term data from sites with different climatic conditions; and
Section 5 presents conclusions and discussions.
2. Data and Instrumentation
The data used in this study originates from publicly available observational datasets provided by the Cloudnet monitoring network. Specifically, Ka-band cloud radar data from eight selected Cloudnet sites throughout 2024 are analyzed and validated. Each selected site is equipped with METEK-manufactured MIRA-35 series Ka-band Doppler cloud radar systems, including the fixed-type MIRA-35 and the scanning-capable MIRA-35S models. The operational frequency range of these radars is 33–37 GHz, with a recommended central frequency of 35.2 GHz, providing high sensitivity and fine temporal resolution. All radar systems include LDR measurement capabilities for distinguishing hydrometeor types (such as liquid water droplets, ice crystals, and insects). Technical parameters of the MIRA-35 series radars are summarized in
Table 1.
In this research, Ka-band cloud radar data are utilized for constructing radar reflectivity images and input features. Cloudnet’s classification products serve as the reference baseline. Additionally, lidar and ground meteorological station measurements provide supplementary external information, particularly useful for verification and support in cases where Cloudnet classification results are uncertain or disputed, thereby assisting in accurately identifying the true nature of non-meteorological echoes.
3. Methods
Previous research by Zou et al. (2025) [
16], based on systematic channel importance evaluation and statistical feature analysis, demonstrated that spatial textural features—such as echo continuity—exhibit greater stability and discriminatory power than incomplete or noise-contaminated linear depolarization ratio (LDR) measurements when identifying clear-air echoes. Leveraging the ability of deep learning (DL) to capture spatial structures, Zou et al. (2025) [
16] proposed a UNet-based classification model, which achieved substantially higher performance than traditional algorithms across diverse meteorological scenarios.
Building upon this framework, the present study first pretrained the UNet-based model on the multi-weather-scene dataset developed by Zou et al. (2025) [
16]. The model was then fine-tuned through a small-scale transfer learning process using ten randomly selected days of lidar–radar co-observations from the Bucharest station (May 2024) within Cloudnet. This period was deliberately chosen to (1) differ from the subsequent analysis period, ensuring independence between training and validation; (2) rely on a single station only, so as to test robustness and verify that the DL model learns signal morphology rather than overfitting site-specific conditions; and (3) use only a limited amount of labeled data, thereby highlighting the generalizability of the pretrained model and showing that minimal fine-tuning is sufficient for transferring the method to other platforms. While longer fine-tuning periods could in principle be used, they would not necessarily improve generalization and might amplify labeling uncertainties.
For fine-tuning, the dataset was split after segmentation, with 20% reserved for validation, and the model with the highest intersection-over-union (IoU) score was selected for subsequent statistical analyses. Because the evaluation metrics already reached very high values, and because expert labeling inevitably introduces uncertainty, we chose not to extend the discussion of numerical performance metrics further in this paper. Detailed descriptions of training configurations and additional validation can be found in Zou et al. (2025) [
16] and in the accompanying open-source repository.
This fine-tuning step was designed to enhance the model’s adaptability to Cloudnet’s instrumental settings and observational conditions. Bucharest was selected due to its relatively rich instrumentation setup, rather than any specific meteorological feature. Data pre-processing and labeling procedures followed the methods described in Zou et al. (2025) [
16] and are therefore not repeated here.
To evaluate the DL model’s classification performance within the Cloudnet, we compared it directly with Cloudnet’s existing non-meteorological echo identification algorithm. The existing algorithm is implemented within the
CloudnetPy module, which is an integrated data processing platform for Cloudnet [
20]. This heuristic algorithm treats clear-air echoes, particularly those caused by insect scattering, as a distinct class of non-meteorological targets and employs probability-based modeling to identify them. Initially, it constructs probability functions separately for multiple radar variables, including reflectivity (Z), Doppler spectral width, vertical velocity (V), LDR, and temperature (T), with conditional logic depending on whether LDR channel information is available:
When LDR data are available: LDR (linear depolarization ratio, in dB) serves as the primary criterion, combined with the air temperature
T (in K) to form a probability field. The main decision factor for insect identification is given by Equation (1):
where
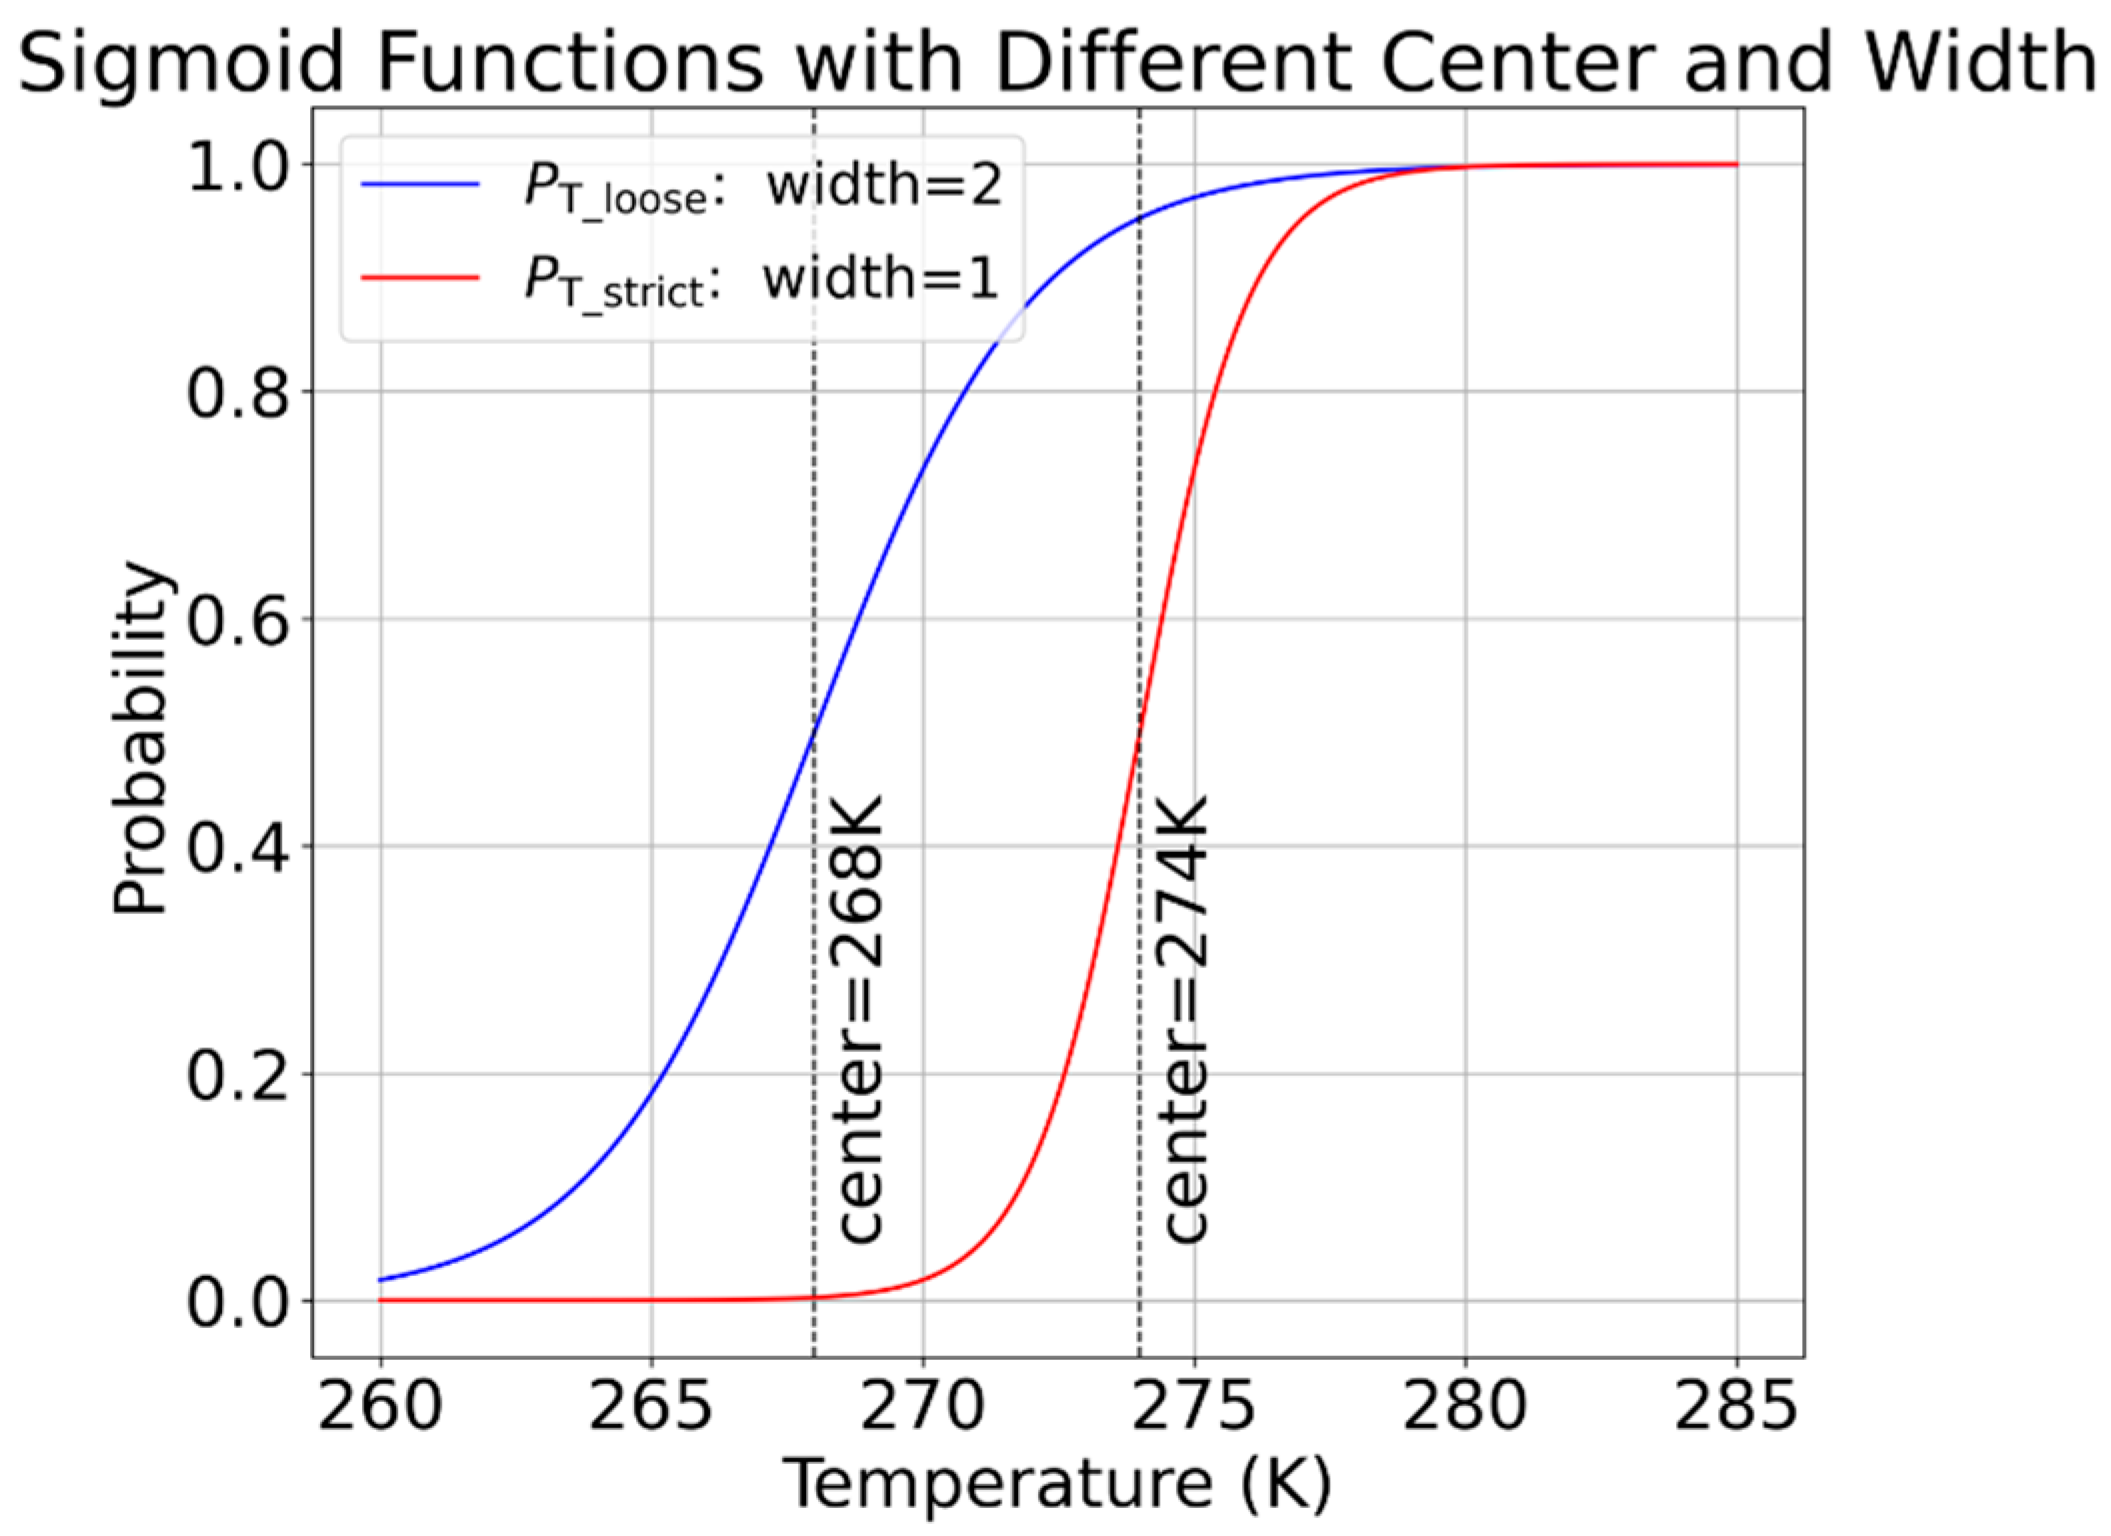
In this context, the sigmoid function maps physical variables into a probability-like field, with the center indicating the inflection point where the sigmoid value equals 0.5, and the width controlling the steepness of the transition. A larger width results in a more gradual transition, reflecting a looser constraint. Specifically, adopts a relatively broad constraint on temperature, implying that insect-related echoes are favored under warm conditions (typically above −5 °C), though without a sharply defined cutoff.
Equations (2) and (3) indicate that LDR and temperature jointly contribute to the classification of non-meteorological echoes when LDR observations are available. Echoes are classified as insect-related only when the LDR is relatively high (e.g., >−17 dBZ) and the ambient environment is sufficiently warm, as captured by the smooth sigmoid weighting.
When LDR data are unavailable: Cloudnet employs an alternative combination of reflectivity, spectral width, Doppler velocity, and environmental temperature for joint probability estimation as shown in Equation (4):
with typical parameter settings shown in Equations (5) to (8):
where
(radar reflectivity, dBZ) relates to target size and concentration,
(spectral width, m/s) measures variability in Doppler velocity within a radar pulse volume, and
(Doppler velocity, m/s) describes mean radial velocity.
Thus, although no explicit weighting factor is used, due to the small width parameter, temperature effectively acts as a “primary threshold”, while other variables mainly serve to enhance discriminative power. And the probability function is shown in
Figure 1. The underlying logic emphasizes that, in the absence of LDR data, temperature imposes strict constraints—the colder the environment, the lower the probability of identifying clear-air echoes.
By transferring the DL model onto the Cloudnet platform and systematically comparing it with the aforementioned fuzzy logic method, this study aims to evaluate the DL model’s ability to generalize and identify non-meteorological echoes within a cross-platform context. Furthermore, we aim to assess potential limitations and improvement potentials of Cloudnet’s current classification strategy. Additionally, this research will utilize the DL model to explore temporal and spatial distribution patterns of clear-air echoes, thereby providing theoretical support and practical evidence for future optimization of Cloudnet’s cloud radar echo classification algorithms.
4. Results
4.1. Case-Based Validation Analysis
To comprehensively assess the applicability of Cloudnet’s fuzzy logic classification algorithm under complex meteorological conditions and verify the generalization capability of the DL model proposed in this study, three representative observational cases (Cases 1–3) from the Lampedusa station in the Mediterranean region were selected for comparative analysis. This site, characterized by frequent clear-air echo contamination and diverse weather conditions, was not included in model training, making it a representative and independent case for evaluating the generalization capability of the deep learning model [
23]. These cases respectively represent typical scenarios such as weak precipitation, misclassification of meteorological echoes as clear-air echoes, and mixed echo types, thereby clearly highlighting the limitations of existing classification strategies.
4.1.1. Case 1: Misclassification at Precipitation Edges Without LDR
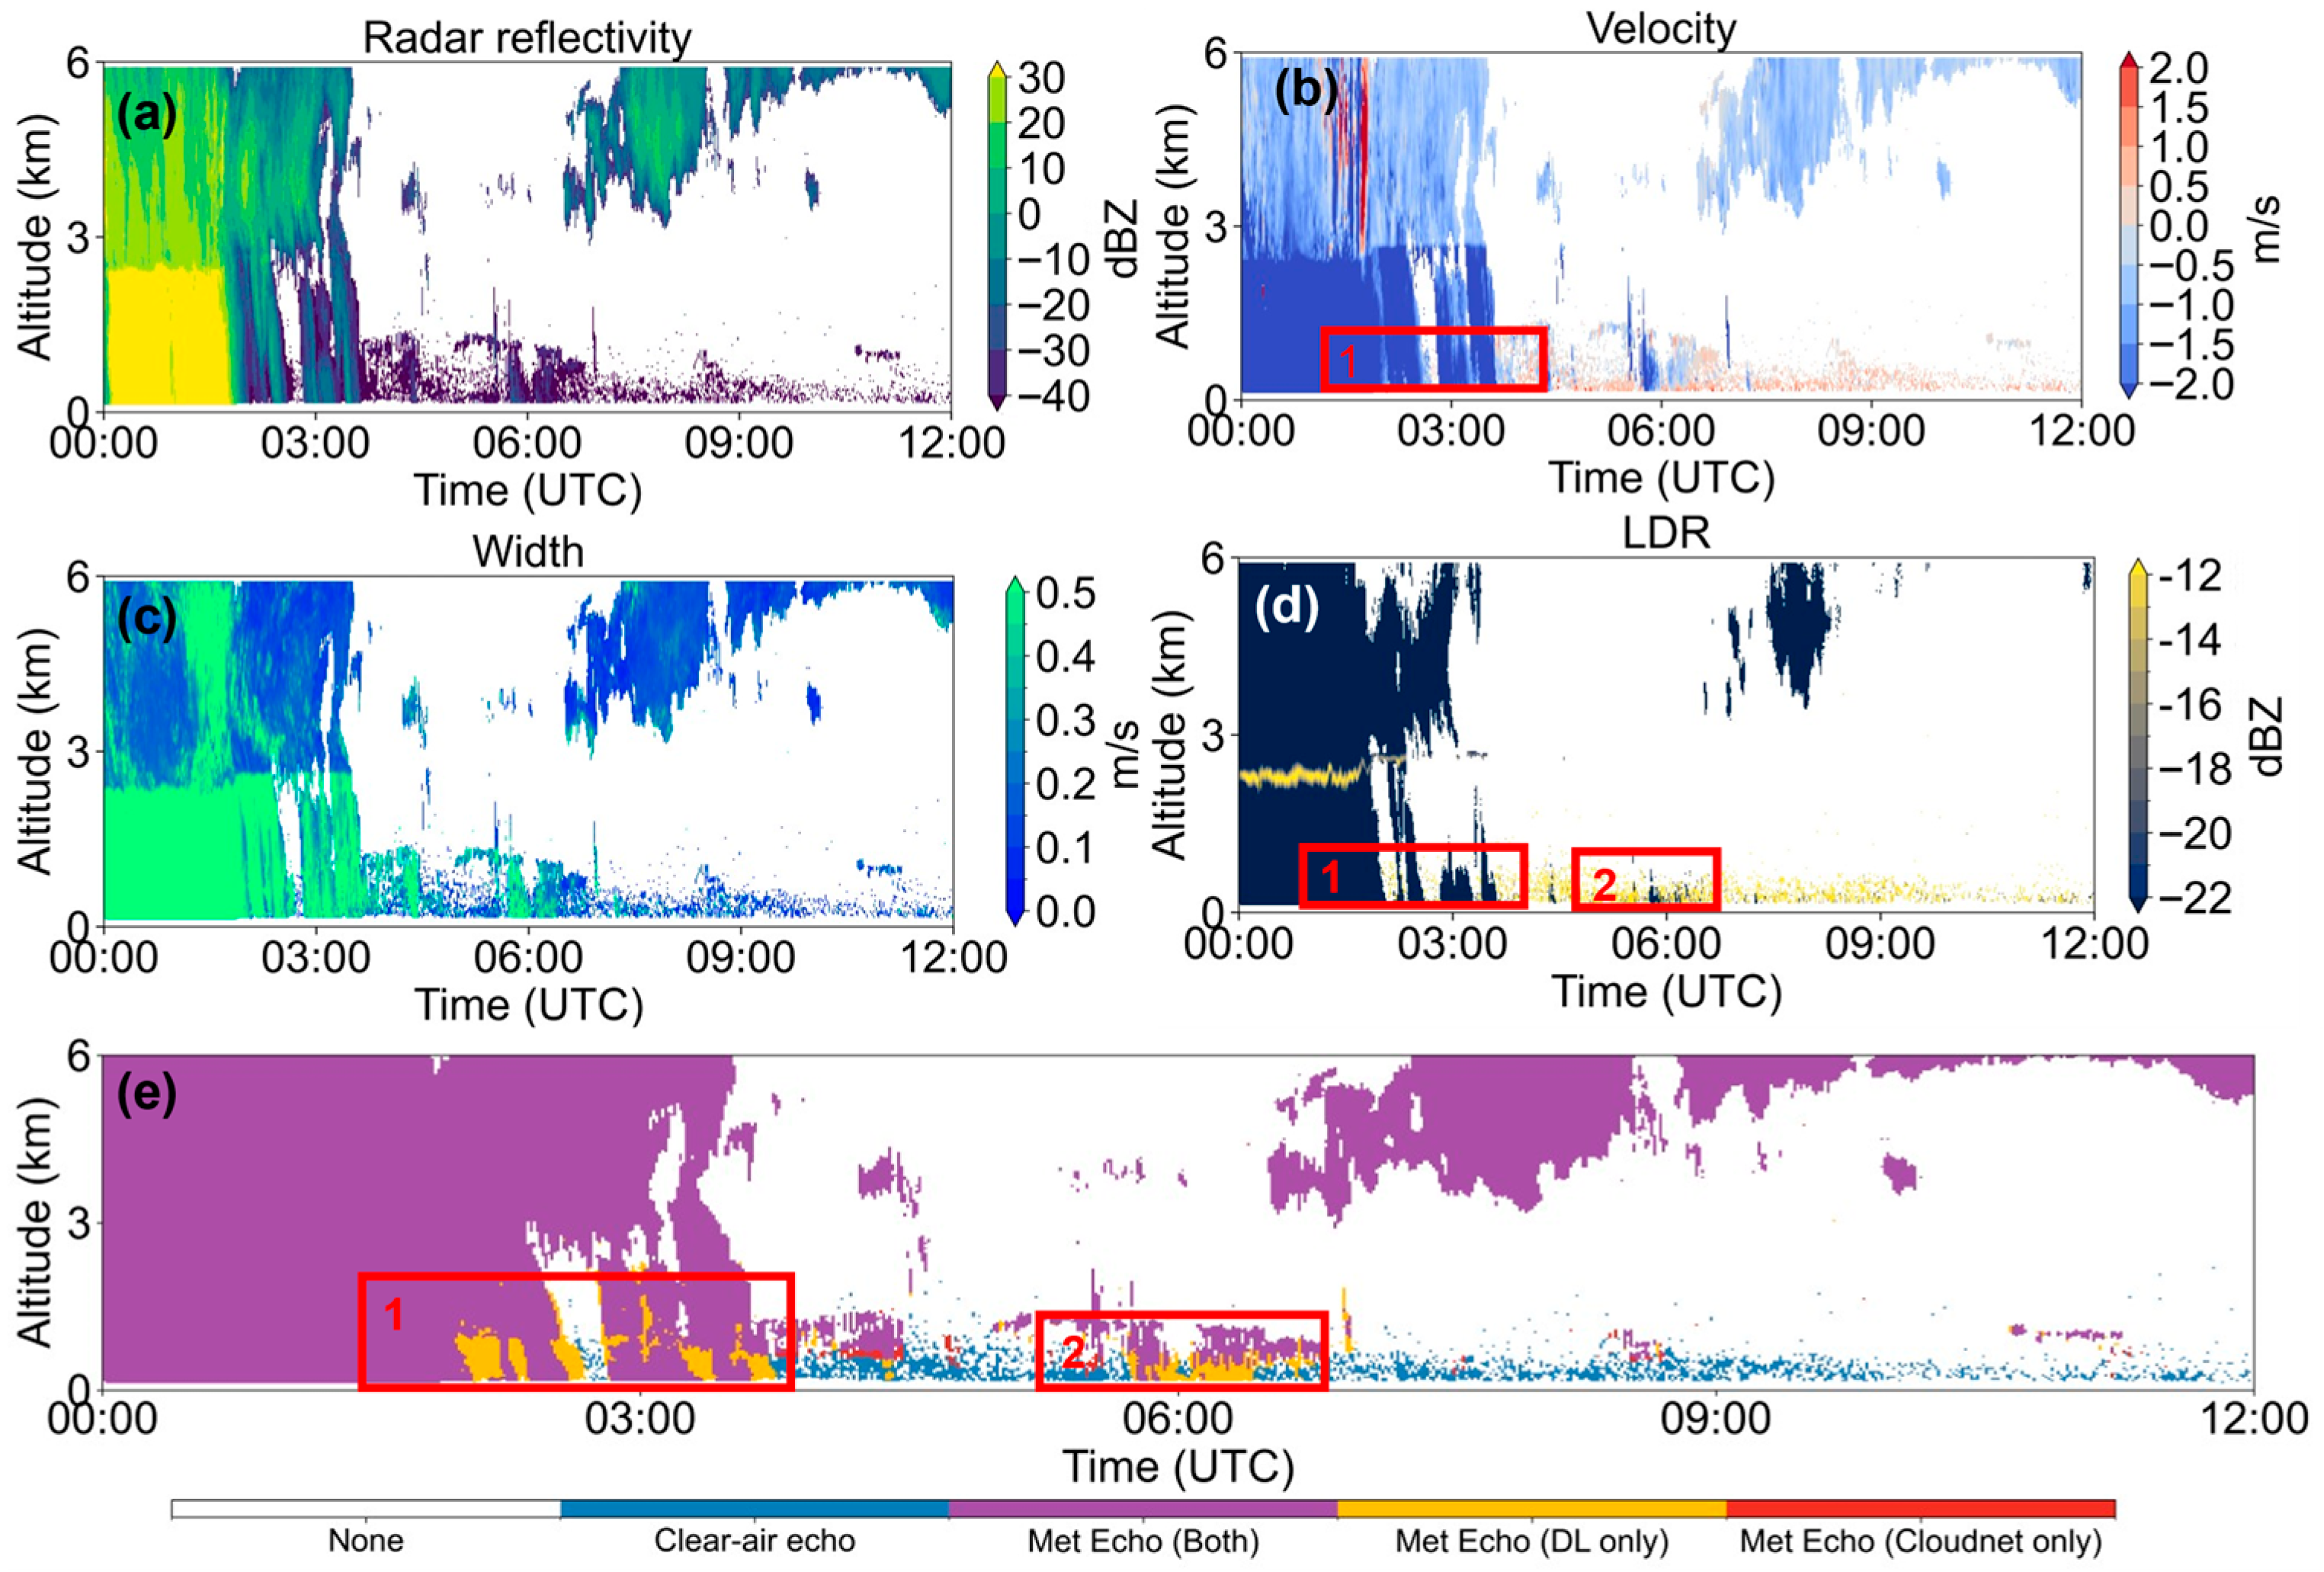
Case 1 is shown in
Figure 2, depicting the difference of clear-echo identification based on the DL algorithm and Fuzzy logic algorithm.
As shown in
Figure 2, Cloudnet incorrectly classified portions of the meteorological echoes as clear-air echoes, primarily due to its strong dependence on the LDR channel:
Missing LDR period (
Figure 2, 02:00–04:00, Box 1): During this period, precipitation edges exhibited weak reflectivity, causing the polarization channel signals to degrade below system sensitivity thresholds and resulting in missing LDR data [
24]. Consequently, the fuzzy logic algorithm erroneously classified these meteorological echoes as clear-air echoes. The significant and coherent negative Doppler velocities (<−2 m/s) clearly indicate precipitation.
Insect overlapping interference (
Figure 2, 06:00, Box 2): Strong depolarization signals in lower layers suggest active insects within the morning boundary layer. Due to insects coexisting with weak meteorological echoes, Cloudnet classification became ambiguous, demonstrating the potential for insect signals to mask meteorological signals under weak reflectivity conditions, misleading the classification.
Conversely, by leveraging contextual texture information, the DL model effectively captured the overall precipitation structures, maintaining classification continuity even in regions of weakened signals at cloud tops. The DL model also exhibited robust segmentation ability against lower-layer insect disturbances, highlighting its superior structural modeling and robustness.
4.1.2. Case 2: Misclassification Under Weak Signal
Figure 3 illustrates a typical false-alarm scenario. Between 2–6 km altitude, Cloudnet classification results indicated continuous “meteorological echoes,” whereas lidar observations showed no indication of clouds. Further analysis revealed missing LDR data in this region, prompting Cloudnet to rely solely on ambient temperature for classification. Due to temperatures below insect activity thresholds, echoes were labelled as meteorological bits, resulting in false alarms. However, these echoes were more likely caused by large aerosol particles or atmospheric refractive index variations induced by turbulence [
21,
25].
Such misclassifications artificially expand cloud boundaries. In contrast, the DL model, by capturing spatial discontinuity and contextual structures, effectively suppressed these weak height-based misclassifications of clear-air echoes as meteorological echoes, demonstrating greater robustness.
4.1.3. Case 3: Complex Scenario
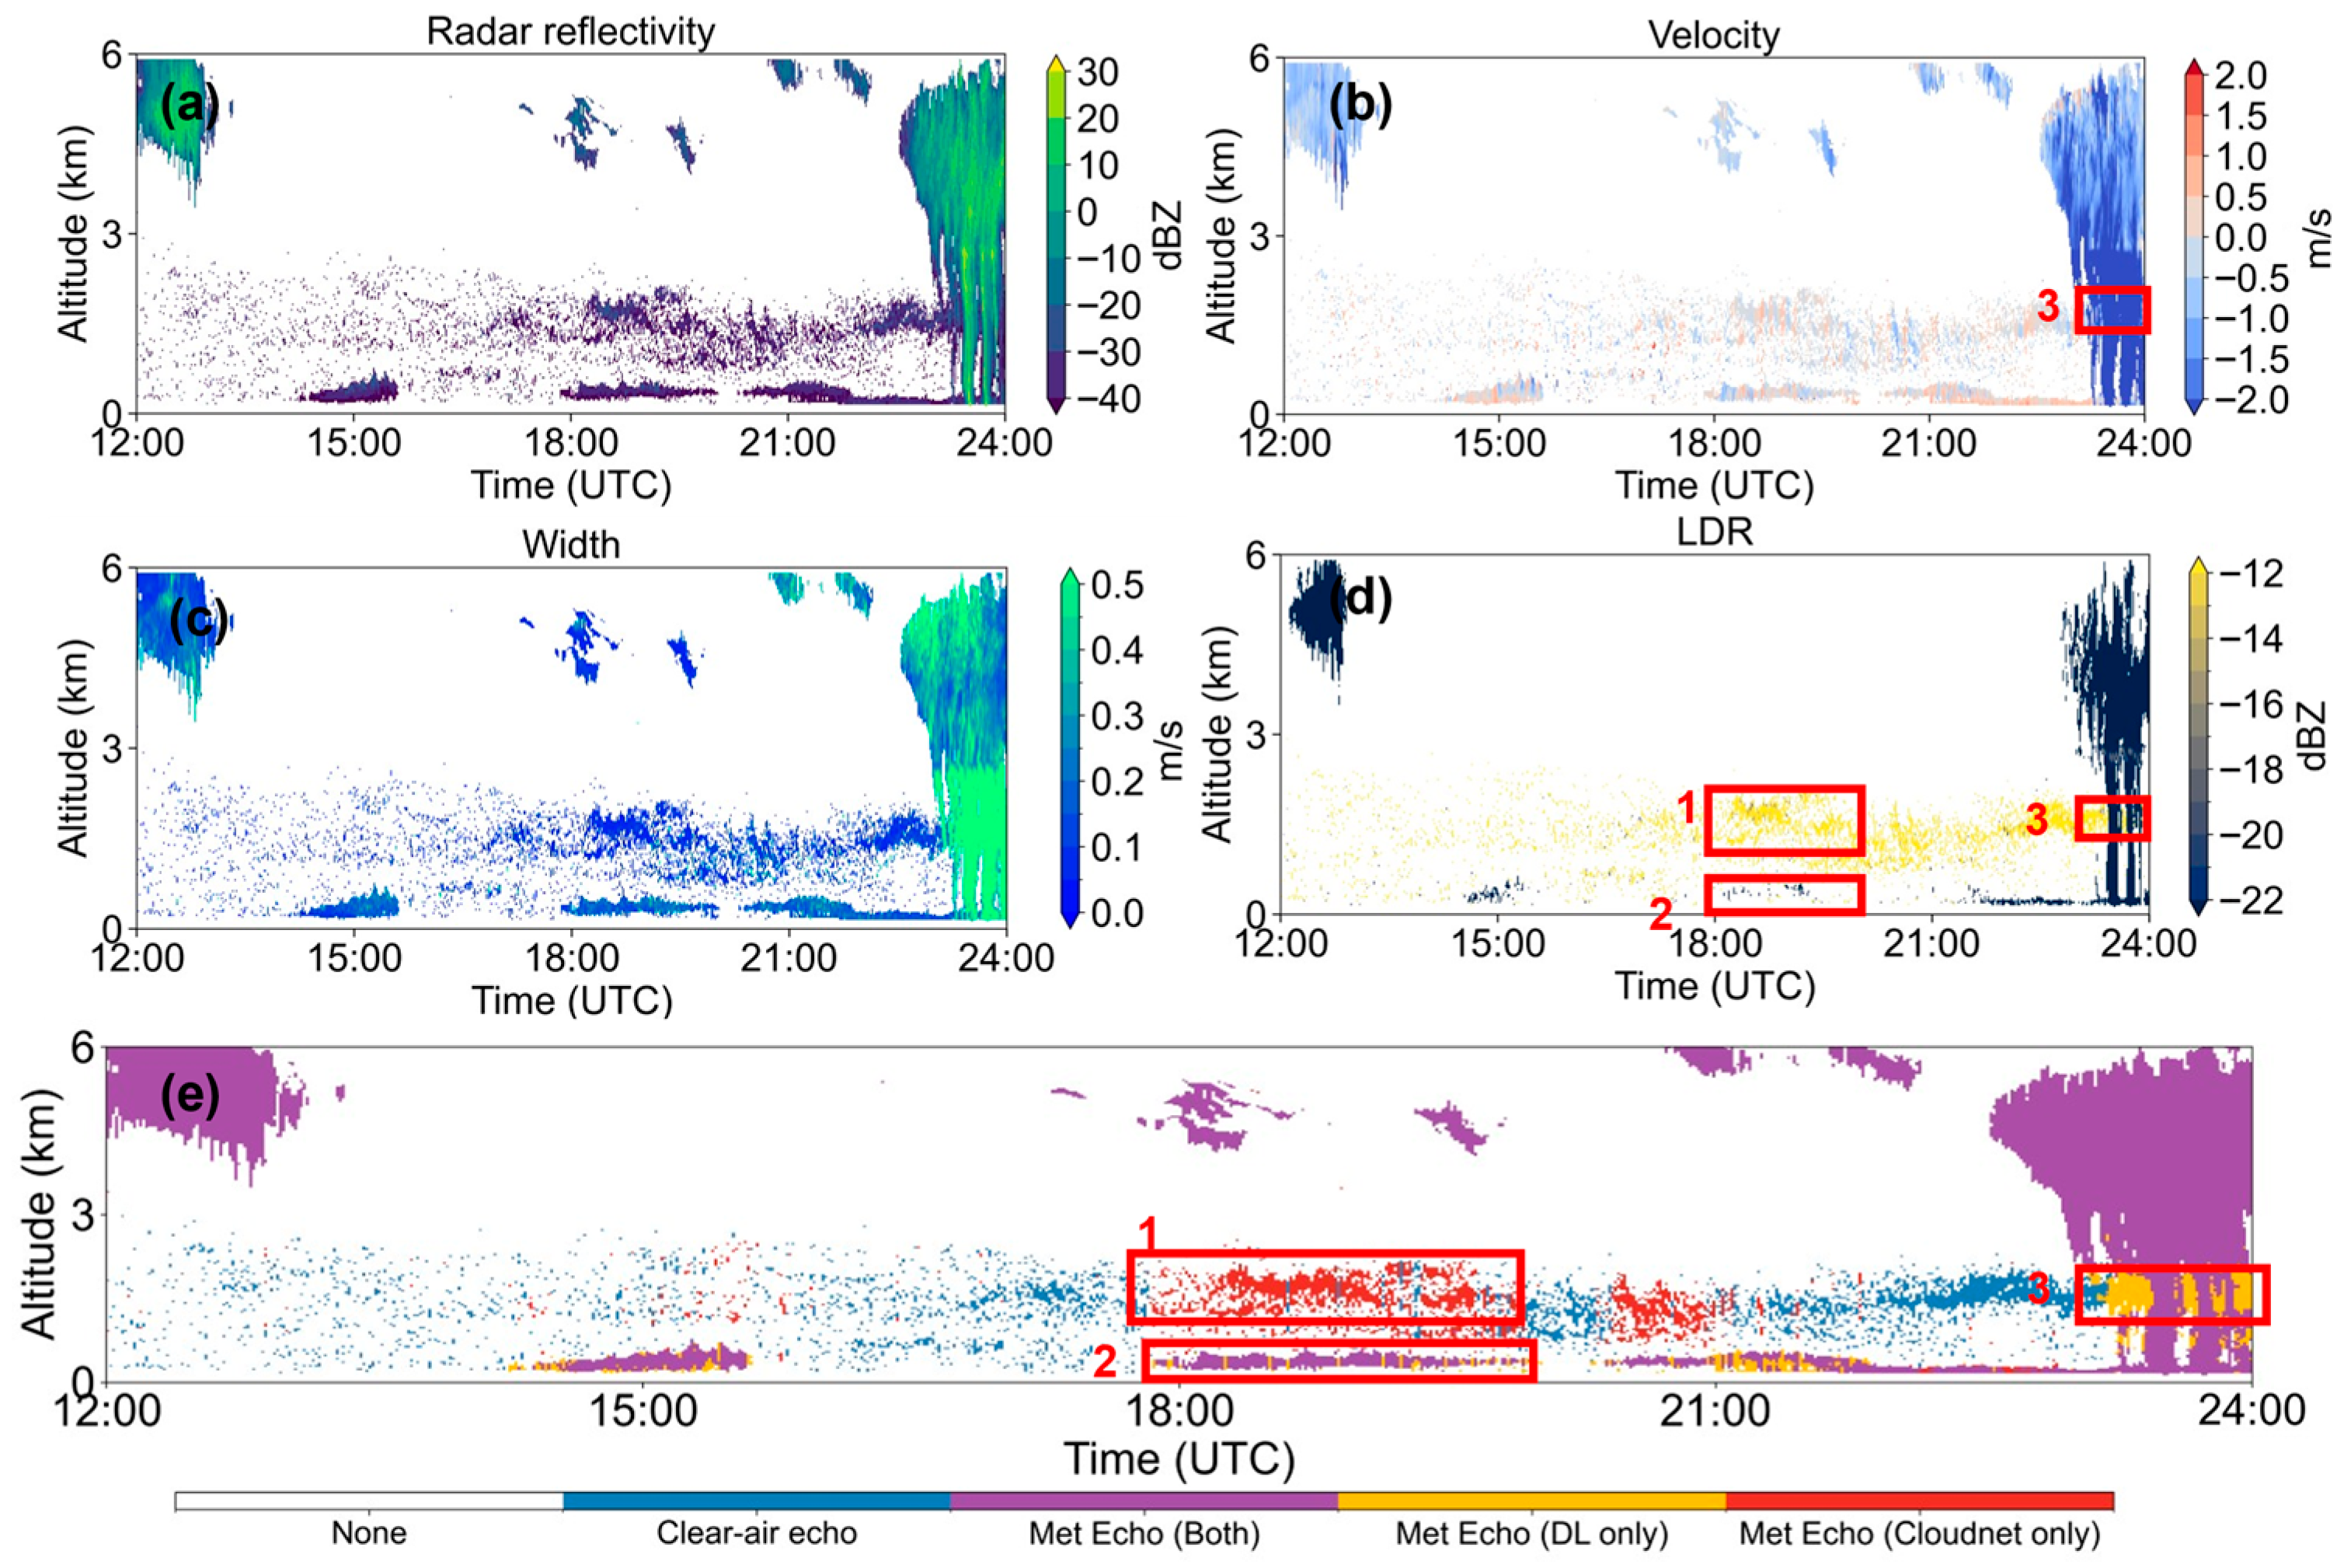
Figure 4 covers various echo types throughout the day, including weak precipitation, low clouds, sparse high-altitude clouds, and potential non-meteorological interference, comprehensively testing classification capability.
Figure 4, 18:00–20:00 (2–3 km altitude, Box 1): Cloudnet again classified spatially discrete weak signals above 3 km (approximately −30 dBZ reflectivity) as meteorological, despite lacking corresponding lidar responses, possibly representing refractive layers or insects above clouds. This misclassification, similar to Case 2, resulted from temperature-based classification logic.
Figure 4, 18:00–24:00 (0–1 km altitude, Box 2): Distinct low cloud structures were identified consistently by both Cloudnet and DL models due to prominent reflectivity and available LDR signals, indicating stable performance under optimal signal quality.
Figure 4, 23:45–24:00 (Box 3) gap: A brief weak echo event (reflectivity factor 15 dBZ, velocity 1.2 m/s) indicative of localized small-scale precipitation was misclassified as clear-air by Cloudnet, whereas the DL model consistently tracked and identified this event, further highlighting its structural modeling advantages in missing LDR scenarios.
In summary, the DL approach demonstrated higher spatial continuity, consistency, and adaptability to weak signals throughout Case 3, notably outperforming Cloudnet at precipitation edges, height-based misclassifications, and complex structure classification.
4.2. Comparative Study of Classification Results from Multiple Sites
To further validate the generalization capability of the proposed DL classification model across different climatic environments and observational conditions, we selected eight representative Cloudnet sites: Lampedusa, Jülich, Limassol, Lindenberg, Munich, Schneefernerhaus, Potenza, and Bucharest. The basic geographic and climatic characteristics of these sites are summarized in
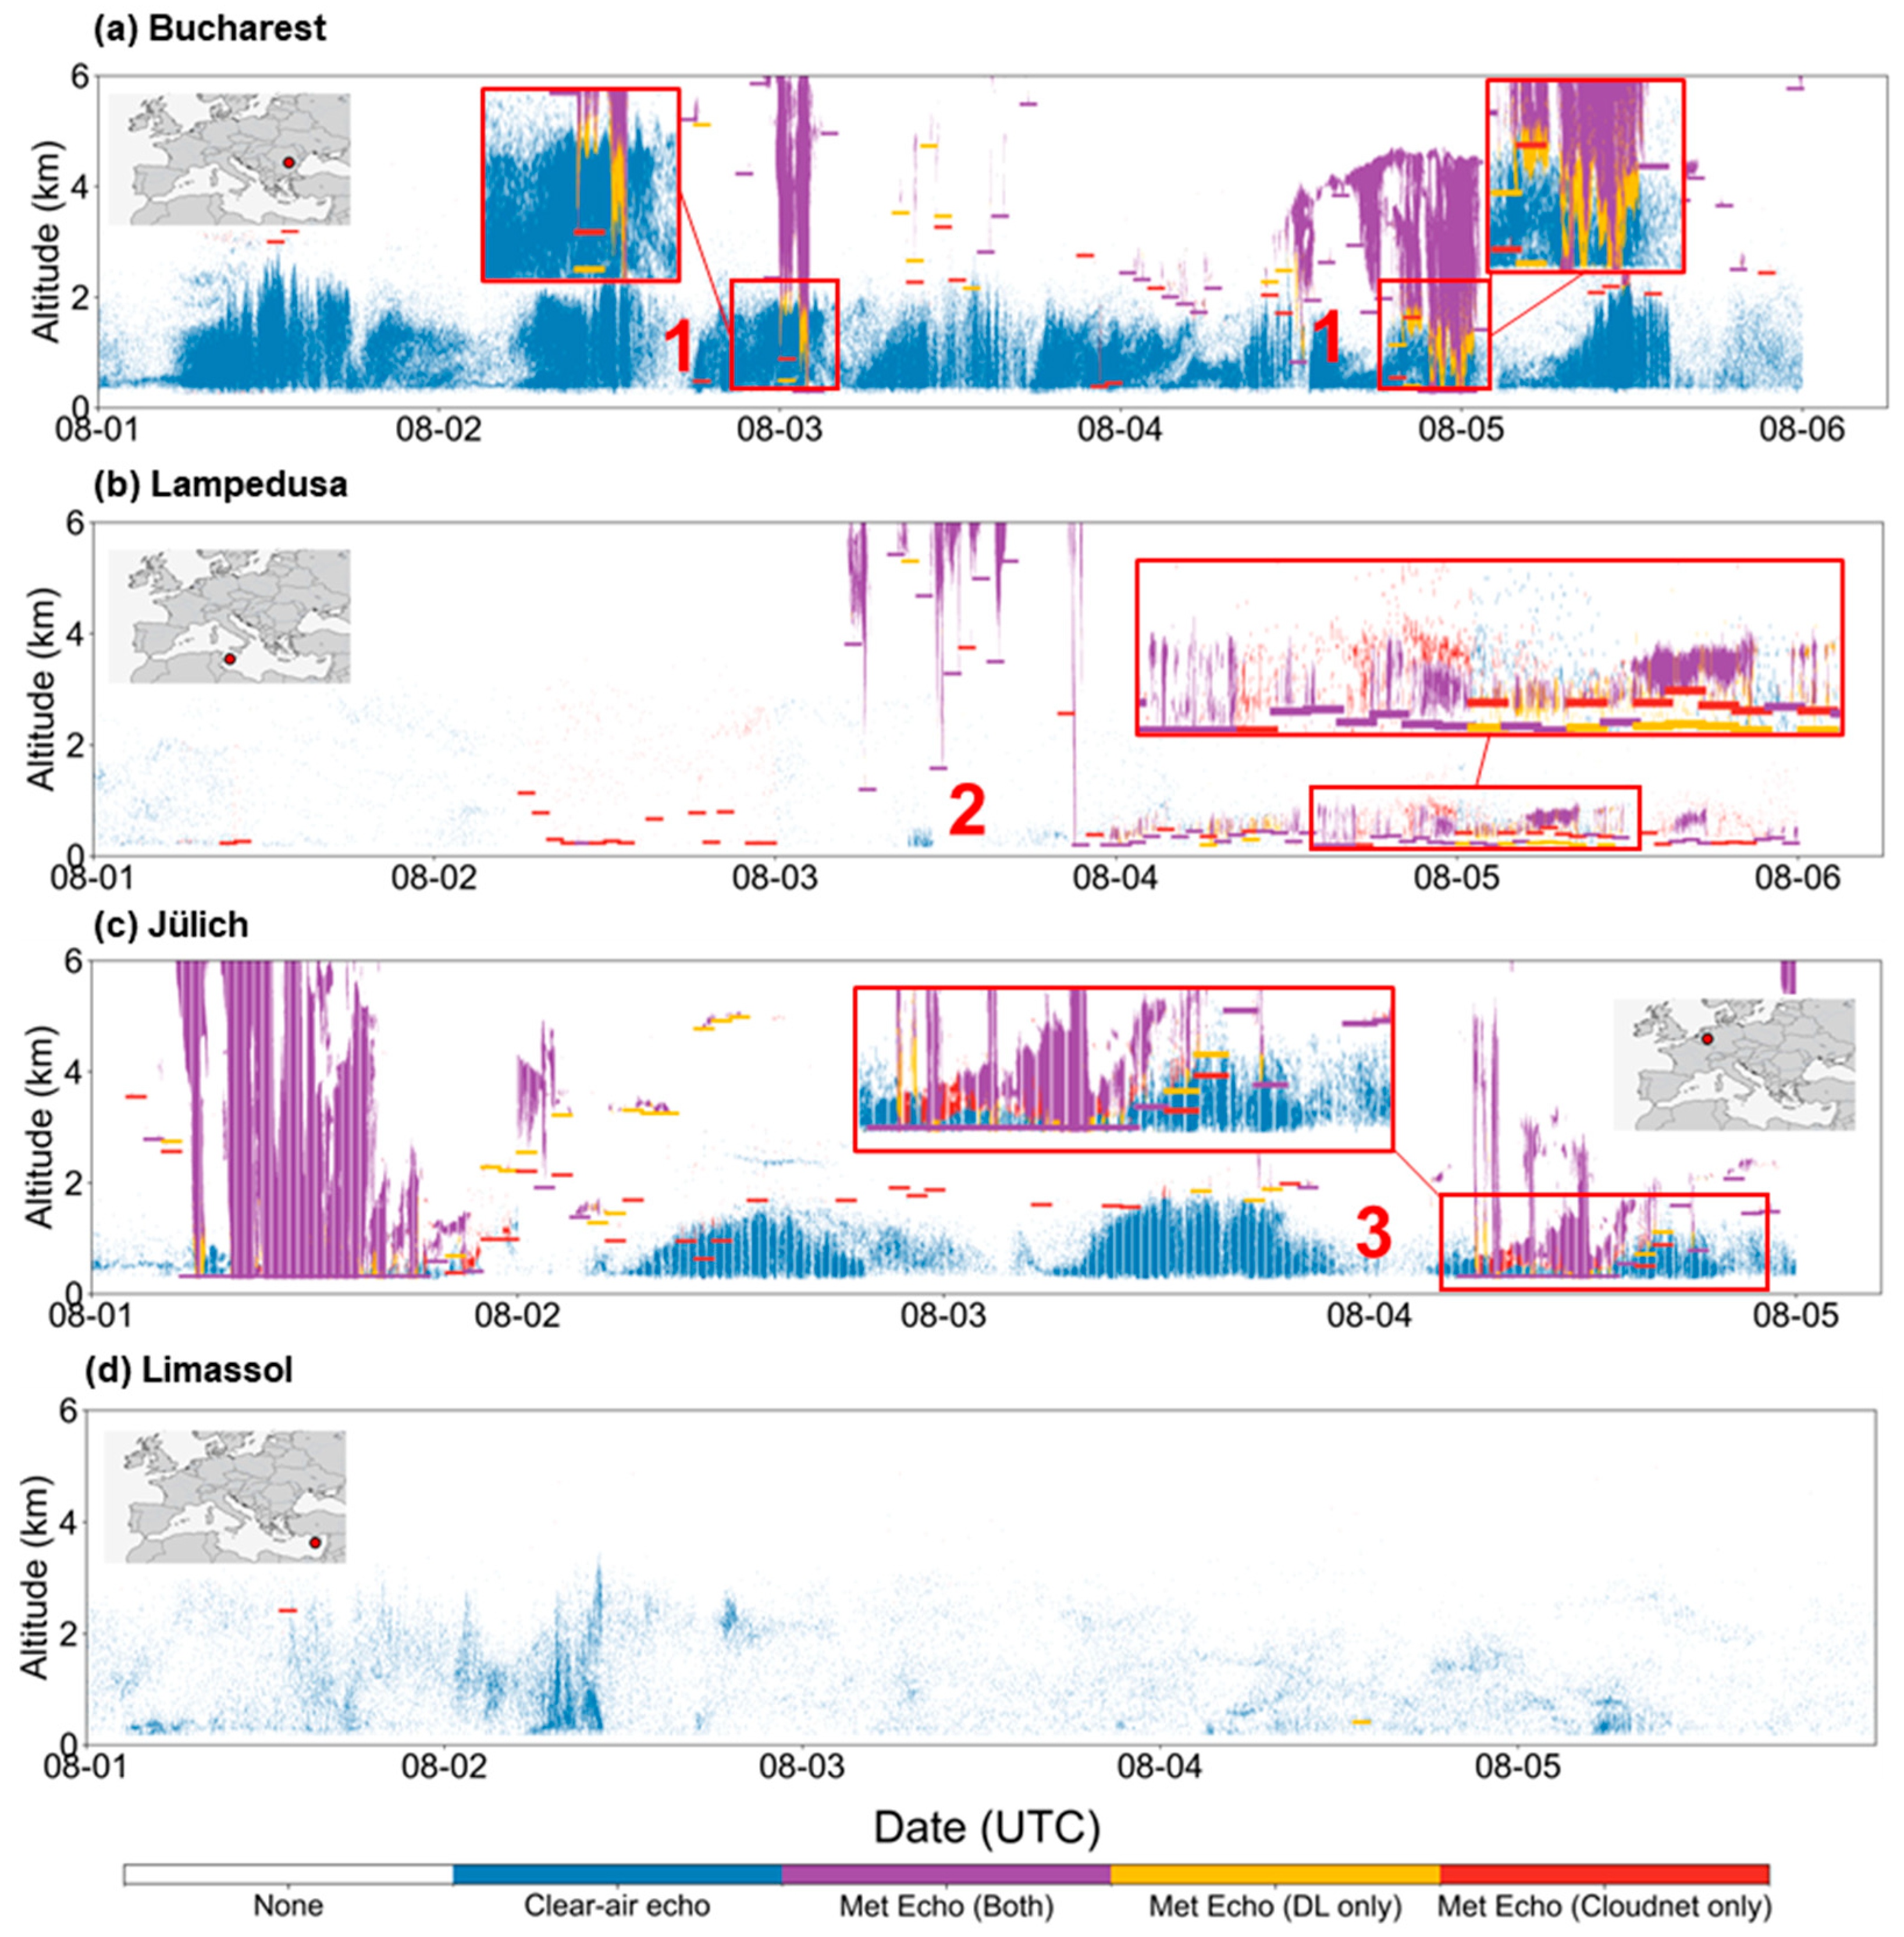
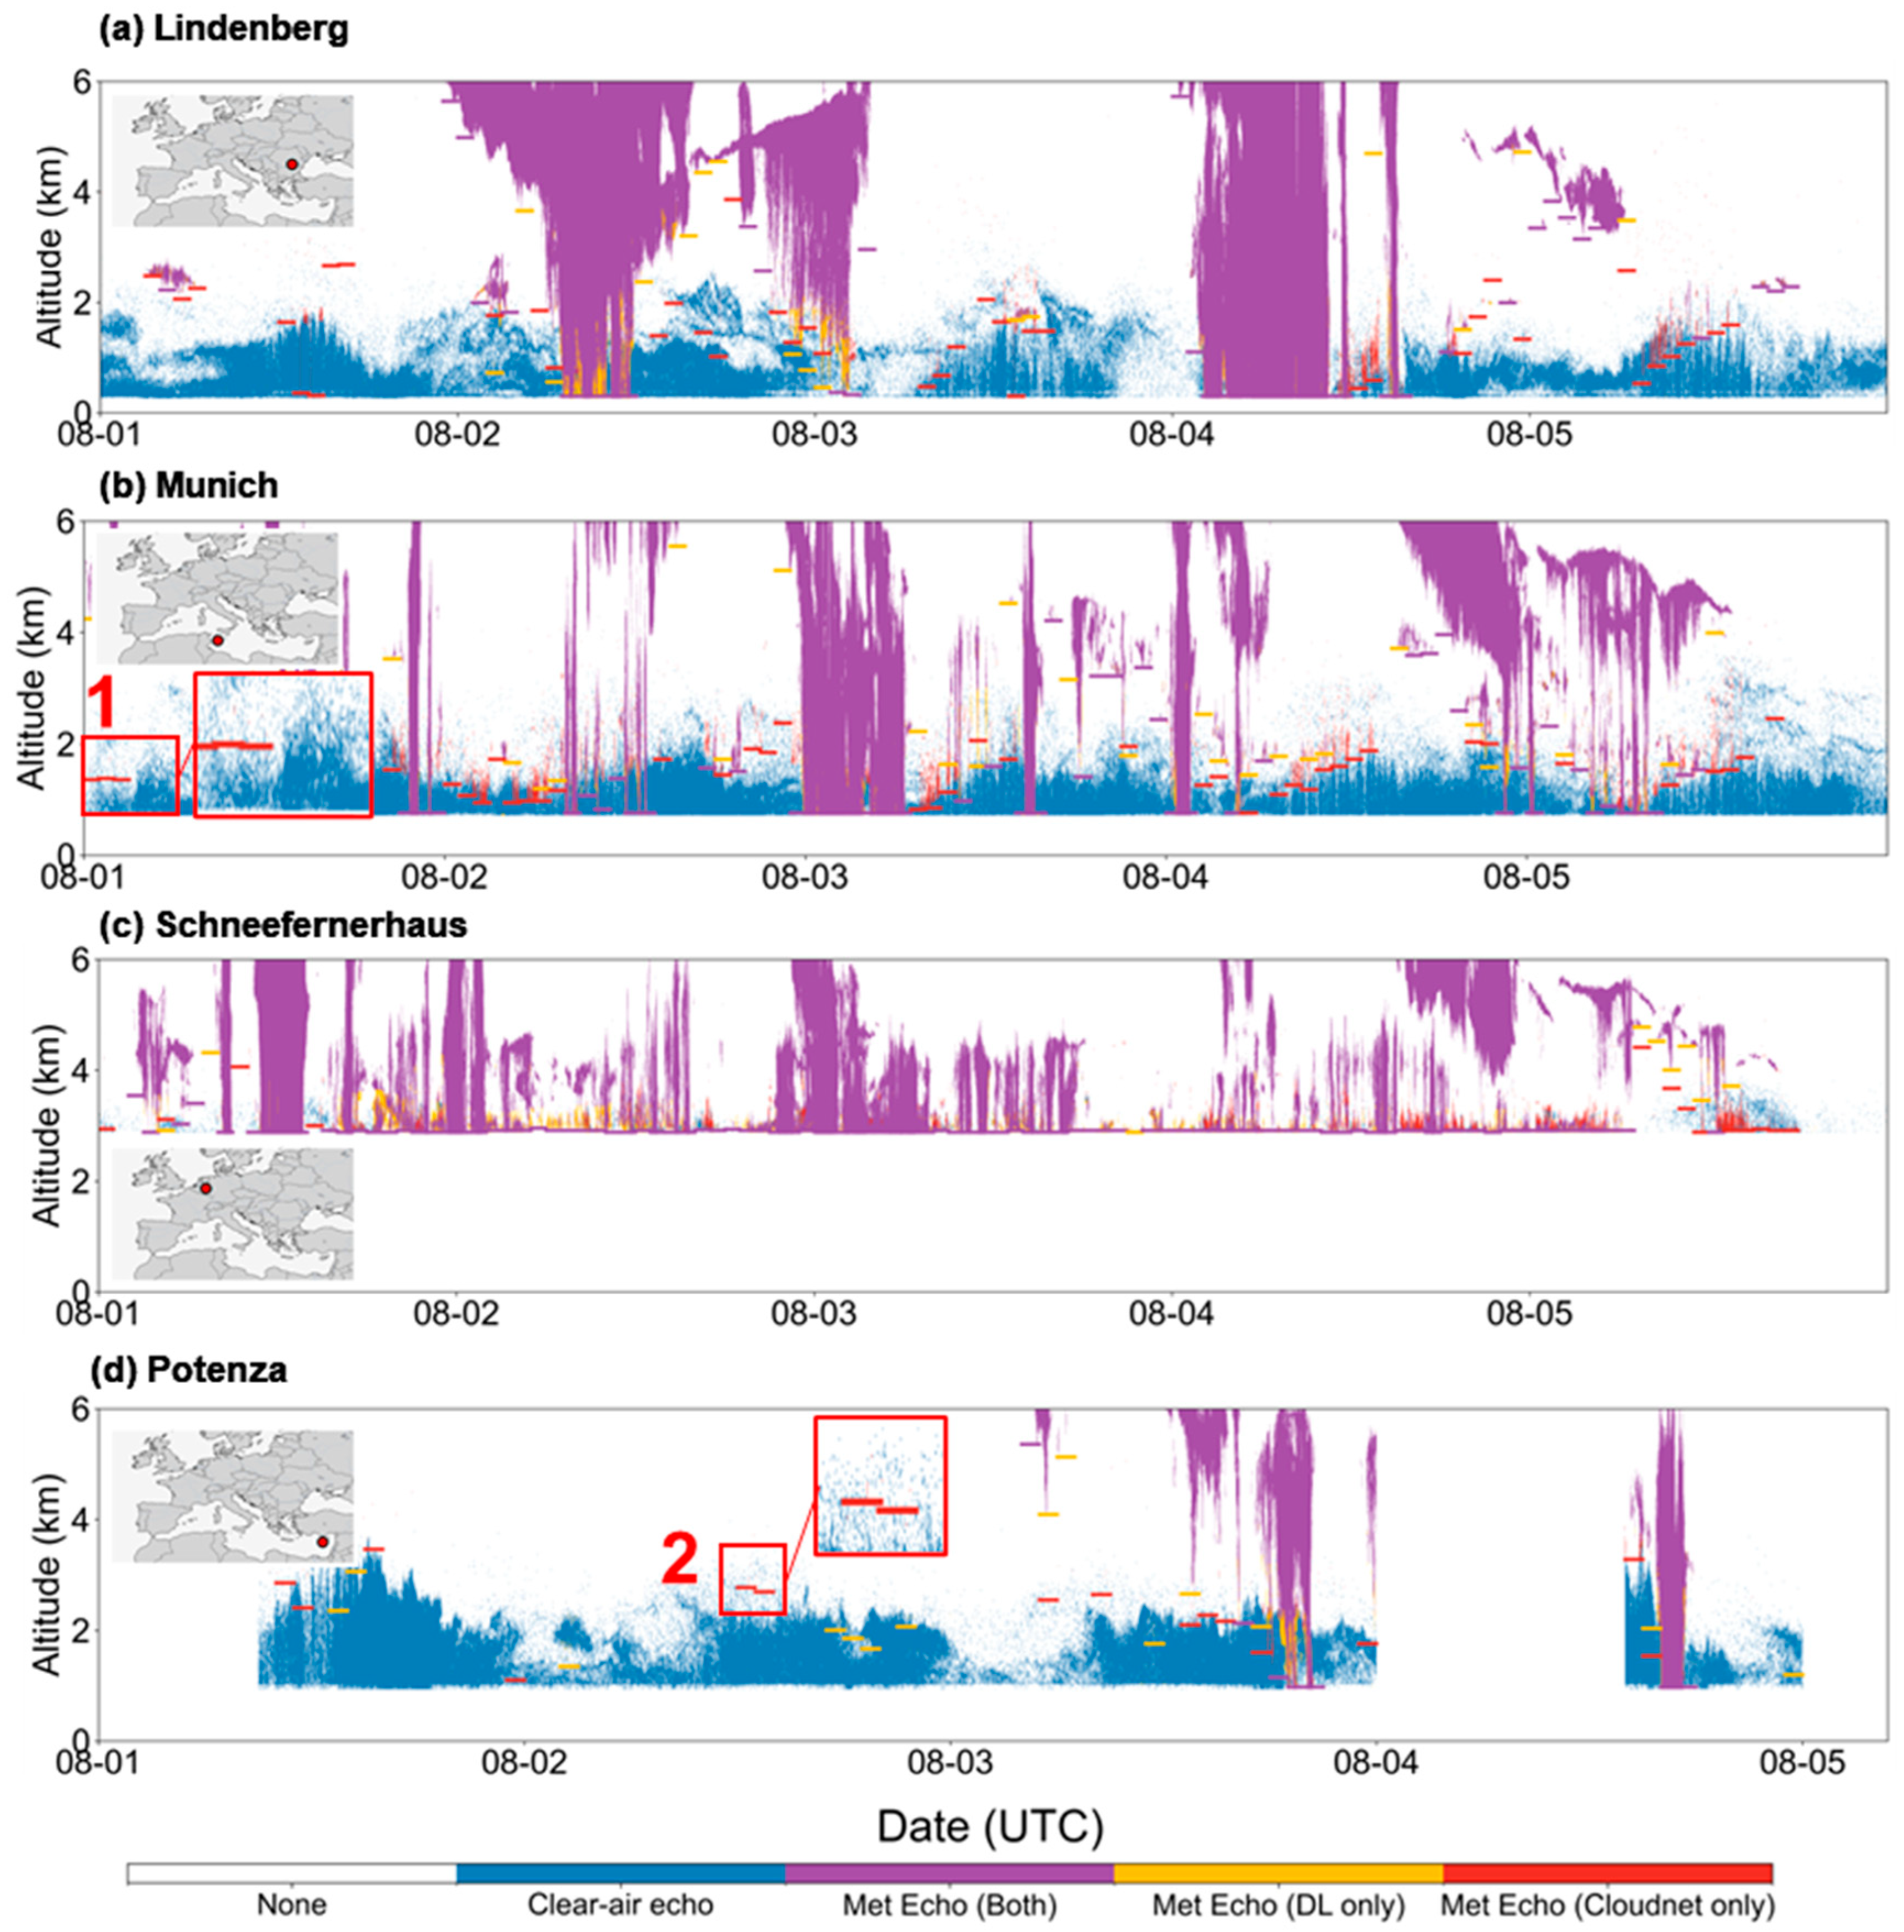
Table 2. These stations cover a wide geographic range, with distinct altitudes and climate regimes, and provided relatively continuous observations during the target period, making them suitable for testing model robustness and enabling cross-site comparison. Observational results from Ka-band radar data collected between 1 and 10 August 2024 at these sites were systematically compared with the existing Cloudnet classification products (visual comparisons for 1–5 August are shown in
Figure 5 and
Figure 6). The August period was deliberately chosen because it features frequent convective and precipitation events, which pose significant challenges for the traditional Cloudnet algorithm and thus provide a stringent test for the proposed approach.
Considering the significant interference of clear-air echoes on subsequent cloud-base height retrieval and cloud fraction statistics, this study also assessed the impact of different echo classification strategies on estimating low-level cloud bases (0–6 km altitude range). Specifically, cloud-base detection was considered valid if, within each 60-min window, at least 15 vertical profile observations were present and the vertical range of detected echoes was less than 1 km. The mean height within these profiles was then used as the estimated cloud-base height, mitigating potential biases introduced by clear-air echoes.
4.2.1. Comparison of Model Generalization Across Different Sites
Overall, the DL model demonstrated superior consistency and boundary integrity across different sites, especially under conditions involving complex weather patterns or mixed echo types, according to
Figure 5 and
Figure 6. It clearly identified weak precipitation events and effectively suppressed cases of clear-air echoes being misclassified as meteorological echoes around 2–4 km altitude, in contrast to Cloudnet. Notable examples include:
At the Bucharest site (
Figure 5a, Box 1), several precipitation events occurred between August 3 and 5. Cloudnet consistently misclassified echoes at cloud edges and near-surface weak precipitation areas as clear-air echoes. In contrast, the DL method accurately tracked precipitation structures, effectively distinguishing low-level clouds, precipitation echoes, and non-meteorological interference, thus aligning with previous detailed case analyses.
High-altitude sites such as Potenza (
Figure 6d, Box 2) and Munich (
Figure 6b, Box 1) frequently exhibited missing LDR data, causing Cloudnet classifications to overly depend on temperature fields. Particularly during nighttime observations, Cloudnet produced systematic false alarms by incorrectly classifying refractive layers or weak insect activity as meteorological clouds (e.g., Munich site on August 1, Potenza site on August 1–3). The DL model robustly suppressed such disturbances, significantly reducing false alarm rates.
At weaker echo observation sites, such as Lampedusa (
Figure 5b, Box 2) and Limassol (
Figure 5c, Box 3), echoes primarily consisted of low-reflectivity clouds and insect interference. Despite weaker meteorological signals, the DL method maintained smooth and continuous classification without frequent high-altitude false alarms or insect-related misclassification common in Cloudnet’s results. This further validated its robustness under sparse data conditions.
4.2.2. Comparative Analysis of Cloud-Base Height Identification
To quantitatively evaluate cloud-base height detection performance, we statistically analyzed 1824 simultaneous observation samples. Among these, Cloudnet exclusively identified cloud bases in 273 cases (approximately 14.97%) that the DL model classified as clear-air. These Cloudnet-exclusive cloud bases averaged 1.94 km altitude (standard deviation: 1.05 km). Notably, the two methods showed high consistency at lower altitudes (<2 km), where clear-air echoes were effectively excluded by both. The differences thus predominantly emerged near the 3 km level, corresponding to the 0 °C isotherm, where Cloudnet’s temperature-based classification rules—especially under missing LDR conditions—tend to produce false positives. These false alarms typically lack spatial continuity and exhibit signal intensity distributions that deviate from typical meteorological echoes, further supporting their non-meteorological origin. Such spurious low-level cloud detections result in a systematic underestimation of cloud-base height. In contrast, the deep learning model was less susceptible to such misclassifications, as it relies on spatial continuity and morphological features rather than a fixed thermodynamic threshold.
Furthermore, for 628 samples identified as cloudy by both methods, error statistics for cloud-base height were computed separately within two altitude intervals (<3 km and 3–6 km), summarized in
Table 3.
In the mid-level region (3–6 km), cloud-base heights identified by the DL model were on average 0.84 km higher than those by Cloudnet, with a mean absolute error of 0.86 km. This difference reflects the DL model’s superior capability in accurately delineating cloud boundaries by effectively filtering out false detections, particularly those associated with non-meteorological echoes around the 0 °C level. Since Cloudnet tends to trigger cloud-base identification based on temperature thresholds in the absence of LDR data, these high-altitude false alarms frequently result in the misclassification of clear-air as clouds. As cloud-base height is defined by the lowest identified echo, these spurious detections lead to a consistent downward bias in Cloudnet estimates. Taken together, these results indicate that Cloudnet systematically underestimates mid-level cloud-base heights by approximately 19.5% under such conditions.
4.2.3. Cloud Fraction Accuracy and Error Attribution
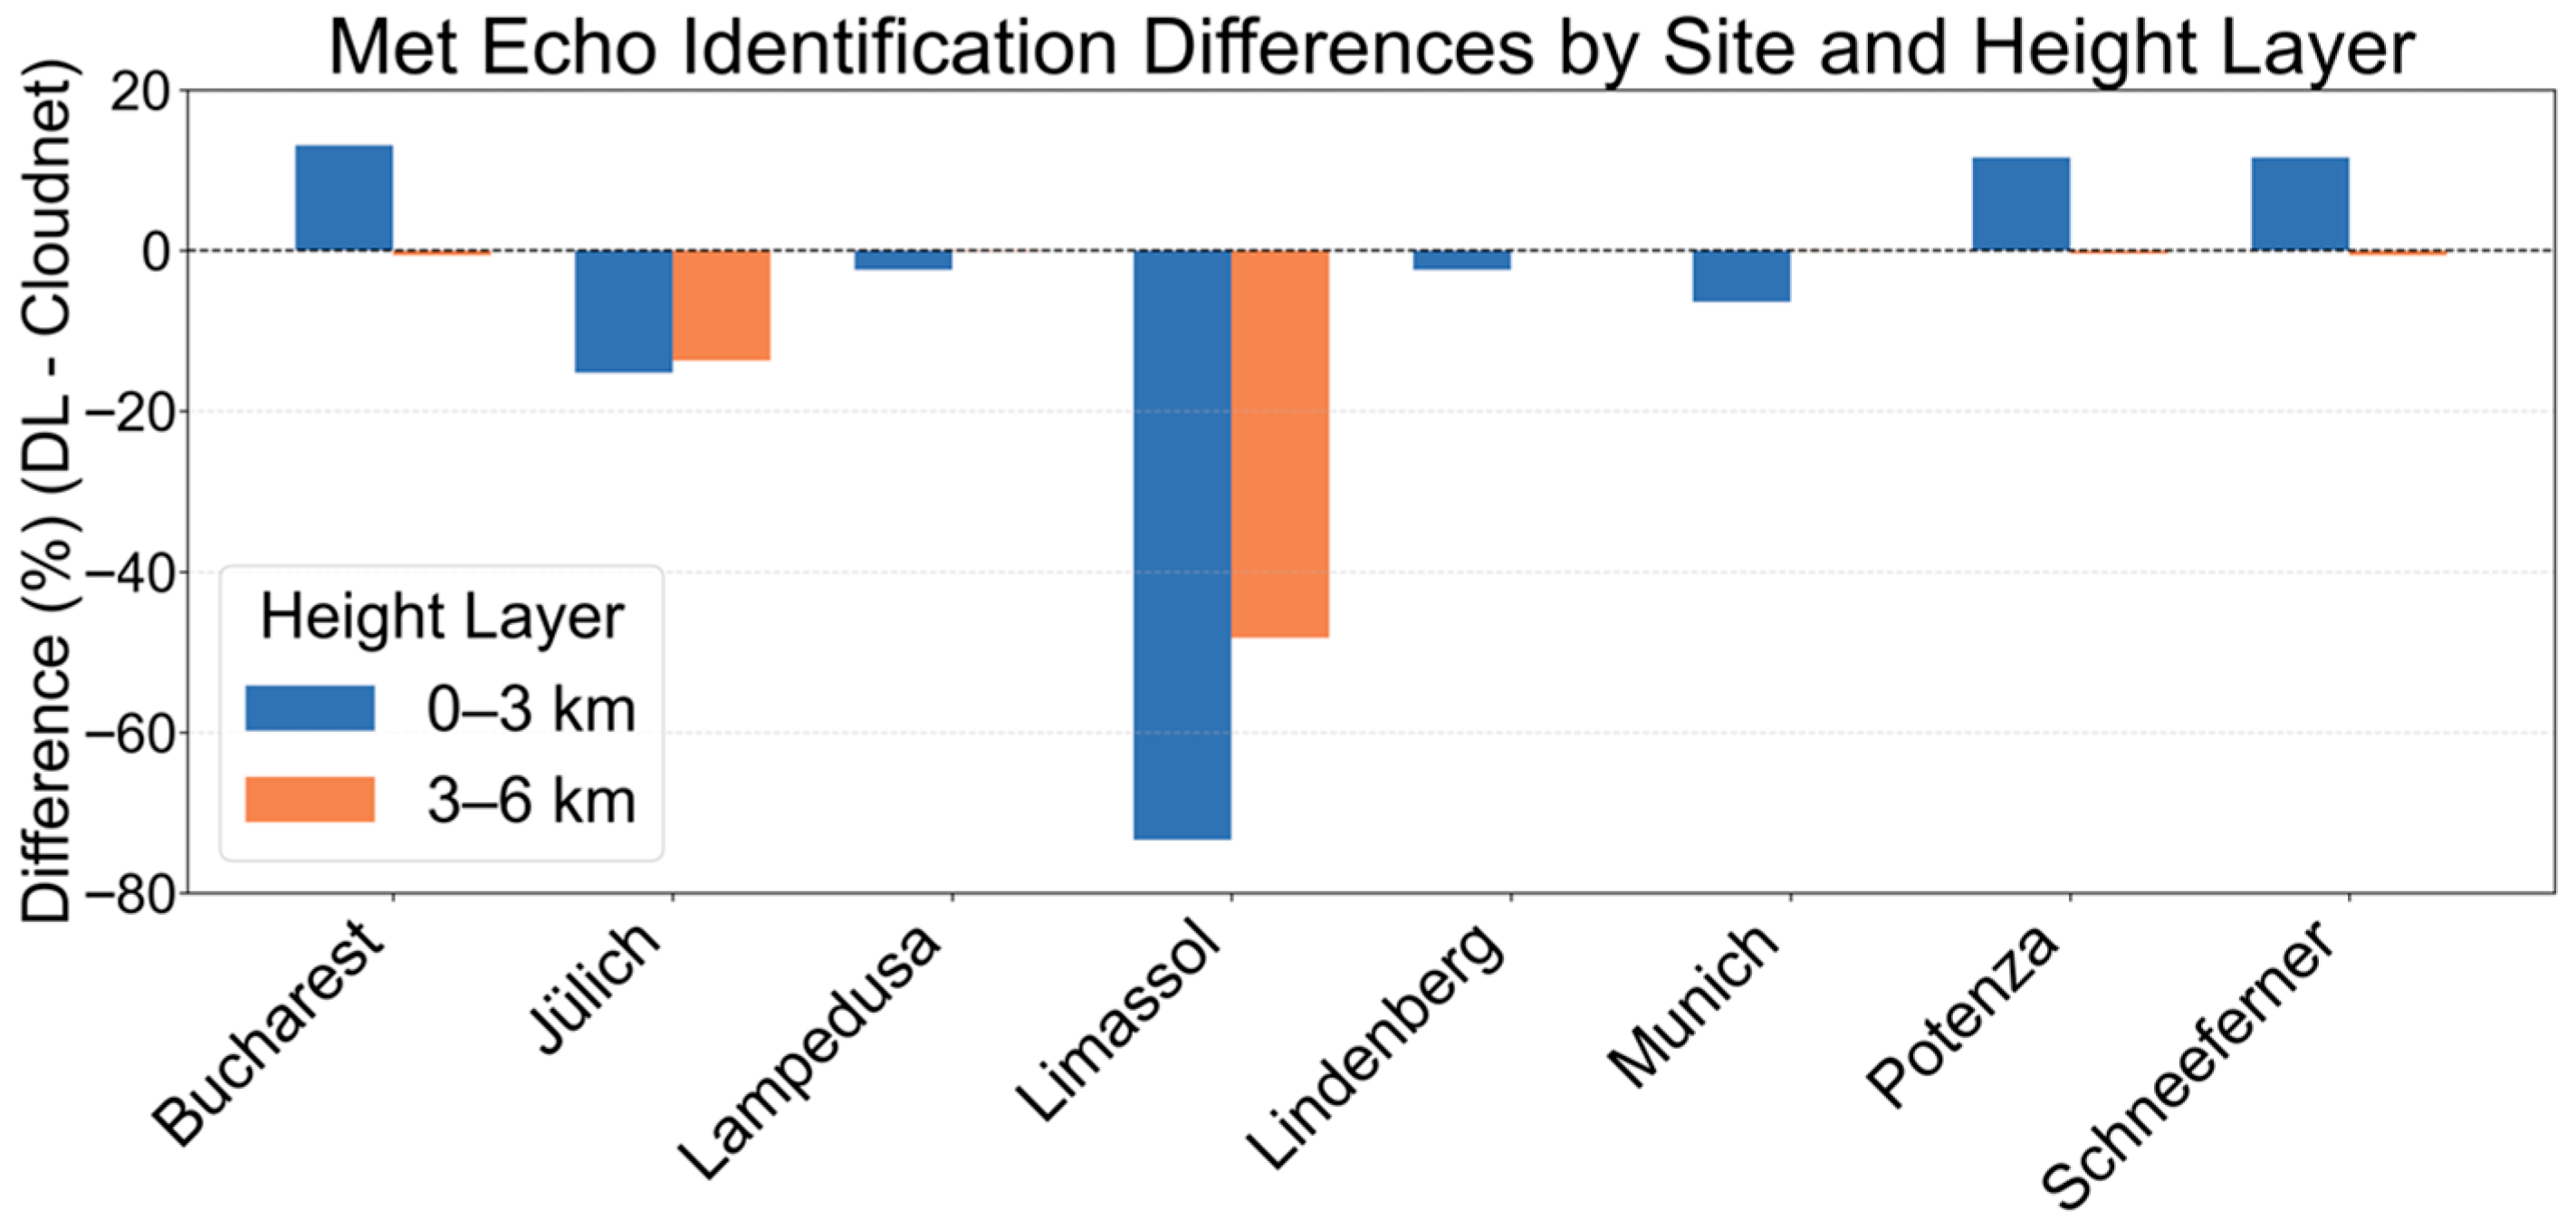
Figure 7 shows differences in identified meteorological echo quantities between the DL model and Cloudnet at two altitude layers (0–3 km in blue and 3–6 km in orange) across eight Cloudnet sites during 1–10 August 2024. Differences are calculated as Equation (9):
where
and
represent the number of meteorological echoes identified by each method, respectively. Positive values indicate more echoes identified by DL, while negative values indicate fewer.
Bucharest, Potenza, and Schneefernerhaus exhibited more echoes detected by the DL model, attributable to its superior capture of precipitation boundaries and continuous weak echoes missed by Cloudnet due to LDR absence or ambiguous textures. Conversely, Limassol and Lindenberg sites showed significantly fewer echoes detected by the DL method, especially at Limassol (difference exceeding 70%). The annual statistics presented in
Section 4.3 confirmed that Limassol experienced relatively fewer actual clouds during this period. Cloudnet’s reliance on temperature in the absence of LDR data led to substantial false alarms, whereas the DL method effectively excluded these erroneous identifications.
This pattern held statistically: across all sites, the DL method identified 2.3% fewer echoes at 0–3 km and 1.3% fewer at 3–6 km, averaging a 1.7% lower total echo detection rate in the 0–6 km range compared to Cloudnet. These findings indicate systematic cloud fraction overestimation (~1.7%) by Cloudnet, primarily attributable to inadequate removal of clear-air echoes.
4.3. Long-Term Observational Validation and Analysis Under Different Climatic Conditions
Given the significant seasonality and climate dependence of clear-air echoes, this study further selected two representative Cloudnet stations—Lampedusa (subtropical marine climate) and Jülich (temperate marine climate)—to conduct a year-long comparative analysis of clear-air echo distributions using Ka-band radar data from 2024. Rather than pursuing comprehensive site coverage, this study focused on revealing the typical limitations and failure mechanisms of the traditional classification algorithm. Two stations—Lampedusa (subtropical marine climate) and Jülich (temperate marine climate)—were selected for their distinct climatic settings and representative clear-air echo characteristics. This analysis also enabled the evaluation of the DL model’s consistency and climate adaptability relative to Cloudnet across extended temporal scales.
4.3.1. Seasonal and Diurnal Variability of Clear-Air Echoes
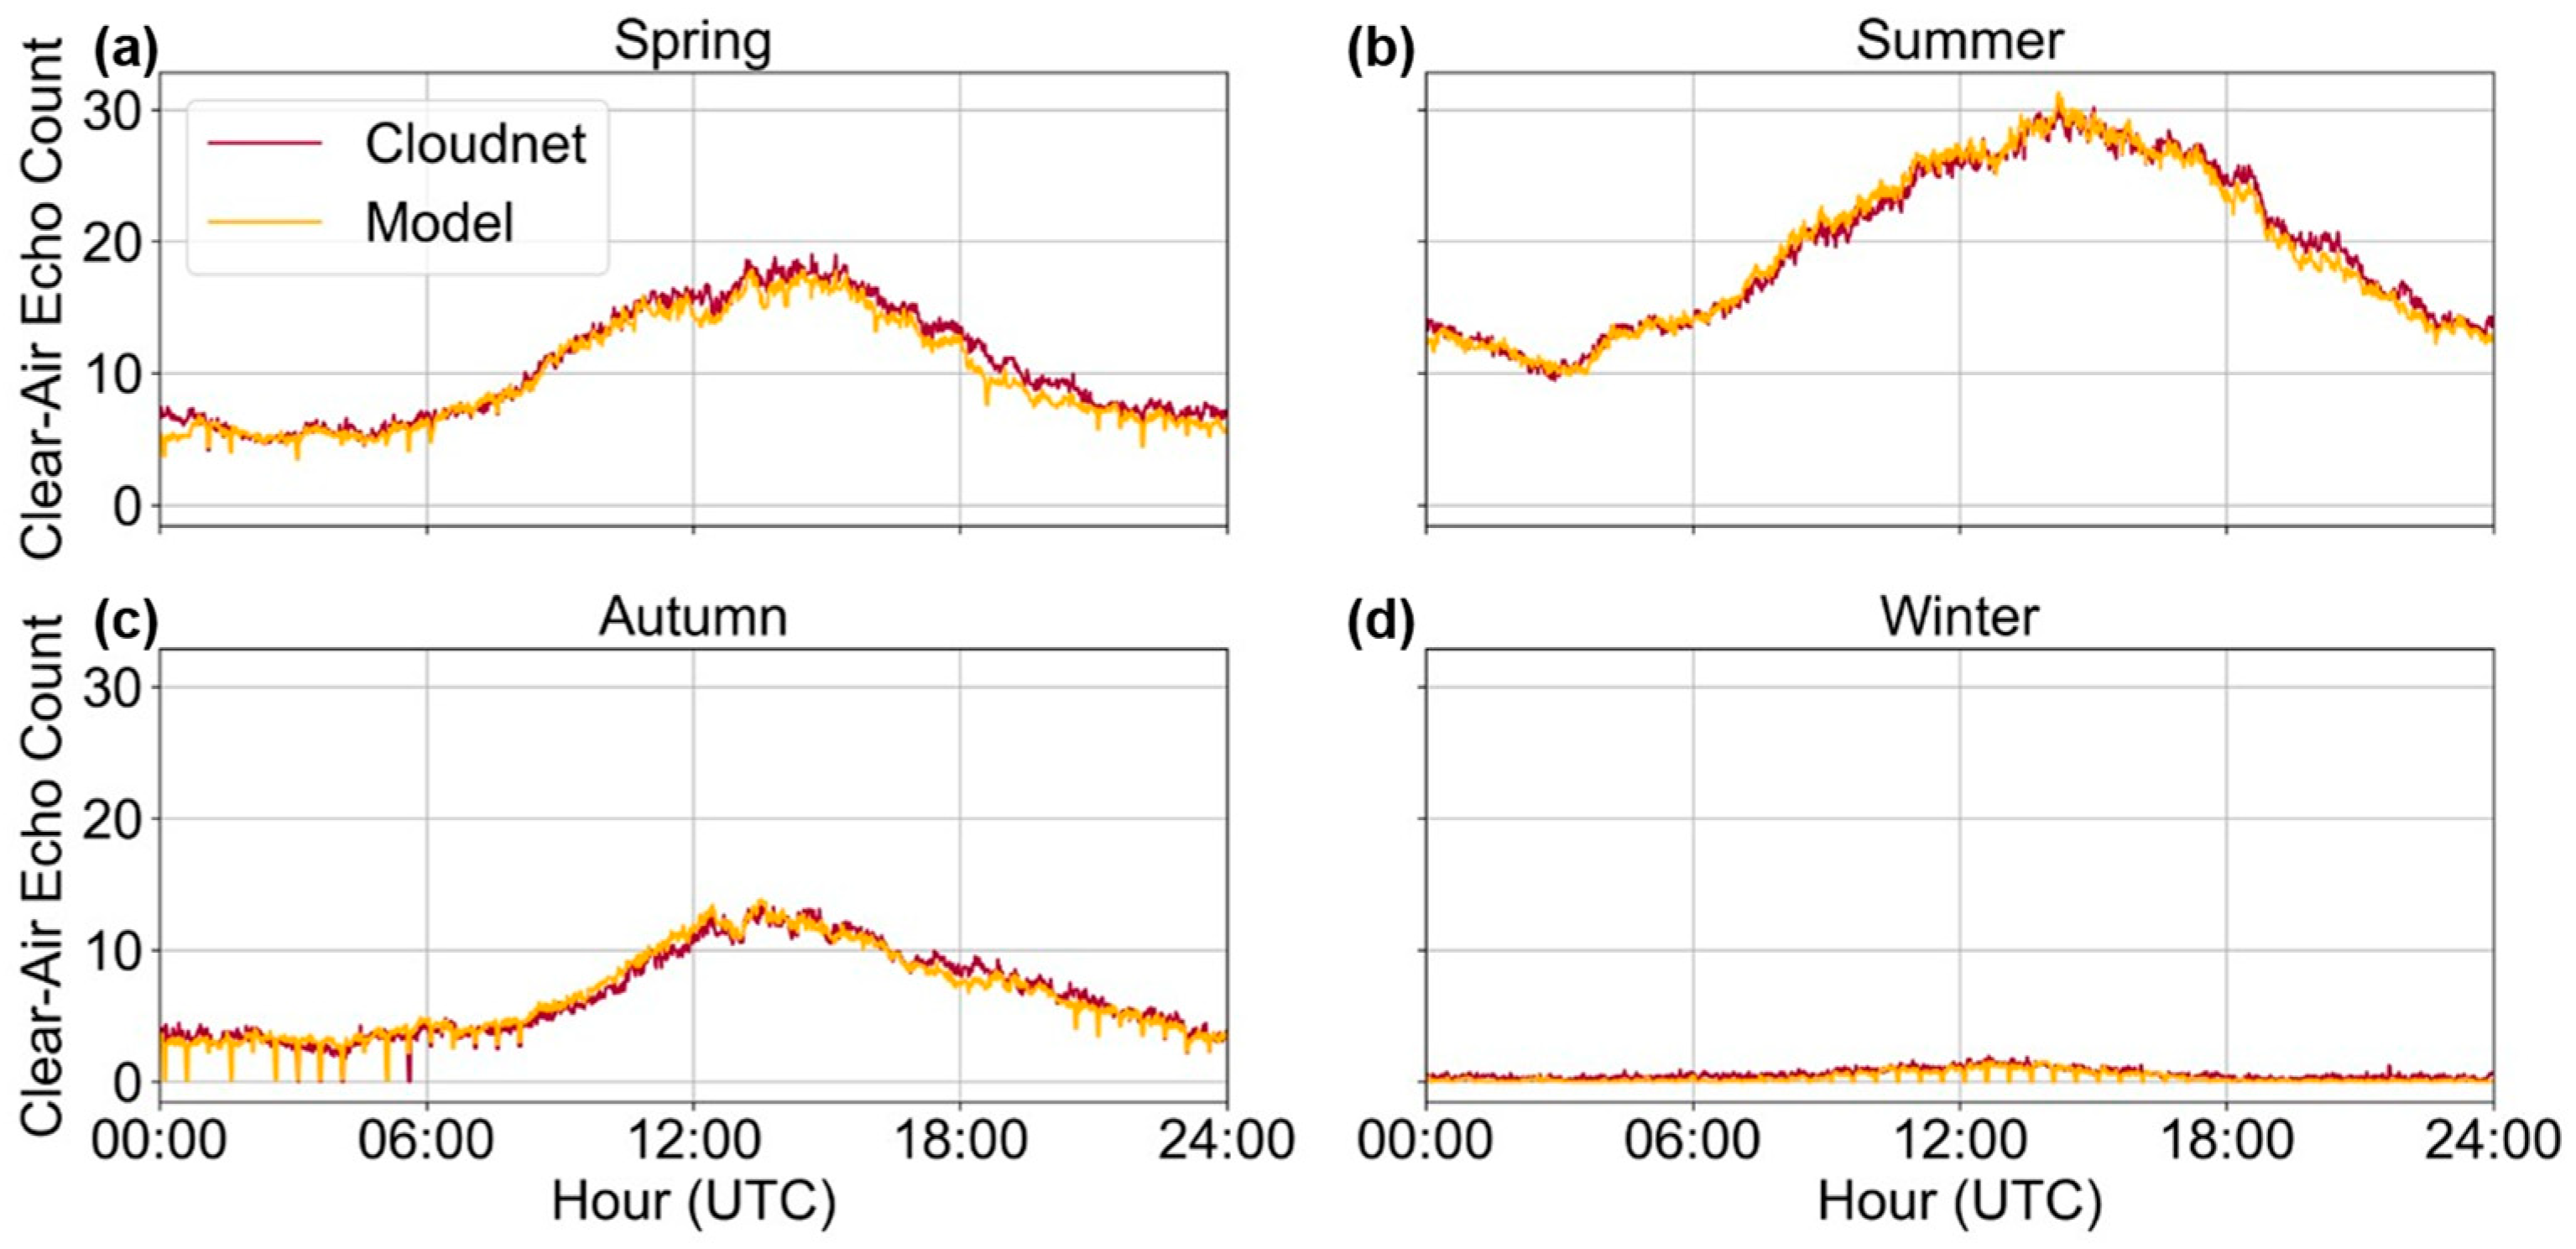
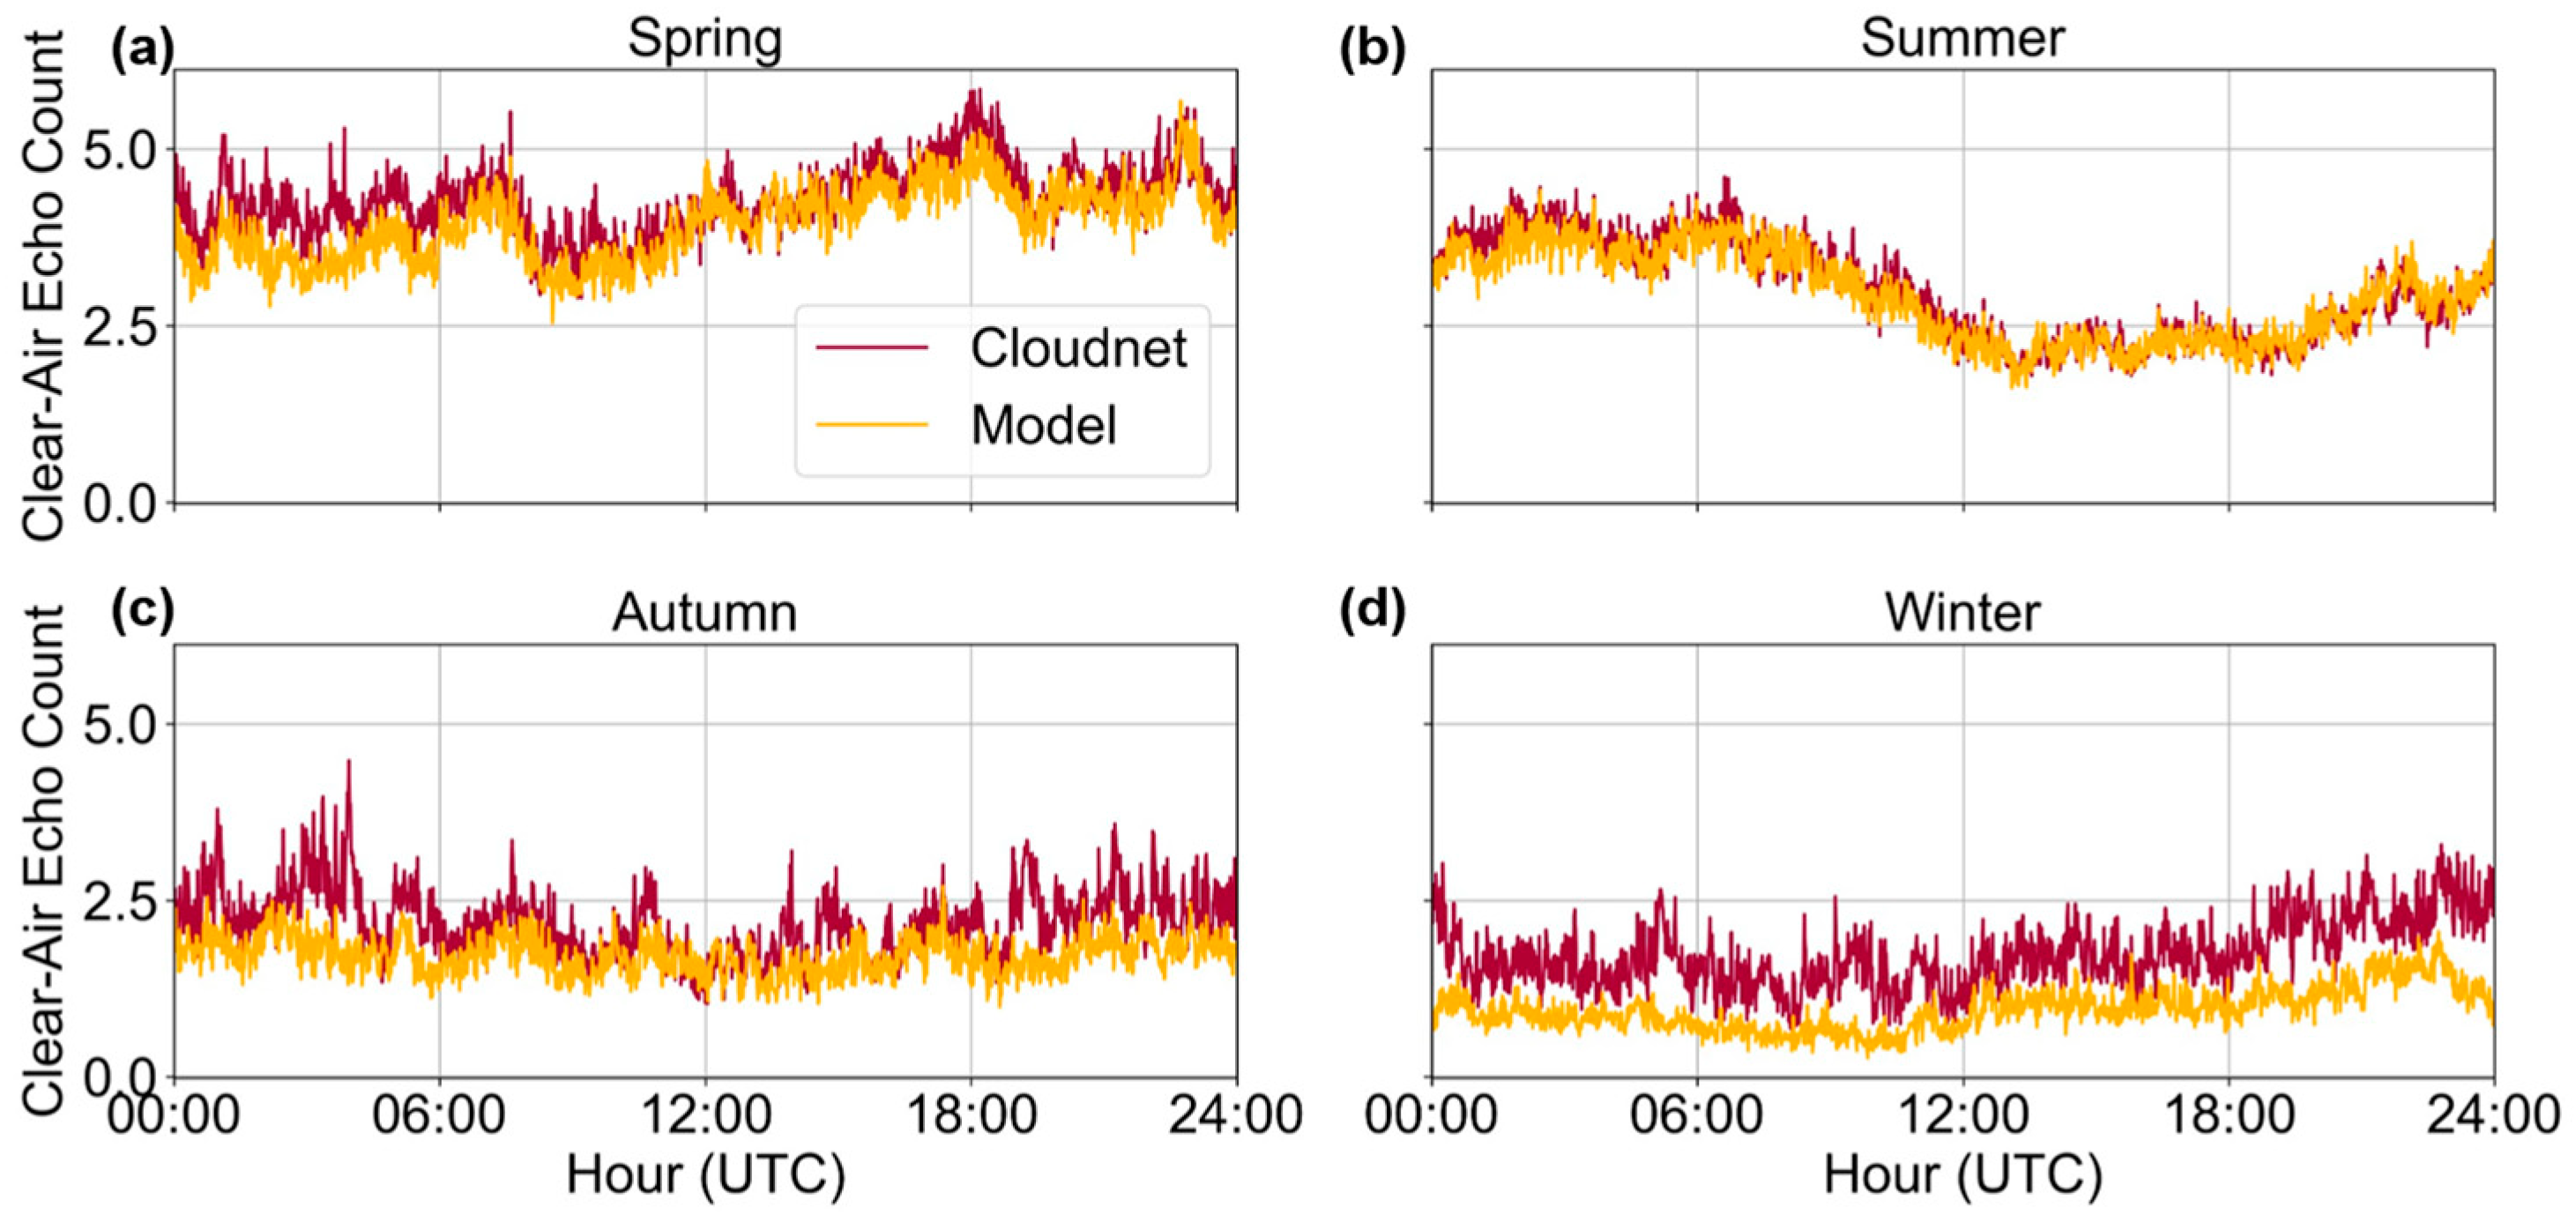
Figure 8 and
Figure 9 illustrate daily variations in clear-air echo counts at the two stations, comparing results identified by Cloudnet and the DL model.
At the Jülich site (
Figure 8), clear-air echoes showed pronounced seasonal variation and distinct diurnal patterns, with counts peaking in summer and decreasing in winter. Daytime echo counts exceeded nighttime counts, consistent with known patterns of biologically induced echoes, such as insects. Both algorithms produced similar temporal trends, confirming the DL model’s stability in capturing seasonal and daily variations.
In contrast, at the Lampedusa site (
Figure 9), the overall clear-air echo counts were significantly lower than those observed at Jülich, averaging approximately 6 echoes per minute in summer compared to around 18 at Jülich. While seasonal variations existed, diurnal variations were less pronounced. Interestingly, summer nighttime counts at Lampedusa occasionally exceeded daytime counts, potentially due to the suppression of insect activity by extreme daytime heat, as average daytime temperatures often exceeded 30 °C during this season.
These observations highlight that the relationship between clear-air echoes and temperature is not simply linear and positive; in certain high-temperature regions, inverse modulation effects may occur. Consequently, Cloudnet’s sigmoid-based temperature probability modeling may have limited applicability across different climate regions.
Additionally, during winter at Lampedusa, clear-air echo counts identified by the DL model were notably fewer compared to Cloudnet. This discrepancy likely arises because Cloudnet misclassified thin, low-reflectivity cloud layers (with missing LDR data) as clear-air echoes, whereas the DL method utilized spatial textural features to maintain higher accuracy, demonstrating superior interference suppression in weak-signal winter conditions.
4.3.2. Joint Altitude-Season Distribution Analysis
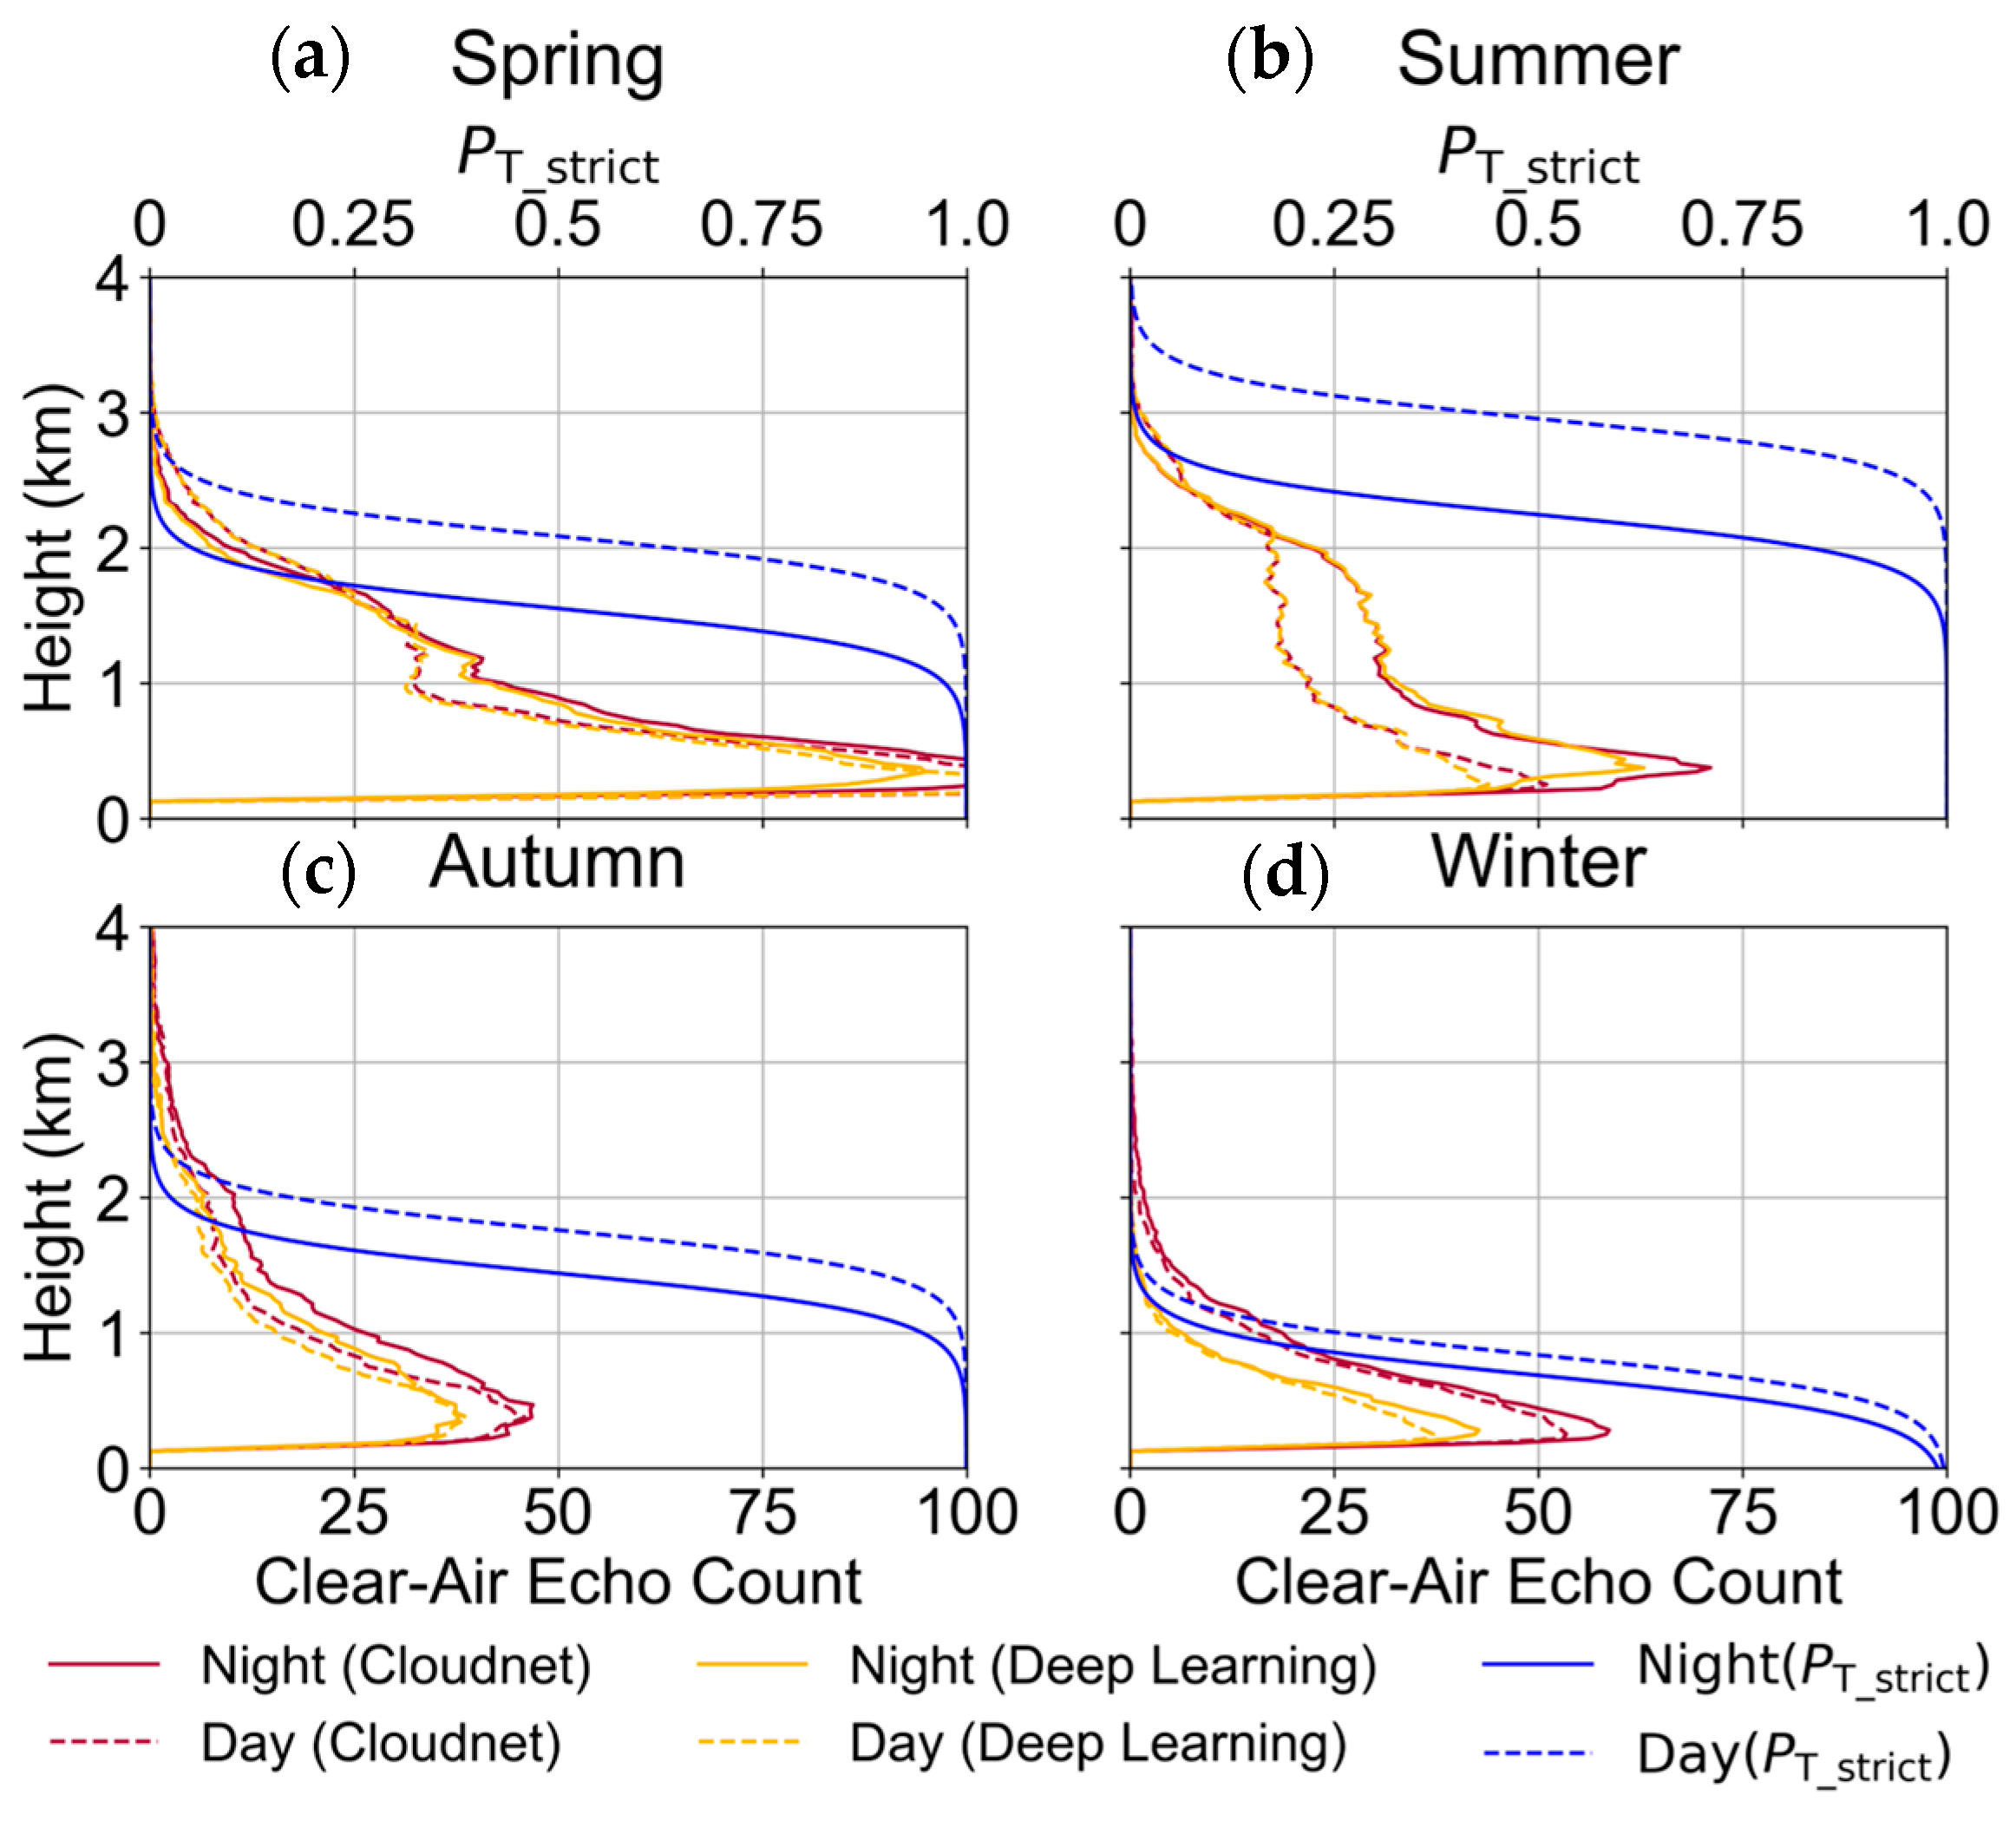
To further characterize vertical distributions,
Figure 10 and
Figure 11 depict seasonal clear-air echo altitude distributions at both stations throughout 2024, differentiating daytime (dashed lines) from nighttime (solid lines). In addition, temperature-related probability functions (Equations (3) and (6)) are visualized across altitudes by coupling surface temperatures with a standard atmospheric model. The daytime-derived probability profiles are shown as blue dashed lines, and nighttime profiles as solid blue lines.
At Jülich (
Figure 10), clear-air echoes predominantly occurred within the 0–2 km altitude range during spring and autumn, extending to higher altitudes in summer and remaining close to ground level in winter, showing strong diurnal variations. At Lampedusa (
Figure 11), echoes frequently appeared at higher altitudes during spring, summer, and autumn compared to Jülich, with minimal day-night differences. This suggests that biological sources may not be the primary triggers in this region, or that the mechanisms controlling clear-air echo formation might be more climate-dependent and complex such as refractive layers, as discussed in the research of Franck et al. [
25].
These findings illustrate that clear-air echo altitudes generally decrease with temperature and altitude, but the specific patterns and diurnal cycles depend heavily on geographic location, local climate, and types of non-meteorological scattering sources. For instance, at Jülich (
Figure 10), the vertical distribution of clear-air echoes aligns well with the temperature-based probability function, suggesting that insect activity is a likely contributor in the temperate marine climate. In contrast, at Lampedusa (
Figure 11), clear-air echoes in spring, autumn, and winter frequently appeared between 1.5–3 km, deviating significantly from the probability curve. For these altitudes, the temperature-based function used in Cloudnet typically assigns probabilities below 0.5, thereby impairing its ability to accurately classify these echoes. This discrepancy likely stems from the fact that high-altitude clear-air echoes at Lampedusa are not of biological origin.
Therefore, classification approaches relying solely on single-variable thresholds (such as “high-altitude implies meteorological” or “low temperature implies non-meteorological”) are inadequate.
4.3.3. Influence of Temperature and Pressure on Clear-Air Echo Occurrence
To further examine relationships between clear-air echo occurrence and surface meteorological variables,
Figure 12 presents two-dimensional heatmaps of clear-air echo counts against surface temperature and pressure for the year 2024 at Jülich and Lampedusa, along with calculated correlation coefficients.
At Jülich, clear-air echo counts exhibited a significant positive correlation (R = 0.68) with surface temperature, aligning with the classical understanding of insect activity sensitivity to temperature. At Lampedusa, however, the correlation was nearly non-existent (R = 0.05), indicating the different role of temperature under subtropical high-temperature conditions. This finding suggests potential saturation or suppression mechanisms, or other influential factors such as dust or large aerosols, that are insensitive to temperature variations.
This analysis further underscores the uncertainty of temperature as a primary determinant for clear-air echo classification across diverse climatic zones. The fixed sigmoid function-based temperature model used by Cloudnet does not adequately capture nonlinear coupling among temperature, climate, and ecological backgrounds. In contrast, the DL method—by not depending on specific physical variables—demonstrates greater adaptability and robustness.
5. Conclusions and Discussion
This study systematically evaluated a deep learning classification model that incorporates spatial texture characteristics to address misclassification of non-meteorological echoes in Ka-band cloud radar data. Using multi-site observations from the Cloudnet network, the proposed DL method was extensively validated against the existing Cloudnet fuzzy logic algorithm. The results demonstrated robust performance, with consistent structural modeling and boundary preservation across diverse meteorological cases, long-term datasets, multiple climatic regions, and varying observational scales, thereby highlighting its strong generalization capability. At the same time, it should be noted that the reliability of deep learning methods largely depends on the reliability of the underlying data. Clear-air echoes lack direct in situ measurements and can only be identified through auxiliary instruments such as lidar or through signal texture features, which inevitably introduces uncertainties in manual labeling. The issue of interpretability and the reasons behind the model’s superior performance have already been investigated in greater detail in our previous work, where more controlled comparative experiments were conducted.
Detailed case-based analyses revealed that Cloudnet’s current fuzzy logic classification algorithm heavily relies on two physical variables: the linear depolarization ratio (LDR) and ambient temperature. While LDR serves as the primary polarization criterion, temperature becomes the primary alternative under conditions of missing LDR data. Through comparative analyses across multiple cases and sites, the present study identified clear limitations of this strategy, particularly near weak precipitation boundaries, high-altitude disturbances, and non-biological interference backgrounds. When weak reflectivity reduces LDR signals below radar sensitivity thresholds, Cloudnet frequently misclassifies genuine meteorological signals as clear-air echoes. Conversely, in regions with missing LDR data, its excessive dependence on temperature leads to systematic false alarms, incorrectly labelling high-altitude non-meteorological disturbances as clouds. While moderately effective in typical meteorological scenarios at mid-to-low latitudes, Cloudnet’s strategy clearly suffers in non-ideal observational conditions.
Through extensive multi-site temporal validation, comparative analysis of 1824 simultaneous observation samples showed that Cloudnet had approximately 15% (273 cases) false alarms identified uniquely as cloud echoes, typically centered at around 1.94 km altitude, directly linked to temperature-based misclassification mechanisms. Significantly, these clear-air echo identification errors adversely affect higher-order meteorological products. Analysis of multi-site observational data indicated that Cloudnet systematically underestimated cloud-base heights by an average of 0.84 km in the 3–6 km altitude range, representing a systematic bias of approximately 19.5% caused by high-altitude clear-air false alarms. Although low-level cloud-base identifications (<3 km) were consistent between the DL and Cloudnet methods, Cloudnet’s total cloud fraction estimates in the 0–6 km range exhibited a systematic overestimation of about 1.7%, attributable to insufficient removal of clear-air echoes. Such systematic errors can introduce biases in cloud statistical characterization, radiative budget estimations, and model initial conditions derived from radar data, ultimately impacting weather and climate prediction accuracy.
Long-term statistical analyses at two climatologically distinct stations—Lampedusa and Jülich—further revealed that the relationship between clear-air echo occurrence and ambient temperature was not always positively linear, with some high-temperature regions even exhibiting inverse or negligible correlations. For example, Lampedusa’s high annual temperatures corresponded to significantly fewer clear-air echoes compared to Jülich, and diurnal variations were minimal, while Jülich showed pronounced biological activity-driven echo patterns. These differences indicate that Cloudnet’s current fixed sigmoid temperature-echo probability mapping lacks universal applicability across varying geographic, ecological, and climatic contexts. Future classification algorithms should thus incorporate regional ecological modifiers to enhance physical interpretability and general adaptability.
It should also be acknowledged that the present study relies on limited temporal subsets for model fine-tuning (ten days from the Bucharest station in May 2024) and for cross-site comparisons (ten days in August 2024 across multiple stations). These periods were chosen to maximize data availability and ensure overlapping observations across sites, but they may not capture the full spectrum of climatological variability. One limitation of this study is that the fine-tuning used only a 10-day period at a single site. While this may appear short, the pretrained dataset already covers multiple seasons and sites, providing sufficient climatic diversity for generalization. Moreover, extending the fine-tuning period would not necessarily improve results, since uncertainties in manual labeling dominate once the dataset is sufficiently large. Thus, we consider the chosen setup adequate for testing transferability, though future work could further test longer or alternative fine-tuning periods. While our additional year-long analysis at Lampedusa and Jülich partially mitigates this limitation, future work should further examine longer and more diverse temporal windows to confirm the robustness of the conclusions.
Another limitation relates to differences in radar sensitivity across Cloudnet sites. Although all instruments are MIRA-35 radars, variations in antenna dimensions, integration times, and range resolutions inevitably lead to differences in absolute sensitivity. Our approach focuses on echo morphology and spatial texture features rather than absolute calibration, which helps mitigate this variability. The consistent performance observed across multiple sites supports this robustness. Nevertheless, it should be emphasized that the method is designed for radars operating under standard quality-control frameworks (e.g., CMA Net, Cloudnet). If instrumental performance degrades severely, any classification algorithm will inevitably fail. Future work may further improve adaptability by explicitly incorporating radar metadata (e.g., sensitivity parameters) into the model training.
In summary, through comprehensive multi-site, multi-temporal, and multi-climatic Ka-band radar observations, this study thoroughly validated the DL-based clear-air echo identification model’s generalization and physical consistency within the Cloudnet classification framework. Comparative case analyses, quantitative cloud-base and cloud-fraction assessments, and year-long statistical evaluations indicate that the DL model, independent of temperature effectively distinguishes non-meteorological disturbances from genuine meteorological signals, achieving higher classification consistency, structural integrity, and physical rationality under varied interference scenarios. These findings not only reveal key limitations of Cloudnet’s existing fuzzy logic classification method, particularly its reliance on temperature and vulnerability in missing-LDR conditions, but also propose concrete directions for future improvements. Besides direct adoption of DL methods, further fuzzy-logic-based studies might explore the influence of regional ecological factors and climatic properties on non-meteorological echo distributions, providing foundations for constructing physically interpretable, adaptive radar echo classification systems.
Author Contributions
Investigation, J.Z.; data curation, J.Z., J.Y., W.T., Z.L. and S.L.; writing—original draft, J.Z.; technical support, J.Y., W.T., Z.L. and T.L.; conceptualization, Z.Y. and D.M.; supervision, Z.Y.; project administration, Z.Y.; funding acquisition, Z.Y.; writing—review & editing, W.Z., Z.Y. and X.W.; methodology, W.Z.; data processing, W.Z.; evaluation, W.Z.; visualization, W.Z.; validation, Y.W. software development, S.L.; resources, T.L. All authors have read and agreed to the published version of the manuscript.
Funding
This work was partially supported by the National Key Research and Development Program of China under Grant 2023YFC3007802 and the Innovation and Development Project of the China Meteorological Administration (grant nos. CXFZ2025J062). This research has also been supported by the National Natural Science Foundation of China (grant nos. 42205130, 62475068, 42575141).
Data Availability Statement
Acknowledgments
The authors thank the technical support from the Cloudnet community and gratefully acknowledge the ACTRIS Cloud Remote Sensing Unit for making the Cloudnet datasets publicly available. We also acknowledge the China Meteorological Administration and the Meteorological Observation Center for providing the dataset datasets used in this study.
Conflicts of Interest
The authors declare that they have no conflict of interest.
References
- Slingo, A. Sensitivity of the Earth’s Radiation Budget to Changes in Low Clouds. Nature 1990, 343, 49–51. [Google Scholar] [CrossRef]
- Stephens, G.L.; Li, J.; Wild, M.; Clayson, C.A.; Loeb, N.; Kato, S.; L’Ecuyer, T.; Stackhouse, P.W.; Lebsock, M.; Andrews, T. An Update on Earth’s Energy Balance in Light of the Latest Global Observations. Nat. Geosci. 2012, 5, 691–696. [Google Scholar] [CrossRef]
- Deng, M.; Mace, G.G.; Wang, Z.; Okamoto, H. Tropical Composition, Cloud and Climate Coupling Experiment Validation for Cirrus Cloud Profiling Retrieval Using CloudSat Radar and CALIPSO Lidar. J. Geophys. Res. Atmos. 2010, 115, D00H25. [Google Scholar] [CrossRef]
- Zhao, C.; Xie, S.; Klein, S.A.; Protat, A.; Shupe, M.D.; McFarlane, S.A.; Comstock, J.M.; Delanoë, J.; Deng, M.; Dunn, M.; et al. Toward Understanding of Differences in Current Cloud Retrievals of ARM Ground-Based Measurements. J. Geophys. Res. Atmos. 2012, 117, D10206. [Google Scholar] [CrossRef]
- Illingworth, A.J.; Hogan, R.J.; O’Connor, E.J.; Bouniol, D.; Brooks, M.E.; Delanoé, J.; Donovan, D.P.; Eastment, J.D.; Gaussiat, N.; Goddard, J.W.F.; et al. Cloudnet: Continuous Evaluation of Cloud Profiles in Seven Operational Models Using Ground-Based Observations. Bull. Am. Meteorol. Soc. 2007, 88, 883–898. [Google Scholar] [CrossRef]
- Görsdorf, U.; Lehmann, V.; Bauer-Pfundstein, M.; Peters, G.; Vavriv, D.; Vinogradov, V.; Volkov, V. A 35-GHz Polarimetric Doppler Radar for Long-Term Observations of Cloud Parameters—Description of System and Data Processing. J. Atmos. Ocean. Technol. 2015, 32, 675–690. [Google Scholar] [CrossRef]
- Luke, E.P.; Kollias, P.; Johnson, K.L.; Clothiaux, E.E. A Technique for the Automatic Detection of Insect Clutter in Cloud Radar Returns. J. Atmos. Ocean. Technol. 2008, 25, 1498–1513. [Google Scholar] [CrossRef]
- Chandra, A.S.; Kollias, P.; Albrecht, B.A. Multiyear Summertime Observations of Daytime Fair-Weather Cumuli at the ARM Southern Great Plains Facility. J. Clim. 2013, 26, 10013–10030. [Google Scholar] [CrossRef]
- Yang, L.; Wang, Y.; Wang, Z.; Yang, Q.; Fan, X.; Tao, F.; Zhen, X.; Yang, Z. Automatic Identification of Clear-Air Echoes Based on Millimeter-Wave Cloud Radar Measurements. Adv. Atmos. Sci. 2020, 37, 912–924. [Google Scholar] [CrossRef]
- Hildebrand, P.H.; Sekhon, R.S. Objective Determination of the Noise Level in Doppler Spectra. J. Appl. Meteorol. 1974, 13, 808–811. [Google Scholar] [CrossRef]
- Zou, W.; Yin, Z.; Dai, Y.; Chen, Y.; Bu, Z.; Li, S.; He, Y.; Hu, X.; Müller, D.; Lu, T.; et al. Robust Lidar-Radar Composite Cloud Boundary Detection Method With Rainfall Pixels Removal. IEEE Trans. Geosci. Remote Sens. 2024, 62, 3476127. [Google Scholar] [CrossRef]
- Qu, Y.; Zhang, C.; Yang, X.; Wu, Y.; Zhang, W.; Zhang, G. Classifying Clear Air Echoes via Static and Motion Streams Network. IEEE Geosci. Remote Sens. Lett. 2022, 19, 3097098. [Google Scholar] [CrossRef]
- Williams, C.R.; Maahn, M.; Hardin, J.C.; de Boer, G. Clutter Mitigation, Multiple Peaks, and High-Order Spectral Moments in 35GHz Vertically Pointing Radar Velocity Spectra. Atmos. Meas. Tech. 2018, 11, 4963–4980. [Google Scholar] [CrossRef]
- Wainwright, C.E.; Stepanian, P.M.; Reynolds, D.R.; Reynolds, A.M. The Movement of Small Insects in the Convective Boundary Layer: Linking Patterns to Processes. Sci. Rep. 2017, 7, 5438. [Google Scholar] [CrossRef]
- Tao, F.; Guan, L.; Zhang, X.; Hu, S.; Yang, L.; Ma, Q. Vertical Structure and Variation Characteristics of Clear-Air Echoes Observed by Ka-Band Cloud Radar. Trans. Atmos. Sci. 2020, 31, 719–728. [Google Scholar] [CrossRef]
- Zou, W.; Yin, Z.; Zhang, J.; Dai, Y.; Chen, Y.; Bu, Z.; He, Y.; Müller, D.; Lu, T.; Wei, Y.; et al. Ka-Band Cloud Radar Meteorological Echo Dataset with Complex Weather Coverage: Baseline Models for Deep Learning Applications. IEEE Trans. Geosci. Remote Sens. 2025, 63, 3577556. [Google Scholar] [CrossRef]
- Garrett, T.J.; Zhao, C. Ground-Based Remote Sensing of Thin Clouds in the Arctic. Atmos. Meas. Tech. 2013, 6, 1227–1243. [Google Scholar] [CrossRef]
- Hu, X.; Ge, J.; Du, J.; Li, Q.; Huang, J.; Fu, Q. A Robust Low-Level Cloud and Clutter Discrimination Method for Ground-Based Millimeter-Wavelength Cloud Radar. Atmos. Meas. Tech. 2021, 14, 1743–1759. [Google Scholar] [CrossRef]
- Huang, J.; Ge, J.; Weng, F. Detection of Asia Dust Storms Using Multisensor Satellite Measurements. Remote Sens. Environ. 2007, 110, 186–191. [Google Scholar] [CrossRef]
- Tukiainen, S.; O’Connor, E.; Korpinen, A. CloudnetPy: A Python Package for Processing Cloud Remote Sensing Data. J. Open Source Softw. 2020, 5, 2123. [Google Scholar] [CrossRef]
- Gumà-Claramunt, P.; Madonna, F.; Amodeo, A.; Bauer-Pfundstein, M.; Papagiannopoulos, N.; Rosoldi, M.; Pappalardo, G. Giant Aerosol Observations with Cloud Radar: Methodology and Effects. Remote Sens. 2025, 17, 419. [Google Scholar] [CrossRef]
- Kalapureddy, M.C.R.; Sukanya, P.; Das, S.K.; Deshpande, S.M.; Pandithurai, G.; Pazamany, A.L.; Ambuj, K.J.; Chakravarty, K.; Kalekar, P.; Devisetty, H.K.; et al. A Simple Biota Removal Algorithm for 35 GHz Cloud Radar Measurements. Atmos. Meas. Tech. 2018, 11, 1417–1436. [Google Scholar] [CrossRef]
- Browning, K.A.; Nicol, J.C.; Marsham, J.H.; Rogberg, P.; Norton, E.G. Layers of Insect Echoes near a Thunderstorm and Implications for the Interpretation of Radar Data in Terms of Airflow. Q. J. R. Meteorol. Soc. 2011, 137, 723–735. [Google Scholar] [CrossRef]
- Beauchamp, R.M.; Chandrasekar, V. Robust Linear Depolarization Ratio Estimation for Dual-Polarization Weather Radar. IEEE Trans. Geosci. Remote Sens. 2016, 54, 1462–1474. [Google Scholar] [CrossRef]
- Franck, A.; Moisseev, D.; Vakkari, V.; Leskinen, M.; Lampilahti, J.; Kerminen, V.-M.; O’Connor, E. Evaluation of Convective Boundary Layer Height Estimates Using Radars Operating at Different Frequency Bands. Atmos. Meas. Tech. 2021, 14, 7341–7353. [Google Scholar] [CrossRef]
Figure 1.
Temperature-based probability curves used in Cloudnet. The blue line applies when LDR data are available, and the red line when they are missing. In the absence of LDR, temperature plays a more dominant role in the classification.
Figure 1.
Temperature-based probability curves used in Cloudnet. The blue line applies when LDR data are available, and the red line when they are missing. In the absence of LDR, temperature plays a more dominant role in the classification.
Figure 2.
Case of misclassification due to missing LDR during a weak precipitation event (12 April 2024, Lampedusa site). (a) Radar reflectivity factor (dBZ); (b) Doppler velocity (m/s); (c) Spectral width (m/s); (d) Linear depolarization ratio (LDR, dB); (e) Echo classification results (Cloudnet vs. deep learning model). Red Box 1: Rainfall boundary with LDR missing, leading to misclassification. Red Box 2: Strong insect echo interference. Color codes: gray—no valid echo (None); light blue—both methods identify clear-air echo (Clear-air Echo, Both); purple—both identify meteorological echo (Met Echo, Both); orange—only DL identifies meteorological echo (DL only); red—only Cloudnet identifies meteorological echo (Cloudnet only).
Figure 3.
False identification of weak high-altitude echoes (17 April 2024, Lampedusa site). (a) Radar reflectivity factor (dBZ); (b) Doppler velocity (m/s); (c) Spectral width (m/s); (d) Linear depolarization ratio (LDR, dB); (e) Echo classification results (Cloudnet vs. deep learning model). Red Box 1: Misclassified high-altitude clear-air echoes. Color codes: gray—no valid echo (None); light blue—both methods identify clear-air echo (Clear-air Echo, Both); purple—both identify meteorological echo (Met Echo, Both); orange—only DL identifies meteorological echo (DL only); red—only Cloudnet identifies meteorological echo (Cloudnet only).
Figure 4.
Classification comparison under mixed echo conditions (7 May 2024, Lampedusa site). (a) Radar reflectivity factor (dBZ); (b) Doppler velocity (m/s); (c) Spectral width (m/s); (d) Linear depolarization ratio (LDR, dB); (e) Echo classification results (Cloudnet vs. deep learning model). Red Box 1: Misclassified stratiform precipitation echoes (underestimated by Cloudnet due to weak LDR signals), which are correctly identified by the DL model. Red Box 2: Near-surface insect-contaminated echoes (low reflectivity, high spectral width, no LDR), incorrectly classified as clear-air echoes by Cloudnet. Red Box 3: Precipitation region with valid LDR but misclassified as clear-air echo by Cloudnet, likely due to thresholding bias or unbalanced decision weights. Color codes: gray—no valid echo (None); light blue—both methods identify clear-air echo (Clear-air Echo, Both); purple—both identify meteorological echo (Met Echo, Both); orange—only DL identifies meteorological echo (DL only); red—only Cloudnet identifies meteorological echo (Cloudnet only).
![Remotesensing 17 03324 g004 Remotesensing 17 03324 g004]()
Figure 5.
Comparison of meteorological echo classification between the deep learning (DL) model and Cloudnet under long time series conditions (1–10 August 2024). Panels (a–d) show the time–height classification profiles for four Cloudnet stations—Bucharest, Lampedusa, Jülich, and Limassol—during the period of 1–10 August 2024. The cloud-base identifications are marked by short horizontal lines. The comparison highlights the consistency and differences between the DL model and the Cloudnet algorithm in identifying meteorological versus clear-air echoes. Color codes: gray—no valid echo (None); light blue—both methods identify clear-air echo (Clear-air Echo, Both); purple—both identify meteorological echo (Met Echo, Both); orange—only DL identifies meteorological echo (DL only); red—only Cloudnet identifies meteorological echo (Cloudnet only). Horizontal lines indicate the 60-min detected cloud base height.
Figure 6.
Same as
Figure 5, but for four additional Cloudnet stations: (
a) Lindenberg; (
b) Munich; (
c) Schneefernerhaus; (
d) Potenza.
Figure 6.
Same as
Figure 5, but for four additional Cloudnet stations: (
a) Lindenberg; (
b) Munich; (
c) Schneefernerhaus; (
d) Potenza.
Figure 7.
Differences in the number of meteorological echoes identified by the deep learning model relative to Cloudnet across European Cloudnet stations, based on the period statistical analysis. Bar plots show the relative differences (in %) between the deep learning model and Cloudnet in the number of meteorological echoes detected at two altitude ranges: 0–3 km (blue bars) and 3–6 km (orange bars).
Figure 8.
Diurnal variation of clear-air echo occurrences at the Jülich site in 2024, stratified by season: (a) spring, (b) summer, (c) autumn, and (d) winter. The orange line represents clear-air echoes identified by the deep learning model, and the red line represents those classified by the Cloudnet algorithm. The y-axis indicates the number of clear-air echoes accumulated per minute at each UTC hour.
Figure 9.
Diurnal variation of clear-air echo occurrences at the Lampedusa site in 2024, stratified by season: (a) spring, (b) summer, (c) autumn, and (d) winter. The orange line represents clear-air echoes identified by the deep learning model, while the red line indicates those classified by the Cloudnet algorithm. The y-axis shows the number of clear-air echoes accumulated per minute at each UTC hour.
Figure 10.
Altitude distribution of clear-air echoes at the Jülich site throughout 2024, stratified by season: (a) spring, (b) summer, (c) autumn, and (d) winter. Histograms show the number of clear-air echoes at each altitude for daytime (dashed lines) and nighttime (solid lines). Red lines represent results from the Cloudnet classification, while orange lines indicate identifications by the deep learning model. The x-axis denotes the total number of clear-air echoes per altitude bin, and the y-axis indicates altitude (in km).
Figure 11.
Altitude distribution of clear-air echoes at the Lampedusa site throughout 2024, stratified by season: (a) spring, (b) summer, (c) autumn, and (d) winter. Histograms display the number of clear-air echoes at each altitude for daytime (dashed lines) and nighttime (solid lines). Red lines indicate Cloudnet classification results, while orange lines represent identifications by the deep learning model. The x-axis shows the total number of clear-air echoes per altitude bin, and the y-axis corresponds to altitude (in km).
Figure 12.
Two-dimensional distribution of clear-air echo occurrences over the year 2024 at (a) Lampedusa and (b) Jülich, plotted in the space of surface temperature (y-axis) and surface pressure (x-axis). Color shading indicates the total number of clear-air echoes identified by the deep learning model under each temperature–pressure condition pair (unit: count).
Table 1.
Technical Specifications of MIRA-35 Ka-band Cloud Radar.
Table 1.
Technical Specifications of MIRA-35 Ka-band Cloud Radar.
| Parameter Type | Specification |
|---|
| Operating Frequency | 33–37 GHz (Ka-band, recommended 35.2 GHz) |
| Sensitivity | −53 dBZ (5 km range, 30 m resolution, 10 s integration) |
| Maximum Height | Up to 58.8 km (dependent on pulse width and PRF) |
| Minimum Height | Typically 100–150 m; stable sensitivity above 450 m |
| Spatial Resolution | 15–60 m (adjustable pulse width) |
| Temporal Resolution | Minimum 0.1 s |
| Polarization | Simultaneous co/cross-polarization reception for hydrometeor identification |
Table 2.
Basic geographic and climatic information of selected Cloudnet sites.
Table 2.
Basic geographic and climatic information of selected Cloudnet sites.
| Site | Latitude (°) | Longitude (°) | Altitude (m) | Climate Type | Coastal |
|---|
| Bucharest | 44.3 | 26 | 90 | Humid continental | No |
| Jülich | 50.9 | 6.4 | 100 | Oceanic | No |
| Lampedusa | 35.5 | 12.6 | 20 | Hot semi-arid | Yes |
| Limassol | 34.7 | 33 | 10 | Hot semi-arid/Mediterranean | Yes |
| Lindenberg | 52.2 | 14.1 | 98 | Oceanic | No |
| Munich | 48.1 | 11.6 | 519 | Oceanic | No |
| Potenza | 40.6 | 15.7 | 819 | Mediterranean highland | No |
| Schneefernerhaus | 47 | 10.9 | 2650 | Alpine | No |
Table 3.
Statistical Differences Between the Deep Learning Model and Cloudnet in Different Cloud Base Height Ranges. All metrics are reported in kilometers (km).
Table 3.
Statistical Differences Between the Deep Learning Model and Cloudnet in Different Cloud Base Height Ranges. All metrics are reported in kilometers (km).
| Height Interval (DL-Predicted Cloud-Base) (km) | Sample Size | Mean Difference (km) (DL-Cloudnet) | Median (km) | Std. Deviation (km) | Mean Absolute Error (km) |
|---|
| pred < 3 | 525 | +0.05 | 0.00 | 0.30 | 0.13 |
| 3 ≤ pred < 6 | 103 | +0.84 | 0.00 | 1.35 | 0.86 |
| Disclaimer/Publisher’s Note: The statements, opinions and data contained in all publications are solely those of the individual author(s) and contributor(s) and not of MDPI and/or the editor(s). MDPI and/or the editor(s) disclaim responsibility for any injury to people or property resulting from any ideas, methods, instructions or products referred to in the content. |
© 2025 by the authors. Licensee MDPI, Basel, Switzerland. This article is an open access article distributed under the terms and conditions of the Creative Commons Attribution (CC BY) license (https://creativecommons.org/licenses/by/4.0/).
