1. Introduction
The differential interferometric synthetic aperture radar (DInSAR) technique is a remote sensing technique capable of providing highly precise surface deformation measurements with millimeter-level accuracy, achieved by analyzing phase differences in the radar echoes [
1,
2,
3]. It finds critical applications in geodesy, geophysics, and earth sciences, including the monitoring of tectonic plate movements [
4], deformation due to activities like groundwater extraction or oil reservoir depletion [
5,
6], and the evaluation of volcanic and seismic hazards [
7,
8]. However, there are limitations attributed to temporal and geometric decorrelations, as well as atmospheric effects, which limit its deformation measurement accuracy.
To overcome these limitations, the persistent scatterer interferometric synthetic aperture radar (PS-InSAR) technique [
9,
10] has been proposed and developed in the last two decades. The PS-InSAR technique is an extension of the DInSAR technique and relies on persistent scatterer (PS) pixels, whose amplitude and phase values are stable over time and imaging geometry.
As the proposers of this technique, Ferretti et al. [
9] designed a PS-InSAR processing flow that is primarily divided into two steps. First, the PS candidates (PSCs) are selected using the ADI-based method, and the atmospheric phase screen (APS) contributions are estimated and removed based on an iterative algorithm. Then, the digital elevation model (DEM) errors and line-of-sight (LOS) velocities are estimated by maximizing the pixel-by-pixel temporal coherence, and the PS-identification is performed again by setting a threshold on the maximum temporal coherence. Subsequently, Guoxang Liu et al. [
11] proposed a more streamlined approach, requiring only a single ADI-based PS selection step. Neighboring PS pixels are connected to each other to build a network. Spatially correlated components, such as APS contributions, can be eliminated through the phase differencing of connected pixels. The DEM error difference and LOS velocity difference on each connection are solved by maximizing the model coherence. The resulting two systems of linear equations pertaining to DEM errors and LOS velocities, respectively, are independently solved using the least squares method. The deformation measurements in this paper are obtained through this approach.
However, in either processing flow, the quality and quantity of selected PS pixels in the PS-InSAR technique are crucial factors that influence the accuracy and reliability of deformation measurements [
12,
13]. High-quality PS pixels are valuable for accurate deformation measurements, but an inadequate selection may lead to restricted coverage of the study area. Conversely, high-density PS pixels may provide comprehensive coverage but can be less accurate due to the poor phase stability of PS pixels [
14,
15]. Therefore, PS pixel selection is an essential step of PS-InSAR technique.
Conventional PS pixel selection methods can be roughly divided into two categories: amplitude-based methods and phase-based methods. Amplitude-based methods, with amplitude dispersion index (ADI) [
9] as a representative, characterize the phase stability of pixels in time-series images through statistical information of amplitude information. These methods perform well for very bright pixels and are therefore suitable for urban areas that contain significant man-made structures [
16]. However, in sparsely built areas, the density of PS pixels selected by these methods is too low and generally insufficient to produce reliable deformation measurements [
17]. Phase-based methods, with temporal phase coherence (TPC) [
18] as a representative, estimate pixels’ phase stability directly from its interferometric phase noise. Since the amplitude information is no longer utilized, these methods can identify high phase stability pixels with low amplitude and can effectively increase the density of PS pixels in non-urban areas. In addition, the integration of amplitude-based and phase-based methods has already demonstrated enhanced performance in certain specific application scenarios [
13,
19]. Taking StaMPS [
19] as an example, it utilizes both ADI and TPC for PS pixel selection, which has proven to be reliable even in natural terrains. However, this method is more computationally expensive and still cannot adequately identify all possible PS pixels in both urban and non-urban areas [
20]. Furthermore, all above-mentioned methods are sensitive to the threshold value choice: a low threshold can ensure the selection of PS pixels with better phase quality but may also lead to the exclusion of valid PS pixels; conversely, a high threshold may increase the number of PS pixels but can introduce lower-quality pixels. This threshold, however, is traditionally chosen based on scholars’ experience and is highly subjective.
Deep learning is a machine learning technique with multiple levels of representation [
21]. In recent years, deep learning methods have rapidly developed and been successfully applied in the field of SAR image processing [
22,
23,
24,
25]. In our case, the PS pixel selection task requires us to construct a function that can label pixels containing persistent scatterers based on time-series single look complex (SLC) SAR images. This function has a complex structure, making it difficult to represent it in simple mathematical formulas. Conventional PS pixel selection methods try to approximate this function which relied on the researchers’ choice of features and thresholds while the influence brought by subjective factors limited their effectiveness.However, for deep learning, complex functions can be efficiently learned by models with a sufficiently complex structure [
21].
Currently, some researchers have made beneficial attempts to introduce deep learning methods into the task of PS pixel selection. Tiwari et al. [
26] developed a two-dimensional convolution neural network (CNN) structure and a convolutional long short-term memory (CLSTM) structure to extract spatial and spatiotemporal characteristics of PS pixels from time-series interferometric phase. Subsequently, Zhang et al. [
27] introduced a one-dimensional CNN to extract temporal characteristics from SAR amplitude and coherence of interferograms, achieving improved computational efficiency and lower training sample requirements. In the study by Chen et al. [
28], a two-branch network named PSFNet was employed for PS pixel selection. Within this framework, the ResUNet structure extracts spatial characteristics from mean amplitude, amplitude dispersion, and average coherence of time-series SAR images, while the TANet extracts temporal characteristics from the time-series interferometric phase. The two-dimensional characteristics are ultimately concatenated and fused. Alternatively, Azadnejad et al. [
29] designed a multi-layer perceptron (MLP) structure which requires a total of 18 time-domain and frequency-domain characteristics derived from time-series SAR amplitude as input. This approach seeks to reduce the complexity of deep learning models and the training computational cost by leveraging an ample set of pre-extracted characteristics. Although the above methods can all obtain higher-quality PS pixels selection results than conventional approaches, their implementation relies on a certain degree of feature pre-extraction, which complicates the processing flow. However, for an end-to-end deep learning model, the feature extraction is performed automatically during training without manual intervention, thus not influenced by the will of researchers.
Therefore, to improve the quality of PS pixel selection and simplify the processing flow, we construct the multi-temporal feature extraction network (MFN) in this paper. The MFN combines the 3D U-Net [
30] and the CLSTM [
31] to achieve time-series analysis and takes time-series SLC SAR images as input. 3D U-net is a kind of convolutional neural network (CNN) that has been wildly used for volumetric segmentation in medical images [
32,
33,
34]. CLSTM is a kind of recurrent neural network (RNN) that was proposed for solving spatiotemporal sequence forecasting problems [
31]. In the MFN, we first extract spatial characteristics from raw time-series SLC SAR images using 3D U-net. Then, we transmit the extracted spatial feature maps into CLSTM for temporal characteristics extraction and obtain the probability of pixels to be PS pixels. Compared with traditional methods, MFN fully extracts the spatiotemporal characteristics of complex SAR images to improve selection performance.
The remainder of this paper is organized as follows.
Section 2 introduces the characteristics of the PS pixel and analyzes the limitations of the traditional PS pixel selection method.
Section 3 presents the proposed MFN including 3D U-Net and CLSTM in detail, and describes the training set construction method.
Section 4 evaluates the effectiveness of MFN by using 38 Sentinel-1 single-look complex images of Tongzhou district, Beijing, China.
Section 5 discusses the performance of MFN and its advantages over traditional PS selection methods, while also indicating some potential directions for future research.
Section 6 concludes this article.
2. PS Pixel Statistical Characteristics
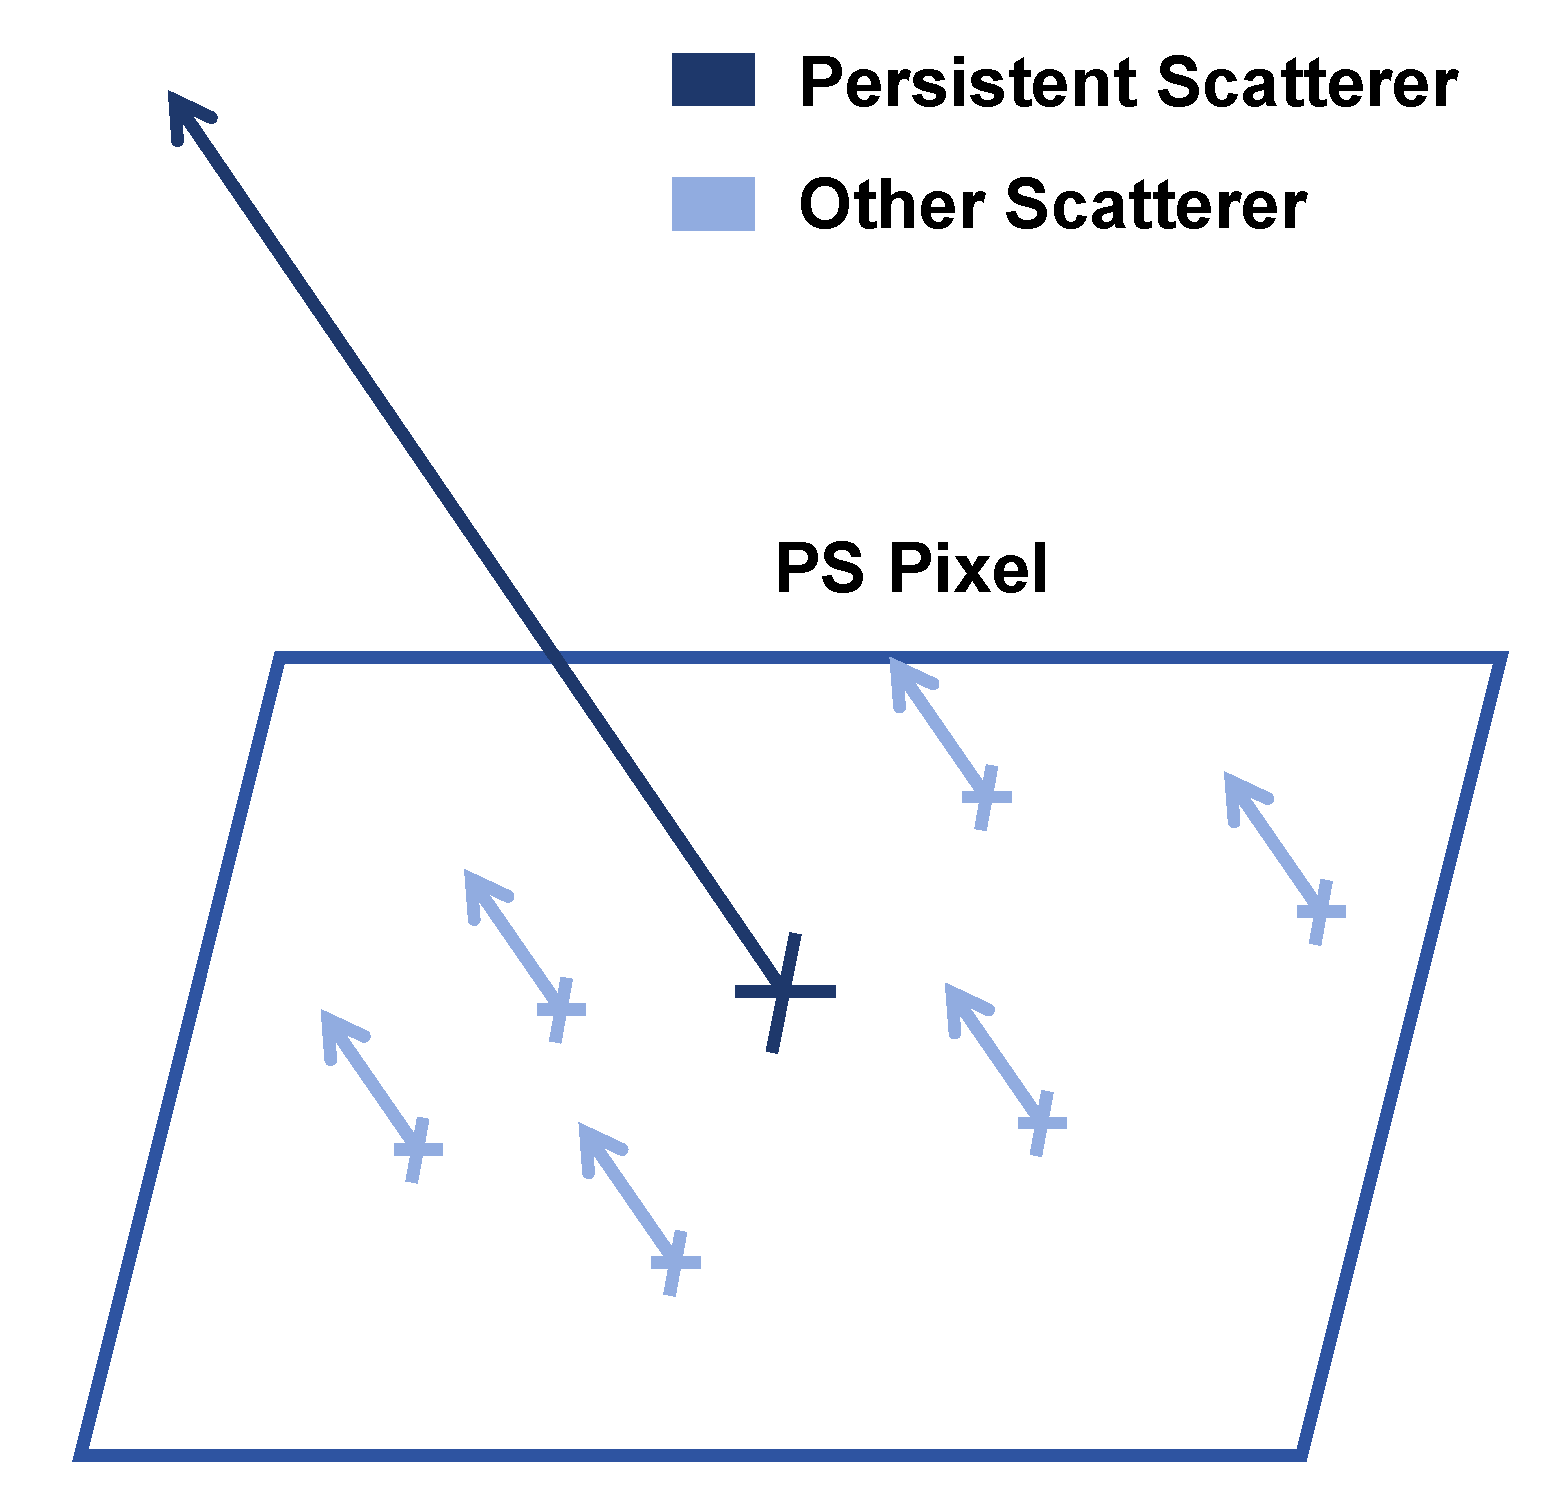
In SAR images, a resolution cell contains a large number of scatterers and the amplitude and phase of its corresponding pixel are jointly determined by all of them. Among all scatterers, targets such as building corners, railings, and exposed rocks exhibit strong scattering intensity and maintain coherence over long time intervals. These are referred to as PS, with the pixels containing them referred to as PS pixels. PS can dominate the value of the PS pixel due to its strong scattering intensity. The remaining weak scatterers only result in minimal change in amplitude and phase (see
Figure 1).
For PS pixel value, let us consider a circular complex Gaussian noise
n with variance
in both real part
and imaginary part
. Without loss of generality, assuming that the complex reflectivity
g of a pixel has
phase (i.e.,
), then the amplitude values
A obey the Rice distribution [
9]
where
is the modified Bessel function. The shape of this distribution can be determined by the signal-to-noise ratio (SNR) (i.e.,
) of the pixel, and
approximately obeys Gaussian distribution when the SNR is high enough. In SAR images, most pixels meet
and the amplitude standard deviation
approximates the noise standard deviation
[
9].
Under this fact, the dispersion of PS pixel values can be represented in the form shown in
Figure 2. Where
and
are the mean and standard deviation of amplitude of the signal, respectively, and
is the standard deviation of circular complex Gaussian noise (its
range is plotted). Assuming the PS pixel has a high SNR, which means
is small, we have phase standard deviation (PSD)
. We define
as ADI
, for a high SNR case, it can be regarded as an approximation of
[
9].
Since the mean value and the standard deviation of each pixel can be easily obtained from time-series SAR images, PS pixel selection can be achieved by comparing the ADI of the candidate pixels with a set threshold. In the high SNR region of SAR images, this method can accurately identify high-quality PS pixels. Therefore, as a simple and effective method for PS pixel selection, the ADI-based method is widely used today (either individually [
35,
36,
37] or in combination with other methods [
38,
39,
40]).
However, this method can hardly balance the quality and quantity of PS pixels. To illustrate the problem, a simulation of the correspondence between the PSD and the ADI is designed. As shown in
Figure 3a, we set 50,000 pixels in the stack of 38 SAR images. The signal is fixed to 1 and the standard deviations of both real and imaginary parts of noise are randomly selected between 0 and 0.8. It can be seen that, with the increase in PSD, the distribution of points becomes increasingly scattered and deviates from the 1:1 ratio line, which means the ADI-based method loses stability at low SNR.
If we consider PS candidates with a PSD of 0.3 or less, the points with amplitude deviation less than 0.3 will be selected (see
Figure 3b). In this case, a large number of high-quality candidates are missed (shown in the blue area). To reduce the missing alarm rate, the ADI threshold needs to be elevated. As shown in
Figure 3c, the ADI threshold is adjusted to 0.4, and in this case, previously missed pixels are almost completely recognized. However, this change introduces more false PS pixels (shown in red area) which will seriously affect the following deformation measurement.
Limited by the high SNR assumption, the false alarm probability of the ADI-based method is increasing with the PSD. Therefore, to reduce the ratio of false PS pixels, in actual processing only a low ADI threshold can be chosen, which will result in missing a large number of high-quality PS pixels.
3. The Proposed MFN-Based Method
As mentioned above, the ADI-based method utilized time-series amplitude information and determined whether a pixel is a PS pixel by a fixed threshold. However, the phase information is not employed, and the PS pixel spatial distribution characteristics are not considered throughout the processing. In addition, the subjectivity of threshold selection can affect the quality of PS pixels.
To overcome the limitations of traditional PS pixel selection methods, the MFN is constructed in this paper. The MFN combines the 3D U-Net [
30] for extracting spatial characteristics and the CLSTM [
31] for extracting temporal characteristics. This structure presents several advantages:
Firstly, MFN can achieve spatiotemporal characteristics extraction on complex data. We believe that, compared to the ADI-based method, additional consideration of phase information and spatial characteristics extraction ability will facilitate the selection of high-quality PS pixels.
Secondly, as an end-to-end network, the MFN can directly utilize time-series SAR image raw data and can automatically implement feature extraction during training. This not only simplifies the processing flow but also prevents subjective factors affect the quality of the PS pixel.
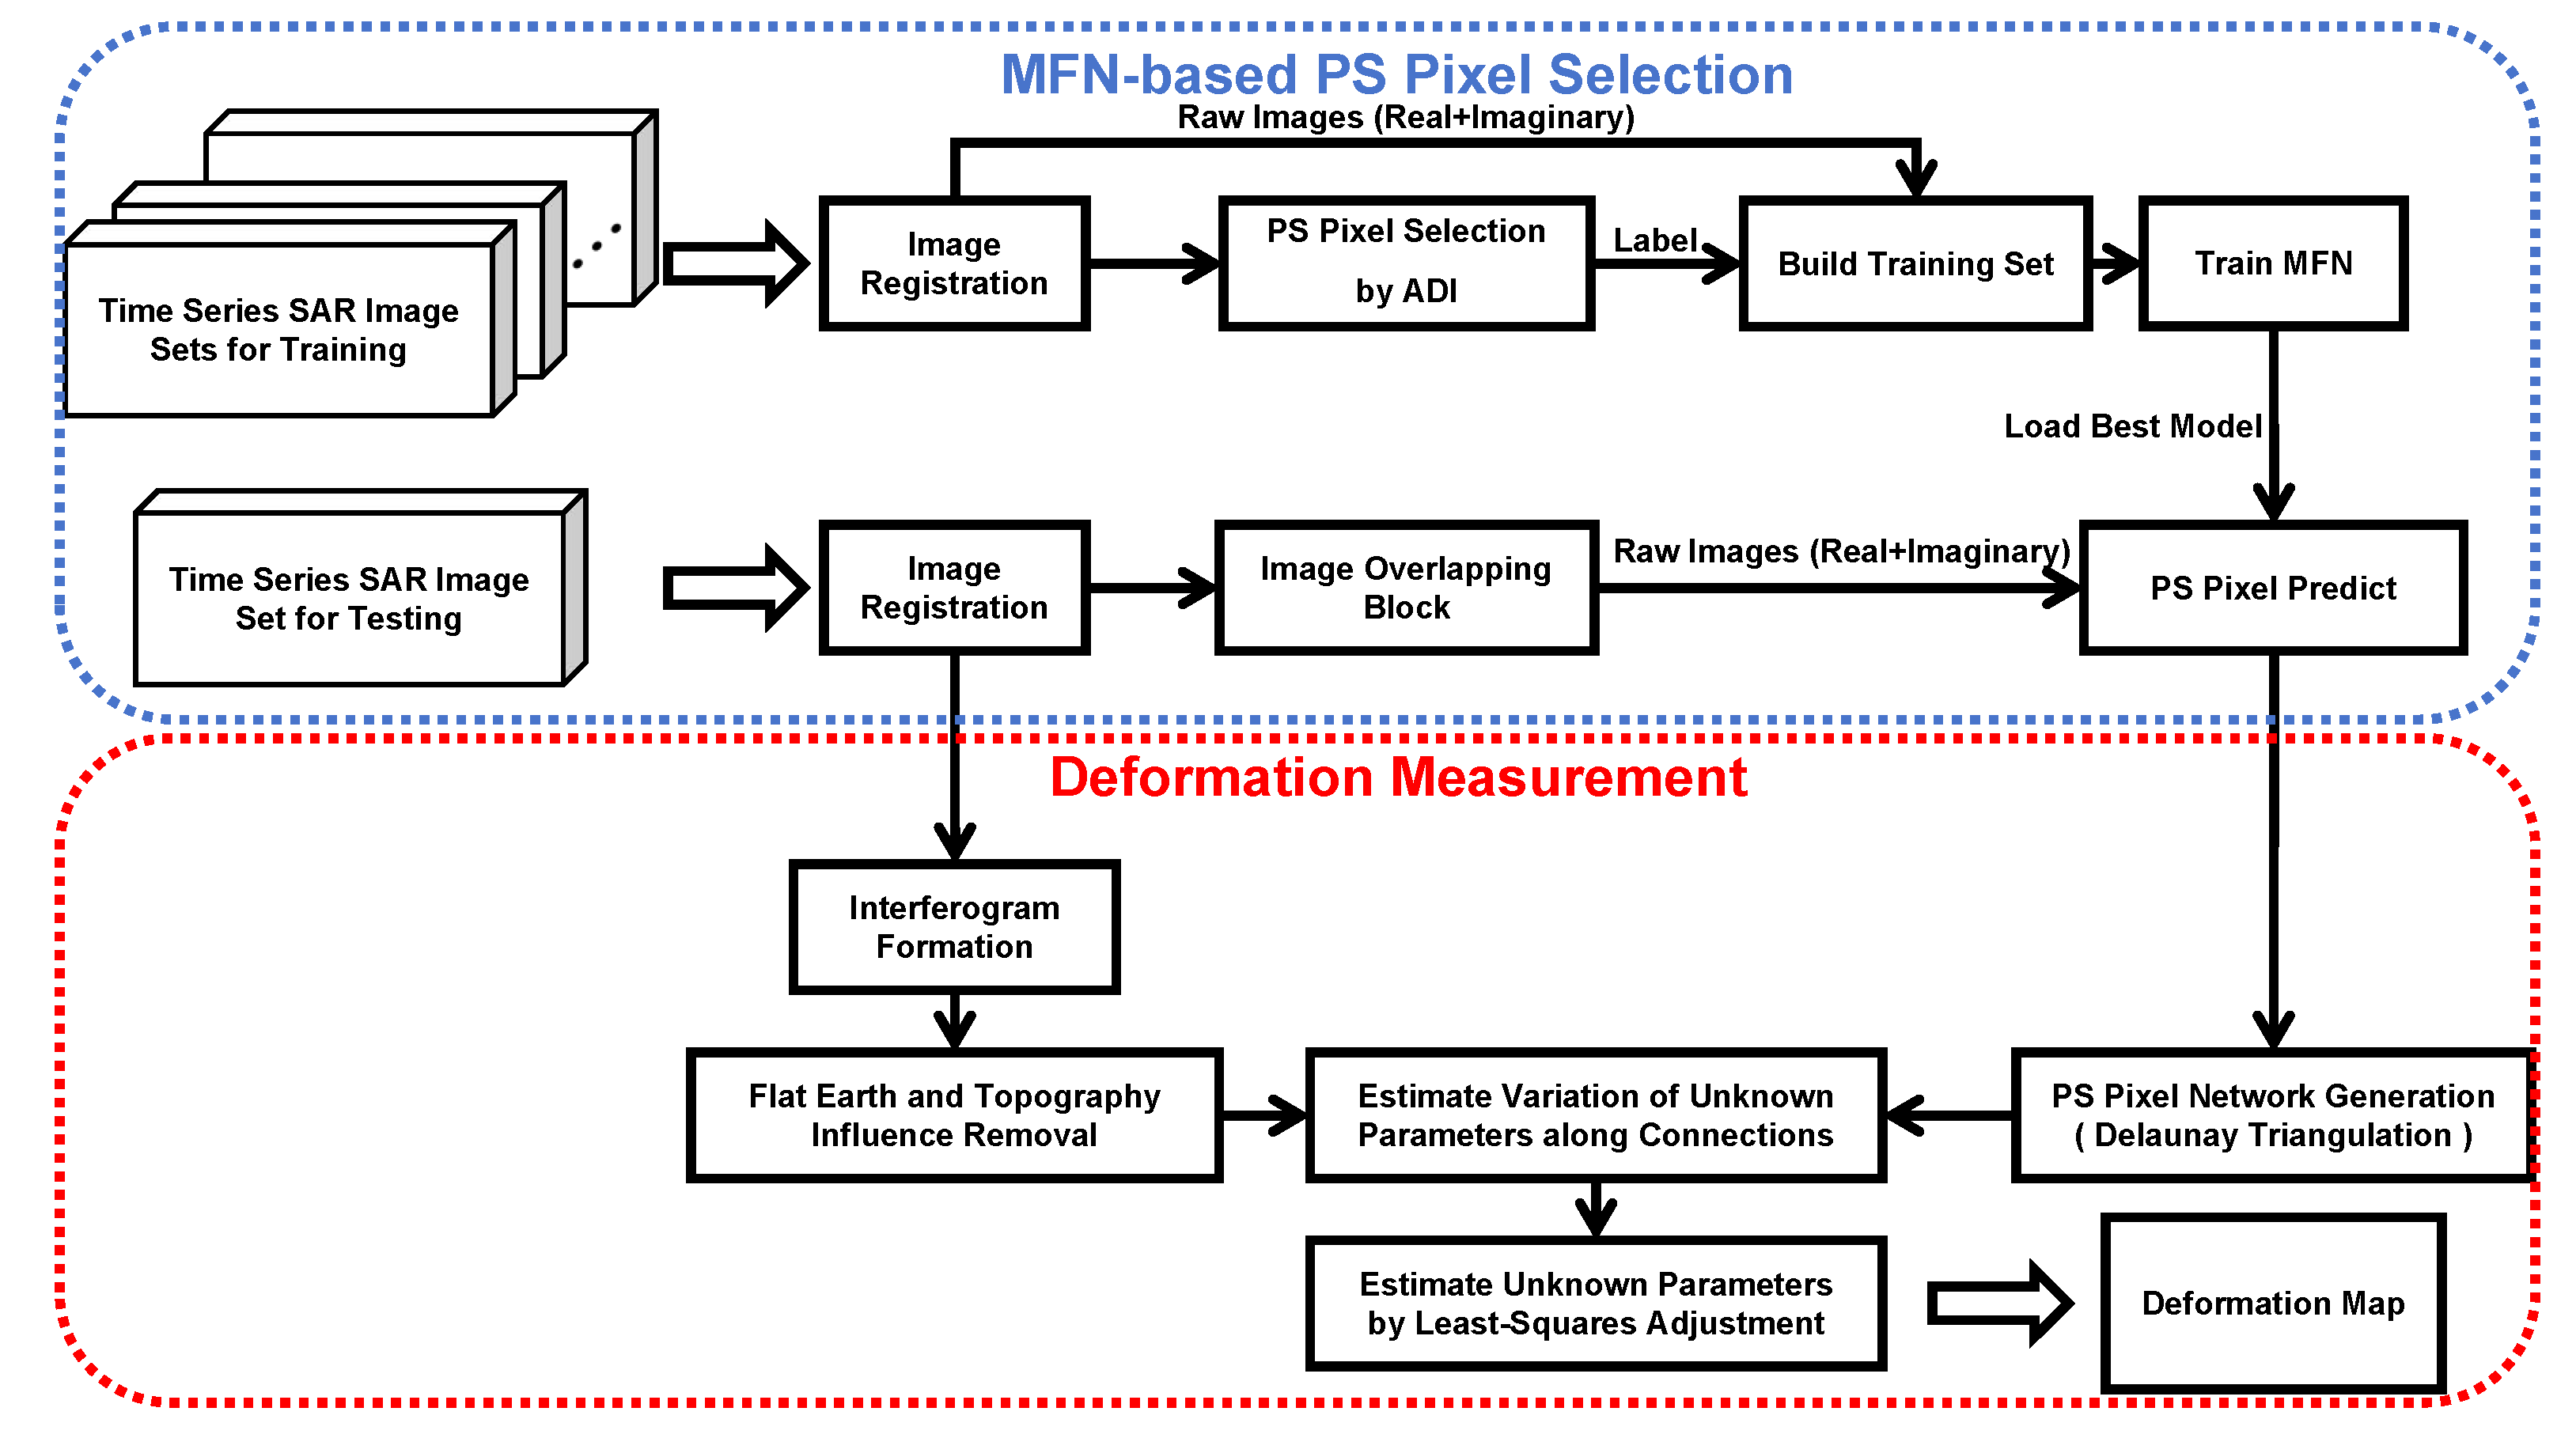
The process of the MFN-based PS-InSAR algorithm is shown in
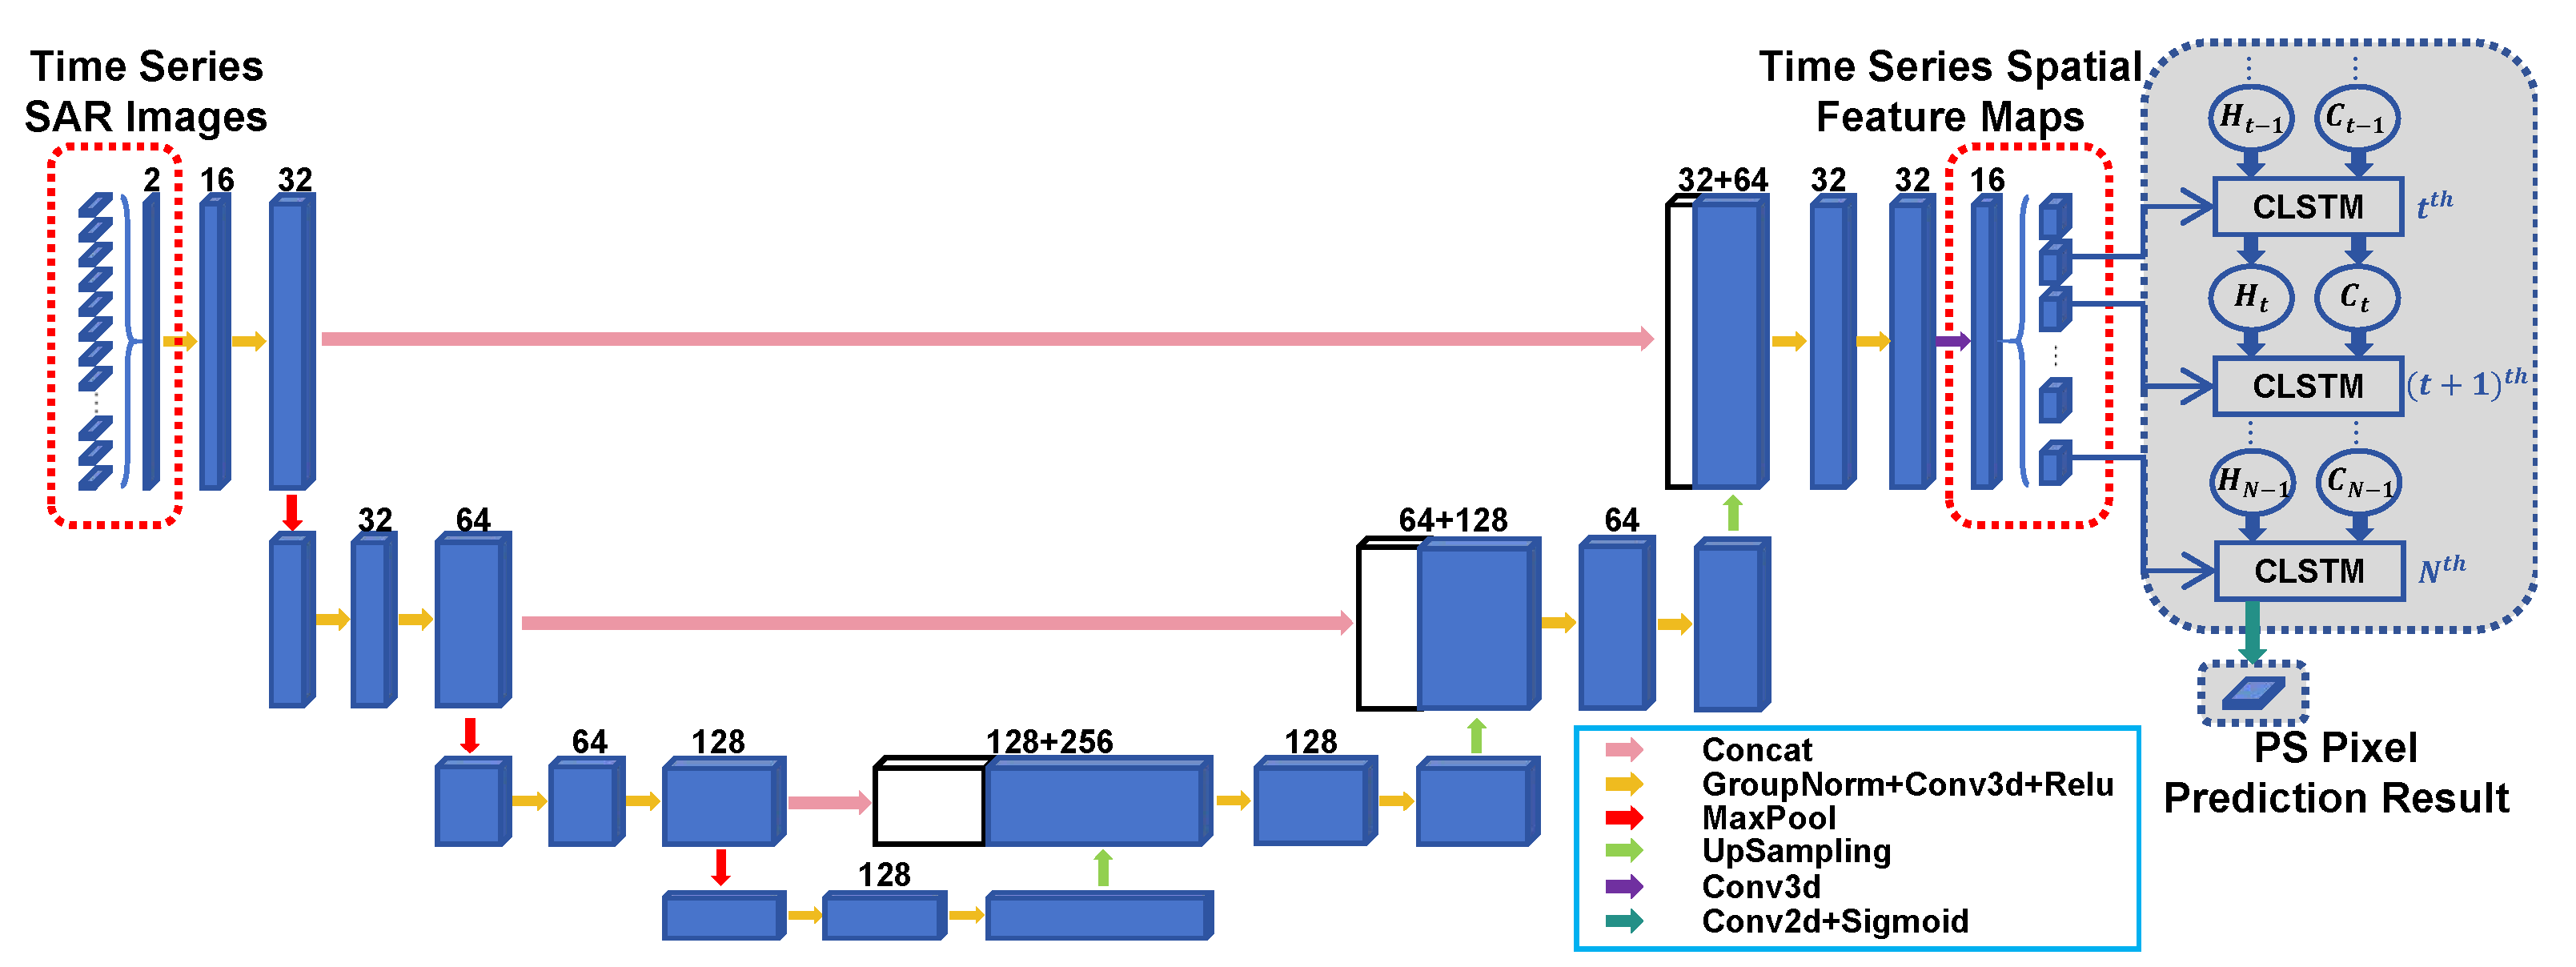
Figure 4, and the MFN structure is shown in
Figure 5. In this section, we will introduce the MFN’s structure and the construction of training datasets.
3.1. Spatial Characteristics Extraction Based on 3D U-Net
Previous studies have shown that PS pixels are always statistically inhomogeneous in their neighborhood [
20]. Therefore, in building MFN, our first consideration is to make it possible to realize the spatial characteristics extraction of the raw time-series SAR images.
3D U-Net is a CNN that was proposed and applied to biomedical volumetric image segmentation in 2016 [
30]. As an improvement based on the U-Net [
41], it consists of an encoding path and a decoding path. The encoding path follows the typical CNN structure. However, in the decoding path, the pooling operators are replaced by up-sampling operators to increase the resolution of the output. In each resolution step, features from the encoding path are combined with the upsampled output. 3D U-Net transforms traditional 2D architecture into 3D architecture, which corresponds exactly to the 3D structure of time-series SAR images (image number × length × width). In addition, the time-series SAR image feature extraction task is not a conventional computer vision task, which requires autonomous data generation and annotation, with fewer samples available for training; thus, using a network structure with a large number of parameters may cause overfitting. So here we only set four resolution steps.
The left part of
Figure 5 shows the 3D U-Net structure in the MFN. The encoding path expands the receptive field by 2 × 2 × 2 max pooling with 2 × 2 × 2 stride. Each step extracts the spatially relevant information around pixels using two 3 × 3 × 3 3D convolutions with ReLU activation function. Normalization is essential to reduce the difficulty of network training. Among the most classic methods is Batch Normalization (BN), which involves normalization along the batch dimension. However, considering that the time-series SAR image sets occupy a large memory space, the batch size during training cannot be set sufficiently large, which leads to increased errors in BN. To address this, we introduce Group Normalization (GN) [
42] before each convolution. This method divides the channel dimension into groups and performs normalization within each group. Since GN does not rely on the batch dimension, its performance is unaffected by batch size. The decoding path recovers the spatially relevant information voxel to the original scale by four steps upsampling exactly opposite to the above four steps max pooling. The data in the same resolution step of the encoding and the decoding path are directly connected in the channel dimension which allows the feature maps recovered from upsampling to contain more low-level information.
The network-required input is a voxel tile of 38 time-series SAR images with two channels (corresponding to the real and imaginary parts of SAR images). To mitigate demands on computer hardware resources [
43], we employ an overlapping blocking strategy to group the large coverage data into the network. Specifically, the time-series SAR images are divided along the length and width dimensions, with each division creating a 100 × 100 pixel block. This means a single batch of data transmitted into the network has a size of 2 × 38 × 100 × 100 (channel × image number × length × width). Each block is partitioned with a stride of 40 along both the length and width dimensions, indicating that there is some overlap between consecutive batches of data derived from the same time-series SAR image set. The average prediction of all the blocks containing each pixel determines the final probability of identifying that pixel as a PS pixel. Insufficient spatial information creates uncertainty regarding the effectiveness of the network on block edge pixels. Nevertheless, our overlapping strategy ensures that all internal pixels receive enough information in specific blocks. This ensures that the prediction results of pixels remain unaffected by the blocking operation.
3.2. Temporal Characteristics Extraction Based on CLSTM
The phase stability of a pixel responds to the overall variation of its phase value in time-series SAR images. The 3D convolutions kernel of the previously mentioned 3D U-Net has one dimension corresponding to the image number of the time-series SAR images, which means that it has a certain capability of temporal characteristics extraction. However, the structure of the 3D U-Net is not designed for time-series analysis.
CLSTM is an RNN for time-series data analysis. As a generalization of the classical LSTM structure, it creatively replaces the full connections in input-to-state and state-to-state transitions with convolutional networks [
31].This makes CLSTM capture characteristics better.
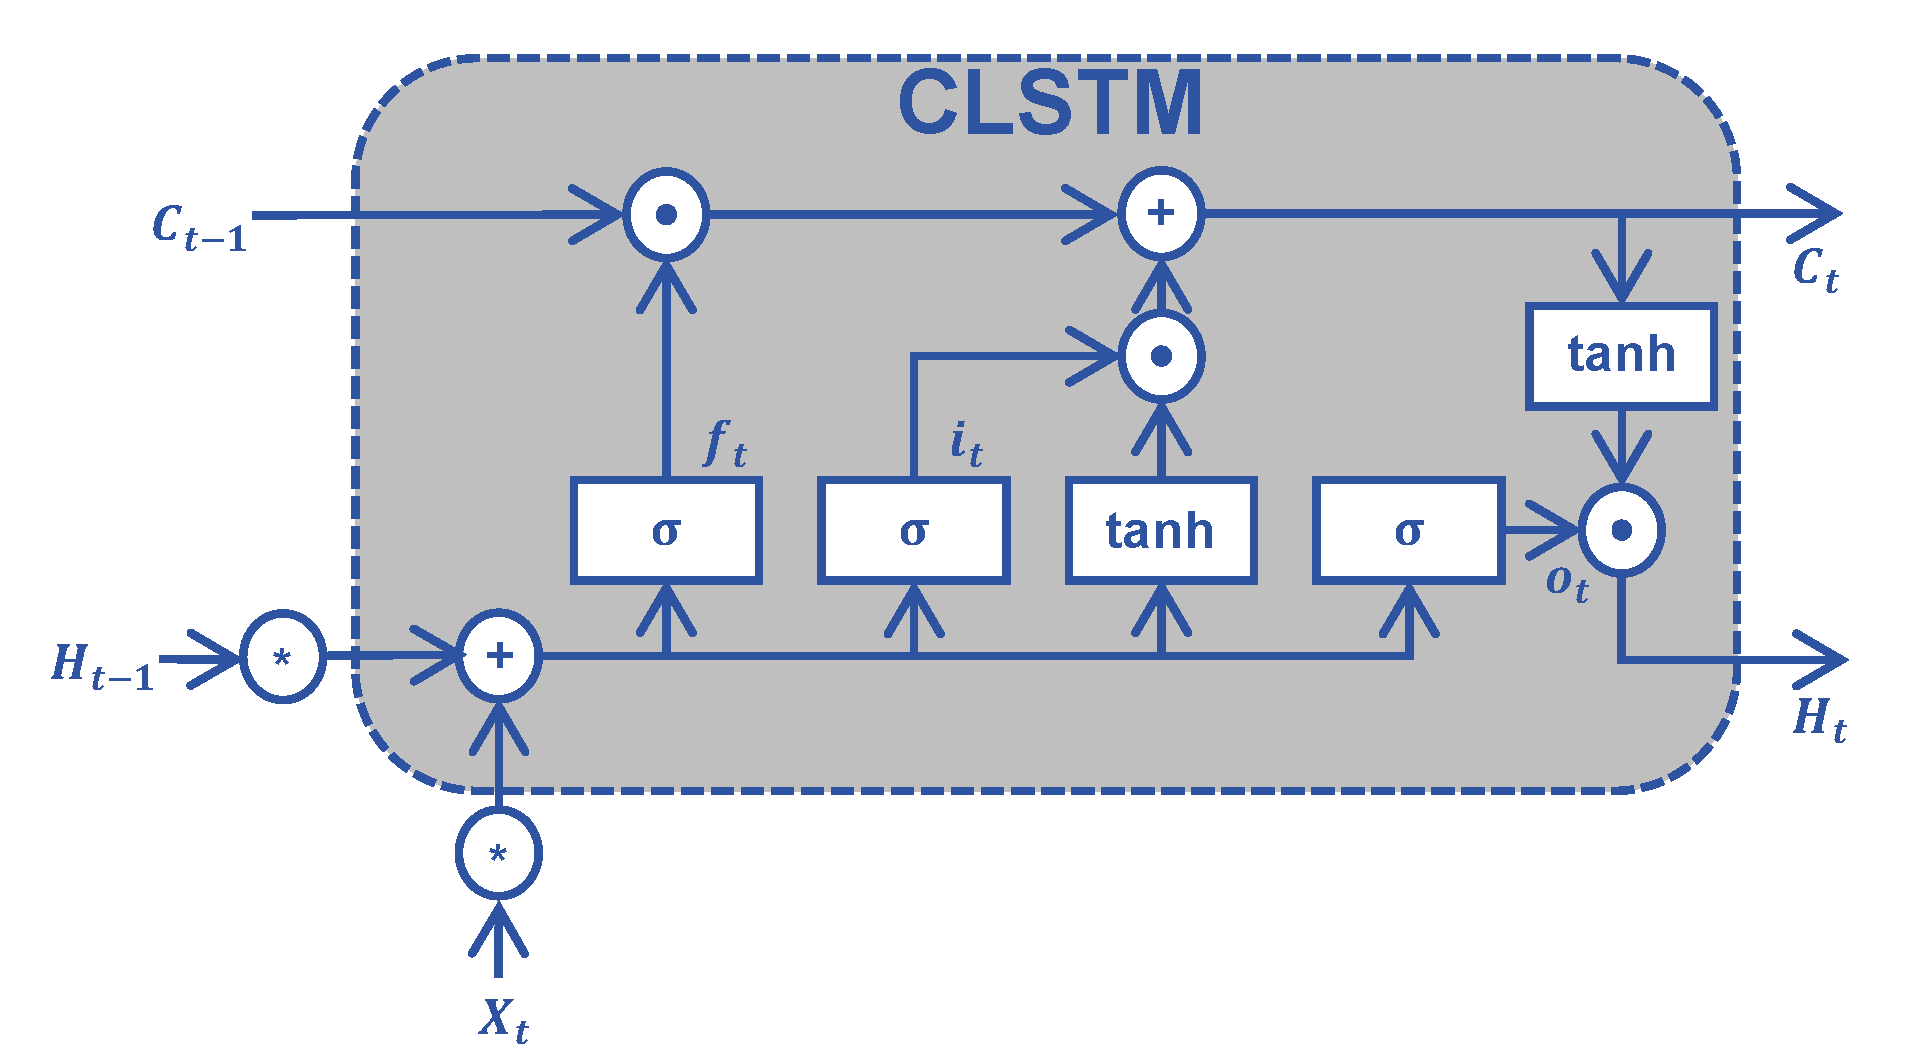
A complete CLSTM structure consists of several levels of sequentially connected CLSTM blocks. The structure of the CLSTM block corresponding to the t-th spatial feature map is shown in
Figure 6. The block updates and maintains the input cell state through the control of a series of switching units, thus maintaining a long-time memory of the input data and outputting the results of the timing analysis. The switching units are categorized into forget gates, input gates, and output gates according to their functions, and the maintenance process of the network module can be expressed as follows [
31].
where
denotes the Sigmoid activation function, ∗ denotes the convolution operation, and ⨀ denotes the Hadamard product.
,
,
are weights used to adjust the switching units
,
,
, respectively, and
is the corresponding bias. Benefiting from the existence of these gates in each block, CLSTM can overcome the long-term dependencies problem [
44] and effectively discover the relationship between the changing pattern of pixels in the time-series and whether they are PS pixels or not.
Based on the above two structures, our network can be viewed as a model that receives spatiotemporal correlation information in time-series SAR images. It accomplishes feature extraction and integration to achieve specific pixel recognition.
3.3. Loss Function
A loss function combining Dice Loss and Binary Cross-Entropy Loss (BCE Loss) is used for model training. In the majority of the study area, the number of PS pixels in the SAR images is significantly lower than the number of non-PS pixels. Dice Loss mainly considers the overall similarity of the segmentation result, and can reduce the influence of class-imbalance on network training. If there are N pixel points in the prediction matrix, where the label of the i th pixel is
(recorded as 1 if it is a PS pixel and 0 if it is not a PS pixel), the probability that the network predicts the pixel to be a PS pixel is
, the Dice Loss can be calculated as follows [
45]:
BCE Loss mainly considers the pixel-level classification accuracy and can be calculated as follows: [
46]
The loss function we use is obtained by combining the above two loss functions.
3.4. Training Dataset Construction
The training dataset we construct for our network consists of time-series SAR images from Sentinel-1A of five cities, as shown in
Table 1. The main areas of them all have a dense concentration of buildings that can provide rich PS pixels. Considering that the CNN has translation invariance, whether or not the image is segmented has no effect on the training results. Selecting areas containing more feature pixels is equivalent to expanding the training dataset. In addition to this, they contain a variety of ground object features including wood, parkland, farmland, desert, and waterbody.
The construction process of the training dataset is shown in
Figure 7. The real and imaginary parts of the registered SLC SAR images are used as the two channels to form a four-dimensional dataset. After segmentation in terms of image length, width, and number dimensions, each dataset becomes a matrix of 2 × 38 × 500 × 2000 (channel × image number × length × width).
The PS pixel label of the training dataset can be obtained by some existing PS pixel selection methods. In this paper, we adopt the widely used ADI-based method. Although, as described in
Section 2, this method can hardly balance the quality and quantity of PS pixels, the results obtained can be applied to network training as long as the accuracy of point selection is ensured by lowering the threshold (
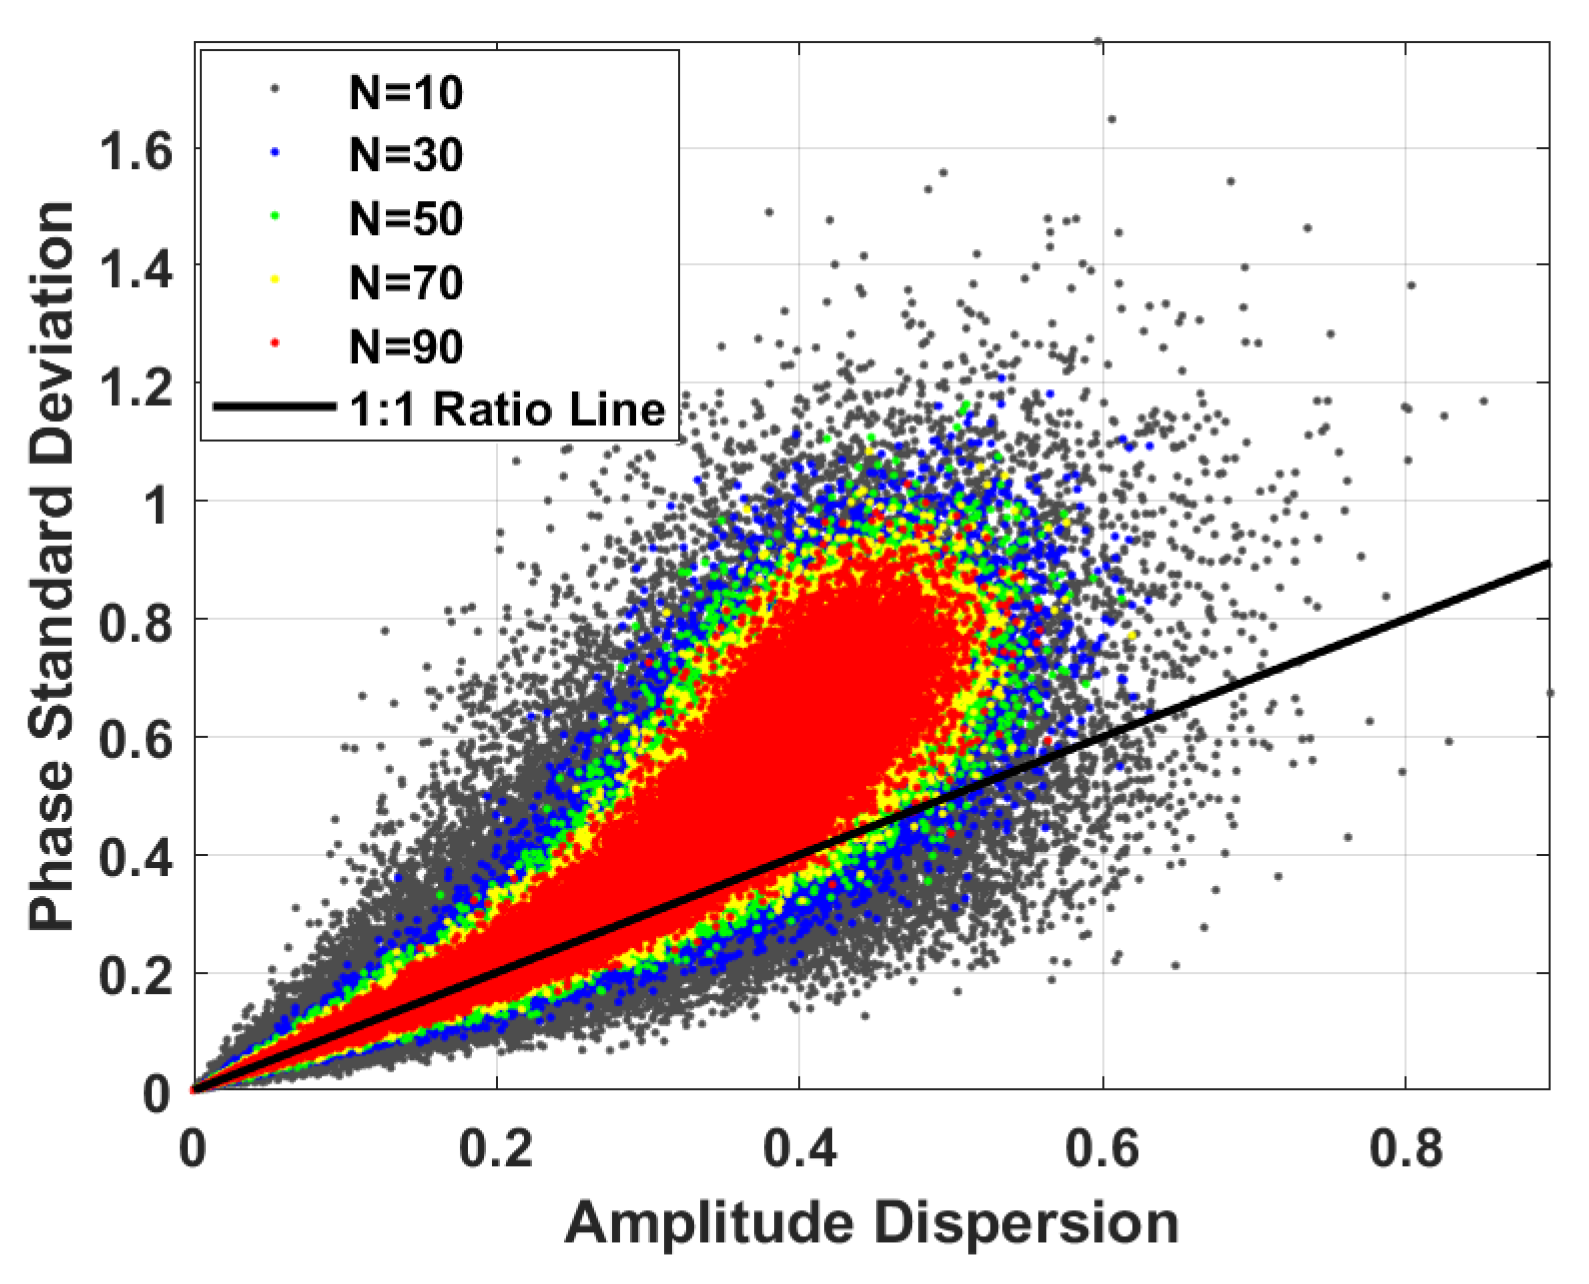
). Additionally, a sufficient number of images are included in the PS pixel selection to minimize misjudgment resulting from inadequate estimation samples.
Figure 8 demonstrates the impact of the number of images on the reliability of the ADI-based method. Increasing the number of images results in a significant decrease in the deviation of the scattering distribution.
Finally, we performed data augmentation on the dataset using image symmetry, image rotation (90°, 180°, 270°), and Gaussian blurring.
4. Experimental Datasets and Results
4.1. Validation Area and Dataset
To assess the effectiveness of our MFN-based PS-InSAR algorithm, SAR images gathered by Sentinel-1A over Tongzhou District, Beijing, China, are used to investigate the deformation in the area.
Tongzhou District is located in the southeastern region of Beijing. At the outset of the 21st century, the pace of urbanization hastened in the locality, engendering a significant rise in population density. This triggered ecological degradation and over-exploitation of groundwater, which caused a swift ground deformation in the area.
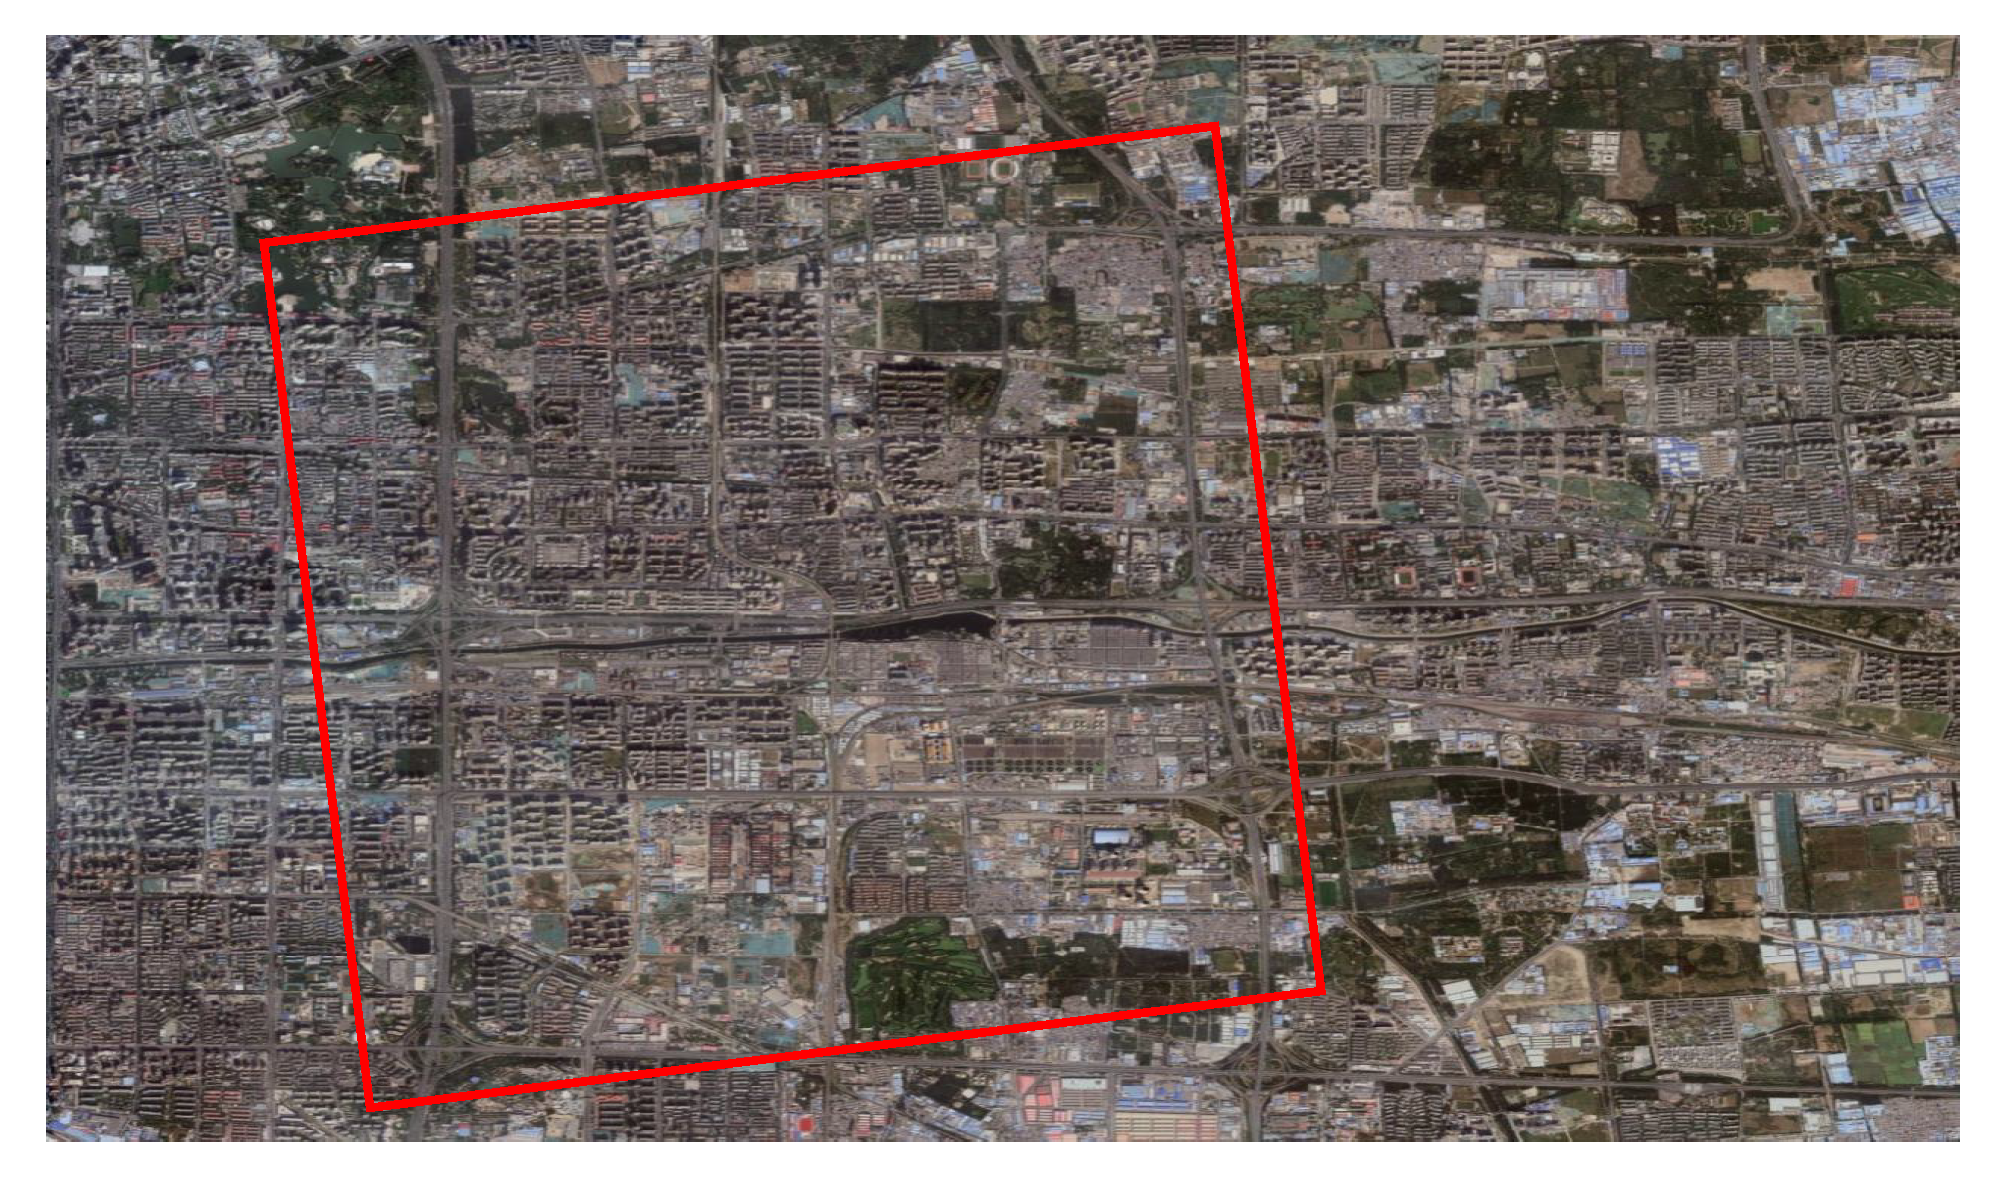
In this section, 38 single-look complex images obtained by Sentinel-1A from July 2015 to December 2017, as shown in
Table 2, are applied to the deformation analysis in Tongzhou district. We focus on the region of 116.581°E–116.644°E longitude and 39.768°N–39.852°N latitude.
Figure 9 shows the optical image of the area we concentrate on.
All SAR image data utilized in this section originate from Sentinel-1A, launched in 2014, carrying a C-band SAR instrument. Sentinel-1A has four operational modes. Among them, the Interferometric Wide Swath (IW) Mode, which is used for our data, is the main operational mode over land with a spatial resolution of 5-by-20 m.
4.2. Performance Analysis of the MFN
Being a PS pixel selection method that fully exploits the spatiotemporal information of time-series SAR images, the MFN-based method proposed in this paper can overcome the disadvantages of the traditional ADI-based method and can balance the quality and quantity of PS pixels.
To validate the above conclusion, we use the ADI-based method and the MFN-based method to select PS pixels in the study area. For the ADI-based method, the cases of 0.28 and 0.437 thresholds are selected. The effectiveness of these methods will be evaluated in terms of both PS pixel selection and deformation measurement.
4.2.1. PS Pixel Selection Effectiveness Evaluation
The number of PS pixels selected by the MFN-based method and the ADI-based method is presented in
Table 3. The ADI-based method (
) ensures the quality of PS pixels by choosing a lower threshold, but the number of PS pixels it selected is lower than the other two methods. The number of PS pixels selected by the ADI-based method (
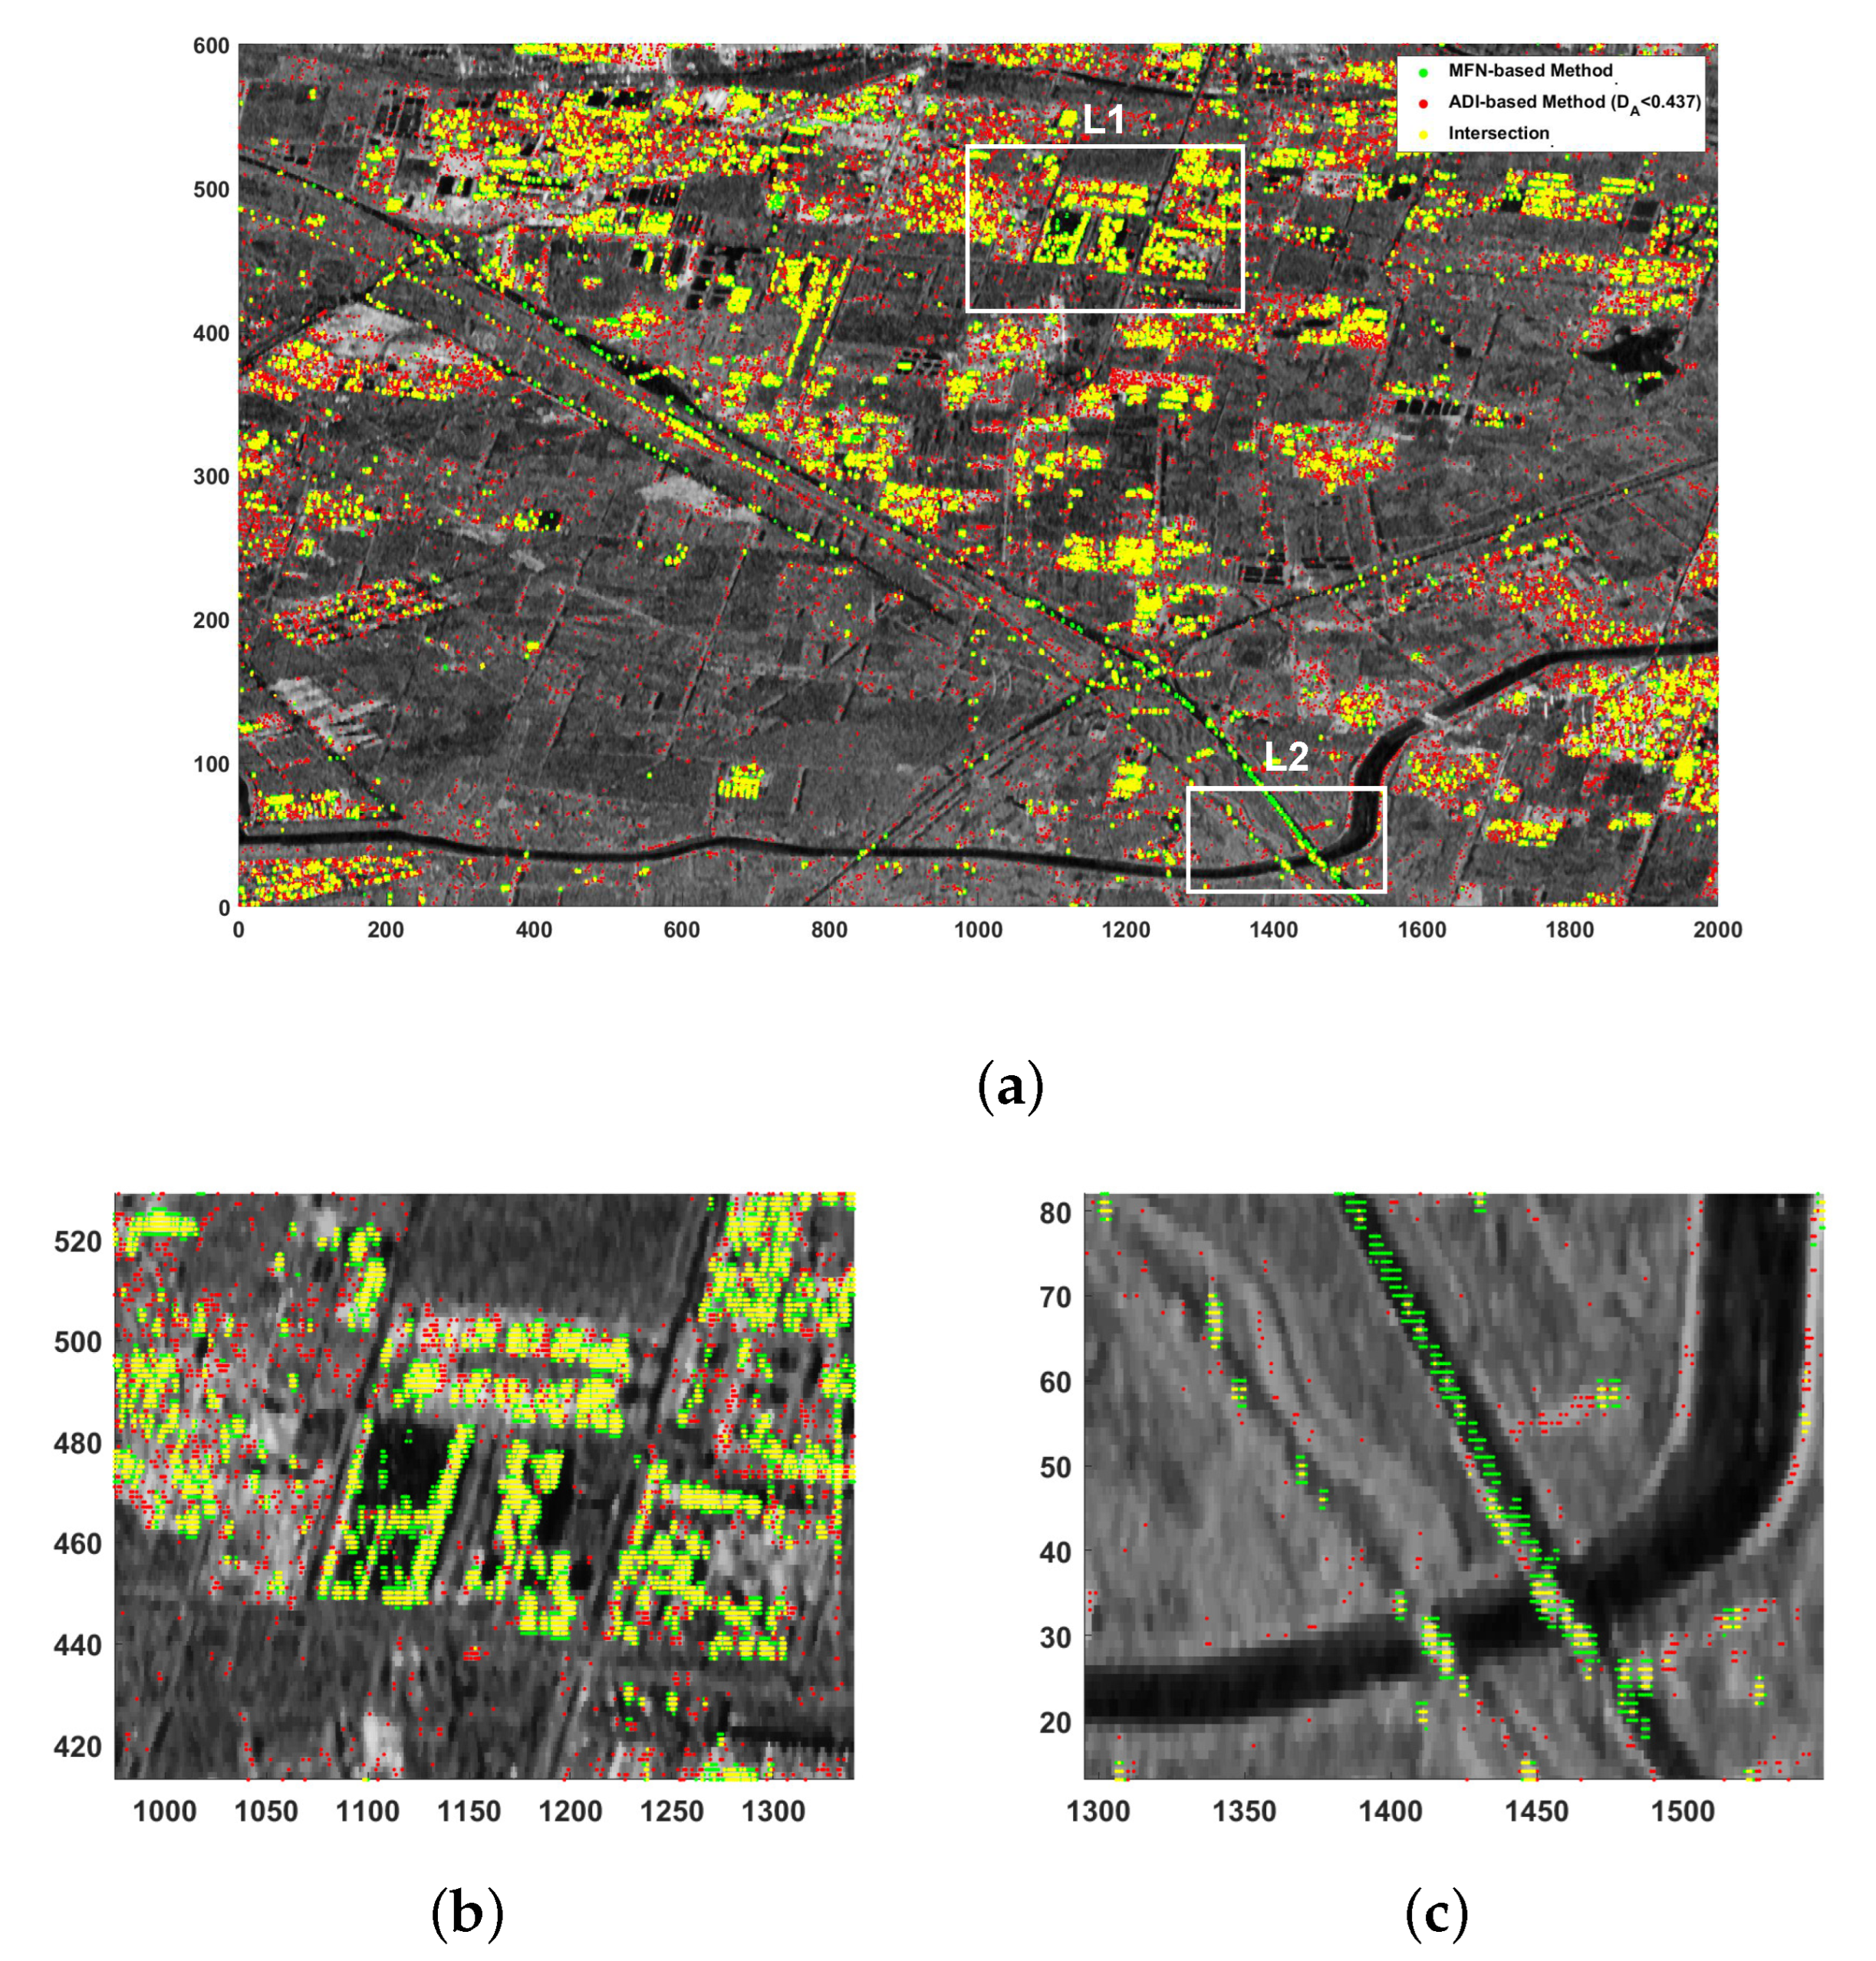
) and the MFN-based method is similar. Their PS pixel selection results are shown in
Figure 10a and it is clear that their distribution is very different.
The L1 region is situated in a densely built-up area in the upper part of the validation area. As shown in
Figure 10b, the PS candidates identified by the MFN-based method are concentrated in built-up areas. However, the results of the ADI-based method, although there is an overlap with the results of the MFN-based method, are irregularly dispersed in the low-reflectivity areas between the buildings.
The L2 region contains mainly open space. As shown in
Figure 10c, the additional predictions of the MFN-based method are mainly distributed on a road crossing the river. Although the scattering stability of the road is usually weaker than that of general man-made targets, there may be structures along the road such as guardrails and street lamps that produce more stable scattering and the proposed method exploits this information and supplements the lack of PS on the road. The results of the ADI-based method are mostly distributed on the river bank and bare ground, which suggests that the ADI-based method is more serious for false alarms at a higher threshold.
To assess the quality of selected pixels quantitatively, we introduce a metric that measures the temporal phase noise of pixels. This metric, named STIP (Similar Time-series Interferometric Pixel) index [
20], is determined by counting the number of pixels in a search window that adhere to the following conditions:
Here, N is the number of time-series SAR images, x is the pixel under test, y is a certain pixel in its neighborhood, and is the interference phase of a certain pixel in the w-th interferogram. The equation eliminates the part of the phase that is spatially correlated through a correlation operation between the two pixel values to achieve phase stability detection. Thus, a higher STIP index for a pixel indicates increased phase stability.
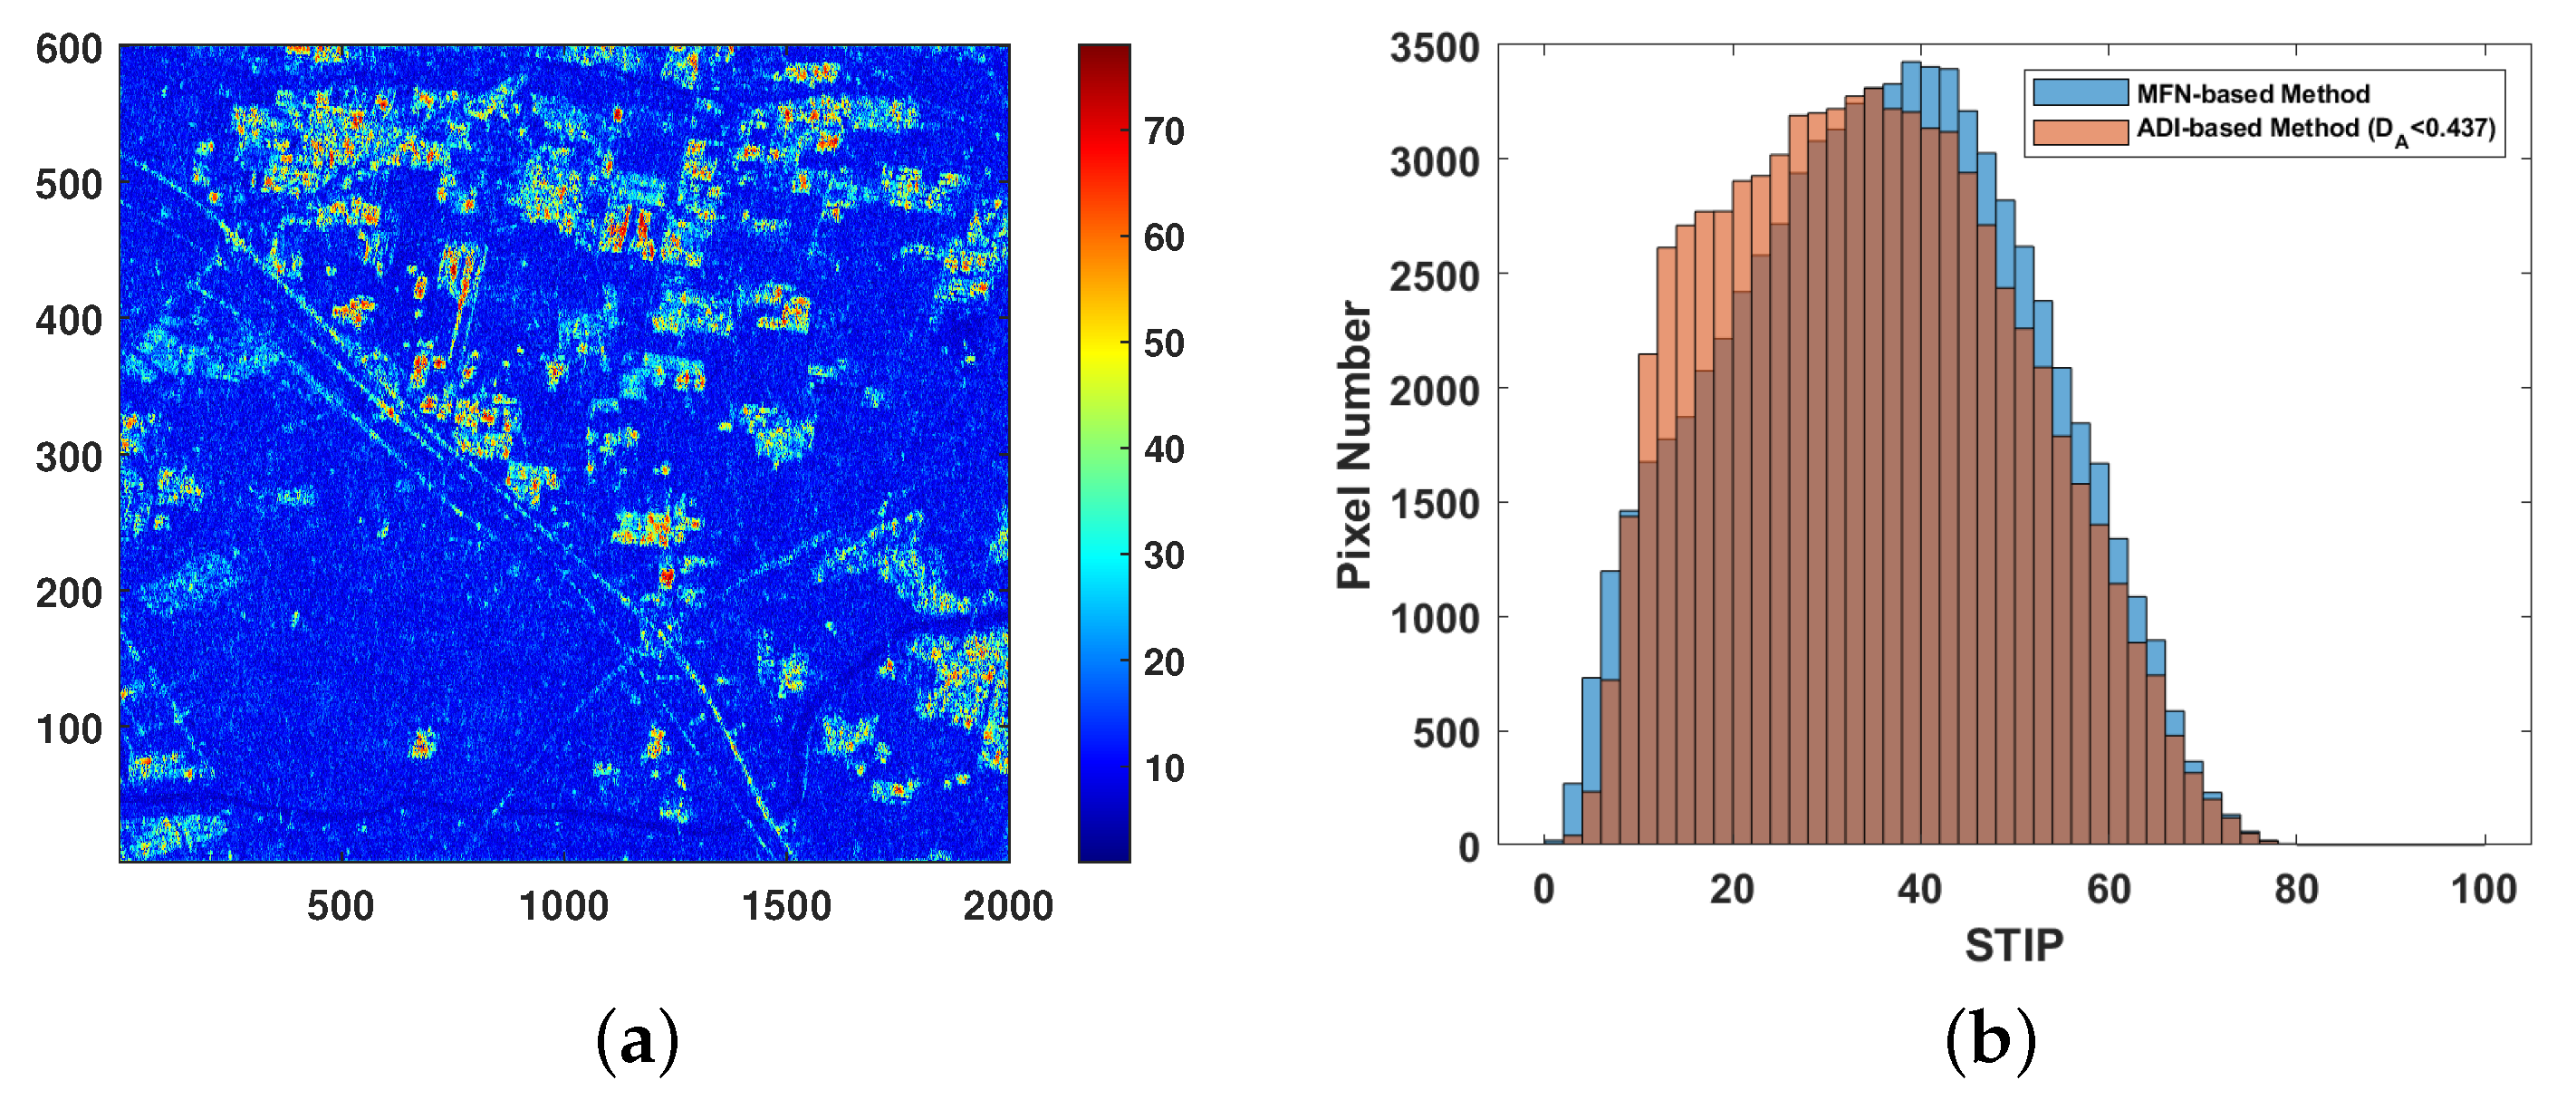
The STIP index distribution of pixels in the study area is shown in
Figure 11a. Considering that PS pixels are essentially pixels with high phase stability, the performance of PS pixel selection methods can be assessed by calculating the distribution of the STIP index of their PS pixel selection results.
Figure 11b shows the STIP index distribution for the PS pixels selected by the two previously mentioned methods. It can be seen that, as the number of selected PS pixels is nearly the same, the statistical histogram of the MFN-based method is more biased towards the high STIP index region than the ADI-based method (
). In other words, the overall STIP index of PS pixels selected by the MFN-based method takes a higher value, and it can be concluded that the MFN-based method produces a greater proportion of high-quality PS pixels.
4.2.2. Deformation Measurement Effectiveness Evaluation
The quality and quantity of PS pixel selection directly determine the effectiveness of deformation measurement. The deformation measurement process used in this section is shown in
Figure 4. Firstly, the PS pixel selection results are employed to construct a Delaunay Triangulation Network. Secondly, the maximum likelihood estimation technique is utilized to solve the deformation parameters along connections. Finally, the deformation rate measurements at the PS pixel locations are obtained through the least square method.
We present the above-mentioned three PS pixel selection results for the study area. In practice, to ensure the precision of deformation measurement, the ADI-based method typically applies a more rigorous threshold.
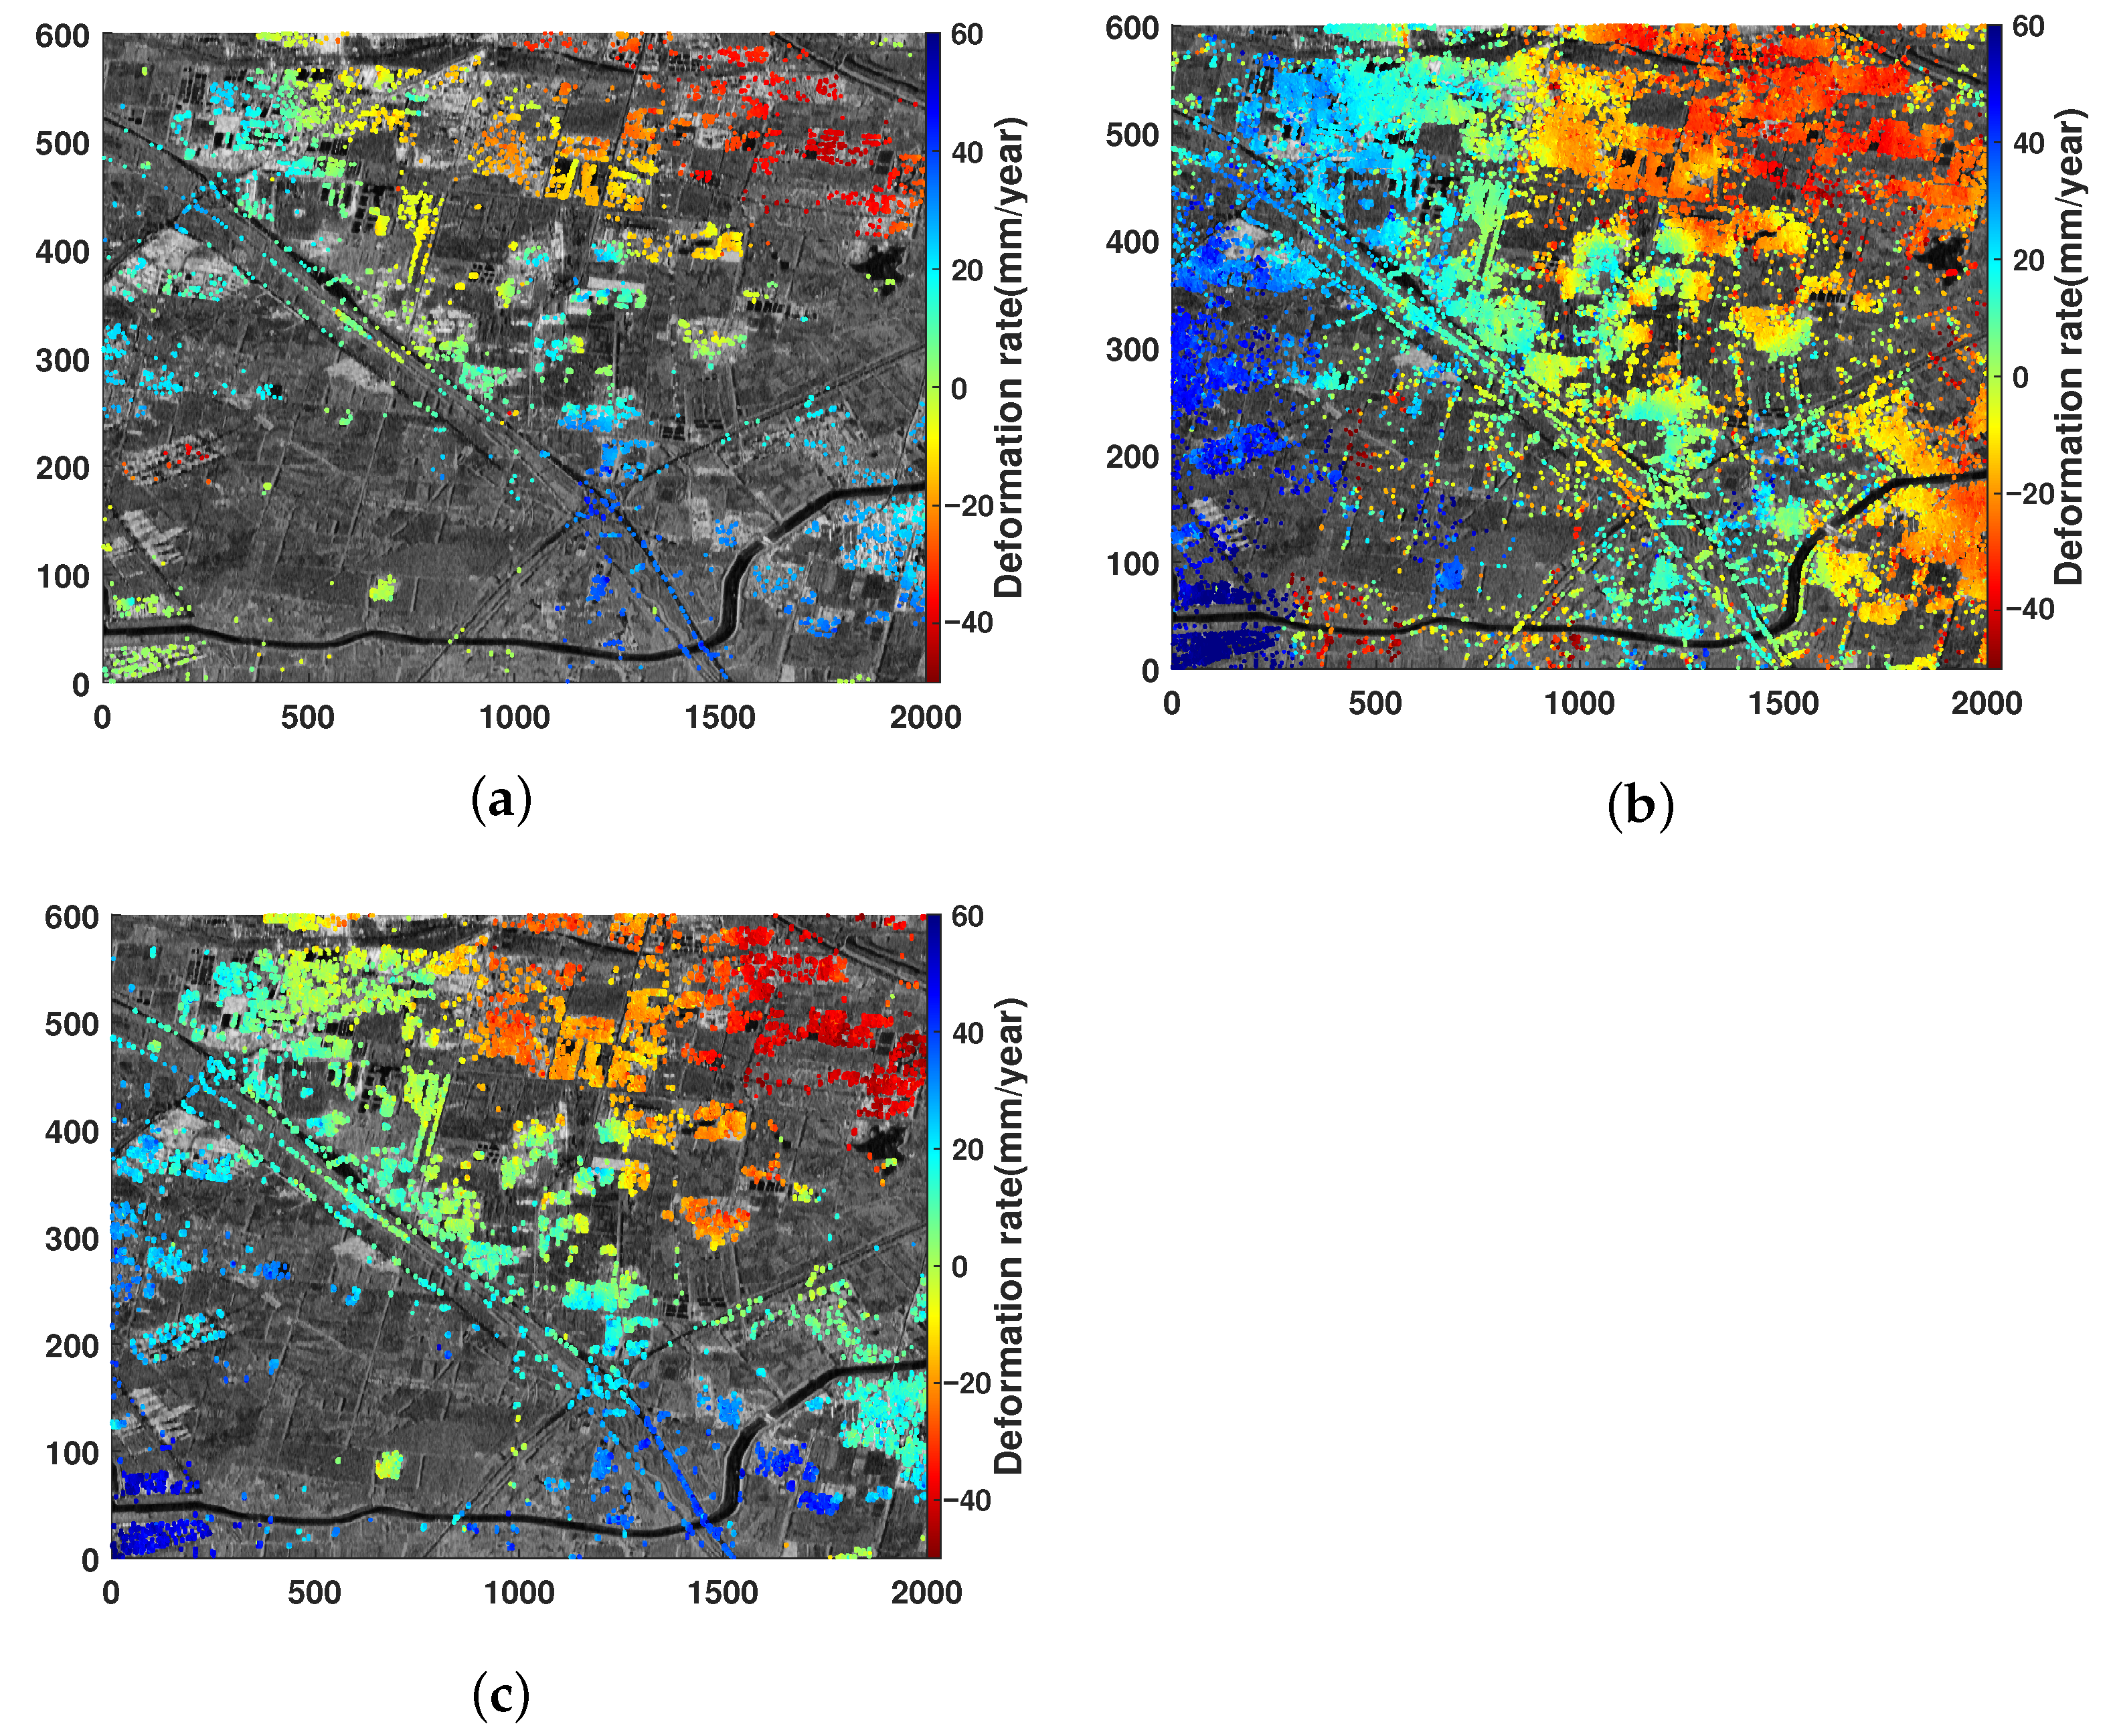
Figure 12a shows the deformation measurement result acquired by utilizing the PS pixel selection result with the ADI-based method with a threshold of 0.28. It can be seen that there is a clear deformation trend in the densely built-up area in the upper right of the study area, while there is an upward trend in the lower right. If the threshold of the ADI-based method is increased to 0.437, more PS pixels can be selected and the coverage of the measurement results will be greater (see
Figure 12b). However, due to the increase in the false alarm rate (see
Figure 3), a large number of pixels with low phase stability will be included in the triangulation network construction and the deformation analysis results will be inaccurate. As shown in
Table 3 the number of PS points selected by the MFN-based method is close to that of the ADI-based method with a threshold of 0.437. However, its deformation measurement result (see
Figure 12c) is close to the ADI-based method with a threshold of 0.28, meaning that the additional PS pixels introduced did not reduce the quality of the deformation measurement.
To quantitatively confirm the effectiveness of deformation measurements, dependable deformation measurements of the study area are required as a reference. The Stanford Method of Persistent Scatterer (StaMPS) software (version 4.1 beta) package developed by Andy Hooper et al. is used for extracting ground displacements from time-series of SAR acquisitions. Currently, the SNAP-StaMPS integrated processing is extensively employed in processing Sentinel-1 data [
47]. In this section, we use the StaMPS software package to perform a regression analysis of the deformation measurement in the study area as a reference and with the three deformation measurements mentioned above. Specifically, we extracted the common parts of all four PS pixel selection results and calculated the Person Correlation Coefficient R according to (
13).
where
n is the number of PS pixels involved in the analysis,
and
are the measured and reference values of the deformation rate, respectively.
Figure 13 shows the comparison of the deformation measurements of the above three methods with the StaMPS method. When the ADI threshold increases from 0.28 to 0.437, R decreases from 0.80421 to 0.4062, indicating that the effect of the ADI-based method is sensitive to the threshold setting. In contrast, the MFN-based method proposed in this paper improves R to 0.88593 while maintaining the quantity of PS pixels, indicating that increasing the number of high-quality PS points improves the deformation monitoring accuracy of the PS-InSAR algorithm.
4.3. Performance Analysis of Different Structures
The MFN proposed in this paper is composed of the 3D U-Net structure and the CLSTM structure. In order to elucidate the contribution of the two structures to the performance of the MFN, we utilize MFN, 3D U-Net, and CLSTM, respectively, for PS pixel selection and evaluate the quality of the results.
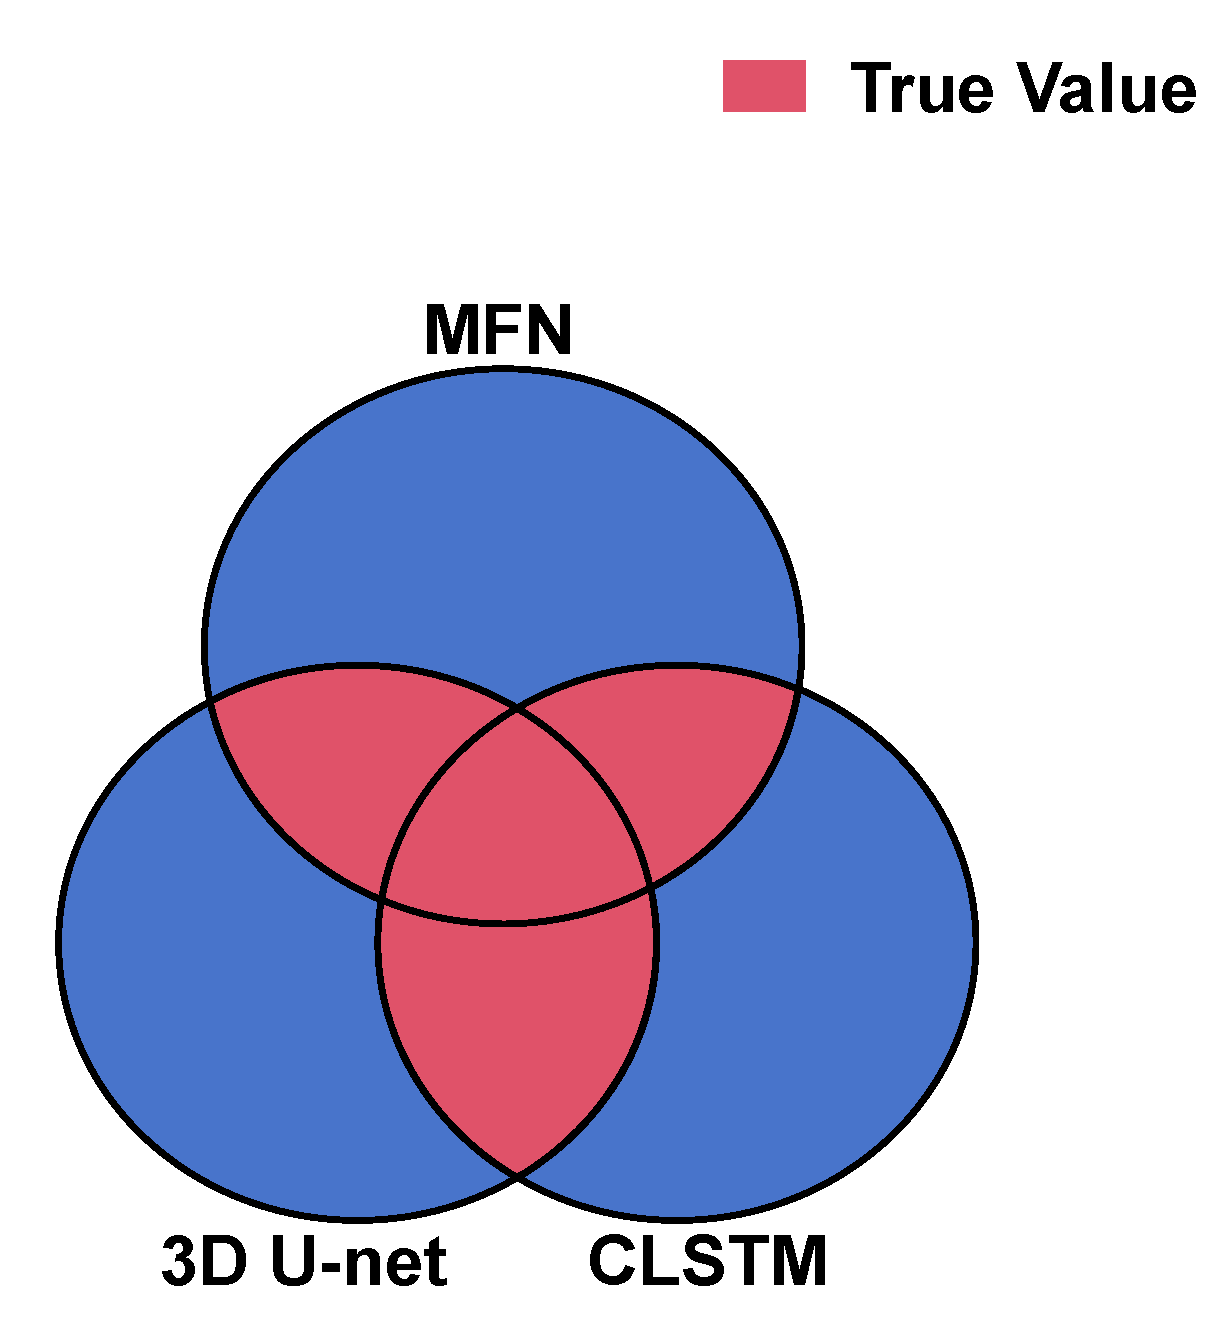
However, the definition of the PS pixel itself is fuzzy; in other words, the demarcation between high and low phase stability is not clear. This makes it difficult to obtain the so-called ‘true value’ of the PS pixel. In order to analyze the performance of the above three structures, a multi-structure voting evaluation method is employed.
PS pixels exhibit complex spatiotemporal characteristics in time-series SAR images, and the above three methods rely on some of them to distinguish between PS pixels and non-PS pixels. Considering that pixels with sufficient characteristics are more likely to be PS pixels, we regard pixels that are selected by two or more structures as true values (see
Figure 14). The PS pixel selection results for each structure are then analyzed in terms of accuracy rate
and error rate
. If the number of true values is denoted as
T, and for the PS pixel selection result of a certain structure, the number of true values contained in it is
and the number of remaining pixels is
. Then these two metrics can be expressed as follows:
reflects the ability of the structure to select PS pixels, while the
reflects the ability of the structure to reject non-PS pixels.
After analysis, a total of 70647 PS pixels in the study area are considered true values, and the effects of three structures are proposed in
Table 4. It can be seen that the MFN structure selects the greatest number of PS pixels, and
of its PS pixel selection result is higher than that of the 3D U-Net and the CLSTM. In terms of
, the MFN performs similarly to the 3D U-Net, while the CLSTM exhibits suboptimal performance.
In summary, the MFN structure has superior PS pixel selection performance compared to its two components. Among them, the 3D U-Net structure contributes the most of the overall performance. The CLSTM structure, although it is difficult to be used for PS pixel selection alone, its time-series analysis capability brings improvement to the overall performance when combined with the 3D U-Net structure.
5. Discussion
The proposed MFN integrates spatiotemporal feature extraction capabilities and can fully select high-quality PS pixels from time-series SAR images. To assess the performance of MFN, we conduct PS pixel selection and deformation measurements in the Tongzhou District, Beijing, which exhibits swift ground deformation. The experimental results indicate that the number of selected PS pixels by MFN in the study area is close to that of the ADI-based method with a threshold of 0.437. However, from the perspectives of spatial distribution rationality of selected PS pixels, STIP index distribution, or the quality of corresponding deformation measurement, the ADI-based method evidently introduces a significant number of low-quality PS pixels. This is primarily due to the increase in the false alarm rate caused by the failure of the approximation of the ADI to the PSD in the case of lower SNR. In contrast, the proposed MFN, although trained using labels provided by the ADI-based method, does not exhibit the same issue. This suggests that the MFN can learn more intrinsic features of PS pixels in time-series SAR images than the ADI feature. When the threshold is lowered to 0.28, the quality of deformation measurements corresponding to the ADI-based method improves significantly. However, the sparse distribution of PS pixels adversely affected deformation measurement quality, resulting in slightly inferior performance compared to MFN. Additionally, we analyze the contributions of different structures in the MFN. The results demonstrate that the 3D U-Net structure contributes most of the overall performance, while the CLSTM delivers additional performance gains.
5.1. Comparative Analysis of Computational Cost
However, besides the quality and quantity of selected PS pixels, computational cost is also an important criterion for evaluating a PS pixel selection method. A more efficient PS selection method contributes to enhancing the overall efficiency of deformation measurement. As a result, we selected 38 scenes of SAR images with a size of 600 × 2000 in the study area, and applied four methods (MFN, StaMPS, ADI-based method, and STIP-based method (search window size: 9 × 9)y) for PS pixel selection, with the computation time recorded in
Table 5. The CPU device we used was an AMD Ryzen 9 7945HX (Advanced Micro Devices, Santa Clara, CA, USA) and the GPU device was an NVIDIA RTX 4060 (NVIDIA Corporation, Santa Clara, CA, USA). Among these four methods, the ADI-based method is the fastest in computation, mainly due to its simpler computational steps.The MFN, while slower than the ADI-based method, but faster than the remaining two methods, proving its relative advantage in computational cost as a deep-learning-based method.
5.2. Sensitivity to the Number of Input Images
Generally, the performance of PS pixel selection methods is directly related to the number of input time-series SAR images. Incorporating more SAR images helps improve the quality of PS pixel selection. However, it is regrettable that the data sources available for processing are not always sufficient. Therefore, here we analyze the sensitivity of our proposed MFN method to the number of input images.
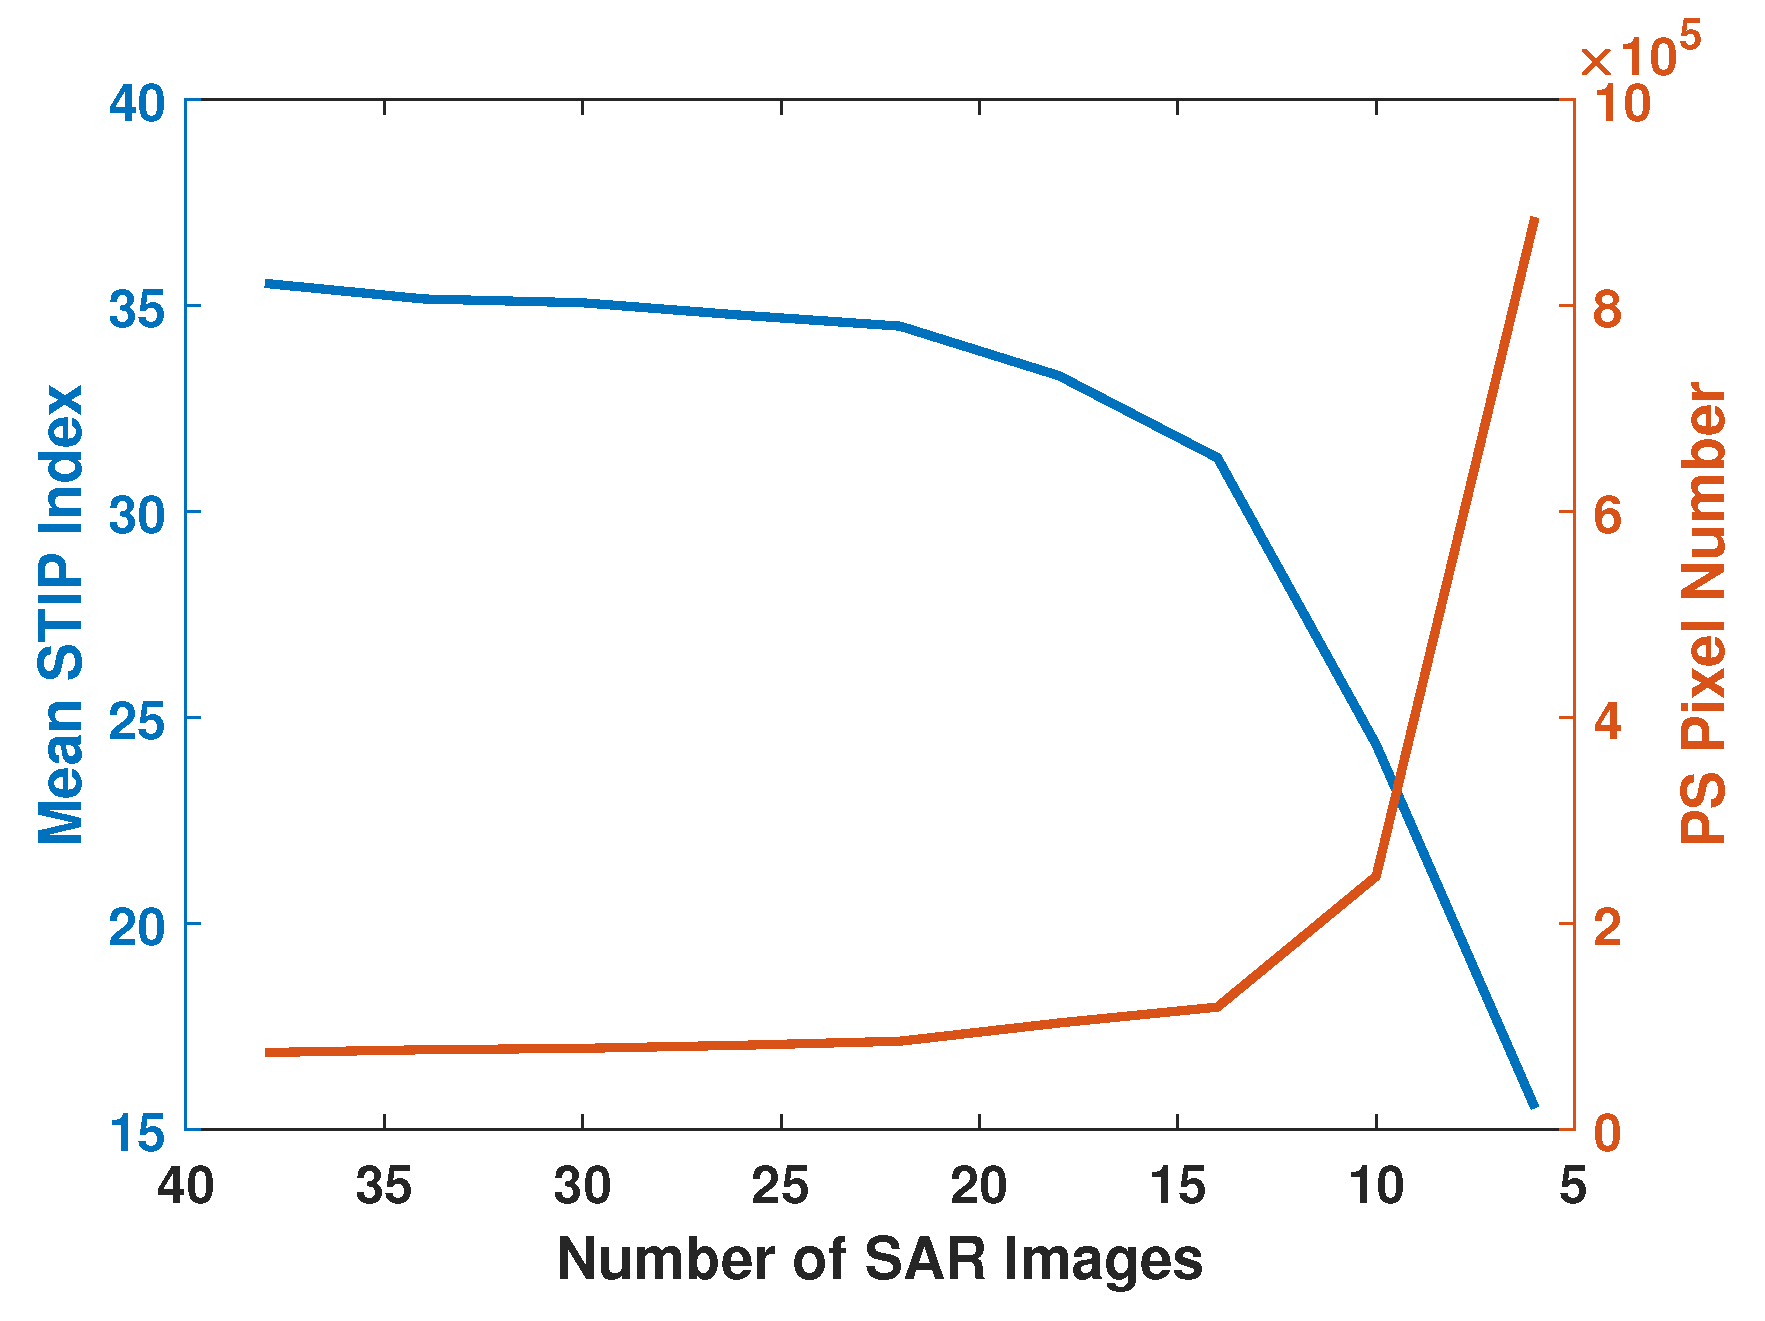
Figure 15 illustrates the variation in the mean STIP index and the number of selected PS pixels obtained by the MFN-based method as the number of input SAR images changes. It can be observed that, as the number of input SAR images decreases, the quantity of selected pixels increases, while the mean quality of these pixels declines. Notably, when the number of input SAR images exceeds 15, this change is gradual, indicating that the PS selection results of the MFN-based method are relatively insensitive to variations in number of input SAR images within this range. However, when the number of input images falls below 15, the performance of the MFN-based method deteriorates rapidly.
5.3. Performance Evaluation Across Different Scene
In
Section 4, we have demonstrated the effectiveness of the proposed method using a scene in Tongzhou District. This area is located at the urban fringe with relatively low building density. To further evaluate the general applicability of our method, we additionally select a central urban area of Beijing (116.478°E–116.541°E longitude and 39.869°N–39.953°N latitude) based on the data presented in
Table 2 for further experimentation.
Figure 16 shows the optical image of the central urban area.
Figure 17 shows the STIP index distribution in the central urban area, along with scatistical histograms of the STIP index for the selected PS pixels obtained by the StaMPS method, the ADI-based method (
), and our proposed MFN-based method. In terms of quantity, the MFN-based method selected a total of 186616 PS pixels in this area, which is comparable to the 186057 PS pixels selected by the ADI-based method (
), and both significantly exceed the 119872 PS pixels selected by the StaMPS method. In terms of quality, the mean STIP index for the PS pixels selected by the MFN-based method is 35.0851, compared to 30.3674 for the ADI-based method (
) and 33.4186 for the StaMPS method, demonstrating that our proposed MFN-based method achieves the optimal selection quality.
In summary, the experiment conducted in the central urban area further demonstrates the performance of the proposed MFN-based method, confirming its general applicability.
5.4. Challenges and Prospects for X-Band Application
The Sentinel-1A operates at C-band, featuring short spatiotemporal baselines and good global coverage, with its data free of charge. The assessment of the proposed MFN in
Section 4 is also conducted using Sentinel-1A SAR images. However, X-band sensors have particular advantages in small structure deformation measurement tasks in urban areas. Benefiting from higher resolution, PS-InSAR processing using X-band data typically provides more PS pixels than C-band PS-InSAR, thereby better revealing deformation patterns in the scene [
48]. Next, we aim to improve the proposed MFN to adapt it for X-band data processing. This is a highly challenging task. The shorter wavelength of X-band data makes the interferometric phase more sensitive to deformation and DEM errors. For systems with larger baselines spans (such as COSMO-SkyMed), the impact of DEM errors on the interferometric phase becomes even more significant. The rapid variation in the interferometric phase will make phase unwrapping more difficult. Consequently, the selection of PS pixels must guarantee not only the quality and quantity of PS pixels but also moderate phase variation between PS pixels.
5.5. Limitation and Future Work
In this paper, the MFN is constructed and applied to PS pixel selection task. While the method achieves notable performance in both the quality and quantity of selected PS pixels, it exhibits several limitations.
Firstly, as shown in
Table 5, the proposed MFN-based method requires longer computation time compared to the traditional ADI-based method. While this increased compulational demand does not present a pronounced disadvantage for analyses of limited study area, it becomes a significant constraint as the study area expands. To address this limitation, our future work will focus on adjusting the blocking size of input SAR images to achieve a balance between memory constraints and computational efficiency.
Secondly, as shown in
Figure 15, a decrease in the number of input SAR images adversely affects the performance of the MFN-based method, mainly due to insufficient temporal characteristics. To address this limitation, our future work will focus on enhancing the network’s architectures for feature extraction and utilization, thereby improving its performance under conditions of limited input images.
Finally, the proposed method is primarily focuses on C-band Sentinel-1A data. Our future work will extend the validation to X-band radar data to more comprehensively demonstrate the generalization ability of the proposed method.
6. Conclusions
Considering that the traditional ADI-based method can hardly balance the quality and quantity of PS pixels, in this paper, the MFN is constructed to fully select high-quality PS pixels from time-series SAR images. The MFN combines the 3D U-Net and the CLSTM, which can effectively achieve spatiotemporal feature extraction.
The experimental results demonstrate that, in comparison to the ADI-based method, the MFN-based method surpasses the low threshold () case in term of quality and the high threshold () case in term of quantity of PS pixel selection results. Therefore, we believe that the introduction of the MFN-based method into the PS-InSAR technique can effectively improve the coverage and accuracy of the deformation measurement.
In addition, considering that any type of scatterer exhibits certain spatiotemporal characteristics in the time-series SAR images, the MFN can be used in the task of recognizing other types of scatterers as long as suitable training is imposed.
