Article

An Evaluation of Radiation Parameterizations in a Meso-Scale Weather Prediction Model Using Satellite Flux Observations

1
BK21 Weather Extremes Education & Research Team, Department of Atmospheric Sciences, Kyungpook National University, Daegu 41566, Republic of Korea
2
Center for Atmospheric REmote sensing (CARE), Kyungpook National University, Daegu 41566, Republic of Korea
3
KNU G-LAMP Project Group, Kyungpook National University, Daegu 41566, Republic of Korea
4
Korea Institute of Atmospheric Prediction Systems (KIAPS), Seoul 07071, Republic of Korea
*
Author to whom correspondence should be addressed.
These authors contributed equally to this work.
Remote Sens. 2025, 17(19), 3312; https://doi.org/10.3390/rs17193312
Submission received: 21 August 2025 / Revised: 23 September 2025 / Accepted: 24 September 2025 / Published: 26 September 2025

Abstract

Highlights

What are the main findings?
  • RRTMG-K reduced OLR RMSE by 4.8%, OSR RMSE by 17.5%, and bias by over 40% compared to RRTMG, mainly due to improved shortwave processes.
  • RRTMG-KNN achieved similar or better accuracy than RRTMG-K, while offering 60-fold higher computational efficiency.
What is the implication of the main finding?
  • This study is the first to validate the performance of RRTMG-K using CERES satellite fluxes in a high-resolution NWP framework.
  • CERES fluxes provide a reliable benchmark for radiation scheme evaluation, and RRTMG-KNN offers a practical, fast alternative for radiative transfer.

Abstract

This study evaluates the forecast performance of four radiation parameterization schemes—the Rapid Radiative Transfer Model for General Circulation Models (RRTMG), its improved version RRTMG-K, the infrequently applied variant, RRTMG-K60x, and the neural network emulator, RRTMG-KNN, within a high-resolution numerical weather prediction (NWP) model. The evaluation uses satellite-derived observations of Outgoing Longwave Radiation (OLR) and Outgoing Shortwave Radiation (OSR) from the Clouds and the Earth’s Radiant Energy System (CERES) over the Korean Peninsula during 2020, including an extreme case study of Typhoon Haishen. Results show that RRTMG-K reduces RMSEs by 4.8% for OLR and 17.5% for OSR relative to RRTMG, primarily due to substantial bias reduction (42.3% for OLR, 60.4% for OSR). The RRTMG-KNN scheme achieves approximately 60-fold computational speedup while maintaining similar or slightly better accuracy than RRTMG-K; specifically, it reduces OLR errors by 1.2% and OSR errors by 1.6% compared to the infrequently applied RRTMG-K60x. In contrast, the infrequent application of RRTMG-K (RRTMG-K60x) slightly increases errors, underscoring the trade-off between computational efficiency and accuracy. These findings demonstrate the value of integrating advanced satellite flux observations and machine learning techniques into the evaluation and optimization of radiation schemes, providing a robust framework for improving cloud–radiation interaction representation in NWP models.

1. Introduction

The Earth’s radiative energy budget governs the exchange of energy between the Sun, atmosphere, and surface, thereby regulating climate, driving weather systems, and influencing the global water cycle. Accurately quantifying this budget is essential for improving our understanding of the Earth system and for enhancing the performance of climate and numerical weather prediction (NWP) models. Because the radiative budget integrates processes across multiple spatial and temporal scales, satellite observations provide a uniquely consistent and global perspective for its measurement.
Since the early 1960s, a succession of satellite missions equipped with visible–infrared broadband radiometers has been launched to monitor the Earth’s radiation budget and its variability. The Television Infrared Observation Satellite (TIROS) and Nimbus series (1961–1972) carried the Medium Resolution Infrared Radiometer (MRIR), which measured two broadband channels (0.2–4.0 μm and 5–30 μm) at ~55 km horizontal resolution. These pioneering missions provided the first space based broadband radiance measurements, paving the way for the Earth Radiation Budget Experiment (ERBE), operational since 1985, which used three scanning radiometers (0.2–5 μm, 0.2–50 μm, and 5–50 μm) to significantly advance knowledge of the global radiation budget, general circulation patterns, cloud radiative forcing, and reanalysis evaluation [1,2,3,4,5,6].
Building on ERBE, the Clouds and the Earth’s Radiant Energy System (CERES) instruments have been operating on Tropical Rainfall Measuring Mission (TRMM), Terra, Aqua, Suomi National Polar-orbiting Partnership (NPP), and National Oceanic and Atmospheric Administration-20 (NOAA-20) since 1997, measuring broadband shortwave (0.3–5 μm) and total (0.3–200 μm) fluxes at ~20 km horizontal resolution [7,8,9,10,11,12]. CERES has become the global reference standard for radiation budget measurements due to its high radiometric accuracy, comprehensive validation record, well-documented uncertainty characterization, and consistent multi decade dataset.
In 2004, the Geostationary Earth Radiation Budget (GERB) instrument was launched aboard Meteosat satellites, becoming the first geostationary broadband radiometer. GERB measures two broadband channels (0.32–4 μm and 0.32–100 μm) and offers high temporal resolution observations of the diurnal cycle of shortwave (SW) and longwave (LW) radiative fluxes [13,14,15]. However, its spatial coverage is restricted to Europe, Africa, and West Asia. Geostationary satellites with multiple narrowband channels, such as the Advanced Meteorological Imager (AMI) and Advanced Himawari Imager (AHI), can derive OLR and OSR, but their accuracy is generally lower than broadband measurements. For example, over East Asia, AMI/AHI retrievals exhibit Root Mean Square Errors (RMSEs) of 7.52–12.01 W m−2 for OLR and 26.10–52.12 W m−2 for OSR compared to CERES [16,17,18]. Given CERES’s superior accuracy, consistent coverage of the Korean Peninsula, and extensive use in prior validation studies, it is adopted here as the primary observational reference.
Broadband flux measurements are not only central to climate monitoring but also to the evaluation of radiation parameterizations in general circulation models (GCMs) and NWP models, which rely on theoretical approximations to represent radiative transfer processes [19,20,21,22]. Among the variables produced from broadband flux measurements—LW/SW upward fluxes at the top of the atmosphere (TOA) and upward/downward fluxes at the surface—the upward longwave (OLR) and shortwave (OSR) fluxes at the TOA are the most direct and widely used for model evaluation. Eitzen et al. (2017) [23] reported RMSEs of 3.4–3.9 W m−2 for OLR and 14.3–15.0 W m−2 for OSR in HadGEM2 A versus CERES, and further analyzed differences by cloud type using cloud optical depth and cloud top pressure from the ISCCP (International Satellite Cloud Climatology Project) classification [24]. Loeb et al. (2020) [25] found that Coupled Model Intercomparison Project Phase 6 (CMIP6) models exhibit a global monthly OSR correlation of only 0.33 ± 0.098 with CERES for 2000–2017, while Li et al. (2023) [26] showed that land biases (OLR: 3.9 W m−2, OSR: 4.3 W m−2) exceed ocean biases (OLR: 3.1 W m−2, OSR: 3.4 W m−2). Yuan et al. (2024) [27] demonstrated that the Beijing Climate Center RADiative transfer model (BCC-RAD) scheme improved global mean cloud cover by ~3% and clear sky OLR by ~5.6 W m−2 relative to the Rapid Radiative Transfer Model for GCM (RRTMG) [19,20]. However, these evaluations largely focus on global climatologies rather than mesoscale, time-specific forecasts.
Satellite-based flux observations have rarely been utilized to evaluate numerical weather prediction (NWP) models with mesoscale and hourly resolutions. Atmospheric radiation processes are determined by interactions between atmospheric gases (i.e., CO2, water vapor, ozone, etc.), aerosols, clouds, and land surface processes [28,29,30,31,32], and the OLR and OSR in mesoscale NWP models are largely controlled by clouds. In the presence of clouds, the OLR tends to decrease because LW radiation is released from the cloud top at lower temperatures, whereas the OSR increases due to cloud reflection. For this reason, the OLR has frequently been used as an indicator of deep convective clouds [33,34]. On the other hand, the OSR tends to be less utilized than the OLR because it is only available during the day, and its absolute value varies with the solar zenith angle. When satellite flux observations are used to evaluate mesoscale NWP models in relation to the exact location and time, this corresponds to cloud-radiation verification at convection-permitting scales.
RRTMG is among the most widely used radiation schemes in both GCM and NWP applications. Its Korea Institute of Atmospheric Prediction Systems (KIAPS) modified version, RRTMG-K [21], reduces computational cost by decreasing Monte Carlo independent column approximation (MCICA) sampling and improves accuracy via revisions to the SW two-stream approximations, lowering layer mean flux errors by 39% compared to the 16-stream Discrete Ordinates Radiative Transfer (DISORT) benchmark [35,36]. However, RRTMG-K has yet to be evaluated against satellite-based flux observations.
This study also considers two additional configurations: RRTMG-K60x, where radiation calculations are performed only once every 60 model time steps, and RRTMG-KNN, a neural network emulator of RRTMG-K that is approximately 60× faster. The infrequent use of a radiation scheme has long been employed in operational NWP to reduce computational burden, but excessive infrequency can amplify numerical errors through interactions with other physical processes [37,38]. Meanwhile, RRTMG-KNN has been shown in prior studies to reproduce RRTMG-K with high efficiency and stability, exhibiting skillful forecasts of surface temperature and precipitation [39,40]. However, despite these advances [41,42,43,44,45], its performance has not yet been rigorously validated against satellite-based flux observations.
This research leverages archived outputs from pre-existing NWP simulations using RRTMG, RRTMG-K, RRTMG-K60x, and RRTMG-KNN. The archived simulations were limited to the period 2016–2020, among which the year 2020 was selected due to its widespread use in prior studies and consistency with established verification frameworks. These archived datasets contain only radiative flux variables (OLR and OSR) and lack collocated cloud microphysical or classification data, making explicit separation into cloudy and clear-sky conditions infeasible. Indirect classification using reanalysis cloud data (e.g., European Centre for Medium-Range Weather Forecasts Reanalysis version 5 (ERA5)) was tested but showed substantial mismatches with CERES radiative patterns at the model grid scale—likely due to spatial smoothing and simplified microphysics—rendering this approach unreliable. Recognizing this inherent constraint, the present study focuses on maximizing the available radiative information to provide a collocated, observation-based evaluation—where model outputs and CERES measurements are matched in both time and horizontal grid location—of radiation schemes.
By quantifying both the accuracy and computational trade-offs of four radiation schemes using collocated CERES OLR/OSR, this study develops an observation-driven framework for evaluating and improving radiation parameterizations in mesoscale NWP models. The findings are expected to guide both the operational selection of radiation schemes and the development of next-generation parameterizations that better capture cloud–radiation interactions at high spatial and temporal resolutions, with applicability extending beyond the Korean Peninsula to other regions requiring high-fidelity radiation modeling.

2. Data and Methods

2.1. CERES Observations

This study used top-of-atmosphere Outgoing Longwave Radiation (OLR) and Outgoing Shortwave Radiation (OSR) data from the Clouds and the Earth’s Radiant Energy System (CERES) Single-Scanner Footprint (SSF) Level 2, Edition 4A data [7,46] over the Korean Peninsula for the entire year 2020. The SSF Level 2 data was selected because it provides the highest spatial resolution currently available from CERES, with a nominal footprint diameter of approximately 20 km, and retains individual footprint-level observations rather than spatially or temporally averaged fields as in Level 3 data. The ability to preserve fine-scale spatial detail is particularly important in high-resolution numerical weather prediction (NWP) evaluation, where mismatches between observation and model scales can significantly influence verification statistics.
Observations were obtained from CERES SSF Level 2, Edition 4A (Terra, descending ~10:30 LST; Aqua, ascending ~13:30 LST) and Edition 1B (NOAA-20 FM6, ascending ~13:25 LST) datasets. These sun-synchronous, polar-orbiting satellites provide two daily overpasses at mid-latitudes, ensuring morning and afternoon coverage of the Korean Peninsula. From the measured broadband radiances, OLR (day/night) and OSR (daytime only) fluxes were derived based on thermal emission and reflected solar radiation.

2.2. NWP Model and Radiation Parameterization Schemes

The numerical simulations were performed using the Korea Local Analysis and Prediction System (KLAPS), the operational short-range forecasting suite of the Korea Meteorological Administration [47], based on the Advanced Research Weather Research and Forecasting model (WRF-ARW; [48]). Initial and lateral boundary conditions were provided by ERA5 reanalysis [49] at 0.25° × 0.25° horizontal resolution every 3 h. The model domain consisted of 234 × 282 grid points with 5 km spacing covering the Korean Peninsula and included 40 vertical levels extending from the surface to 50 hPa.
Four radiation parameterization schemes were evaluated. The four schemes were chosen to represent the main families of fast radiation methods—CKD (correlated-k distribution)/lookup-table (RRTMG), operational variants (RRTMG-K, K60x), and a neural-network emulator (RRTMG-KNN)—consistent with prior literature on CKD, NN emulators, and multi-regression approaches (e.g., [30,50,51]).
In this study, “frequent-update” schemes (RRTMG, RRTMG-K, and RRTMG-KNN) calculate radiative fluxes at every model time step (radt = dt = 20 s), ensuring continuous coupling with other physical processes. In contrast, RRTMG-K60x applies radiation calculations only once every 60 steps (radt = 20 min), with interpolation used between radiation calls. This infrequent-update approach reduces computational demand but may introduce errors due to decoupling from rapidly changing atmospheric conditions. The first was the Rapid Radiative Transfer Model for General Circulation Models (RRTMG; [19,20]), a widely used broadband radiation scheme in both GCM and NWP applications. The second was RRTMG-K [21], developed by the Korea Institute of Atmospheric Prediction Systems (KIAPS) to improve computational efficiency by approximately 14% [21]; (Table 1) relative to RRTMG, achieved by reducing the Monte Carlo Independent Column Approximation (MCICA) sampling size and revising the shortwave two-stream approximations, while maintaining accuracy close to the 16-stream DISORT benchmark.
The third scheme, RRTMG-K60x (referred to as ‘WRF60’ in [40]), is an infrequent-update configuration applying RRTMG-K only once every 60 model steps (radt = 20 min), with a model time step (dt) of 20 s. This reduces radiation computation time by approximately 60-fold, a common operational practice, but may introduce errors due to temporal mismatches in rapidly evolving cloud fields.
The fourth scheme, RRTMG-KNN [39,40,41,42,44,45], is a neural network emulator of RRTMG-K. It consists of a single hidden layer with 90 neurons and employs stochastic weight averaging [52]. The emulator was trained using KLAPS-domain simulations from July of each year between 2009 and 2019, covering multiple years and meteorological regimes over the Korean Peninsula. Input variables included vertical profiles of pressure, temperature, humidity, ozone, and cloud fraction, along with surface and solar parameters. The outputs consisted of broadband LW/SW radiative fluxes and all-sky heating rate profiles. The training dataset was entirely independent of the 2020 KLAPS simulations evaluated here, ensuring a strict online validation without data leakage.
Table 1 summarizes the radiation time step (radt) and relative computation time for each radiation scheme. Relative computation time represents the average wall-clock time for radiation calculations alone, normalized to 100 for the baseline RRTMG scheme executed at every model step (radt = dt = 20 s). Under this normalization, RRTMG-K is approximately 14% faster per call than RRTMG, as previously reported by [21]. RRTMG-K60x (radt = 20 min) and RRTMG-KNN (neural network emulator, radt = 20 s) both demonstrate significantly reduced relative computation times, consistent with the roughly 60-fold speedup reported in [40]. All timing measurements followed identical hardware and compiler settings as described in [40]. All simulations were performed on the Korea Meteorological Administration’s DURU (No. 5) HPC cluster (Lenovo ThinkSystem SD530) powered by Intel Cascade Lake processors (24-core, 2.9 GHz). Radiation computation time was measured under a single-core setting and averaged over multiple repeated runs to ensure consistency. For RRTMG-K60x, the reported computation time includes only the radiation calculation at each call and does not account for any additional overhead from interpolation between radiation steps.
All other physical parameterizations followed the operational KLAPS configuration detailed in [40], including the WRF Single-Moment 6-class (WSM6) microphysics scheme, Yonsei University (YSU) planetary boundary layer scheme, Noah land surface model, and the Kain–Fritsch cumulus parameterization (applied only to outer nests, not used at 5 km resolution). This consistent physics setup isolated forecast differences attributable solely to radiation schemes. RRTMG, RRTMG-K, and RRTMG-KNN were executed at every model time step (radt = dt), whereas RRTMG-K60x was executed only once every 60 steps. Although combining RRTMG-KNN with infrequent updates could yield further computational savings, such a hybrid configuration was not evaluated here.

2.3. Experimental Design and Data Collocation

The numerical experiments covered the full calendar year of 2020. Each simulation consisted of a seven-day integration starting on the 1st, 8th, 15th, and 22nd of every month, yielding 48 forecast cases in total (4 per month × 12 months). This schedule provided uniform temporal sampling across all seasons and weather regimes, while the seven-day forecast length—following the approach of [40]—allowed evaluation of both short-range performance and the cumulative growth of radiation-related errors over multiple days.
Prior to collocation, we merged CERES SSF Level 2 observations from the three satellites—Terra, Aqua, NOAA-20—into a single integrated dataset covering the study period. In this study, spatial collocation employed a 10 km radius around each model grid point, averaging the corresponding CERES SSF within that radius to balance representativeness and minimize spatial mismatch errors between model grid cells and CERES observations. Temporal collocation between model output and satellite overpasses was performed using a ±5 min window. This window corresponds to half of the model output interval (10 min) and ensures that the forecast time used for validation is the closest possible to the actual observation time, thereby reducing temporal mismatch. The combined use of the 10 km spatial radius and ±5 min temporal window is consistent with the CERES instrument’s spatial resolution and the model’s temporal sampling characteristics.
This study used only CERES observations [7,46] that did not contain missing values or geolocation errors, while all such problematic data were excluded from the analysis. This procedure ensured that the CERES dataset used in this study provided a robust and reliable observational reference for evaluating the accuracy of model-simulated radiative fluxes throughout the 2020 analysis period. Note that the Geostationary Earth Radiation Budget (GERB) satellite data were not used, as GERB’s observational coverage (Europe–Africa–West Asia) does not include the East Asia and Korean Peninsula region examined in this study.
In addition to the year-long evaluation, Typhoon Haishen (September 2020) was selected as an extreme case study. It produced the highest total accumulated rainfall among typhoons affecting the Korean Peninsula in 2020, with over 547 mm recorded on Jeju’s Halla Mountain. The event featured intense deep convection and extensive high cloud cover, resulting in exceptionally strong cloud–radiation interactions. These characteristics make Haishen an ideal case for assessing radiation scheme performance under highly dynamic, radiatively active atmospheric conditions.

3. Results

To examine the performance of radiation parameterizations under extreme weather conditions, we analyzed Typhoon Haishen, a medium-sized typhoon that made landfall on the Korean Peninsula on 7 September 2020. At its mature stage, Haishen had a central pressure of approximately 950 hPa and maximum sustained winds near 35 m s−1, producing intense deep convection and heavy rainfall that strongly influenced the regional radiation budget. In the presence of deep convective clouds, OLR is typically reduced due to cold cloud-top emission, whereas in clear-sky regions with high surface temperature and emissivity, OLR values are elevated.
Figure 1a presents the CERES-observed OLR distribution at 04:30 UTC on 7 September 2020, corresponding to a 157.5 h forecast initialized at 15:00 UTC on 31 August. High OLR values above 270 W m−2 appear over the southwestern portion of the domain, indicative of clear-sky conditions, whereas low values below 150 W m−2 are concentrated near Ulleungdo Island in the East Sea, marking the typhoon’s cold cloud top. The corresponding model-simulated OLR fields from the four radiation schemes (Figure 1b–e) reproduce the general structure but differ from observations in key aspects. All schemes tend to overestimate the extent of the high-OLR (>270 W m−2) clear-sky area, particularly over the southeastern sector, and underestimate the intensity of the low-OLR (<150 W m−2) typhoon core. Quantitative verification against CERES observations yields RMSEs of 35.889, 33.487, 34.244, and 33.262 W m−2 for RRTMG, RRTMG-K, RRTMG-K60x, and RRTMG-KNN, respectively. Relative to RRTMG, the frequent-update RRTMG-K reduces RMSE by about 6.7%. However, when RRTMG-K is used infrequently (RRTMG-K60x), the RMSE increases by about 2.3% compared to the frequent-update RRTMG-K. The RRTMG-KNN achieves the lowest RMSE among the four schemes, slightly outperforming RRTMG-K, while simultaneously offering substantial computational efficiency. The mean biases for RRTMG, RRTMG-K, RRTMG-K60x, and RRTMG-KNN are 11.429, 7.326, 7.394, and 6.535 W m−2, indicating that the positive bias of RRTMG is reduced by 35.3–42.8% in the other three schemes. These results suggest that the KIAPS-modified RRTMG-K improves OLR prediction skill over the original RRTMG in this medium-sized typhoon case, and that the neural network emulator (RRTMG-KNN) can further enhance both computational efficiency and accuracy under similar conditions. The RRTMG-K scheme retains most of the longwave (LW) module from RRTMG but improves the shortwave (SW) module by revising the delta-scaled two-stream approximation to reduce systematic biases in shortwave radiative transfer under cloud-scattering conditions and to enhance numerical stability [21]. Therefore, the OLR differences shown in Figure 1 reflect an indirect effect of this SW improvement, and direct assessment of SW radiative performance requires analysis of OSR.
OSR generally increases when vertical temperature, surface albedo, and cloud fraction are high, and this relationship is evident in Figure 2. CERES observations (Figure 2a) show maximum OSR values over the East Sea, corresponding to the typhoon center, while minimum values occur over the southwestern sector of the domain, consistent with the OLR distribution in Figure 1a. The simulated OSR fields from the four radiation schemes (Figure 2b–e) reproduce the overall structure but tend to overestimate OSR around the typhoon compared to CERES. This overestimation is likely related to the simplified treatment of cloud scattering in the radiation schemes. For example, the widely used two-stream approximation does not fully represent the angular dependence of scattering (forward and backward) with respect to solar zenith angle, and incomplete representation of the optical properties of cloud particles (water droplets, ice, snow) can lead to excessive shortwave radiative flux. Consequently, simultaneous overestimation of OLR and OSR suggests limitations in the representation of cloud–radiation interactions. Quantitatively, RRTMG-K reduces OSR RMSE by 13.0% relative to RRTMG (217.539 → 189.350 W m−2) and decreases the positive mean bias by 25.9% (129.569 → 96.006 W m−2). RRTMG-K60x and RRTMG-KNN also reduce bias by 27.6% and 25.3%, respectively, although their RMSEs are 0.58% and 0.65% higher than that of RRTMG-K. These increases are much smaller than the 2.5% observed in OLR and are likely limited by the fact that the SW process operates only during daytime, reducing long-term error accumulation. These results provide direct evidence from OSR verification that RRTMG-K offers a substantial improvement in the SW radiative process compared to RRTMG.
For long-term statistical verification, this study analyzed the spatial distributions of RMSE and bias for OLR from four radiation parameterizations compared with CERES observations during the year 2020 (Figure 3). Twenty-eight days per month were considered in the analysis, so the results for each grid point correspond to a total of 336 days. The RMSEs of OLR were larger over the ocean than over land (Figure 3a–d). This is because OLR is relatively insensitive to uncertainties in surface emissivity but highly sensitive to cloud fields. Since relative humidity is generally higher over the ocean, cloud occurrence is more frequent, and discrepancies in cloud versus clear-sky areas between observations and models are interpreted as the dominant cause of increased RMSE. Compared to RRTMG (Figure 3a), the RRTMG-K, RRTMG-K60x, and RRTMG-KNN schemes show a substantial reduction in OLR RMSE (Figure 3b–d). For example, in RRTMG, broad regions over the East Sea with OLR RMSEs exceeding 28 W m−2 are greatly reduced in extent in the other three schemes. This improvement is largely attributable to the reduction in the systematic positive bias (Figure 3e–h).
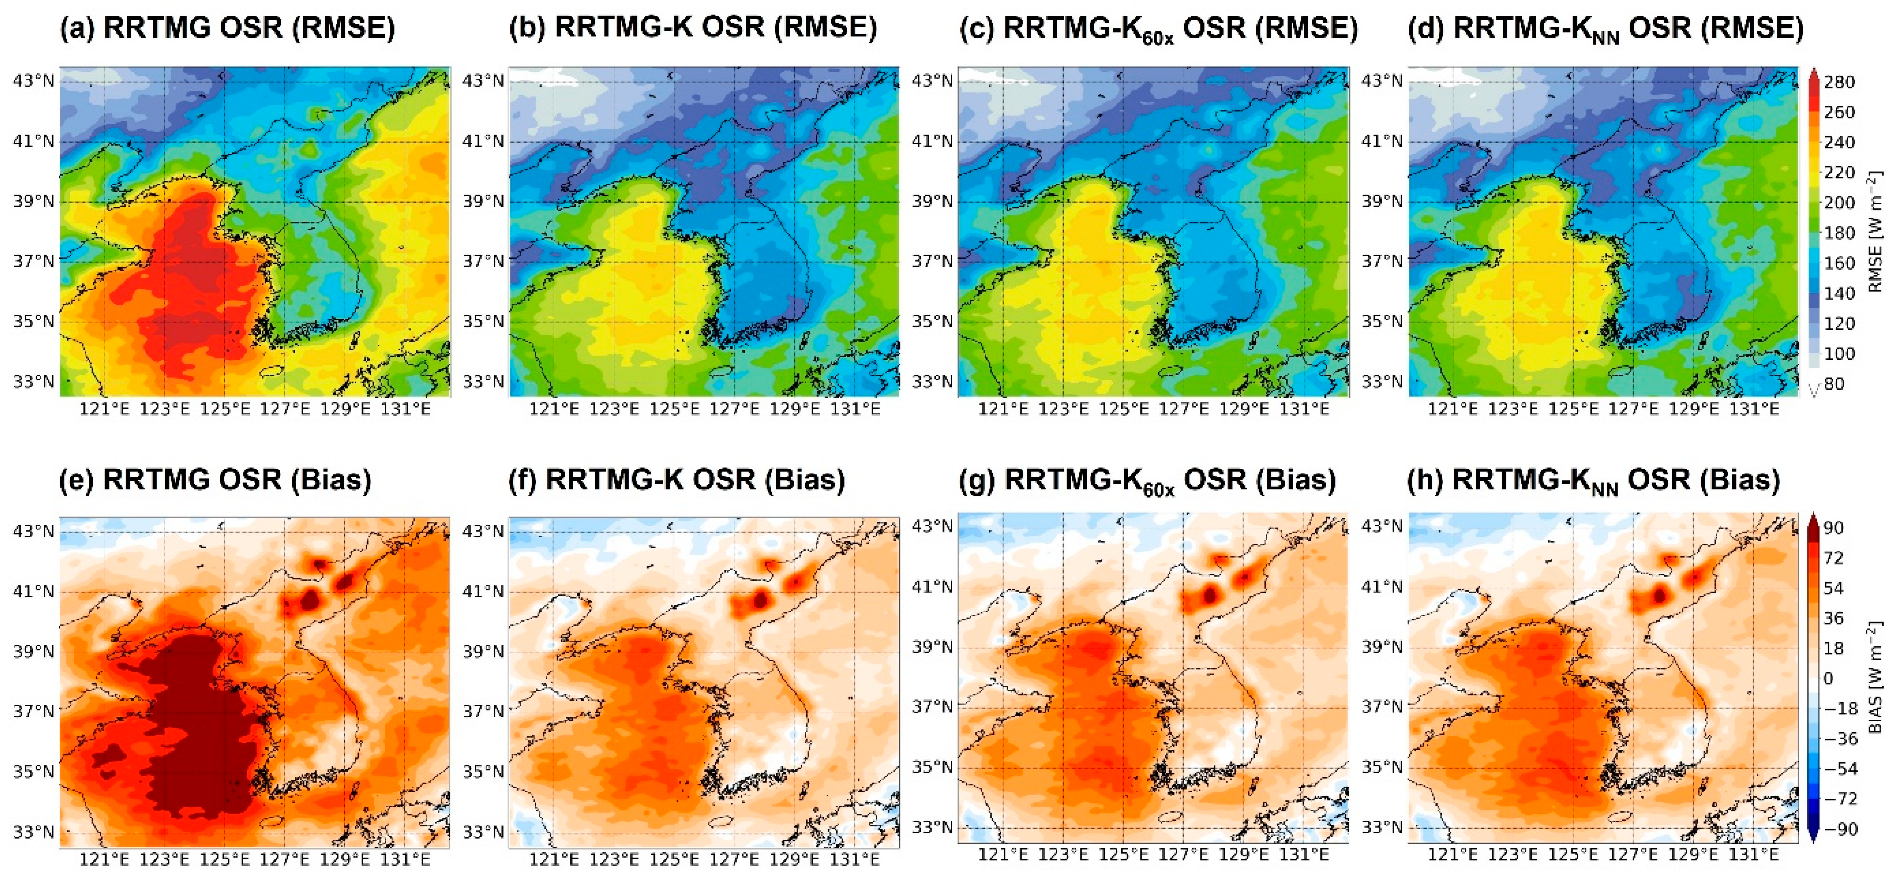
The OSR verification (Figure 4) shows similar characteristics. The RMSEs of OSR are also larger over the ocean, but the pronounced overestimation over the Yellow Sea contrasts with the OLR RMSE patterns over the East Sea. This contrast is linked to the climatological mean distributions of OLR (day and night) and OSR (daytime).
Specifically, the large mean OLR values over the East Sea (Figure 5) and the large mean OSR values over the Yellow Sea (Figure 6) exert strong influences on the respective RMSE patterns. In particular, the RRTMG scheme exhibits extensive regions over the Yellow Sea with RMSEs exceeding 240 W m−2 and biases greater than 72 W m−2 (Figure 4a,e). However, these large-error regions nearly disappear in the RRTMG-K, RRTMG-K60x, and RRTMG-KNN schemes (Figure 4b–d,f–h). Consequently, all three schemes significantly reduce the RMSE and bias of OSR, demonstrating a marked improvement in forecast accuracy compared to RRTMG.
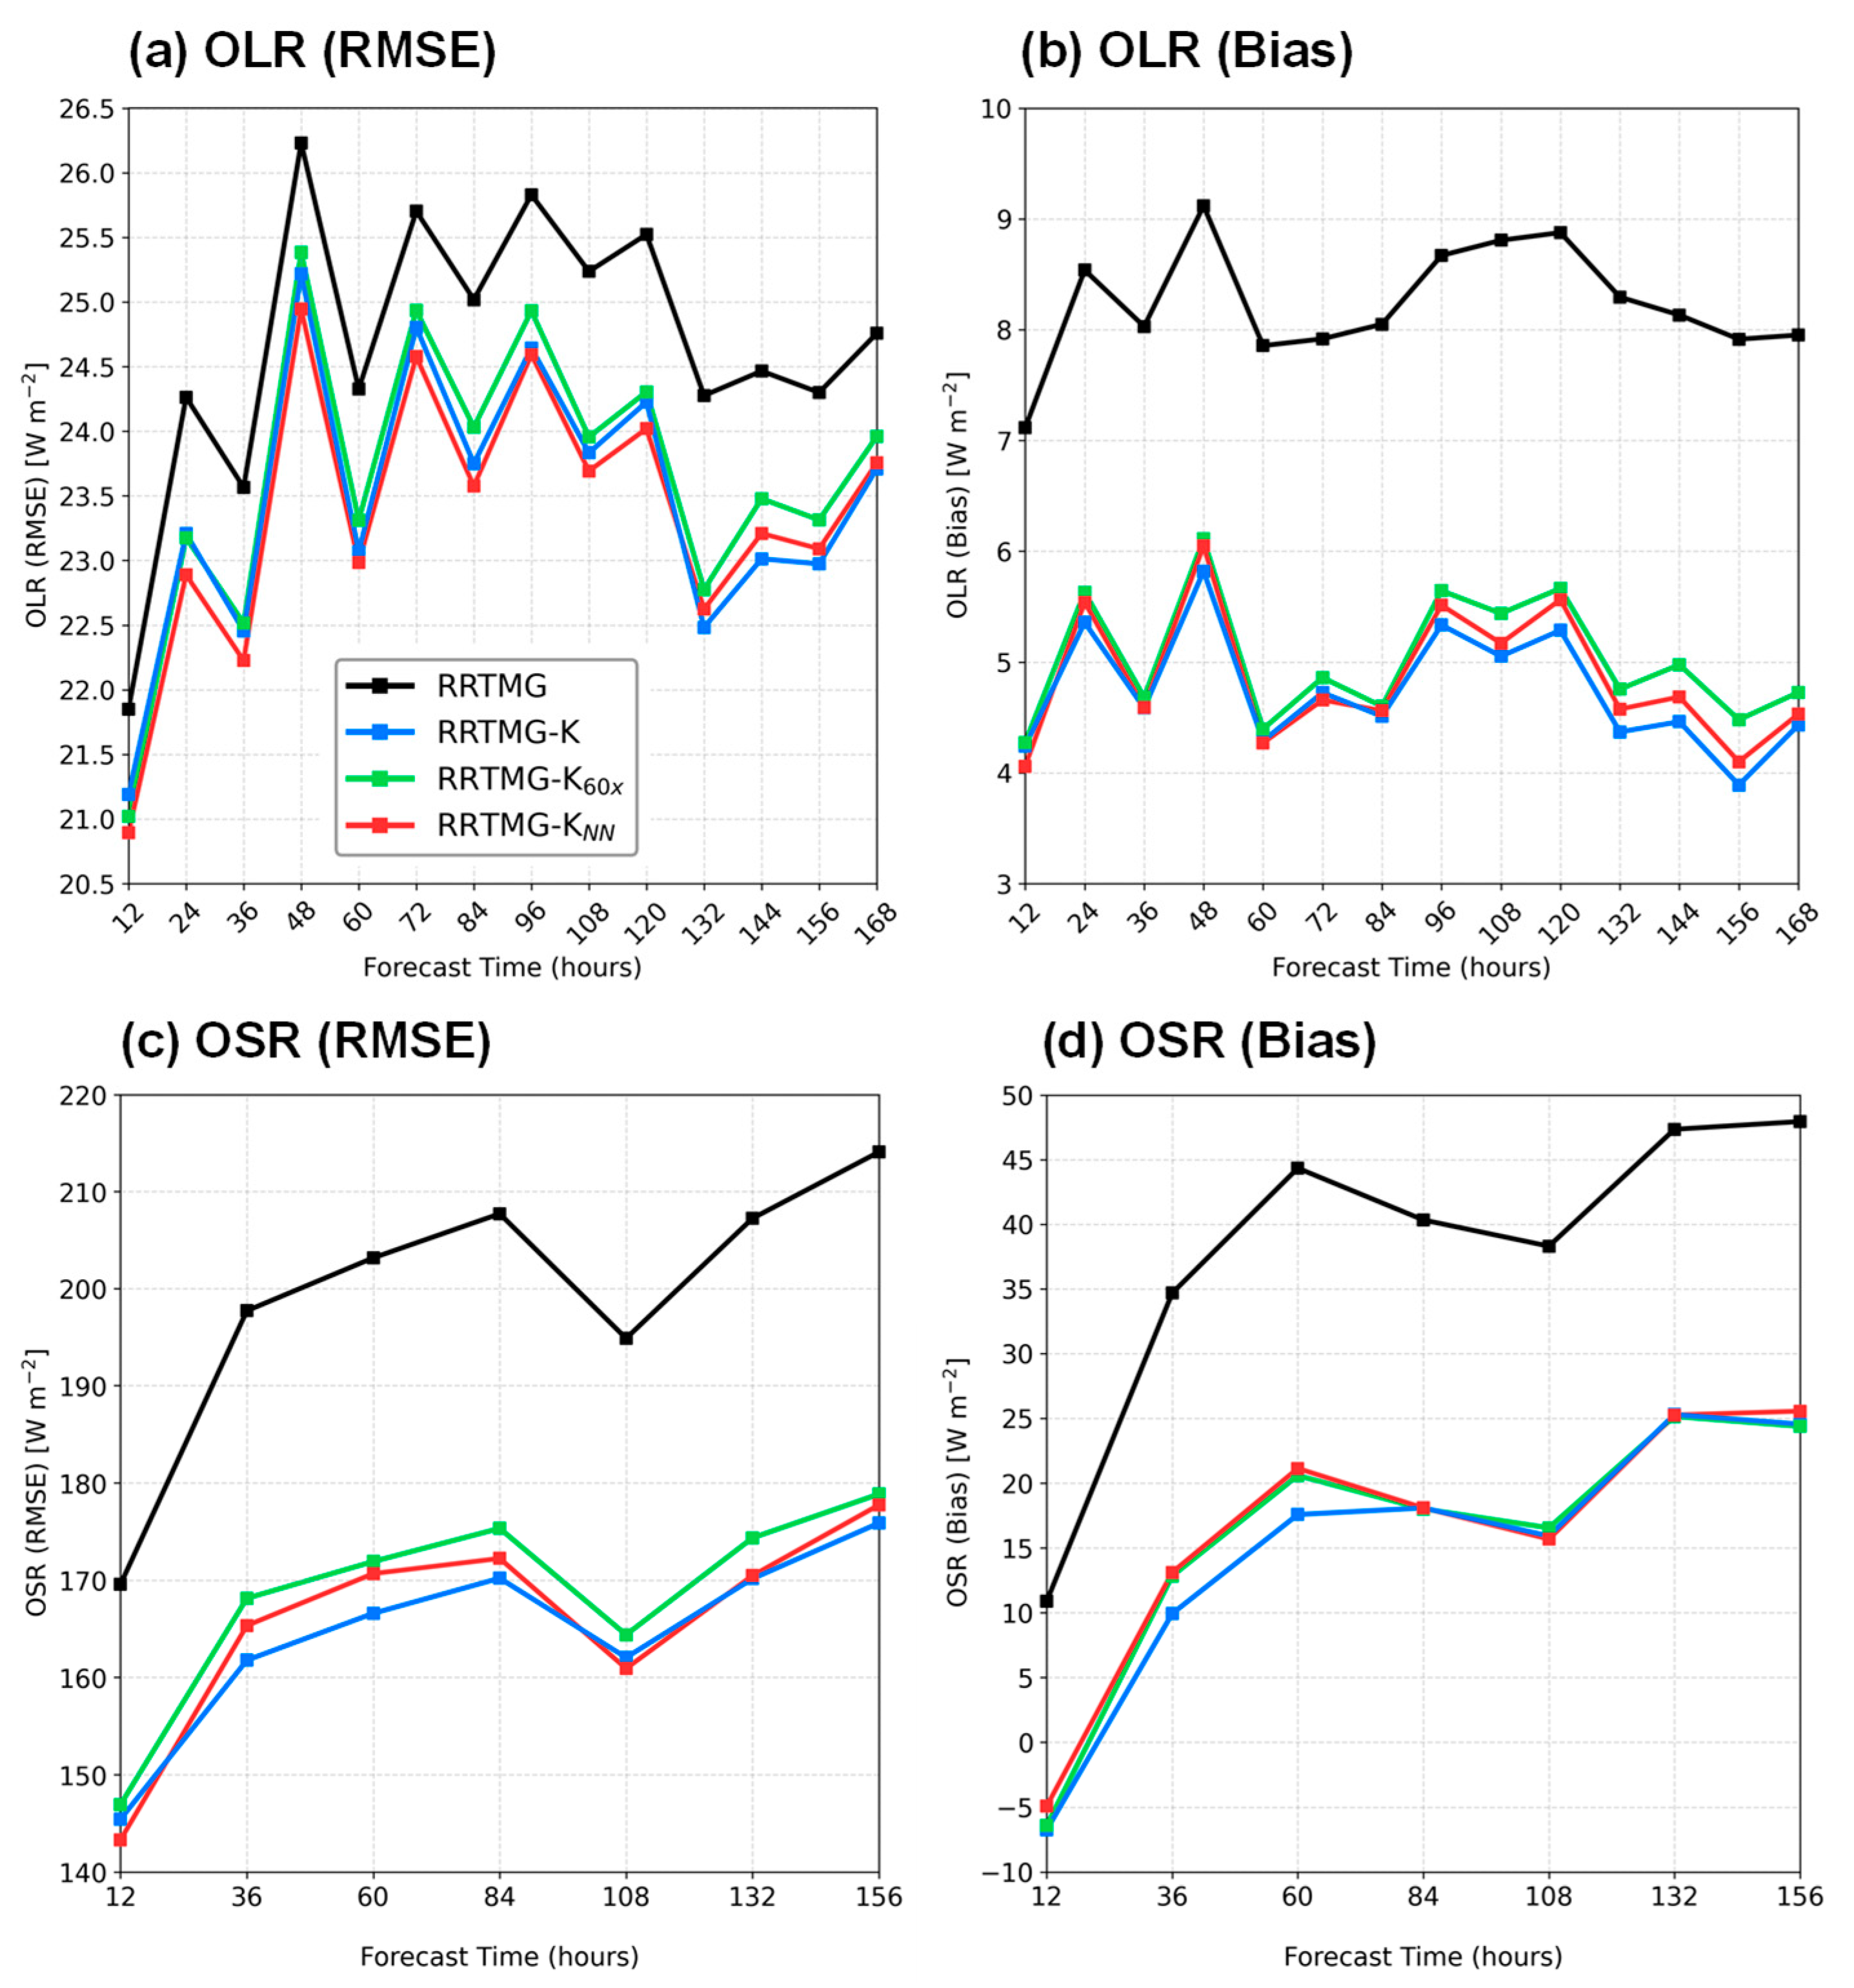
To examine the temporal evolution of forecast errors in OLR and OSR, time series of RMSEs and biases were analyzed (Figure 7). The statistics represent spatial averages over the entire domain and are evaluated at 12 h intervals for OLR and 24 h intervals for OSR, up to 168 h. For OLR, RMSEs ranged between 20 and 24 W m−2 (Figure 7a). RMSE generally increased with forecast lead time, though the growth tended to level off in the later part of the integrations. Across all lead times, the three alternative schemes (RRTMG-K, RRTMG-K60x, and RRTMG-KNN) yielded lower RMSEs than RRTMG, with reductions ranging from 3.0% to 7.4%. Correspondingly, their OLR biases were reduced by 33.0–50.8% compared with RRTMG (Figure 7b), indicating that mitigation of the systematic positive bias was a major factor in lowering the overall OLR errors. For OSR, the relative forecast improvements were larger than for OLR, consistent with the fact that RRTMG-K was developed by modifying the shortwave radiation process of RRTMG (Figure 7c,d). In particular, the increasing trends of RMSE and bias with forecast time were clearly alleviated. As a result, RRTMG-K, RRTMG-K60x, and RRTMG-KNN produced RMSEs that were 13.4–18.1% lower and biases that were 38.0–71.4% lower than those of RRTMG throughout the forecast period (Figure 7c,d).
The forecast errors of OLR and OSR were further examined using frequency distributions between CERES observations and the four radiation parameterizations (Figure 8). The occurrence frequency is represented by the color shading. While many cases align with the 1:1 line, substantial deviations also occur, indicating both overestimation and underestimation. For OLR, differences between models and observations were generally small at values above 300 W m−2. Larger discrepancies appeared at the extremes: models occasionally overestimated OLR up to ~300 W m−2 when observations indicated low values near 120 W m−2 (deep convective clouds), or underestimated OLR down to ~120 W m−2 when observations were near 300 W m−2 (clear-sky conditions). These discrepancies largely reflect uncertainties in cloud location prediction. Overall, the models tended to simulate higher OLR compared with observations. Quantitatively, RRTMG exhibited the highest RMSE (24.725 W m−2) and the lowest correlation coefficient (0.797), indicating the weakest performance among the four schemes (Figure 8a). In contrast, the three alternative schemes (RRTMG-K, RRTMG-K60x, and RRTMG-KNN) slightly improved performance, with RMSEs of 23.422–23.713 W m−2 and correlation coefficients of 0.800–0.804. The OSR results (Figure 8e–h) revealed distinct characteristics. The models generally simulated higher OSR than observed, particularly producing excessively large values when observations indicated small OSR. Rare events with OSR exceeding 1000 W m−2 were virtually absent in observations but appeared more frequently in the model outputs, contributing to overestimation. Consequently, correlation coefficients for OSR (0.659–0.698) were notably lower than those for OLR (0.797–0.804), consistent with the greater sensitivity of shortwave radiation to cloud microphysical processes [42]. Compared with CERES, RRTMG produced an OSR RMSE of 199.765 W m−2 and correlation coefficient of 0.659 (Figure 8e). The other three schemes showed marked improvement, reducing RMSEs to 164.853–168.930 W m−2 and raising correlation coefficients to 0.689–0.698. One additional feature was found for RRTMG-KNN: it occasionally generated OSR values below 50 W m−2, which were absent in both observations and other schemes. This suggests that further refinement of the neural network emulator is required, particularly near sunrise and sunset when OSR approaches zero.
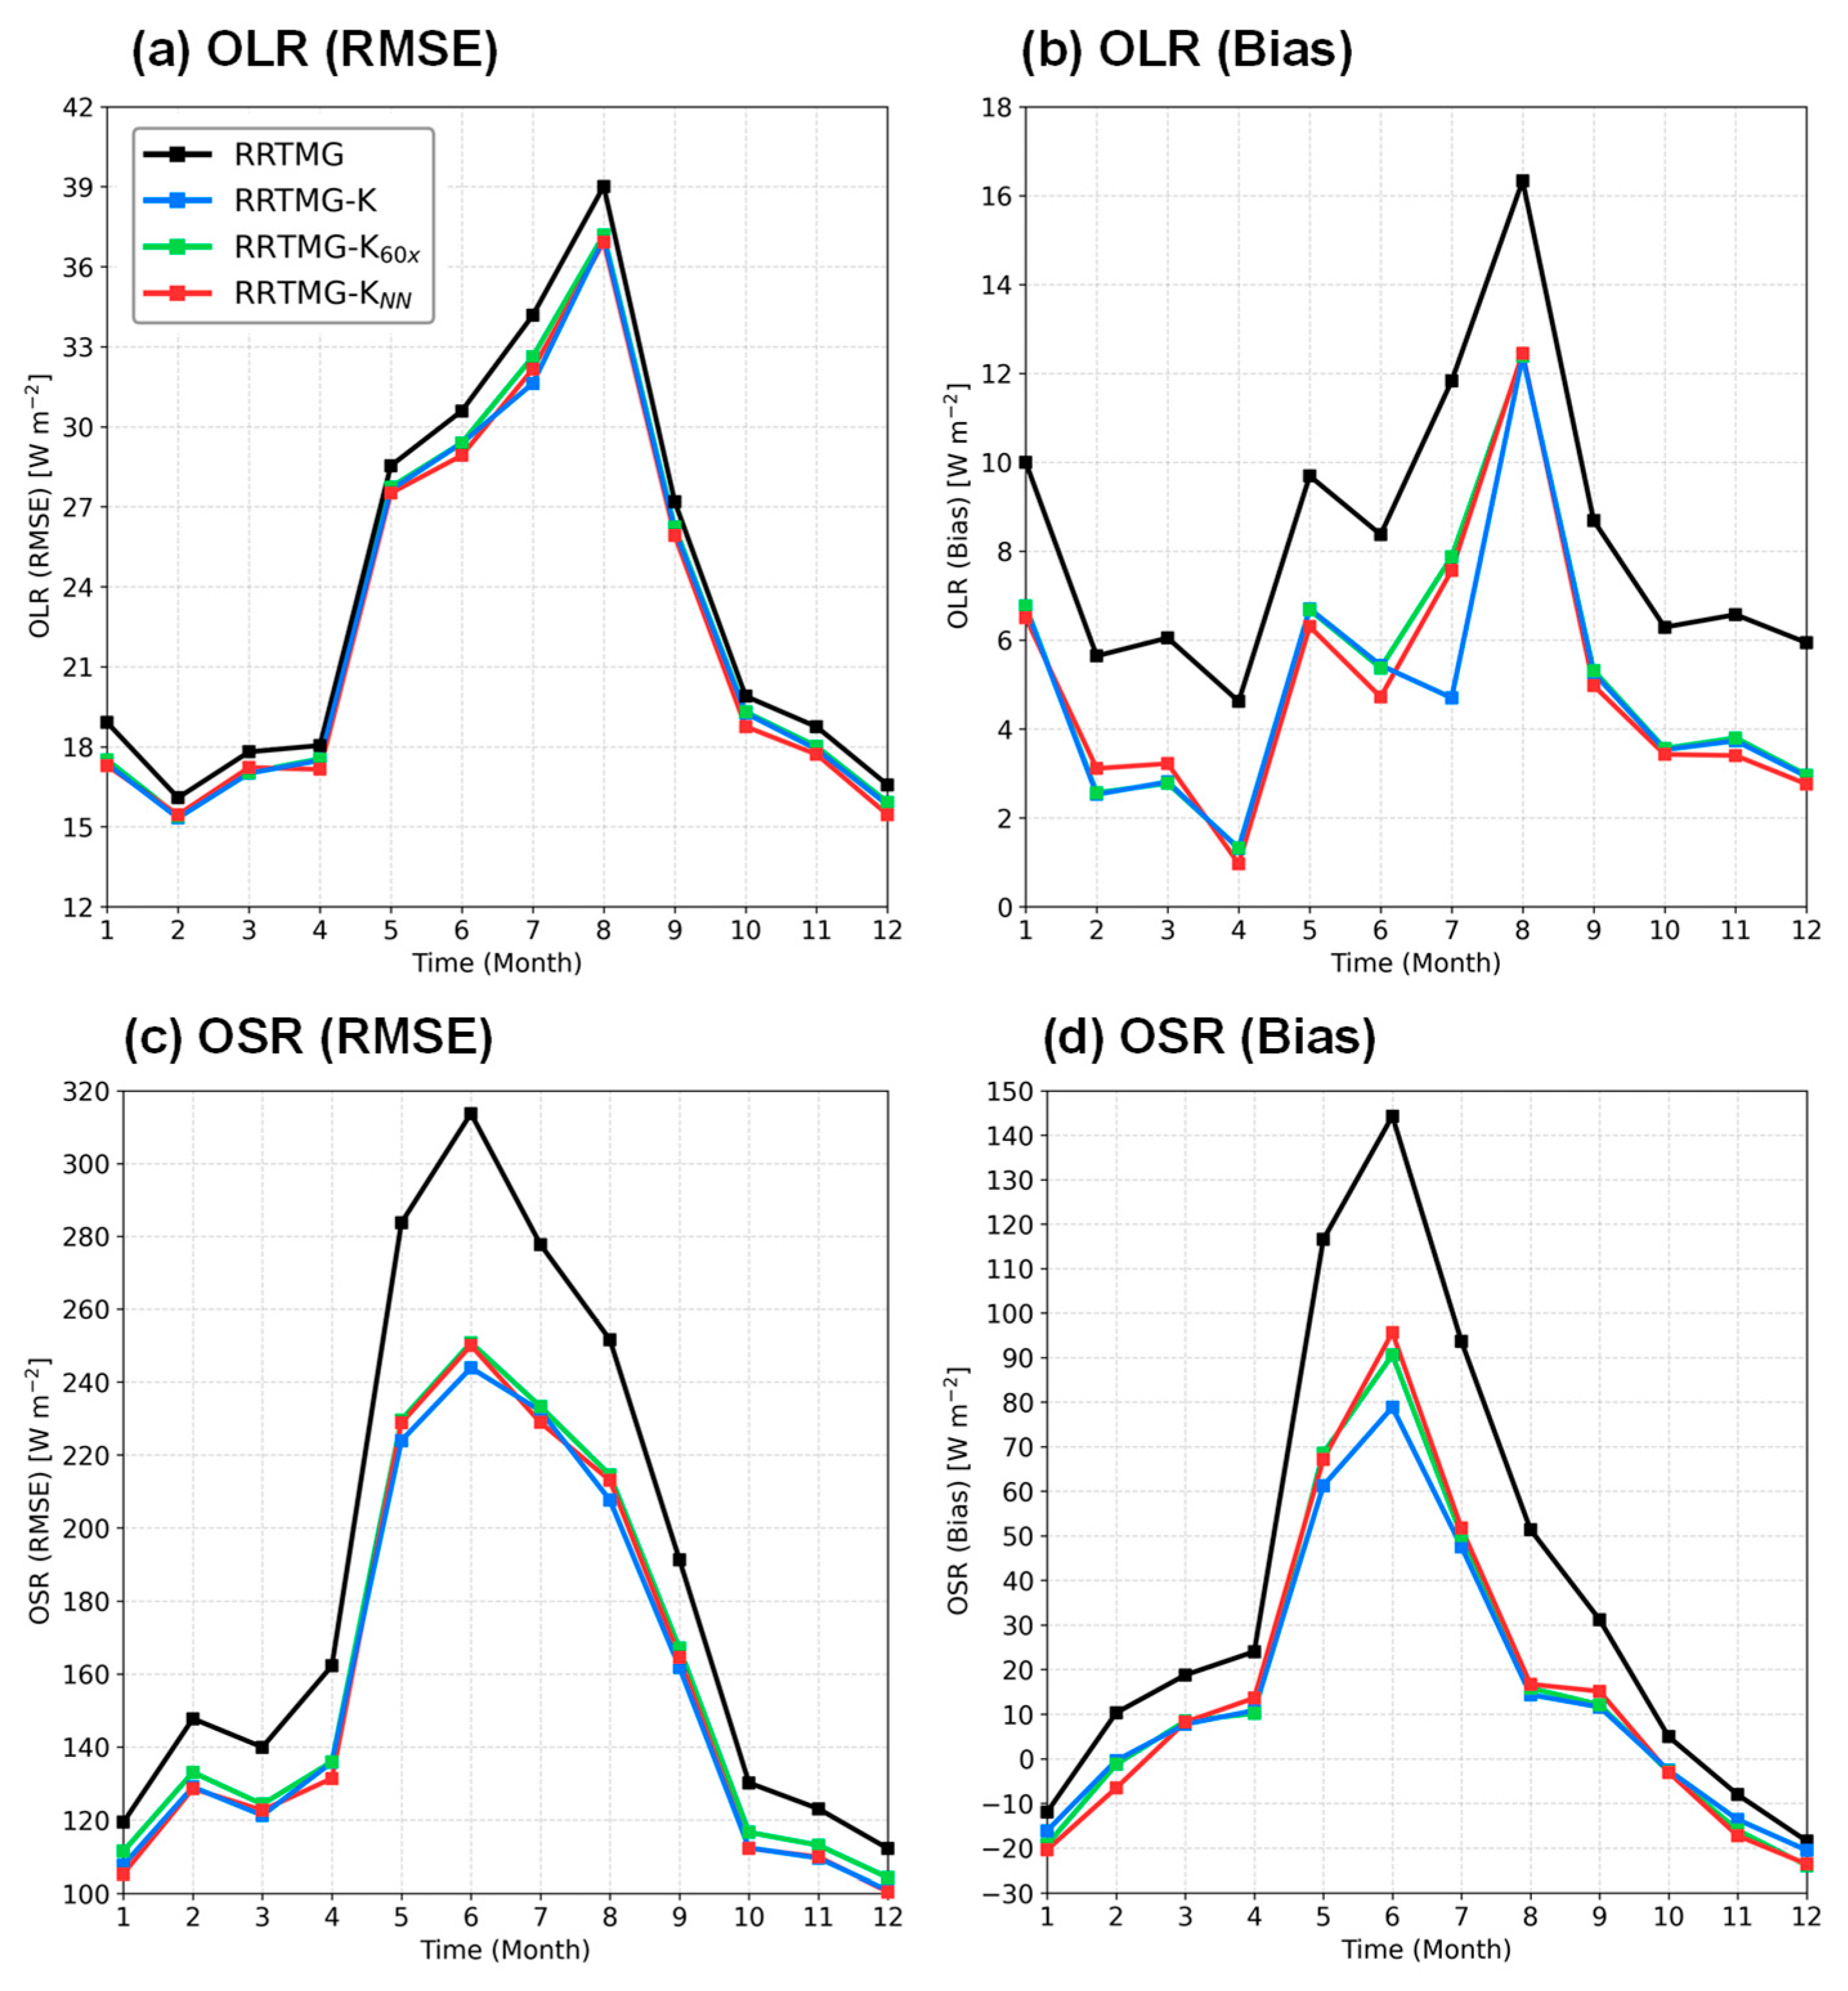
Figure 9 presents the monthly RMSE and bias statistics of OLR and OSR for the four radiation schemes. For OLR, RMSEs were largest in summer (June–August), ranging from 28.921 to 39.012 W m−2, and also high in winter (December–February), ranging from 15.456 to 18.909 W m−2 (Figure 9a). The summer maximum reflects frequent cumulus cloud development over the Korean Peninsula. The largest OLR bias occurred in August, although no clear seasonal pattern was evident (Figure 9b). Compared with RRTMG, the RRTMG-K, RRTMG-K60x, and RRTMG-KNN schemes reduced OLR RMSEs by 4.8%, 4.1%, and 5.3%, respectively. The lowest RMSE obtained with RRTMG-KNN is noteworthy given that it emulates RRTMG-K. Biases for these three schemes were also reduced by 42.3%, 38.9%, and 41.0%, respectively, relative to RRTMG. For OSR, the largest forecast errors occurred in June, slightly earlier than the OLR peak in August (Figure 9c). This difference reflects the direct proportionality of OSR to the solar elevation angle, which peaks at the summer solstice (21 June). Conversely, the smallest OSR errors were found in December, near the winter solstice (21 December). Overall, OSR errors were larger near the summer solstice and smaller near the winter solstice. The OSR biases were negative during November–January but positive for most of the year (Figure 9d). Because the positive biases outweighed the negative ones, the annual mean bias was positive, indicating a general overestimation of OSR by the models. Compared with RRTMG, the three schemes reduced OSR RMSEs by 17.5%, 15.4%, and 16.8%, respectively, and improved OSR biases by 60.4%, 57.8%, and 56.7%, respectively. These results confirm that the modifications to the shortwave processes in RRTMG-K produce substantial improvement in OSR relative to OLR. Moreover, the emulator scheme RRTMG-KNN reproduced errors comparable to RRTMG-K, while the infrequent-update configuration RRTMG-K60x showed some degradation. This suggests that neural-network emulation can provide computational efficiency without loss of forecast accuracy, whereas infrequent radiation updates may introduce additional error.

4. Discussion

This study evaluated four radiation parameterization schemes—RRTMG, RRTMG-K, RRTMG-K60x, and RRTMG-KNN—using CERES OLR and OSR observations over the Korean Peninsula in 2020. Both RRTMG-K and RRTMG-KNN consistently reduced forecast errors relative to RRTMG, with improvements more pronounced in OSR due to the revised shortwave process. For Typhoon Haishen, RRTMG-K lowered OLR RMSE by 6.7% and OSR RMSE by 13%, while bias reductions reached 35–43% (OLR) and 24–28% (OSR). Although RRTMG-K primarily targets shortwave processes, its more accurate shortwave radiation treatment can influence cloud development and distribution through improved cloud–radiation interactions. Since clouds play a major role in longwave radiation, this indirect effect likely contributed to the improved OLR performance observed with RRTMG-K. On an annual basis, improvements were 3–7% (OLR RMSE) and 13–18% (OSR RMSE), with bias reductions of 33–51% (OLR) and 38–71% (OSR).
The emulator RRTMG-KNN performed similarly or slightly better than RRTMG-K (OLR RMSE −5.3%, OSR RMSE −16.8% vs. RRTMG), while being ~60× faster, though occasional atypical OSR values were noted near sunrise and sunset. These anomalous values likely reflect limitations in model performance under high solar zenith angles, where observational uncertainty is also elevated. Limited twilight samples in the training data may have contributed to this behavior. Future improvements will focus on better sampling and model handling of low-light conditions. Despite this issue, the overall performance of RRTMG-KNN remains robust and does not affect the main conclusions of this study.
Additionally, this study did not explicitly separate clear-sky and cloudy-sky conditions due to the lack of cloud microphysical data in the archived outputs and spatiotemporal mismatch with CERES observations. Future work will incorporate satellite-based cloud products or model-derived cloud fraction to address this limitation. Given our domain, we incorporate cloud products from the Himawari-8 Advanced Himawari Imager (AHI) and the GEO-KOMPSAT-2A Advanced Meteorological Imager (AMI)—geostationary multispectral imagers—including cloud mask/fraction, phase, cloud-top temperature/height, and optical depth at ~5–15 min intervals. These datasets support tighter model–observation collocation, clear/cloudy-sky separation, and top-of-atmosphere radiation (OLR/OSR) evaluation. Cloud phase and vertical layering strongly influence surface solar radiation. Prior studies [53,54,55] showed shortwave impacts of liquid clouds and consistent differences between multi- and single-layer cases, highlighting the need to represent these features in radiation schemes.
In contrast, the infrequent-update scheme (RRTMG-K60x) achieved computational savings but degraded RMSE by ~1–2%. These results underscore the trade-off between computational efficiency and physical accuracy in radiation schemes. Improvements in radiation parameterizations, as demonstrated in this study, may also support practical forecasting tasks such as precipitation prediction and nowcasting by providing a more realistic representation of the atmospheric energy budget. Finally, geostationary Cloud Motion Vector (CMV) studies document tangible nowcasting gains: single-layer CMV improves SSI (Surface solar irradiance) nowcasts [56] and multi-layer (3D) CMV delivers consistent 0–3 h improvements [57]. These findings suggest that coupling our improved radiative fields with satellite-based CMV methods can support short-lead nowcasting.
Although this study focused on the Korean Peninsula, the radiation schemes evaluated here are column-based and region-agnostic, meaning they can be applied to other climates and regions with appropriate input profiles. To ensure reproducibility and broader applicability, all datasets, model configurations, and evaluation scripts have been archived and are publicly available via Zenodo [40].

5. Conclusions

This study conducted a comparative evaluation of four radiation parameterization schemes within a mesoscale NWP framework, utilizing satellite-based observations over the Korean Peninsula. Both RRTMG-K and RRTMG-KNN exhibited clear improvements over the widely used RRTMG scheme, particularly in simulating shortwave radiation. Among them, RRTMG-KNN achieved the most favorable balance between computational efficiency and predictive accuracy, operating approximately 60-fold faster while maintaining or enhancing forecast performance. These findings underscore the significance of satellite-derived flux data for the rigorous evaluation of physical parameterizations and demonstrate the promise of machine-learning-based emulators as viable alternatives in future operational forecasting systems. While Typhoon Haishen served as a valuable benchmark for assessing scheme performance under extreme weather conditions, reliance on a single case inherently limits the generalizability of the results. Future research will address this limitation by incorporating multiple typhoons and other high-impact weather events to strengthen the robustness and applicability of the conclusions.

Author Contributions

Conceptualization, H.-J.S.; formal analysis, J.C., S.R., M.C. and W.-J.C.; writing—original draft preparation, J.C. and S.R.; writing—review and editing, H.-J.S. and S.B.; supervision, H.-J.S. All authors have read and agreed to the published version of the manuscript.

Funding

This research was funded by Global—Learning & Academic research institution for Master’s·PhD students, and Postdocs (LAMP) Program of the National Research Foundation of Korea (NRF) grant funded by the Ministry of Education (No. RS-2023-00301914). It was also supported by the National Research Foundation of Korea (NRF) grants funded by the Korea government (MSIT) (No. RS-2023-00211994, No. RS-2023-00210362, and No. RS-2025-02242970) and the Korea Meteorological Administration Research and Development Program under Grant (RS-2025-02219688).

Data Availability Statement

CERES satellite data used in this study are publicly accessible from NASA Langley Research Center at https://ceres.larc.nasa.gov/data (accessed on 23 September 2025).

Conflicts of Interest

The authors declare no conflicts of interest.

References

  1. Barkstrom, B.R.; Smith, G.L. The Earth Radiation Budget Experiment: Science and implementation. Rev. Geophys. 1986, 24, 379–390. [Google Scholar] [CrossRef]
  2. Ramanathan, V. The role of earth radiation budget studies in climate and general circulation research. J. Geophys. Res. Atmos. 1987, 92, 4075–4095. [Google Scholar] [CrossRef]
  3. Harrison, E.F.; Minnis, P.; Barkstrom, B.R.; Ramanathan, V.; Cess, R.D.; Gibson, G.G. Seasonal variation of cloud radiative forcing derived from the Earth Radiation Budget Experiment. J. Geophys. Res. Atmos. 1990, 95, 18687–18703. [Google Scholar] [CrossRef]
  4. Yang, S.-K.; Hou, Y.-T.; Miller, A.J.; Campana, K.A. Evaluation of the Earth radiation budget in NCEP–NCAR reanalysis with ERBE. J. Clim. 1999, 12, 477–493. [Google Scholar] [CrossRef]
  5. Loeb, N.G.; Johnson, G.C.; Thorsen, T.J.; Lyman, J.M.; Rose, F.G.; Kato, S. Satellite and Ocean Data Reveal Marked Increase in Earth’s Heating Rate. Geophys. Res. Lett. 2021, 48, e2021GL093047. [Google Scholar] [CrossRef]
  6. Loeb, N.G.; Ham, S.-H.; Allan, R.P.; Thorsen, T.J.; Meyssignac, B.; Kato, S.; Johnson, G.C.; Lyman, J.M. Observational Assessment of Changes in Earth’s Energy Imbalance Since 2000. Surv. Geophys. 2024, 45, 1757–1783. [Google Scholar] [CrossRef] [PubMed]
  7. Wielicki, B.A.; Barkstrom, B.R.; Harrison, E.F.; Lee, R.B., III; Smith, G.L.; Cooper, J.E. Clouds and the Earth’s Radiant Energy System (CERES): An Earth Observing System experiment. Bull. Am. Meteorol. Soc. 1996, 77, 853–868. [Google Scholar] [CrossRef]
  8. Smith, G.L.; Priestley, K.J.; Loeb, N.G.; Wielicki, B.A.; Charlock, T.P.; Minnis, P.; Doelling, D.R.; Rutan, D.A. Clouds and Earth Radiant Energy System (CERES), a review: Past, present and future. Adv. Space Res. 2011, 48, 254–263. [Google Scholar] [CrossRef]
  9. Loeb, N.G.; Doelling, D.R.; Wang, H.; Su, W.; Nguyen, C.; Corbett, J.G.; Liang, L.; Mitrescu, C.; Rose, F.G.; Kato, S. Clouds and the Earth’s Radiant Energy System (CERES) Energy Balanced and Filled (EBAF) top-of-atmosphere (TOA) Edition-4.0 data product. J. Clim. 2018, 31, 895–918. [Google Scholar] [CrossRef]
  10. Kato, S.; Rose, F.G.; Rutan, D.A.; Thorsen, T.J.; Loeb, N.G.; Doelling, D.R.; Huang, X.; Smith, W.L.; Su, W.; Ham, S.-H. Surface irradiances of Edition 4.0 Clouds and the Earth’s Radiant Energy System (CERES) Energy Balanced and Filled (EBAF) data product. J. Clim. 2018, 31, 4501–4527. [Google Scholar] [CrossRef]
  11. Loeb, N.G.; Doelling, D.R.; Kato, S.; Su, W.; Mlynczak, P.E.; Wilkins, J.C. Continuity in Top-of-Atmosphere Earth Radiation Budget Observations from CERES EBAF Edition 4.2. J. Clim. 2024, 37, 6093–6108. [Google Scholar] [CrossRef]
  12. Liang, L.; Su, W.; Sejas, S.; Eitzen, Z.; Loeb, N.G. Next-generation radiance unfiltering process for the Clouds and the Earth’s Radiant Energy System instrument. Atmos. Meas. Tech. 2024, 17, 2147–2163. [Google Scholar] [CrossRef]
  13. Harries, J.E.; Russell, J.E.; Hanafin, J.A.; Brindley, H.; Futyan, J.; Rufus, J.; Kellock, S.; Matthews, G.; Wrigley, R.; Last, A.; et al. The Geostationary Earth Radiation Budget project. Bull. Am. Meteorol. Soc. 2005, 86, 945–960. [Google Scholar] [CrossRef]
  14. Dewitte, S.; Gonzalez, L.; Clerbaux, N.; Ipe, A.; Bertrand, C.; De Paepe, B. The Geostationary Earth Radiation Budget Edition 1 Data Processing Algorithms. Adv. Space Res. 2008, 41, 1906–1913. [Google Scholar] [CrossRef]
  15. Clerbaux, N.; Dewitte, S.; Bertrand, C.; Caprion, D.; De Paepe, B.; Gonzalez, L.; Ipe, A.; Russell, J.E.; Brindley, H. Unfiltering of the Geostationary Earth Radiation Budget (GERB) Data. Part I: Shortwave Radiation. J. Atmos. Ocean. Technol. 2008, 25, 1087–1105. [Google Scholar] [CrossRef]
  16. Kim, B.-Y.; Lee, K.-T.; Jee, J.-B.; Zo, I.-S. Retrieval of outgoing longwave radiation at top-of-atmosphere using Himawari-8 AHI data. Remote Sens. Environ. 2018, 204, 498–508. [Google Scholar] [CrossRef]
  17. Lee, S.-H.; Kim, B.-Y.; Lee, K.-T.; Zo, I.-S.; Jung, H.-S.; Rim, S.-H. Retrieval of reflected shortwave radiation at the top of the atmosphere using Himawari-8/AHI data. Remote Sens. 2018, 10, 213. [Google Scholar] [CrossRef]
  18. Zo, I.-S.; Jee, J.-B.; Lee, K.-T.; Lee, K.-H.; Lee, M.-Y.; Kwon, Y.-S. Radiative energy budget for East Asia based on GK-2A/AMI observation data. Remote Sens. 2023, 15, 1558. [Google Scholar] [CrossRef]
  19. Clough, S.A.; Shephard, M.W.; Mlawer, E.J.; Delamere, J.S.; Iacono, M.J.; Cady-Pereira, K.; Boukabara, S.; Brown, P.D. Atmospheric radiative transfer modeling: A summary of the AER codes. J. Quant. Spectrosc. Radiat. Transf. 2005, 91, 233–244. [Google Scholar] [CrossRef]
  20. Iacono, M.J.; Delamere, J.S.; Mlawer, E.J.; Shephard, M.W.; Clough, S.A.; Collins, W.D. Radiative forcing by long-lived greenhouse gases: Calculations with the AER radiative transfer models. J. Geophys. Res. Atmos. 2008, 113, D13103. [Google Scholar] [CrossRef]
  21. Baek, S.-H. A revised radiation package of G-packed McICA and two-stream approximation: Performance evaluation in a global weather forecasting model. J. Adv. Model. Earth Syst. 2017, 9, 1628–1640. [Google Scholar] [CrossRef]
  22. Hogan, R.J.; Bozzo, A. A flexible and efficient radiation scheme for the ECMWF model. J. Adv. Model. Earth Syst. 2018, 10, 1990–2008. [Google Scholar] [CrossRef]
  23. Eitzen, Z.A.; Su, W.; Xu, K.; Loeb, N.; Sun, M.; Doelling, D.; Rose, F.; Bodas-Salcedo, A. Evaluation of a general circulation model by the CERES Flux-by-Cloud type simulator. J. Geophys. Res. Atmos. 2017, 122, 10655–10668. [Google Scholar] [CrossRef] [PubMed]
  24. Rossow, W.B.; Schiffer, R.A. Advances in understanding clouds from ISCCP. Bull. Am. Meteorol. Soc. 1999, 80, 2261–2287. [Google Scholar] [CrossRef]
  25. Loeb, N.G.; Wang, H.; Allan, R.P.; Andrews, T.; Armour, K.; Cole, J.N.S.; Dufresne, J.; Forster, P.; Gettelman, A.; Guo, H.; et al. New generation of climate models track recent unprecedented changes in Earth’s radiation budget observed by CERES. Geophys. Res. Lett. 2020, 47, e2019GL086705. [Google Scholar] [CrossRef]
  26. Li, D.; Folini, D.; Wild, M. Assessment of top of atmosphere, atmospheric and surface energy budgets in CMIP6 models on regional scales. Earth Space Sci. 2023, 10, e2022EA002758. [Google Scholar] [CrossRef]
  27. Yuan, C.; Zhang, H.; Jing, X.; Zhao, S.; Li, X. Impact of a new radiation scheme on simulated climate in the Global–Regional Integrated SysTem model under varying physical parameterization schemes. Atmosphere 2024, 15, 501. [Google Scholar] [CrossRef]
  28. Pinty, B.; Lavergne, T.; Dickinson, R.E.; Widlowski, J.-L.; Gobron, N.; Verstraete, M.M. Simplifying the interaction of land surfaces with radiation for relating remote sensing products to climate models. J. Geophys. Res. Atmos. 2006, 111, D02116. [Google Scholar] [CrossRef]
  29. Bae, S.Y.; Park, R.-S. Consistency between the cloud and radiation processes in a numerical forecasting model. Meteorol. Atmos. Phys. 2019, 131, 1429–1436. [Google Scholar] [CrossRef]
  30. Hogan, R.J.; Matricardi, M. Evaluating and improving the treatment of gases in radiation schemes: The Correlated K-Distribution Model Intercomparison Project (CKDMIP). Geosci. Model Dev. 2020, 13, 6501–6521. [Google Scholar] [CrossRef]
  31. Roh, S.; Song, H.-J. Evaluation of neural network emulations for radiation parameterization in cloud resolving model. Geophys. Res. Lett. 2020, 47, e2020GL089444. [Google Scholar] [CrossRef]
  32. Zhang, H.; Zhu, S.; Zhao, S.; Wei, X. Establishment of high-resolution aerosol parameterization and its influence on radiation calculations. J. Quant. Spectrosc. Radiat. Transf. 2020, 243, 106802. [Google Scholar] [CrossRef]
  33. Waliser, D.E.; Graham, N.E.; Gautier, C. Comparison of the highly reflective cloud and outgoing longwave radiation datasets for use in estimating tropical deep convection. J. Clim. 1993, 6, 331–353. [Google Scholar] [CrossRef]
  34. Pearson, K.J.; Hogan, R.J.; Allan, R.P.; Lister, G.M.S.; Holloway, C.E. Evaluation of the model representation of the evolution of convective systems using satellite observations of outgoing longwave radiation. J. Geophys. Res. Atmos. 2010, 115, D20206. [Google Scholar] [CrossRef]
  35. Wiscombe, W.J. The delta-M method: Rapid yet accurate radiative flux calculations for strongly asymmetric phase functions. J. Atmos. Sci. 1977, 34, 1408–1422. [Google Scholar] [CrossRef]
  36. Stamnes, K.; Tsay, S.-C.; Wiscombe, W.; Jayaweera, K. Numerically stable algorithm for discrete-ordinate-method radiative transfer in multiple scattering and emitting layered media. Appl. Opt. 1988, 27, 2502–2509. [Google Scholar] [CrossRef]
  37. Pauluis, O.; Emanuel, K. Numerical instability resulting from infrequent calculation of radiative heating. Mon. Weather Rev. 2004, 132, 673–686. [Google Scholar] [CrossRef]
  38. Pincus, R.; Stevens, B. Paths to accuracy for radiation parameterizations in atmospheric models. J. Adv. Model. Earth Syst. 2013, 5, 225–233. [Google Scholar] [CrossRef]
  39. Song, H.-J.; Roh, S. Improved weather forecasting using neural network emulation for radiation parameterization. J. Adv. Model. Earth Syst. 2021, 13, e2021MS002609. [Google Scholar] [CrossRef]
  40. Song, H.J.; Roh, S.; Lee, J.; Nam, G.; Yun, E.; Yoon, J.; Kim, P.S. Benefits of stochastic weight averaging in developing neural network radiation scheme for numerical weather prediction. J. Adv. Model. Earth Syst. 2022, 14, e2021MS002921. [Google Scholar] [CrossRef]
  41. Song, H.-J.; Roh, S.; Park, H. Compound parameterization to improve the accuracy of radiation emulator in a numerical weather prediction model. Geophys. Res. Lett. 2021, 48, e2021GL095043. [Google Scholar] [CrossRef]
  42. Kim, P.S.; Song, H.-J. Usefulness of automatic hyperparameter optimization in developing radiation emulator in a numerical weather prediction model. Atmosphere 2022, 13, 721. [Google Scholar] [CrossRef]
  43. Song, H.-J.; Kim, P.S. Effects of cloud microphysics on the universal performance of neural network radiation scheme. Geophys. Res. Lett. 2022, 49, e2022GL098601. [Google Scholar] [CrossRef]
  44. Song, H.-J.; Roh, S. Impact of horizontal resolution on the robustness of radiation emulators in a numerical weather prediction model. Remote Sens. 2023, 15, 2637. [Google Scholar] [CrossRef]
  45. Roh, S.; Kim, P.S.; Song, H.-J. Streamlining hyperparameter optimization for radiation emulator training with automated Sherpa. Geosci. Lett. 2024, 11, 19. [Google Scholar] [CrossRef]
  46. Su, W.; Corbett, J.; Eitzen, Z.; Liang, L. Next-generation angular distribution models for top-of-atmosphere radiative flux calculation from CERES instruments: Methodology. Atmos. Meas. Tech. 2015, 8, 611–632. [Google Scholar] [CrossRef]
  47. Shin, H.-C.; Ha, J.-H.; Ahn, K.D.; Lee, E.H.; Kim, C.H.; Lee, Y.H.; Clayton, A. An overview of KMA’s operational NWP data assimilation systems. In Data Assimilation for Atmospheric, Oceanic and Hydrologic Applications; Park, S.K., Xu, L., Eds.; Springer: Cham, Switzerland, 2022; Volume IV, pp. 1–30. [Google Scholar] [CrossRef]
  48. Skamarock, W.C.; Klemp, J.B.; Dudhia, J.; Gill, D.O.; Zhiquan, L.; Berner, J.; Wang, W.; Powers, J.G.; Duda, M.G.; Barker, D.M.; et al. A Description of the Advanced Research WRF Model Version 4; NCAR Tech. Note NCAR/TN-556+STR; National Center for Atmospheric Research: Boulder, CO, USA, 2019. [Google Scholar] [CrossRef]
  49. Hersbach, H.; Bell, B.; Berrisford, P.; Hirahara, S.; Horányi, A.; Muñoz-Sabater, J.; Nicolas, J.; Peubey, C.; Radu, R.; Schepers, D.; et al. The ERA5 global reanalysis. Q. J. R. Meteorol. Soc. 2020, 146, 1999–2049. [Google Scholar] [CrossRef]
  50. Belochitski, A.; Krasnopolsky, V. Robustness of Neural Network Emulations of Radiative Transfer Parameterizations in a State-of-the-Art General Circulation Model. Geosci. Model Dev. 2021, 14, 7425–7437. [Google Scholar] [CrossRef]
  51. Saunders, R.; Hocking, J.; Turner, E.; Rayer, P.; Rundle, D.; Brunel, P.; Vidot, J.; Roquet, P.; Matricardi, M.; Geer, A.; et al. An Update on the RTTOV Fast Radiative Transfer Model (currently version 12). Geosci. Model Dev. 2018, 11, 2717–2737. [Google Scholar] [CrossRef]
  52. Izmailov, P.; Podoprikhin, D.; Garipov, T.; Vetrov, D.; Wilson, A.G. Averaging weights leads to wider optima and better generalization. In Proceedings of the Conference on Uncertainty in Artificial Intelligence (UAI), Monterey, CA, USA, 6–10 August 2018; Available online: https://arxiv.org/abs/1803.05407 (accessed on 23 September 2025).
  53. Matus, A.V.; L’Ecuyer, T.S. The Role of Cloud Phase in Earth’s Radiation Budget. J. Geophys. Res. Atmos. 2017, 122, 2559–2578. [Google Scholar] [CrossRef]
  54. Bodas-Salcedo, A.; Williams, K.D.; Ringer, M.A.; Beau, I.; Cole, J.N.S.; Dufresne, J.-L.; Koshiro, T.; Stevens, B.; Wang, Z. Large Contribution of Supercooled Liquid Clouds to the Solar Radiation Budget of the Southern Ocean. J. Clim. 2016, 29, 4213–4228. [Google Scholar] [CrossRef]
  55. Li, J.; Yi, Y.; Minnis, P.; Huang, J.; Yan, H.; Ma, Y.; Wang, W.; Ayers, J.K. Radiative Effect Differences between Multi-Layered and Single-Layer Clouds Derived from CERES, CALIPSO, and CloudSat Data. J. Quant. Spectrosc. Radiat. Transf. 2011, 112, 361–375. [Google Scholar] [CrossRef]
  56. Gallucci, D.; Romano, F.; Cersosimo, A.; Cimini, D.; Di Paola, F.; Gentile, S.; Geraldi, E.; Larosa, S.; Nilo, S.T.; Ricciardelli, E.; et al. Nowcasting Surface Solar Irradiance with AMESIS via Motion Vector Fields of MSG-SEVIRI Data. Remote Sens. 2018, 10, 845. [Google Scholar] [CrossRef]
  57. Kosmopoulos, P.; Dhake, H.; Melita, N.; Tagarakis, K.; Georgakis, A.; Stefas, A.; Vaggelis, O.; Korre, V.; Kashyap, Y. Multi-Layer Cloud Motion Vector Forecasting for Solar Energy Applications. Appl. Energy 2024, 353, 122144. [Google Scholar] [CrossRef]
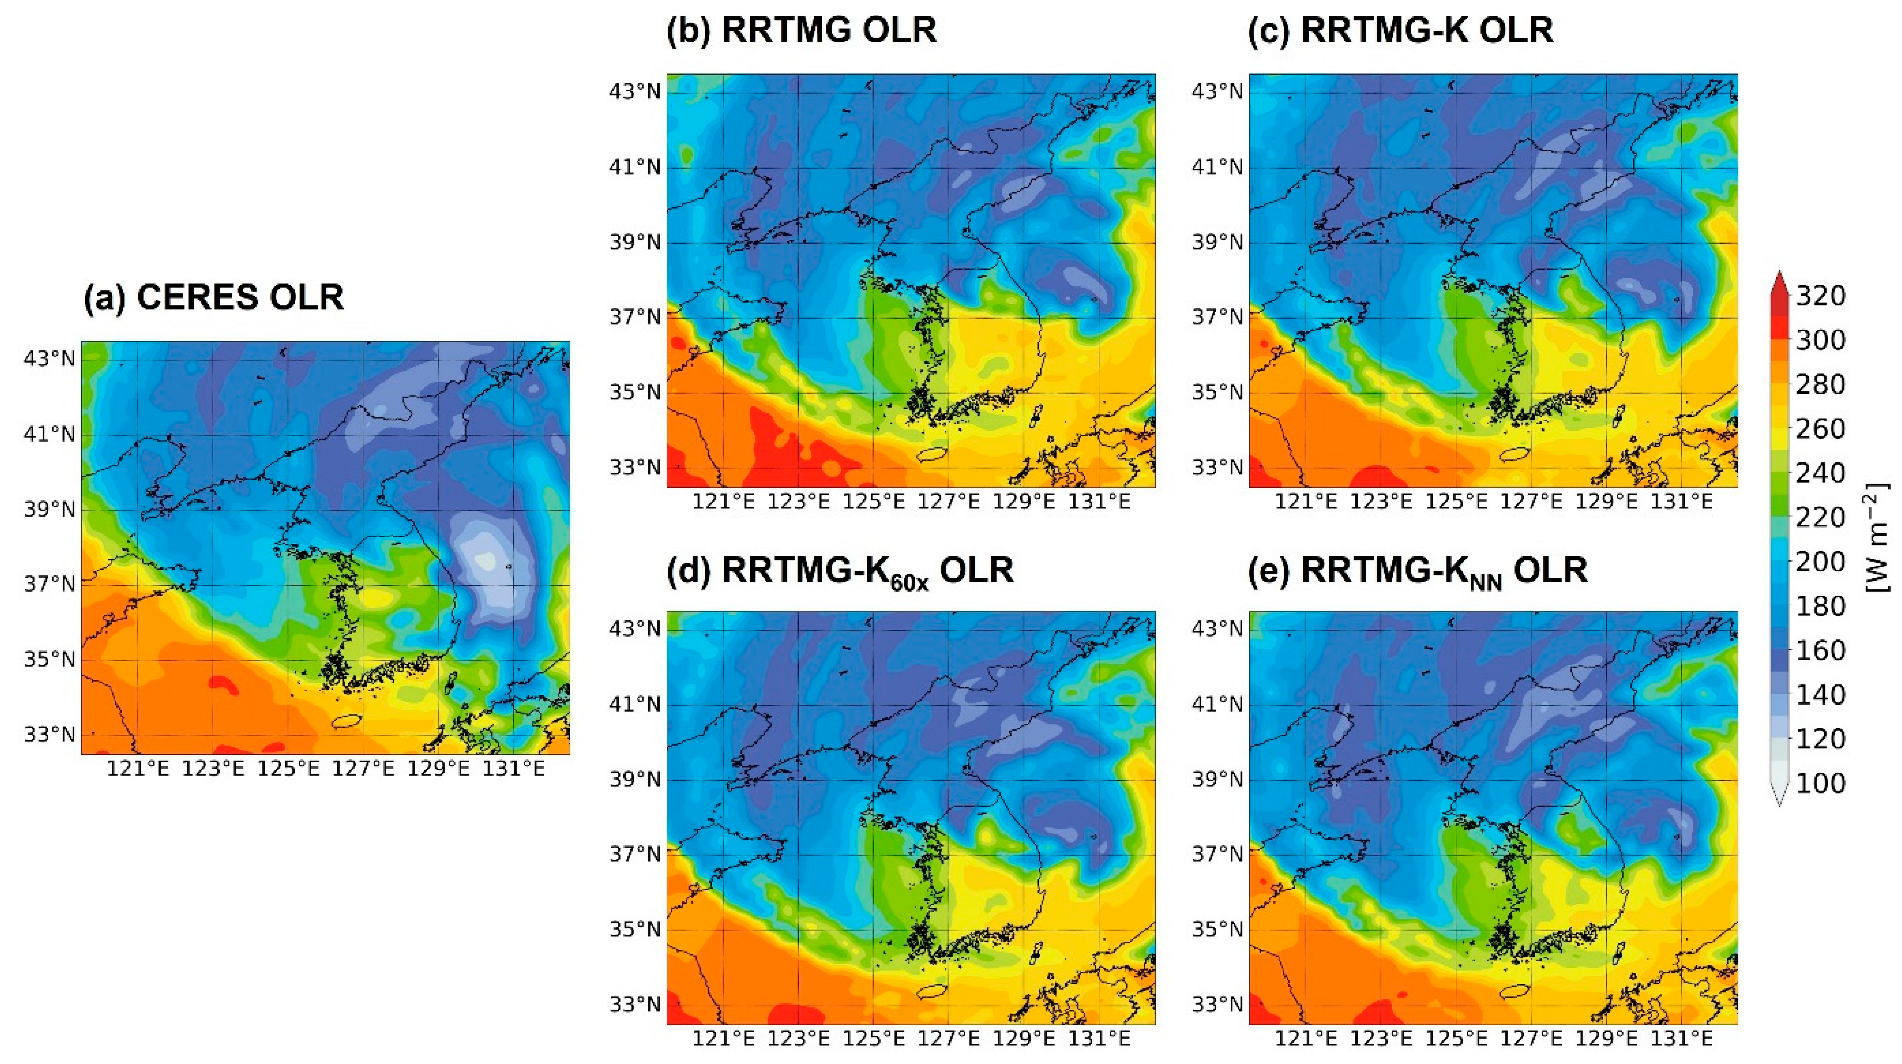
Figure 1. Spatial distributions of Outgoing Longwave Radiation (OLR) from (a) Aqua CERES observation and (be) four radiation schemes (RRTMG, RRTMG-K, RRTMG-K60x, and RRTMG-KNN) for the Typhoon Haishen case at 04:30 UTC on 7 September 2020.
Remotesensing 17 03312 g001
Figure 2. Same as Figure 1, but for Outgoing Shortwave Radiation (OSR).
Remotesensing 17 03312 g002
Figure 3. Spatial distributions of annual (ad) RMSEs and (eh) biases of Outgoing Longwave Radiation (OLR) from four radiation schemes (RRTMG, RRTMG-K, RRTMG-K60x, and RRTMG-KNN) compared to the CERES satellite observations.
Remotesensing 17 03312 g003
Figure 4. Same as Figure 3, but for Outgoing Shortwave Radiation (OSR).
Remotesensing 17 03312 g004
Figure 5. Spatial distributions of annual mean Outgoing Longwave Radiation (OLR) from the (a) CERES satellite observation and (be) four radiation schemes (RRTMG, RRTMG-K, RRTMG-K60x, and RRTMG-KNN).
Remotesensing 17 03312 g005
Figure 6. Same as Figure 5, but for Outgoing Shortwave Radiation (OSR).
Remotesensing 17 03312 g006
Figure 7. Temporal evolution of (a) RMSEs and (b) biases for Outgoing Longwave Radiation (OLR) of four radiation schemes (RRTMG, RRTMG-K, RRTMG-K60x, and RRTMG-KNN) compared to the CERES satellite observations. (c,d) Same as (a,b), but for Outgoing Shortwave Radiation (OSR).
Remotesensing 17 03312 g007
Figure 8. Scatter plots of (ad) Outgoing Longwave Radiation (OLR) and (eh) Outgoing Shortwave Radiation (OSR) comparing the simulation results of four radiation schemes (RRTMG, RRTMG-K, RRTMG-K60x, and RRTMG-KNN) against CERES satellite observations. Colors in the figures denote the frequency distributions, while RMSE and pattern correlation are also given within each figure.
Remotesensing 17 03312 g008
Figure 9. Monthly statistics of (a) RMSEs and (b) biases for Outgoing Longwave Radiation (OLR) of four radiation schemes (RRTMG, RRTMG-K, RRTMG-K60x, and RRTMG-KNN) compared to the CERES satellite observations. (c,d) Same as (a,b), but for Outgoing Shortwave Radiation (OSR).
Remotesensing 17 03312 g009
Table 1. The radiation time step (radt) used in four radiation parameterizations (RRTMG, RRTMG-K, RRTMG-K60x, and RRTMG-KNN) and relative computation time compared to the RRTMG scheme.
Radiation SchemesradtComputation Time
RRTMG20 s100
RRTMG-K20 s86
RRTMG-K60x20 min1.43
RRTMG-KNN20 s1.43
Disclaimer/Publisher’s Note: The statements, opinions and data contained in all publications are solely those of the individual author(s) and contributor(s) and not of MDPI and/or the editor(s). MDPI and/or the editor(s) disclaim responsibility for any injury to people or property resulting from any ideas, methods, instructions or products referred to in the content.