Article

Bundled-Images Based Geo-Positioning Method for Satellite Images Without Using Ground Control Points

1
College of Information Technology, Shanghai Ocean University, Shanghai 201306, China
2
School of Electronic and Information Engineering, Shanghai Dianji University, Shanghai 201306, China
3
School of Geodesy and Geomatics, Wuhan University, Wuhan 430079, China
*
Author to whom correspondence should be addressed.
Remote Sens. 2025, 17(19), 3289; https://doi.org/10.3390/rs17193289
Submission received: 3 August 2025 / Revised: 15 September 2025 / Accepted: 23 September 2025 / Published: 25 September 2025

Abstract

Highlights

What are the main findings?
  • A new bundled-images based geo-positioning method without ground control points.
  • A detailed strategy for leveraging a Kalman filter to integrate new image observations with their corresponding historical information.
What is the implication of the main finding?
  • Validated with heterogeneous TH-1 and ZY-3 datasets and homologous IKONOS datasets, meeting the mapping demands at the corresponding scale without ground control points.
  • Potential for regional and global mapping without using ground control points.

Abstract

Bundle adjustment without Ground Control Points (GCPs) using stereo remote sensing images represents a reliable and efficient approach for realizing the demand for regional and global mapping. This paper proposes a bundled-images based geo-positioning method that leverages a Kalman filter to effectively integrate new image observations with their corresponding historical bundled images. Under the assumption that the noise follows a Gaussian distribution, a linear mean square estimator is employed to orient the new images. The historical bundled images can be updated with posterior covariance information to maintain consistent accuracy with the newly oriented images. This method employs recursive computation to dynamically orient the new images, ensuring consistent accuracy across all the historical and new images. To validate the proposed method, extensive experiments were carried out using two satellite datasets comprising both homologous (IKONOS) and heterogeneous (TH-1 and ZY-3) sources. The experiment results reveal that without using GCPs, the proposed method can meet 1:50,000 mapping standards with heterogeneous TH-1 and ZY-3 datasets and 1:10,000 mapping accuracy requirements with homologous IKONOS datasets. These experiments indicate that as the bundled images expand further, the image quantity growth no longer results in substantial improvements in precision, suggesting the presence of an accuracy ceiling. The final positioning accuracy is predominantly influenced by the initial bundled image quality. Experimental evidence suggests that when using the proposed method, the bundled image sets should exhibit superior precision compared to subsequently new images. In future research, we will expand the coverage to regional or global scales.

1. Introduction

High-precision geographic information can be effectively obtained through the utilization of stereo satellite imagery. Block adjustment serves as a pivotal technology in image geometric processing, aiming to simultaneously determine both the image orientation parameters and the three-dimensional coordinates of tie points with high precision. In traditional block adjustment methodologies (the traditional method in short), Ground Control Points (GCPs) play a crucial role in both compensating for systematic errors and improving the geometric accuracy of remote sensing imagery. However, GCP measurement requires enormous human and material resources, particularly for large-scale geographical information acquisition. GCP-free block adjustment using stereo remote sensing images represents a reliable and efficient approach for realizing the demand for regional and global mapping.
Many studies have focused on block adjustment without GCPs using satellite images. Three ways have been described for the geometric positioning of satellite images without GCPs. The first directly compensates for the attitude errors of exterior orientation elements to enable high-precision geometric positioning without GCPs. However, this method requires knowledge of the sensor’s internal structure as well as attitude and orbital parameters. The second approach utilizes virtual control points as a replacement for GCPs in the geometric positioning of images [1]. However, the accuracy of these virtual control points is dependent on the precision of the image’s Rational Polynomial Coefficients (RPCs). If the RPC accuracy is insufficient, it can degrade the final adjustment accuracy and, in severe cases, result in the non-convergence of the adjustment process. The third approach substitutes GCPs with high-precision geographic data for geometric image positioning [2,3]. Typical geographic data sources include the Digital Elevation Model (DEM) [4], laser altimetry data [5], bundled images and so on. Current implementations of such methods incorporate geographic data by introducing additional observation equations into the block adjustment process for image orientation. However, this approach presents two significant limitations. First, additional observation equations lead to prolonged processing times. Second, the geographic data remains static and is not dynamically updated when new images are incorporated.
This paper proposes a bundled-images based geo-positioning method that leverages a Kalman filter to effectively integrate new image observations with their corresponding historical information on bundled images. This approach does not require adding observation equations for the bundled images, relying only on covariance information of their tie points, significantly reducing computational load. Under the assumption that the noise follows a Gaussian distribution, a linear mean square estimator is employed to orient the new images. The historical bundled images can be updated using posterior covariance information. For subsequent new images requiring orientation, the process of orientation and update is repeated. This method employs recursive computation to dynamically orient the new images, ensuring consistent accuracy across all the historical and new images.
The contributions of this study can be summarized as follows:
1.
We utilize a Kalman filter to integrate new image observations with their a priori covariance information derived from bundled images. This approach enables efficient image orientation while excluding bundled image point observations.
2.
The historical bundled images can be updated with posterior covariance information to maintain consistent accuracy with the new bundled image.
3.
Without using GCPs, the proposed bundled-images based geo-positioning method meets 1:50,000 mapping standards with heterogeneous TH-1 and ZY-3 datasets and 1:10,000 mapping accuracy requirements with homologous IKONOS datasets.

2. Related Work

2.1. Attitude Error Compensation

TH-1, China’s first mapping satellite, has been effectively employed to produce topographic maps, demonstrating the feasibility of GCP-free mapping methodologies. The attitude accuracy of exterior orientation elements is a key factor affecting the location accuracy without GCPs. The Equivalent Frame Photo (EFP) bundle adjustment is used to solve the TH-1 systematic distortion of the strip model, enabling high location accuracy without using GCPs [6]. This approach compensates for both low-frequency angular errors and drift angle deviations [7,8]. Therefore, global mapping can be achieved using regional calibration parameters. Zhang et al. carried out automatic matching and block adjustment using multistrip ZY-3 satellite imagery and achieved accuracies of about 13–15 m in both planimetry and height [9]. However, this method depends on accurate information regarding both the sensor’s internal architecture as well as its attitude and orbital characteristics.

2.2. Virtual Control Points Taken as a Substitute for GCPs

The initial RPCs of the imagery were utilized to generate virtual control points, which were subsequently incorporated into the block adjustment as weighted observations to improve the state of the normal equation. The technique facilitated GCP-free block adjustment with high geometric accuracy for satellite imagery [10]. The rank deficiency problem in the coefficient matrix of the normal equation during block adjustment without GCPs was addressed by constructing “average” virtual control points. A novel method for block adjustment using high-resolution optical satellite imagery without GCPs was proposed, which is both efficient and easily parallelizable [11]. Toutin et al. introduced a new hybrid model that utilized image metadata to generate virtual control points. This model was applied to WorldView-1 and WorldView-2 stereo images for elevation extraction in the mountainous regions of Quebec. Although the accuracy was slightly reduced when compared to LiDAR data, the decrease in the GCP requirement presented a significant advantage for the application of WorldView imagery in remote areas [12]. Liu et al. addressed the ill-conditioned nature of normal equations by incorporating weighted virtual observations, which introduces affine transformation parameters as compensation terms to construct a bias-compensated rational function model [13].
However, the initial RPC accuracy determines the precision of generated virtual control points. Images exhibiting poor initial positioning accuracy not only impact the final block adjustment accuracy but may also lead to non-convergence in the adjustment process.

2.3. High-Precision Geographic Data Taken as a Substitute for GCPs

High-precision geographic data, including DEM, laser altimetry data and bundled images, can replace GCPs in the geo-positioning for new images. By integrating DEM for elevation control, the researchers enhanced both absolute planimetric and vertical positioning accuracy without relying on GCPs [4]. By integrating ICESat laser altimetry data as vertical constraints in the satellite image block adjustment process, researchers achieved elevation accuracy within 5 m [14]. This methodology was further enhanced by incorporating spaceborne synthetic aperture radar (SAR) imagery, which leveraged its inherent high planimetric precision characteristics, thereby ensuring planimetric accuracy within 7 m [15]. Wang et al. [16] proposed a temporary reference station-assisted block adjustment method for ZY-3 satellite imagery in overseas areas, with experiments demonstrating its effectiveness in complex overseas terrains. Jiang et al. [17] innovatively established an adjustment optimization method integrating Rational Function Model (RFM)-based image-space affine models with inequality constraints, showing 38 % faster convergence than conventional methods. Pi et al. [18] constructed an adaptive weighted adjustment system using ZY-3 triplet stereo images, attaining sub-meter level planimetric accuracy through optimal observation weighting strategies. Cheng et al. developed an advanced RFM that incorporates the image orientation parameter precision by transforming the prior autonomous positioning accuracy and linear drift of the imagery into the accuracy and weight of these parameters. This approach enhanced the positioning accuracy without GCPs and improved the robustness of solving orientation parameters [19]. Tee-Ann Teo et al. conducted a comparative analysis of three distinct DEM-based satellite block adjustment methodologies: the modified traditional approach, the direct georeferencing technique and the RFM-based method. Experimental findings revealed that the DEM-based block adjustment approaches significantly improved positioning accuracy compared to conventional single-image positioning, with accuracy enhancements varying between 3 and 24 m. Three methodologies demonstrated consistent performance levels, offering multiple viable strategies for optimizing block adjustment accuracy in photogrammetric applications [20].
The authors proposed the Spatial Triangulated Network (STN) [21], an extension of the Metric Information Network (MIN) [22]. Functioning as a database, the STN is designed to store photogrammetric spatial triangulation results of bundled images, including three-dimensional coordinates of ground points, bundled image metadata, orientation parameters of bundled images and associated covariance matrices [21]. The bundled images retrieved from the STN can replace GCPs to be involved in the combined block adjustment for geo-positioning the new images. This technique incorporates an additional term into the normal equation matrix related to the bundled images, thereby improving the normal equation condition and ensuring solution stability. The physical model-based and RFM-based geo-positioning methods using bundled images instead of using GCPs have been studied in a previous paper and can achieve comparable accuracy to the traditional method using GCPs [23]. By utilizing bundled images, this approach increases redundant observations and improves base-to-height ratios, thereby enhancing geo-positioning accuracy. In this study, we designate this methodology as the direct method.
However, the image points extracted from bundled images must be incorporated into observation equations and participate in the combined block adjustment. If the study area exhibits a high degree of overlap and contains a lot of images, the number of observation equations will increase, leading to longer computational time. Moreover, the covariance information of the bundled images was not fully utilized, and the STN was not updated when new images were added. Therefore, this paper proposes a bundled images-based geo-positioning method without GCPs, which does not require observation equations for the bundled images, relying only on their historical covariance information. In this study, we designate this method as the merged method.

3. Methodology

3.1. Overview of the Proposed Merged Method

The proposed merged method utilizes historical bundled images as prior knowledge and employs a Kalman filter to geo-position new images. Then, these new bundled images are applied to update the historical bundled images to maintain consistent and high accuracy. The workflow of the merged method without using GCPs is shown in Figure 1. The process of geo-positioning new images using the proposed merged method initiates with image retrieval, which identifies overlapping bundled images based on their spatial coverage. The corresponding points identified within the overlapping regions of the retrieved bundled images are transferred to the new images, denoted as T s 1 . Simultaneously, the associated three-dimensional geospatial coordinates and their corresponding covariance matrices are extracted for each transferred point. For non-overlapping regions between the new images and the bundled images, new tie points T n are matched through the Least Squares Matching (LSM) method with subpixel accuracy. The initial three-dimensional geospatial coordinates of these newly identified tie points are determined through forward intersection, using both the image point coordinates and the image RPCs. The initial values of the affine transformation coefficients for image orientation are set to zero. The initial prior covariance information is assigned. Both T s 1 and T n , incorporating their respective prior covariance information, are utilized as observational data. The functional model is constructed based on the rational function model, supplemented by an affine transformation model to compensate for systematic errors. Linear mean square estimator is then used to obtain image orientation parameters, three-dimensional coordinates, and covariance matrices for the new images. At this stage, the posteriori covariance matrix for T s 1 is updated and, subsequently, the new images can be applied to update the bundled images. The new covariance matrix for T s 1 is used to update the existing information of T s 2 , maintaining consistent accuracy with the new bundled images.

3.2. The Theoretical Foundations of the Proposed Merged Method

3.2.1. Corresponding Points Acquisition

In the proposed merged method, corresponding points T s 1 and T n are employed as observational data. Specifically, T s 1 represents the corresponding points located within the overlapping regions of the bundled images, which are subsequently transferred onto the new images. Utilizing the image point coordinates from T s 1 and the RPC coefficients of the bundled images, the longitude and latitude of these points are computed at the mean elevation plane. Subsequently, leveraging the commutated three-dimensional coordinates of these points along with the RPC coefficients of the new images, the approximate positions of the corresponding points on the new images are determined. A target window is opened on the bundled image centered on each point. Simultaneously, a search area is delineated on the new images centered around each approximate corresponding point. Subsequently, within this search area, a smaller search window is established around each pixel. The correlation coefficient between each search window and the target window is calculated. The pixel at the center of the window with the highest correlation coefficient within each search area is selected as the corresponding point. Following this, one adjacent point to the left and one to the right of this corresponding point are chosen, and their correlation coefficients are computed. These three points are then fitted into a correlation curve, and the point corresponding to the peak of this curve is identified as the final corresponding point. This method enables the matching accuracy to reach the sub-pixel level.
T n represents the tie points on the new images that lie outside the overlapping areas of the bundled images, acquired through the LSM technique. Initially, pyramid structures are generated for all images. Subsequently, tie points are identified by distinctive image features on the full-resolution pyramid levels of a chosen master image. The corresponding points on the remaining images are then located by searching within ranges determined by the estimated maximum parallaxes, based on correlation coefficients. The correlation window size is established at 7 × 7 pixels, with a correlation coefficient threshold set at 0.8. Subsequently, the LSM technique is employed to further enhance the matching precision. The LSM matching window is configured to a size of 5 × 5 pixels. This process is executed progressively from the course to the finest level of the image pyramids. On average, a final matching accuracy of 0.1 to 0.2 pixels is attainable for the majority of tie points.

3.2.2. The Mathematics of RFM

By describing the observation errors as an affine transformation of the image point coordinates and incorporating this into the RFM [24], it is possible to compensate for the systematic errors and achieve accurate geo-positioning for the images. The geo-positioning model, which integrates RFM with an additional error correction component, can be expressed as follows:
l + c l , 0 + c l , 1 l + c l , 2 s = N u m L U , V , W D e n L U , V , W L i n e _ S c a l e L i n e _ O f f s + e s , 0 + e s , 1 l + e s , 2 s = N u m s U , V , W D e n s U , V , W S a m p _ S c a l e S a m p _ O f f
where (U, V, W) represent the regularized three-dimensional geographic coordinates of object points. (l, s) represents the image point coordinates. L i n e _ O f f and S a m p O f f are the regularized offsets of the image coordinates; L i n e S c a l e and S a m p S c a l e stand for the scale normalization parameters of the image coordinates. N u m L U , V , W , D e n L U , V , W , N u m s U , V , W and D e n s U , V , W are represented by cubic polynomials, each comprising 20 coefficients, which constitute RPCs. c l , 0 , c l , 1 , c l , 2 , e s , 0 , e s , 1 and e s , 2 represent the affine transformation parameters, which also serve as the image orientation parameters to be determined for each individual image.
By applying the Taylor series expansion to linearize Equation (1) and omitting the second-order terms, the error equation is obtained, demonstrated as follows:
v = H X L
where v represents the error vector, X denotes the correction vector for ground point coordinates and orientation parameters, H is the coefficient matrix, and L corresponds to the observation vector of image coordinates.

3.2.3. Basic Principles of the Kalman Filter

The fundamental principle of the Kalman filter [22] lies in utilizing the gain to optimize the state estimation. The Kalman gain represents the weight between the model prediction error and the actual measurement error (the Kalman gain ranges from 0 to 1). When the prediction error is zero, the state value is entirely equal to the predicted value; when the prediction error is 1, the state value is entirely equal to the actual measurement value. The Kalman gain is calculated as follows:
G = P k H T H P k H T + R 1
where G stands for the Kalman gain; R represents a prior covariance matrix of the observation error; P k represents a prior covariance matrix of the unknown vector.
A linear mean square estimator is applied to acquire the optimal estimates of the unknowns, shown as follows:
X ^ = G L
where X ^ is the optimal estimates of the unknown vector.
A posteriori error covariance matrix P k ^ is shown as follows:
P k ^ = I G H P k

3.2.4. The Proposed Merged Method

The proposed merged method consists of two distinct steps of orientation and update. During the orientation step, corresponding points T s 1 and T n are employed as observational data. Priori covariance information of T s 1 , T n and new image orientations are employed to geo-position the new images using a linear mean square estimator through Kalman gain without using GCPs, and the corresponding posterior information can be obtained. During the update step, the historical information of the bundled images is updated with posterior information.
(1)
The first step of orientation
The vector X is composed of X 1 and X 2 , where X 1 stands for the unknown vector to be estimated and X 2 stands for the information of the bundled images to be updated. This decomposition can be expressed as follows:
X = X 1 , X 2 T X = X n e w , X s 1 , X n , X B , X s 2 T X 1 = X n e w , X s 1 , X n T X 2 = X B , X s 2 T
where X n e w represents the correction for the orientation parameters of the new images; X s 1 denotes the correction for the ground point coordinates of T s 1 on the new images; X n is the correction for the ground point coordinates of T n ; X B is the correction for the orientation parameters of the the bundled images; X s 2 stands for the correction for the ground point coordinates of T s 2 .
The corresponding covariance matrix P is defined as follows:
P = P 11 P 12 P 21 P 22
where P 11 = P n e w P s 1 P n , P = P B P s 2 and P 12 = P 21 T . P 12 and P 21 are the covariance matrices of T s 1 , extracted from the bundled images. P n e w and P n stand for covariance matrices of new image orientations and T n , which need to be predefined based on the image metadata. P s 2 , P s 1 and P B are the covariance matrices of T s 2 and T s 1 and the orientation parameters of the bundled images.
According to Equation (3), the Kalman gain can be calculated as follows:
G 1 = P 11 H T H P 11 H T + R 1
According to Equation (4), the optimal estimator of X 1 can be calculated as follows:
X 1 ^ = G 1 L = P 11 H T H P 11 H T + R 1 L
where X 1 ^ stands for the optimal estimator of X 1 . The posterior covariance matrix P 11 ^ is calculated using Equation (5):
P 11 ^ = I G 1 H P 11 = P 11 P 11 H T H P 11 H T + R 1 H P 11
The Kalman gain is updated using P 11 ^ , and the formula is shown as follows:
G 1 ^ = P 11 ^ H T H P 11 ^ H T + R 1
The updated G 1 ^ is then used to update the covariance matrix P 12 , as shown in the following formula:
P 12 ^ = I G 1 ^ H P 12 = P 12 P 11 ^ H T H P 11 ^ H T + R 1 H P 12
Until now, X 1 ^ , P 11 ^ and P 12 ^ have been determined by the Kalman filter without using GCPs.
(2)
The second step of updating
After the orientation step, the orientation information of bundled images can be updated. The updated vector X ^ can be defined as follows:
X ^ = X n e w ^ , X s 1 ^ , X n ^ , X B , X s 2 T
P = P n e w ^ P s 1 ^ P n ^ P B P s 2
where X n e w ^ , X s 1 ^ and X n ^ , constituting X 1 ^ , represent the posterior estimates from the orientation step, accompanied by their respective posterior covariance matrices P n e w ^ , P s 1 ^ and P n ^ .
The Kalman filter can be applied to update the bundled images, in which the Kalman gain can be calculated as follows:
G 2 = P 12 ^ H T H P 11 ^ H T + R 1
X 2 and P 22 are updated through Equations (11) and (13), shown as follows:
X 2 ^ = G 2 L = P 12 ^ H T H P 11 ^ H T + R 1 L
P 22 ^ = I G 2 ^ H P 22 = P 22 P 12 ^ H T H P 12 ^ H T + R 1 H P 22
Following these computations, the historical spatial triangulation outcome of the bundled images is updated.
(3)
Accuracy assessment
Check points are used for external accuracy assessment in the object space. The nominal object coordinates of these check points are calculated using bundled images. The Root Mean Square Error (RMSE) in the object space is computed based on the discrepancies between the truth values and nominal values of the check points, shown in Equation (18):
μ X = X t X c 2 r μ Y = Y t Y c 2 r μ Z = Z t Z c 2 r μ P = μ X 2 + μ Y 2 + μ Z 2
where μ X , μ Y and μ Z represent the RMSE of check points for the corresponding three directions; r refers to the number of check points; X t , Y t and Z t are the truth coordinates of check points; X c , Y c and Z c are the nominal coordinates of check points. μ P is used to state the accuracy in the object space in the following discussions.

4. Data

This study employed two datasets with extensive overlap for experimental validation, each covering distinct regions. The first dataset comprised homologous IKONOS imagery, covering the Hobart region in Australia and exhibiting sixfold overlap. The second experimental dataset was composed of TH-1 and ZY-3 multi-source imagery, exhibiting an elevenfold overlap and covering the Dengfeng region in Henan Province.

4.1. Homologous IKONOS Datasets

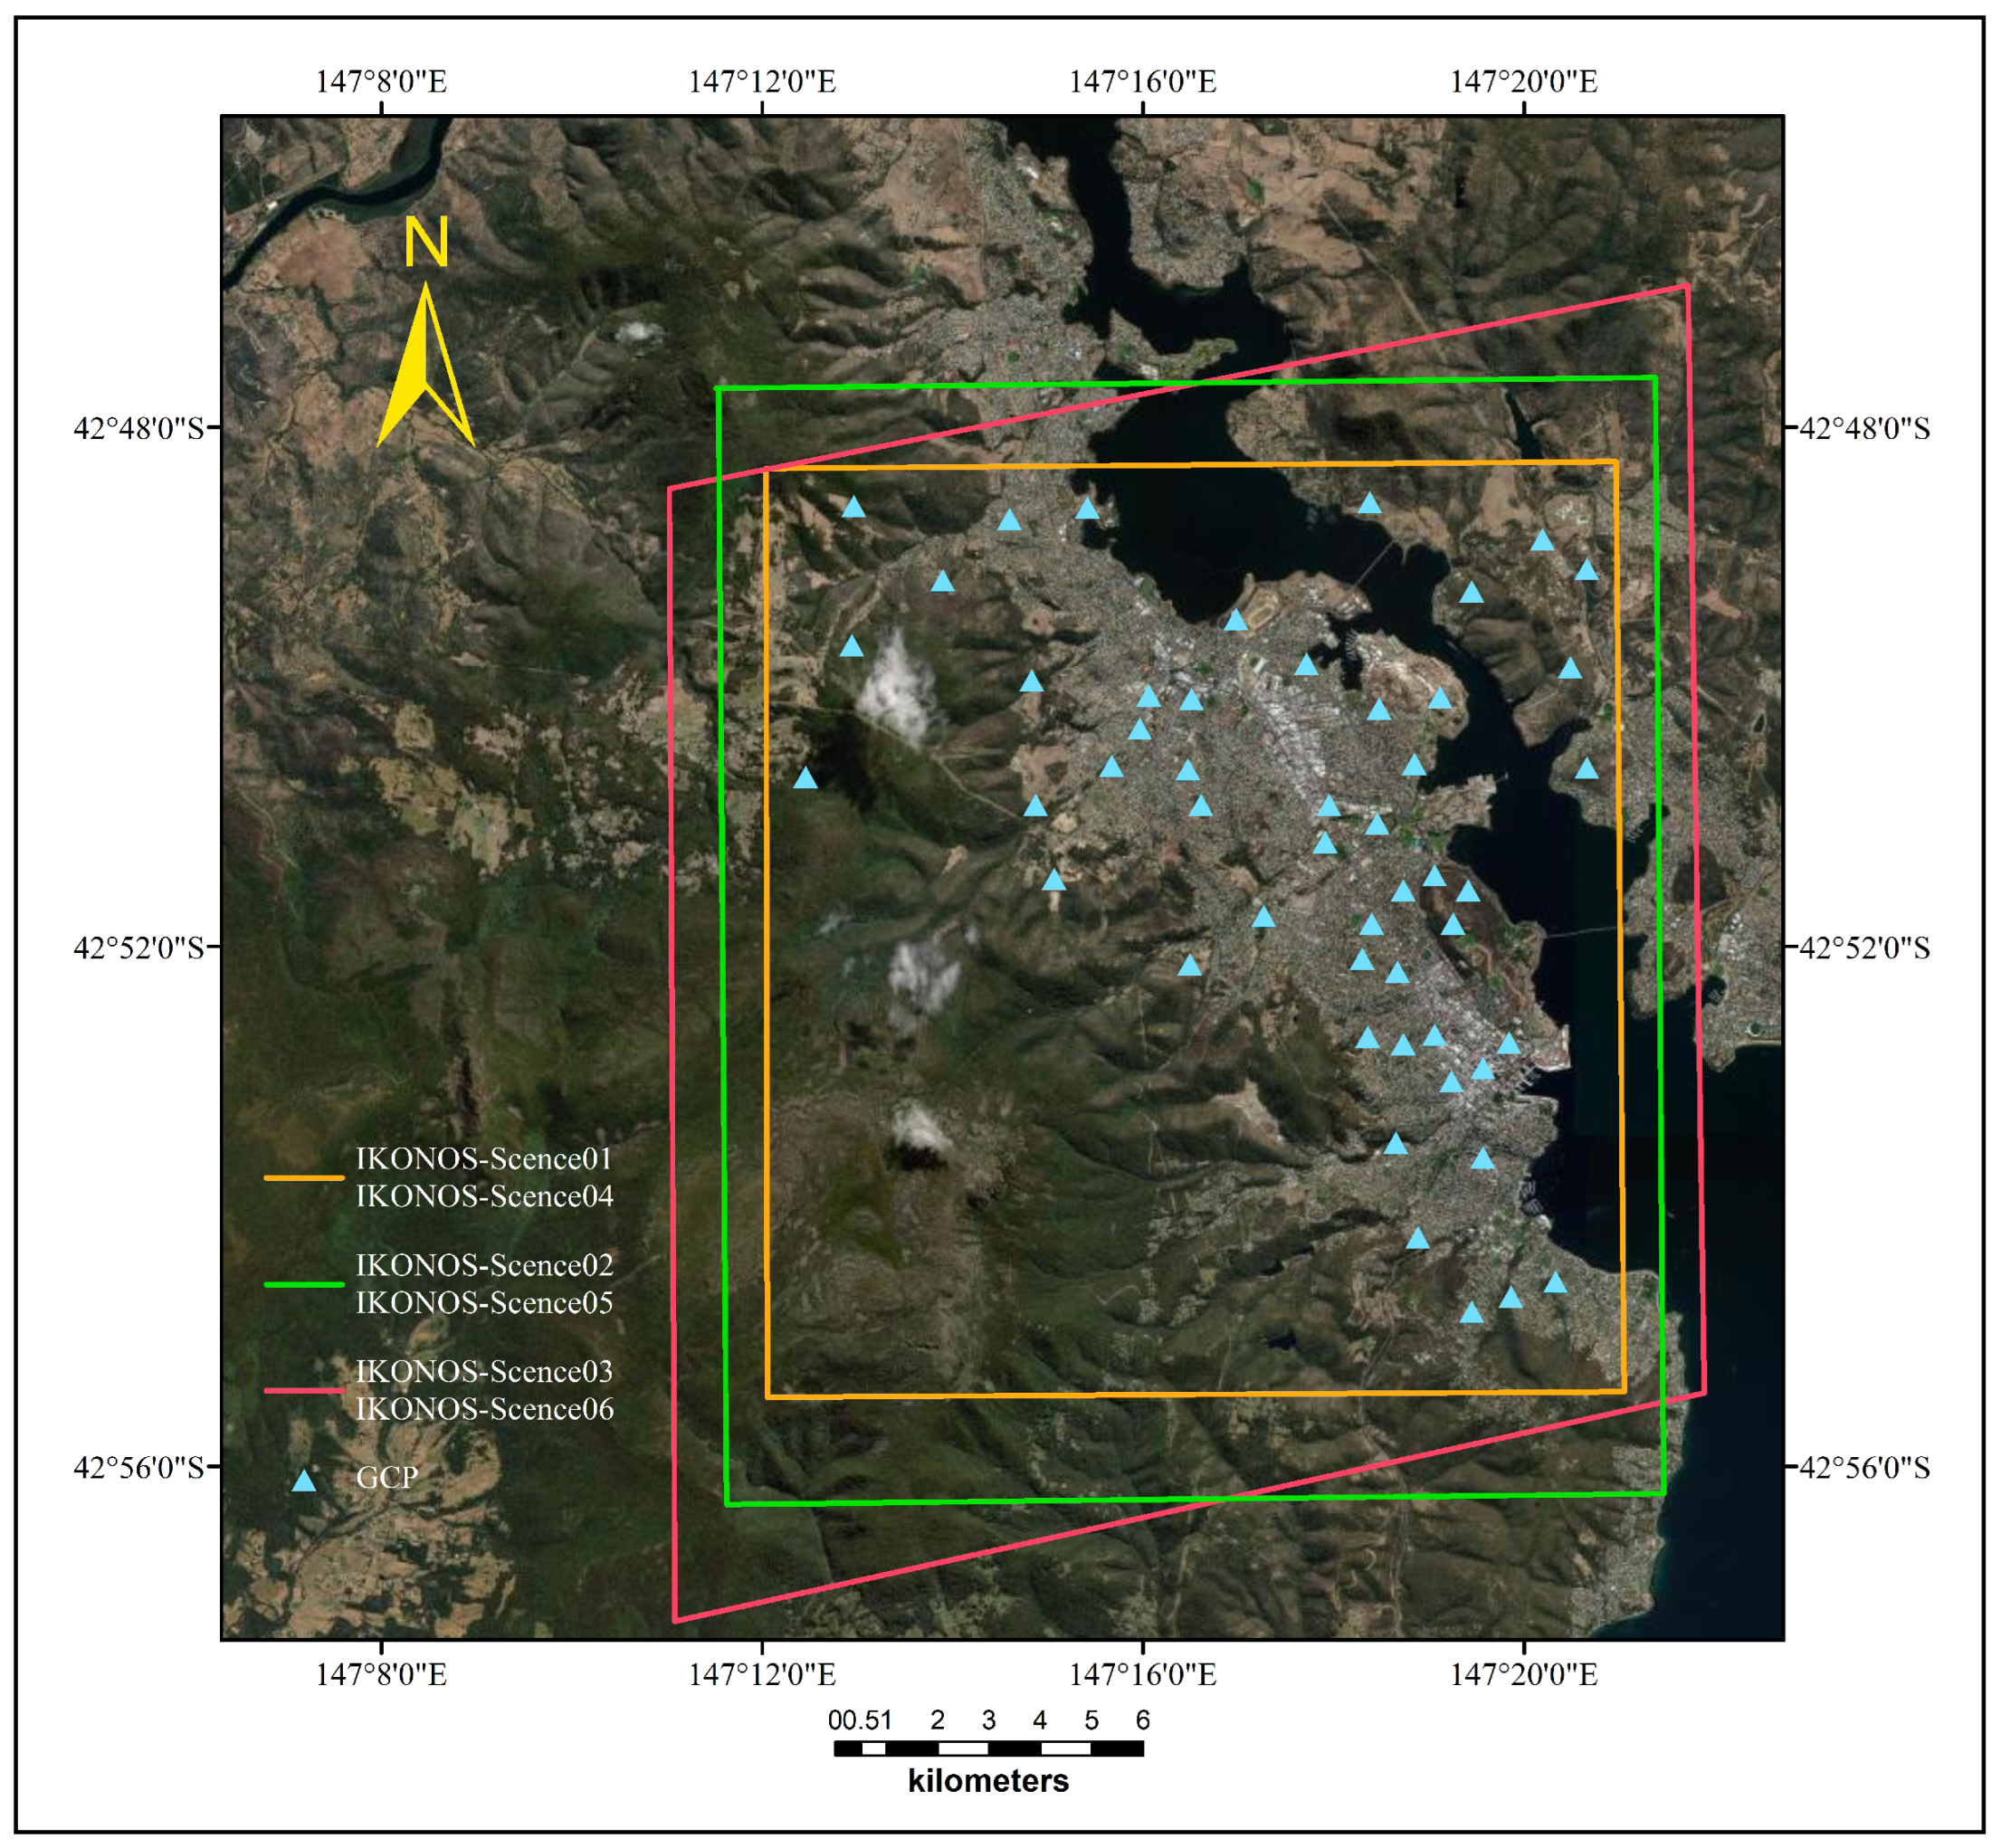
Sixfold overlap homologous IKONOS images from Hobart, Australia, were utilized to further validate the proposed merged method. IKONOS satellite data can be used for 1:10,000-scale topographic mapping. These images, obtained from the International Society for Photogrammetry and Remote Sensing (https://www.isprs.org/resources/datasets/sample-datasets/ikonos_hobart/default.aspx, accessed on 15 September 2025), were captured from three distinct viewing angles. Specifically, IKONOS-Scene01, IKONOS-Scene02 and IKONOS-Scene03 are panchromatic images with a resolution of 1 m, whereas IKONOS-Scene04, IKONOS-Scene05 and IKONOS-Scene06 are multispectral images with a resolution of 4 m. The multispectral images were acquired concurrently with their panchromatic counterparts from identical viewpoints. These images were organized into three distinct sets of stereo pairs. The first image set consisted of IKONOS-Scene01 and IKONOS-Scene02. The second image set included IKONOS-Scene03 and IKONOS-Scene04, while the third image set was composed of IKONOS-Scene05 and IKONOS-Scene06. This assignment primarily considered multiple perspectives to achieve a stereoscopic effect, while also accounting for variations in resolution and positioning accuracy. Detailed information regarding the sixfold overlap homologous IKONOS images for Hobart, Australia, is presented in Table 1. Fifty GCPs, measured by the Department of Geomatics at the University of Melbourne, were utilized for accuracy assessment. Figure 2 demonstrates the spatial coverage of the six IKONOS images, along with the distribution of the GCPs.

4.2. Heterogeneous TH-1 and ZY-3 Datasets

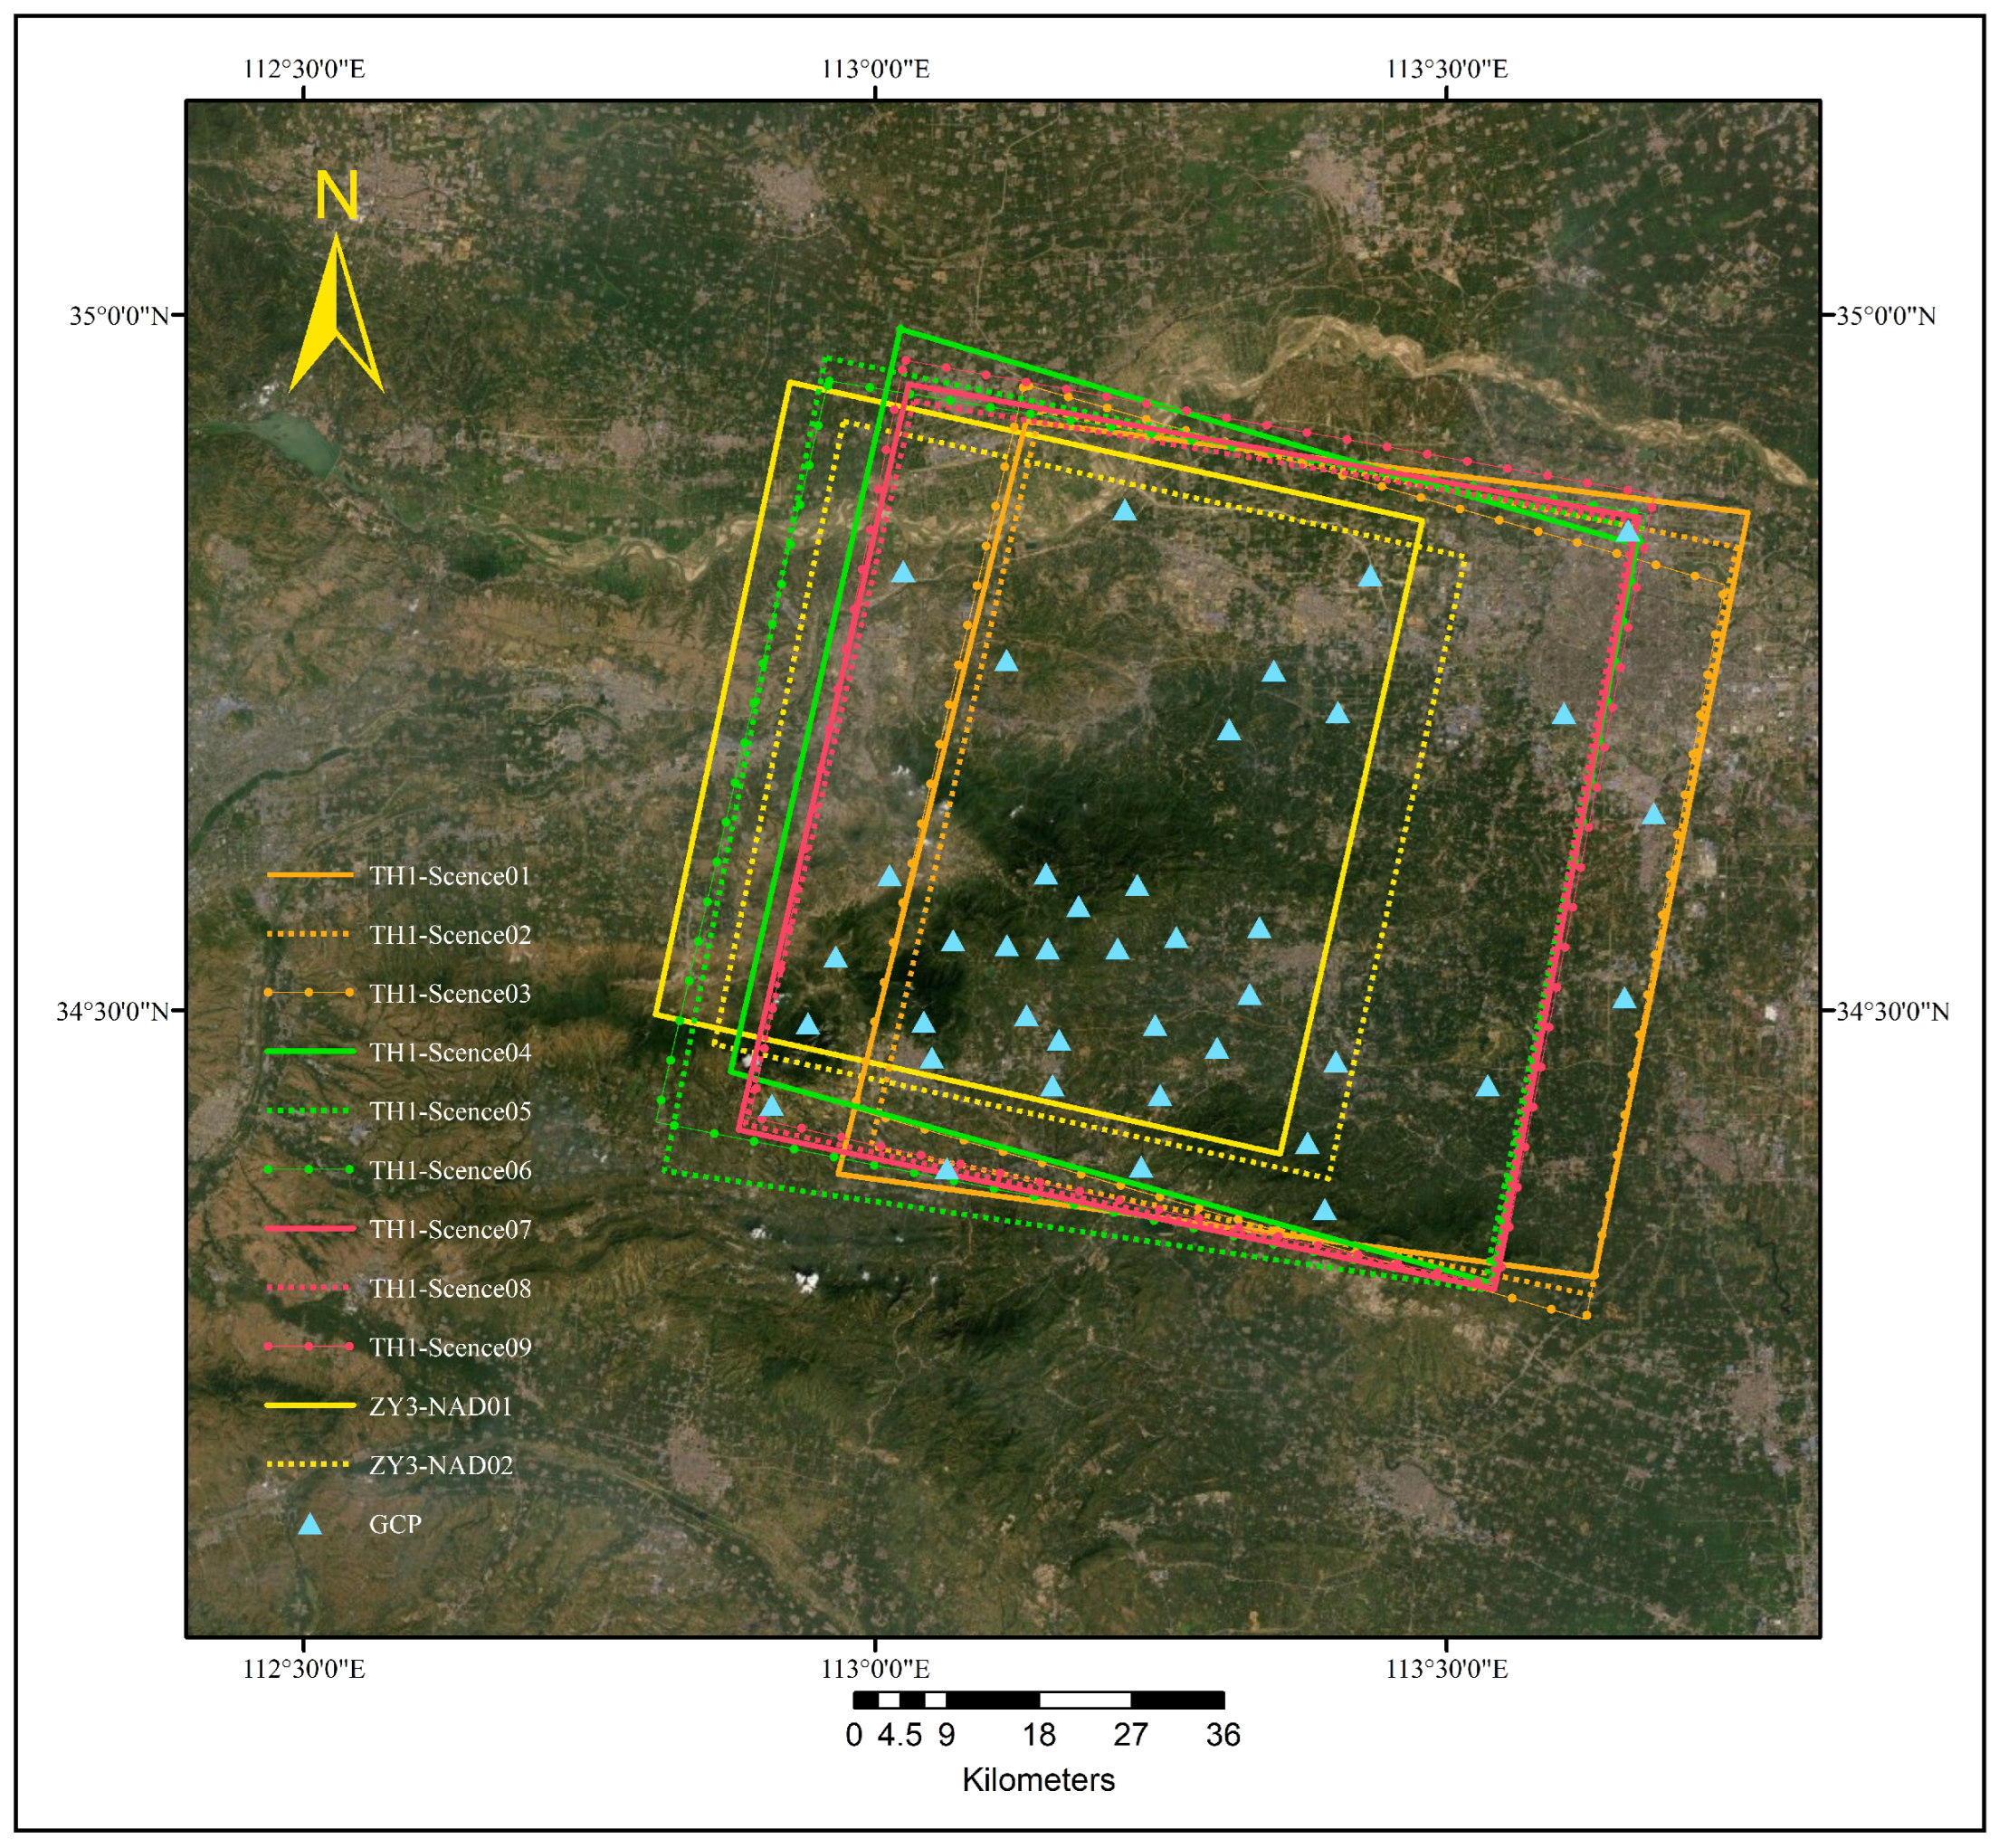
The elevenfold overlap heterogeneous images from Chinese stereo mapping satellites TH-1 and ZY-3, captured in the Dengfeng region of Henan Province, were utilized for experimental validation. These satellites are designed for 1:50,000-scale topographic mapping. These images were divided into four sets. The first image set comprised TH1-Scene01, TH1-Scene02 and TH1-Scene03, acquired on 27 March 2013. The second image set included TH1-Scene04, TH1-Scene05 and TH1-Scene06, captured on 15 June 2013. The third image set consisted of TH1-Scene07, TH1-Scene08 and TH1-Scene09, obtained on 30 August 2013. The fourth image set contained ZY3-NAD01 and ZY3-NAD02, acquired on 3 November 2013 and 3 February 2012, respectively. The TH-1 images were acquired by three-line scanning sensors, providing a resolution of 5 m per pixel. Each image set comprised three images, simultaneously captured by TH-1’s forward, nadir and backward sensors. The ZY-3 images were acquired by the nadir sensor, offering a resolution of 2.1 m per pixel. The detailed parameters of these eleven images are listed in Table 2. A total of forty GCPs were used for geo-positioning and accuracy assessments. These GCPs were initially collected on high-resolution aerial images and subsequently measured using differential GPS equipment, achieving measurement accuracies at the centimeter level. Figure 3 depicts the coverage area of the TH-1 and ZY-3 images, along with the spatial distribution of the GCPs.

5. Experimental Analysis and Discussion

Comparative experiments with homologous IKONOS datasets and heterogeneous TH-1 and ZY-3 datasets were designed to evaluate accuracies using the traditional method, the direct method and the proposed merged method. The traditional method applies GCPs to compensate for systematic errors and can achieve optimal geo-positioning accuracy, which is often employed as a benchmark for evaluating new geo-positioning methods. The direct method is proposed by the authors, taking bundled images as a substitute for GCPs to perform the combined block adjustment for geo-positioning new images. This method involves observation equations for bundled images, giving an additional term to the normal equation matrix related to the bundled images, thereby improving the normal equation condition and ensuring solution stability. The proposed merged method in this paper is an improvement upon the direct method as it does not require observation equations for bundled images, leveraging a Kalman filter to integrate the new image observations with their corresponding historical covariance information extracted from bundled images; then, the previous bundled images can be updated using posterior covariance information.

5.1. Heterogeneous TH-1 and ZY-3 Datasets

5.1.1. Comparative Experiments

Three experiments were executed using heterogeneous TH-1 and ZY-3 datasets, with the first image set acting as the bundled images for both direct and merged method implementations. The quantitative accuracy evaluation results were measured in terms of RMSE in meters using all the geo-positioned images.
In the first experiment, comparative analyses were conducted using the first two TH-1 image sets. The corresponding results are summarized in Table 3.
As shown in Table 3, the traditional method achieved planimetric and vertical accuracies of 7.97 m and 4.29 m, respectively. The direct method demonstrated planimetric and vertical accuracies of 7.88 m and 4.21 m, respectively. The proposed merged method achieved accuracy of 8.49 m in the planimetric direction and 3.20 m in the vertical direction. The proposed merged method demonstrated lower planimetric accuracy (by <1 m) compared to the other two methods, while exhibiting vertical accuracy with an improvement of approximately 1 m. The discrepancies complied with the standardized accuracy requirements for 1:50,000-scale topographic mapping, where the maximum permissible errors are 12 m planimetrically and 6 m vertically [25].
In the second experiment, three TH-1 image sets were utilized for accuracy evaluation, employing three distinct methodologies: the traditional method, the direct method and the merged method. Two groups of experiments were performed using the proposed merged method. In the first group, the second TH-1 set was geo-positioned and used to update the first set of bundled images through the merged method; then, the third TH-1 set was geo-positioned and updated for the second image set using the same procedure. The second group was formed by sequentially integrating the third TH-1 set, followed by the second TH-1 set. The experimental results are shown in Table 4.
The traditional method achieved planimetric and vertical geo-positioning accuracies of 7.88 m and 4.72 m, respectively. The direct method achieved planimetric and vertical accuracies of 7.75 m and 4.61 m, respectively. The first group using the merged method demonstrated planimetric and vertical positional accuracies of 8.19 m and 3.12 m, respectively. The second group using the merged method presented planimetric and vertical accuracies of 7.69 m and 3.07 m, respectively. The merged method achieved a slight accuracy difference between the two groups of experiments in both horizontal and vertical directions, within 0.5 m. Compared to the traditional method and the direct method, the merged method achieved comparable planimetric accuracy and surpassed the previous two methods in elevation accuracy by 1.5 m. All three approaches met the precision requirements for 1:50,000-scale topographic mapping applications. A comparative analysis of Table 3 and Table 4 reveals that the proposed merged method, when applied to three image sets, yielded accuracy levels on par with those achieved using the first two image sets. The increase in image quantity did not lead to improved accuracy.
In the third experiment, all four sets of TH-1 and ZY-3 satellites were employed for accuracy assessment through the implementation of three methodologies: the traditional method, the direct method and the merged method. Three groups of experiments were conducted using the proposed merged method. The first group sequentially integrated the second TH-1 set, the third TH-1 set and the fourth ZY-3 set. In the second group, the integration sequence was altered to incorporate the third, second and fourth sets, respectively. The third group executed the orientation and update process following the sequence of the third, fourth and second image sets. The results are shown in Table 5.
The traditional method demonstrated planimetric and vertical geo-positioning accuracies of 8.00 m and 5.19 m, respectively. The direct method acquired accuracies of 7.73 m and 4.58 m, respectively, using the second, third and fourth new image sets along with the first bundled set. The first group using the merge method resulted in planimetric and vertical geo-positioning accuracies of 8.22 m and 3.43 m, respectively. The second group yielded planimetric and vertical geo-positioning accuracies of 6.72 m and 3.12 m, respectively. The third group achieved accuracies of 7.39 m and 3.18 m in the planimetric and vertical dimensions, respectively. The proposed merged method achieved variations in accuracy across the three groups of experiments utilizing the four sets of images, within 0.31–1.5 m. Compared to the traditional method and the direct method, the propose merged method improved elevation accuracy by approximately 1 m, while maintaining comparable accuracy in the planimetric direction. All three approaches met the precision requirements for 1:50,000-scale topographic mapping applications. As can be seen from Table 3, Table 4 and Table 5, the proposed merged method achieved similar accuracy levels across the various experiments with different image quantities.

5.1.2. Analysis and Discussion

Meanwhile, three experiments were conducted using the proposed merged method with TH-1 and ZY-3 data. In these experiments, the first image set was treated as the bundled images, while the order of new image geo-positioning and updating was varied. In the first experiment, the second image set was geo-positioned and used to update the bundled images using the proposed merged method. The third and fourth sets were subsequently added in the same manner. In the second experiment, the integration and update order were altered to follow the sequence of the third, second and fourth sets. In the third experiment, the third image set, the fourth set and the second image set were sequentially geo-positioned and integrated into the bundled images.
(1)
The first experiment with the proposed merged method
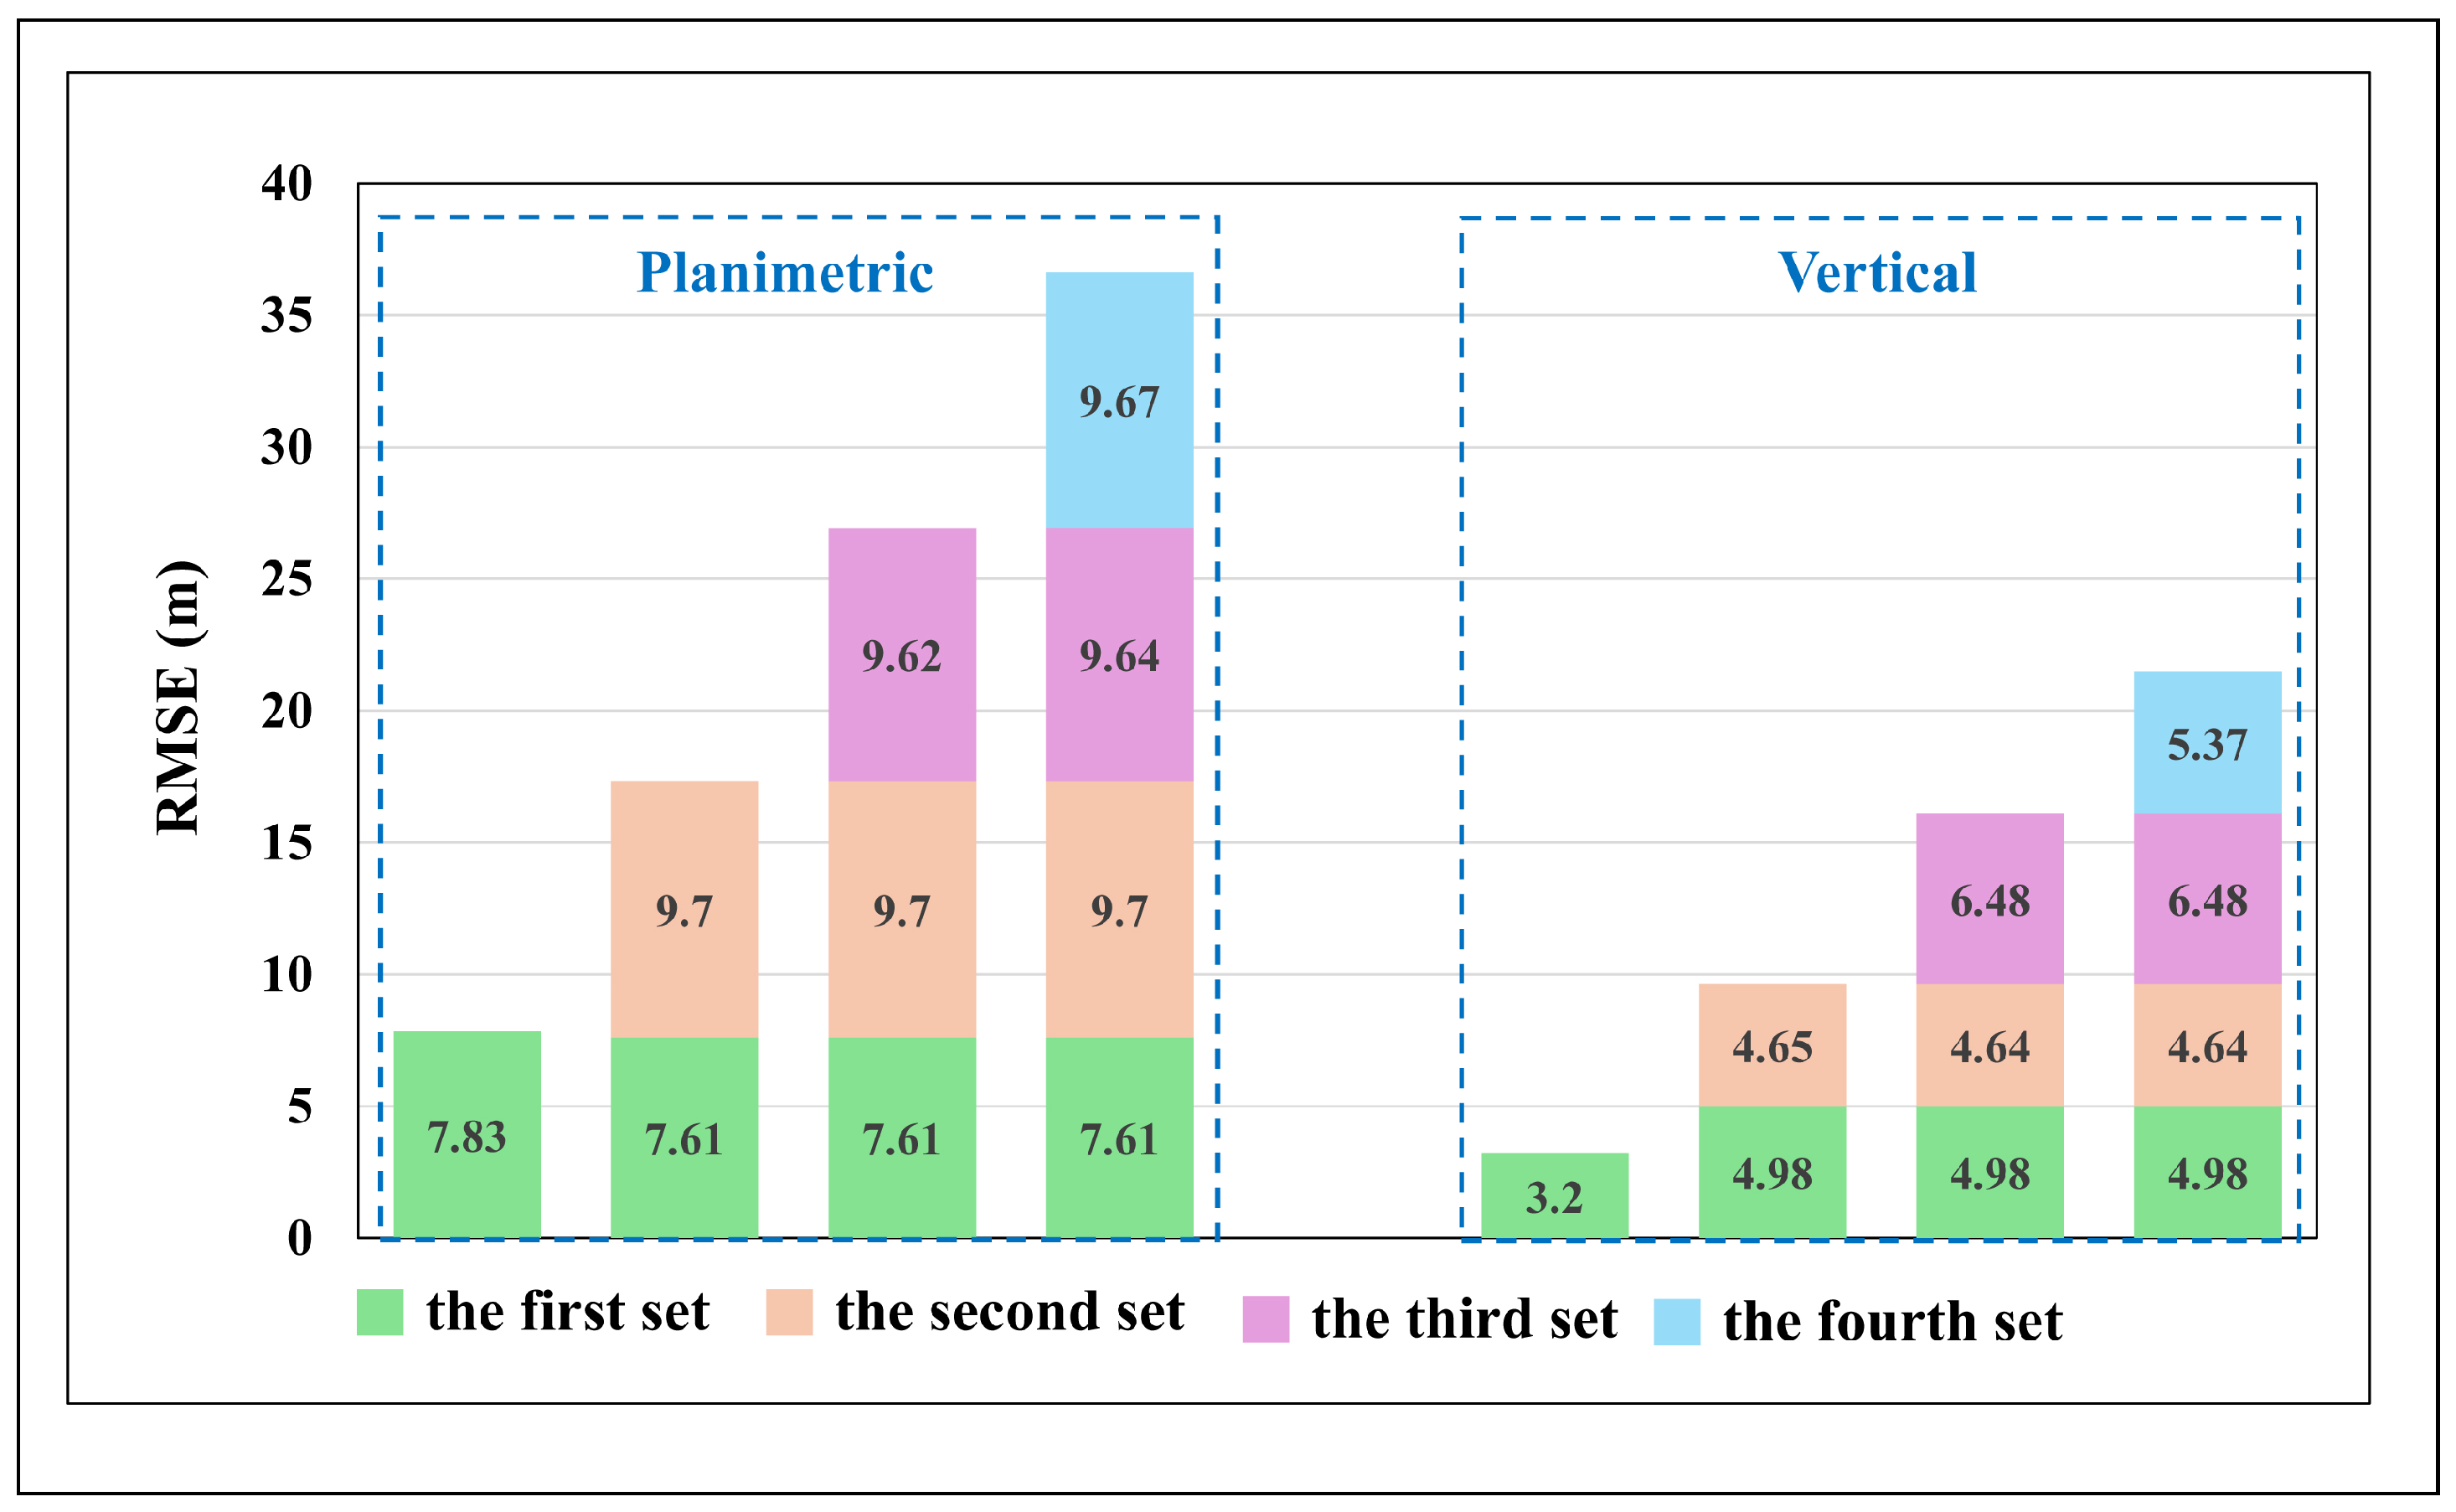
In the first experiment, the first bundled image set exhibited accuracies of 7.83 m in the planimetric direction and 3.20 m in the vertical direction. Using the proposed merged method, the second set of TH-1 images achieved planimetric and vertical accuracies of 9.70 m and 4.65 m, respectively (Figure 4). This image set was then used to update the first bundled image set, resulting in revised geo-positioning accuracies of 7.61 m and 4.98 m in the planimetric and vertical directions, respectively. The third set of TH-1 images was then geo-positioned using the updated images, achieving planimetric and vertical accuracies of 9.62 m and 6.48 m, respectively. Subsequent updating further improved the geo-positioning accuracies of the second bundled image set, which were revised to 9.70 m and 4.64 m in the planimetric and vertical directions, respectively. The fourth set of ZY-3 images was then geo-positioned, achieving accuracies of 9.67 m and 5.37 m, respectively. After updating, the geo-positioning accuracies of the third bundled image set were revised to 9.64 m and 6.48 m in the planimetric and vertical directions, respectively.
(2)
The second experiment with the proposed merged method
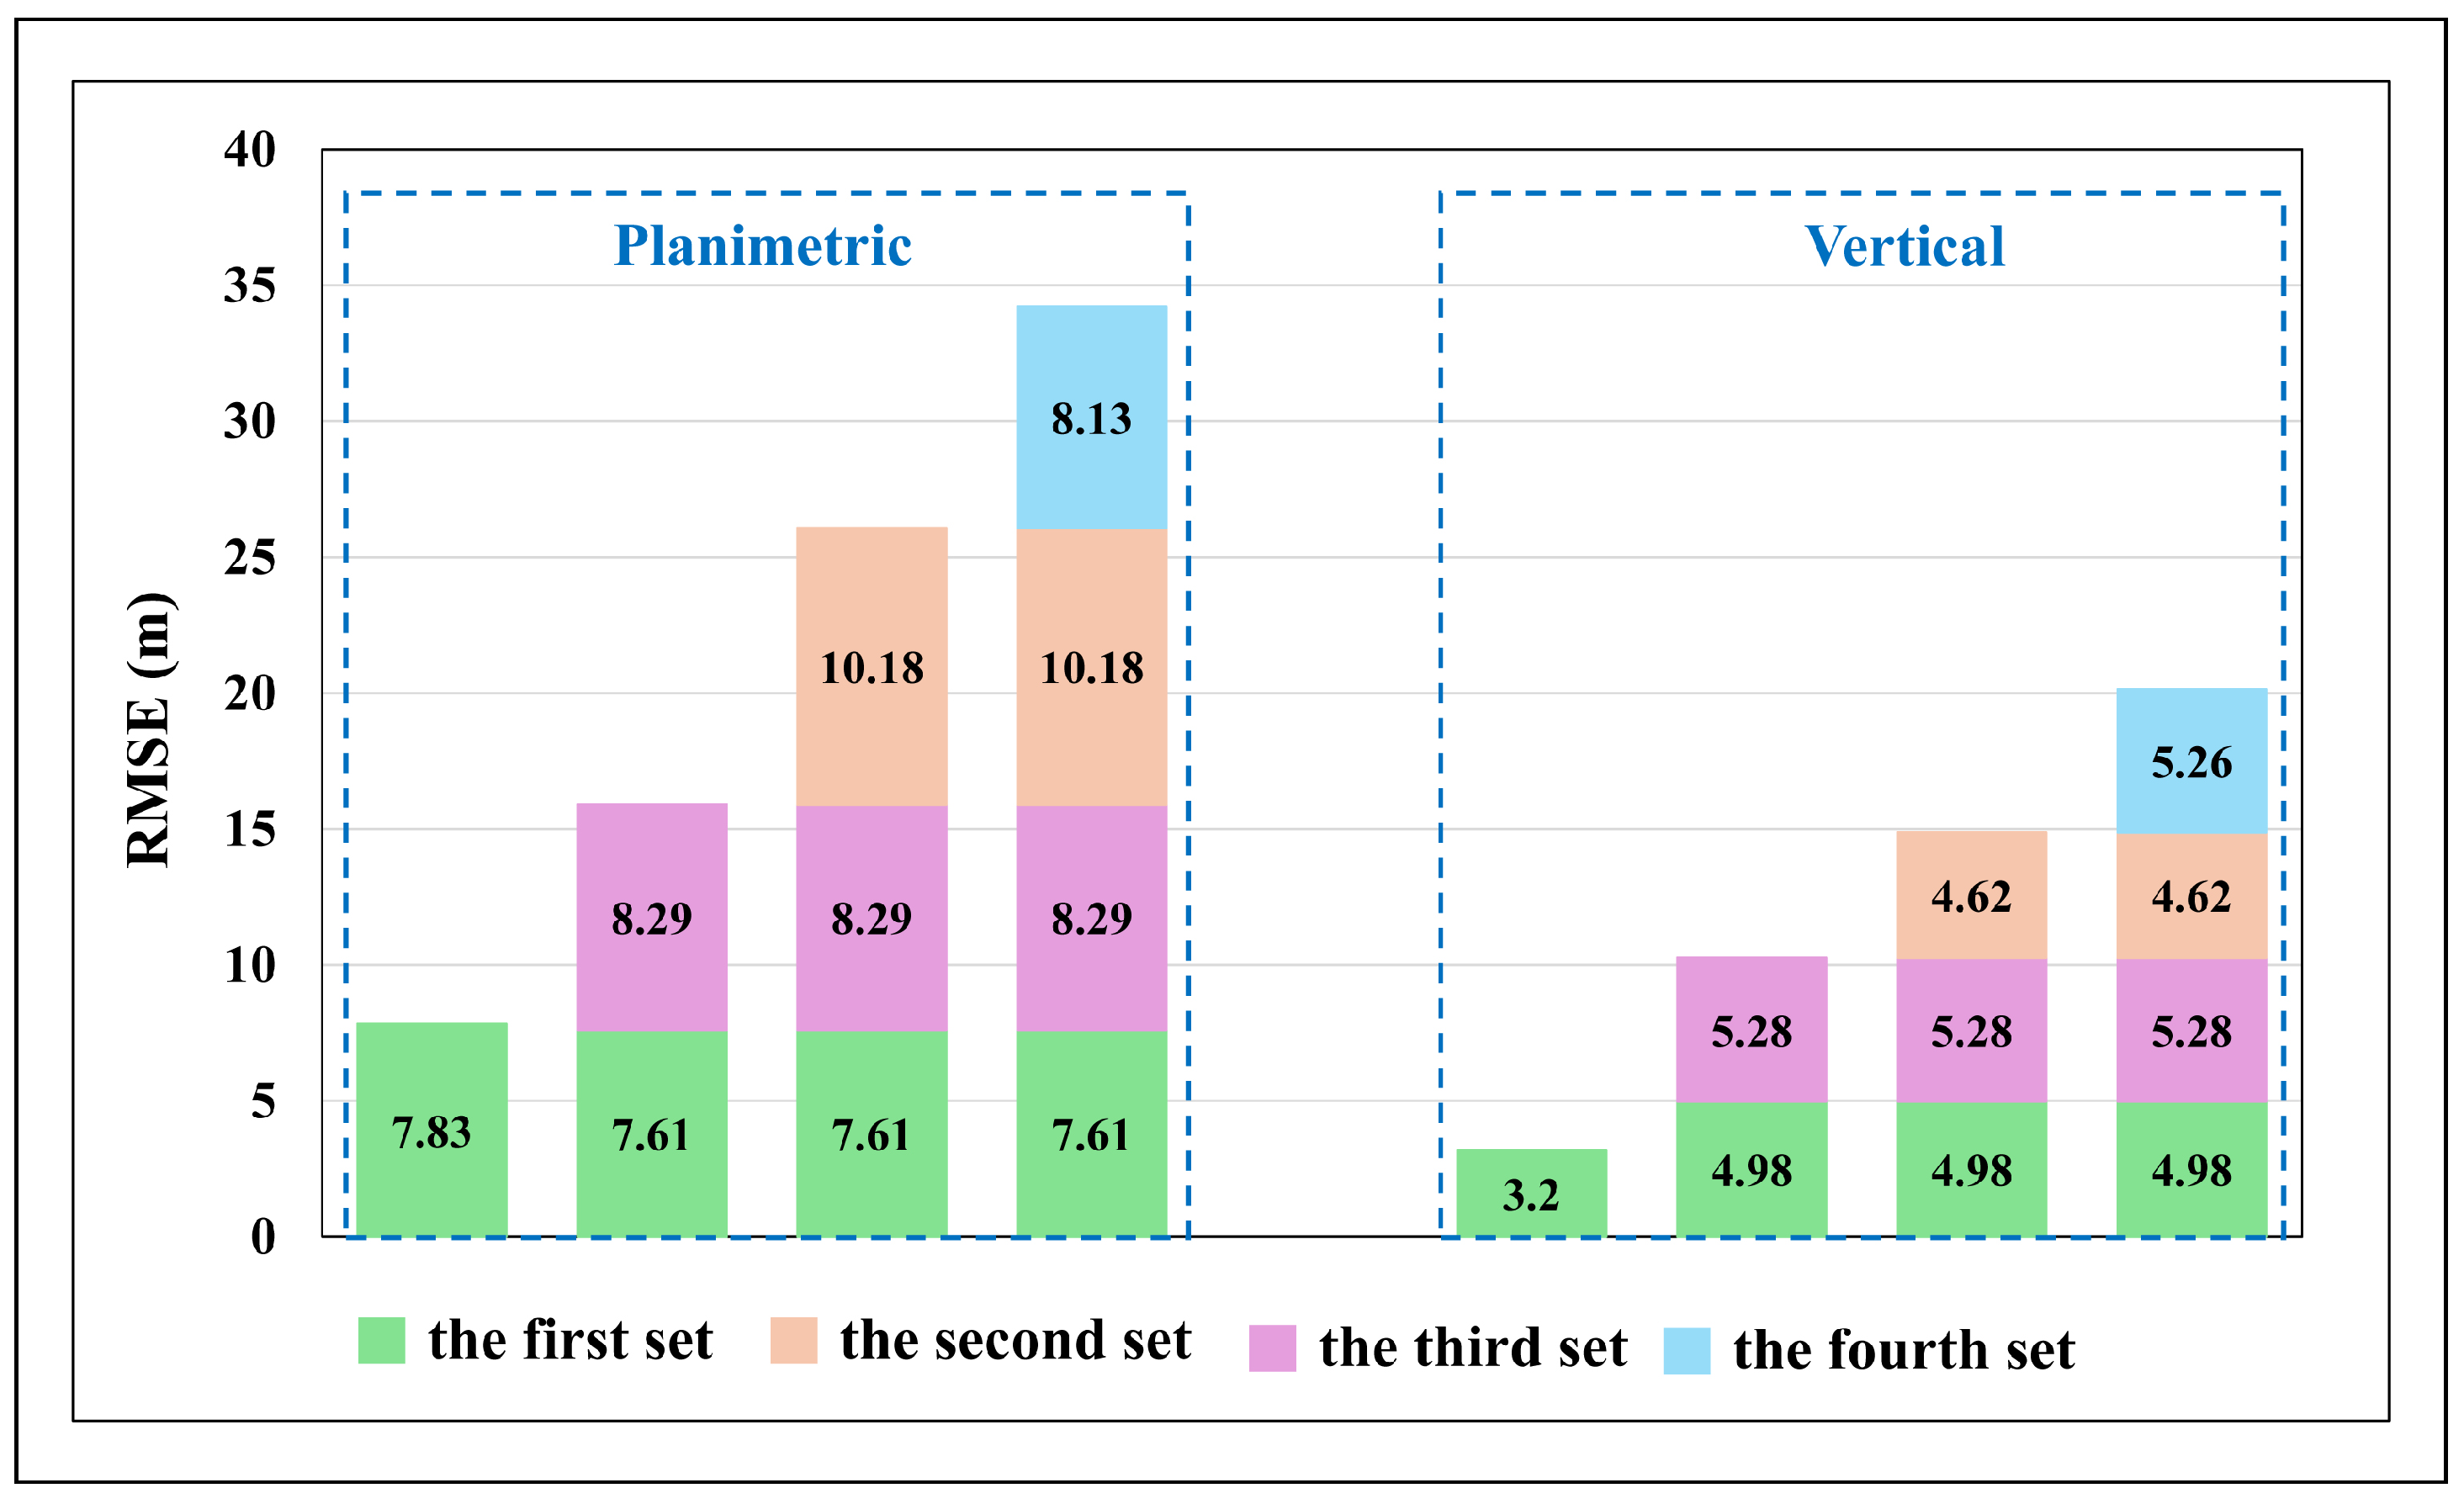
As shown in Figure 5, the experimental results indicated that the third set of TH-1 images achieved planimetric and vertical accuracies of 8.29 m and 5.28 m, respectively, using the proposed merged method. Additionally, the accuracies of the first bundled image set were updated to 7.61 m and 4.98 m in the planimetric and vertical directions, respectively. Following the integration of the third image set, the second set was geo-positioned using the updated bundled images, achieving planimetric and vertical accuracies of 10.18 m and 4.62 m, respectively. Subsequently, the fourth set of ZY-3 images was geo-positioned, attaining accuracies of 8.13 m and 5.26 m, respectively.
(3)
The second experiment with the proposed merged method
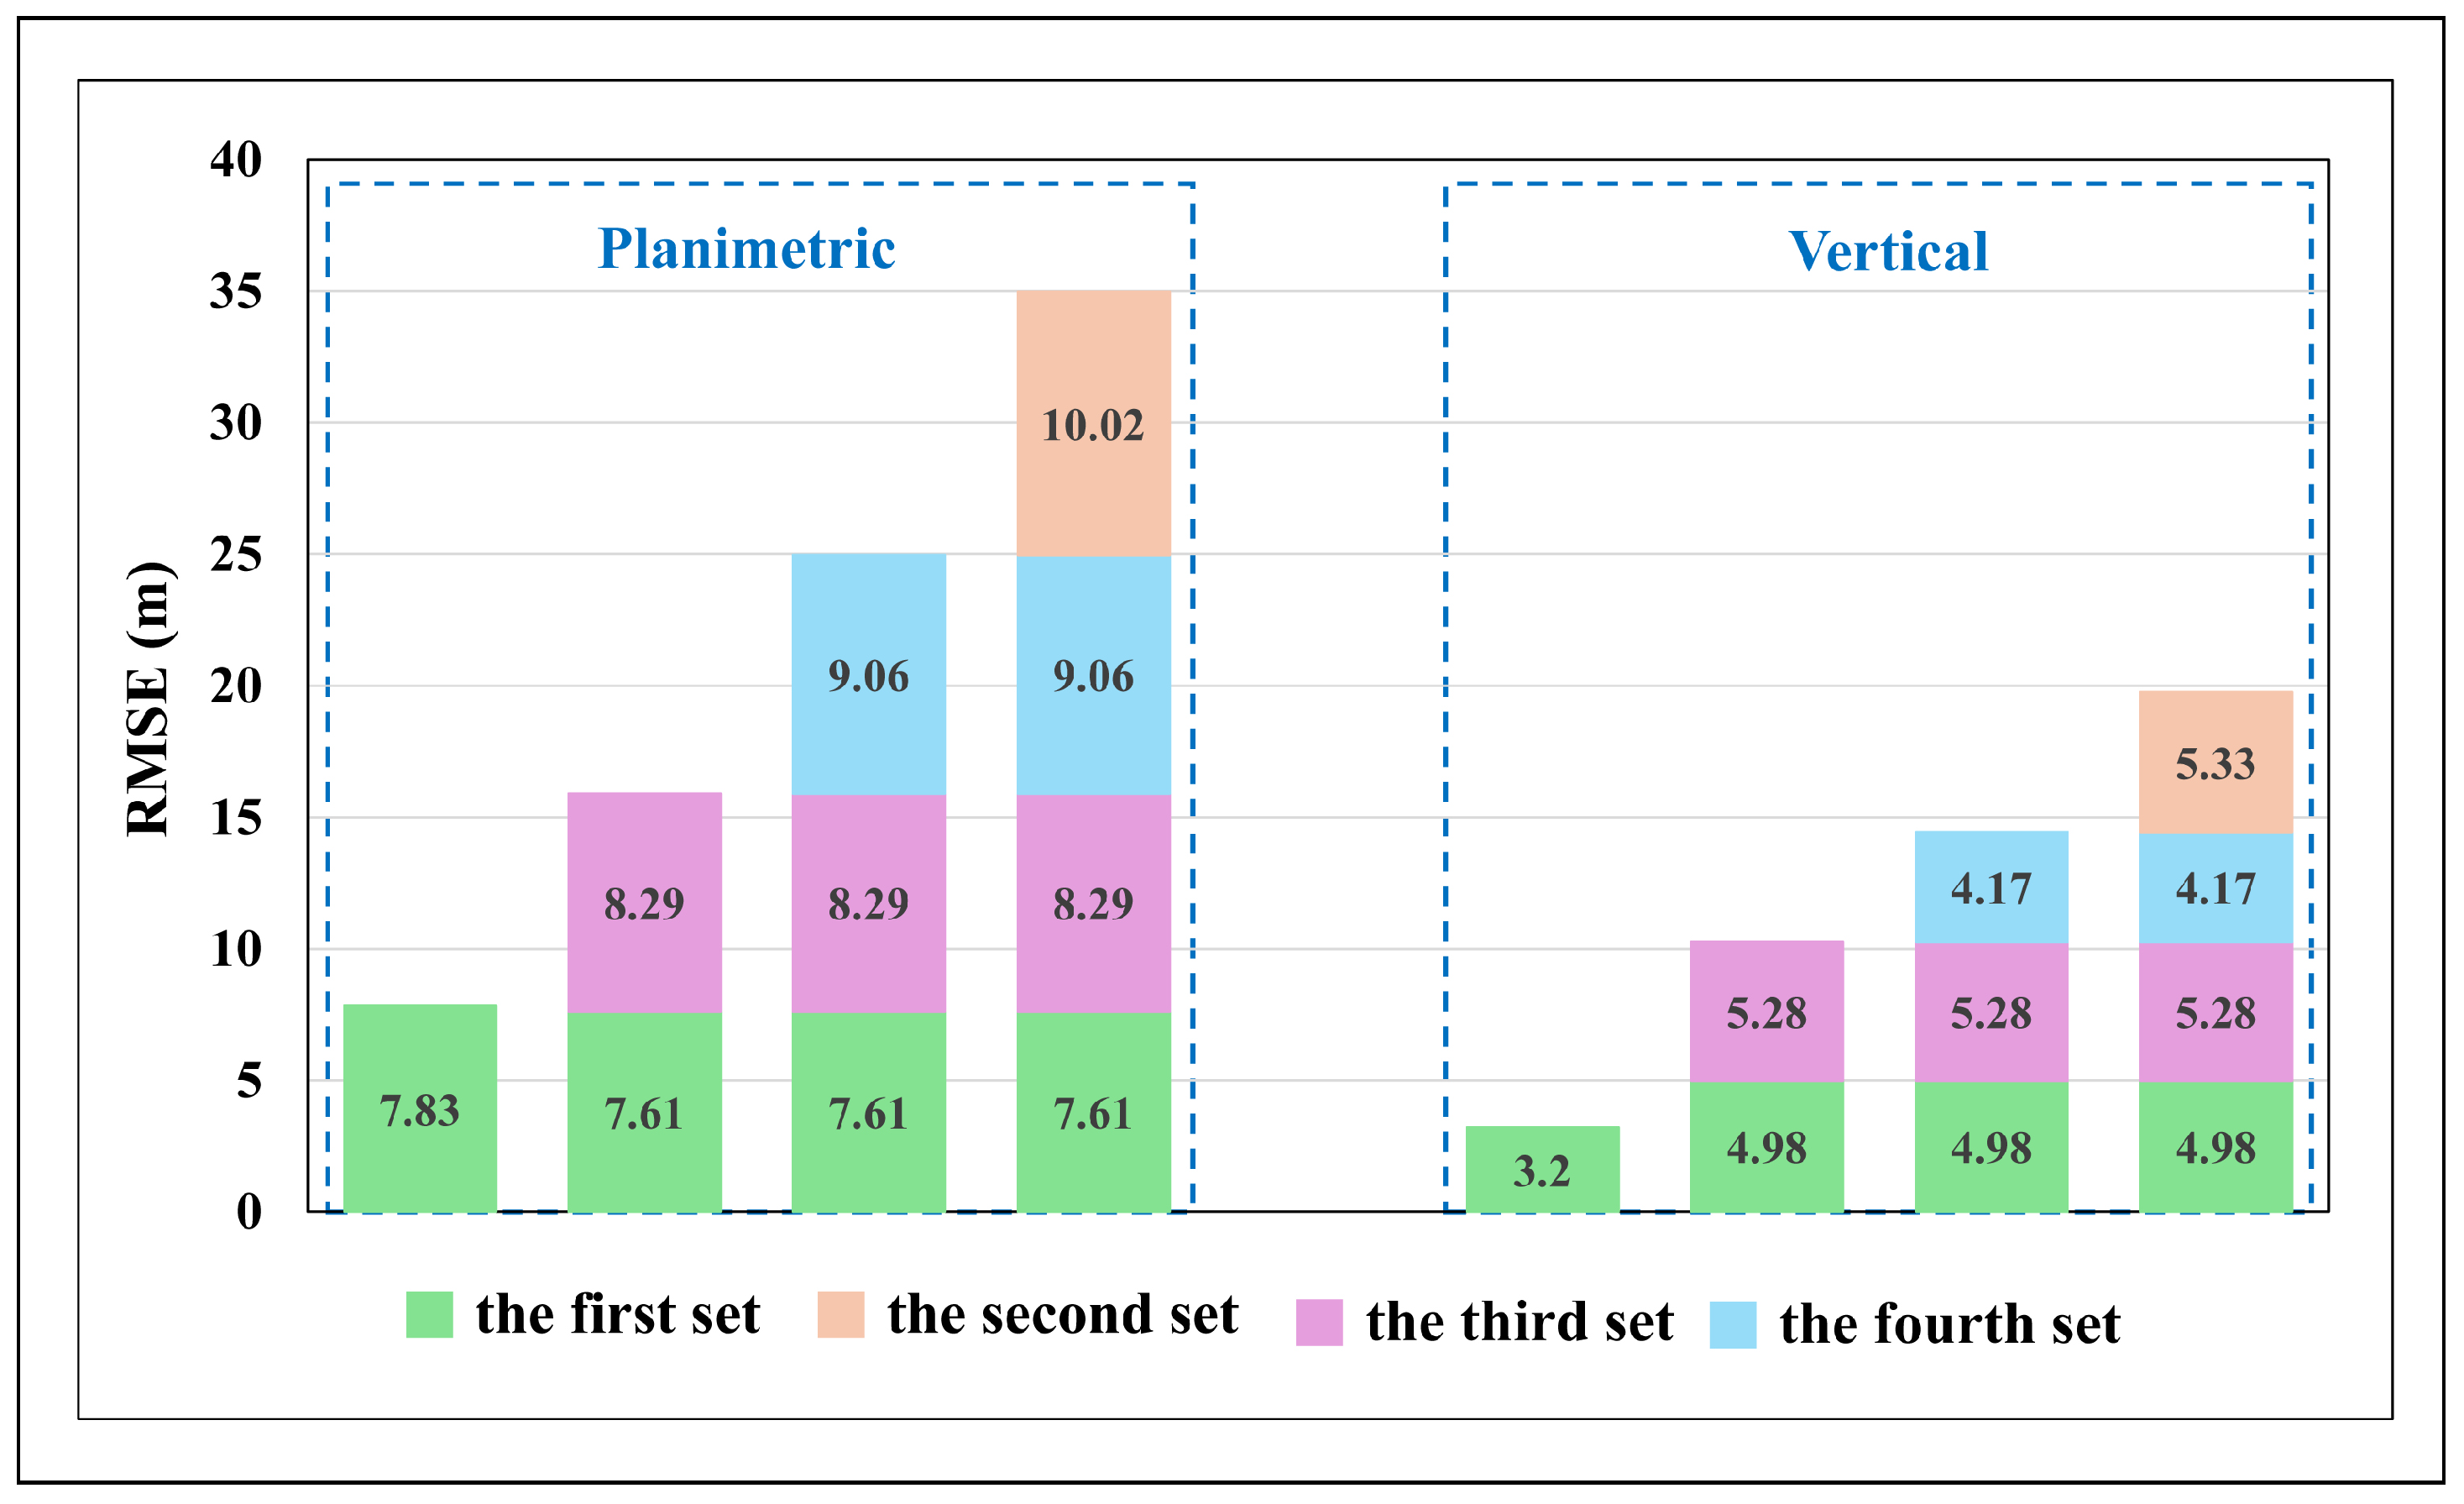
The third experimental results are displayed in Figure 6. The third set of TH-1 images demonstrated planimetric and vertical accuracies of 8.29 m and 5.28 m, respectively, through the application of the proposed merged method. Furthermore, the planimetric and vertical accuracy of the first bundled image set was updated to 7.61 m and 4.98 m, respectively. Subsequently, the fourth image set was geo-positioned using the updated bundled images, achieving planimetric and vertical accuracies of 9.06 m and 4.17 m, respectively. The second image set was then geo-positioned, achieving accuracies of 10.02 m and 5.33 m in the planimetric and vertical directions, respectively.
In the first two experiments, the order of orientation and update varied between the second and third image sets. The final geo-positioning accuracy of the fourth image set obtained in the second experiment was superior to that achieved in the first experiment. The third image set in the third experiment showed greater geo-positioning accuracy than that in the first experiment, and the fourth image set, building on this improved foundation, also achieved higher accuracy.
Different bundled image sets with various geo-positioning accuracies significantly influenced the final outcomes, with experimental evidence suggesting that prioritizing higher-precision bundled images yielded optimal orientation accuracy for the new images. These homologous and heterogeneous experiments demonstrate that bundled image sets should exhibit superior precision compared to subsequently new images.

5.2. Homologous IKONOS Datasets

5.2.1. Comparative Experiments

Two experiments were executed using homologous IKONOS datasets. The quantitative accuracies calculated with all the geo-positioned images in terms of RMSE in meters were compared with the traditional method, the direct method and the proposed merged method.
In the first experiment, comparative analyses were conducted using the first two TH-1 image sets, with the first image set acting as the bundled images for both direct and merged method implementations. The corresponding results are summarized in Table 6.
The traditional method achieved planimetric and vertical accuracies of 0.75 m in both directions. The direct method yielded planimetric and vertical accuracies of 0.73 m and 0.82 m, respectively. The merged method achieved accuracies of 1.29 m in the planimetric direction and 0.89 m in the vertical direction, respectively. These three methods yielded similar results in the vertical direction. The planimetric accuracy of the merged method, though approximately 1 m lower than that of the first two methods, still satisfied the accuracy standards for 1:10,000-scale mapping (7.5 m planimetric and 1.2 m vertical maximum permissible errors).
In the second experiment, all three sets of IKONOS datasets were utilized to conduct comparative analyses. Three groups of experiments were executed using the proposed merged method. The first image set served as the bundled images for both the direct method implementation and the initial two groups of the merged method. The first group of the merged method sequentially integrated the second and third IKONOS image sets. In the second group, the integration sequence was reversed, incorporating the third set followed by the second. In the third group, the second IKONOS set served as the bundled images, and the merged method performed the orientation and update process following the sequential order of the first and third image sets.
The overall accuracy assessment results, expressed in terms of RMSE in meters, for all three IKONOS image sets were compared among three approaches: the traditional method, the direct method and the proposed merged method. The detailed results are summarized in Table 7.
The traditional method for all three IKONOS image sets attained planimetric and vertical accuracies of 0.74 m and 0.64 m, respectively. Accuracy assessments of the direct method demonstrated planimetric and vertical accuracies of 0.84 m and 0.77 m, respectively. The first group of the merged method demonstrated planimetric and vertical geo-positioning accuracies of 1.28 m and 0.71 m, respectively. The second group of the merged method achieved planimetric and vertical geo-positioning accuracies at 1.14 m and 0.83 m, respectively. The planimetric and vertical geo-positioning accuracies decreased to 2.26 m and 3.02 m, respectively, using three sets of images in the third group. The first two groups of the merged method yielded comparable results. However, the third group exhibited a degradation in accuracy of approximately 1–2 m in both planimetric and vertical directions, failing to meet the accuracy requirements for 1:10,000-scale mapping. While the first two groups of the merged method showed lower positioning accuracy compared to both the traditional and direct methods, with deviations remaining below 0.5 m in planimetric and elevation measurements, the results still complied with 1:10,000-scale mapping accuracy standards.
The homologous and heterogeneous experimental results indicate that the proposed merged method can achieve comparable accuracy to both the traditional and direct method, while maintaining consistent precision across all bundled and new images. While image quantity increases, the geo-positioning accuracy does not continue growing continuously, suggesting the presence of an accuracy ceiling. The order of image integration impacts the final results for the proposed merged method. The accuracy reduction of the merged method is primarily attributable to the lower precision of the initial second set of bundled images.

5.2.2. Analysis and Discussion

Specifically, three experiments with the proposed merged method using the IKONOS data were designed in which the bundled images differed and the order of new images’ orientation and update also varied. In the first experiment, the first IKONOS image set was initially taken as the bundled images. Subsequently, the second IKONOS image set was geo-positioned and used to update the bundled images using the proposed merged method, followed by the integration of the third IKONOS image set. In the second experiment, the first IKONOS image set was maintained as the bundled images but the subsequent integration order was altered to incorporate the third and second sets. In the third experiment, the second image set was initially used as the bundled images. Subsequently, the first and third image sets were sequentially geo-positioned and integrated into the bundled images.
(1)
The first experiment with the proposed merged method
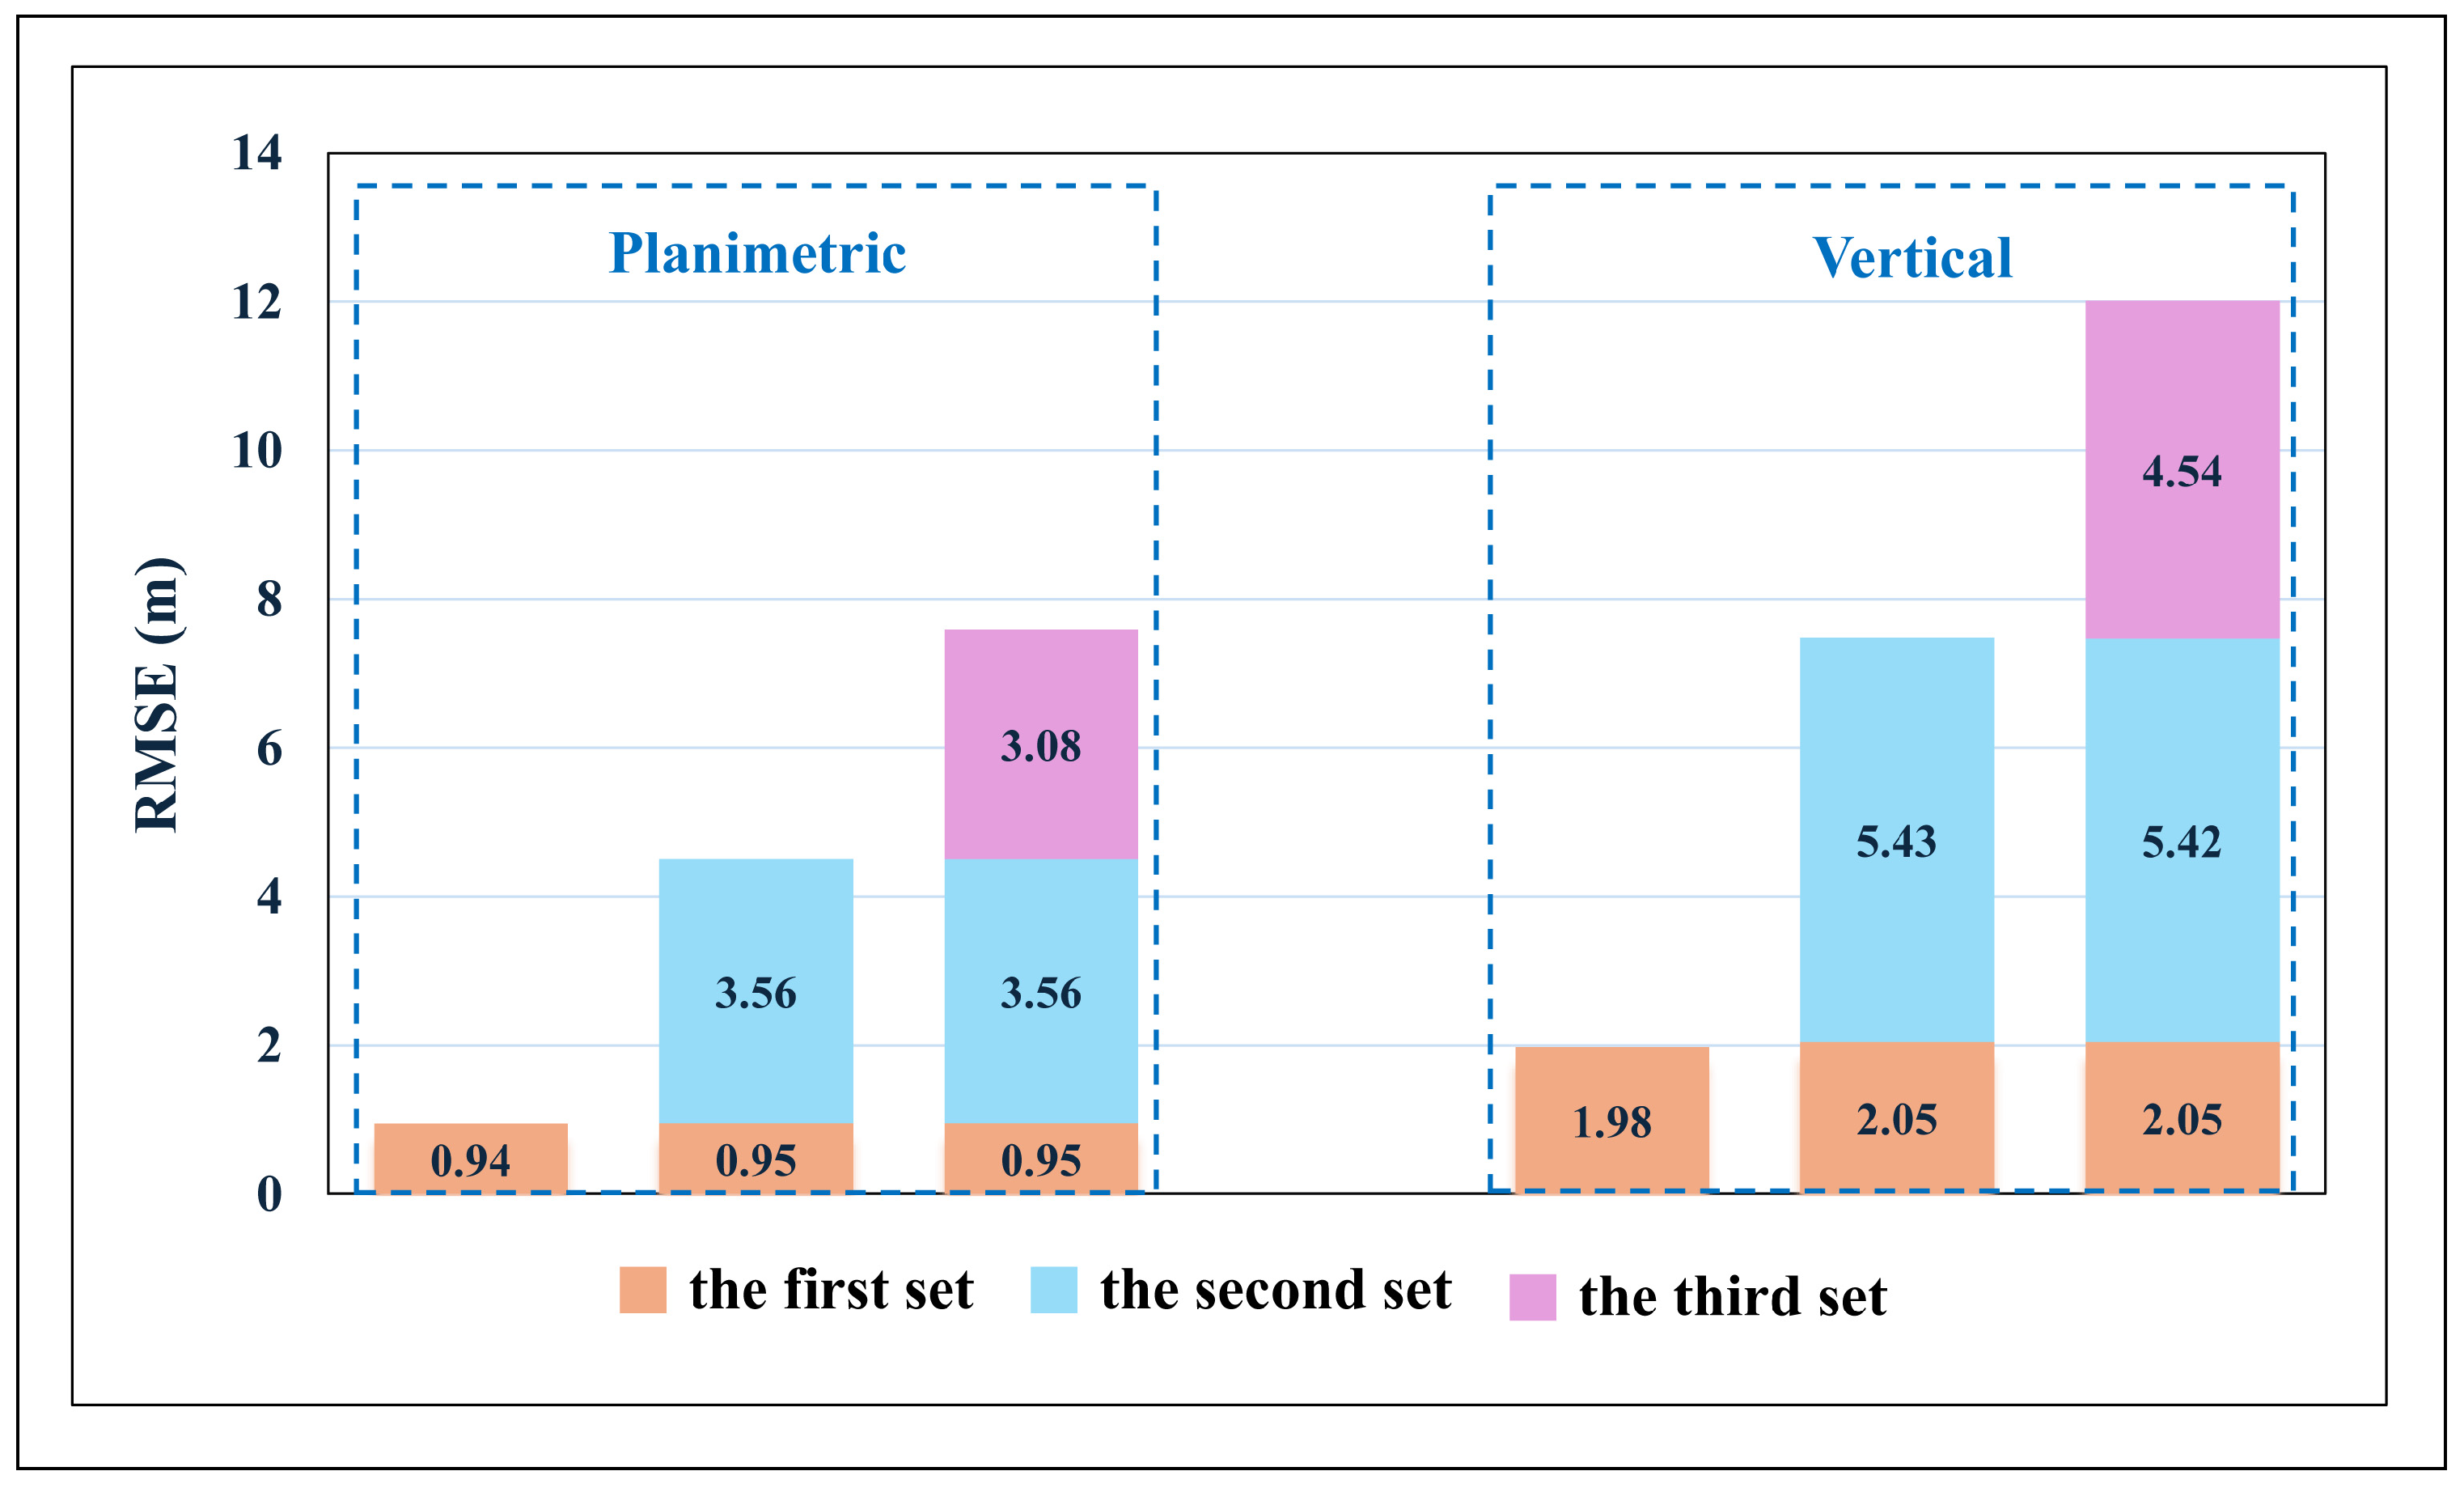
In the first experiment, the first set of bundled images exhibited accuracies of 0.94 m and 1.98 m in the planimetric and vertical directions, respectively. The second set of IKONOS images achieved planimetric and vertical accuracies of 3.56 m and 5.43 m, respectively, using the proposed merged method (Figure 7), and were subsequently used to update the first bundled image set. After updating, the geo-positioning accuracies of the first bundled image set were revised to 0.95 m and 2.05 m in the planimetric and vertical directions, respectively. The third set of IKONOS images was then geo-positioned using the updated images, achieving planimetric and vertical accuracies of 3.08 m and 4.54 m, respectively.
(2)
The second experiment with the proposed merged method
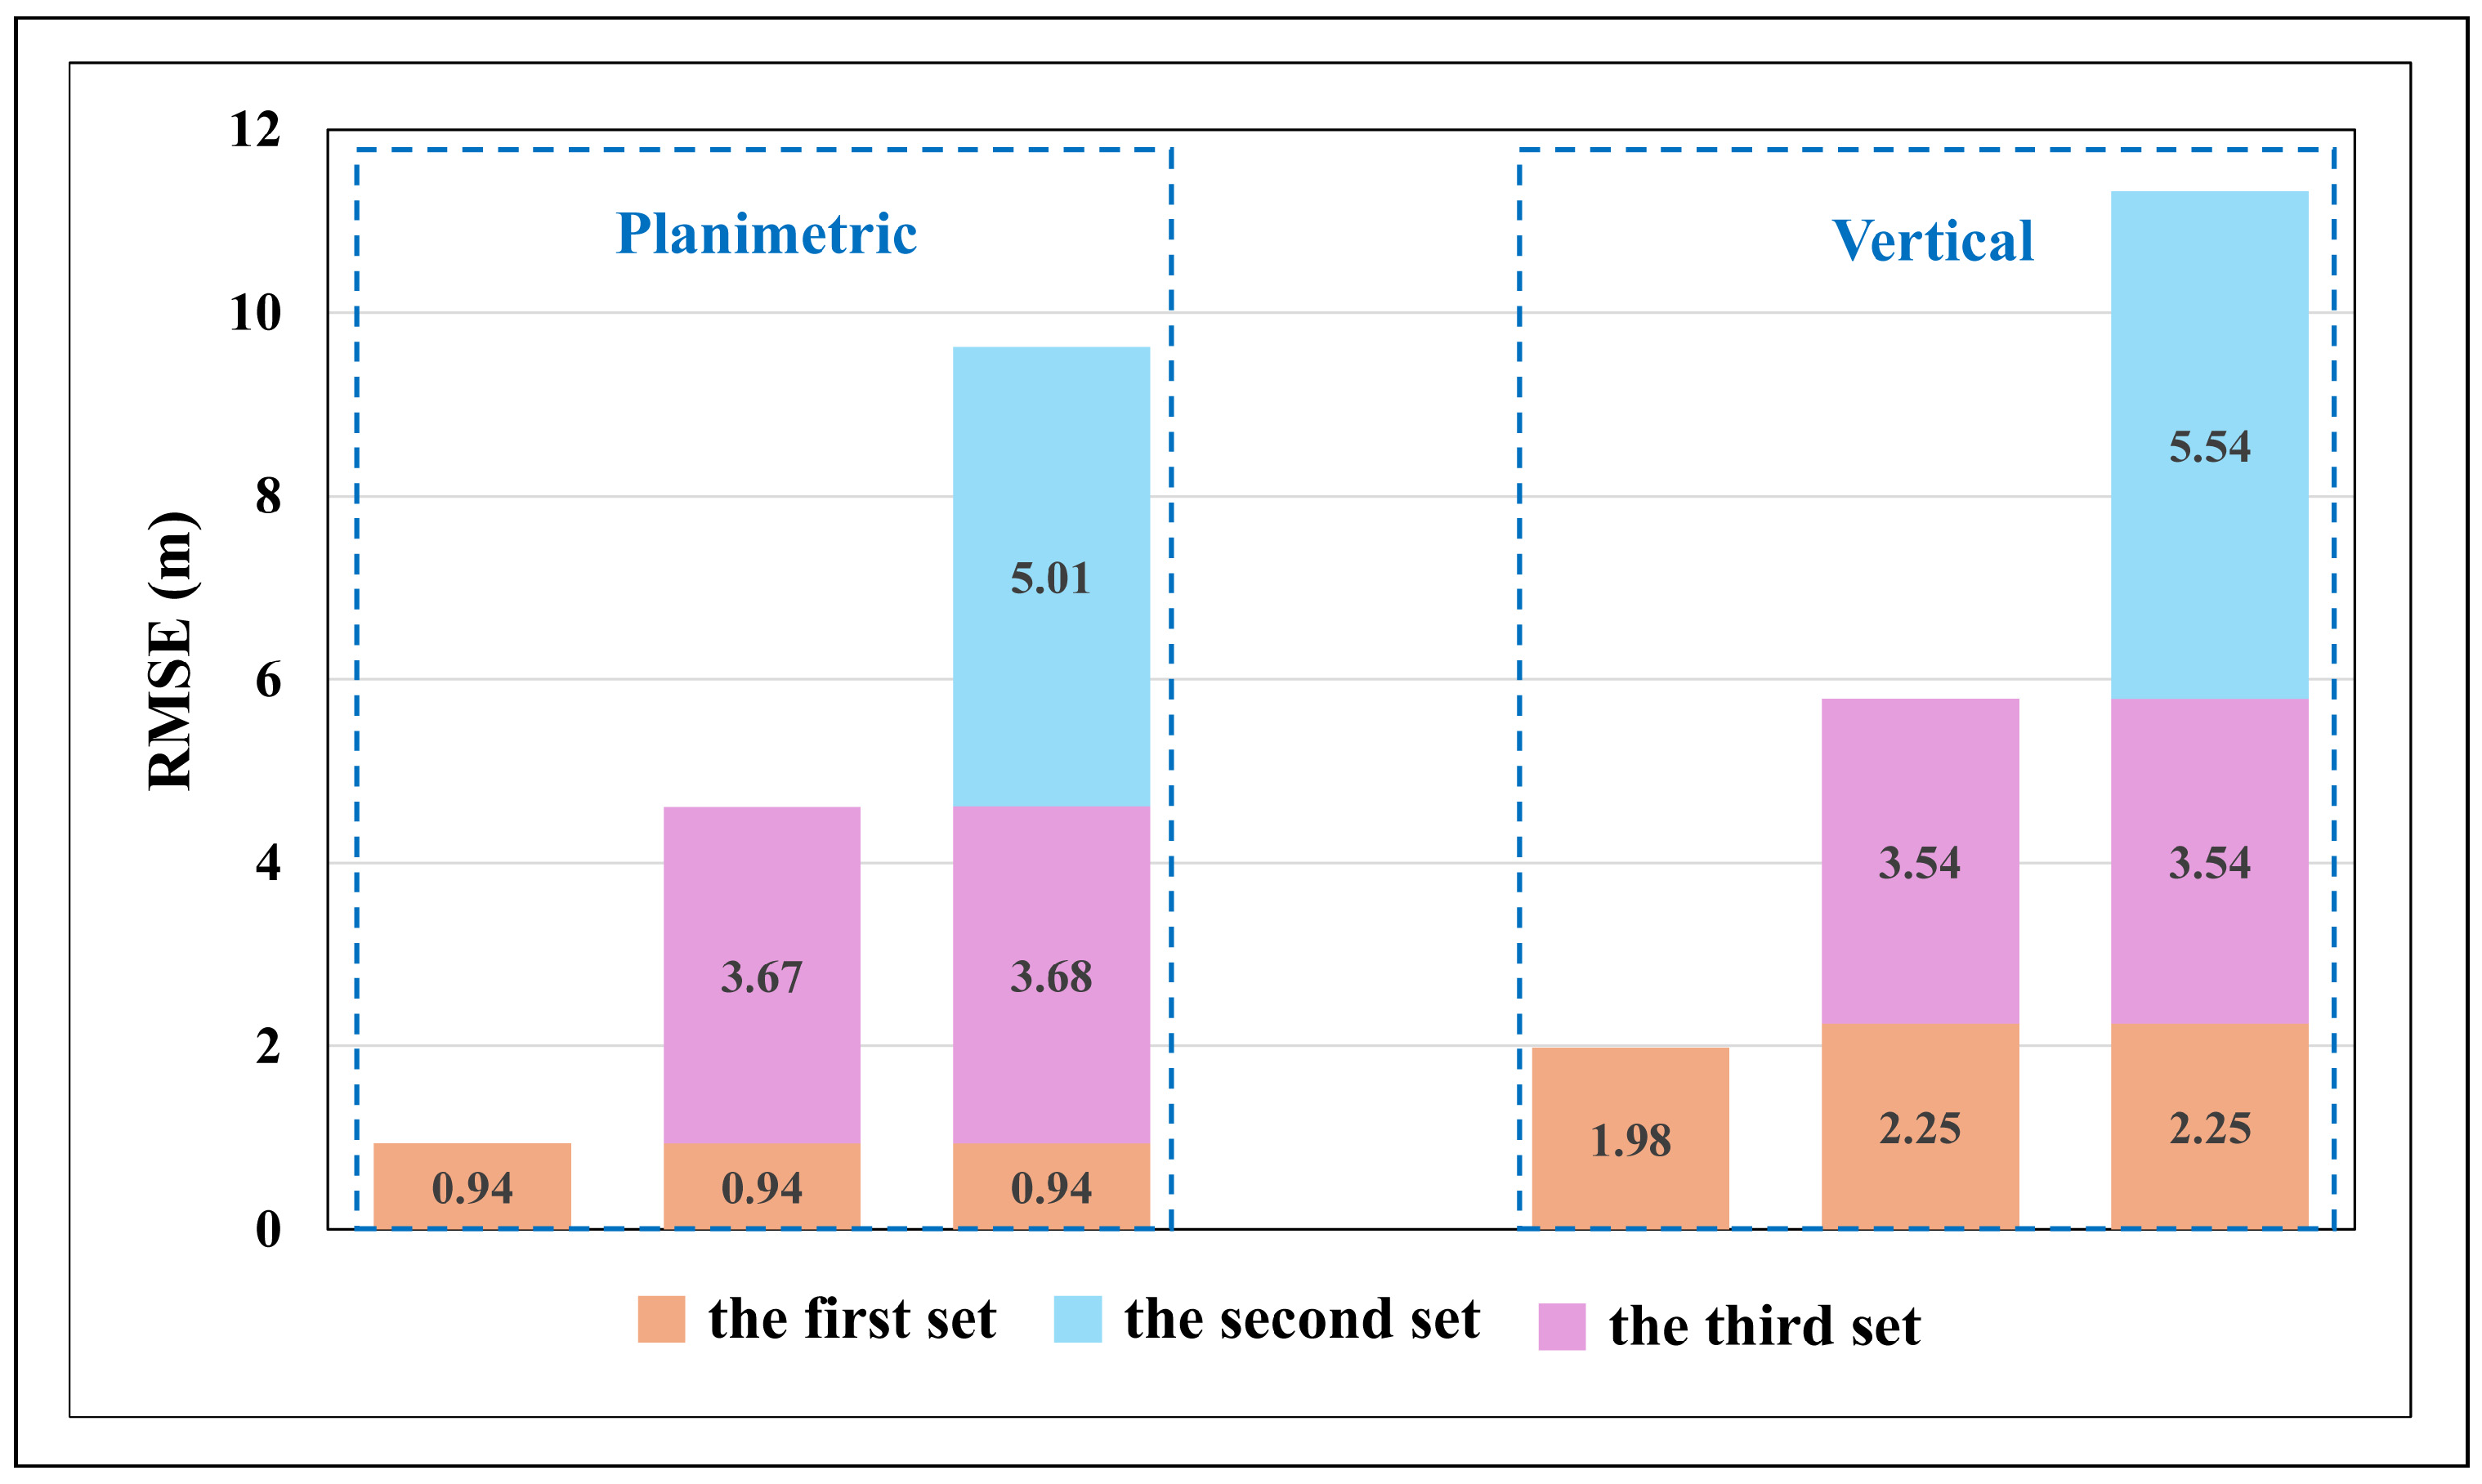
As presented in Figure 8, the experimental results demonstrated that the third set of IKONOS images achieved planimetric and vertical accuracies of 3.67 m and 3.54 m, respectively, utilizing the proposed merged method. Additionally, the accuracies of the first set of bundled images were updated to 0.94 m and 2.25 m in the planimetric and vertical directions, respectively. Following the incorporation of the third set of images, the second set was geo-positioned using the updated bundled images, achieving planimetric and vertical accuracies of 5.01 m and 5.54 m, respectively.
In the first two experiments, the first image set was used as the bundled images. The order of orientation and update varied between the second and third image sets. A comparative analysis was conducted between the first two experimental results. The final geo-positioning accuracy of the second image set obtained in the second experiment was superior to that achieved in the third experiment. The third image set achieved fine results in the third experiment compared to those obtained in the second experiment.
(3)
The third experiment with the proposed merged method
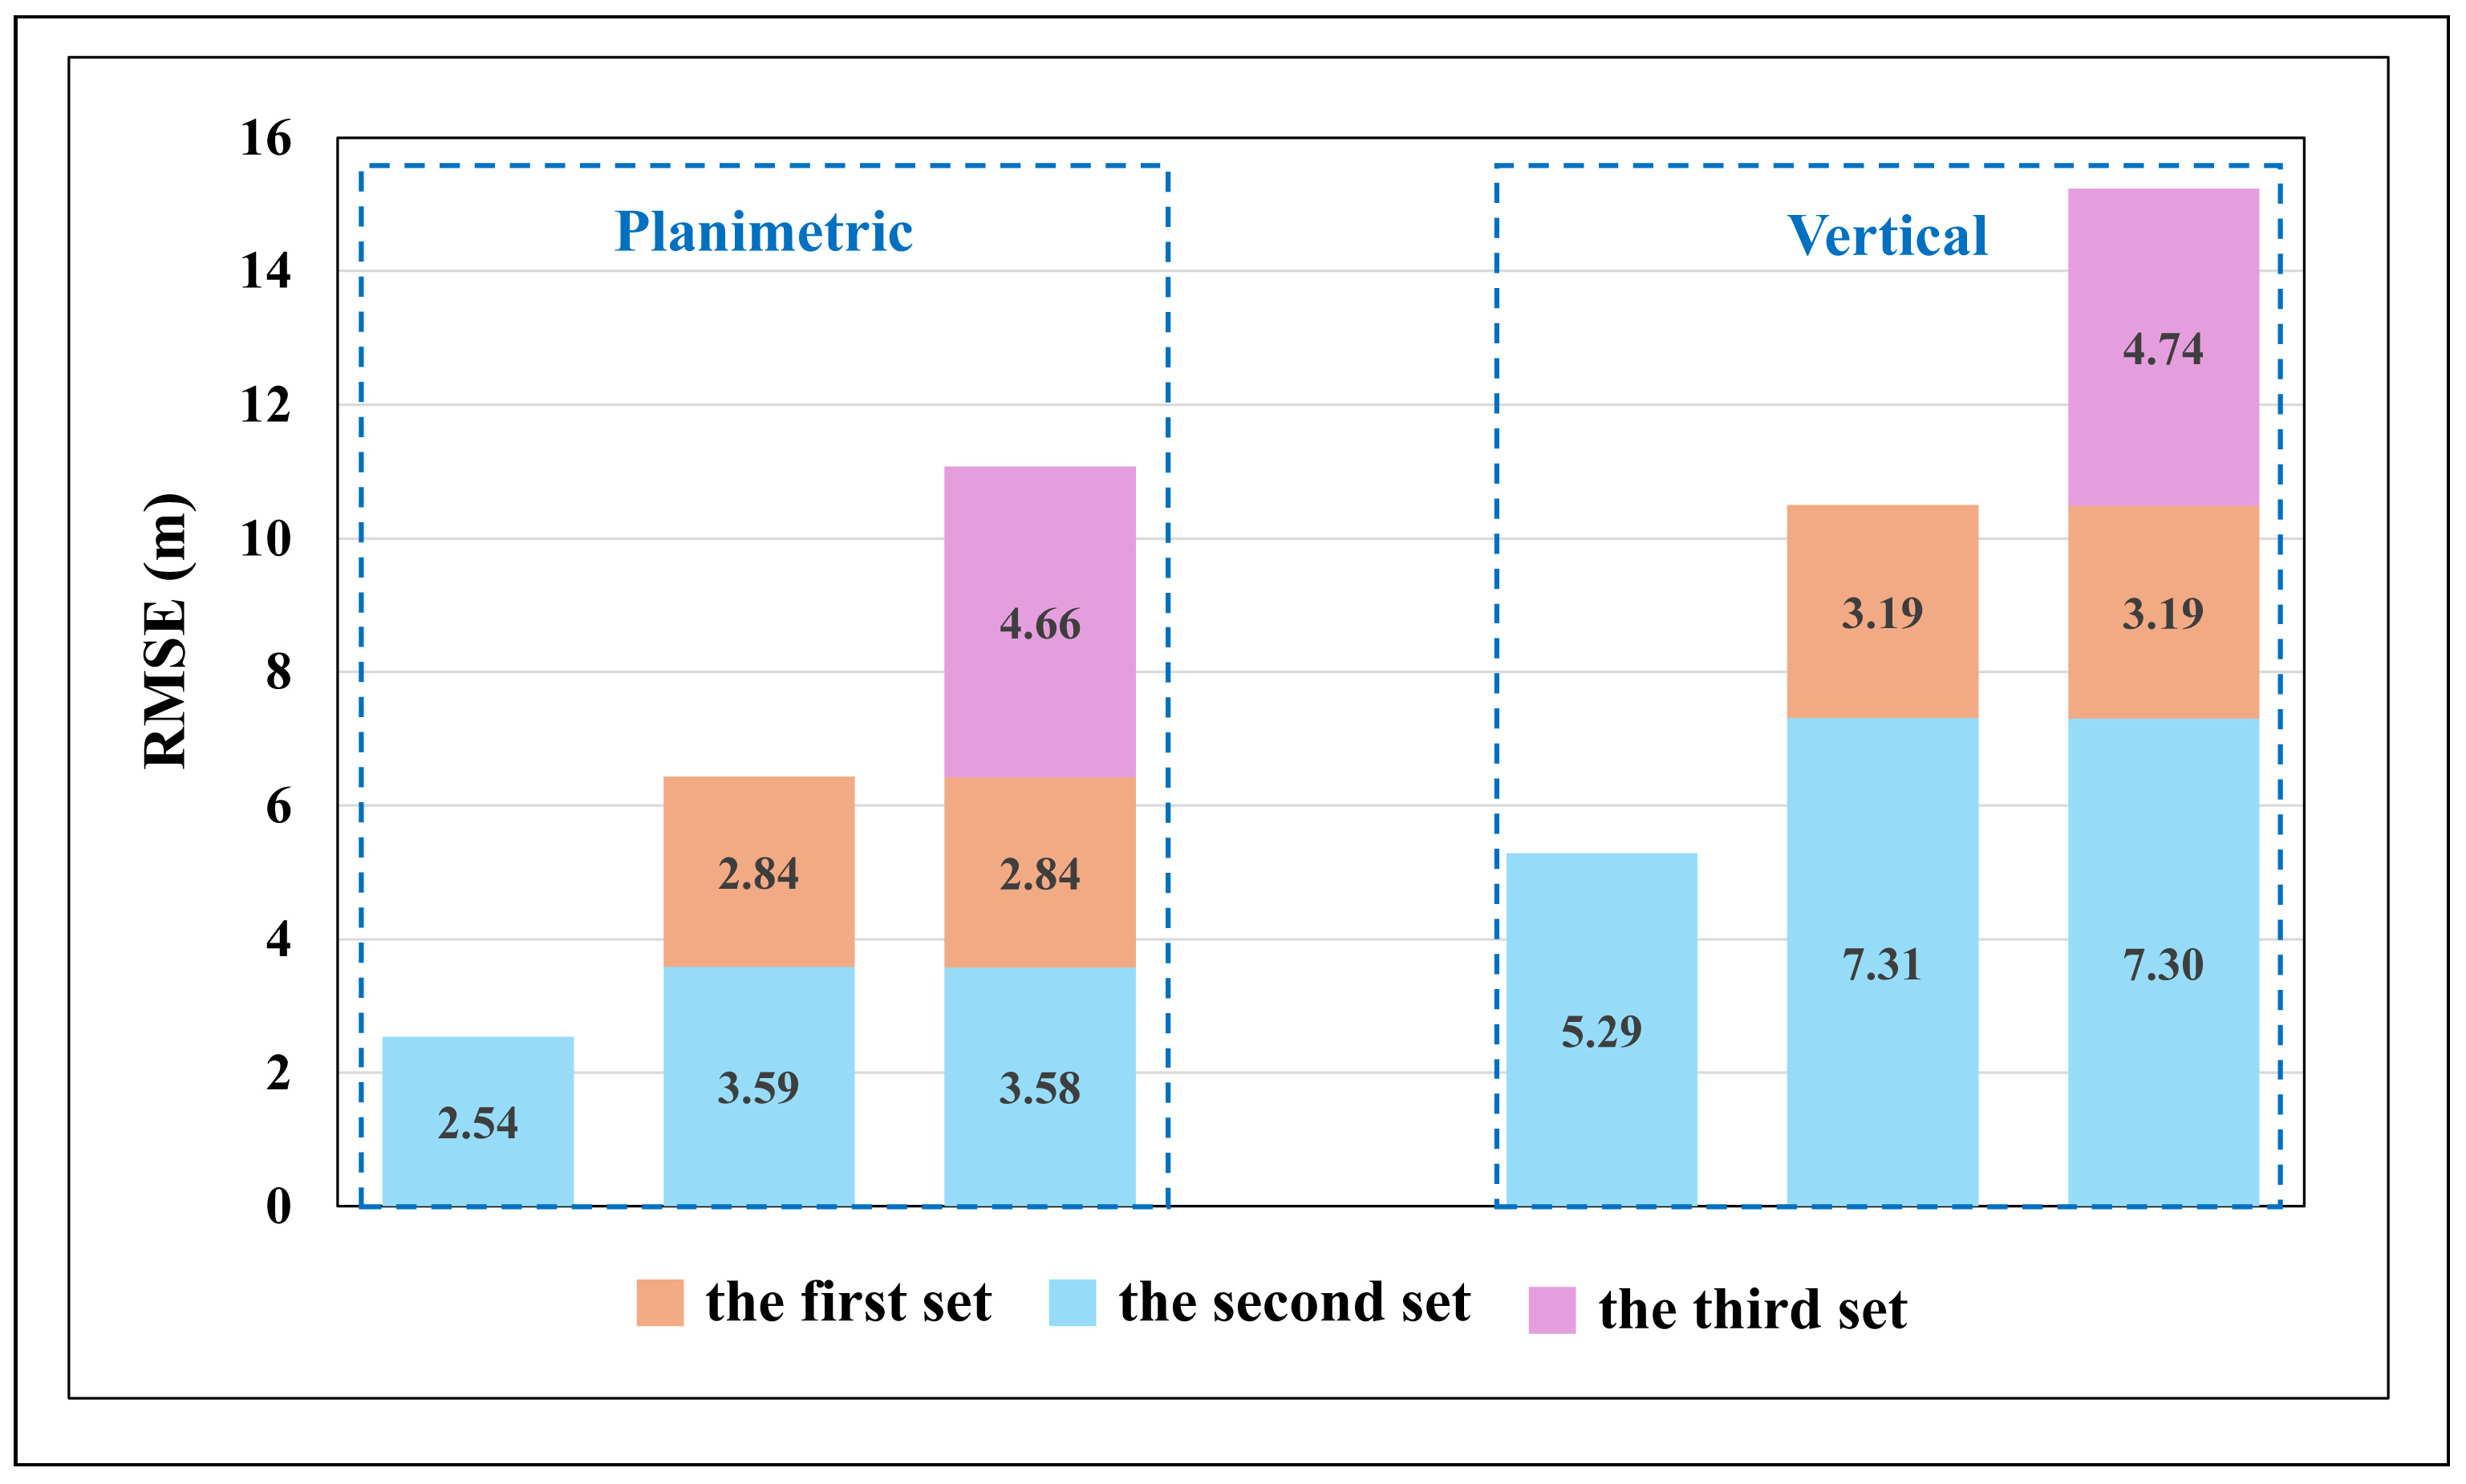
In the third experiment, the second set of bundled IKONOS images demonstrated planimetric and vertical accuracies of 2.54 m and 5.29 m, respectively. The experimental results are displayed in Figure 9. The first set of IKONOS images demonstrated planimetric and vertical accuracies of 2.84 m and 3.19 m, respectively, through the application of the proposed merged method. Furthermore, the planimetric and vertical accuracy of the second set of bundled images was updated to 3.59 m and 7.31 m, respectively. Subsequently, the third set of images was geo-positioned using the updated bundled images, achieving planimetric and vertical accuracies of 4.66 m and 4.74 m, respectively. The positioning accuracy achieved in the third experiment was inferior to that of the previous two experiments. This discrepancy arose because the first two experiments utilized the first bundled IKONOS dataset, which demonstrated higher geo-positioning accuracy compared to the second bundled IKONOS dataset employed in the third experiment. This was because IKONOS-Scence04 in the second IKONOS set had a resolution of 4 m, which was lower than that of the first three IKONOS images. The reduced precision in image point measurements led to a degradation in positioning accuracy.
Different bundled image sets with various geo-positioning accuracies significantly influenced the final outcomes, with experimental evidence suggesting that prioritizing higher-precision bundled images yields optimal orientation accuracy for new images. These three experiments demonstrate that bundled image sets should exhibit superior precision compared to subsequently new images.

5.3. Computational Performance

The proposed merged method substitutes GCPs with bundled images for image geometric positioning. Compared to the direct method, this approach does not require observation equations for bundled images, relying only on their historical covariance information, thus reducing the computational time.
Taking two experiments as an example, in the first test, the second IKONOS image set was geo-positioned using both the direct method and the merged method, with the first image set serving as the bundled images. There were ten corresponding points of T s 1 , twenty corresponding points of T n and ten corresponding points of T s 2 . Experiments were performed on a system with the following hardware configuration: Windows 11 operating system, 11th Gen Intel (R) core (TM) i7-1165G7 2.8GHz CPU, 16 GB Memory. Under this configuration, in the first test, the direct method and the merged method required 0.928 s and 0.561 s, respectively (Table 8). In the second test, the second TH-1 image set was geo-positioned with the first bundled TH-1 image set using both the direct method and the merged method. There were ten corresponding points of T s 1 , twenty-six corresponding points of T n and fourteen corresponding points of T s 2 . Under the same configuration, in the second test, the direct method and the merged method required 1.24 s and 0.597 s, respectively (Table 8). The results showed that the merged method requires less time than the direct method.

6. Conclusions

High-precision geographic data can substitute GCPs for image geometric positioning. Current implementations of this method introduce additional observation equations, increasing the computational load. Furthermore, the covariance information of the geographic data is not fully utilized, and the data itself remains static without dynamic updates when new images are integrated. This paper proposed a bundled images-based geo-positioning method without GCPs that leverages a Kalman filter to integrate new image observations with their corresponding historical covariance information extracted from the bundled images, significantly reducing computational load. The bundled images can be updated using posterior covariance information. For subsequent new images requiring orientation, the process of orientation and update is repeated, ensuring consistent accuracy across all the historical and new images.
Two datasets, including sixfold overlap homologous IKONOS images and elevenfold overlap heterogeneous images from Chinese stereo mapping satellites TH-1 and ZY-3, were utilized to validate the proposed merged method. The experimental results indicate that the proposed method can achieve accuracy on par with the traditional method assisted by GCPs. Without using GCPs, the proposed merged method can meet 1:50,000 mapping standards with heterogeneous TH-1 and ZY-3 datasets and 1:10,000 mapping accuracy requirements with homologous IKONOS datasets. These experiments indicate that as the bundled images expand further, the image quantity growth no longer results in substantial improvements in precision, suggesting the presence of an accuracy ceiling. The final positioning accuracy is predominantly influenced by the initial bundled image quality. Experimental evidence suggests that when using the merged method, the bundled image sets should exhibit superior precision compared to subsequently new images.
In future research, we will expand the coverage to build STN at regional or global scales. High mountain valleys and dense forest areas will also be a key focus of future research.

Author Contributions

Conceptualization, Z.M. and X.Z.; methodology, Y.C. and Z.W.; software, Y.C.; validation, Y.C.; formal analysis, P.S.; investigation, Y.L.; data curation, Y.C.; writing—original draft preparation, Y.L.; writing—review and editing, Z.M.; visualization, X.Z.; project administration, X.Z.; writing and editing, H.X.; funding acquisition, Z.M. All authors have read and agreed to the published version of the manuscript.

Funding

This work was supported by the National Natural Science Foundation of China (NSFC) (no. 42101443).

Data Availability Statement

Data are available upon request.

Acknowledgments

We thank all the participants involved in this study.

Conflicts of Interest

The authors declare no conflicts of interest.

References

  1. Tong, X.; Fu, Q.; Liu, S.; Wang, H.; Ye, Z.; Jin, Y.; Chen, P.; Xu, X.; Wang, C.; Liu, S.; et al. Optimal selection of virtual control points with planar constraints for large-scale block adjustment of satellite imagery. Photogramm. Rec. 2020, 35, 487–508. [Google Scholar] [CrossRef]
  2. Zhang, Z.; Tao, P. An Overview on “Cloud Control” Photogrammetry in Big Data Era. Acta Geod. Cartogr. Sin. 2017, 46, 1238–1248. [Google Scholar]
  3. Zhong, H.; Duan, Y.; Zhou, Q.; Chen, Q.; Cai, B.; Tao, P.; Zhang, Z. Calibrating an airborne linear-array multi-camera system on the master focal plane with existing bundled images. Geo-Spat. Inf. Sci. 2025, 28, 1141–1159. [Google Scholar] [CrossRef]
  4. Cao, H.; Tao, P.; Li, H.; Zhang, Z. Using DEM as full controls in block adjustment of satellite imagery. Acta Geod. Cartogr. Sin. 2020, 49, 79–91. [Google Scholar]
  5. Liu, C.; Tang, X.; Zhang, H.; Li, G.; Wang, X.; Li, F. Geopositioning improvement of ZY-3 satellite imagery integrating GF-7 Laser Altimetry data. IEEE Geosci. Remote Sens. Lett. 2022, 19, 1–5. [Google Scholar] [CrossRef]
  6. Wang, J.; Wang, R.; Hu, X.; Su, Z. The on-orbit calibration of geometric parameters of the Tian-Hui 1 (TH-1) satellite. ISPRS J. Photogramm. Remote Sens. 2017, 124, 144–151. [Google Scholar] [CrossRef]
  7. Wang, J.; Wang, R. Efp multi-functional bundle adjustment without ground control points for th-1 satellite. J. Remote Sens. 2012, 16, 112–115. [Google Scholar]
  8. Wang, R.; Wang, J.; Li, J. Improvement strategy for location accuracy without ground control points of 3rd satellite of TH-1. Acta Geod. Cartogr. Sin. 2019, 48, 671–675. [Google Scholar]
  9. Zhang, Y.; Zheng, M.; Xiong, X.; Xiong, J. Multistrip bundle block adjustment of zy-3 satellite imagery by rigorous sensor model without ground control point. IEEE Geosci. Remote Sens. Lett. 2015, 12, 865–869. [Google Scholar] [CrossRef]
  10. Yang, B.; Pi, Y.; Li, X.; Wang, M. Relative geometric refinement of patch images without use of ground control points for the geostationary optical satellite gaofen4. IEEE Trans. Geosci. Remote Sens. 2018, 56, 474–484. [Google Scholar] [CrossRef]
  11. Sun, Y.; Zhang, L.; Xu, B.; Zhang, Y. Method and GCP-independent block adjustment for ZY-3 satellite images. J. Remote Sens. 2019, 23, 205–214. [Google Scholar] [CrossRef]
  12. Toutin, T.; Schmitt, C.; Wang, H. Impact of no gcp on elevation extraction from worldview stereo data. ISPRS J. Photogramm. Remote Sens. 2012, 72, 73–79. [Google Scholar] [CrossRef]
  13. Liu, K.; Tao, P.; Tan, K.; Duan, Y.; He, J.; Luo, X. Adaptive re-weighted block adjustment for multi-coverage satellite stereo images without ground control points. IEEE Access 2019, 7, 112120–112130. [Google Scholar] [CrossRef]
  14. Wang, J.; Zhang, Y.; Zhang, Z.; Li, X.; Tao, P.; Song, M. Icesat laser points assisted block adjustment for mapping satellite-1 imagery. Acta Geod. Cartogr. Sin. 2018, 47, 359–369. [Google Scholar]
  15. Zhang, G.; Jiang, B.; Wang, T.; Ye, Y.; Li, X. Combined block adjustment for optical satellite stereo imagery assisted by spaceborne sar and laser altimetry data. Remote Sens. 2021, 13, 3062. [Google Scholar] [CrossRef]
  16. Wang, M.; Wei, Y.; Pi, Y. Geometric positioning integrating optical satellite stereo imagery and a global database of icesat-2 laser control points: A framework and key technologies. Geo-Spat. Inf. Sci. 2023, 26, 206–217. [Google Scholar] [CrossRef]
  17. Jiang, Y.; Li, Z.; Tan, M.; Wei, S.; Zhang, G.; Guan, Z.; Han, B. A stable block adjustment method without ground control points using bound constrained optimization. Int. J. Remote Sens. 2022, 43, 4708–4722. [Google Scholar] [CrossRef]
  18. Pi, Y.; Yang, B. Block adjustment of multispectral images without gcp aided by stereo tlc images for zy-3 satellite. isprs annals of the photogrammetry. Remote Sens. Spat. Inf. Sci. 2020, V-2-2020, 65–72. [Google Scholar] [CrossRef]
  19. Cheng, C.; Zhang, J.; Huang, G.; Zhang, L.; Yang, J. Combined positioning of TerraSAR-X and SPOT-5 HRS images with RFM considering accuracy information of orientation parameters. Acta Geod. Cartogr. Sin. 2017, 46, 179–187. [Google Scholar]
  20. Teo, T.; Chen, L.; Liu, C.; Tung, Y.; Wu, W. Dem-aided block adjustment for satellite images with weak convergence geometry. IEEE Trans. Geosci. Remote Sens. 2010, 48, 1907–1918. [Google Scholar] [CrossRef]
  21. Ma, Z.; Wu, X.; Yan, L.; Xu, Z. Geometric Positioning for Satellite Imagery without Ground Control Points by Exploiting Repeated Observation. Sensors 2017, 17, 240. [Google Scholar] [CrossRef] [PubMed]
  22. Dolloff, J.; Iiyama, M. Fusion of image block adjustments for the generation of a ground control network. In Proceeding of the 10th International Conference on Information Fusion, Québec, QC, Canada, 9–12 July 2007. [Google Scholar]
  23. Ma, Z.; Song, W.; Deng, J.; Wang, J.; Cui, C. A rational function model based geo-positioning method for satellite images without using ground control points. Remote Sens. 2018, 10, 182. [Google Scholar] [CrossRef]
  24. Grodecki, J.; Dial, G. Block adjustment of high-resolution satellite images described by rational polynomials. Photogramm. Eng. Remote Sens. 2003, 69, 59–68. [Google Scholar] [CrossRef]
  25. ITEK Corporation. Conceptual Design of an Automated Mapping Satellite System (Mapsat); National Technology Information Server: Lexington, KY, USA, 1981. [Google Scholar]
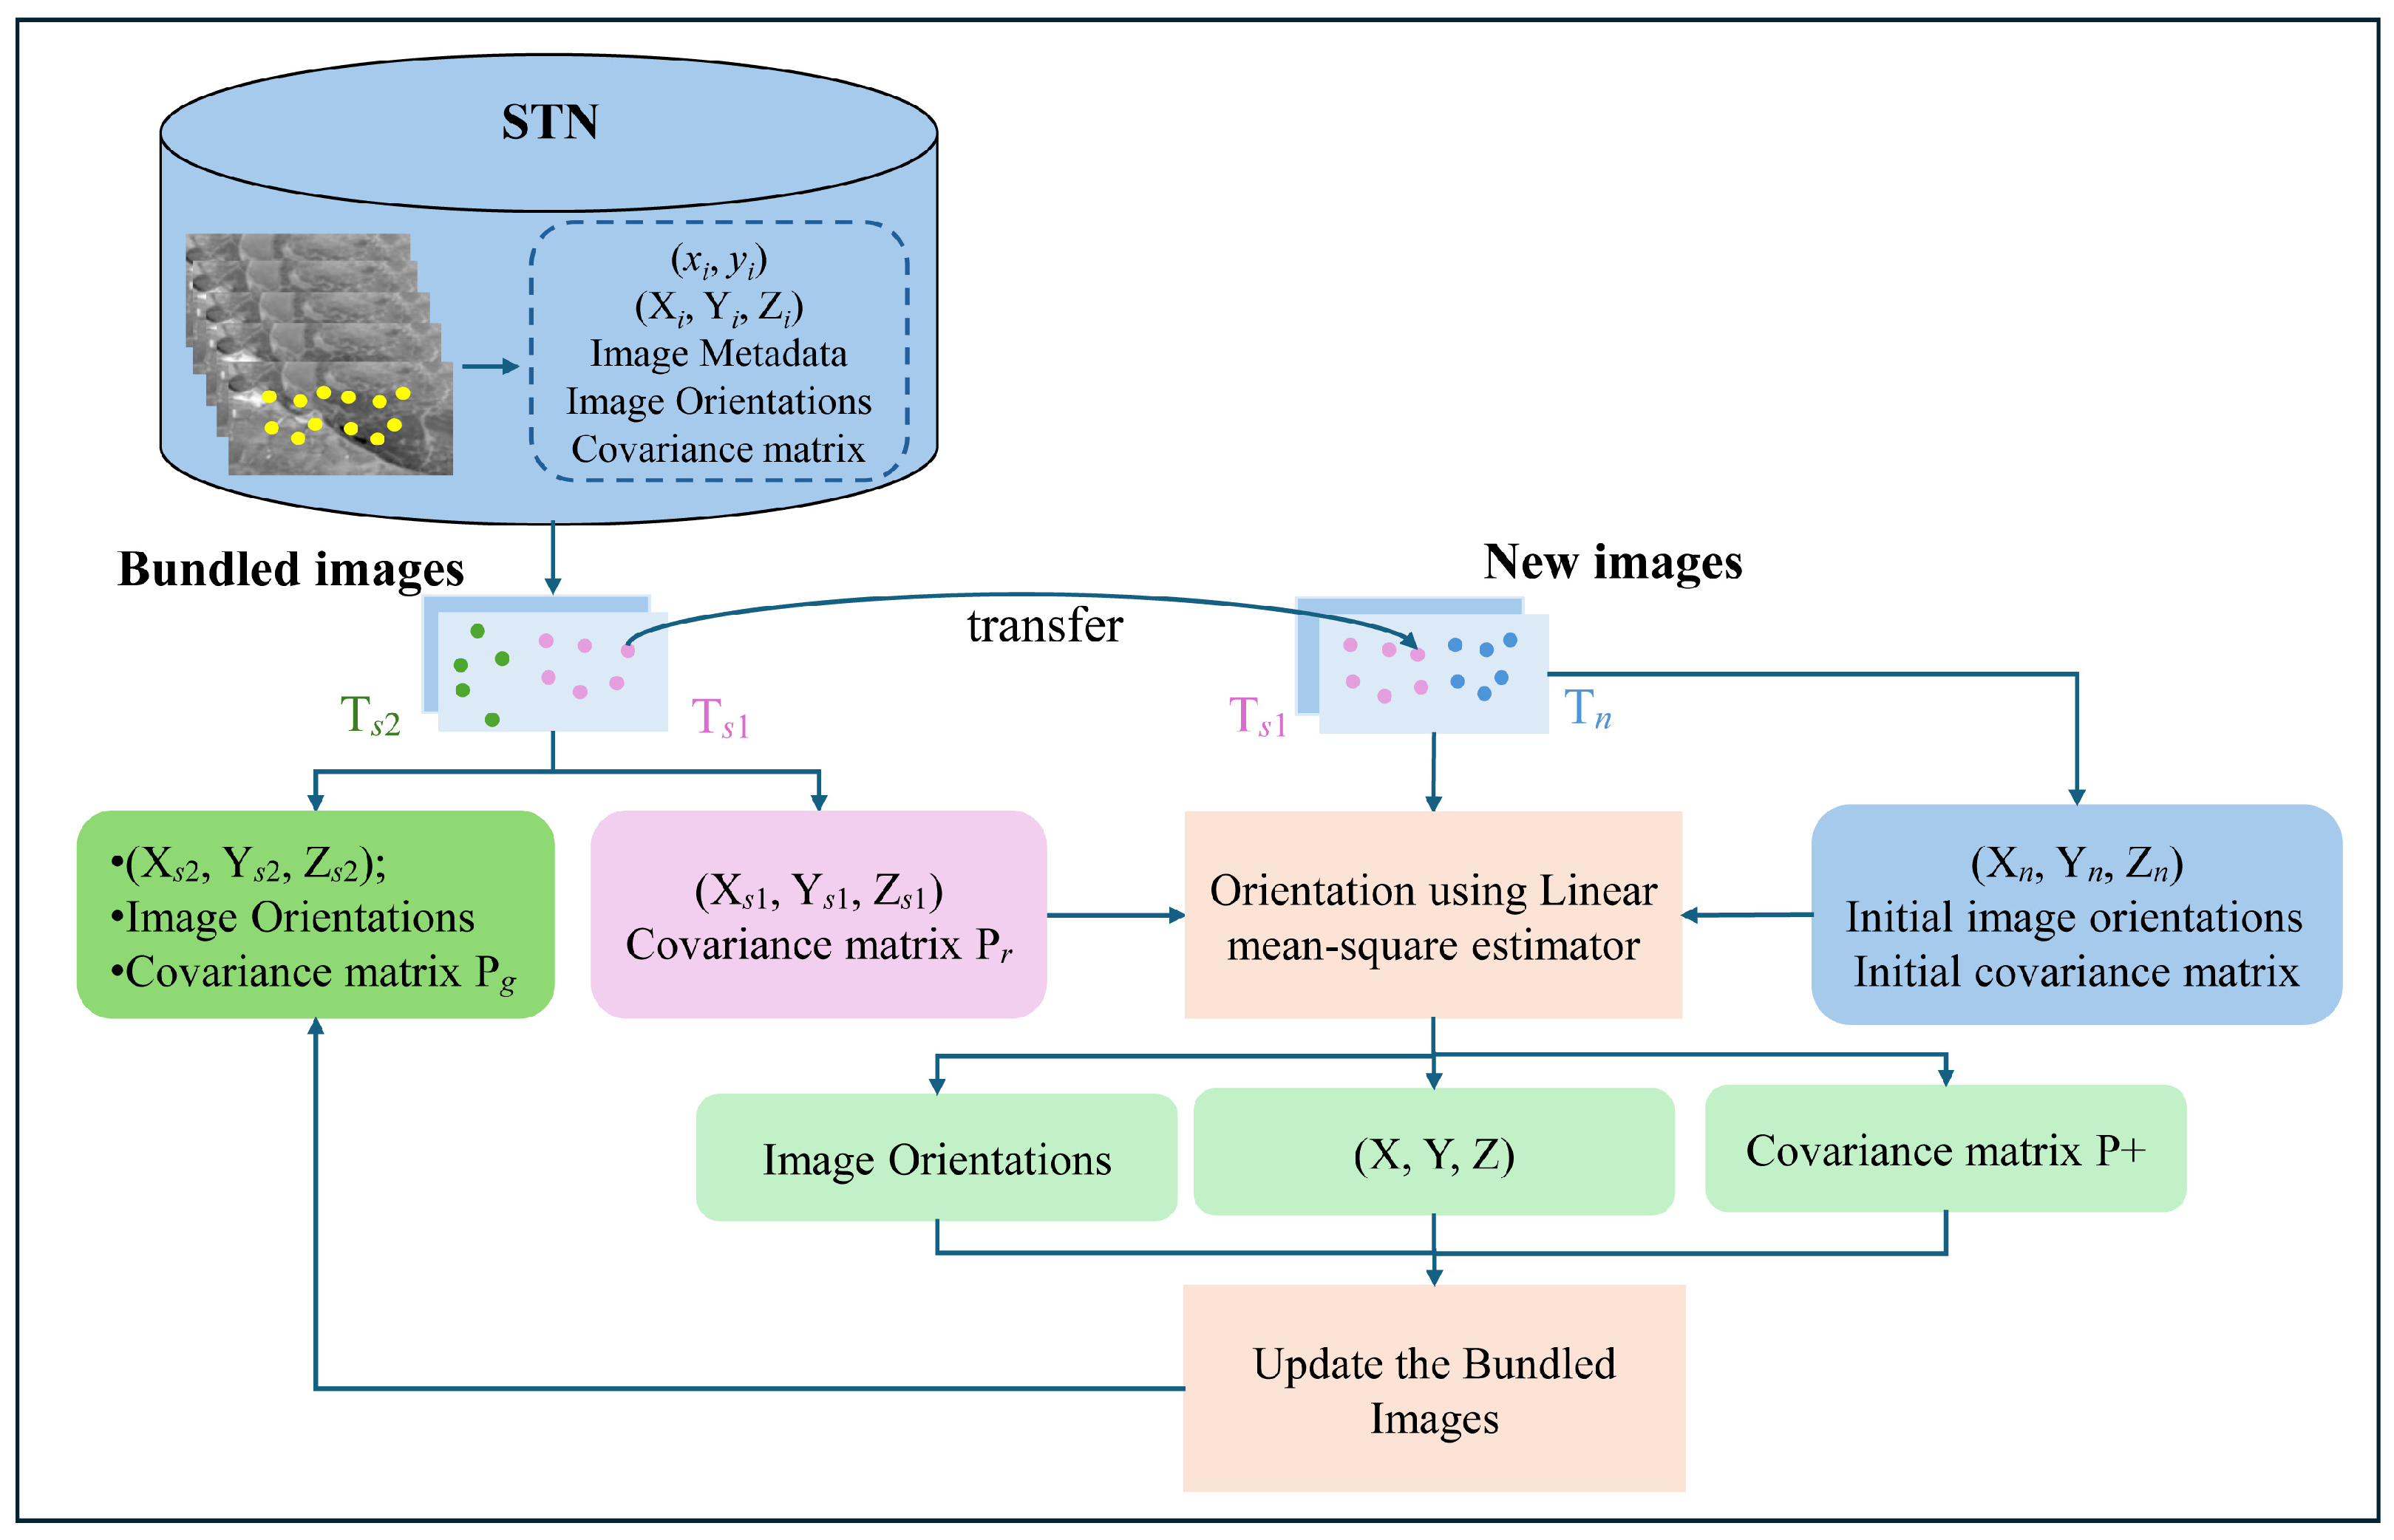
Figure 1. The workflow of the proposed merged method without using GCPs.
Remotesensing 17 03289 g001
Figure 2. Three sets of IKONOS image footprints and GCPs in Hobart, Australia.
Remotesensing 17 03289 g002
Figure 3. Four sets of TH-1 and ZY-3 image footprints and GCPs in Dengfeng, Henan Province.
Remotesensing 17 03289 g003
Figure 4. The accuracy (RMSE in meters) of the proposed merged method for the first TH-1 and ZY-3 experiment sequentially integrating the first bundled set, the second set, the third set and the fourth set.
Remotesensing 17 03289 g004
Figure 5. The accuracy (RMSE in meters) of the proposed merged method for the second TH-1 and ZY-3 experiment sequentially integrating the first bundled set, the third set, the second set and the fourth set.
Remotesensing 17 03289 g005
Figure 6. The accuracy (RMSE in meters) of the proposed merged method for the third TH-1 and ZY-3 experiment sequentially integrating the first bundled set, the third set, the fourth set and the second set.
Remotesensing 17 03289 g006
Figure 7. The accuracy (RMSE in meters) of the proposed merged method for the first IKONOS experiment sequentially integrating the first bundled set, the second set and the third set.
Remotesensing 17 03289 g007
Figure 8. The accuracy (RMSE in meters) of the proposed merged method for the second IKONOS experiment sequentially integrating the first bundled set, the third set and the second set.
Remotesensing 17 03289 g008
Figure 9. The accuracy (RMSE in meters) of the proposed merged method for the third IKONOS experiment sequentially integrating the second bundled set, the first set and the third set.
Remotesensing 17 03289 g009
Table 1. Information on the sixfold overlap homologous IKONOS images for Hobart, Australia.
SetImage NameAcquisition TimeSensor Azimuth (°)Resolution (m)Image Size (Pixels)
1IKONOS-Scence0122 February 2003
00:27:24.8
293.7112,124 × 13,148
IKONOS-Scence0222 February 2003
00:27:03.8
329.4112,124 × 13,148
2IKONOS-Scence0322 February 2003
00:27:54.3
235.7112,124 × 13,148
IKONOS-Scence0422 February 2003
00:27:24.8
293.743031 × 3287
3IKONOS-Scence0522 February 2003
00:27:03.8
329.443031 × 3287
IKONOS-Scence0622 February 2003
00:27:54.3
235.743031 × 3287
Table 2. Information on the elevenfold overlap heterogeneous TH-1 and ZY-3 images for Dengfeng, Henan.
SetImage NameAcquisition TimeSensorResolution (m)Image Size (Pixels)
TH1-Scence0127 March 2013Forward
1TH1-Scence0227 March 2013Nadir512,000 × 12,000
TH1-Scence0327 March 2013Backward
TH1-Scence0415 June 2013Forward
2TH1-Scence0515 June 2013Nadir512,000 × 12,000
TH1-Scence0615 June 2013Backward
TH1-Scence0730 August 2013Forward
3TH1-Scence0830 August 2013Nadir512,000 × 12,000
TH1-Scence0930 August 2013Backward
4ZY3-NAD013 November 2013Nadir2.124,525 × 24,410
ZY3-NAD023 February 2012Nadir
Table 3. The accuracy comparison of the traditional method, the direct method and the merged method for the first two sets of TH-1 images (RMSE in meters).
The Traditional MethodThe Direct MethodThe Merged Method
Planimetric7.977.888.49
Vertical4.294.213.20
Table 4. Accuracy comparison of the traditional method, the direct method and the merged method for the first three sets of TH-1 images (RMSE in meters).
The Traditional MethodThe Direct MethodThe Merged Method IThe Merged Method II
Planimetric7.887.758.197.69
Vertical4.724.613.123.07
Table 5. The accuracy comparison of the traditional method, the direct method and the merged method for all the sets of TH-1 and ZY-3 images (RMSE in meters).
The Traditional MethodThe Direct MethodThe Merged Method IThe Merged Method IIThe Merged Method III
Planimetric87.738.226.727.39
Vertical5.194.583.433.123.18
Table 6. Accuracy comparison of the traditional method, the direct method and the merged method for the first two IKONOS image sets (RMSE in meters).
The Traditional MethodThe Direct MethodThe Merged Method
Planimetric0.750.731.29
Vertical0.750.820.89
Table 7. The accuracy comparison of the traditional method, the direct method and the merged method for all three IKONOS image sets (RMSE in meters).
The Traditional
Method
The Direct
Method
The Merged
Method I
The Merged
Method II
The Merged
Method III
Planimetric0.740.841.281.142.26
Vertical0.640.770.710.833.02
Table 8. Computational time for the direct method and the merged method using IKONOS and TH-1 data (in seconds).
IKONOSTH-1
the direct method0.9281.24
the merged method0.5610.597
Disclaimer/Publisher’s Note: The statements, opinions and data contained in all publications are solely those of the individual author(s) and contributor(s) and not of MDPI and/or the editor(s). MDPI and/or the editor(s) disclaim responsibility for any injury to people or property resulting from any ideas, methods, instructions or products referred to in the content.