Article

From the Moon to Mercury: Release of Global Crater Catalogs Using Multimodal Deep Learning for Crater Detection and Morphometric Analysis

by
Riccardo La Grassa
1,*,
Cristina Re
1,
Elena Martellato
1,
Adriano Tullo
1,
Silvia Bertoli
1,
Gabriele Cremonese
1,
Natalia Amanda Vergara Sassarini
1,
Maddalena Faletti
2,
Valentina Galluzzi
3 and
Lorenza Giacomini
3
1
INAF–Astronomical Observatory of Padua, Vicolo dell’Osservatorio 5, 35122 Padova, Italy
2
Centro di Ateneo di Studi e Attività Spaziali “Giuseppe Colombo”, Via Venezia 15, 35131 Padova, Italy
3
INAF–Institute for Space Astrophysics and Planetology, Via Fosso del Cavaliere 100, 00133 Rome, Italy
*
Author to whom correspondence should be addressed.
Remote Sens. 2025, 17(19), 3287; https://doi.org/10.3390/rs17193287
Submission received: 5 July 2025 / Revised: 29 August 2025 / Accepted: 22 September 2025 / Published: 25 September 2025

Abstract

Highlights

What are the main findings?
  • First global crater catalog for Mercury (>400 m) produced using a multimodal deep-learning pipeline.
  • Extension of YOLOLens to multimodal inputs enables robust crater detection in shadowed and degraded terrains.
What is the implication of the main finding?
  • Multimodal learning establishes a scalable approach for planetary crater detection and morphometric studies.
  • Cross-planet generalization opens the way to automated crater detection on other planetary bodies.

Abstract

This study has compiled the first impact-crater dataset for Mercury with diameters greater than 400 m by a multimodal deep-learning pipeline. We present an enhanced deep learning framework for large-scale planetary crater detection, extending the YOLOLens architecture through the integration of multimodal inputs: optical imagery, digital terrain models (DTMs), and hillshade derivatives. By incorporating morphometric data, the model achieves robust detection of impact craters that are often imperceptible in optical imagery alone, especially in regions affected by low contrast, degraded rims, or shadow-dominated illumination. The resulting catalogs LU6M371TGT for the Moon and ME6M300TGT for Mercury constitute the most comprehensive automated crater inventories to date, demonstrating the effectiveness of multimodal learning and cross-planet transfer. This work highlights the critical role of terrain information in planetary object detection and establishes a scalable, high-throughput pipeline for planetary surface analysis using modern deep learning tools. To validate the pipeline, we compare its predictions against the manually annotated catalogs for the Moon, Mercury, and several regional inventories, observing close agreement across the full diameter spectrum, revealing a high level of confidence in our approach. This work presents a spatial density analysis, comparing the spatial density maps of small and large craters highlighting the uneven distribution of crater sizes across Mercury. We explore the prevalence of kilometer-scale (1–5 km range) impact craters, demonstrating that these dominate the crater population in certain regions of Mercury’s surface.

1. Introduction

Impact cratering has played a significant role in shaping the surfaces of atmosphereless bodies such as the Moon and Mercury throughout their history. The giant impacts that created the large basins, combined with continuous impact cratering up to the present day, have profoundly influenced the planet’s surface. This process, in conjunction with volcanic activity and tectonic forces, has been a major driver of Mercury’s geological evolution [1]. The analysis of crater distributions allows one to compare different regions, estimate the ages of geological units, interpret evolutionary processes, and infer the geological and geomechanical properties of planetary surfaces. In this context, impact crater catalogs are fundamental tools in planetary sciences, offering valuable information on the geological history and evolution of celestial bodies [2,3,4,5,6,7]. These catalogs enable the derivation of crater densities across surfaces, which serve as a valuable method for dating specific geological units or processes and establishing chronostratigraphic sequences of surface-modifying events [8,9,10,11,12].
Over the years, advancements in space missions equipped with high-resolution remote sensing instruments have facilitated the creation of increasingly accurate crater catalogs. Early catalogs were produced manually, relying on the competencies of expert scientists to identify craters on remote sensing data. For instance, on the Moon, Head’s catalog, created using high-resolution data from the Lunar Orbiter Laser Altimeter (LOLA), primarily listed large lunar craters with diameters over 20 km [6]. Povilaitis later extended this catalog to include craters down to 5 km, promoting studies of younger terrains and geological processes [7]. A significant advancement came with Robbins’ catalog, which includes craters with diameters greater than 1 km and was compiled using images from the Lunar Reconnaissance Orbiter (LRO) camera [13] and the Kaguya Terrain Camera (TC) [14]. On the Moon, the study of impact cratering is also closely connected to the investigation of polar regions, where permanently shadowed areas host deposits of volatile-rich ices that are of major scientific and exploration interest [15]. On Mercury, the first attempts to create a comprehensive crater catalog [16] were limited by the low spatial resolution and the wide range of solar illumination conditions of images from missions like Mariner 10 and MESSENGER, hindering the development of a consistent global dataset of uniformly classified craters. Despite these efforts, existing crater catalogs have limitations that do not allow for more detailed analysis. For example, actual Lunar crater datasets focus on craters larger than 1 km, and primarily rely on optical imagery [3,5,6,7,17,18,19]. Specific applications such as selecting landing sites for future lunar missions require precise knowledge of the location and dimensions of craters smaller than one kilometer to ensure lander safety and maximize scientific value [8]. On Mercury, the lack of detailed catalogs makes it complex even to analyze crater populations, particularly in regions with high crater densities [16]. Recent advancements in remote sensing technology, image processing techniques, and computational power have led to the development of sophisticated automatic detection algorithms [20,21,22,23]. These methods utilize characteristics such as shape and depth to identify craters more efficiently [3,24,25,26]. The integration of diverse multimodal remote sensing datasets such as multi-spectral images, laser altimeters, and thermal infrared data has further improved crater exploration. The transformation of crater catalogs into detailed datasets will support deep learning models such as Ground-Truth for tasks like semantic segmentation, detection, and classification. The neural network can be applied to larger datasets of the same body or even different planetary bodies through transfer learning techniques [26]. More generally, it can also serve as a feature extractor and be fine-tuned for application in other contexts [27]. An example of a crater catalog is produced using automatic Crater Detection Algorithms (CDAs) [5], based on crater shape and size, incorporating edge detection methods, e.g., [28,29]. Although this catalog included craters down to ≥8 km in diameter and was successively improved through a hybrid CDA [13], a need for more comprehensive datasets covering smaller craters remained. In this study, a significant advancement in crater cataloging is presented by compiling comprehensive global datasets of impact craters for both the Moon and Mercury. We apply a deep learning multimodal approach, presenting a CDA based on a convolutional neural network fine-tuned on lunar data and adapted to Mercury through transfer learning. Our CDA, known as YOLOLens [2], uses a super-resolution deep learning model that enhances spatial resolution by 2 × , improving crater detection. The algorithm leverages a multimodal dataset integrating visible spectrum images, Digital Elevation Models (DEMs), hillshade imagery, and, combined with post-processing techniques, has led to the creation of an enhanced version of the previous lunar catalog LU5M812TGT [30] and the new ME6M300TGT Hermean global catalog.
This paper is organized as follows. In Section 2, the preprocessing image datasets involved and the main workflow are introduced. In Section 2.2, the crater detection algorithm is described, and the methods developed for the extraction of the morphometric parameters are reported in Section 2.3. In Section 3.1 and Section 3.3, the catalogs are described and evaluation procedures are presented to examine the catalog in detail, and finally, in Section 4, the concluding remarks are reported.

2. Materials and Methods

Accurate detection and characterization of craters are crucial tasks challenged by the projections of the source map and its spatial resolution, the variability in crater sizes, and the limitations of individual data layers in the identification of craters in complex terrains. This subsection outlines the comprehensive workflow developed to address these challenges, detailing the construction of a distortion-mitigated celestial body grid, the application of multi-scale processing to capture craters of varying sizes, and the integration of a multi-band dataset for robust detection in diverse surface environments. The adaptability of the workflow was designed with the aim of easily adapting to the study of impact craters on different celestial bodies with similar challenges.

2.1. Preprocessing and Dataset

The workflow involves generating a complete grid for a celestial body, composed of projected tiles extracted from global mosaics, specifically the datasets of LROC WAC [13] for the Moon and MESSENGER Mercury Dual Imaging System (MDIS) [31] for Mercury. To address projection distortion effects, particularly near the polar regions, the initial cylindrical projection is transformed into a local orthographic projection. This transformation minimizes dilation and improves the performance of the neural network in detecting craters across the grid. For each orthographic tile, the cylindrical coordinates (expressed in longitude and latitude) are retained as primary location references. In addition, projection distortion coefficients for the transformation from cylindrical to orthographic projection are computed and stored. This ensures that spatial accuracy and distortion effects are taken into account during crater detection. A critical issue arises when a crater’s size exceeds the dimensions of a tile, potentially leading to its exclusion. To address this, a triple-image sub-sampling approach is employed. For each tile, three images are generated at varying scales, capturing a range of crater sizes and enabling accurate detection of both small and large craters. This multi-scale strategy ensures that no significant craters are discarded. To optimize the process, three window sizes are defined. These windows are applied consistently across both the Lunar and Mercurian datasets, as illustrated in Figure 1. For the Moon, the workflow utilizes the Robbins crater catalog as Ground-Truth to generate labeled data, which is critical for fine-tuning the neural network in the supervised paradigm. In contrast, Mercury lacks a large and comprehensive Ground-Truth dataset. The methodology applies the same workflow, relying solely on the predictive capabilities of the neural network.

Overcoming the Limitations of Imagery in Permanently Shadowed Regions

The core principle behind constructing this 3-band dataset is to provide the neural network with complementary information that emphasizes the unique characteristics of impact craters, boosting their detectability. The 3-band dataset is composed of the following:
  • LROC WAC Image: This serves as a baseline visual representation, capturing the albedo variations, textures, and subtle patterns suggestive of the crater forms.
  • LROC WAC DTM: The DTM directly encodes elevation data. Key aspects beneficial for crater detection include the following:
    Rim Definition: Pronounced elevation changes at crater rims become starkly visible in the DTM, allowing the model to delineate crater boundaries more confidently, even for degraded or partially obscured craters.
    Interior Depth: The craters exhibit a distinct bowl-shaped depth profile that the DTM highlights, helping discriminate them from other circular depressions that might appear similar in the WAC image alone.
  • LROC WAC Hillshade: Simulates how the terrain would appear when illuminated from a specific angle. Strategically, it emphasizes topographic details, providing a perspective to enhance the robustness of the features.
Finally, the 3-band dataset must maintain perfect pixel-to-pixel registration between the WAC, DTM, and hillshade layers. The preprocessing phase involves resampling to a common resolution and applying precise spatial co-registration techniques (see Data Preparation in Figure 1). Each band (WAC, DTM, hillshade) is normalized to a standard range (e.g., [0–1]) to prevent any single data type from dominating the feature space. The existing YOLOLens model has been modified to take advantage of the 3-band dataset instead of the single WAC image. The model parameters could learn to extract patterns representing rims, slopes, and depth profiles relevant to crater identification. For Mercury, a combination of the 250 m/px DTM for Mercury’s Northern Polar Region and the 665 m/px global DEM for the other areas is used. The 250 m/px DTM covers latitudes close to the North Pole, providing the high-resolution data needed to accurately measure fine-scale topographic features in this region. For craters located outside the North Pole area, the 665 m/px global DEM is used, ensuring complete planetary coverage. The combination of these two maps allows for accurate and consistent extraction of crater morphometric parameters throughout Mercury, enabling a balance between high-resolution details at the North Pole and a broader global coverage. Regarding the visible spectrum image, we used the Mercury MESSENGER MDIS Basemap LOI Global Mosaic at 166 m/px, then, as for the Moon experiments, we warped the DTM to 166 m/px to achieve a 1:1 ratio before fusion. This supports reliable detection of craters larger than 400 m.

2.2. The Model

The YOLOLens model, introduced by [2], leverages deep learning and super-resolution techniques to improve the detection of impact craters on planetary surfaces. By addressing challenges such as low spatial resolution and variable solar illuminance in satellite imagery, YOLOLens demonstrated enhanced precision and recall metrics compared to state-of-the-art methods. The parameters are modified at the first/last layers such that the model creates super-resolution (SR) images from a single input image at 3 bands instead of 1 band using convolutive layers (see Table A1 in Appendix A). Then, the SR output is used by an object-detection model in an end-to-end model, where the final error computed will be backpropagated over the unique model designed. The object-detection layers will be responsible for the crater detection task using SR-generated images (visible spectrum, DTM, and Hillshade features) to enhance the crater recognition.
More formally, let x R H × W × C represent a low-resolution input image, where H, W, and C denote its height, width, and number of channels, respectively.
  • Super-Resolution Generator: The generator G : R H × W × C R r H × r W × C applies super-resolution to the input, producing a high-resolution image:
    x HR = G ( x ) ,
    where r > 1 is the resolution scaling factor, and x HR R r H × r W × C .
  • Object-Detection Model: The high-resolution output x HR is then forwarded to an object-detection model D : R r H × r W × C Y , which performs object-detection and returns a set of predictions:
    Y = D ( x HR ) ,
    where Y is the set of detected objects and their corresponding attributes (e.g., class labels, bounding box coordinates, and confidence scores).
  • Unified Function: The entire system can be represented as a composite function F : R H × W × C Y , where
    F ( x ) = D ( G ( x ) )
Given the pre-trained model derived by [2] on WAC data, the new revised model is fine-tuned on the balanced WLH-Moon crater dataset (Table 1). Training was carried out for up to 100 epochs (patience = 80) with 8-image batches of 416 × 416 px inputs on a single GPU. We adopted the Adam optimizer (initial learning rate l r 0 = 2 × 10 4 , cosine decay to 1% of l r 0 , weight decay = 5 × 10 4 , β 1 = 0.937 ) and enabled automatic mixed-precision. Data augmentation was restricted to 100 % mosaic tiling, without flips or intensity transforms. Inference and validation employed IoU-NMS with a 0.7 threshold and allowed up to 3000 detections per image. To achieve acceptable generalization model capabilities, a balancing function is applied to split the dataset into the training/validation set across latitude ranges and windows in order to ensure robust model generalization (Table 1). Finally, the entire planet grid is employed in the test step to have the complete celestial body crater counting.

2.3. Methods for Extraction of Morphometric Parameters

To extract detailed morphometric information for craters in the catalogs, different global and local DTMs are used as sources of the elevation data. Given the catalog of craters derived by YOLOLens, the post-processing step adds a function to extract the morphometric information. All the measured elevation points are extracted using a spatial window that depends on the diameter size of the crater to avoid the prediction of misalignment of the bounding box around the craters and obtain more accurate values (see Figure 2).
More formally, let D w and D h the diameters extracted from the AI-catalog; then, the average diameter is defined as follows:
D = D w + D h 2
The neighborhood size is
n = max 1 4 · D · 1000 s p , 4
where s p is the spatial resolution expressed in m/px. Given x c and y c to be the coordinates in pixel space of the crater’s center, the neighborhood coordinates of x c , y c are
x coords = x c n 2 , x c + n 2 , y coords = y c n 2 , y c + n 2
the sub-array centered at ( x c , y c ) is
sub_array = img [ x coords [ 0 ] : x coords [ 1 ] , y coords [ 0 ] : y coords [ 1 ] ]
where img is the bounding box of the craters predicted by YOLOLens.
The central depth is
d c = min ( sub_array )
The maximum peak in the neighborhood is
p max = max ( sub_array )
Analogously, the same method is applied for each rim (right, left, top, bottom) of the craters to retrieve the maximum peak of the neighborhood of the predicted crater’s border.
Then, the differential depths between each rim and the center are given by the following:
Δ d rim = d rim d c
Finally, the depth-to-diameter ratio is derived as follows:
Δ D = max ( d r i m r , d r i m l , d r i m t , d r i m b ) d c D · 1000
The stored data was then added to the AI catalog to improve the dataset for scientific analysis. For the Moon, a combination of the following three covered maps is used:
  • LDEM at 60 m/px in the range [−90°, −60°] of latitude [32];
  • LRO LOLA at 118 m/px in the range [60°, 90°] of latitude [33,34,35,36,37,38,39,40];
  • LRO LOLA-SELENE Kaguya ±60° of latitude at 60 m/px [33].

3. Results

3.1. Enhancements to the Lunar Global Catalog: The LU6M371TGT

This section introduces the lunar catalog derived through the revised version of the YOLOLens model. By leveraging a recall-based assessment, a benchmark of the model against established lunar crater catalogs is presented, such as the Ground-Truth Robbins catalog and the previous LU5M812TGT catalog. The analysis focuses on comparing retrieval capabilities across the Moon, particularly in regions with Permanent Shadow Regions (PSRs), which present unique detection challenges. The recall improvements are analyzed in the South and North lunar poles, regions critical for understanding the model’s generalization capabilities. Furthermore, the study extends to an equatorial analysis and includes qualitative evaluations by experts. These insights aim to validate the YOLOLens model’s advancements in crater detection and its ability to enhance the completeness and accuracy of lunar datasets.

3.2. Model’s Performance

To assess the crater detection performance by using the new data and the revised model, the recall score is evaluated as ( True Positives True Positives + False Negatives ). This metric is compared to the Ground-Truth Robbins catalog and the previous LU5M812TGT catalog to benchmark the model’s retrieval capability over the Moon. In Table 2, the recall results across the South and North lunar poles are reported and compared. The experimental results prove our initial hypothesis, in which the model enhances its generalization capability by using the multimodal data, also increasing the crater detection task across the regions characterized by shaded areas in the images, even the Permanent Shadow Regions (PSRs). Almost double the Robbins recall is reached using the new revised version of YOLOLens reported in catalog LU6M371TGT than in the previous one, LU5M812TGT, in regions α and ϵ . As the analysis moves farther from the South/North Poles to the equatorial region, the improvements are marginal, attributed to the lower prevalence of shaded areas.
To further compare the previous catalog with the new one, the same three tiles in [30] are selected, in the range of ±60 of latitudes. In these tiles, the experienced operators verified craters’ accuracy at different confidence intervals, ranging from 0.2 to 0.4 . The results of the analysis are reported in Table 3. A low number of false positives is found in the range ±60 of latitudes, little improvement over the previous catalog [30] in terms of percentage and high crater counting (see red in Table 3). Regarding the confidence threshold, we manually inspected a large number of detected craters and established an appropriate compromise by testing different values across regions. The chosen threshold ensured a low rate of false positives while maintaining a high rate of true positives. The qualitative/quantitative analysis carried out by operators confirms the effectiveness of the YOLOLens model in crater prediction and the correctness of all results provided by the workflow introduced in this manuscript. This outcome underscores the effectiveness of integrating elevation data with visible imagery, as the inclusion of elevation data enables the identification of craters within deeply shaded areas that would otherwise remain undetected (see Figure 3 and Figure A1).
In Figure 1, the global test and post-processing steps (green and red rectangles, respectively), illustrate the final phases to achieve the complete craters dataset. Each crater candidate has been included in the catalog when their confidence level is ≥0.2. Finally, the resulting LU6M371TGT catalog (available at https://doi.org/10.6084/m9.figshare.30188149.v1) contains 6,371,337 craters, in the diameter range between 0.3 km and 109 km. In Figure 4, the density map of the lunar craters is shown. The variables stored in the dataset are the following:
  • Longitude, latitude: These are the crater’s center coordinates in decimal degrees, between ± 180 ° and ± 90 ° . The format utilizes a two-dimensional coordinate system, with separate values for the x and y coordinates.
  • Diameters W, H: These variables represent the horizontal and vertical sides, respectively, of the bounding box of the crater, expressed in kilometers.
  • Confidence: This variable measures the certainty level of the crater identification by means of our model. Higher confidence values suggest a greater likelihood that the identified feature is indeed a crater. This variable is vital for assessing the reliability of each crater record.

3.3. The Global Mercury Catalog ME6M300TGT

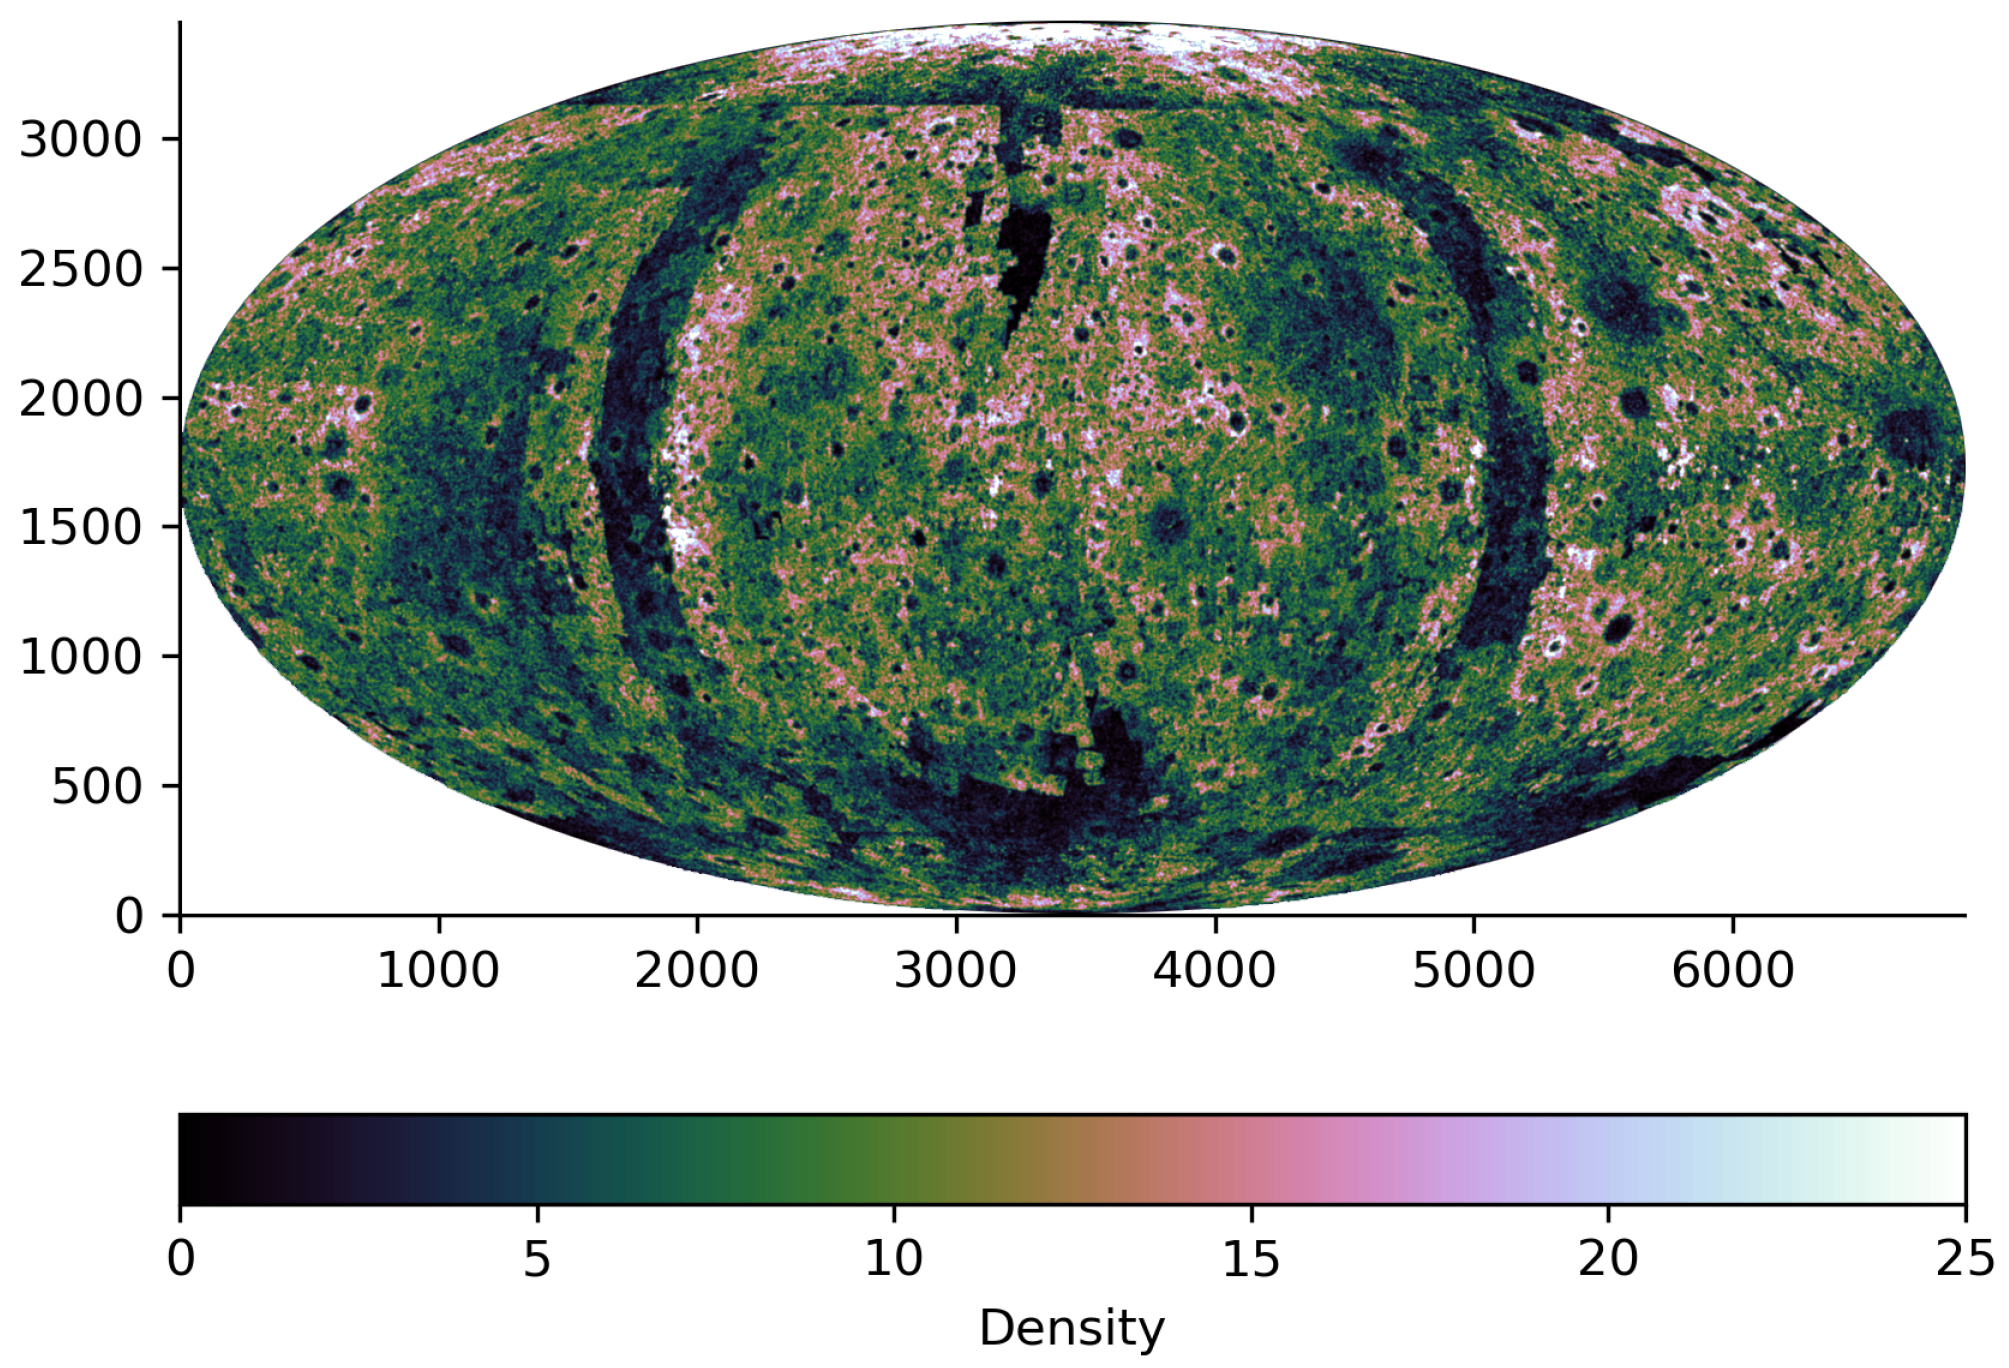
To demonstrate the effectiveness of the revised workflow and the enhanced model, which integrates multiple sources of information, the workflow (outlined in Figure 1) is applied directly to the planet Mercury. Similar to the approach used for the Moon-derived catalog, extensive pre-processing and post-processing steps are applied to the data. Importantly, no additional training or fine-tuning is performed; instead, the pre-trained model developed for the lunar surface is employed without modification. Figure 5 illustrates the density map derived from the final Mercury catalog, referred to as ME6M300TGT (catalog available at https://doi.org/10.6084/m9.figshare.30187999.v1). In Table 4, the distribution of the 6,299,481 detected craters across different size ranges is reported, comparing the results against Herrick’s dataset.

3.3.1. Evaluation of the Crater-Detection Model

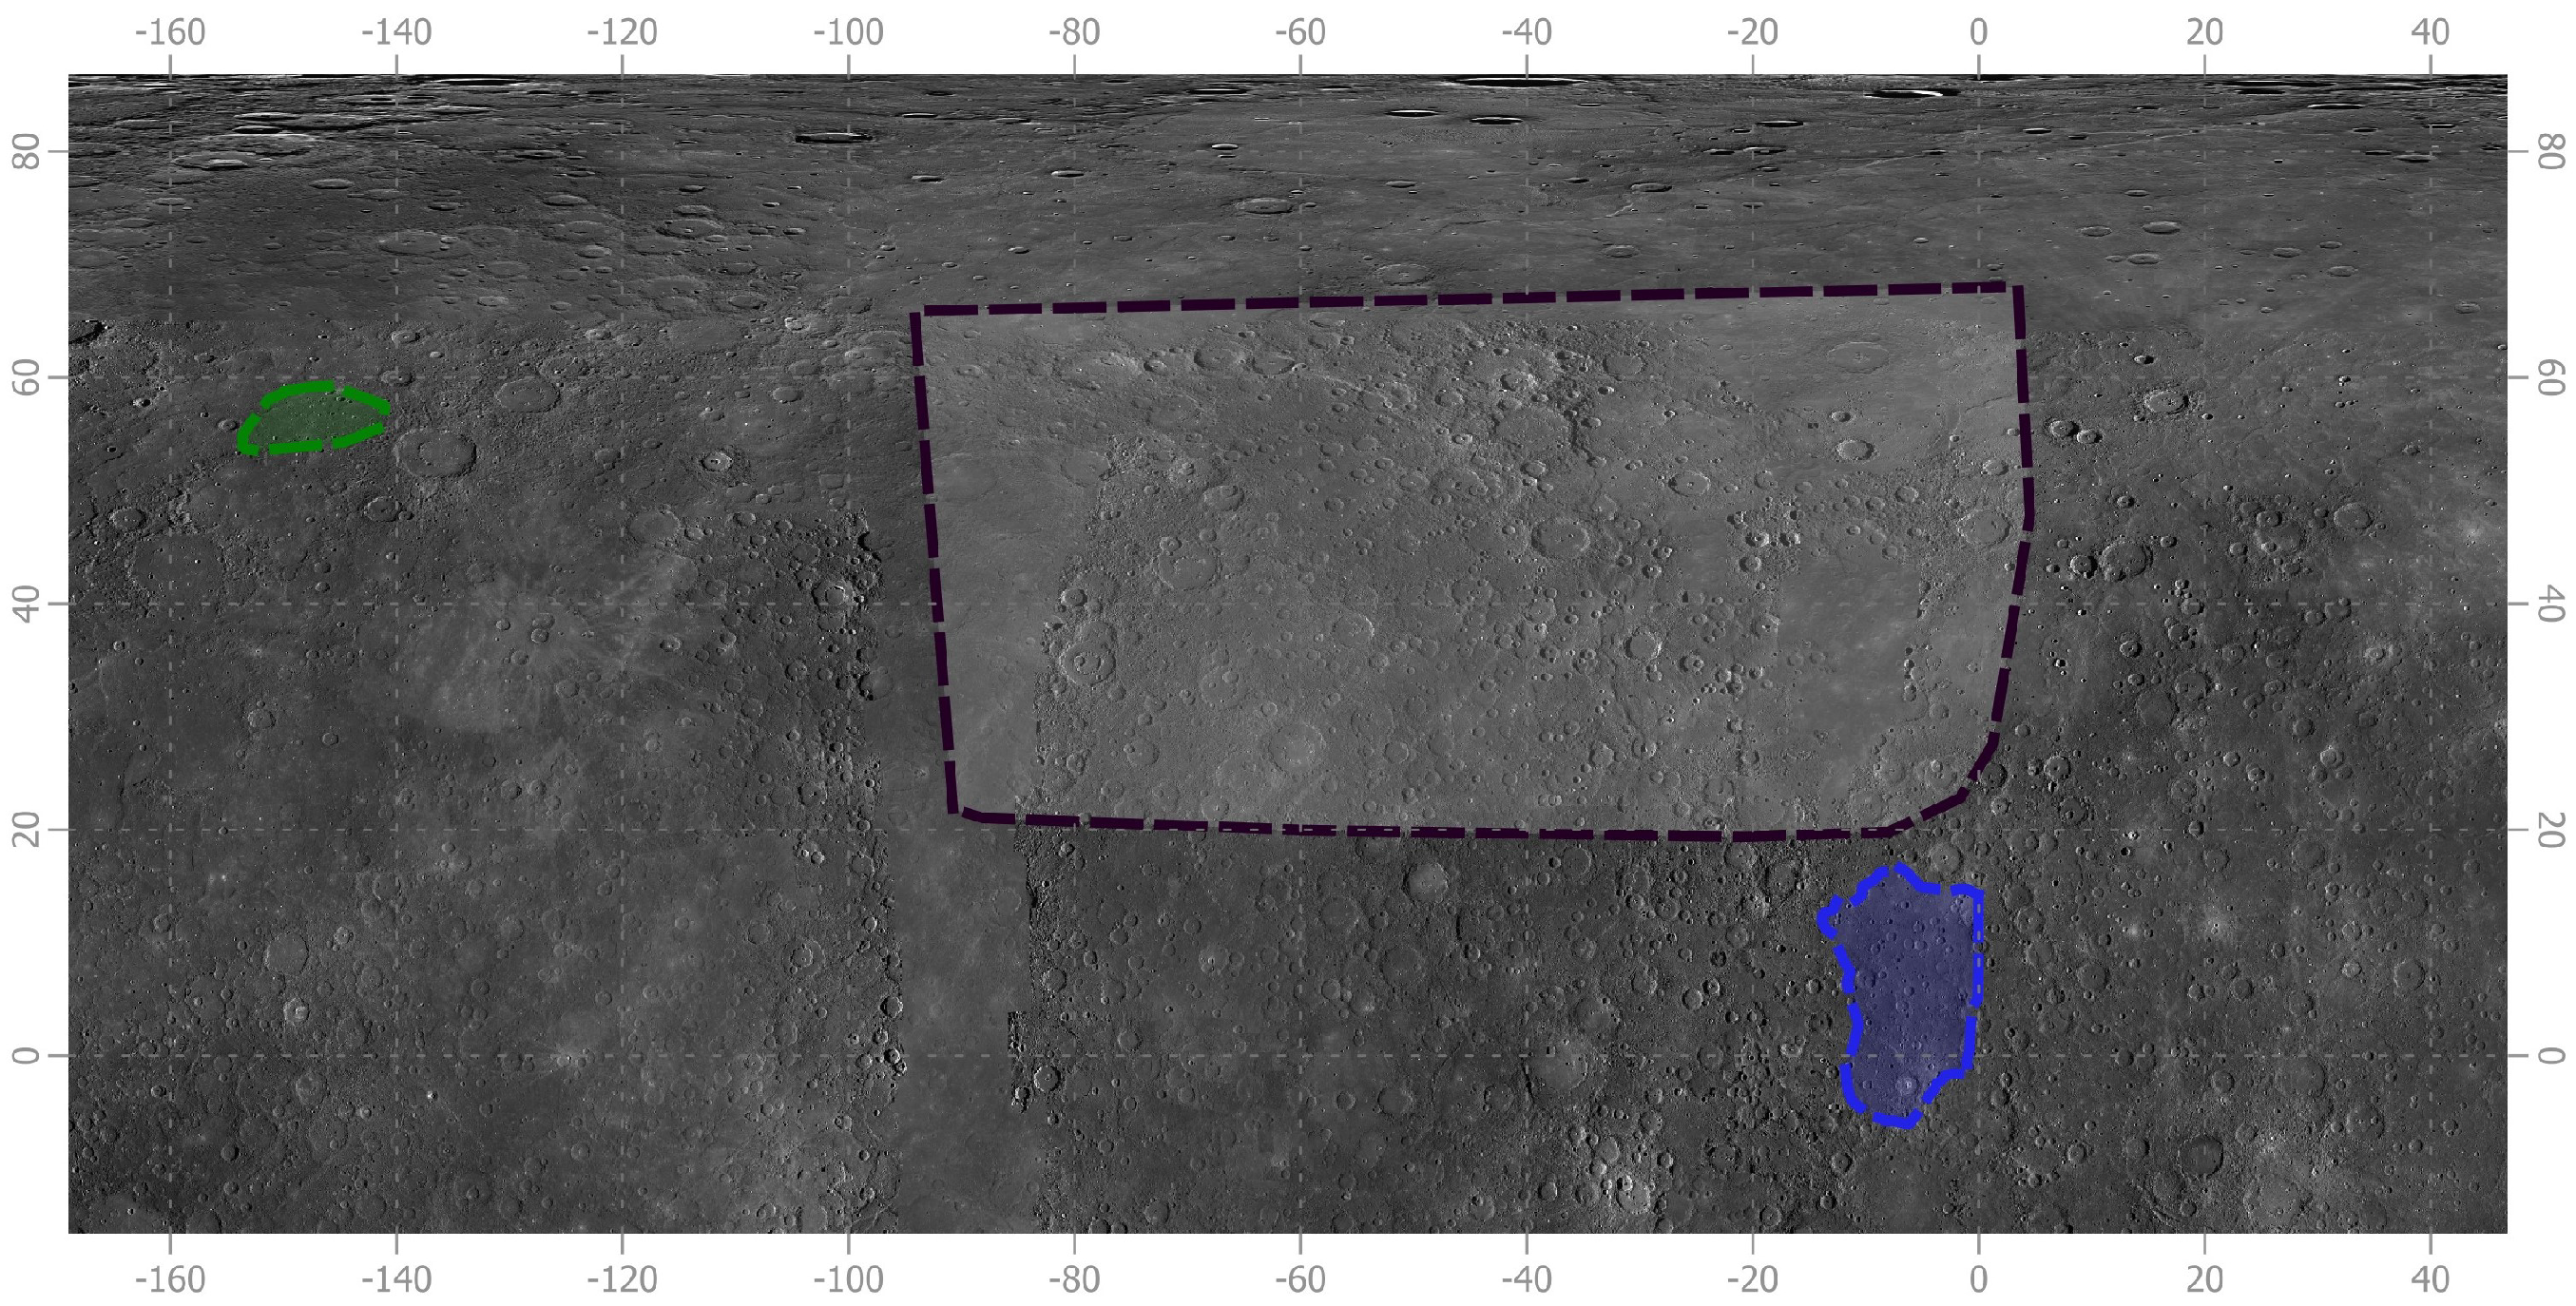
In [16], the author introduced the first comprehensive catalog of Hermean craters. The work reports initial insights derived from the database, while also addressing several limitations that constrain future analyses. Notably, the authors underscored that many craters were likely overlooked in regions with poor lighting conditions. Additionally, the study highlighted various issues related to data quality, which contributed to the catalog’s incompleteness and resulted in the misclassification of craters. To quantify the accuracy of the ME6M300TGT catalog at lower crater diameters, is thus taken into account also other partial datasets to perform the validation of the ME6M300TGT catalog. Since the Ground-Truth data are partial and given the presence of numerous mismatched craters, our validation set was compiled through three different crater manual counts (Figure 6).
The first one is cross-checked with the catalog proposed in the study of [41] for the Victoria Quadrangle (H02). This quadrangle is located between latitudes 22.5°N and 65°N and longitudes 270°E and 360°E, which corresponds to an area of nearly 5 × 10 6   km 2 (about 6.5% of Mercury’s surface), and includes 1732 primary craters ranging from 4.8 km to 100 km in diameter. Of the 1732 manually labeled craters by [41], the YOLOLens model accurately recognized 1579, while also identifying 30,920 craters globally, resulting in a 92% recall. The second crater dataset was produced by [10,12], for a few regions within the Kuiper Quadrangle (H06). This quadrangle extends between −3.67° and 15.89° in latitude, and −13.41° and 0.30° in longitude. The counted craters have diameters ranging from 6 km to 87 km. The model achieved the 80% recall (106 craters correctly detected over 132), demonstrating robust performance in these regions. As the third dataset, an initial count in the Suisei Planitia of the Shakespeare Quadrangle (H03) is expanded. The total counted craters, which encompasses both primaries and secondaries, are 5052. The counts include craters with diameters below the limit imposed by the resolution of the data used by the model, so that the lower limit is not considered in the other counts and can also be validated. Of these, YOLOLens retrieved 2949 craters from a total of 30,017 craters detected globally. The recall rate is 58%, which is likely associated with the difference in resolution, but also, to a smaller extent, with the presence of highly degraded craters. These buried craters with only their rim crests visible present a challenge for the model, which was trained on lunar craters that lack these distinctive characteristics. When validated against the Herrick database, our model achieved an 84% recall rate in the South Pole region (between latitudes −90° and −70°), detecting 352 out of 418 craters, with a global detection count of 35,905 craters in this region. An additional dataset, produced by [42], is considered, which includes primary impact craters with diameters between 2.6 km and 311.0 km, within the latitude range of 6° to 90°N. In detail, they identified 331 primary impact craters on Mercury’s northern hemisphere. In this specific range, our model, YOLOLens, detected 493,970 craters, achieving a recall rate of 95.7% relative to the 331 craters identified by Susorney (317 out of 331). In conclusion, the YOLOLens model generally demonstrates a high retrieval capability, summarized in Table 5. These results confirm the effectiveness of the model, confirming that the transfer learning from the lunar data enables reliable crater detection across Mercury’s surface, as validated through comparisons with manually compiled crater databases. Finally, in Figure 7, the mean of Intersection-Over-Union (IoU) Error we obtain from our catalog with respect to [10,41] and the Suisei Planitia is shown, grouped by the reported bins expressed into km in the x-axis. The IoU serves as a robust performance metric for detection quality by considering the entire area of both the original and detected craters, alongside their intersection.

3.3.2. Size-Frequency Distribution Analysis

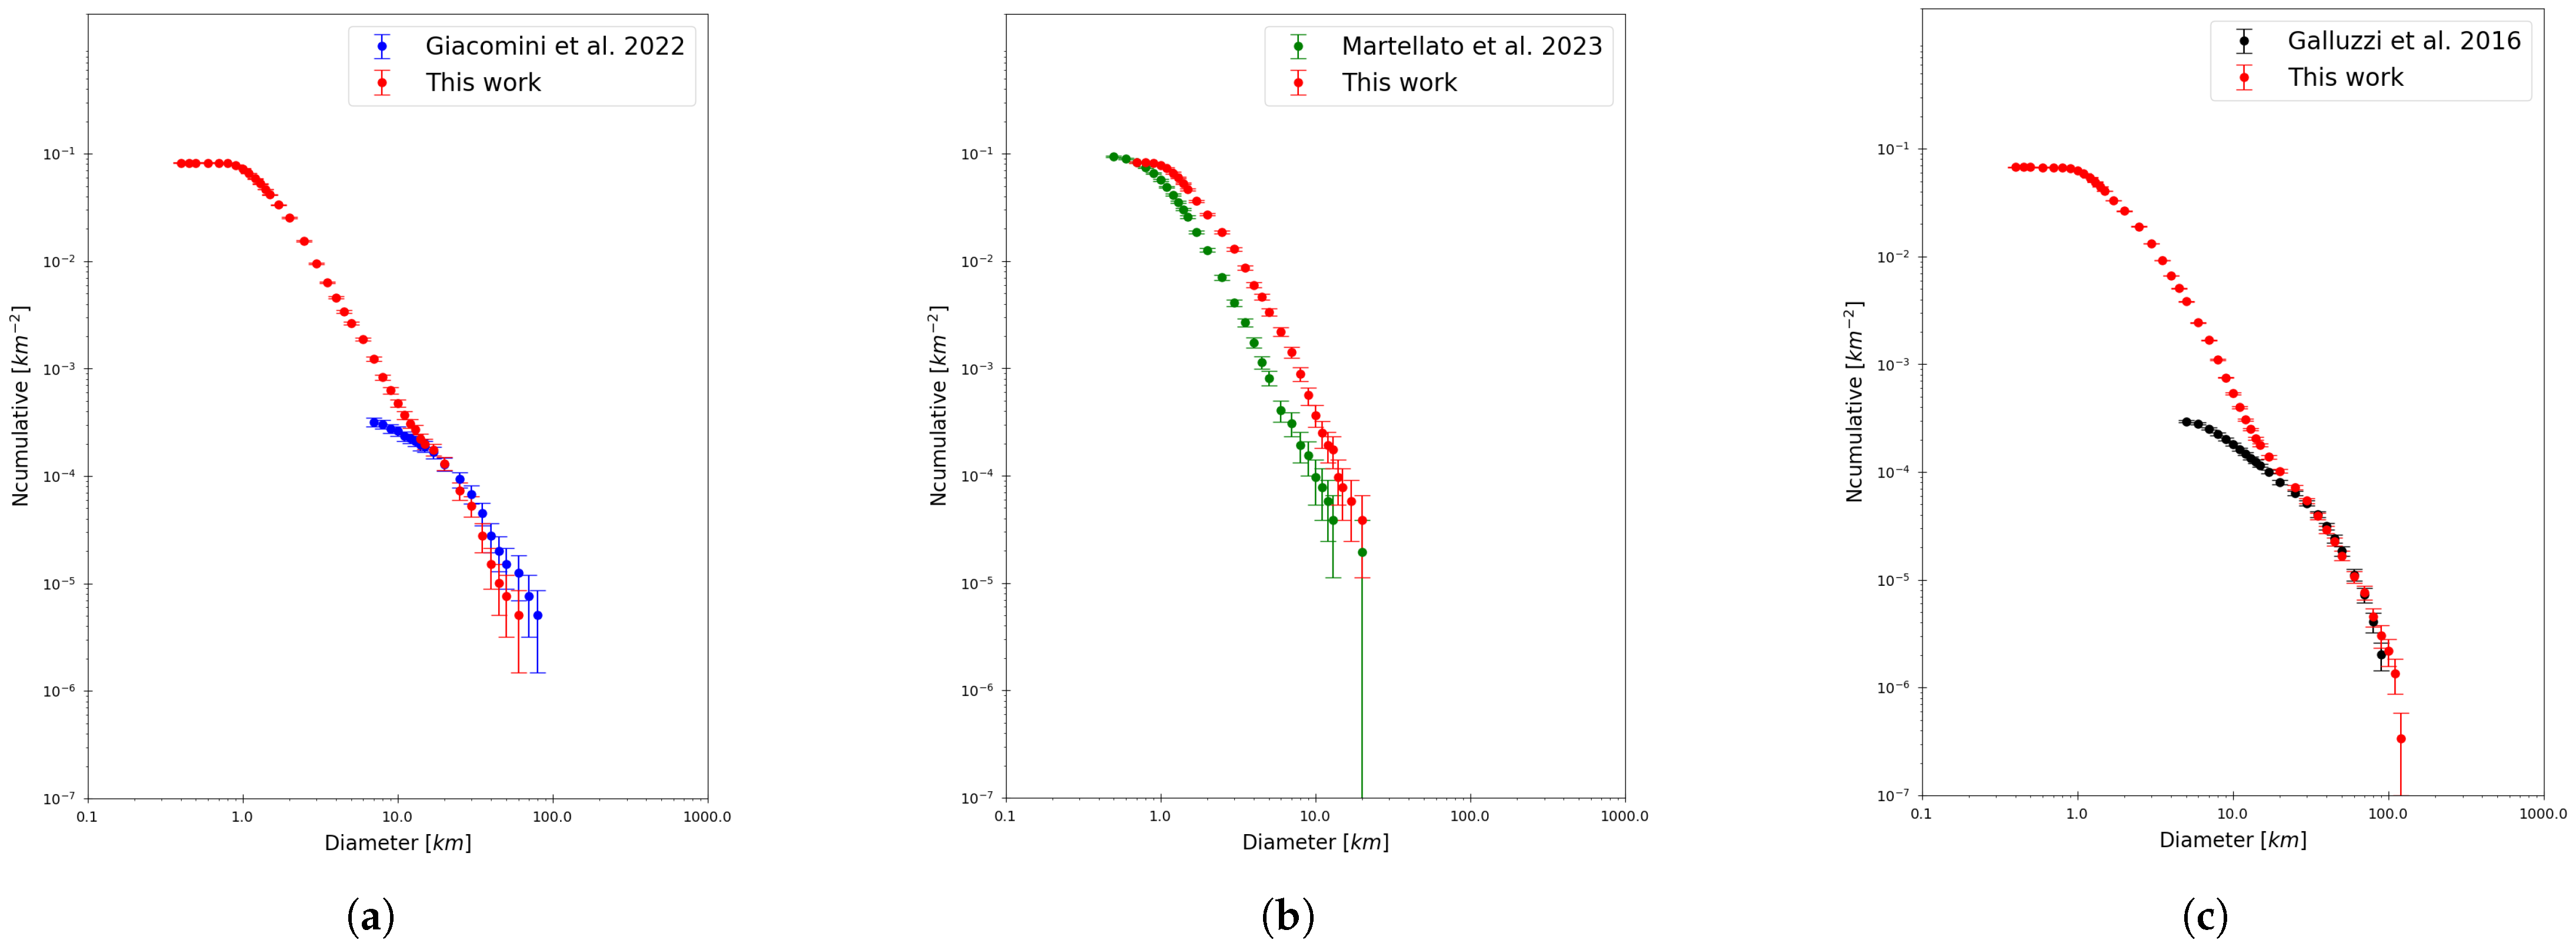
In the investigated regions, generally high recall values are obtained, suggesting robust performances of the YOLOLens model to identify impact craters. Since the areas used for comparison are representative of all the latitudes, such robustness could be extended to all the Hermean surfaces. The recall of the count in Suisei Planitia is the only one of the regions tested to show a rather low recall value. This discrepancy can be attributed to the fact that a larger number of small craters were identified on the manual count, while these features were instead filtered by DEM and thus not detected by the YOLOLens model. Such a disagreement is visible also in Figure 8b. In particular, the cumulative plot of the ME6M300TGT for the Suisei Planitia area shows a shift towards larger diameters, suggesting that at sizes lower than 10 km, the crater diameter is overestimated by 30%. Figure 8a and Figure 8c highlight a further discrepancy between the ME6M300TGT catalog and the manual counts by Giacomini et al. and Galluzzi et al., respectively. Indeed, in the range between 10 and 20 km, the SFD curves of the ME6M300TGT catalog and manual count dataset start to diverge, with the ME6M300TGT SFD becoming steeper with decreasing crater sizes. The most likely reason for such a mismatch can be ascribed to the fact that the manual counts were fulfilled only of the primary craters, whereas the YOLOLens model detected all the impact structures regardless of their origin. As shown in several previous works [1,6], secondary craters on Mercury are generally up to 10 km in size, but can reach dimensions as large as 20 km. This diameter range of the influence of secondaries on the crater population is exactly the one pointed out by the crater SFD curves in Figure 8a,c. Therefore, once taking into account the issue raised by secondaries, the Giacomini et al. and the Galluzzi et al. datasets are a suitable reference for Ground-Truth for the model’s validation. For the craters larger than 10–20 km, a good match of the ME6M300TGT crater SFD with the manually counted crater datasets within the error bars is obtained; Figure 8 shows the discrepancy in SFDs below 10 km due to the fact that the studies considered focused only on primary craters.

3.3.3. Comparison with Current Geological Knowledge

The development of a comprehensive global catalog allows us to investigate the distribution of craters and their morphometric characteristics, and from them observe clues about the evolution of the Hermean surface. The crater density information provides us with important insights about the age of the different regions and the rates of degradation or remodeling. The map in Figure 9 is divided by diameter range and shows remarkable parallels with the geological mapping of several quadrangles. Many geological units identified to date are, in fact, linked to the distribution of craters, which influences their appearance and age definition (Figure 10). This relationship is discussed in more detail in the following paragraphs, subdivided according to the most widespread geological units in the current geological interpretation of Mercury [44].
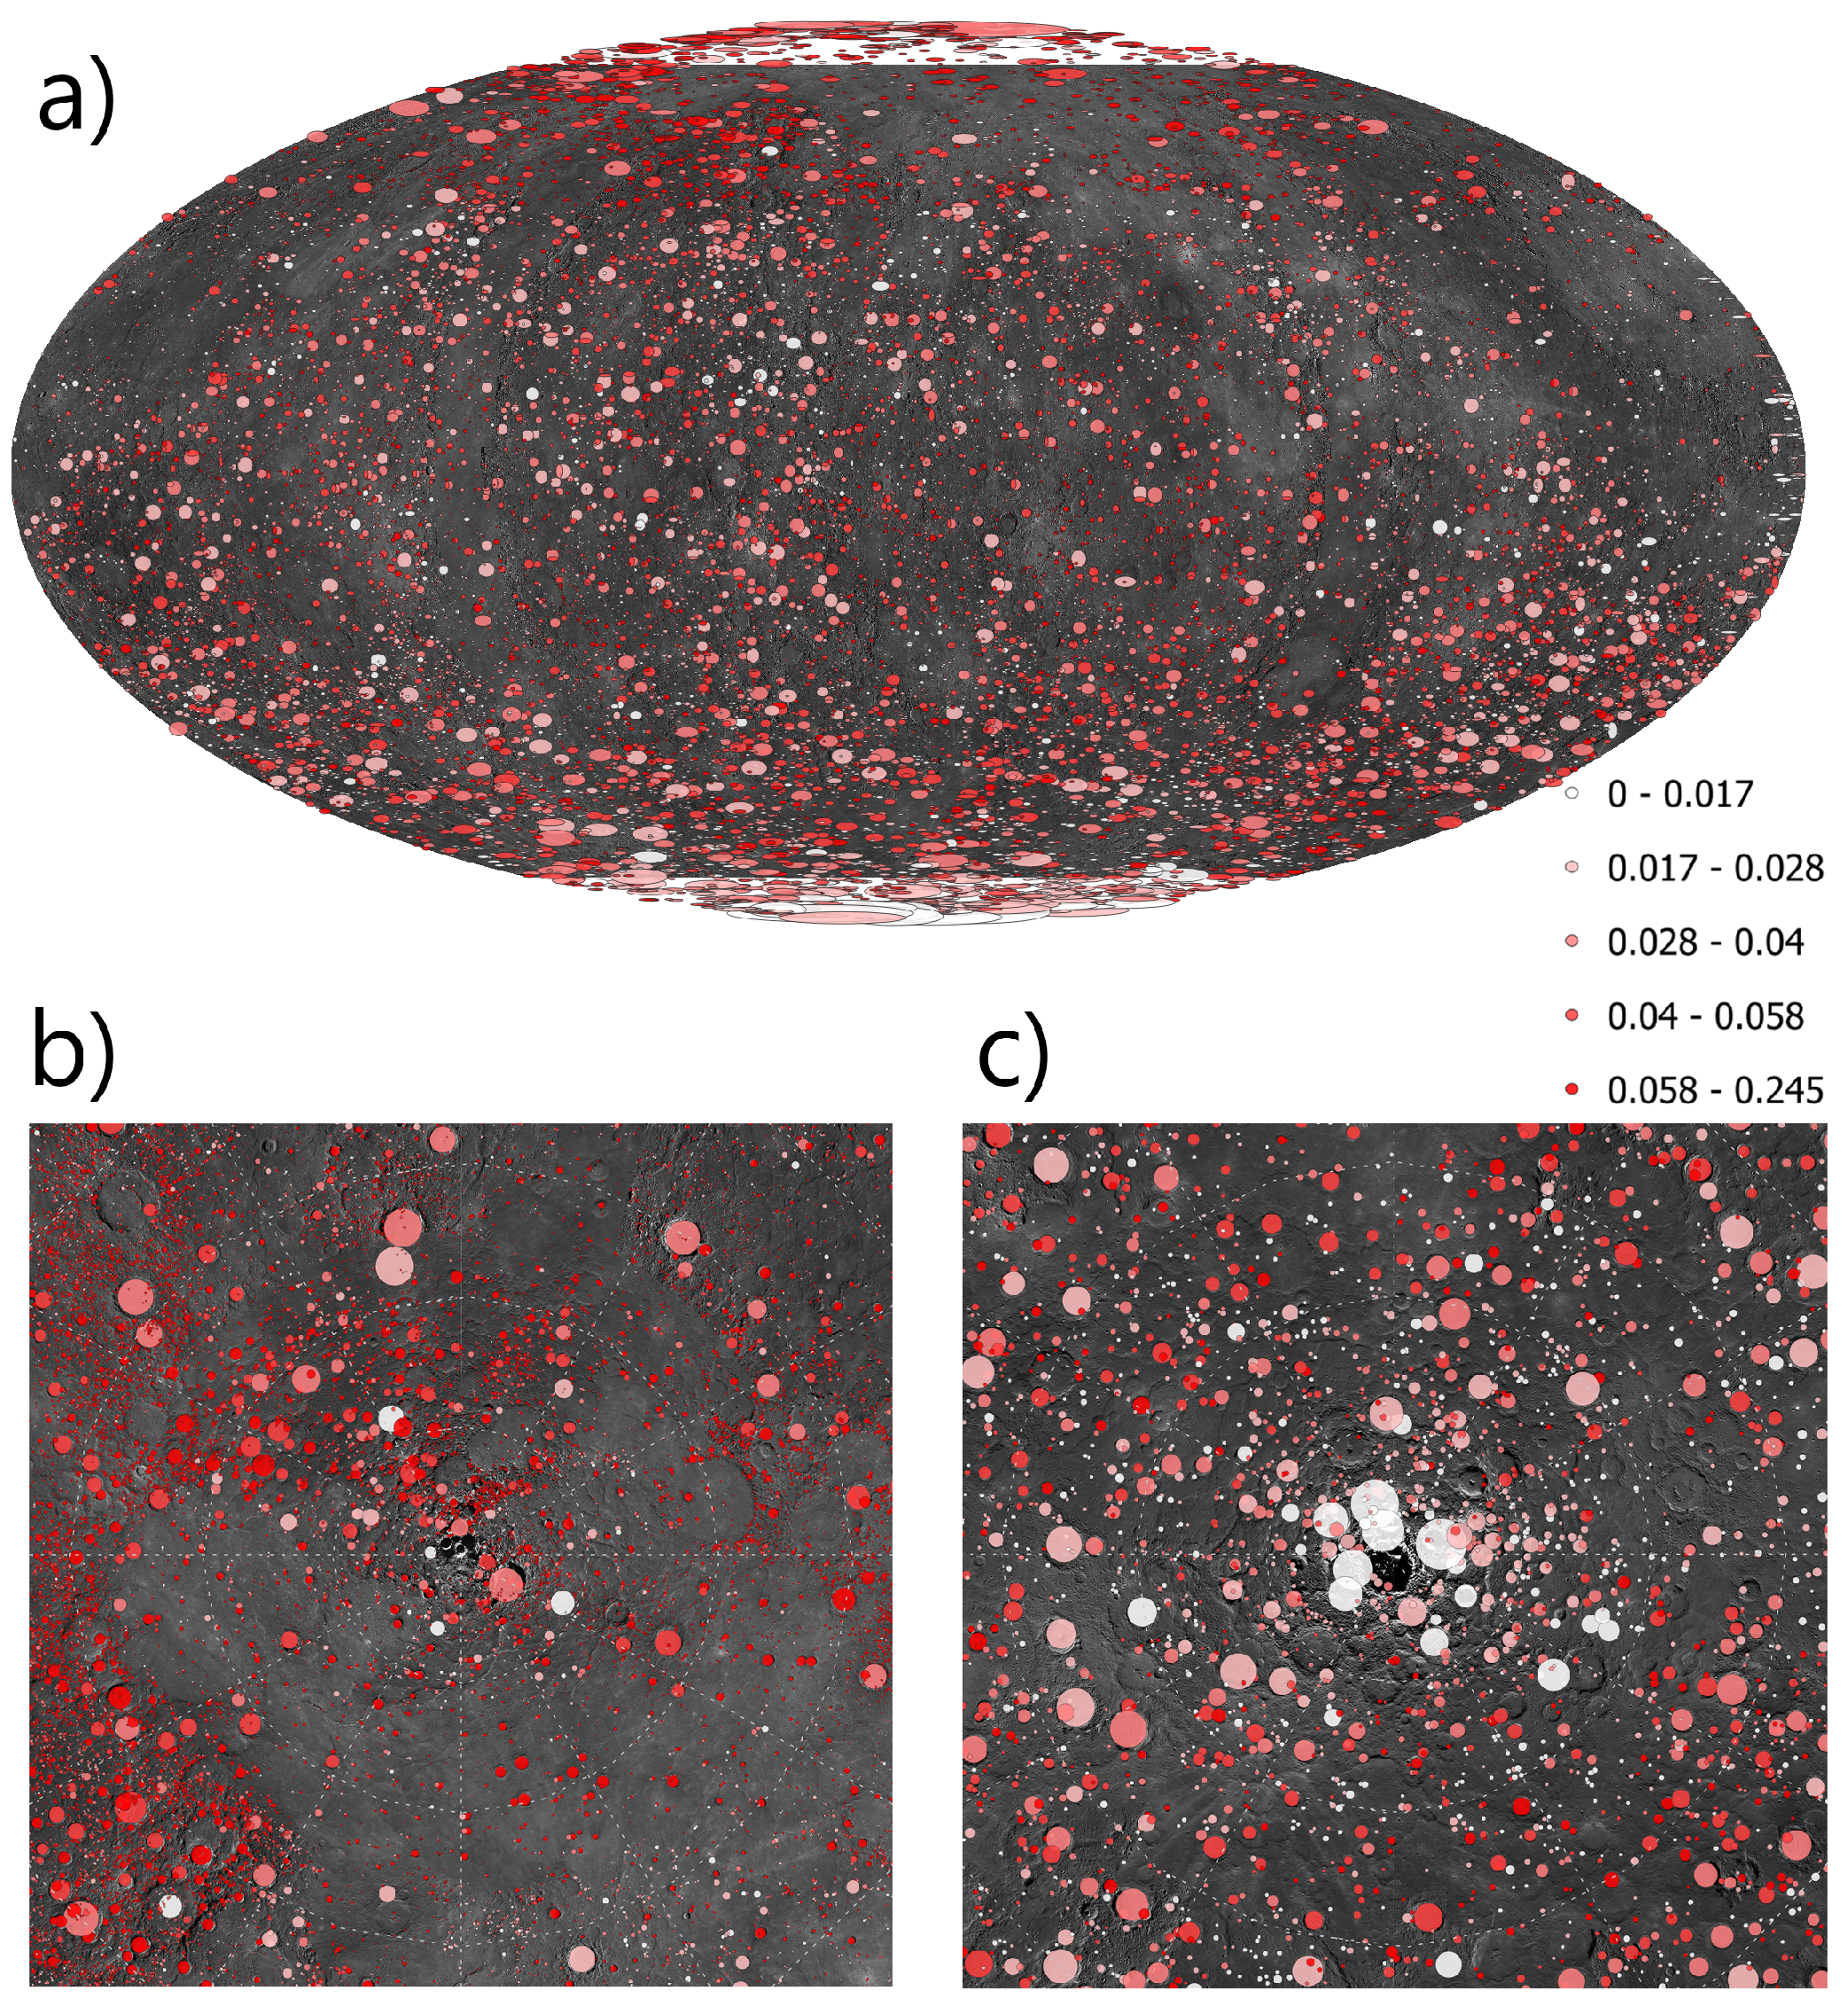
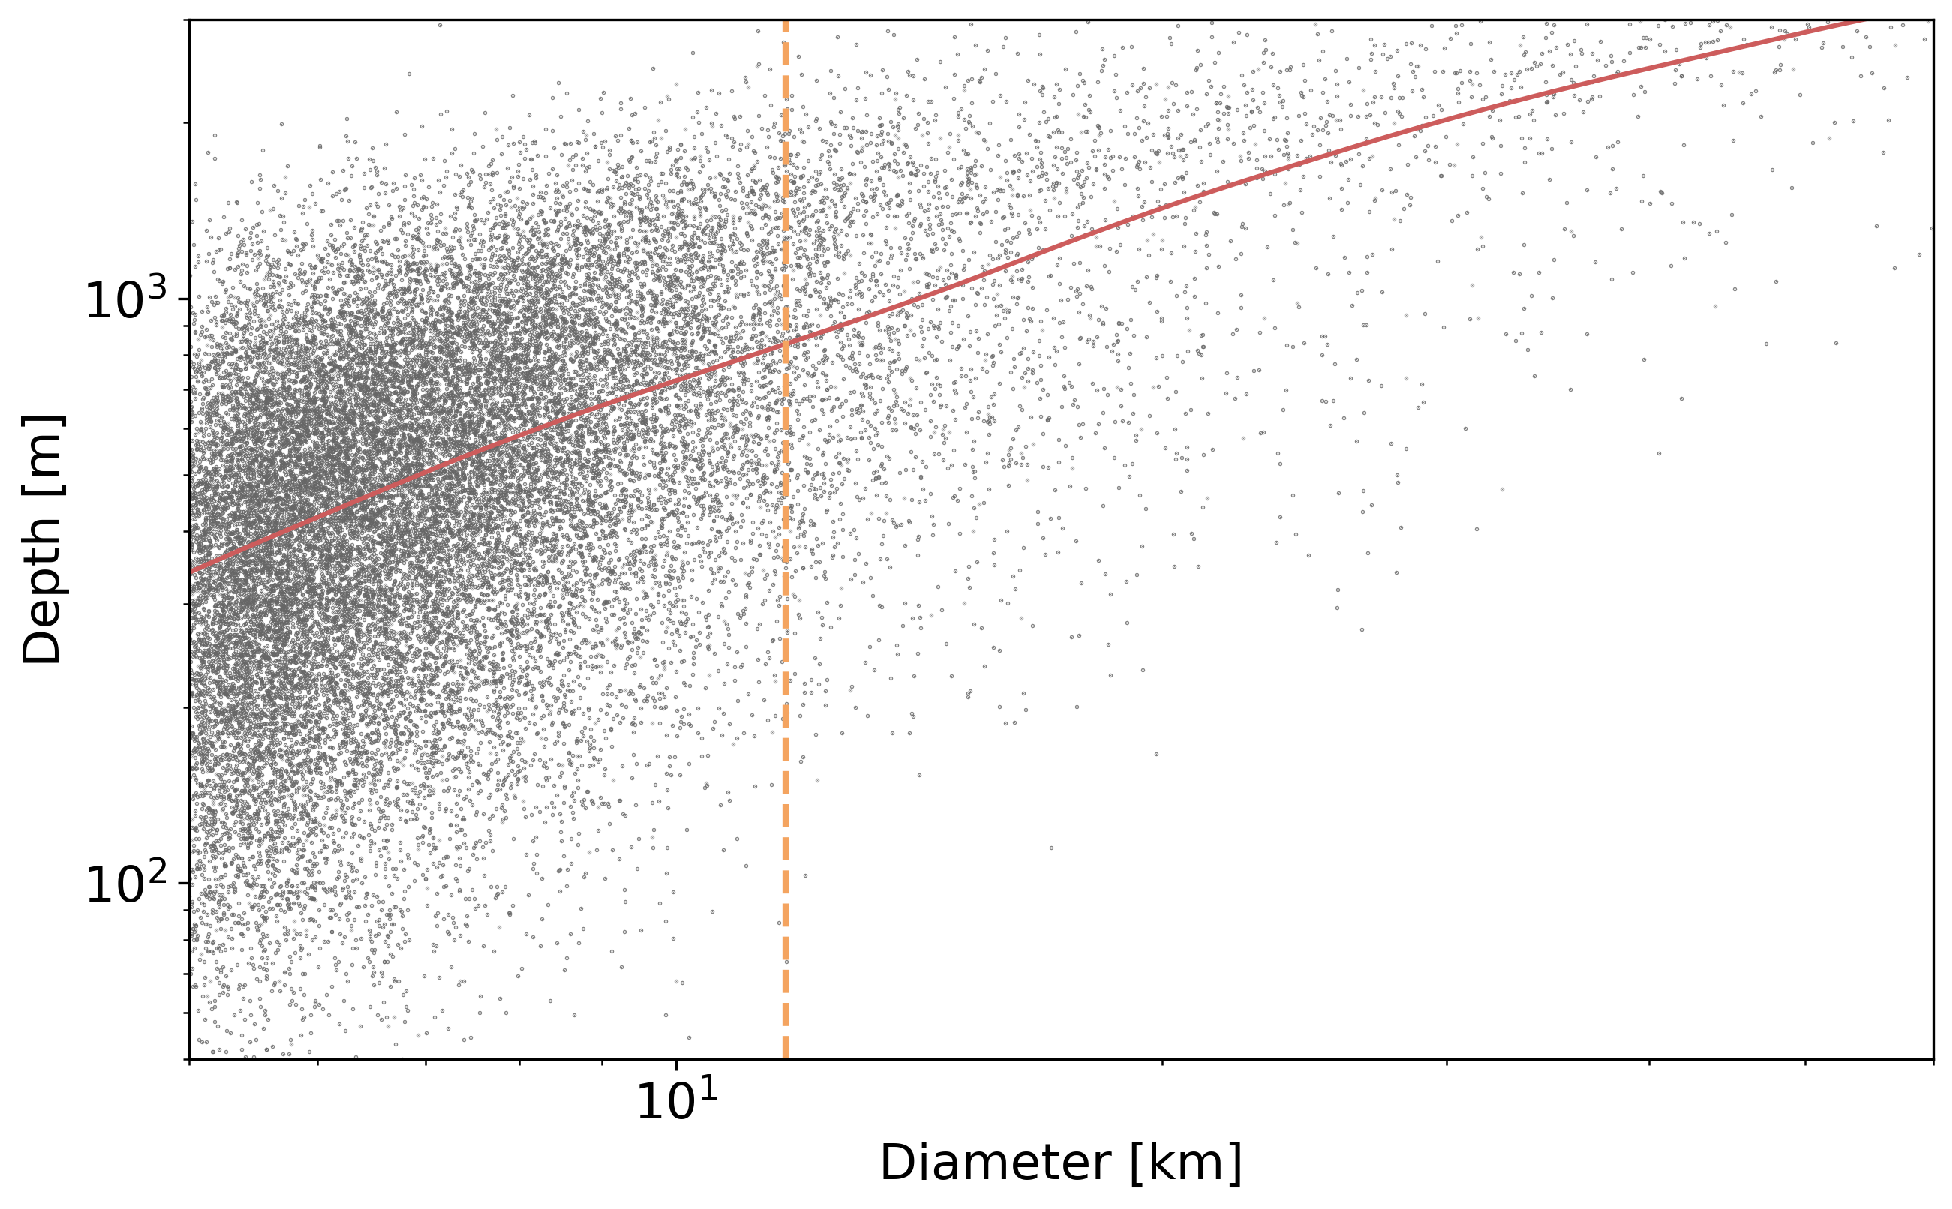
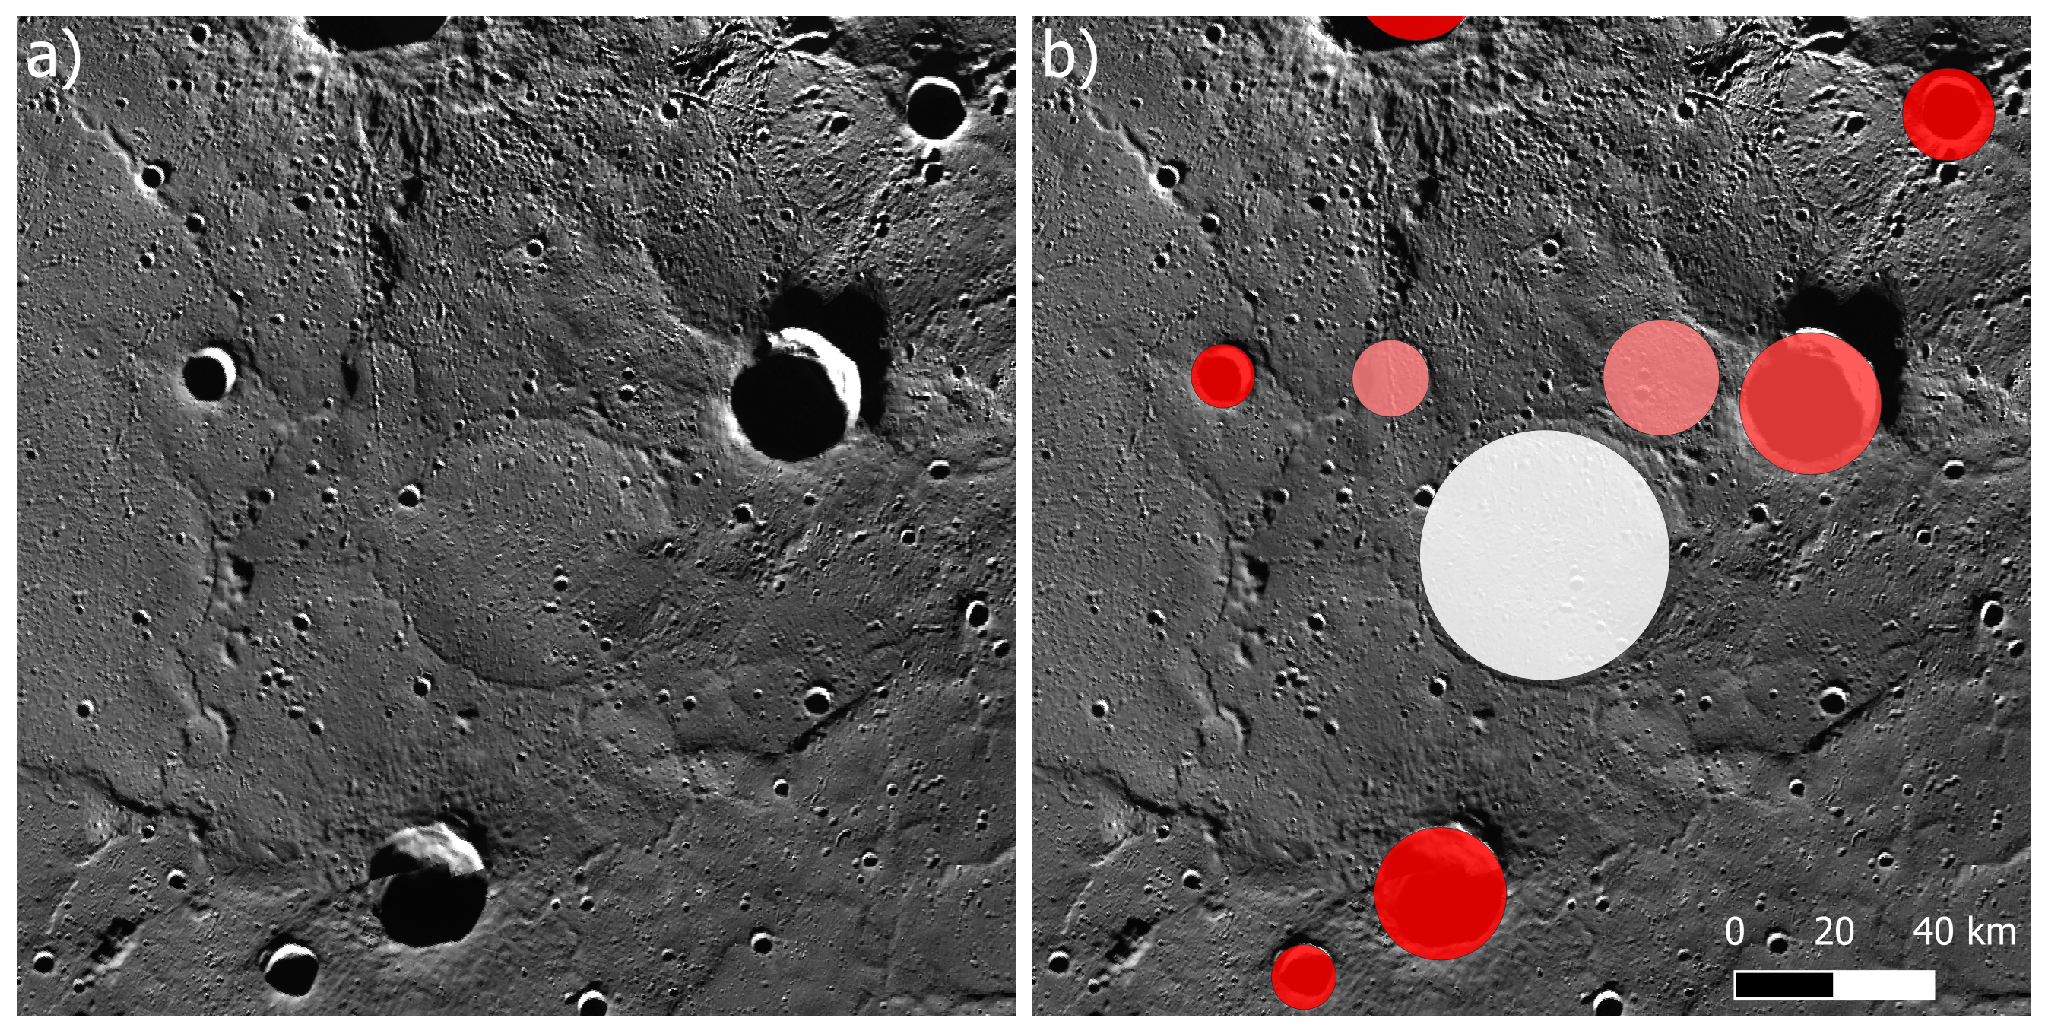
Another important parameter for the surface characterization is the depth-to-diameter (d/D) ratio, which is useful to define post-impact degradation and modification of the crater. Other factors contributing to the influence of the depth-to-diameter ratio can include the varying properties of the material and the physical state of the surface before the impact itself [45,46]. The d/D was measured through the methodology described in Section 2.3 for the entire catalog. The maps in Figure 11 show the distribution of the d/D of the craters on Mercury, with variations in shading representing differences in this ratio. Lighter colors represent craters with lower d/D ratios (shallower craters relative to their diameter), while darker ones correspond to craters with higher d/D ratios (deeper craters for their size). In Figure 12 and Figure 13, the distribution of d/D is shown for the subset of craters at latitudes above 45°N, where the typical parabolic trend can be observed, which shows how depth increases less as the crater diameter increases.
Smooth Plains
The smooth plains cover about a quarter of Mercury’s surface and have been associated with Mercury’s most recent widespread effusive volcanism phenomena [48,49,50]. The low crater density of the smooth plains makes them stand out, particularly in the density maps of Figure 14, in which they generally appear red or reddish-orange. Both the two main smooth plain macro-areas, the Borealis Planitia (Figure 9) and the area surrounding the Caloris basin (Figure 14a), as well as several smaller patches such as Apārangi Planitia (Figure 14b), the Sithu Planitia (Figure 14c), and the area surrounding the Tolstoj crater (Figure 14d), are visible.
Apart from their low crater density, the smooth plains present, on average, younger and more preserved craters that have high d/D ratios. This inverse relationship between d/D ratios and crater densities arises probably because the smooth plains are the most recently resurfaced terrains on Mercury, and have thus been subjected to the shortest period of impact crater accumulation and degradation, as it is observed for the maria on the Moon [51]. The small d/D value of some large impact structures, in particular in the northern polar region, is indicative of old degraded [52] craters (Figure 15). This is consistent with what is known about these regions: the volcanic resurfacing events that formed the smooth plains [48,49] likely filled many craters, reducing their depths over time. These areas have been extensively resurfaced by volcanic flows, which could explain why craters appear shallower; lava infill or surface modification would reduce their depth.
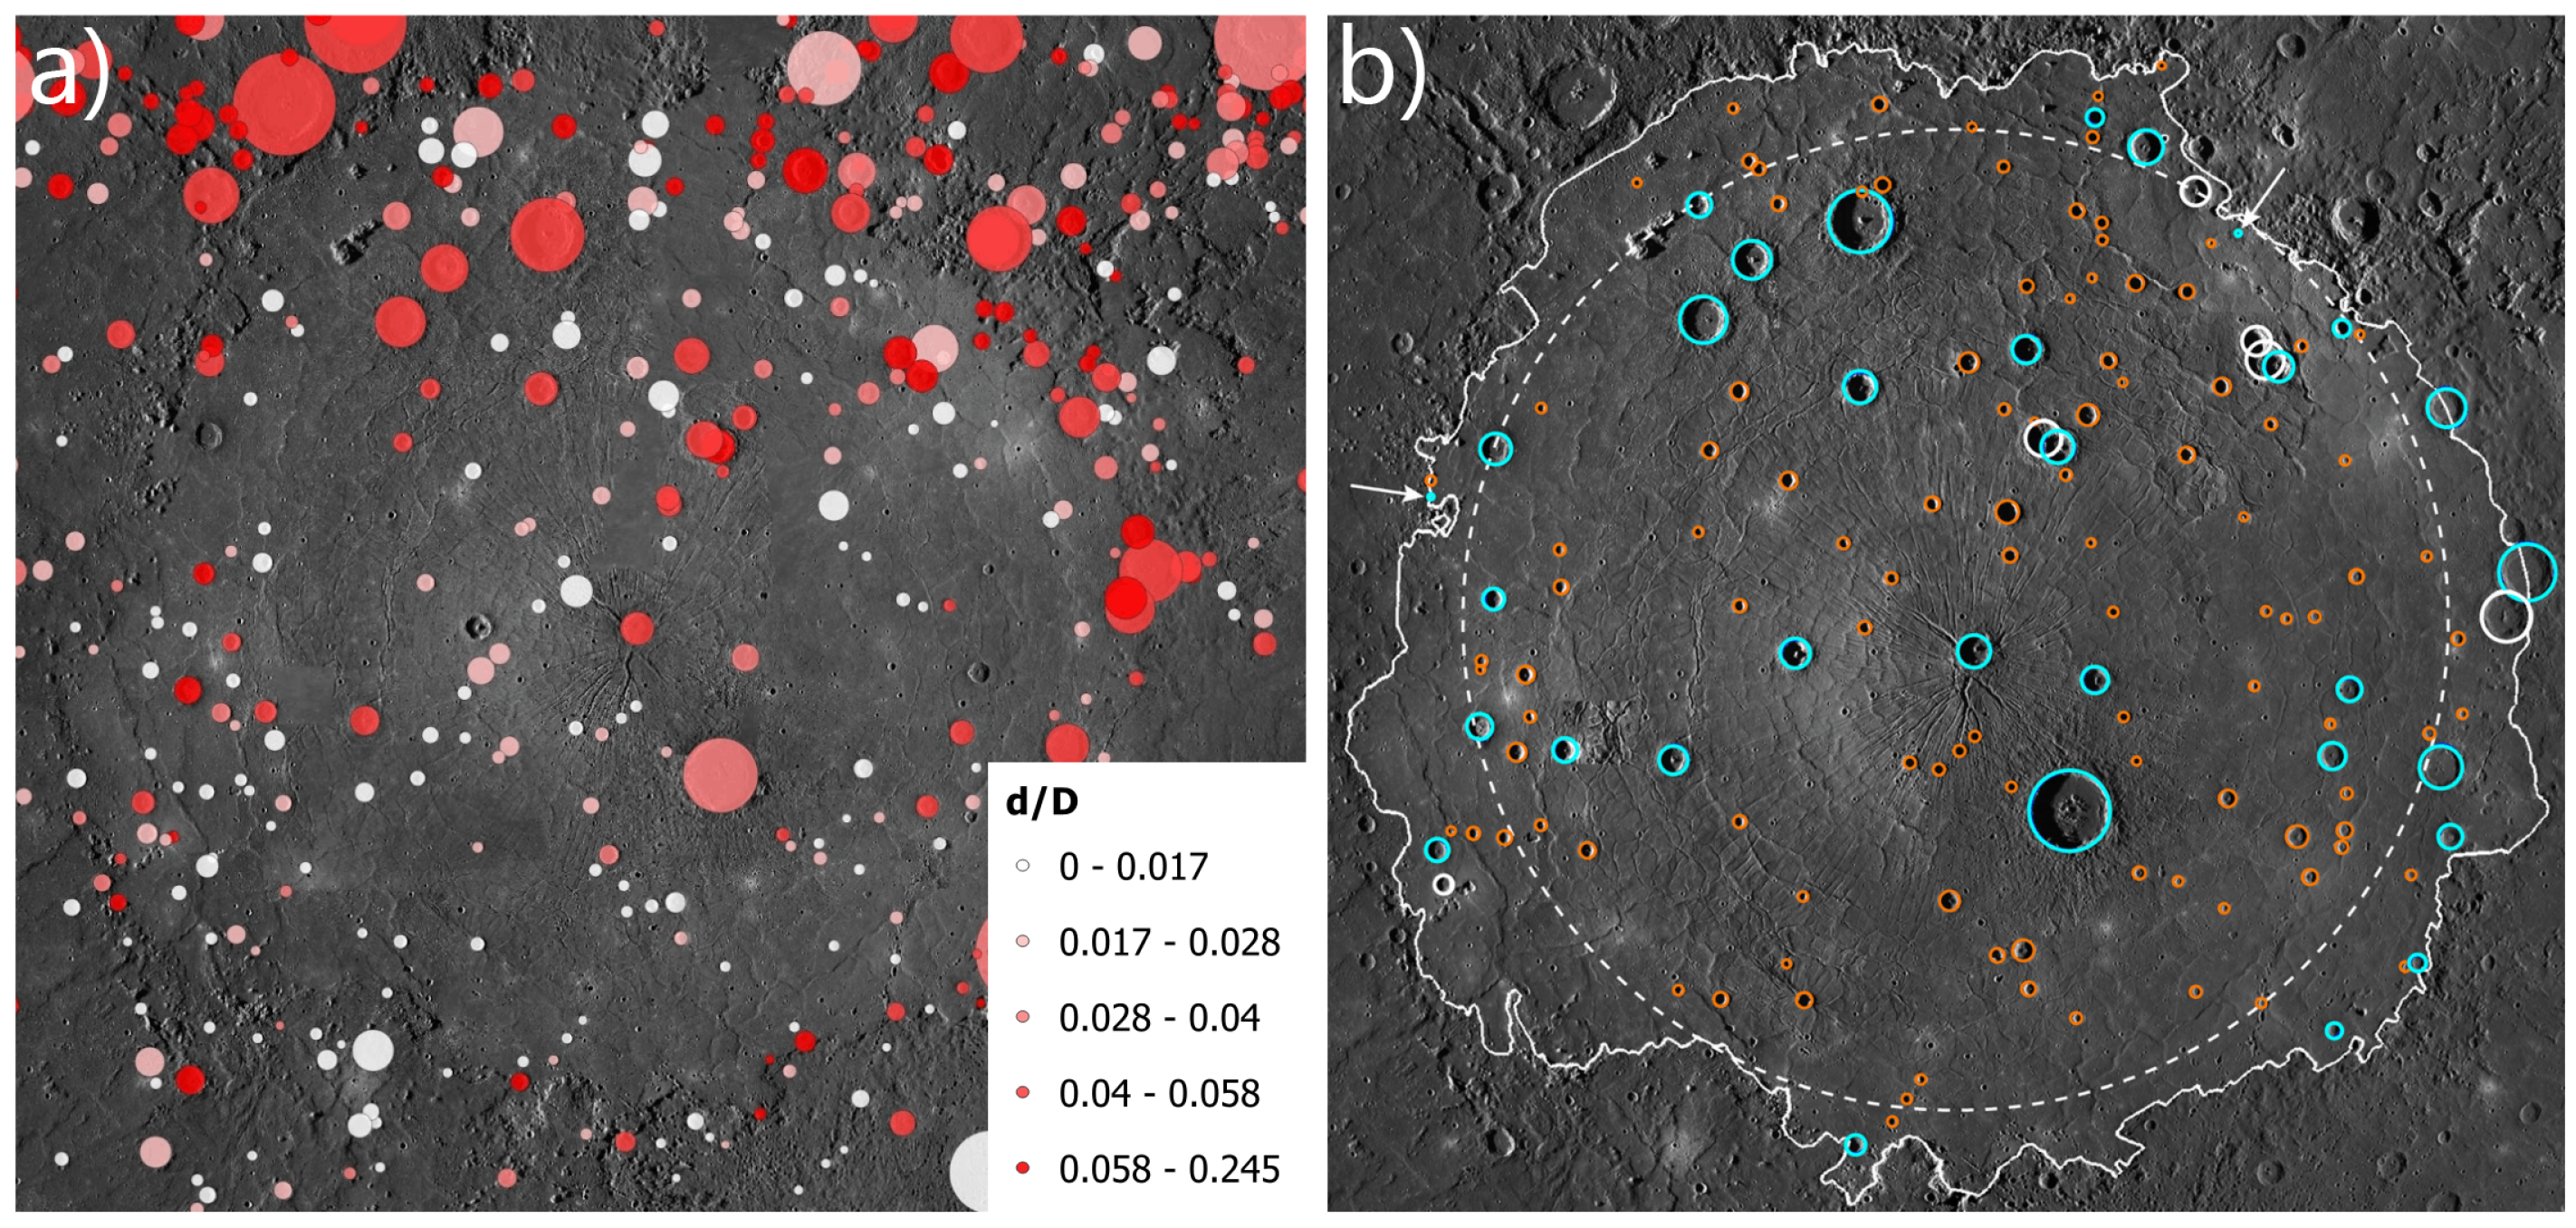
The Caloris Basin also represents an interesting example in terms of crater distribution. It is Mercury’s youngest large impact basin, and it is filled by volcanic plains that are spectrally distinct from surrounding material [53]. The high-reflectance red plains (HRP) within the Caloris basin show different spectral properties from both the Caloris rim and the surrounding smooth plains. Impact craters in the basin have exposed deeper layers, revealing low-reflectance material (LRM) beneath much of the HRP, indicating the presence of a distinct subsurface unit [53]. In terms of crater density, this basin reflects the smooth plains behavior, and it is in line with its resurfaced and filling history [1]. In Figure 14a, the predominance of red color indicates a high percentage of small craters. From a d/D perspective, most of the smaller craters appear relatively shallow, in contrast to what is observed in the northern smooth plains (Figure 16a). This is consistent with the findings of [53], as shown in Figure 16b, who differentiates craters that expose LRM from those that do not. A correlation can be hypothesized between craters exposing LRM (in blue), which tend to have higher d/D ratios, as seen in Figure 16a, compared to the orange craters that are shallower and do not expose LRM (represented by light pink and white in Figure 16a).
Intercrater Plains and Other Observations
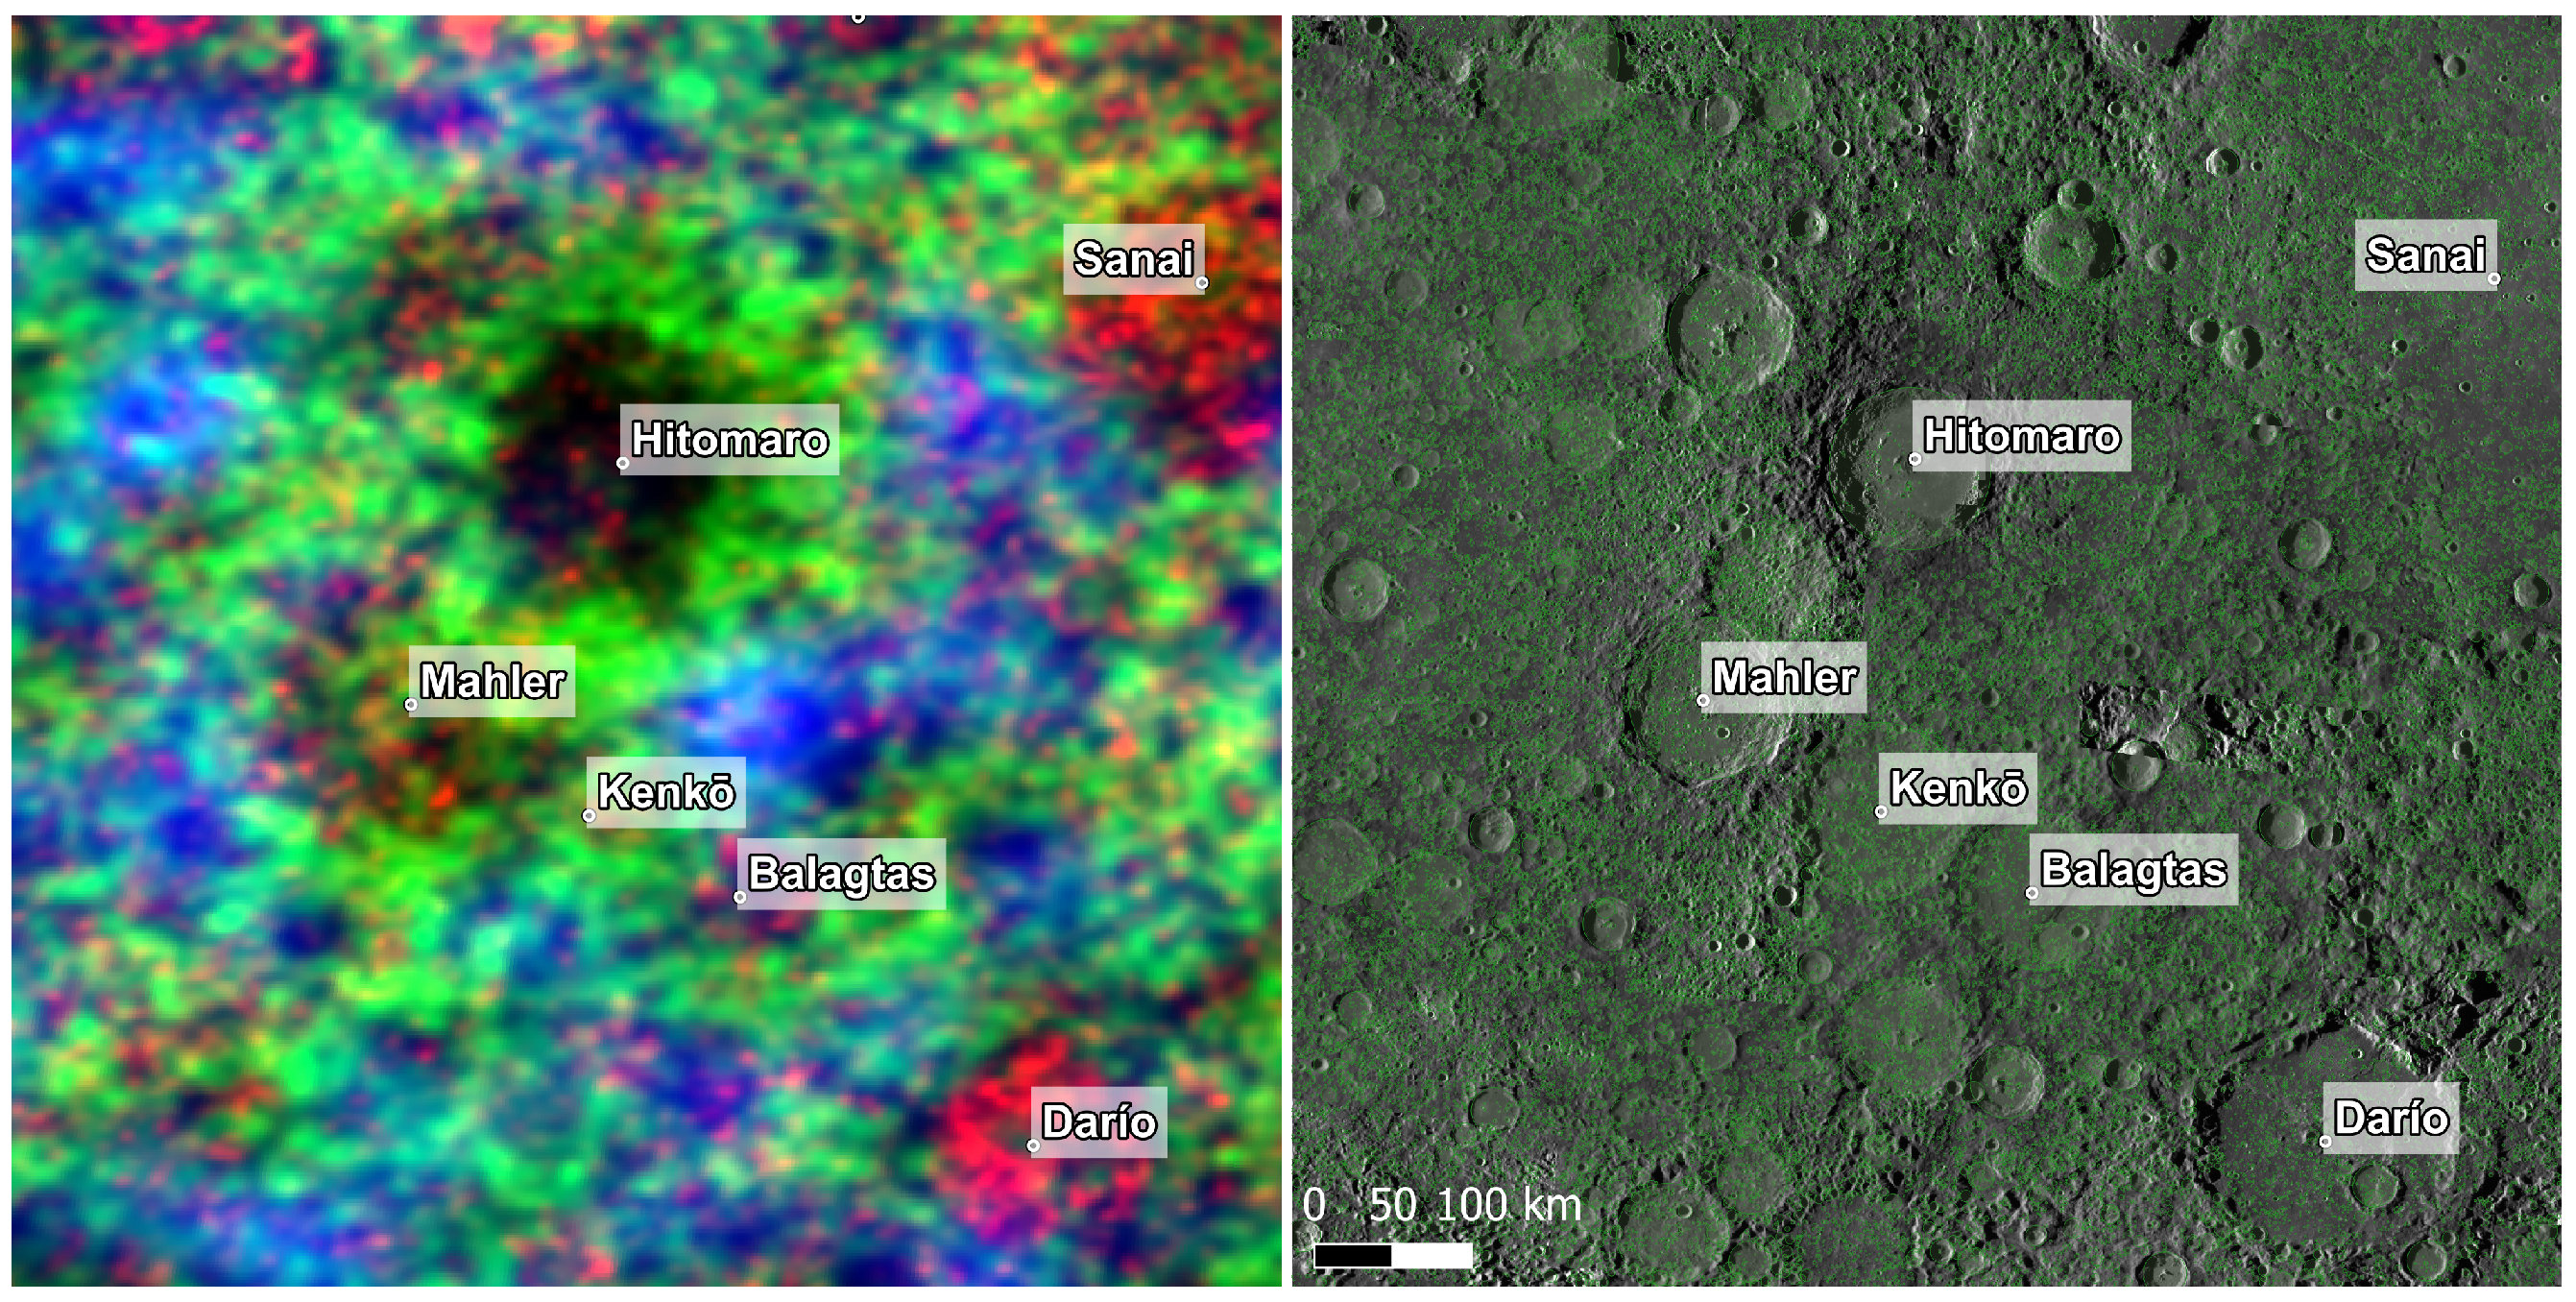
Given the wide variety, the intercrater plains are less uniform compared to the smooth plains. The unit shows peaks of high density in all the intervals considered, reflecting its heterogeneity [54,55]. As noted in [54,56], most of the craters within the unit can be interpreted as secondary to larger craters (>50 km). Such secondaries are particularly evident in the density map: higher density crowns of craters with diameters between 2 and 10 km (in green) surround the source craters both inside and outside the ejecta fields (Figure 17 and Figure 18). The H-12 (Michelangelo) and H-13 (Neruda) quadrangles, south of the Caloris basin, are the most affected by craters > 10 km, as shown in observations by [57,58,59]. The observations suggest that this region was the least affected by late resurfacing and volcanism [58], representing the oldest preserved part of Mercury’s surface. This is further confirmed by the d/D ratio, which is 0.038 on average, noticeably lower than the global average of 0.041 (Figure 19), indicative of extensive degradation. In addition, a substantial part of the region is covered by clusters of secondary craters, which generally tend to have higher spatial densities and lower depth-to-diameter ratios. Compared to geological interpretation, the difference between intercrater plains and intermediate units [44] in density maps is less evident, although sometimes characterized by a lower density of crater ≥2 km, resulting in colors more geared towards purple and reddish-orange.
The South Pole region provides another instance of the widespread Intercrater Plain unit, with a few scattered patches of smooth plains [60]. Unlike other areas of Mercury, this region has a high crater density, and the d/D ratios vary, although craters generally tend to be large and shallow. Note that the high number of craters with low d/D observed in the central part of the South Pole is probably due to data bias. In fact, due to MESSENGER’s highly eccentric orbit, with its closest approach over northern latitudes, observations of Mercury’s southern regions were limited by the spacecraft’s greater distance from the planet, and, therefore, limited spatial resolution. In particular, no data from the Mercury Laser Altimeter (MLA) were collected below 10° south [61], leaving elevation information in the southern hemisphere to be inferred from the Mercury Dual Imaging System (MDIS) [31] and supplemented by radio occultation data [62].

4. Conclusions

This study introduces a significantly refined version of the YOLOLens deep learning framework for planetary surface analysis, specifically targeting crater detection on Mercury and the Moon. By integrating multimodal input—comprising optical imagery and digital terrain models (DTMs) into a unified deep learning architecture, our method leverages complementary spatial and topographic information to enhance detection robustness and generalization across diverse surface conditions. The updated YOLOLens pipeline incorporates morphometric constraints derived from DTMs to reinforce feature discrimination and spatial coherence in crater detection, resulting in substantial performance gains over previously published models. This has enabled the automated construction of two large-scale crater catalogs: ME6M300TGT for Mercury (over 6 million craters, a 300-fold increase in coverage) and LU6M371TGT for the Moon. Both datasets exhibit improved accuracy, especially in high-latitude and morphologically ambiguous regions, thanks to the multimodal approach and architectural refinements. Beyond catalog generation, our work demonstrates the scalability and adaptability of transformer-based detection architectures for remote sensing tasks in planetary science, offering a high-throughput and reproducible pipeline for morphological feature extraction at a global scale. The methodology presented lays the groundwork for future cross-planet generalization studies and the development of domain-adaptive detection models applicable to other planetary bodies or geological targets.

Author Contributions

Conceptualization, R.L.G.; Methodology, R.L.G.; Software, R.L.G.; Validation, R.L.G., A.T., S.B. and N.A.V.S.; Formal analysis, R.L.G., C.R., E.M., M.F., V.G. and L.G.; Investigation, R.L.G.; Data curation, R.L.G. and A.T.; Writing—original draft, R.L.G., E.M., A.T., S.B. and G.C.; Writing—review & editing, R.L.G., C.R. and E.M.; Visualization, R.L.G., A.T. and N.A.V.S.; Supervision, C.R. and G.C.; Project administration, C.R. and G.C.; Funding acquisition, C.R. All authors have read and agreed to the published version of the manuscript.

Funding

This research was funded by the Italian Space Agency (ASI-INAF) agreement no. 2024-18-HH.0.

Data Availability Statement

Conflicts of Interest

The authors declare no conflict of interest.

Appendix A. YOLOLens Architecture

In Table A1, the architecture of YOLOLens is shown in detail.
Table A1. Network layers.
Layer TypeOutput ShapeParam #
Conv2d: 1-1[−1, 64, 416, 416]1792
Sequential: 1-2 (× 23)[−1, 64, 416, 416]
 ResidualResidualDenseBlock: 2-1[−1, 64, 416, 416]
  ResidualDenseBlock: 3-1[−1, 64, 416, 416]239,808
  ResidualDenseBlock: 3-2[−1, 64, 416, 416]239,808
  ResidualDenseBlock: 3-3[−1, 64, 416, 416]239,808
Conv2d: 1-3[−1, 64, 416, 416]36,928
Sequential: 1-4[−1, 32, 832, 832]
 Conv2d: 2-24[−1, 128, 416, 416]73,856
 LeakyReLU: 2-25[−1, 128, 416, 416]
 PixelShuffle: 2-26[−1, 32, 832, 832]
Sequential: 1-5[−1, 64, 832, 832]
 Conv2d: 2-27[−1, 64, 832, 832]18,496
 LeakyReLU: 2-28[−1, 64, 832, 832]
Sequential: 1-6[−1, 64, 832, 832]
 Conv2d: 2-29[−1, 64, 832, 832]36,928
Sequential: 1-7[−1, 64, 832, 832]
 Conv2d: 2-30[−1, 64, 832, 832]36,928
 LeakyReLU: 2-31[−1, 64, 832, 832]
 Conv2d: 2-32[−1, 128, 832, 832]73,856
 LeakyReLU: 2-33[−1, 128, 832, 832]
 Conv2d: 2-34[−1, 128, 832, 832]147,584
 LeakyReLU: 2-35[−1, 128, 832, 832]
 Conv2d: 2-36[−1, 64, 832, 832]73,792
Sequential: 1-8[−1, 3, 832, 832]
 Conv2d: 2-37[−1, 64, 832, 832]36,928
 Conv2d: 2-38[−1, 3, 832, 832]1731
DetectionModel: 1-9[−1, 5, 14196]
 Sequential: 2
  Conv: 3-70[−1, 80, 416, 416]2320
  Conv: 3-71[−1, 160, 208, 208]115,520
  C2f: 3-72[−1, 160, 208, 208]436,800
  Conv: 3-73[−1, 320, 104, 104]461,440
  C2f: 3-74[−1, 320, 104, 104]3,281,920
  Conv: 3-75[−1, 640, 52, 52]1,844,480
  C2f: 3-76[−1, 640, 52, 52]13,117,440
  Conv: 3-77[−1, 640, 26, 26]3,687,680
  C2f: 3-78[−1, 640, 26, 26]6,969,600
  SPPF: 3-79[−1, 640, 26, 26]1,025,920
  Upsample: 3-80[−1, 640, 52, 52]
  Concat: 3-81[−1, 1280, 52, 52]
  C2f: 3-82[−1, 640, 52, 52]7,379,200
  Upsample: 3-83[−1, 640, 104, 104]
  Concat: 3-84[−1, 960, 104, 104]
  C2f: 3-85[−1, 320, 104, 104]1,948,800
  Conv: 3-86[−1, 320, 52, 52]922,240
  Concat: 3-87[−1, 960, 52, 52]
  C2f: 3-88[−1, 640, 52, 52]7,174,400
  Conv: 3-89[−1, 640, 26, 26]3,687,680
  Concat: 3-90[−1, 1280, 26, 26]
  C2f: 3-91[−1, 640, 26, 26]7,379,200
  Detect: 3-92[−1, 5, 14196]8,718,931

Appendix B. Detection Sample over PSR of the Lunar South Pole

In Figure A1, a detailed analysis of a specific area of the Moon’s South Pole is presented, focusing on the Permanent Shadow Region (PSR). This region is depicted using three complementary images: the Wide Angle Camera (WAC) view, the Digital Elevation Model (DEM), and the DEM overlaid with detected craters. The images emphasize key craters in the PSR, including Faustini, Shoemaker, and Nobile, located approximately within the longitude range [36, 78] and latitude range [−90, −85]. Using a multimodal deep learning model, true positive crater detections are identified, highlighted by yellow circles, which demonstrate the effectiveness of the approach in characterizing lunar surface features within permanently shadowed areas.
Figure A1. Three images (WAC, DEM, and detected craters over DEM) of South Lunar Pole region that highlight Permanent Shadow Region showing Faustini, Shoemaker, and Nobile craters at [36°, 78°] of longitude and [−90°, −85°] of latitude. By using multimodal deep learning model, the true positive craters (yellow circles) are individuated.
Remotesensing 17 03287 g0a1

References

  1. Head, J.W.; Chapman, C.R.; Strom, R.G.; Fassett, C.I.; Denevi, B.W.; Blewett, D.T.; Ernst, C.M.; Watters, T.R.; Solomon, S.C.; Murchie, S.L.; et al. Flood volcanism in the northern high latitudes of Mercury revealed by MESSENGER. Science 2011, 333, 1853–1856. [Google Scholar] [CrossRef]
  2. La Grassa, R.; Cremonese, G.; Gallo, I.; Re, C.; Martellato, E. YOLOLens: A Deep Learning Model Based on Super-Resolution to Enhance the Crater Detection of the Planetary Surfaces. Remote Sens. 2023, 15, 1171. [Google Scholar] [CrossRef]
  3. Wang, Y.; Wu, B.; Xue, H.; Li, X.; Ma, J. An improved global catalog of lunar impact craters (>1 km) with 3D morphometric information and updates on global crater analysis. J. Geophys. Res. Planets 2021, 126, e2020JE006728. [Google Scholar] [CrossRef]
  4. Robbins, S.J. A new global database of lunar impact craters > 1–2 km: 1. Crater locations and sizes, comparisons with published databases, and global analysis. J. Geophys. Res. Planets 2019, 124, 871–892. [Google Scholar] [CrossRef]
  5. Salamunićcar, G.; Lončarić, S.; Mazarico, E. LU60645GT and MA132843GT catalogues of Lunar and Martian impact craters developed using a Crater Shape-based interpolation crater detection algorithm for topography data. Planet. Space Sci. 2012, 60, 236–247. [Google Scholar] [CrossRef]
  6. Head, J.W., III; Fassett, C.I.; Kadish, S.J.; Smith, D.E.; Zuber, M.T.; Neumann, G.A.; Mazarico, E. Global distribution of large lunar craters: Implications for resurfacing and impactor populations. Science 2010, 329, 1504–1507. [Google Scholar] [CrossRef]
  7. Povilaitis, R.; Robinson, M.; Van der Bogert, C.; Hiesinger, H.; Meyer, H.; Ostrach, L.R. Crater density differences: Exploring regional resurfacing, secondary crater populations, and crater saturation equilibrium on the moon. Planet. Space Sci. 2018, 162, 41–51. [Google Scholar] [CrossRef]
  8. Yue, Z.; Michael, G.; Di, K.; Liu, J. Global survey of lunar wrinkle ridge formation times. Earth Planet. Sci. Lett. 2017, 477, 14–20. [Google Scholar] [CrossRef]
  9. Kneissl, T.; Michael, G.; Platz, T.; Walter, S. Age determination of linear surface features using the Buffered Crater Counting approach–Case studies of the Sirenum and Fortuna Fossae graben systems on Mars. Icarus 2015, 250, 384–394. [Google Scholar] [CrossRef]
  10. Giacomini, L.; Massironi, M.; Galluzzi, V.; Ferrari, S.; Palumbo, P. Dating long thrust systems on Mercury: New clues on the thermal evolution of the planet. Geosci. Front. 2020, 11, 855–870. [Google Scholar] [CrossRef]
  11. Hiesinger, H.; Head, J.; Wolf, U.; Jaumann, R.; Neukum, G. Ages and stratigraphy of lunar mare basalts: A synthesis. Recent Adv. Curr. Res. Issues Lunar Stratigr. 2011, 477, 1–51. [Google Scholar]
  12. Giacomini, L.; Galluzzi, V.; Massironi, M.; Ferranti, L.; Palumbo, P. Geology of the Kuiper quadrangle (H06), Mercury. J. Maps 2022, 18, 246–257. [Google Scholar] [CrossRef]
  13. Robinson, M.S.; Brylow, S.; Tschimmel, M.e.; Humm, D.; Lawrence, S.; Thomas, P.; Denevi, B.W.; Bowman-Cisneros, E.; Zerr, J.; Ravine, M.; et al. Lunar reconnaissance orbiter camera (LROC) instrument overview. Space Sci. Rev. 2010, 150, 81–124. [Google Scholar] [CrossRef]
  14. Haruyama, J.; Matsunaga, T.; Ohtake, M.; Morota, T.; Honda, C.; Yokota, Y.; Torii, M.; Ogawa, Y.; Group, L.W. Global lunar-surface mapping experiment using the Lunar Imager/Spectrometer on SELENE. Earth Planets Space 2008, 60, 243–255. [Google Scholar] [CrossRef]
  15. Kereszturi, A. Polar ice on the moon. In Encyclopedia of Lunar Science; Springer: Cham, Switzerland, 2023; pp. 971–980. [Google Scholar]
  16. Herrick, R.R.; Curran, L.L.; Baer, A.T. A Mariner/MESSENGER global catalog of mercurian craters. Icarus 2011, 215, 452–454. [Google Scholar] [CrossRef]
  17. Robbins, S.J. New crater calibrations for the lunar crater-age chronology. Earth Planet. Sci. Lett. 2014, 403, 188–198. [Google Scholar] [CrossRef]
  18. Robbins, S.J.; Riggs, J.D.; Weaver, B.P.; Bierhaus, E.B.; Chapman, C.R.; Kirchoff, M.R.; Singer, K.N.; Gaddis, L.R. Revised recommended methods for analyzing crater size-frequency distributions. Meteorit. Planet. Sci. 2018, 53, 891–931. [Google Scholar] [CrossRef]
  19. Wang, Y.; Xie, M.; Xiao, Z.; Cui, J. The minimum confidence limit for diameters in crater counts. Icarus 2020, 341, 113645. [Google Scholar] [CrossRef]
  20. Zuo, W.; Gao, X.; Wu, D.; Liu, J.; Zeng, X.; Li, C. YOLO-SCNet: A Framework for Enhanced Detection of Small Lunar Craters. Remote Sens. 2025, 17, 1959. [Google Scholar] [CrossRef]
  21. Zhong, Z.; Lai, J.; Zhong, Y.; Xu, Y.; Cui, F. Enhancing lunar DEM data using super-resolution techniques and optimizing the faster R-CNN network for sub-kilometer crater detection. Icarus 2025, 430, 116483. [Google Scholar] [CrossRef]
  22. Martinez, L.; Andrieu, F.; Schmidt, F.; Talbot, H.; Bentley, M. Robust automatic crater detection at all latitudes on Mars with deep-learning. Planet. Space Sci. 2025, 260, 106053. [Google Scholar] [CrossRef]
  23. Guo, Y.; Wu, H.; Yang, S.; Cai, Z. Crater-DETR: A Novel Transformer Network for Crater Detection Based on Dense Supervision and Multiscale Fusion. IEEE Trans. Geosci. Remote Sens. 2024, 62, 5614112. [Google Scholar] [CrossRef]
  24. Cadogan, P.H. Automated precision counting of very small craters at lunar landing sites. Icarus 2020, 348, 113822. [Google Scholar] [CrossRef]
  25. Tewari, A.; Verma, V.; Srivastava, P.; Jain, V.; Khanna, N. Automated crater detection from co-registered optical images, elevation maps and slope maps using deep learning. Planet. Space Sci. 2022, 218, 105500. [Google Scholar] [CrossRef]
  26. Silburt, A.; Ali-Dib, M.; Zhu, C.; Jackson, A.; Valencia, D.; Kissin, Y.; Tamayo, D.; Menou, K. Lunar crater identification via deep learning. Icarus 2019, 317, 27–38. [Google Scholar] [CrossRef]
  27. La Grassa, R.; Gallo, I.; Landro, N. OCmst: One-class novelty detection using convolutional neural network and minimum spanning trees. Pattern Recognit. Lett. 2022, 155, 114–120. [Google Scholar] [CrossRef]
  28. Canny, J. A computational approach to edge detection. IEEE Trans. Pattern Anal. Mach. Intell. 1986, PAMI-8, 679–698. [Google Scholar]
  29. Shen, J.; Castan, S. An optimal linear operator for step edge detection. CVGIP Graph. Model. Image Process. 1992, 54, 112–133. [Google Scholar]
  30. La Grassa, R.; Martellato, E.; Cremonese, G.; Re, C.; Tullo, A.; Bertoli, S. LU5M812TGT: An AI-Powered global database of impact craters > 0.4 km on the Moon. ISPRS J. Photogramm. Remote Sens. 2025, 220, 75–84. [Google Scholar]
  31. Hawkins, S.E.; Boldt, J.D.; Darlington, E.H.; Espiritu, R.; Gold, R.E.; Gotwols, B.; Grey, M.P.; Hash, C.D.; Hayes, J.R.; Jaskulek, S.E.; et al. The Mercury dual imaging system on the MESSENGER spacecraft. Space Sci. Rev. 2007, 131, 247–338. [Google Scholar] [CrossRef]
  32. Barker, M.K.; Mazarico, E.; Neumann, G.A.; Smith, D.E.; Zuber, M.T.; Head, J.W.; Sun, X. A New View of the Lunar South Pole from the Lunar Orbiter Laser Altimeter (LOLA). Planet. Sci. J. 2023, 4, 183. [Google Scholar] [CrossRef]
  33. Barker, M.; Mazarico, E.; Neumann, G.; Zuber, M.; Haruyama, J.; Smith, D. A new lunar digital elevation model from the Lunar Orbiter Laser Altimeter and SELENE Terrain Camera. Icarus 2016, 273, 346–355. [Google Scholar] [CrossRef]
  34. Archinal, B.A.; A’Hearn, M.F.; Bowell, E.; Conrad, A.; Consolmagno, G.J.; Courtin, R.; Fukushima, T.; Hestroffer, D.; Hilton, J.L.; Krasinsky, G.A.; et al. Report of the IAU working group on cartographic coordinates and rotational elements: 2009. Celest. Mech. Dyn. Astron. 2011, 109, 101–135. [Google Scholar] [CrossRef]
  35. Mazarico, E.; Rowlands, D.; Neumann, G.; Smith, D.; Torrence, M.; Lemoine, F.; Zuber, M. Orbit determination of the lunar reconnaissance orbiter. J. Geod. 2012, 86, 193–207. [Google Scholar]
  36. Smith, D.; Zuber, M.; Neumann, G.; Mazarico, E.; Head, J.; Torrence, M.; LOLA Science Team. Results from the Lunar Orbiter Laser Altimeter (LOLA): Global, high resolution topographic mapping of the Moon. In Proceedings of the 42nd Annual Lunar and Planetary Science Conference, The Woodlands, TX, USA, 7–11 March 2011; p. 2350. [Google Scholar]
  37. Smith, D.E.; Zuber, M.T.; Neumann, G.A.; Lemoine, F.G.; Mazarico, E.; Torrence, M.H.; McGarry, J.F.; Rowlands, D.D.; Head, J.W., III; Duxbury, T.H.; et al. Initial observations from the lunar orbiter laser altimeter (LOLA). Geophys. Res. Lett. 2010, 37. [Google Scholar] [CrossRef]
  38. Tooley, C.R.; Houghton, M.B.; Saylor, R.S.; Peddie, C.; Everett, D.F.; Baker, C.L.; Safdie, K.N. Lunar Reconnaissance Orbiter mission and spacecraft design. Space Sci. Rev. 2010, 150, 23–62. [Google Scholar] [CrossRef]
  39. Wessel, P.; Smith, W.H.; Scharroo, R.; Luis, J.; Wobbe, F. Generic mapping tools: Improved version released. Eos Trans. Am. Geophys. Union 2013, 94, 409–410. [Google Scholar] [CrossRef]
  40. Williams, J. DE421 Lunar Orbit, Physical Librations, and Surface Coordinates. 2008. Available online: https://cir.nii.ac.jp/crid/1570572700867074816 (accessed on 10 September 2025).
  41. Galluzzi, V.; Guzzetta, L.; Ferranti, L.; Di Achille, G.; Rothery, D.A.; Palumbo, P. Geology of the Victoria quadrangle (H02), Mercury. J. Maps 2016, 12, 227–238. [Google Scholar] [CrossRef]
  42. Susorney, H.C.; Barnouin, O.S.; Ernst, C.M.; Johnson, C.L. Morphometry of impact craters on Mercury from MESSENGER altimetry and imaging. Icarus 2016, 271, 180–193. [Google Scholar] [CrossRef]
  43. Martellato, E.; Luther, R.; Benkhoff, J.; Da Deppo, V.; Casini, C.; Palumbo, P.; Rotundi, A.; Slemer, A.; Cremonese, G. MESSENGER Grand Finale at Mercury: Surface age and property characterization. In Proceedings of the Mercury Exploration Assessment Group (MExAG) Annual Meeting 2023, Virtual, 1–3 February 2023. [Google Scholar]
  44. Galluzzi, V.; Giacomini, L.; Guzzetta, L.; Lewang, A.M.; Malliband, C.C.; Mancinelli, P.; Pegg, D.L.; Semenzato, A.; Wright, J.; Ferranti, L.; et al. Geological Mapping of Mercury. Geophys. Res. Abstr. 2019, 21, 1. [Google Scholar]
  45. Schultz, P.H. Endogenic modification of impact craters on Mercury. Phys. Earth Planet. Inter. 1977, 15, 202–219. [Google Scholar] [CrossRef]
  46. Krüger, T.; Hergarten, S.; Kenkmann, T. Deriving morphometric parameters and the simple-to-complex transition diameter from a high-resolution, global database of fresh lunar impact craters (D > 3 km). J. Geophys. Res. Planets 2018, 123, 2667–2690. [Google Scholar] [CrossRef]
  47. Pike, R.J. Geomorphology of impact craters on Mercury. Mercury 1988, 89, 165–273. [Google Scholar]
  48. Denevi, B.W.; Ernst, C.M.; Meyer, H.M.; Robinson, M.S.; Murchie, S.L.; Whitten, J.L.; Head, J.W.; Watters, T.R.; Solomon, S.C.; Ostrach, L.R.; et al. The distribution and origin of smooth plains on Mercury. J. Geophys. Res. Planets 2013, 118, 891–907. [Google Scholar] [CrossRef]
  49. Ostrach, L.R.; Robinson, M.S.; Whitten, J.L.; Fassett, C.I.; Strom, R.G.; Head, J.W.; Solomon, S.C. Extent, age, and resurfacing history of the northern smooth plains on Mercury from MESSENGER observations. Icarus 2015, 250, 602–622. [Google Scholar] [CrossRef]
  50. Caminiti, E.; Doressoundiram, A.; Besse, S.; Wright, J. A spectral study of the Caloris basin on Mercury and the origin of associated volcanic smooth plains. J. Geophys. Res. Planets 2023, 128, e2022JE007685. [Google Scholar] [CrossRef]
  51. Wu, B.; Wang, Y.; Werner, S.C.; Prieur, N.C.; Xiao, Z. A global analysis of crater depth/diameter ratios on the Moon. Geophys. Res. Lett. 2022, 49, e2022GL100886. [Google Scholar] [CrossRef]
  52. Klimczak, C.; Watters, T.R.; Ernst, C.M.; Freed, A.M.; Byrne, P.K.; Solomon, S.C.; Blair, D.M.; Head, J.W. Deformation associated with ghost craters and basins in volcanic smooth plains on Mercury: Strain analysis and implications for plains evolution. J. Geophys. Res. Planets 2012, 117. [Google Scholar] [CrossRef]
  53. Ernst, C.M.; Denevi, B.W.; Barnouin, O.S.; Klimczak, C.; Chabot, N.L.; Head, J.W.; Murchie, S.L.; Neumann, G.A.; Prockter, L.M.; Robinson, M.S.; et al. Stratigraphy of the Caloris basin, Mercury: Implications for volcanic history and basin impact melt. Icarus 2015, 250, 413–429. [Google Scholar] [CrossRef]
  54. Whitten, J.L.; Head, J.W.; Denevi, B.W.; Solomon, S.C. Intercrater plains on Mercury: Insights into unit definition, characterization, and origin from MESSENGER datasets. Icarus 2014, 241, 97–113. [Google Scholar] [CrossRef]
  55. Fassett, C.I.; Crowley, M.C.; Leight, C.; Dyar, M.D.; Minton, D.A.; Hirabayashi, M.; Thomson, B.J.; Watters, W.A. Evidence for rapid topographic evolution and crater degradation on Mercury from simple crater morphometry. Geophys. Res. Lett. 2017, 44, 5326–5335. [Google Scholar] [CrossRef]
  56. Pegg, D.; Rothery, D.; Balme, M.; Conway, S.J.; Malliband, C.; Man, B. Geology of the Debussy quadrangle (H14), Mercury. J. Maps 2021, 17, 718–729. [Google Scholar] [CrossRef]
  57. Denevi, B.; Ernst, C.; Prockter, L.; Robinson, M.; Spudis, P.; Klima, R.; Murchie, S.; Solomon, S.; Whitten, J.; Povilaitis, R.; et al. The origin of Mercury’s oldest surfaces and the nature of intercrater plains resurfacing. In Proceedings of the 47th Annual Lunar and Planetary Science Conference, The Woodlands, TX, USA, 21–25 March 2016; p. 1624. [Google Scholar]
  58. Man, B.; Rothery, D.A.; Balme, M.R.; Conway, S.J.; Wright, J.; Pegg, D.L.; Lennox, A.R.; Buoninfante, S. Geology of the Neruda quadrangle (H13), Mercury. J. Maps 2023, 19, 2256353. [Google Scholar] [CrossRef]
  59. Buoninfante, S.; Galluzzi, V.; Ferranti, L.; Milano, M.; Palumbo, P. Geostructural mapping of the Michelangelo (H-12) quadrangle of Mercury: Relationship between tectonic and crustal structures. In Proceedings of the Europlanet Science Congress 2022, EPSC2022, Granada, Spain, 18–23 September 2022; Volume 811. [Google Scholar]
  60. Kinczyk, M.; Prockter, L.; Denevi, B.; Ostrach, L.; Skinner, J. A global geological map of Mercury. Mercur. Curr. Future Sci. Inn. Planet 2018, 2047, 6123. [Google Scholar]
  61. Zuber, M.T.; Smith, D.E.; Phillips, R.J.; Solomon, S.C.; Neumann, G.A.; Hauck, S.A.; Peale, S.J.; Barnouin, O.S.; Head, J.W.; Johnson, C.L.; et al. Topography of the northern hemisphere of Mercury from MESSENGER laser altimetry. Science 2012, 336, 217–220. [Google Scholar] [CrossRef] [PubMed]
  62. Perry, M.E.; Neumann, G.A.; Phillips, R.J.; Barnouin, O.S.; Ernst, C.M.; Kahan, D.S.; Solomon, S.C.; Zuber, M.T.; Smith, D.E.; Hauck, S.A.; et al. The low-degree shape of Mercury. Geophys. Res. Lett. 2015, 42, 6951–6958. [Google Scholar] [CrossRef]
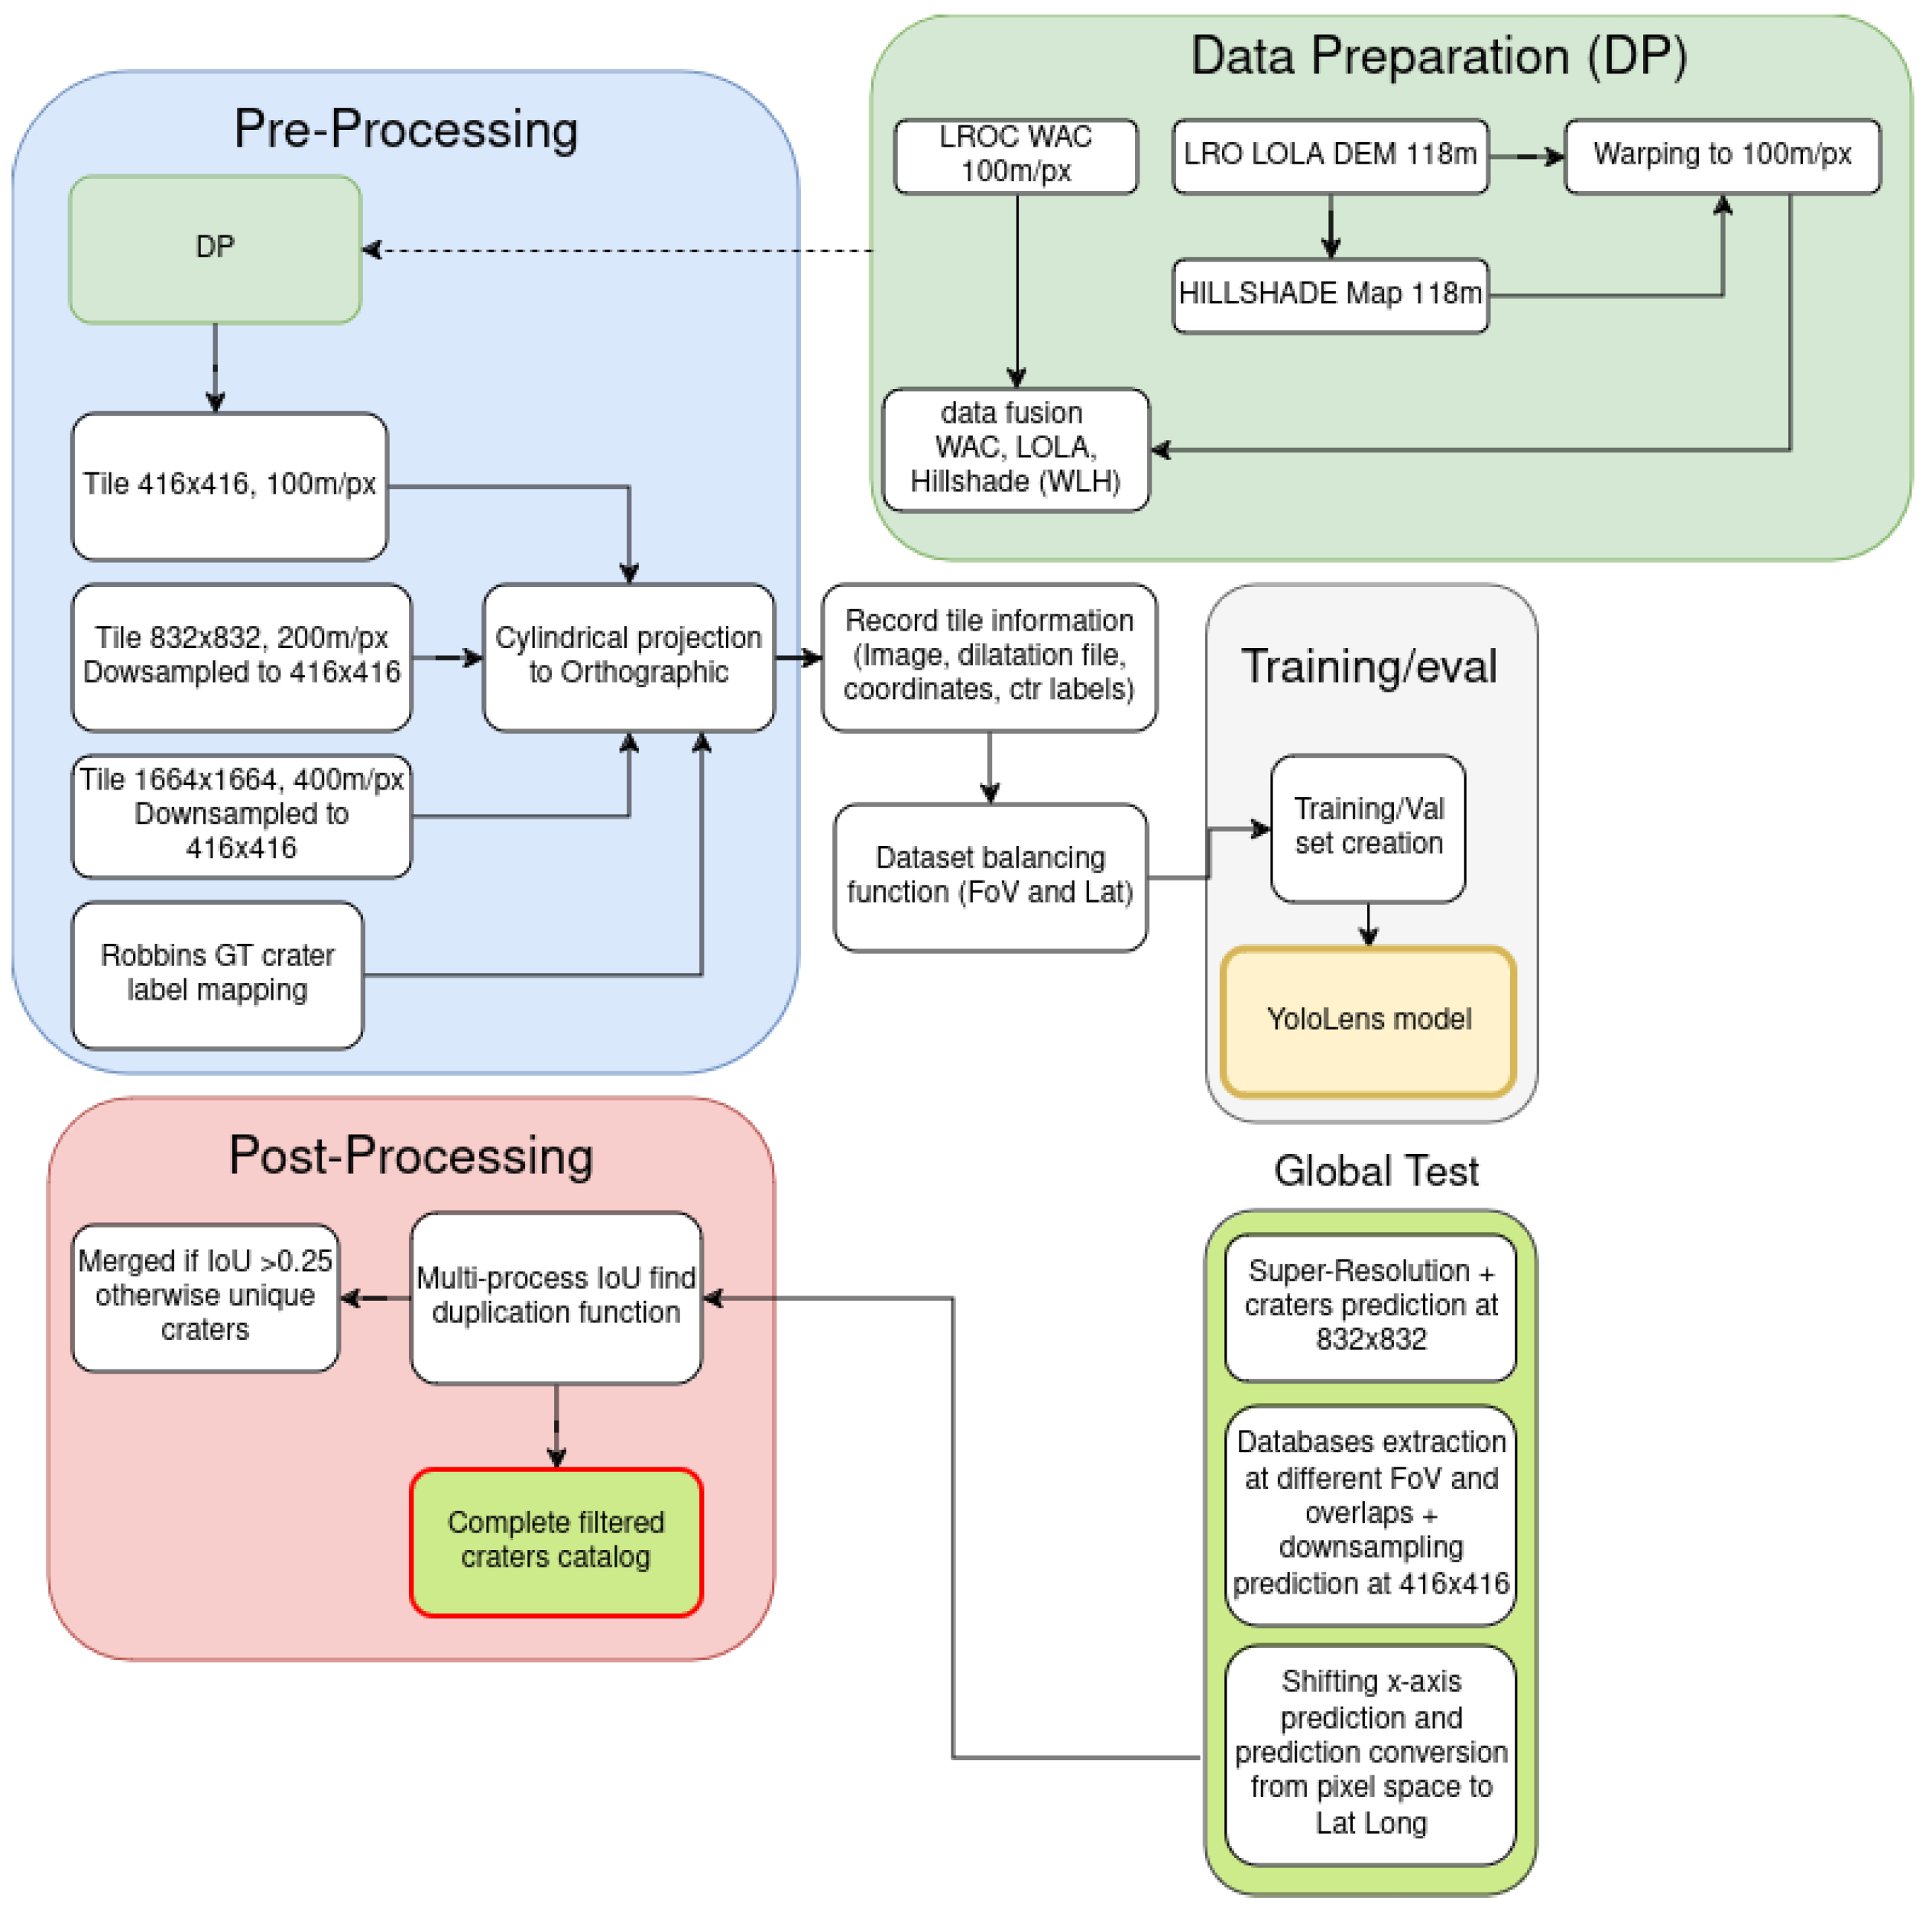
Figure 1. Main workflow. Data Preparation (DP) in light green rectangle represents the data fusion pre-processing in the new revised version.
Remotesensing 17 03287 g001
Figure 2. Example of maximum rim extraction of borders.
Remotesensing 17 03287 g002
Figure 3. At the top, a PSR of the lunar North Pole, extracted by the Wide Angle Camera (WAC), is shown. In the middle, the identical region is presented utilizing data from the Lunar Digital Terrain Model (DTM) map. At the bottom, the YOLOLens predictions overlaid on the LOLA map are shown. This illustrates that despite the lack of information useful for the detection in the WAC channel, the YOLOLens learning process leverages LOLA data to identify subtle crater details and refine the object recognition accurately.
Remotesensing 17 03287 g003
Figure 4. Density map of the Moon’s crater catalog LU6M371TGT, expressed as the number of craters in an area of 5 km 2 .
Remotesensing 17 03287 g004
Figure 5. Density map of the detected craters on Mercury using the ME6M300TGT catalog.
Remotesensing 17 03287 g005
Figure 6. Three manually annotated regions used for validation analysis on Mercury: Victoria Quadrangle (purple), Kuiper Quadrangle (blue), and Suisei Planitia within the Shakespeare Quadrangle (green).
Remotesensing 17 03287 g006
Figure 7. Mean of intersection over union comparing ME6M300TGT catalog across [10,41] and the Suisei Planitia. In the x-axis, the bins are expressed in km and the y-axis shows the error using 1-IoU metric.
Remotesensing 17 03287 g007
Figure 8. Comparison of size-frequency distributions (SFDs) between the ME6M300TGT and the areas analyzed (a) [10], the Suisei Planitia (b,c) [41,43].
Remotesensing 17 03287 g008
Figure 9. Crater density map derived by ME6M300TGT, expressed in number of craters per km 2 , in RGB color composite by diameter range: under 2 km in red (0–0.158 n./ km 2 ), between 2 and 10 km in green (0–0.0624 n./ km 2 ), and above 10 km in blue (0–0.0012 n./ km 2 ).
Remotesensing 17 03287 g009
Figure 10. Comparison of crater density map and the geological map showing how the geological interpretation is closely linked: (a) extract from the geological map of the Hokusai quadrangle (H05) (Wright et al., 2019) [44] and (b) the same region extracted from the ME6M300TGT to derive the density map by diameter range.
Remotesensing 17 03287 g010
Figure 11. The map shows the d/D distribution of Mercury’s craters. (a) Diameter > 155 km over Mercury, (b) the North Pole (>55 km), and (c) the South Pole (>15 km).
Remotesensing 17 03287 g011
Figure 12. Crater’s depth distribution at latitudes greater than 45°. The transition diameter between simple and complex is highlighted in orange.
Remotesensing 17 03287 g012
Figure 13. Crater’s d/D distribution at latitudes greater than 45°. As expected, the d/D tends to decrease as the diameter progresses due to various physical and infilling reasons, both as a direct consequence of impact and in post-impact processes [46,47].
Remotesensing 17 03287 g013
Figure 14. Details of four different regions of similar crater density at different scales associated in the literature with the Smooth Plains geological unit: (a) the Caloris basin, (b) the Apārangi Planitia, (c) the Sithu Planitia, and (d) the Tolstoj crater.
Remotesensing 17 03287 g014
Figure 15. Examples of different degradation states (a) highlighted by d/D (b). The central highly degraded crater, defined as ‘Ghost’, shows both signs of infilling, probably from the same volcanic event that affected the rest of Northern Smooth Plains, and degradation by space weathering. The color scale follows the legend in Figure 11.
Remotesensing 17 03287 g015
Figure 16. (a) Caloris basin maps of the d/D distribution. (b) Craters outlined in blue (30) excavated and/or uplifted spectrally distinct LRM from depth. Craters outlined in orange (107) have not exposed LRM. Craters outlined in white (7) could not be classified based on color. The dashed circle indicates a distance of 640 km from the basin center (modified from Ernst et al., 2015 [53]).
Remotesensing 17 03287 g016
Figure 17. Examples of secondary crater fields, between 2 and 10 km in diameter, highlighted by the crater density map. The primary source craters, indicated by the official nomenclature (Hitomaro, Mahler, Kenko, and Balagtas), are located in the Kuiper quadrangle.
Remotesensing 17 03287 g017
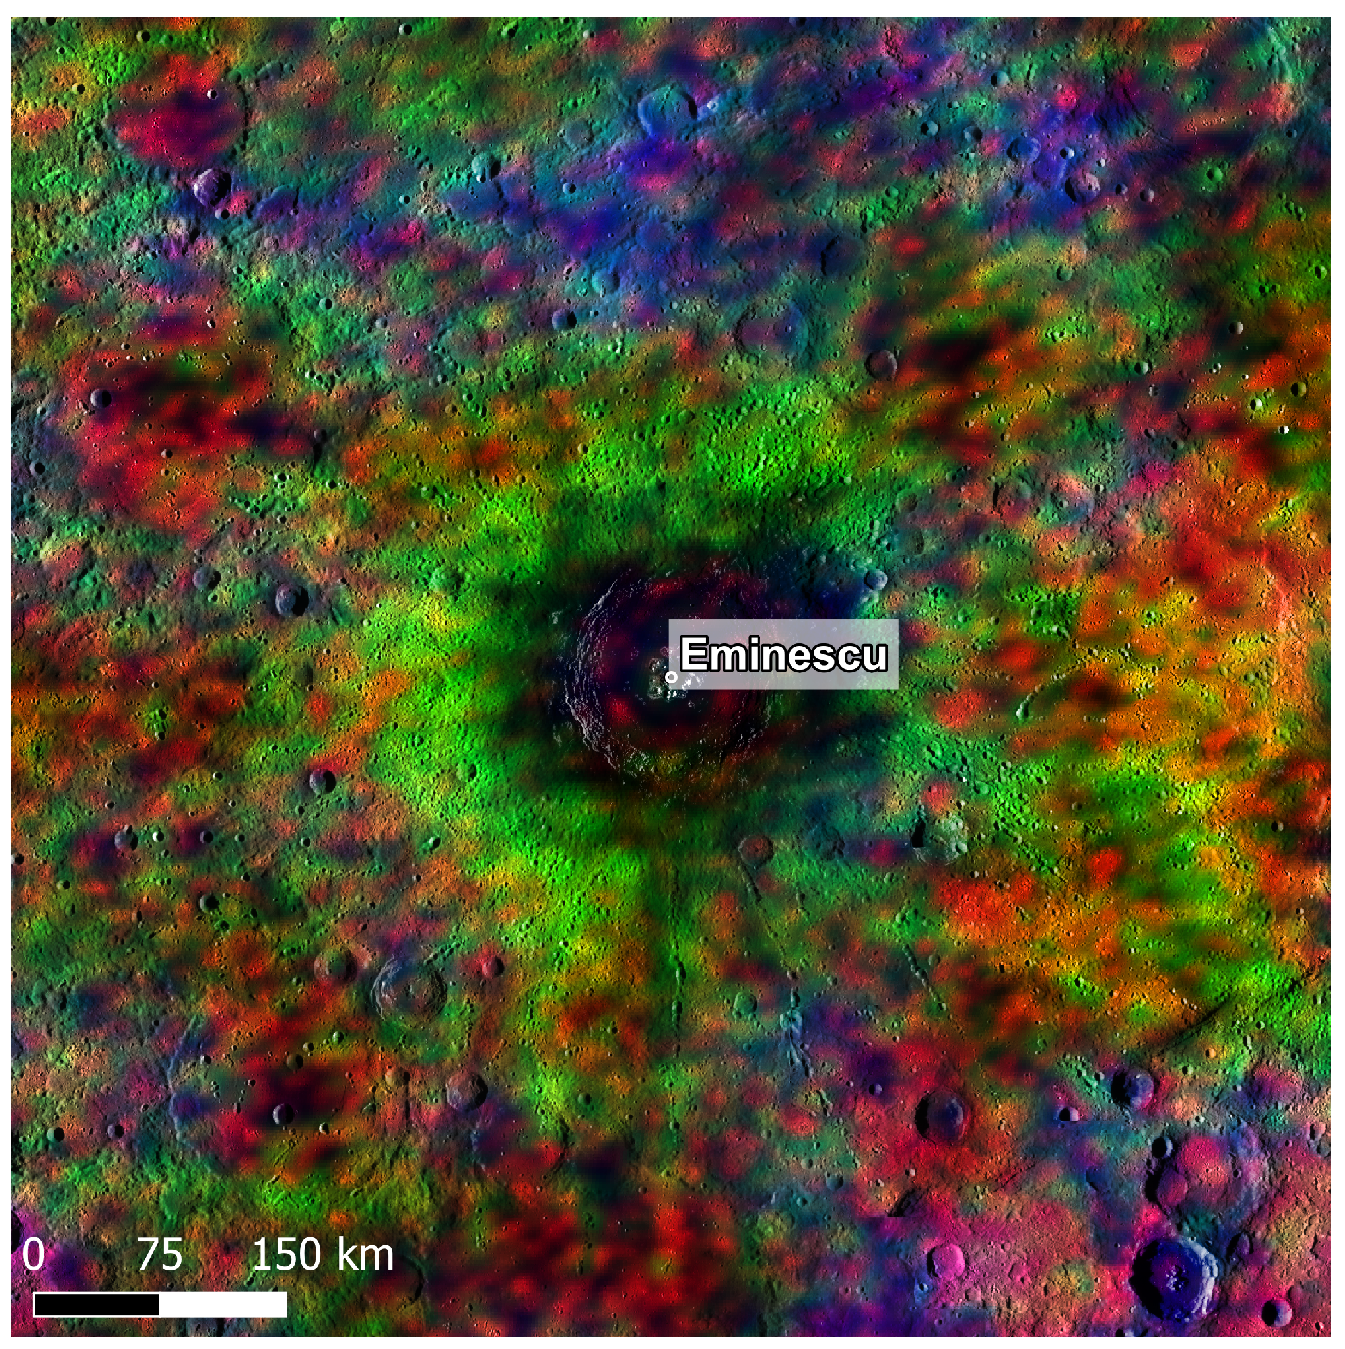
Figure 18. Overlay of the density map with the MESSENGER MDIS global mosaic showing how the secondary craters field of the Eminescu crater is highlighted by the higher density of features between 2 and 10 km in diameter (in green).
Remotesensing 17 03287 g018
Figure 19. The Michelangelo quadrangle showing the highest density of craters with a diameter > 10 km, (a) density map overlaid on the MESSENGER MDIS global mosaic and on average the lowest d/D values (b).
Remotesensing 17 03287 g019
Table 1. Training dataset composition with windows and latitude range balancing.
WindowLatitude Ranges
m/px−90 to −80−80 to −60−60 to 6060 to 8080 to 90
10010942267208322671024
200243490517490227
40043971269721
Table 2. Recall metric extracted by YOLOLens at different latitude degrees using the Robbins Ground-Truth and comparing with the recall extracted by this work (in bold) and previous catalog LU5M812TGT.
South PoleNorth Pole
RangeLU5M812TGTLU6M371TGTRangeLU5M812TGTLU6M371TGT
α 32.3 60.1 ϵ 29.3 59.6
β 47.8 67.8 ζ 53.7 68.2
γ 67.5 77.8 η 68.2 74.3
δ 71.9 77.1 θ 74.5 76.7
Descriptions of Regions
α : 90 to 87 of latitude ϵ : 90 to 87 of latitude
β : 87 to 84 of latitude ζ : 87 to 84 of latitude
γ : 84 to 81 of latitude η : 84 to 81 of latitude
δ : 81 to 78 of latitude θ : 81 to 78 of latitude
Table 3. Results of crater analysis of three different tiles selected as a statistical sample (the new results provided by YOLOLens with WLH approach and compared with the results provided by [30] are in red). The craters were verified by three experienced operators to identify the false positive rate.
ConfidenceDetected CratersFalse PositivesTrue Positives [%]
Southern Highlands (Lat: −45/−40° and Long: 55/60°)
0.281550 (4864)17 (54)98.90 (98.9)
0.261625 (5013)20 (60)98.77 (98.8)
0.221793 (5294)39 (65)97.82 (98.77)
0.21906 (5496)55 (76)97.11 (98.62)
Northern Highlands (Lat: 60/65° and Long: 120/125°)
0.5327 (863)44 (65)86.54 (92.47)
0.4414 (950)64 (80)84.54 (91.58)
0.3517 (1052)90 (93)82.59 (91.16)
0.2746 (1223)139 (117)81.37 (90.43)
Table 4. Comparison of crater diameter counts for Mercury. Number of craters on Mercury within specific diameter ranges (in kilometres) as reported by the ME6M300TGT dataset and Herrick’s dataset. The cumulative count of craters across all diameter ranges is presented in the final row.
Diameter Range (km)ME6M300TGTHerrick
<1895,6290
1 5 5,130,83762
5 10 231,8164150
10 20 32,3886477
20 40 64803646
40 60 15031300
60 80 576553
80 100 252280
T o t a l 6,299,48116,468
Table 5. Summary of crater detection performance by YOLOLens across different datasets, including global crater counts.
AreaRecall (%)Manually CountedMatched by YOLOLensYOLOLens Count
α 92.01732157930,920
β 80.013210630,017
γ 58.05052294930,017
δ 84.041835235,905
ϵ 95.7331317493,970
α : Victoria Quadrangle (H02) [41]. β : Kuiper Quadrangle (H06) [10,12]. γ : Suisei Planitia (H03). δ : South Pole Region [16]. ϵ : Northern Hemisphere [42].
Disclaimer/Publisher’s Note: The statements, opinions and data contained in all publications are solely those of the individual author(s) and contributor(s) and not of MDPI and/or the editor(s). MDPI and/or the editor(s) disclaim responsibility for any injury to people or property resulting from any ideas, methods, instructions or products referred to in the content.