Highlights
What are the main findings?
- Model results reveal that thermodynamic processes dominate Beaufort Sea ice retreat (~90%), with vertical heat flux as the primary driver, while both model and satellite-derived Day of Opening (DOO) strongly correlate with minimum sea ice area.
- Multiple regression using remote sensing and reanalysis data (sea ice concentration, temperature, and wind) provides skillful prediction of summer minimum sea ice area (R2 up to 0.49).
What is the implication of the main finding?
- Remote sensing products offer a robust basis for monitoring and forecasting Beaufort Sea summer sea ice variability.
- Improved seasonal prediction capability highlights the growing influence of weather events under thinning ice conditions in a warming Arctic.
Abstract
The Beaufort Sea has experienced significant sea ice retreat in recent decades, driven by both thermodynamic and dynamic processes. This study investigates the drivers and predictability of summer sea ice retreat in the Beaufort Sea by integrating an ocean–sea ice model with satellite-derived sea ice concentration data and atmospheric reanalysis products. Model diagnostics from 1994 to 2019 reveal that thermodynamic processes dominate annual sea ice loss (approximately 90%), with vertical heat flux accounting for roughly 85% of total oceanic heat input. The summer sea ice minimum area and the day of opening, derived from either model results and satellite observations, have a strong correlation with R2 = 0.60 and R2 = 0.77, respectively, enabling regression equations based solely on remote sensing data. Further multiple linear regression incorporating preceding winter (January to April) accumulated temperature and easterly wind yields moderately robust forecasts of minimum sea ice area (R2 = 0.49) during 1998–2020. Additionally, analysis of reanalysis wind data shows that the timing of minimum sea ice area is significantly influenced by the frequency and intensity of sub-seasonal easterly wind events during melt season. These results demonstrate the critical importance of remote sensing in monitoring Arctic sea ice variability and enhancing seasonal prediction capability under a rapidly changing climate.
1. Introduction
Over the past few decades, the sea ice coverage and extent in the Arctic Ocean have decreased rapidly [1,2,3], and the sea ice thickness and concentration have also constantly declined [4,5]. These changes have been exerting profound impacts on the regional climate environment, ecosystems, carbon cycling, and economic activities, particularly in the marginal continental shelf seas in the Arctic Ocean [6,7,8].
The Beaufort Sea, located in the western Arctic Ocean (Figure 1), is one of the regions with the most dramatic changes in sea ice in the Arctic Ocean [9,10]. It is rich in oil and natural gas resources [11] and is also known as the key area for the Northwest Passage of the Arctic, which plays an increasingly crucial role in shipping activities as the constantly declined sea ice [12,13]. The rapid variability of sea ice area (SIA) of the Beaufort Sea affects regional marine ecosystems, including the utilization rate of light, species abundance, distribution, and interaction, as well as the designation of protected marine zones [14,15]. Meanwhile, the retreat and advance of sea ice fundamentally influence the local marine economic activities such as marine navigation, coastal community infrastructure, and exploitation of oil and natural gas resources [11]. Therefore, it is quite necessary to predict the sea ice area of the Beaufort Sea in the summer season.
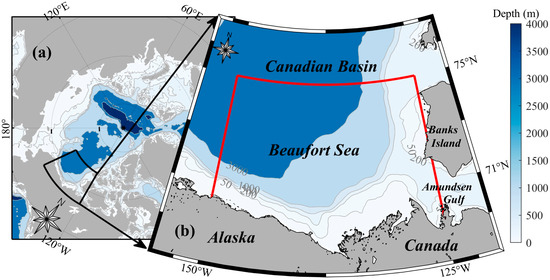
Figure 1.
Bathymetry of the (a) Arctic Ocean and (b) Beaufort Sea. In panel (b), the red solid line represents the range of the Beaufort Sea (125°W to 150°W, south of 75°N to the coastline), and the gray lines are the isobaths representing 50 m, 200 m, 500 m, 1000 m, and 3000 m. Bathymetry data are from the ORCA025 developed for the DRAKKAR project (https://www.drakkar-ocean.eu/global-models/orca025, accessed on 15 June 2016).
Based on the east wind speed from April to June, Steele et al. made predictions for the Day of Opening (DOO) and the Day of Retreat of sea ice in the Beaufort Sea [16]. They also pointed out that sea ice transport in April is particularly important for the sea ice area prediction, as the initial open water areas in the Beaufort Sea are produced by dynamical processes and initiate the positive feedback of ice-albedo that expedites summer sea ice loss. Further, Babb et al. found a statistically significant relationship (R2 = 0.37, p < 0.01) between net sea ice export during April and sea ice area in September in the Beaufort Sea from 1998 to 2016 [17]. This indicates that for every 100,000 km2 of net sea ice export during April, there is a reduction of 72,110 ± 5200 km2 in the September sea ice area.
However, for the time being, only the influence of dynamics is considered, while the contribution of thermodynamics is not taken into account in the prediction of sea ice in the Beaufort Sea [18]. In addition, the recent analysis led by the Sea Ice Prediction Network emphasized that short-term synoptic processes and extreme events play an important role in the abrupt changes in the interannual variation in sea ice coverage [19,20]. These factors can cause rapid, unexpected changes in sea ice, making it challenging to predict future trends. The frequency of Arctic cyclones always peaks in summer [21,22]. Serreze et al. first noticed the impact of summer Arctic cyclone activity on sea ice loss, pointing out that abnormally low sea surface pressure persisted from June to August in 2002 and promoted a new record low of the minimum sea ice area in September [23]. As sea ice thins, the response of sea ice to the atmosphere becomes stronger, and it is also worth exploring how synoptic processes affect the sea ice prediction.
This study aims to (1) quantitatively assess the dynamic and thermodynamic contributions to sea ice retreat in the Beaufort Sea and determine the key controlling factor by using an ocean–sea ice coupled model; (2) evaluate the predictability of summer minimum sea ice area in the Beaufort Sea by using satellite and reanalysis datasets.
2. Materials and Methods
2.1. Sea Ice Concentration and Sea Ice Area
The satellite-based sea ice concentration data during 1979–2020 was sourced from the Climate Data Record (CDR) [24] of Passive Microwave Sea Ice Concentration, which is provided by the National Snow and Ice Data Center (NSIDC) of the United States. This dataset is derived from two passive microwave observations: the Scanning Multichannel Microwave Radiometer on the Nimbus-7 satellite and the Special Sensor Microwave Imager and Special Sensor Microwave Imager/Sounder on the Defense Meteorological Satellite Program satellites. The sea ice concentration from CDR is produced by combining concentration estimates from two algorithms developed at the National Aeronautics and Space Administration of the United States (NASA) Goddard Space Flight Center: the NASA Team algorithm [25] and the Bootstrap algorithm [26]. The data is gridded on the NSIDC polar stereographic grid with a spatial resolution of 25 km × 25 km, covering the entire region from 31.1°N to 90°N of Northern Hemisphere since 25 October 1978. Generally, the observation error in winter sea ice concentration is around 5%, while in summer when melt ponds are present, the error is larger, but overall remains within 15% [27].
In this study, the sea ice concentration of 15% is used as the threshold for calculating the sea ice area (SIA) [28,29]. The specific calculation formula is as follows:
where is the sea ice concentration (0–100%), is the area of grid cell, and is the weight coefficient of each pixel grid. When the sea ice concentration within a grid is less than 15%, the corresponding weight coefficient is 0, indicating that there is no sea ice in that grid area. When the sea ice concentration within a grid exceeds 15%, the weight coefficient is 1, and the sea ice area within that grid is the product of the corresponding sea ice concentration and the grid area. The total sea ice area of the Beaufort Sea is obtained by summing up the sea ice areas of all the grids within the region as shown in Figure 1.
2.2. Wind Speed, Air Temperature and Accumulated Temperature
The atmospheric forcing data were derived from the ERA5 dataset [30], which is the fifth generation of the European Center for Medium-Range Weather Forecasts (ECMWF) atmospheric reanalysis of the global climate, including 10 m wind field and 2 m air temperature. The hourly dataset covers the entire globe with a spatial resolution of 0.25° × 0.25°, and the time period ranges from January 1940 to the present.
The changes in the wind field lead to a rapid response of sea ice area. In contrast, the impact of variabilities in temperature on sea ice is a slow cumulative process. Therefore, accumulated temperature (AT), as the cumulative value of the temperature over a given period [31], is used to represent the influence of temperature on the formation of open water areas. The expression of accumulated temperature is as follows:
where S is the total area of the study area; T(s,t) is the monthly averaged temperature in the given grid cell and given month, s is the cell area, and t is in monthly timescale. In this study, the integral interval length for accumulated temperature is the preceding winter (January to April). During winter, the temperatures are all negative. Thus, the smaller the absolute value of the accumulated temperature, the less heat is lost, and the smaller the increment in sea ice thickness; the larger the absolute accumulated temperature value, the more heat is lost and the greater the increment in sea ice thickness.
2.3. The Ocean–Sea Ice Coupled Model
A three-dimensional ocean–sea ice coupled model was used in this study. The model is based on the Nucleus for European Modelling of the Ocean (NEMO) version 3.6 [32] and the Louvain-la-Neuve Sea Ice Model version 3 (LIM3) [33,34]. It adopts the global ORCA tri-polar grid developed by the DRAKKAR group (https://www.drakkar-ocean.eu/, accessed on 15 June 2016) [35]. The model domain includes the north Atlantic (north of 26°N), north Pacific (north of 45°N), and the entire Arctic Ocean. It has a horizontal resolution of 1/4° in longitude and latitude (~12 km in the Beaufort Sea). Vertically, the model uses a z-coordinate system with 75 layers, including 19 layers within the upper 50 m. The model ran from 1 October 1993, to 31 December 2019, producing completed 26 years of hindcast simulations. The model output, including sea ice concentration and thickness, sea surface temperature (SST), vertical heat flux, eastward and northward velocity, and rate of change in sea ice thickness contributed from thermodynamic processes, was provided as 5-day averages for further analysis. Additional model configurations are described in Luo et al. [36] and Zhang et al. [10].
Comparisons with observational data indicate that the model can reliably reproduce ocean–sea ice variations in the Arctic Ocean [10,36,37]. Zhang et al. [10] performed comprehensive validations of sea ice variables in the Beaufort Sea and showed that the model successfully captures the spatiotemporal variabilities of sea ice concentration, thickness, and drift velocity. Therefore, the model is suitable for studies on sea ice variability and its driving mechanisms in this region.
2.4. Diagnostics of Model Results
Sea ice variability is influenced by both dynamic and thermodynamic processes [10,38,39,40]. Thermodynamic processes directly govern sea ice melting and formation, whereas dynamic processes mainly control sea ice drift, ridge, deformation, breakage, and overlap, which in turn influence ice distribution and associated thermodynamic changes. The model has a significant advantage in directly outputting the contributions of the thermodynamic processes to changes in sea ice thickness. Specifically, the model calculates sea ice thickness changes as the sum of thermodynamic growth/melt and dynamic advection/deformation terms. This separation is explicitly embedded in the model’s governing equations [33], which is clearly described in the user guide of LIM3 (available at https://cmc.ipsl.fr/images/publications/scientific_notes/lim3_book.pdf, accessed on 25 July 2016). In practice, the thermodynamic contribution to the ice thickness change is calculated based on the model thermal ice melting and freezing, directly outputting from model as a diagnostic variable (5-day averaged). While the dynamic contribution to the ice thickness change is calculated as the difference between the total ice thickness change over 5-day and the thermodynamic contribution.
Then we quantitatively evaluated the relative contributions of thermodynamic and dynamic processes to sea ice thickness changes. Taking the dynamics as an example, the relative contribution is calculated as follows [19,41]:
The lateral net heat flux includes the heat exchange through the eastern, northern, and western boundaries of the Beaufort Sea (red lines in Figure 1), and is calculated following the method proposed by Woodgate [42]:
where Q is defined as the lateral heat flux; ρ is the density of seawater (1023 kg m–3); Cω is the specific heat capacity of water (3900 J kg–1 K–1); θ (°C) is the seawater temperature; θref is the referential temperature (−1.9°C); v (m/s) and u (m/s) are the north–south and east–west components of the velocity, respectively.
3. Results
3.1. Dominant Drivers of Sea Ice Retreat in the Beaufort Sea
Based on the model results, we estimated the relative contributions of thermodynamics and dynamics to sea ice thickness changes in the Beaufort Sea from 1994 to 2019 (Figure 2). From January to April, the region is almost entirely covered by sea ice. During this period, thermodynamic processes contribute to an increase in sea ice thickness, while dynamic processes lead to a reduction. At the end of April, the thermodynamic contribution shifts from positive to negative, initiating sea ice loss. While from June to early September, the dynamic processes contribute positively to sea ice thickness. Under the influence of the two processes, the reduction rate of sea ice thickness peaks in July and then gradually decreases. By mid-September, the thermodynamic contribution becomes positive again, and ice thickness turns to increase. From October onward, the thermodynamic component remains positive, leading to a gradual recovery of ice thickness.
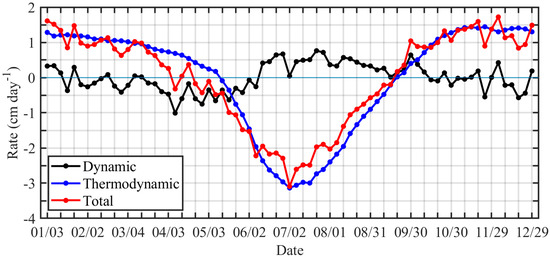
Figure 2.
Annual cycle of sea ice growth and decay rates of ice thickness in the Beaufort Sea averaged over multiple years from 1994 to 2019. A negative value indicates the rate of sea ice thickness decay, and a positive value indicates the growth rate.
During the melting season (late April to late September), the decline rate of sea ice thickness is −1.38 ± 0.33 cm day−1, which is comparable to the thermodynamic-driven rate of −1.52 ± 0.17 cm day−1. According to Equation (3), the contributions of dynamic and thermodynamic processes to sea ice decline between April 23 and September 15 were quantified, indicating that dynamics account for approximately 36%, while thermodynamics dominate with a contribution of ~64%. Annually, thermodynamic and dynamic processes contribute ~92% and ~8%, respectively, confirming that thermodynamics are the primary driver of sea ice change in the Beaufort Sea, whereas changes induced by dynamic processes are relatively minor [18,43]. Therefore, the following analysis primarily focuses on the relationship between sea ice thickness change and thermodynamic processes.
The heat responsible for sea ice melt in the Beaufort Sea originates primarily from sea surface net heat flux [44], Pacific Water inflow [45], riverine input from the Mackenzie River [46], and Atlantic Water delivered by upwelling [47]. These sources can be categorized into vertical and lateral heat fluxes (see Equation (4) for details). Based on model simulations, the climatological seasonal variability (1994–2019) of sea surface temperature (SST), vertical heat flux, and lateral heat flux in the upper 200 m of the Beaufort Sea is presented in Figure 3. Prior to the melt season, vertical heat flux is nearly zero, while lateral heat flux is negative due to stronger export in the western boundary; SST remains slightly higher than the freezing point throughout the region. In early May, the ocean begins to absorb vertical heat flux through the surface, promoting sea ice melt. During the melting season, vertical heat flux increases rapidly, accelerating basal melting and raising SSTs. During June–August, less export in the western boundary together with some Pacific Water entering the Beaufort Sea along the western shelfbreak, although the transport volume is relatively low [45], make the lateral heat flux becomes positive. By late August, SST reaches its annual maximum (~1°C). The warming of the upper ocean delays the onset of freezing and extends the influence of summer heat input into autumn and early winter. In September, the vertical heat flux turns negative, indicating heat release from the ocean to the atmosphere and a decline in water column heat content. By October, the Beaufort Sea is once again covered by sea ice. Annually, vertical heat flux in the sea surface is the dominant contributor to sea ice retreat, accounting for approximately 87% of the total heat input, while lateral heat flux contributes only ~13%.
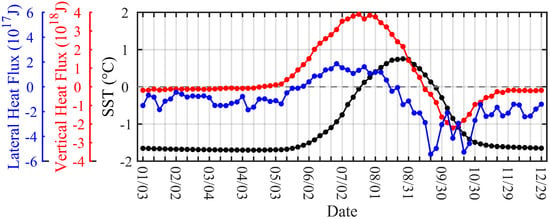
Figure 3.
Seasonal variations in the multi-year average sea surface temperature, vertical heat flux, and lateral heat flux in the Beaufort Sea from 1994 to 2019. A positive (negative) value represents heat absorption (loss). Note that the order of magnitudes of the vertical and lateral heat fluxes is different.
3.2. Linkage Between the Minimum Sea Ice Area and the Day of Opening
As shown in Section 3.1, thermodynamic processes dominate the sea ice retreat in the Beaufort Sea, with vertical heat flux accounting for approximately 87% of the total thermodynamic contribution, making it the primary heat source driving ice melt. Sea ice cover is a key barrier preventing shortwave radiation from penetrating the ocean. Open water reflects only ~7% of incoming solar radiation, whereas snow-covered sea ice reflects ~85%, and bare ice reflects ~65% [44]. As the sea ice retreats, highly reflective sea ice is replaced by highly absorptive open water, resulting in greater solar energy absorption and enhanced melting. Additionally, thinning sea ice due to basal melt allows more solar radiation to be transmitted to the underlying ocean compared to thicker ice [44]. These phenomena reflect the classic albedo feedback mechanism of sea ice melt in the Beaufort Sea: more open water leads to more solar absorption, further melting, and thus more open water.
Sea ice is the primary factor determining the duration of ocean heat absorption and release [48]. The formation of open water is therefore a key factor in establishing this positive feedback. Figure 4 shows the daily variation in sea ice concentration and the interannual variability of the Day of Opening (DOO) and the Day of Closing (DOC) in the Beaufort Sea. The definitions of DOO and DOC follow those provided by the NSIDC: DOO refers to the last date during the winter-spring season when sea ice concentration drops below 80%, marking the onset of open water conditions; while DOC refers to the date when sea ice concentration first exceeds 80% during the freezing period in autumn-winter seasons [49].
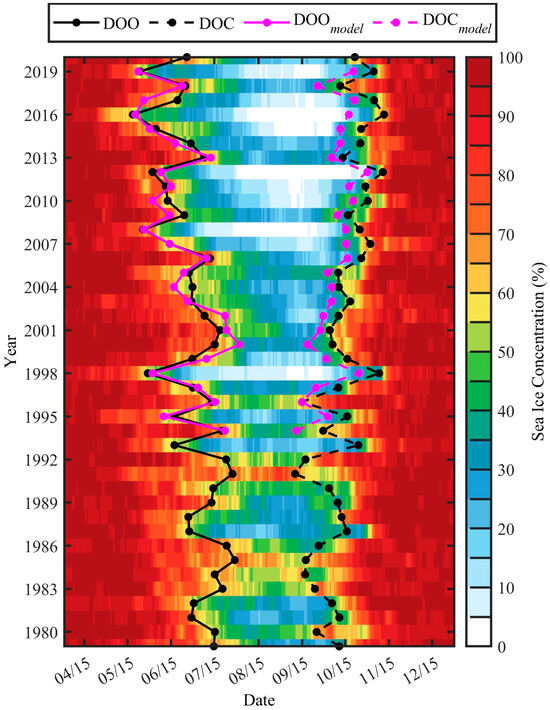
Figure 4.
The daily variation in sea ice concentration averaged over the Beaufort Sea from 1979 to 2020 based on CDR satellite observation data. The black solid and dashed lines represent the DOO and DOC derived from CDR, the magenta solid and dashed lines represent the DOO and DOC derived from model results. DOO and DOC are computed from CDR or modeled sea ice concentration at each grid cell for each year, and then averaged over the entire Beaufort Sea.
Based on the CDR data during 1979–2020, the interannual variability in DOO is substantial, ranging from 18 May in 2016 (the earliest) to 29 July in 1985 (the latest)—a span of 71 days. Similarly, DOC varies between 10 September in 1991 (earliest) and 10 November in 2016 (latest), a difference of 62 days. The interval between DOO and DOC defines the total outer ice-free period (OIFP). The OIFP from CDR data in the Beaufort Sea lasted as long as 176 days in 2016 and as short as 44 days in 1991. Values of DOO and DOC derived from the modeled 5-day averaged ice concentration match well with the CDR-derived DOO and DOC, with the correlations of R = 0.92 (p < 0.01) and R = 0.93 (p < 0.01), respectively.
As shown in Figure 4, for both CDR and model results, years with earlier DOO and longer OIFP correspond well with previously documented extreme low-ice years [17,50,51,52,53]. Moreover, the CDR-derived DOO and DOC from 1979 to 2020 show a significant negative correlation (R = −0.87, p < 0.01), similar significant correlation is presented in the model solution (R = −0.80, p < 0.01), indicating that earlier open water onset allows more solar energy to be absorbed by the ocean, extending the ice-free period and delaying the onset of sea ice formation [54]. The correlation analysis further reveals a strong negative relationship between DOO and OIFP, with a correlation coefficient of −0.97 (p < 0.01) in both CDR and model data. These significant negative correlations underpin the rationale for predicting the minimum sea ice area using the DOO as a predictor.
The interannual variability of CDR-derived DOO, the minimum sea ice area (SIAmin), and the date of the minimum sea ice area from 1979 to 2020 are illustrated in Figure 5a. As DOO advances earlier in the year, the minimum sea ice area declines accordingly. In five extremely low-ice years (1998, 2008, 2012, 2016, 2019), the DOO occurs significantly earlier than in other years. While the date of the minimum sea ice area exhibits interannual variability, it does not show a significant trend toward earlier or later occurrence. The fitting relationship between DOO and SIAmin is robust with a significant positive correlation (R = 0.87, p < 0.01) over the study period (Figure 5b). The fitted linear relationship is:
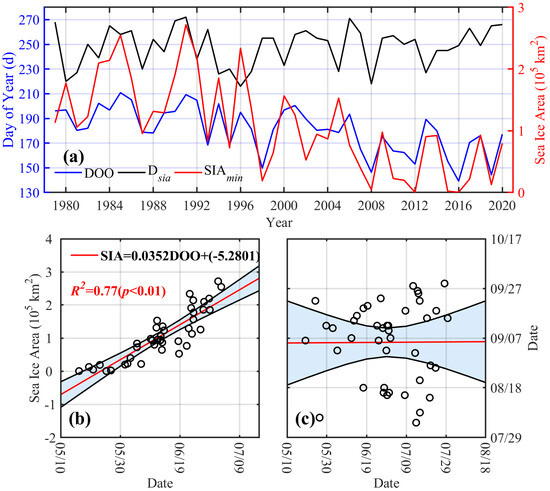
Figure 5.
(a) Interannual variations in the Day of Opening (DOO), the minimum Sea Ice Area (SIAmin) and the date when the minimum SIA (Dsia) was reached in the Beaufort Sea from 1979 to 2020; (b) The fitting relationship between the SIAmin and the DOO, with the blue shaded area representing the 95% confidence interval; (c) The fitting relationship between the Dsia (y-axis) and the DOO (x-axis).
The coefficient of determination (R2) for this regression is 0.77, with prediction error being ± 0.36 × 10⁵ km2. Similarly, modeled SIAmin and DOO also have a robust relationship with R2 of 0.60 (not shown), suggesting the feasibility to predict SIAmin in the Beaufort Sea derived from the easily accessible satellite data. However, as shown in Figure 5c, DOO is not a reliable predictor for the timing of the minimum sea ice area—a point that will be further discussed in Section 4.2.
3.3. Associations of the Day of Opening and Preceding Winter Accumulated Temperature and Wind
This study has demonstrated that vertical heat flux (mainly solar radiation) on the sea surface is the main source of heat for ice-melting and formation of open water in the Beaufort Sea. Thus, in the evolution of sea ice, the role of local air temperature, especially during winter [18], cannot be overlooked. Its effect is primarily manifested as a gradual and accumulative thermal process contributing to eventual sea ice retreat. In meteorology, accumulated temperature below 0 °C is referred to as negative accumulated temperature, which is directly related to sea ice formation [55]. In addition, wind forcing averaged over the preceding winter plays a role in sea ice retreat. Due to the processes of sea ice convergence, ridging, and deformation, sea ice drift is not always aligned with surface wind direction. Nevertheless, changes in sea ice area are largely determined by the regional mean wind field [16]. In the Beaufort Sea, easterly winds promote the formation of open water, while stronger westerly winds tend to favor sea ice growth. Therefore, both preceding winter accumulated temperature and wind forcing are critical preconditions affecting the timing of open water formation before the melt season.
As shown in Figure 6, a significant correlation is observed between preceding winter (January to April) accumulated temperature and DOO: years with higher accumulated temperatures correspond to earlier DOO. The correlation coefficient between the two variables reaches −0.60 (p < 0.01), suggesting that preceding winter accumulated temperature is a key factor influencing the timing of open water formation (Figure 6a). In Figure 6b, the strength of the easterly wind (u) is positively associated with earlier DOO, with a correlation coefficient of 0.29 (p < 0.1). In contrast, the southerly wind component (v) shows little correlation with DOO, and the relationship does not pass the significance test. Overall, the timing of open water formation in the Beaufort Sea is primarily modulated by preceding winter accumulated temperature and the strength of the zonal wind component, with a comparatively minor influence from meridional wind vectors.
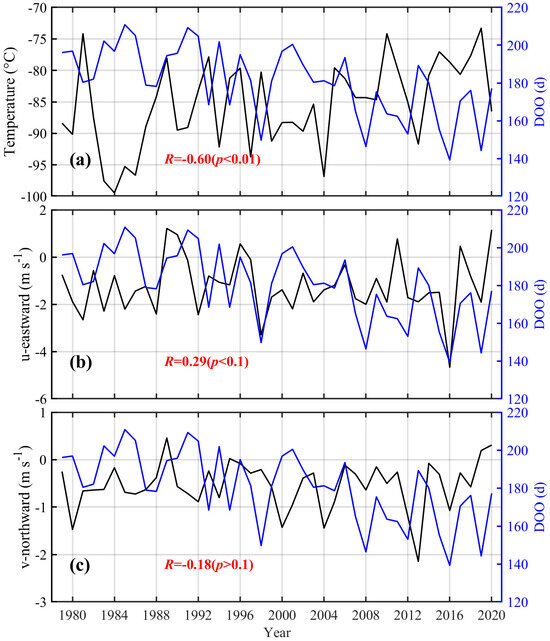
Figure 6.
The interannual variations and correlations of the Day of Opening (DOO) and (a) the accumulated temperature (AT), (b) eastward, and (c) northward wind speed during the preceding winter (January to April) in the Beaufort Sea from 1979 to 2020. A positive (negative) u component indicates west (east) wind, and a positive (negative) v component represents south (north) wind.
A t-test analysis confirms that preceding winter accumulated temperature and easterly wind strength are statistically independent. Thus, a multiple linear regression model was constructed using least squares fitting between DOO and the two predictors—accumulated temperature and easterly wind speed—based on 42 years (1979–2020) of data. After removing outliers based on residual diagnostics, the following relationship was established:
The fitting results of the regression equation show a strong correlation with the observed DOO values (R2 = 0.51, p < 0.01). The prediction error, compared to actual observations, is within ±14 days, enabling 1–3 months lead-time predictions of DOO. This demonstrates that the DOO can be effectively parameterized using a linear combination of preceding winter accumulated temperature and easterly wind strength (Figure 7). The regression equation indicates that stronger easterly winds and warmer winters (i.e., higher accumulated temperatures) favor earlier open water formation in the Beaufort Sea. This combined dynamic-thermodynamic control mechanism provides a useful framework for seasonal prediction of sea ice conditions in the region.
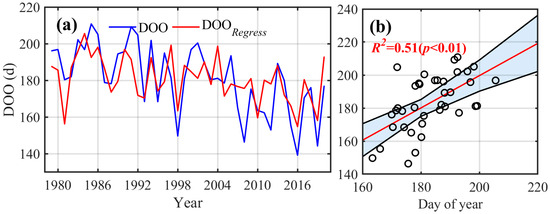
Figure 7.
(a) The interannual variations in the fitted (red) and the observed (blue) Day of Opening (DOO) in the Beaufort Sea from 1979 to 2020; (b) The linear correlation between the fitted and the observed values of DOO, with the blue shaded area representing the 95% confidence interval.
4. Predictability and Timing of Minimum Sea Ice Area
4.1. Predicting the Minimum Summer Sea Ice Area Based on Preceding Winter Accumulated Temperature and Wind Forcing
This study has established a robust relationship between the summer minimum sea ice area (SIAmin) and the Day of Opening (DOO) based on the CDR dataset (Equation (5)), as well as between preceding winter accumulated temperature (AT), easterly wind strength (u), and the DOO (Equation (6)) in the Beaufort Sea during 1979–2020. Building on these insights, the SIAmin can be directly predicted using preceding winter accumulated temperature and easterly wind strength as predictors. A multiple linear regression was performed for the period 1979–2020 using the least squares method. After removing outliers based on residual diagnostics, the following regression equation was obtained:
The goodness-of-fit coefficient R2 of this formula is 0.42 (p < 0.01), with a prediction error of (0.11 ± 0.62) × 105 km2 compared to observed values (Figure 8). These results confirm the feasibility of using preceding winter atmospheric conditions to forecast the summer minimum sea ice area in the Beaufort Sea.
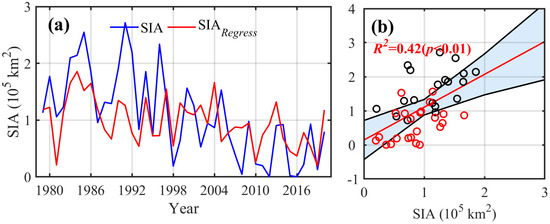
Figure 8.
(a) The interannual variations in the fitted (red) and the observed (blue) summer minimum sea ice area (SIAmin) in the Beaufort Sea from 1979 to 2020; (b) The correlation between the fitted value and the observed value of the SIAmin. The blue shaded area represents the 95% confidence interval, the black circles represent the years before 1998, and the red circles represent the years after 1998.
However, as sea ice has thinned over the past decades, its sensitivity to atmospheric dynamic forcing has likely increased. Among the identified extremely low ice years, the summer of 1998 stands out as a transitional period following several decades characterized by predominantly heavy ice condition. It marked the first year with notably low ice extent, with a younger and thinner ice pack. As such, 1998 has been widely identified as a clear turning point in the Beaufort Sea, making a shift from multiyear ice dominance to a regime dominated by first-year ice [17,56,57,58]. Indeed, while the initial fitted equation performed reasonably well overall, many data points after 1998 fall outside the 95% confidence interval (Figure 8). Moreover, results from Wei et al. [53] indicated that the record-low sea ice area in 2019 was driven by anomalous easterly winds in May, highlighting the increasing importance of dynamic–thermodynamic coupling processes. Therefore, an additional regression analysis was conducted for the post-1998 period (1998–2020), incorporating May easterly wind speed (u5) as a new predictor variable.
The updated regression equation during 1998–2020, based on least squares fitting and outlier exclusion, is as follows:
Incorporating May winds significantly improved the regression equation’s performance, increasing the R2 to 0.49 (p < 0.01) with a prediction error of (0.05 ± 0.41) × 105 km2, and yielding better consistency with the observed data within the confidence bounds (Figure 9). These results suggest that, under conditions of thinner sea ice thickness, short-term atmospheric events, such as anomalous wind patterns during key periods, can have a pronounced impact on summer minimum sea ice area and should be accounted for in regression equation. However, the stochastic nature of such weather events introduces new challenges for sea ice forecasting in a warming Arctic.
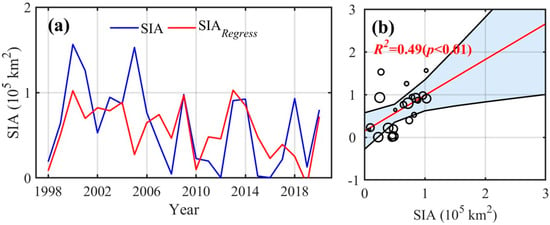
Figure 9.
(a) Same as Figure 8 but for adding May easterly wind speed as a new predictor to obtain the fitted SIAmin during 1998–2020. In panel (b), the circle indicates the year; the larger the circle, the later the year.
Compared with the method from Babb et al. [17], who find a statistical relationship (R2 = 0.37) between ice export during April and September sea ice area, our regression equation has an improvement (R2 = 0.49) by incorporating accumulated temperature. However, as the ice thins through the melt season, the impact of surface (2 m) air temperatures above 0 °C would be greater on sea ice surface melt, such extreme summer temperature events should be explicitly incorporated into the analysis in future work.
Our statistical models are relatively simple compared with advanced machine learning approaches [59,60,61,62,63], coupled forecast models [64,65,66,67,68,69], and other statistical method [70,71,72]. However, the strength of our method lies in its transparency, interpretability, and ease of application by the reliance only on widely available satellite and reanalysis datasets. The regression coefficients directly indicate the relative influence of accumulated temperature and wind, which provides physical insight that complements the results from more complex black-box models. These features make the method easily transferable to other Arctic subregions. Our findings regarding the dominance of vertical heat flux can serve as valuable constraints or benchmarks for more advanced prediction systems, including machine learning and coupled forecast models.
4.2. The Influence of Synoptic Processes on the Timing of Minimum Sea Ice Area
Synoptic processes not only affect the magnitude of the minimum sea ice area but also influence the timing of when this minimum occurs (Tmin). As shown in Section 3.2, the DOO is closely related to the minimum sea ice area but shows no significant correlation with the Tmin. This discrepancy is likely due to transient easterly wind events occurring during the melt season. In this section, we quantified the frequency, intensity, and duration of weather events (easterly wind) during the melt season (May to Tmin) in the Beaufort Sea region (70°N–75°N, 125°W–150°W), based on daily averaged 10 m wind speed reanalysis data.
Easterly wind events were characterized using a three-step procedure: (1) Daily easterly wind speed values were averaged across the study domain during 1979–2020; (2) Daily climatological means and standard deviation (σ) were established; (3) Daily averaged zonal wind speeds for each year were compared to the corresponding climatological mean.
To quantify the frequency of easterly wind events, we counted the number of days when daily zonal wind speeds <0, ≤0σ (i.e., less than the mean), ≤−1σ, and ≤−2σ during May to Tmin. To assess the intensity, we analyzed the number of sustained events where daily zonal wind speeds < 0 for consecutive periods of 3 to 7 days. The occurrences of these events were documented over non-mutually exclusive 3–7 consecutive day windows (e.g., a 7d event was also counted as a 3, 4, 5, 6d event). Events longer than 8 days are rare in the reanalysis dataset and thus excluded, following Ballinger et al. [73].
The sea surface wind speeds are generally in the range of 0–4 m s−1, with spatially averaged values remaining below 4 m s−1 for most of the melt season and an overall mean of 1.5 m s−1 (Figure 10). The dominant wind direction is easterly to northeasterly, consistent with the westward export of sea ice from the Beaufort Sea as shown in Zhang et al. [10] and Wei et al. [53].
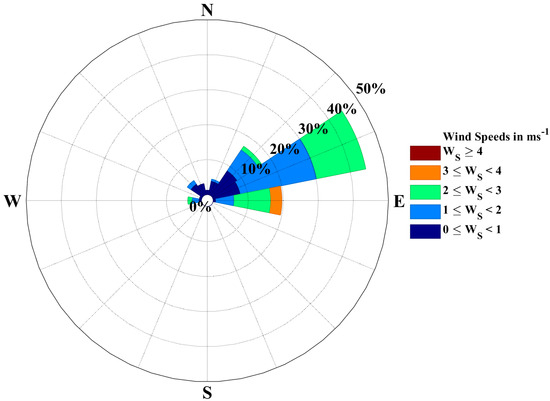
Figure 10.
Multi-year spatial average daily wind rose plot of the entire Beaufort Sea during the melt season from 1979 to 2020.
According to Figure 10, easterly winds dominate the region. Open water generally forms after mid-May, with the earliest onset observed around 18 May (Figure 4). Based on these results, we used the zonal wind component for further statistical analysis and summarized the frequency and intensity of easterly wind events during May–Tmin for the period 1979–2020 (Figure 11).
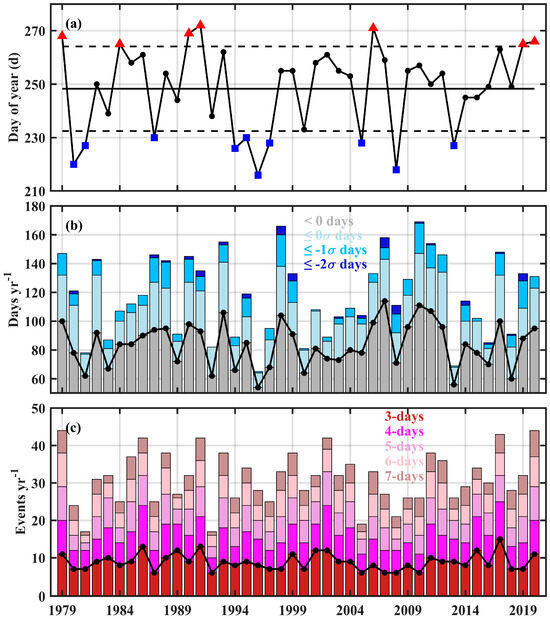
Figure 11.
(a) The day-of-year when the sea ice area of the Beaufort Sea reached its minimum from 1979 to 2020, red triangles represent the days greater than the average plus one standard deviation, blue squares represent the days less than the average minus one standard deviation, and black dots show the normal condition; (b) The number of days when the zonal wind speed <0, ≤0σ, ≤−1σ, and ≤–2σ in Beaufort Sea from May to Tmin; (c) The number of easterly wind events in the Beaufort Sea where the zonal wind < 0 for 3, 4, 5, 6, and 7 consecutive days during May–Tmin.
Figure 11a shows the day-of-year when the minimum sea ice area was reached. Correlation analysis shows that Tmin and easterly wind event frequency have a significant relationship with R = 0.66 (p < 0.01), indicating that more easterly wind event is likely to delay Tmin. Meanwhile, Tmin and 3d/4d/5d/6d event intensity have a strong correlation with R = 0.46/0.50/0.64/0.68/0.51 (p < 0.01), respectively. This implies consecutive easterly wind events lead to persistent sea ice export out of the Beaufort Sea, contributing to the later timing of minimum sea ice area. To facilitate analysis, we categorized the 42 years into three types:
C1 (minimum reached later), 7 years, represented by red triangles;
C2 (normal condition), 25 years, represented by black dots;
C3 (minimum reached earlier), 10 years, represented by blue squares.
Easterly wind event frequency statistics under each category are listed in Table 1. The average days of easterly wind event in types C1, C2, and C3 are 94, 86, and 71 days, respectively. While type C1 exhibits most easterly wind event days, type C3 shows least easterly wind event days across all thresholds except for ≤−2σ. Using Independent-Samples Test, we confirm that easterly wind event frequency of type-C3 are statistically significant differences from the other types.

Table 1.
The average frequency of easterly wind event under different types during May–Tmin (unit: days). Bold values indicate statistically significant differences from the other types values (p < 0.05), and * indicates the two groups are statistically significant differences.
Easterly wind event intensity statistics (Table 2) show that the number of events lasting more than 3 days is 10, 9, and 7 for types C1, C2, and C3, respectively. Similarly to the frequency results, the number of sustained abnormal weather events at all thresholds is higher in type C1 than in type C3. The independent-samples test reveals that easterly wind event intensity of type-C3 are statistically significant differences from the other types.

Table 2.
The average intensity of easterly wind event under different types during May–Tmin (unit: count). Bold values indicate statistically significant differences from the other types values (p < 0.05), and * indicates the two groups are statistically significant differences.
In summary, while thermodynamic processes are the dominant drivers of sea ice retreat in the Beaufort Sea, the timing of the minimum sea ice area is closely linked to the frequency and intensity of transient easterly wind events during the melt season. A higher frequency and intensity of easterly wind event tends to delay the occurrence of the sea ice minimum area.
5. Conclusions
In this study, we employed the coupled ocean–sea ice model to quantitatively assess the dynamic and thermodynamic contributions to sea ice retreat in the Beaufort Sea and identified that the vertical heat flux at the sea surface is a key controlling factor. Based on this, using satellite-derived daily sea ice concentration data and atmospheric reanalysis products (10 m wind and 2 m air temperature), we further evaluated the predictability of summer minimum sea ice area in the Beaufort Sea. The main conclusions are as follows:
Based on model results from 1994 to 2019, the dynamic and thermodynamic contributions to sea ice melt were analyzed. Annually, thermodynamic processes account for ~90%, while dynamic processes contribute only ~10%. During the melt season, contributions of the thermodynamic and dynamic processes are ~60% and ~40%, respectively. These indicate that thermodynamic processes are the dominant drivers of sea ice retreat in the Beaufort Sea. Annual heat flux analysis shows that vertical heat flux contributes ~85% of the total heat input, whereas lateral fluxes, including river runoff and Pacific Water inflow, contribute only ~15%, highlighting vertical heat flux as the primary heat source.
The timing of open water formation is the key factor controlling oceanic heat absorption. Correlation analysis between the DOO and the minimum sea ice area (SIAmin, in units of 105 km2) derived from satellite observation reveals a strong relationship, yielding the regression equation as follows: SIAmin = 0.0352 × DOO − 5.8201, with a coefficient of determination R2 = 0.77 (p < 0.01). Model results also present a robust relationship of SIAmin and DOO with R2 = 0.60 (p < 0.01), indicating the feasibility to predict SIAmin in the Beaufort Sea only using the easily accessible satellite data. A linear relationship between preceding winter accumulated temperature and easterly wind speed and the DOO is also established: DOO = 4.4946 × u − 0.0134 × AT + 48.2657, with R2 = 0.51 (p < 0.01). A further regression using these variables provides a regression equation for the summer minimum sea ice area: SIAmin = 0.0606 × u − 0.0005 × AT − 4.1432, with R2 = 0.42 (p < 0.01). As sea ice continues to thin, the coupling between dynamic and thermodynamic processes intensifies, and weather events can further amplify sea ice loss. To account for increased prediction uncertainty in the post-1998 period, May easterly wind speed (u5) was incorporated into the regression, yielding an improved fitted equation: SIAmin = 0.0625 × u + 0.1366 × u5 − 0.0002 × AT − 1.0696, with an improved fit (R2 = 0.49, p < 0.01).
In addition to influencing the magnitude of the minimum sea ice area, near-surface wind processes also impact the timing of when the minimum occurs. Although thermodynamic factors predominantly control sea ice decline, our analysis shows that the frequency and intensity of near-surface easterly wind anomalies during the melt season are significantly correlated with the date of the minimum sea ice area. Specifically, years with more frequent and intense near-surface easterly wind events tend to exhibit later occurrences of minimum sea ice area. However, the Beaufort Sea is undergoing rapid climate change [74] in a warming Arctic, with extreme weather events becoming increasingly frequent [75] and producing tremendous impacts on sea ice [76,77]. In addition, wave–ice interaction can significantly affect the large-scale dynamics and thermodynamics of sea ice, driving ice drift, and is a crucial process for climate models to accurately predict the future sea ice cover [78,79,80,81,82,83]. These changes may alter the relative contributions of thermodynamic and dynamic processes to sea ice variability, underscoring the need for further investigation on this topic. In addition to oceanic and atmospheric drivers, recent studies have shown that stratospheric processes, particularly ozone variability, can exert a significant influence on Arctic sea ice predictability [84,85]. While such processes are beyond the scope of the present study, their incorporation into coupled prediction systems represents an important direction for future research.
Author Contributions
H.N. and Z.Z. contributed equally to the work and share the first authorship. Conceptualization, H.N. and X.L.; Methodology, Z.Z. and S.W.; Software, Z.Z. and S.W.; Validation, H.N., Z.Z., S.W., W.Z. and X.L.; Formal analysis, Z.Z. and S.W.; Investigation, Z.Z.; Resources, W.Z.; data curation, W.Z.; Writing—original draft preparation, Z.Z. and S.W.; Writing—review and editing, H.N., Z.Z. and X.L.; Visualization, Z.Z.; Supervision, X.L.; Project administration, H.N. and X.L.; Funding acquisition, H.N. and X.L. All authors have read and agreed to the published version of the manuscript.
Funding
This research was funded by the National Natural Science Foundation of China (Grants 41941013, 42141020) and the National Key Research and Development Program of China (Grants 2023YFC2809105, 2023YFC3107702).
Data Availability Statement
The CDR ice concentration was obtained from the National Snow and Ice Data Centre of the USA National Oceanic and Atmospheric Administration (https://nsidc.org/data/G02202/versions/3, accessed on 1 August 2021). Wind speed at 10 m and air temperature at 2 m were obtained from the ERA5 product (https://cds.climate.copernicus.eu/datasets/reanalysis-era5-single-levels?tab=download, accessed on 2 December 2024). Model results used in this study can be directed to the corresponding author.
Acknowledgments
We are grateful to the NEMO development team for providing the state-of-the-art ocean modeling framework. We also greatly thank the NSIDC for the sea ice data and ECMWF for the atmospheric reanalysis data.
Conflicts of Interest
The authors declare no conflicts of interest.
Abbreviations
The following abbreviations are used in this manuscript:
| AT | Accumulated temperature |
| CDR | Climate Data Record |
| DOC | Day of Closing |
| DOO | Day of Opening |
| ECMWF | European Center for Medium-Range Weather Forecasts |
| ERA5 | ECMWF Reanalysis version 5 |
| NASA | National Aeronautics and Space Administration of United States |
| NEMO | Nucleus for European Modelling of the Ocean |
| NSIDC | National Snow and Ice Data center of USA |
| OIFP | Outer ice-free period |
| SIA | Sea ice area |
| SIAmin | Minimum sea ice area |
| SST | Sea surface temperature |
| Tmin | Timing of minimum sea ice area |
References
- Meier, W.; Stroeve, J. An Updated Assessment of the Changing Arctic Sea Ice Cover. Oceanography 2022, 24, 162–173. [Google Scholar] [CrossRef]
- Serreze, M.C.; Meier, W.N. The Arctic’s sea ice cover: Trends, variability, predictability, and comparisons to the Antarctic. Ann. N. Y. Acad. Sci. 2019, 1436, 36–53. [Google Scholar]
- Babb, D.G.; Galley, R.J.; Kirillov, S.; Landy, J.C.; Howell, S.E.L.; Stroeve, J.C.; Meier, W.; Ehn, J.K.; Barber, D.G. The Stepwise Reduction of Multiyear Sea Ice Area in the Arctic Ocean Since 1980. J. Geophys. Res. Ocean. 2023, 128, e2023JC020157. [Google Scholar] [CrossRef]
- Sumata, H.; de Steur, L.; Divine, D.V.; Granskog, M.A.; Gerland, S. Regime shift in Arctic Ocean sea ice thickness. Nature 2023, 615, 443–449. [Google Scholar] [CrossRef] [PubMed]
- Wang, Y.; Bi, H.; Huang, H.; Liu, Y.; Liu, Y.; Liang, X.; Fu, M.; Zhang, Z. Satellite-observed trends in the Arctic sea ice concentration for the period 1979–2016. J. Oceanol. Limnol. 2019, 37, 18–37. [Google Scholar] [CrossRef]
- Crépin, A.; Karcher, M.; Gascard, J. Arctic Climate Change, Economy and Society (ACCESS): Integrated perspectives. Ambio 2017, 46, 341–354. [Google Scholar]
- Ardyna, M.; Arrigo, K.R. Phytoplankton dynamics in a changing Arctic Ocean. Nat. Clim. Change 2020, 10, 892–903. [Google Scholar] [CrossRef]
- Barber, D.G.; Hop, H.; Mundy, C.J.; Else, B.; Dmitrenko, I.A.; Tremblay, J.; Ehn, J.K.; Assmy, P.; Daase, M.; Candlish, L.M.; et al. Selected physical, biological and biogeochemical implications of a rapidly changing Arctic Marginal Ice Zone. Prog. Oceanogr. 2015, 139, 122–150. [Google Scholar] [CrossRef]
- Frey, K.E.; Moore, G.W.K.; Cooper, L.W.; Grebmeier, J.M. Divergent patterns of recent sea ice cover across the Bering, Chukchi, and Beaufort seas of the Pacific Arctic Region. Prog. Oceanogr. 2015, 136, 32–49. [Google Scholar] [CrossRef]
- Zhang, Y.; Wei, H.; Lu, Y.; Luo, X.; Hu, X.; Zhao, W. Dependence of Beaufort Sea Low Ice Condition in the Summer of 1998 on Ice Export in the Prior Winter. J. Clim. 2020, 33, 9247–9259. [Google Scholar] [CrossRef]
- Galley, R.J.; Else, B.G.T.; Prinsenberg, S.J.; Babb, D.; Barber, D.G. Summer Sea Ice Concentration, Motion, and Thickness Near Areas of Proposed Offshore Oil and Gas Development in the Canadian Beaufort Sea—2009. Arctic 2013, 66, 105–116. [Google Scholar]
- Cook, A.J.; Dawson, J.; Howell, S.E.L.; Holloway, J.E.; Brady, M. Sea ice choke points reduce the length of the shipping season in the Northwest Passage. Commun. Earth Environ. 2024, 5, 311–362. [Google Scholar] [CrossRef]
- Ma, L.; Fan, J.; Mou, X.; Qian, S.; Xu, J.; Cao, L.; Xu, B.; Yao, B.; Li, X.; Li, Y. Research on Operational Risk for Northwest Passage Cruise Ships Using POLARIS. J. Mar. Sci. Eng. 2025, 13, 1335. [Google Scholar] [CrossRef]
- Fossheim, M.; Primicerio, R.; Johannesen, E.; Ingvaldsen, R.B.; Aschan, M.M.; Dolgov, A.V. Recent warming leads to a rapid borealization of fish communities in the Arctic. Nat. Clim. Change 2015, 5, 673–677. [Google Scholar] [CrossRef]
- Varpe, Ø.; Daase, M.; Kristiansen, T. A fish-eye view on the new Arctic lightscape. ICES J. Mar. Sci. 2015, 72, 2532–2538. [Google Scholar] [CrossRef]
- Steele, M.; Dickinson, S.; Zhang, J.; Lindsay, R.W. Seasonal ice loss in the Beaufort Sea: Toward synchrony and prediction. J. Geophys. Res. Ocean. 2015, 120, 1118–1132. [Google Scholar]
- Babb, D.G.; Landy, J.C.; Barber, D.G.; Galley, R.J. Winter Sea Ice Export from the Beaufort Sea as a Preconditioning Mechanism for Enhanced Summer Melt: A Case Study of 2016. J. Geophys. Res. Ocean. 2019, 124, 6575–6600. [Google Scholar]
- Bailey, E.; Timmermans, M.L. Investigating the Relative Roles of Dynamics and Thermodynamics in Sea-Ice Volume Changes in the Canada Basin. J. Geophys. Res. Ocean. 2025, 130, e2024JC022075. [Google Scholar] [CrossRef]
- Lukovich, J.V.; Stroeve, J.C.; Crawford, A.; Hamilton, L.; Tsamados, M.; Heorton, H.; Massonnet, F. Summer Extreme Cyclone Impacts on Arctic Sea Ice. J. Clim. 2021, 34, 4817–4834. [Google Scholar] [CrossRef]
- Wang, Z.; Walsh, J.; Szymborski, S.; Peng, M. Rapid Arctic Sea Ice Loss on the Synoptic Time Scale and Related Atmospheric Circulation Anomalies. J. Clim. 2020, 33, 1597–1617. [Google Scholar] [CrossRef]
- Simmonds, I.; Burke, C.; Keay, K. Arctic Climate Change as Manifest in Cyclone Behavior. J. Clim. 2008, 21, 5777–5796. [Google Scholar] [CrossRef]
- Serreze, M.C.; Barrett, A.P. The Summer Cyclone Maximum over the Central Arctic Ocean. J. Clim. 2008, 21, 1048–1065. [Google Scholar] [CrossRef]
- Serreze, M.C.; Maslanik, J.A.; Scambos, T.A.; Fetterer, F.; Stroeve, J.; Knowles, K.; Fowler, C.; Drobot, S.; Barry, R.G.; Haran, T.M. A record minimum arctic sea ice extent and area in 2002. Geophys. Res. Lett. 2003, 30, 1110. [Google Scholar] [CrossRef]
- Meier, W.N.; Fetterer, F.; Windnagel, A.K.; Stewart, J.S. NOAA/NSIDC Climate Data Record of Passive Microwave Sea Ice Concentration; (G02202, Version 4). [Data Set]; National Snow and Ice Data Center: Boulder, CO, USA, 2021. [Google Scholar]
- Cavalieri, D.J.; Gloersen, P.; Campbell, W.J. Determination of sea ice parameters with the NIMBUS 7 SMMR. J. Geophys. Res. Atmos. 1984, 89, 5355–5369. [Google Scholar] [CrossRef]
- Comiso, J.C. Characteristics of Arctic winter sea ice from satellite multispectral microwave observations. J. Geophys. Res. Ocean. 1986, 91, 975–994. [Google Scholar] [CrossRef]
- Cavalieri, D.J.; Parkinson, C.L.; Gloersen, P.; Zwally, H.J. Sea Ice Concentrations from Nimbus-7 SMMR and DMSP SSM/I-SSMIS Passive Microwave Data; (NSIDC-0051, Version 1). [Data Set]; NASA National Snow and Ice Data Center Distributed Active Archive Center: Boulder, CO, USA, 1996. [Google Scholar]
- Comiso, J.C.; Nishio, F. Trends in the sea ice cover using enhanced and compatible AMSR-E, SSM/I, and SMMR data. J. Geophys. Res. Ocean. 2008, 113, C02S07. [Google Scholar] [CrossRef]
- Ogi, M.; Rigor, I.G.; McPhee, M.G.; Wallace, J.M. Summer retreat of Arctic sea ice: Role of summer winds. Geophys. Res. Lett. 2008, 35, L24701. [Google Scholar] [CrossRef]
- Hersbach, H.; Bell, B.; Berrisford, P.; Biavati, G.; Horányi, A.; Muñoz Sabater, J.; Nicolas, J.; Peubey, C.; Radu, R.; Rozum, I.; et al. ERA5 monthly averaged data on single levels from 1940 to present. Copernic. Clim. Change Serv. (C3S) Clim. Data Store (CDS) 2023, 10. [Google Scholar] [CrossRef]
- Hallett, S.H.; Jones, R.J.A. Compilation of an accumulated temperature database for use in an environmental information system. Agric. For. Meteorol. 1993, 63, 21–34. [Google Scholar] [CrossRef]
- Madec, G.; the NEMO Team. NEMO Ocean Engine; Notes du Pôle de Modélisation, Institut Pierre-Simon Laplace (IPSL): Paris, France, 2016; Volume 27, p. 386. [Google Scholar]
- Rousset, C.; Vancoppenolle, M.; Madec, G.; Fichefet, T.; Flavoni, S.; Barthélemy, A.; Benshila, R.; Chanut, J.; Levy, C.; Masson, S.; et al. The Louvain-La-Neuve sea ice model LIM3.6: Global and regional capabilities. Geosci. Model Dev. 2015, 8, 2991–3005. [Google Scholar] [CrossRef]
- Vancoppenolle, M.; Fichefet, T.; Goosse, H.; Bouillon, S.; Madec, G.; Maqueda, M.A.M. Simulating the mass balance and salinity of Arctic and Antarctic sea ice. 1. Model description and validation. Ocean Model. 2009, 27, 33–53. [Google Scholar] [CrossRef]
- Madec, G.; Imbard, M. A global ocean mesh to overcome the North Pole singularity. Clim. Dyn. 1996, 12, 381–388. [Google Scholar] [CrossRef]
- Luo, X.; Hu, X.; Nie, H.; Zhao, W.; Zhang, Y.; Wang, Y.; Qin, Y.; Dong, C.; Lu, Y.; Wei, H. Evaluation of hindcast simulation with the ocean and sea-ice model covering the Arctic and adjacent oceans. Hangyang Xuebao 2019, 41, 1–13. (In Chinese) [Google Scholar]
- Dong, C.; Luo, X.; Nie, H.; Zhao, W.; Wei, H. Effect of compressive strength on the performance of the NEMO-LIM model in Arctic Sea ice simulation. J. Oceanol. Limnol. 2023, 41, 1–16. [Google Scholar] [CrossRef]
- Rigor, I.G.; Wallace, J.M.; Colony, R.L. Response of Sea Ice to the Arctic Oscillation. J. Clim. 2002, 15, 2648–2663. [Google Scholar] [CrossRef]
- Hu, X.; Sun, J.; Chan, T.O.; Myers, P.G. Thermodynamic and dynamic ice thickness contributions in the Canadian Arctic Archipelago in NEMO-LIM2 numerical simulations. Cryosphere 2018, 12, 1233–1247. [Google Scholar] [CrossRef]
- Lindsay, R.W.; Zhang, J. The Thinning of Arctic Sea Ice, 1988–2003: Have We Passed a Tipping Point? J. Clim. 2005, 18, 4879–4894. [Google Scholar] [CrossRef]
- Yang, Y.; Nie, H.; Zhang, Y.; Luo, X.; Wei, H.; Zhao, W. Interannual Variability in the Onset Time Distribution of the Open Water in the Kara Sea. J. Clim. 2024, 37, 1367–1381. [Google Scholar] [CrossRef]
- Woodgate, R.A. Increases in the Pacific inflow to the Arctic from 1990 to 2015, and insights into seasonal trends and driving mechanisms from year-round Bering Strait mooring data. Prog. Oceanogr. 2018, 160, 124–154. [Google Scholar] [CrossRef]
- Wang, Y.; Holt, B.; Erick Rogers, W.; Thomson, J.; Shen, H.H. Wind and wave influences on sea ice floe size and leads in the Beaufort and Chukchi Seas during the summer-fall transition 2014. J. Geophys. Res. Ocean. 2016, 121, 1502–1525. [Google Scholar] [CrossRef]
- Perovich, D.K.; Richter-Menge, J.A.; Jones, K.F.; Light, B. Sunlight, water, and ice: Extreme Arctic sea ice melt during the summer of 2007. Geophys. Res. Lett. 2008, 35, L11501. [Google Scholar] [CrossRef]
- Nikolopoulos, A.; Pickart, R.S.; Fratantoni, P.S.; Shimada, K.; Torres, D.J.; Jones, E.P. The western Arctic boundary current at 152°W: Structure, variability, and transport. Deep. Sea Res. Part II Top. Stud. Oceanogr. 2009, 56, 1164–1181. [Google Scholar]
- Nghiem, S.V.; Hall, D.K.; Rigor, I.G.; Li, P.; Neumann, G. Effects of Mackenzie River discharge and bathymetry on sea ice in the Beaufort Sea. Geophys. Res. Lett. 2014, 41, 873–879. [Google Scholar] [CrossRef]
- Lin, P.; Pickart, R.S.; Fissel, D.B.; Borg, K.; Melling, H.; Wiese, F.K. On the nature of wind-forced upwelling and downwelling in Mackenzie Canyon, Beaufort Sea. Prog. Oceanogr. 2021, 198, 102674. [Google Scholar] [CrossRef]
- Zhao, J.; Zhu, D.; Shi, J. Seasonal Variations in Sea Ice and Its Main Driving Factors in the Chukchi Sea. Adv. Mar. Sci. 2003, 21, 123–131. [Google Scholar]
- Steele, M.; Bliss, A.C.; Peng, G.; Meier, W.N.; Dickinson, S. Arctic Sea Ice Seasonal Change and Melt/Freeze Climate Indicators from Satellite Data; (NSIDC-0747, Version 1). [Data Set]; NASA National Snow and Ice Data Center Distributed Active Archive Center: Boulder, CO, USA, 2019. [Google Scholar]
- Babb, D.G.; Galley, R.J.; Barber, D.G.; Rysgaard, S. Physical processes contributing to an ice free Beaufort Sea during September 2012. J. Geophys. Res. Ocean. 2016, 121, 267–283. [Google Scholar] [CrossRef]
- Maslanik, J.A.; Serreze, M.C.; Agnew, T. On the record reduction in 1998 western Arctic Sea-ice cover. Geophys. Res. Lett. 1999, 26, 1905–1908. [Google Scholar] [CrossRef]
- Perovich, D.K.; Richter-Menge, J.A.; Jones, K.F.; Light, B.; Elder, B.C.; Polashenski, C.; Laroche, D.; Markus, T.; Lindsay, R. Arctic sea-ice melt in 2008 and the role of solar heating. Ann. Glaciol. 2011, 52, 355–359. [Google Scholar] [CrossRef]
- Wei, S.; Zhang, Y.; Nie, H.; Wei, H. Cause of Beaufort Sea low ice condition in the summer of 2019. Haiyang Xuebao 2022, 44, 92–101. (In Chinese) [Google Scholar]
- Dong, C.; Nie, H.; Luo, X.; Wei, H.; Zhao, W. Mechanisms for the link between onset and duration of open water in the Kara Sea. Acta Oceanol. Sin. 2021, 40, 119–128. [Google Scholar] [CrossRef]
- Gu, W.; Shi, P.; Liu, Y.; Xie, F.; Cai, X. The characteristics of temporal and spatial distribution of negative accumulated temperature in Bohai Sea and north Yellow Sea. J. Nat. Resour. 2002, 17, 168–173. [Google Scholar]
- Galley, R.J.; Babb, D.; Ogi, M.; Else, B.G.T.; Geilfus, N.X.; Crabeck, O.; Barber, D.G.; Rysgaard, S. Replacement of multiyear sea ice and changes in the open water season duration in the Beaufort Sea since 2004. J. Geophys. Res. Ocean. 2016, 121, 1806–1823. [Google Scholar] [CrossRef]
- Galley, R.J.; Key, E.; Barber, D.G.; Hwang, B.J.; Ehn, J.K. Spatial and temporal variability of sea ice in the southern Beaufort Sea and Amundsen Gulf: 1980–2004. J. Geophys. Res. Ocean. 2008, 113, 2007JC004553. [Google Scholar] [CrossRef]
- Hutchings, J.K.; Rigor, I.G. Role of ice dynamics in anomalous ice conditions in the Beaufort Sea during 2006 and 2007. J. Geophys. Res. Ocean. 2012, 117, 2011JC007182. [Google Scholar] [CrossRef]
- Keller, M.R.; Piatko, C.; Clemens-Sewall, M.V.; Eager, R.; Foster, K.; Gifford, C.; Rollend, D.; Sleeman, J. Short-Term (7 Day) Beaufort Sea Ice Extent Forecasting with Deep Learning. Artif. Intell. Earth Syst. 2023, 2, e220070. [Google Scholar] [CrossRef]
- Kim, Y.J.; Kim, H.; Han, D.; Lee, S.; Im, J. Prediction of monthly Arctic sea ice concentrations using satellite and reanalysis data based on convolutional neural networks. Cryosphere 2020, 14, 1083–1104. [Google Scholar] [CrossRef]
- Chen, S.; Li, K.; Fu, H.; Wu, Y.C.; Huang, Y. Sea Ice Extent Prediction with Machine Learning Methods and Subregional Analysis in the Arctic. Atmosphere 2023, 14, 1023. [Google Scholar] [CrossRef]
- Andersson, T.R.; Hosking, J.S.; Pérez-Ortiz, M.; Paige, B.; Elliott, A.; Russell, C.; Law, S.; Jones, D.C.; Wilkinson, J.; Phillips, T.; et al. Seasonal Arctic sea ice forecasting with probabilistic deep learning. Nat. Commun. 2021, 12, 5124. [Google Scholar] [CrossRef]
- Ren, Y.; Li, X. Predicting the Daily Sea Ice Concentration on a Subseasonal Scale of the Pan-Arctic During the Melting Season by a Deep Learning Model. IEEE Trans. Geosci. Remote Sens. 2023, 61, 1–15. [Google Scholar] [CrossRef]
- Blanchard-Wrigglesworth, E.; Barthélemy, A.; Chevallier, M.; Cullather, R.; Fučkar, N.; Massonnet, F.; Posey, P.; Wang, W.; Zhang, J.; Ardilouze, C.; et al. Multi-model seasonal forecast of Arctic sea-ice: Forecast uncertainty at pan-Arctic and regional scales. Clim. Dyn. 2017, 49, 1399–1410. [Google Scholar] [CrossRef]
- Bushuk, M.; Msadek, R.; Winton, M.; Vecchi, G.A.; Gudgel, R.; Rosati, A.; Yang, X. Skillful regional prediction of Arctic sea ice on seasonal timescales. Geophys. Res. Lett. 2017, 44, 4953–4964. [Google Scholar] [CrossRef]
- Cheng, S.; Chen, Y.; Aydoğdu, A.; Bertino, L.; Carrassi, A.; Rampal, P.; Jones, C.K.R.T. Arctic sea ice data assimilation combining an ensemble Kalman filter with a novel Lagrangian sea ice model for the winter 2019–2020. Cryosphere 2023, 17, 1735–1754. [Google Scholar] [CrossRef]
- Collow, T.W.; Wang, W.; Kumar, A.; Zhang, J. Improving Arctic Sea Ice Prediction Using PIOMAS Initial Sea Ice Thickness in a Coupled Ocean–Atmosphere Model. Mon. Weather Rev. 2015, 143, 4618–4630. [Google Scholar] [CrossRef]
- Yang, Q.; Mu, L.; Wu, X.; Liu, J.; Zheng, F.; Zhang, J.; Li, C. Improving Arctic sea ice seasonal outlook by ensemble prediction using an ice-ocean model. Atmos. Res. 2019, 227, 14–23. [Google Scholar]
- Yaremchuk, M.; Townsend, T.; Panteleev, G.; Hebert, D.; Allard, R. Advancing Short-Term Forecasts of Ice Conditions in the Beaufort Sea. J. Geophys. Res. Ocean. 2019, 124, 807–820. [Google Scholar]
- Lee, G.; Woo, S.; Baek, E.; Kim, J.; Kim, B.; Jeong, J. Statistical seasonal prediction of Arctic sea ice concentration based on spatiotemporal anomaly persistent method. Environ. Res. Lett. 2024, 19, 114060. [Google Scholar] [CrossRef]
- Wang, Y.; Yuan, X.; Bi, H.; Bushuk, M.; Liang, Y.; Li, C.; Huang, H. Reassessing seasonal sea ice predictability of the Pacific-Arctic sector using a Markov model. Cryosphere 2022, 16, 1141–1156. [Google Scholar] [CrossRef]
- Yuan, X.; Chen, D.; Li, C.; Wang, L.; Wang, W. Arctic Sea Ice Seasonal Prediction by a Linear Markov Model. J. Clim. 2016, 29, 8151–8173. [Google Scholar] [CrossRef]
- Ballinger, T.J.; Walsh, J.E.; Bhatt, U.S.; Bieniek, P.A.; Tschudi, M.A.; Brettschneider, B.; Eicken, H.; Mahoney, A.R.; Richter Menge, J.; Shapiro, L.H. Unusual West Arctic Storm Activity During Winter 2020: Another Collapse of the Beaufort High? Geophys. Res. Lett. 2021, 48, e2021GL092518. [Google Scholar] [CrossRef]
- Ye, D.; Li, J.; Huang, F.; Sun, R.; Tang, X.; Li, R. Influence of the preceding August-September-October tropical cyclones over the Western North Pacific on the following spring sea ice in the Beaufort Sea: The bridging role of El Niño. Clim. Dyn. 2024, 62, 6253–6272. [Google Scholar]
- Peng, L.; Zhang, X.; Kim, J.H.; Cho, K.H.; Kim, B.M.; Wang, Z.; Tang, H. Role of Intense Arctic Storm in Accelerating Summer Sea Ice Melt: An In Situ Observational Study. Geophys. Res. Lett. 2021, 48, e2021GL092714. [Google Scholar] [CrossRef]
- Chang, X.; Yan, T.; Zuo, G.; Ji, Q.; Xue, M. Changes in Beaufort High and Their Impact on Sea Ice Motion in the Western Arctic during the Winters of 2001–2020s. J. Mar. Sci. Eng. 2024, 12, 165. [Google Scholar] [CrossRef]
- Rheinlænder, J.W.; Regan, H.; Rampal, P.; Boutin, G.; Ólason, E.; Davy, R. Breaking the Ice: Exploring the Changing Dynamics of Winter Breakup Events in the Beaufort Sea. J. Geophys. Res. Ocean. 2024, 129, e2023JC020395. [Google Scholar]
- Ardhuin, F.; Otero, M.; Merrifield, S.; Grouazel, A.; Terrill, E. Ice Breakup Controls Dissipation of Wind Waves Across Southern Ocean Sea Ice. Geophys. Res. Lett. 2020, 47, e2020GL087699. [Google Scholar] [CrossRef]
- Li, J.; Babanin, A.V.; Liu, Q.; Voermans, J.J.; Heil, P.; Tang, Y. Effects of Wave-Induced Sea Ice Break-Up and Mixing in a High-Resolution Coupled Ice-Ocean Model. J. Mar. Sci. Eng. 2021, 9, 365. [Google Scholar] [CrossRef]
- Li, S.; Babanin, A.; Liu, Q.; Liu, J.; Li, R.; Voermans, J. Effect of ocean surface waves on sea ice using coupled wave–ice–ocean modelling. Ocean Model 2025, 196, 102540. [Google Scholar] [CrossRef]
- Montiel, F.; Squire, V.A. Modelling wave-induced sea ice break-up in the marginal ice zone. Proc. R. Soc. A Math. Phys. Eng. Sci. 2017, 473, 20170258. [Google Scholar] [CrossRef]
- Voermans, J.J.; Rabault, J.; Filchuk, K.; Ryzhov, I.; Heil, P.; Marchenko, A.; Collins III, C.O.; Dabboor, M.; Sutherland, G.; Babanin, A.V. Experimental evidence for a universal threshold characterizing wave-induced sea ice break-up. Cryosphere 2020, 14, 4265–4278. [Google Scholar] [CrossRef]
- Yang, C.; Liu, J.; Chen, D. Understanding the influence of ocean waves on Arctic sea ice simulation: A modeling study with an atmosphere–ocean–wave–sea ice coupled model. Cryosphere 2024, 18, 1215–1239. [Google Scholar] [CrossRef]
- Stone, K.A.; Solomon, S.; Kinnison, D.E. Prediction of Northern Hemisphere Regional Sea Ice Extent and Snow Depth Using Stratospheric Ozone Information. J. Geophys. Res. Atmos. 2020, 125, e2019JD031770. [Google Scholar] [CrossRef]
- Zhang, J.; Tian, W.; Pyle, J.A.; Keeble, J.; Abraham, N.L.; Chipperfield, M.P.; Xie, F.; Yang, Q.; Mu, L.; Ren, H.; et al. Responses of Arctic sea ice to stratospheric ozone depletion. Sci. Bull. 2022, 67, 1182–1190. [Google Scholar] [CrossRef]
Disclaimer/Publisher’s Note: The statements, opinions and data contained in all publications are solely those of the individual author(s) and contributor(s) and not of MDPI and/or the editor(s). MDPI and/or the editor(s) disclaim responsibility for any injury to people or property resulting from any ideas, methods, instructions or products referred to in the content. |
© 2025 by the authors. Licensee MDPI, Basel, Switzerland. This article is an open access article distributed under the terms and conditions of the Creative Commons Attribution (CC BY) license (https://creativecommons.org/licenses/by/4.0/).