Article

Radiometric Cross-Calibration and Validation of KOMPSAT-3/AEISS Using Sentinel-2A/MSI

1
Department of Earth, Environmental & Space Sciences, Chungnam National University, Daejeon 34134, Republic of Korea
2
Satellite Ground Station R&D Division, Korea Aerospace Research Institute, Daejeon 34133, Republic of Korea
3
Air Quality Research Division, Climate and Air Quality Research Department, National Institute of Environmental Research, Incheon 22689, Republic of Korea
4
Department of Public Policy, Graduate School, Chungnam National University, Daejeon 34134, Republic of Korea
*
Author to whom correspondence should be addressed.
Remote Sens. 2025, 17(19), 3280; https://doi.org/10.3390/rs17193280
Submission received: 28 June 2025 / Revised: 9 September 2025 / Accepted: 10 September 2025 / Published: 24 September 2025

Abstract

Highlights

What are the main findings?
  • Cross-calibration with Sentinel-2A/MSI, applying SBAF and BRDF corrections, yielded gains of 0.0196 (Blue), 0.0237 (Green), 0.0214 (Red), and 0.0136 (NIR), consistent with prior KOMPSAT-3 studies.
  • Five vicarious calibration campaigns at the KARI site produced gains of 0.0217 (Blue), 0.0299 (Green), 0.0221 (Red), and 0.0155 (NIR), demonstrating consistency with earlier studies.
What is the implication of the main finding?
  • Both cross and vicarious calibration confirm that KOMPSAT-3/AEISS has maintained stable radiometric coefficients over more than a decade of operation.
  • These traditional calibration results suggest the potential to extend toward emerging methodologies based on machine learning and deep learning.

Abstract

The successful launch of Korea Multipurpose Satellite-3/Advanced Earth Imaging Sensor System (KOMPSAT-3/AEISS) on 18 May 2012 allowed the Republic of Korea to meet the growing demand for high-resolution satellite imagery. However, like all satellite sensors, KOMPSAT-3/AEISS experienced temporal changes post-launch and thus requires ongoing evaluation and calibration. Although more than a decade has passed since launch, the KOMPSAT-3/AEISS mission and its multi-year data archive remain widely used. This study focused on the cross-calibration of KOMPSAT-3/AEISS with Sentinel-2A/Multispectral Instrument (MSI) by comparing the radiometric responses of the two satellite sensors under similar observation conditions, leveraging the linear relationship between Digital Numbers (DN) and top-of-atmosphere (TOA) radiance. Cross-calibration was performed using near-simultaneous satellite images of the same region, and the Spectral Band Adjustment Factor (SBAF) was calculated and applied to account for differences in spectral response functions (SRF). Additionally, Bidirectional Reflectance Distribution Function (BRDF) correction was applied using MODIS-based kernel models to minimize angular reflectance effects caused by differences in viewing and illumination geometry. This study aims to evaluate the radiometric consistency of KOMPSAT-3/AEISS relative to Sentinel-2A/MSI over Baotou scenes acquired in 2022–2023, derive band-specific calibration coefficients and compare them with prior results, and conduct a side-by-side comparison of cross-calibration and vicarious calibration. Furthermore, the cross-calibration yielded band-specific gains of 0.0196 (Blue), 0.0237 (Green), 0.0214 (Red), and 0.0136 (NIR). These findings offer valuable implications for Earth observation, environmental monitoring, and the planning and execution of future satellite missions.

Graphical Abstract

1. Introduction

Radiometric calibration is essential in satellite remote sensing, as it ensures that measurements from onboard sensors accurately represent physical surface reflectance [1]. To maintain and evaluate radiometric performance, two complementary calibration methods are widely employed: cross-calibration and vicarious calibration [2,3,4,5]. These methods are particularly important for long-term missions, where post-launch factors such as sensor degradation or radiometric drift can significantly compromise data quality and sensor usability [6].
Cross-calibration adjusts the radiometric scale of a sensor using near-simultaneous observations from a well-characterized reference sensor. This approach enables radiometric consistency across different platforms and is especially valuable when the target sensor lacks an onboard calibration system [7,8,9,10,11]. Chander et al. [7] found <4% discrepancies in SWIR bands when calibrating Landsat-7 ETM + against EO-1 ALI. Li et al. [9] showed ±3% agreement between Sentinel-2A/MSI and Landsat-8/OLI, while Dong et al. [11] improved Gaofen WFV calibration by ~37% through bidirectional reflectance distribution function (BRDF) correction. BRDF modeling is particularly important for accurately simulating directional surface reflectance under various observation and illumination geometries. Li et al. [12] proposed a geometric-optical BRDF model that incorporates crown shape and mutual shadowing, effectively characterizing surface anisotropy in forest canopies. Their work laid the foundation for many kernel-driven BRDF models used in cross-calibration.
Vicarious calibration, on the other hand, uses well-characterized ground targets to validate and adjust satellite measurements [13,14,15,16,17,18]. Prominent calibration sites include pseudo-invariant calibration sites (PICS) and natural desert regions such as Railroad Valley Playa, Gobabeb, and Baotou, which are part of the Radiometric Calibration Network (RadCalNet). RadCalNet provides globally standardized, automated surface reflectance and atmospheric correction data [19,20,21]. Baotou is known for its stable high-reflectance surface, minimal BRDF effects, and cloud-free conditions, making it ideal for cross-sensor calibration. Recent evaluations of MODIS BRDF products (e.g., MCD43A1) have confirmed that accurate kernel-based modeling can significantly reduce directional reflectance errors and temporal noise in time series, as demonstrated by Che et al. [22]. Moreover, Spurr [23] advanced the theoretical framework for BRDF parameter retrieval by integrating analytic radiative transfer (LIDORT) and Jacobian-based weighting functions, enabling direct estimation of surface properties without separate atmospheric correction. These developments have collectively enhanced the precision of cross-calibration workflows that rely on accurate surface reflectance modeling.
In South Korea, the Korea Aerospace Research Institute (KARI) has also been used as a field calibration site. Although it is not part of RadCalNet, it allows efficient in situ reflectance measurement using artificial reference tarps, enabling flexible vicarious calibration campaigns. The KOMPSAT-3/AEISS sensor, launched in 2012, supports a wide range of Earth observation missions including land-use monitoring, environmental assessment, and disaster response. However, its long-term radiometric performance must be periodically verified. Previous studies, including those by Yeom et al. [13] Ahn et al. [14], and Jin et al. [24], have applied vicarious calibration, SBAF corrections, and cross-comparisons with Landsat-8 to assess KOMPSAT-3’s stability.
This study evaluates the radiometric consistency of KOMPSAT-3/AEISS relative to Sentinel-2A/MSI over Baotou scenes acquired in 2022–2023, derives band-specific calibration coefficients, compares them with prior results, and provides a side-by-side comparison of cross-calibration and vicarious calibration. To this end, we employed widely used techniques, including spatial-resolution harmonization (downscaling) and application of the Spectral Band Adjustment Factor (SBAF) [8,25,26]. In particular, SBAF was applied to harmonize inter-sensor spectral response function (SRF) differences and to ensure accurate cross-calibration between KOMPSAT-3/AEISS and Sentinel-2A/MSI over the artificial target at the RadCalNet Baotou site. While these traditional methods help maintain radiometric consistency and data interoperability, they have inherent limitations when addressing sensor degradation and temporal drift. To mitigate these issues and enhance calibration accuracy, we further integrated cross-calibration with Sentinel-2A/MSI, a well-calibrated reference, using measurements from the RadCalNet Baotou site, a key location that provides automated surface-reflectance and atmospheric-correction data [16,17,18]. By leveraging RadCalNet resources at Baotou together with SBAF-based spectral harmonization, the proposed framework refines the cross-calibration of KOMPSAT-3/AEISS, improving radiometric reliability and strengthening interoperability with international satellite missions.
Ultimately, this work aims to provide a robust basis for the continued operational use of KOMPSAT-3/AEISS in diverse applications such as environmental monitoring, land-use classification, and disaster response. It also highlights the increasing importance of global calibration networks like RadCalNet in addressing modern calibration challenges, including sensor degradation and spectral response mismatches.

2. Materials and Methods

2.1. Satellite

The KOMPSAT-3/AEISS satellite, developed by KARI and launched on 18 May 2012, has been operational for over a decade, providing high-resolution Earth observation data for a variety of applications including disaster management, land monitoring, environmental studies, and meteorology [19,20,21]. KOMPSAT-3/AEISS operates in a sun-synchronous, near-circular orbit at 685 km altitude, with an inclination of 98.13° and a local time of ascending node (LTAN) of 13:30. At nadir, the sensor provides a 15 km swath, enabling coverage of extensive areas in a single pass. The multispectral (MS) bands of KOMPSAT-3/AEISS (Blue, Green, Red, NIR) have a GSD of 2.8 m, supporting detailed land-cover mapping, vegetation assessment, and environmental monitoring [27]. These bands are commonly used for various applications including atmospheric correction, surface classification, and vegetation analysis. However, in this study, they are used solely for radiometric cross-calibration and TOA radiance-based comparisons.
The four MS bands of KOMPSAT-3/AEISS cover the spectral range from 450 to 900 nm and are particularly valuable for various remote sensing applications. These bands facilitate a wide range of analyses such as land classification, vegetation health assessments, and environmental monitoring. The signal-to-noise ratio (SNR) of the sensor exceeds 100 for the MS bands, ensuring the high-quality, noise-free data that are essential for precise calibration and cross-calibration with other satellite systems. Details of the characteristics of KOMPSAT-3/AEISS, including its spectral bands and SNR values, are listed in Table 1.
The KOMPSAT-3/AEISS does not have an onboard calibration system, which is a notable distinction in its operational framework. As a result, the conversion of Digital Numbers (DN) to Top-of-Atmosphere (TOA) radiance for KOMPSAT-3/AEISS relies on alternative calibration methods. Specifically, this involves either absolute radiometric calibration through field measurements or cross-calibration techniques using a reference sensor. These approaches are essential to maintain the radiometric accuracy and reliability of KOMPSAT-3/AEISS data in the absence of an onboard calibration mechanism.
Similarly, the Sentinel-2A/MSI mission, which was launched by the European Space Agency (ESA) on 23 June 2015 and includes a MSI sensor, provides Earth observation imagery covering a wide range of applications in environmental monitoring, agriculture, forestry, and disaster response [28,29,30,31,32]. Sentinel-2A/MSI operates at an orbital altitude of 786 km and offers a significantly wider swath (290 km) than KOMPSAT-3/AEISS, allowing for broader coverage in a single pass. The GSD of 10 m for the MS bands, while coarser than that of KOMPSAT-3/AEISS, provides sufficient resolution for large-scale monitoring tasks such as land use classification and vegetation mapping.
The Sentinel-2A/MSI is a well-established sensor known for its high levels of onboard calibration and optical stability. It has been widely utilized as a reference sensor in international research and cross-calibration studies. The MSI undergoes regular calibration by the European Space Agency (ESA) using various PICS (Pseudo-Invariant Calibration Sites) and RadCalNet to ensure reliable data quality for comparisons with KOMPSAT-3/AEISS. Additionally, Sentinel-2A/MSI provides standardized data through international calibration networks like RadCalNet. These globally standardized datasets enable results to be interpreted within a broader international context when compared to KOMPSAT-3/AEISS.
The Sentinel-2A/MSI sensor covers 13 spectral bands spanning wavelengths from 0.4 μm to 2.2 μm, with four MS bands (Blue, Green, Red, NIR) falling within similar spectral regions as those of KOMPSAT-3/AEISS. These bands are crucial for various remote-sensing applications, particularly for assessing vegetation health, mapping land cover, and monitoring surface changes. The SNR for the Sentinel-2A/MSI bands is also high, with values of 154 for blue, 168 for green, 142 for red, and 174 for NIR, indicating strong signal quality and ensuring the reliability of data for accurate radiometric comparison with KOMPSAT-3/AEISS [33]. Detailed information regarding the Sentinel-2A/MSI mission characteristics is also given in Table 1.

2.2. Calibration Site

Selecting an appropriate calibration site is crucial for ensuring the reliability and accuracy of cross-calibration based on TOA radiance measurements. The effectiveness of a calibration site is influenced by several key factors, including surface reflectance, atmospheric conditions, spatial uniformity, and seasonal stability. These factors collectively determine the quality of radiometric measurements and the consistency of calibration outcomes. Sites with high surface reflectance, such as desert regions, are advantageous due to their strong radiometric signals and the reduced impact of atmospheric path radiance in the visible and near-infrared (VNIR) bands. Thome et al. [34] emphasized the utility of high-reflectance targets in achieving precise calibration. Additionally, high-altitude sites, typically located above 1000 m, are preferred due to reduced aerosol interference, which can otherwise degrade measurement accuracy.
In addition to high reflectance, calibration sites should exhibit strong spatial uniformity with minimal variation in surface reflectance across different spatial scales. Homogeneous terrain helps ensure that sensor responses are not affected by heterogeneous surface features such as vegetation or water bodies. Arid and semi-arid environments are ideal due to their frequent cloud-free conditions and stable surface properties. Sites such as Railroad Valley Playa in the United States and Gobabeb in Namibia are widely used for radiometric calibration of sensors including Landsat-8 OLI and Sentinel-2A/MSI due to their minimal seasonal variation and uniform desert surfaces [35,36,37,38,39,40]. Another important consideration is the BRDF effect, which arises from angular variations in surface reflectance [41,42,43,44]. To minimize this effect, calibration sites with Lambertian-like characteristics are preferred so that surface reflectance remains consistent across different solar and viewing geometries [45,46,47].
In this study, Baotou, located in the Inner Mongolia Autonomous Region of China, was selected as the cross-calibration site. The site offers a stable, high-reflectance desert environment with minimal seasonal variability and frequent clear-sky conditions [48]. Baotou is part of the Radiometric Calibration Network (RadCalNet), an international initiative that provides standardized surface reflectance and atmospheric correction data for satellite sensor calibration. Previous studies have demonstrated Baotou’s effectiveness in reducing BRDF-related uncertainty and improving the consistency of radiometric calibration results [35,49].
To perform the calibration, multispectral images from both KOMPSAT-3 AEISS and Sentinel-2A/MSI were extracted using the Quantum Geographic Information System (QGIS) and Python 3.9 OpenCV libraries. Due to differences in spatial resolution between the two sensors, the KOMPSAT-3 images (2.8 m resolution) were resampled to match the Sentinel-2A resolution (10 m). Four artificial targets within the Baotou site were selected as regions of interest (ROI), and for each target, a 3 by 3 pixel area (30 m by 30 m) was used to obtain averaged DN values. Sentinel-2A DN values were converted to TOA radiance using metadata contained in the accompanying XML files.
For vicarious calibration, the Korea Aerospace Research Institute (KARI) site in South Korea was selected due to its ease of accessibility, which allowed for efficient field measurements and equipment operation. Although the KARI site does not offer the same level of spatial uniformity as Baotou, it supports diverse reflective conditions suitable for practical field calibration. Four artificial tarps with different reflectance values, each measuring 15 m by 15 m, were deployed to capture reflectance under controlled conditions.
The geographic information for the two calibration sites is summarized in Table 2. Baotou is located at 40.854°N, 109.628°E, with an elevation of 1300 m. KARI is located at 36.374°N, 127.352°E, with an elevation of 60 m. These parameters affect atmospheric transmission and sensor performance during calibration measurements.
Utilizing the strengths of both Baotou and KARI enabled accurate calibration of KOMPSAT-3 AEISS and meaningful cross-comparison with Sentinel-2A/MSI. Figure 1 presents RGB images acquired over Baotou on 28 October 2023, and over KARI on 5 October 2023, illustrating the artificial targets and surrounding terrain features.

2.3. Cross-Calibration Method

The cross-calibration method used in this study was designed to ensure the accurate alignment and harmonization of the radiometric measurements from the KOMPSAT-3/AEISS and Sentinel-2A/MSI satellites. This process is essential for maintaining consistency and reliability across the data from both satellite systems, enabling the meaningful integration of the datasets. The first step of cross-calibration involves the extraction of ROIs, carefully selected well-defined homogeneous areas that typically focus on artificial targets, from the satellite images to be analyzed. Artificial targets are selected because of their high reflectivity and stable signals, which are crucial for precise calibration. Four artificial targets located within the Baotou region were thus selected for analysis. The high reflectivity of the selected artificial targets helps reduce uncertainties in the radiometric measurements that could arise from varying surface characteristics.
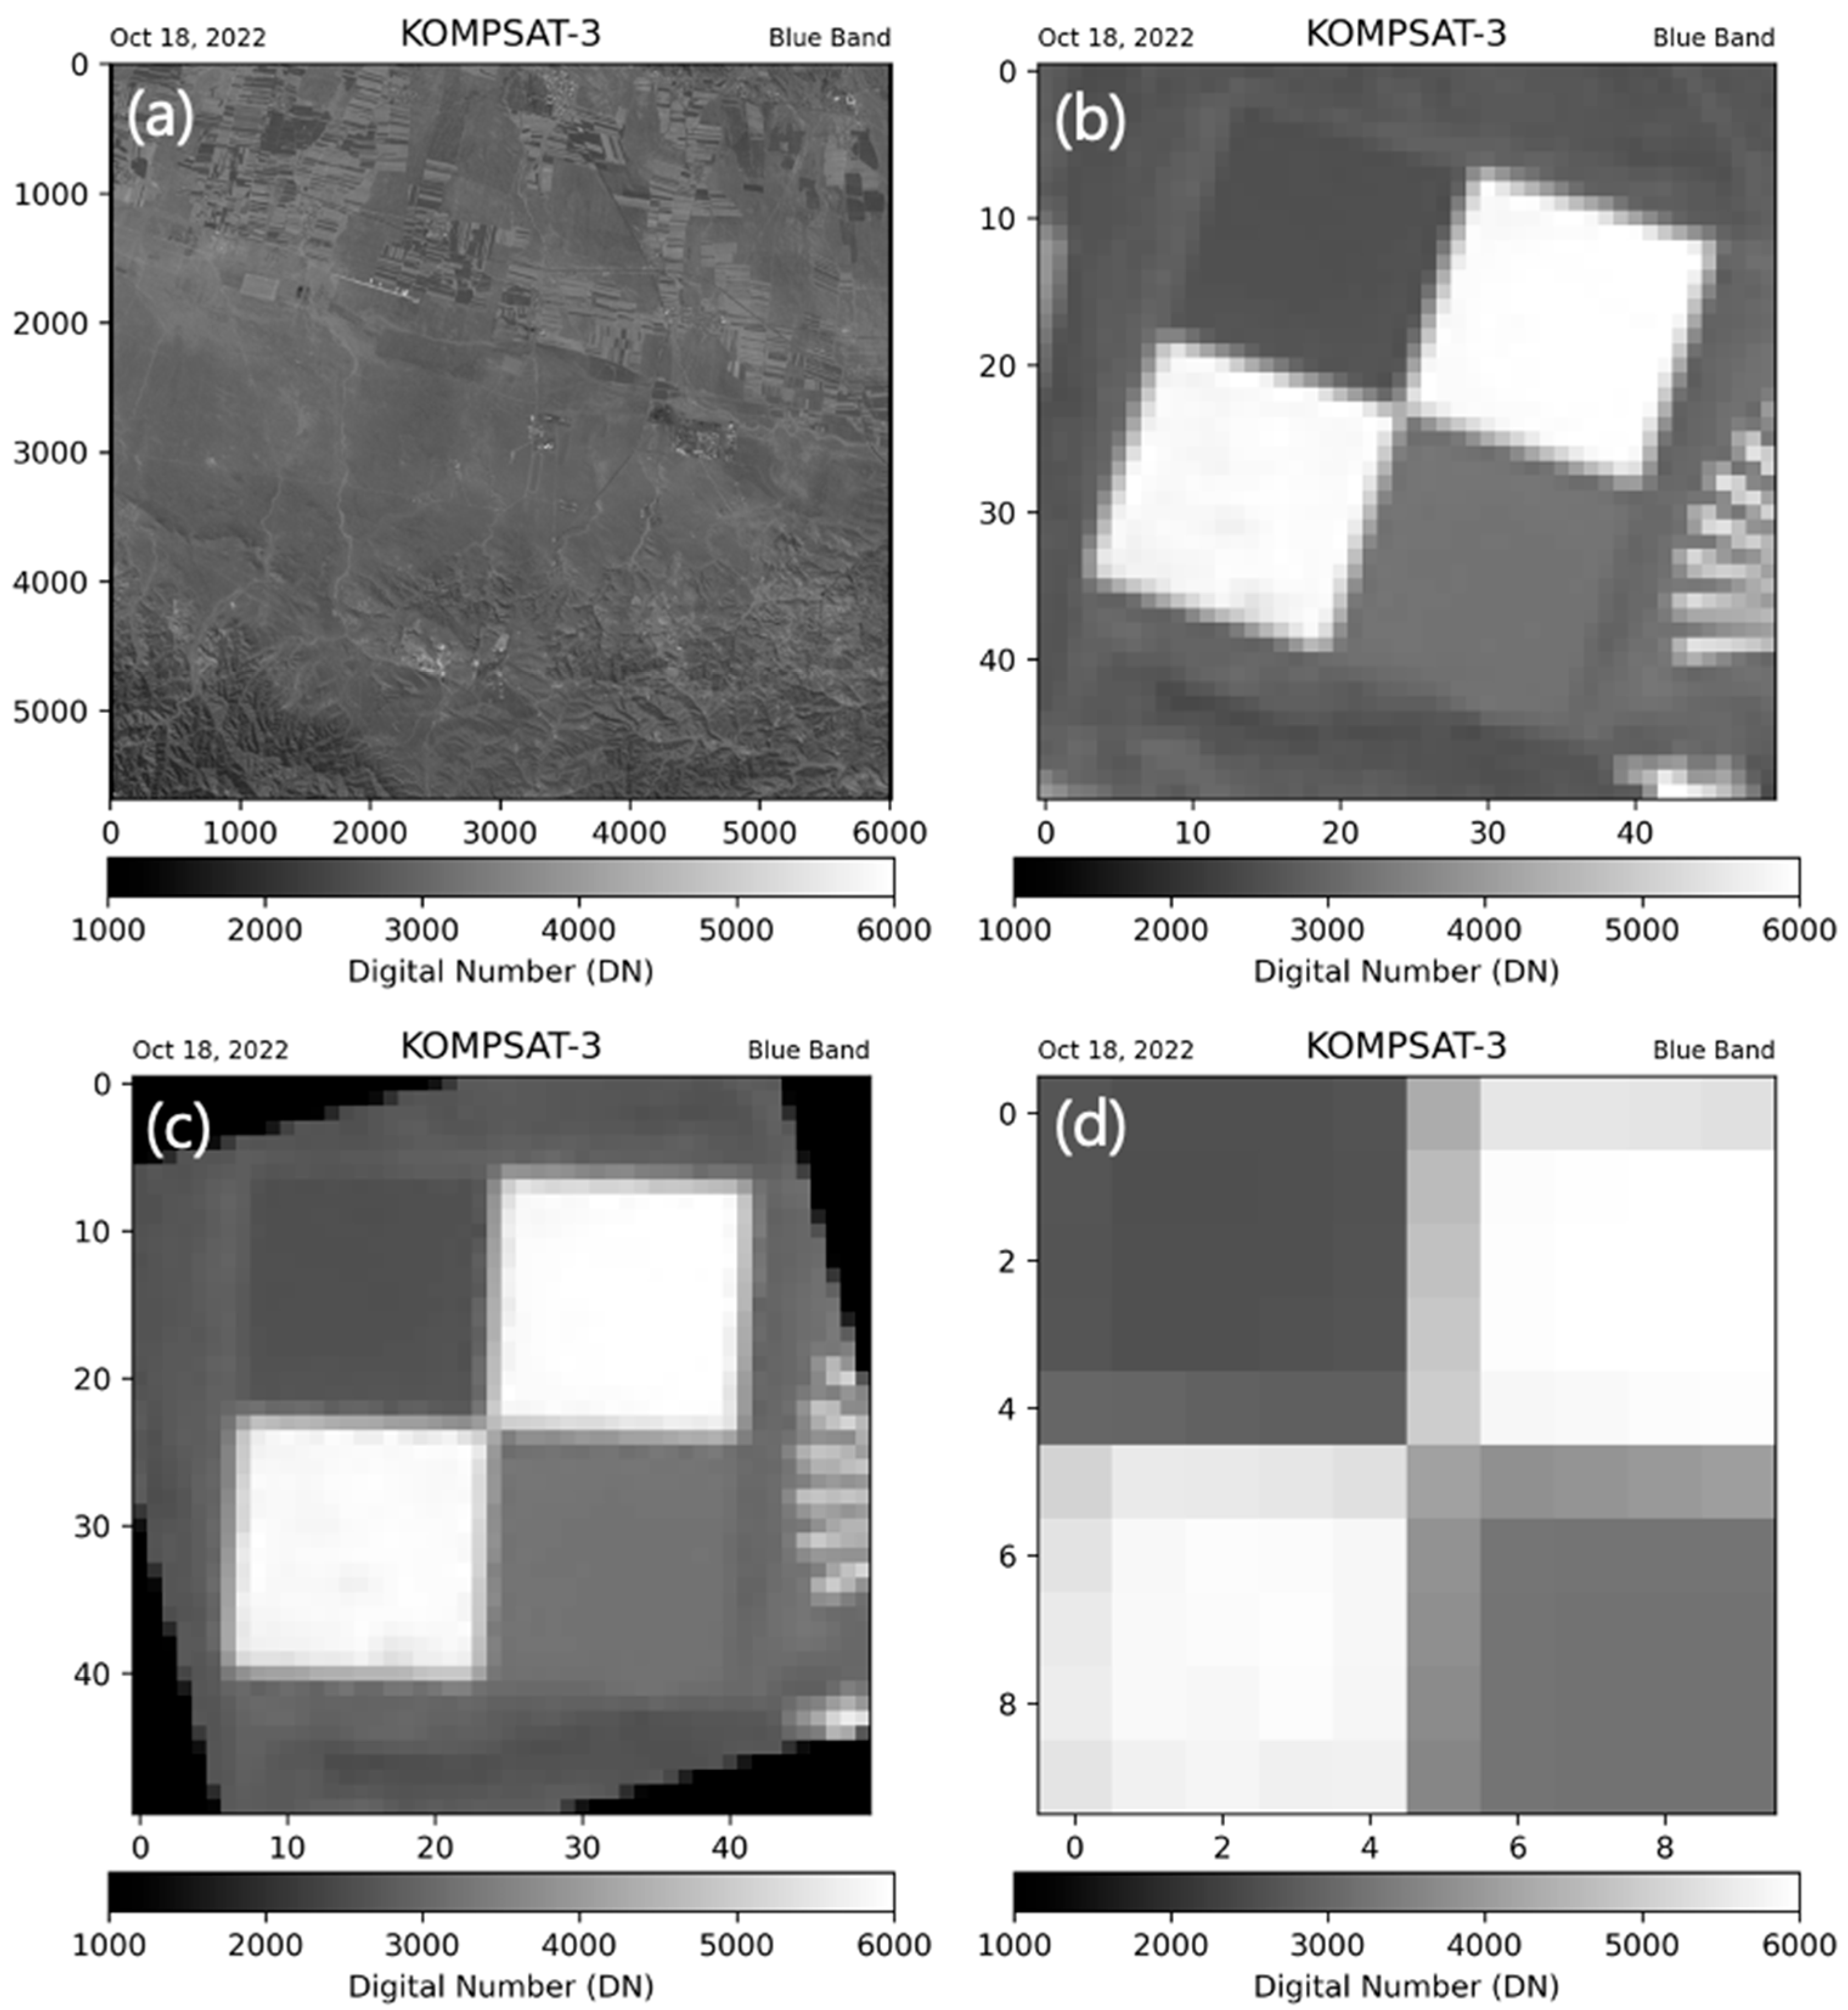
Once the ROIs have been selected, the next step is to ensure that both satellite images are at the same spatial resolution for accurate comparison. Since AEISS has a finer native GSD (2.8 m) than MSI (10 m), the AEISS imagery was downsampled to 10 m to ensure consistent sampling for cross-calibration. In this context, ‘10 m’ refers to the nadir GSD, representing a ground footprint of approximately 10 m × 10 m per pixel. Downscaling was performed using OpenCV’s INTER_AREA resampling, a method designed to reduce resolution while minimizing information loss, aliasing, and distortion. The INTER_AREA method works by applying pixel area relation interpolation, effectively averaging pixel values when reducing image size. This approach preserves spatial structures and reduces aliasing effects, making it particularly suitable for satellite imagery where radiometric integrity is crucial. The use of INTER_AREA ensures that the downscaled image accurately represents the original image at a lower resolution while maintaining radiometric consistency, which is essential for subsequent cross-calibration analysis. Additionally, reflectance measurements were conducted to validate the radiometric properties of the downscaled image. These measurements ensured that the spectral characteristics of the resampled image remained consistent with the original data, minimizing the impact of resolution adjustment on radiometric calibration.
Figure 2 summarizes the spatial harmonization workflow. Panel (a) shows the original KOMPSAT-3/AEISS image over the RadCalNet Baotou site; (b) is a close-up of the artificial targets; (c) shows the scene after a rigid rotation to align the target rows/columns with the image axes and the Sentinel-2A/MSI grid, reducing mixed-pixel effects and enabling like-for-like sampling; and (d) shows the image downscaled to 10 m to match Sentinel-2A/MSI for cross-calibration. After downscaling, to minimize Modulation Transfer Function (MTF) and edge contamination, we extracted the central 3 × 3 pixels from each artificial target. The mean DN of these 3 × 3 kernels was then used in the calibration analysis.
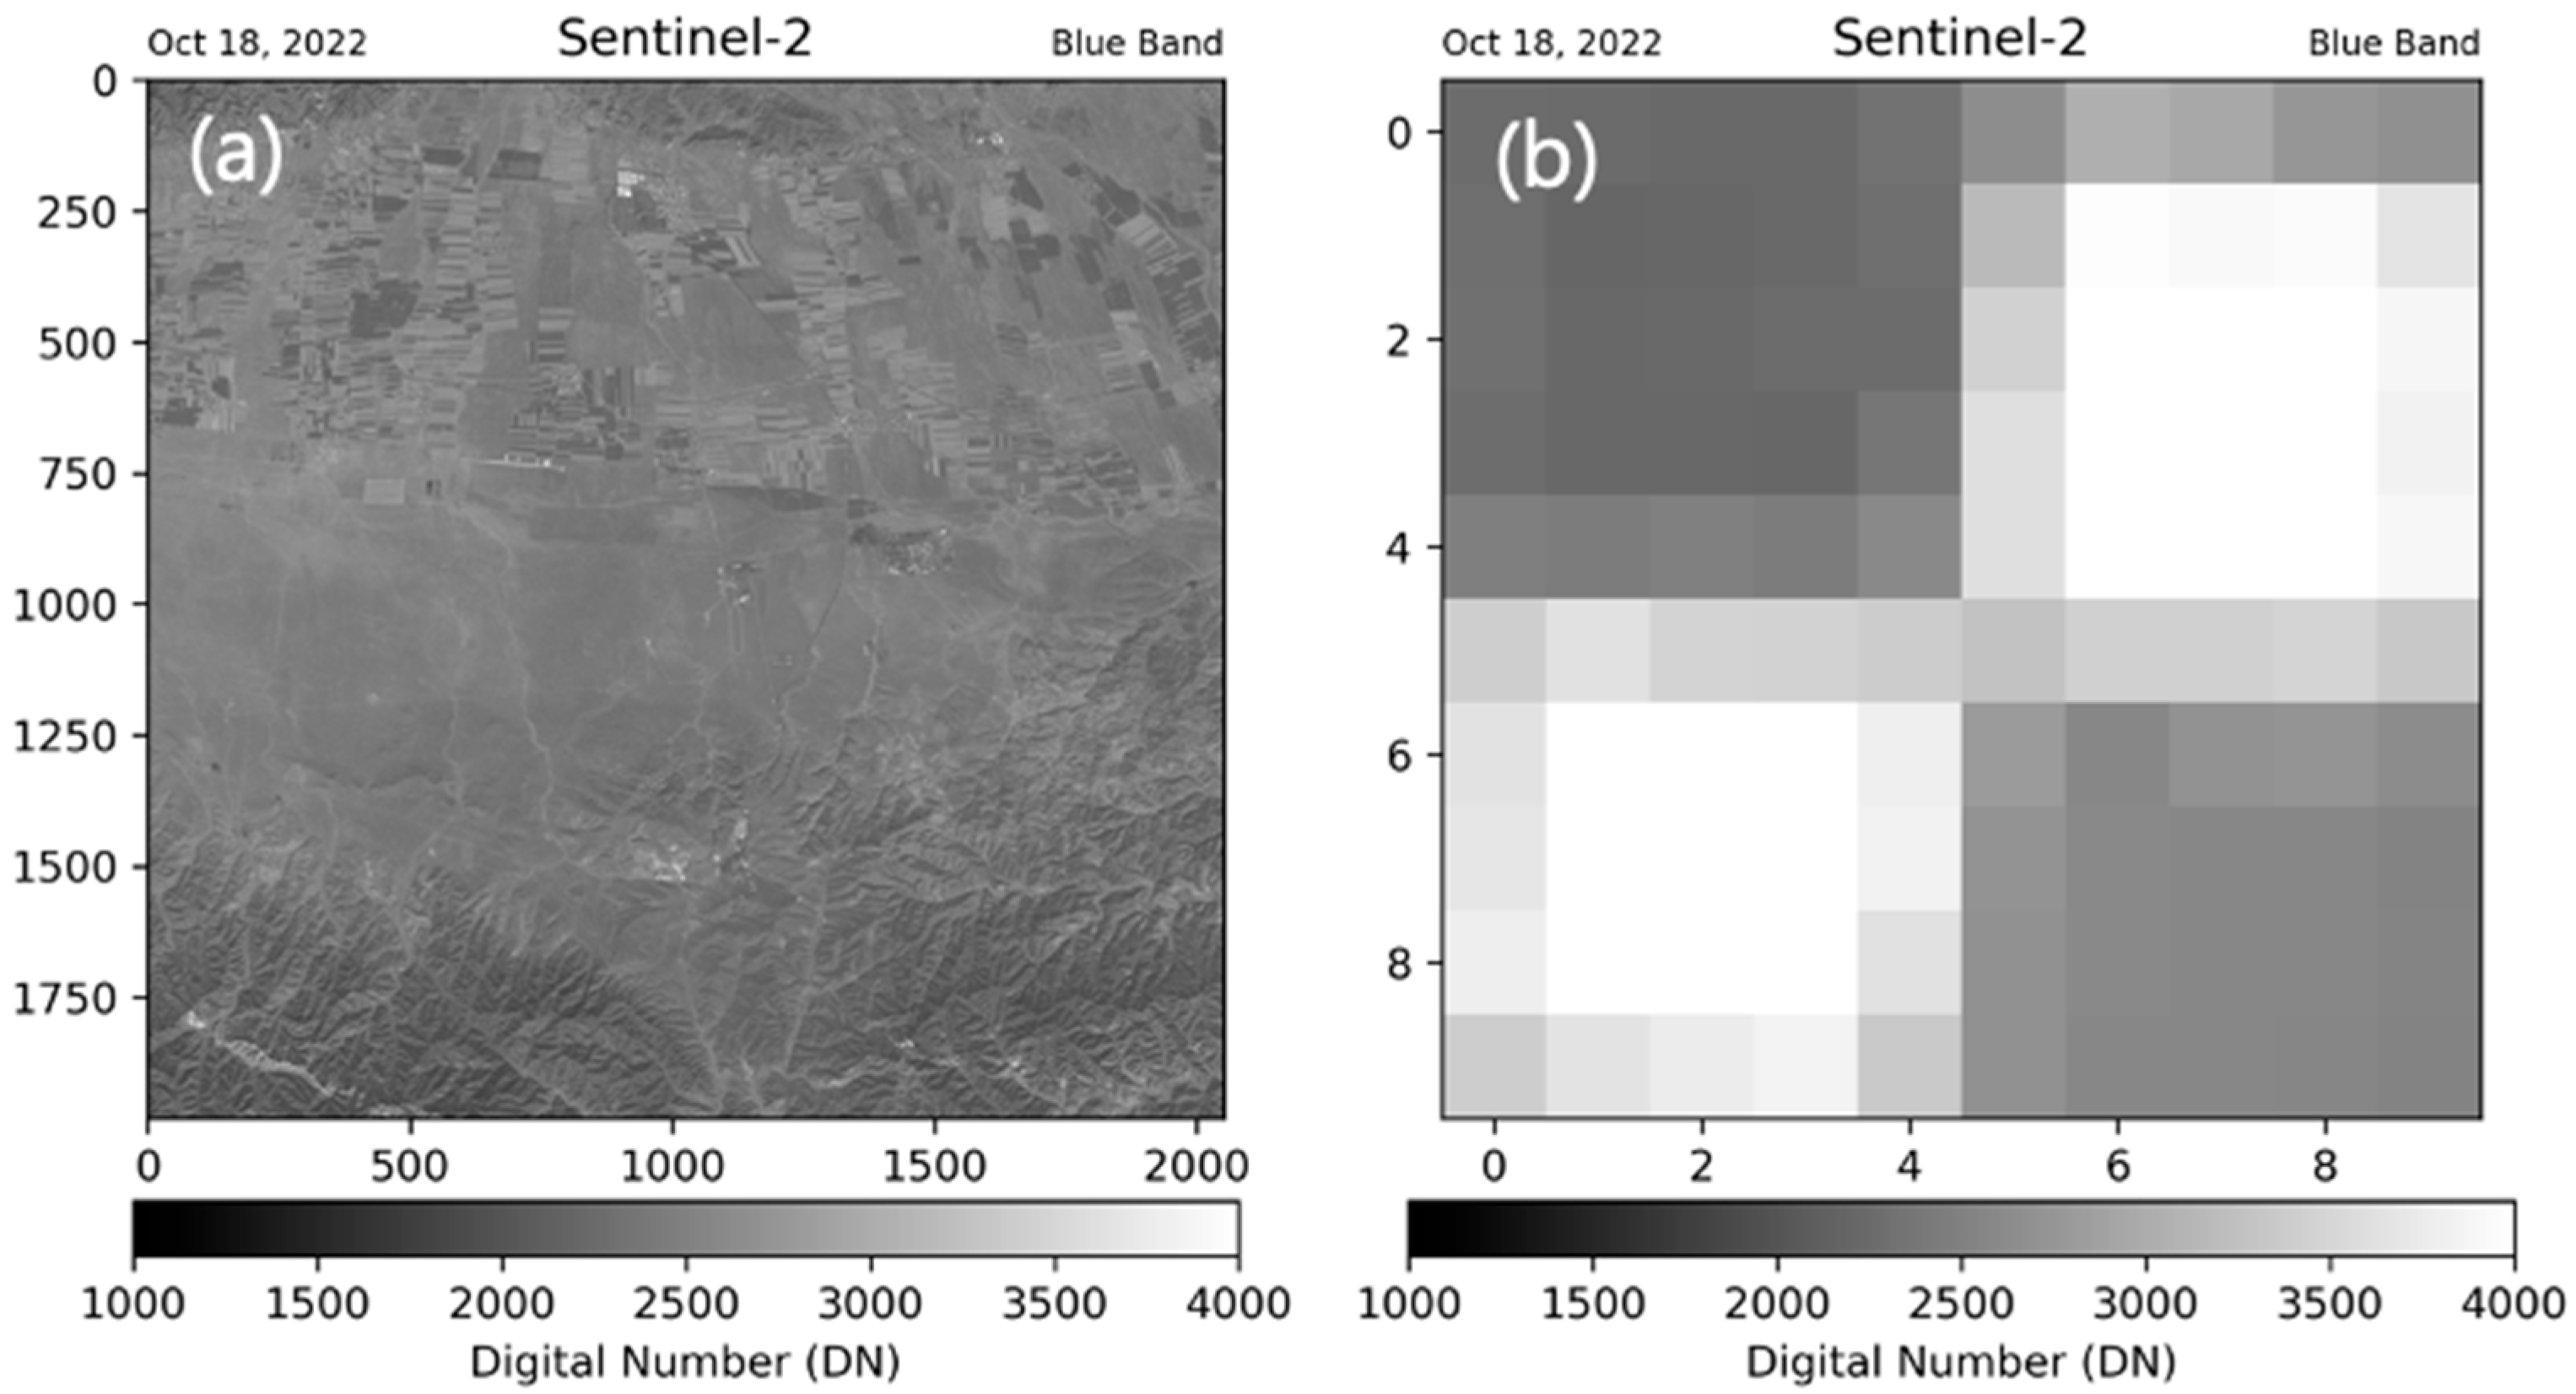
For Sentinel-2A/MSI, Figure 3 presents the corresponding downscaling steps. Panel (a) shows the Baotou site and (b) displays the artificial target area used for reference data extraction. The DN values from Sentinel-2A/MSI were converted to TOA radiance using gain and offset information provided in the satellite metadata (XML files). This conversion allowed for direct radiometric comparison with KOMPSAT-3/AEISS.
Once the TOA radiance values for Sentinel-2A/MSI were obtained, a SBAF was applied to refine the calibration [50]. The SBAF is used to correct any discrepancies in the spectral bands obtained from the two satellites. These discrepancies can arise from differences in the sensor characteristics, such as the SRF or other factors inherent to the design and performance of the satellites. The SBAF is computed by comparing the radiance values from KOMPSAT-3/AEISS and Sentinel-2A/MSI and determining the adjustment factor required to harmonize the spectral bands. Once the SBAF is calculated, it is applied to the radiance values to ensure that the data from both satellites are consistent and aligned, indicating their suitability for use in the subsequent analysis.
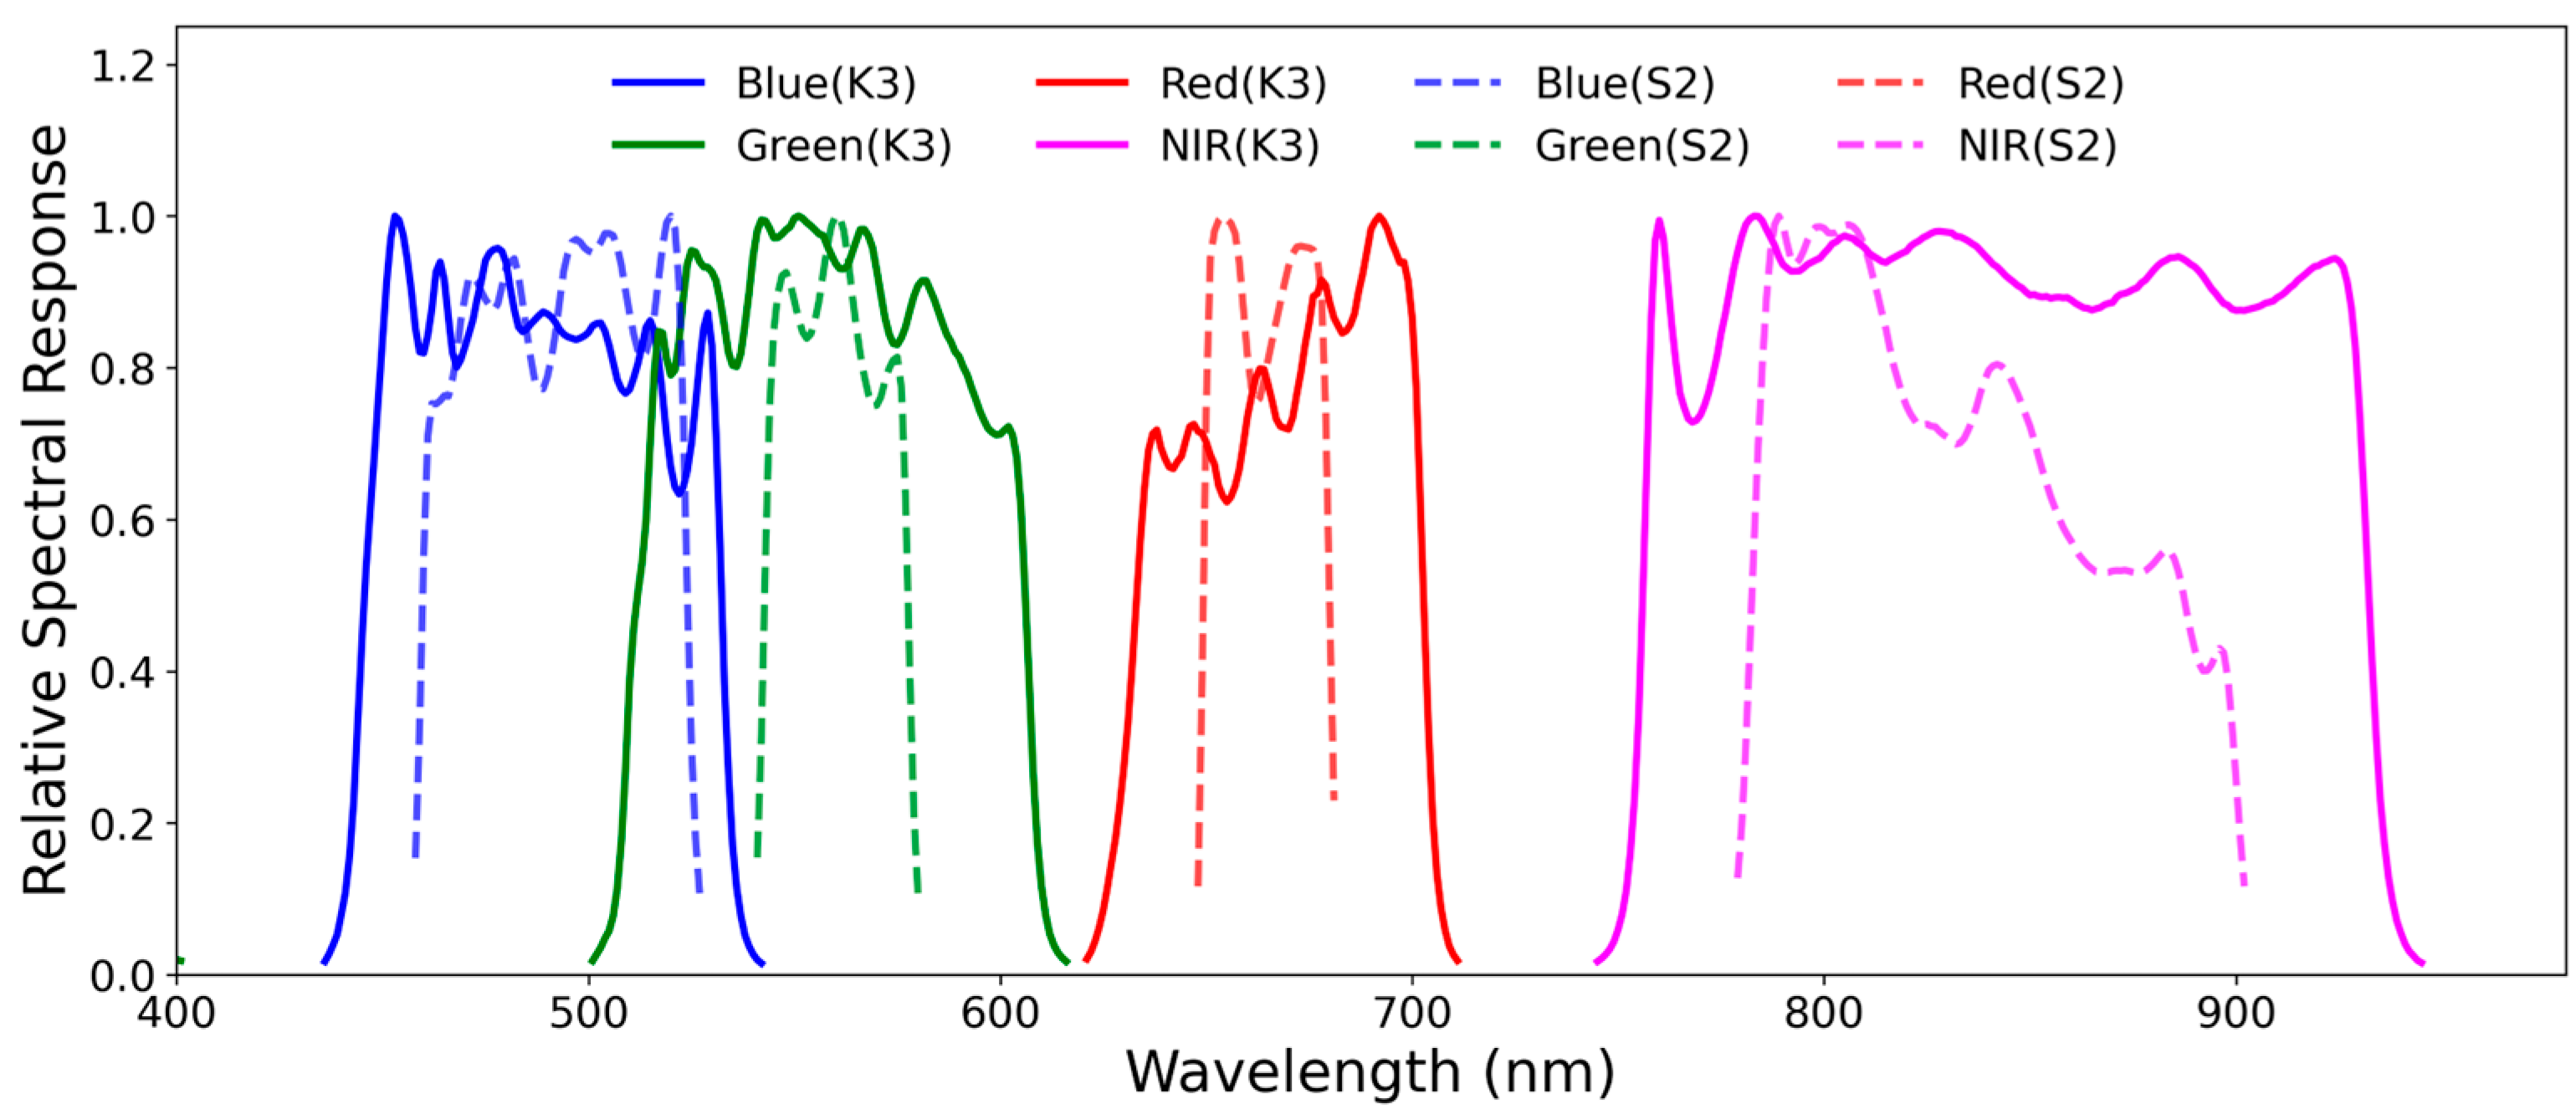
The SRFs for the MS bands (Blue, Green, Red, and NIR) for KOMPSAT-3/AEISS and Sentinel-2A/MSI can be seen in Figure 4. The unique performance characteristics of each satellite lead to disparities in the SRF across these bands. The SBAF was thus computed for each band to compensate for spectral discrepancies and address these differences. The methodology for calculating the SBAF is outlined in Equation (1), with the integrals representing the weighted average of the TOA radiance and the SRF for each sensor across the wavelength range [50].
S B A F S K S S R a d i a n c e = L λ S R F K λ d λ   S R F K λ d λ L λ S R F S λ d λ   S R F S λ d λ
where L λ denotes the TOA radiance for the Baotou artificial target, computed from the target’s BOA reflectance measured at the RadCalNet BTCN site together with co-located atmospheric conditions such as Aerosol Optical Depth (AOD), Water Vapor (WV), and Ozone (O3). These atmospheric parameters were obtained from RadCalNet, which provides standardized, SI-traceable surface reflectance and atmospheric data. RadCalNet continuously collects AOD, WV, and O3 column data at instrumented sites through automated measurements and processes them using a common methodology to ensure consistency and reliability. The simulated TOA radiance was then compared with the DN values recorded by the KOMPSAT-3/AEISS satellite over the same area. These parameters were used as input variables for MODTRAN6 to accurately account for atmospheric effects. Incorporating these site-specific measurements, including BOA reflectance and atmospheric parameters, was critical in minimizing uncertainties arising from spectral discrepancies and ensuring the reliability of the SBAF calculation. This approach enhanced the consistency between KOMPSAT-3/AEISS and Sentinel-2A/MSI data, providing robust radiometric comparisons. Variables S K and S s represent KOMPSAT-3/AEISS and Sentinel-2A/MSI, respectively, whereas S R F K and   S R F S correspond to the SRF of KOMPSAT-3/AEISS and Sentinel-2A/MSI, respectively.
Once computed, the SRF is applied to adjust for the radiance values for both satellites. The adjusted TOA radiance for Sentinel-2A/MSI was calculated using Equation (2) [50]:
L S S B A F = L S × S B A F S K S S R a d i a n c e
where L S represents the TOA radiance derived from the DN values extracted from Sentinel-2A/MSI using an xml file for the radiometric conversion. The corrected TOA radiance, L S S B A F , compensates for the SRF differences by multiplying L S by the SBAF obtained using Equation (1).
To account for differences in observation geometry between Sentinel-2A and KOMPSAT-3, the BRDF effects were corrected using the kernel-driven Ross–Thick Li–Sparse model (hereafter Ross–Li model), as described in Equation (3) [22]. Because the Baotou RadCalNet site is embedded in an optically homogeneous desert environment, we used the MCD43A1 parameters of the pixel containing the site as a representative BRDF value [51,52]. Surface reflectance values for both sensors were estimated using MODIS MCD43A1 BRDF model parameters ( f i s o ,   f v o l ,   f g e o ) with geometry-specific kernel terms derived from solar zenith angle ( θ s ), view zenith angle ( θ v ), and relative azimuth angle ( ϕ ) [22]:
R = f i s o + f v o l · K v o l θ s , θ v , ϕ + f g e o · K g e o θ s , θ v , ϕ
Using this approach, BRDF-adjusted reflectance for Sentinel-2A ( R K ) and KOMPSAT-3 ( R S ) were computed. A BRDF correction factor was then calculated for each scene:
B R D F   C o r r e c t i o n   F a c t o r =   R K R S
To harmonize Sentinel-2A TOA radiance with the directional characteristics of KOMPSAT-3, the corrected Sentinel-2A TOA radiance ( L s , a d j S B A F ) was calculated by multiplying the SBAF-corrected Sentinel-2A TOA radiance ( L S S B A F ) by the ratio of the two BRDF-adjusted reflectance:
L S , a d j S B A F = L S S B A F × R K R s
This method ensures that the directional reflectance differences between the two sensors are minimized, allowing for more accurate radiometric cross-calibration.
Following the SBAF correction, BRDF correction was additionally applied to minimize directional reflectance differences caused by varying observation and illumination geometries between the two sensors. A linear regression model was applied to validate the consistency of the radiometric measurements for the two satellites, using the DN values from KOMPSAT-3/AEISS and corrected TOA radiance from Sentinel-2A/MSI, with the slope representing the gain and the y-intercept corresponding to the offset. The model was used to assess and confirm the accuracy of the calibration across comparable images from both KOMPSAT-3/AEISS and Sentinel-2A/MSI, ensuring that the data from the satellites were aligned and suitable for further analysis. The methodology of applying the SBAF to correct for spectral differences ensures that the radiometric measurements from KOMPSAT-3/AEISS and Sentinel-2A/MSI can be used together with high consistency, enabling more accurate and reliable cross-sensor analyses.
The method outlined above, from ROI extraction and image downscaling to the application of SBAF, is consistent with the established cross-calibration procedures used in previous studies such as those described by Bouvet et al. [49] and Marcq et al. [40], who demonstrated the importance of using high-reflectivity targets and reducing the BRDF effects in satellite calibration. These studies underscore the critical role of precise calibration in improving the consistency and reliability of satellite data, which is essential for effective environmental monitoring and other remote-sensing applications. A linear regression model was applied to validate the accuracy of the cross-calibration, comparing the DN values from KOMPSAT-3/AEISS with the SBAF and BRDF corrected TOA radiance from Sentinel-2A/MSI. In the regression model, the slope represents the gain and the y-intercept the offset, with the adjustments made using the model ensuring that the datasets from both satellites are as consistent as possible, minimizing any discrepancies that may arise from differences in the sensor characteristics.
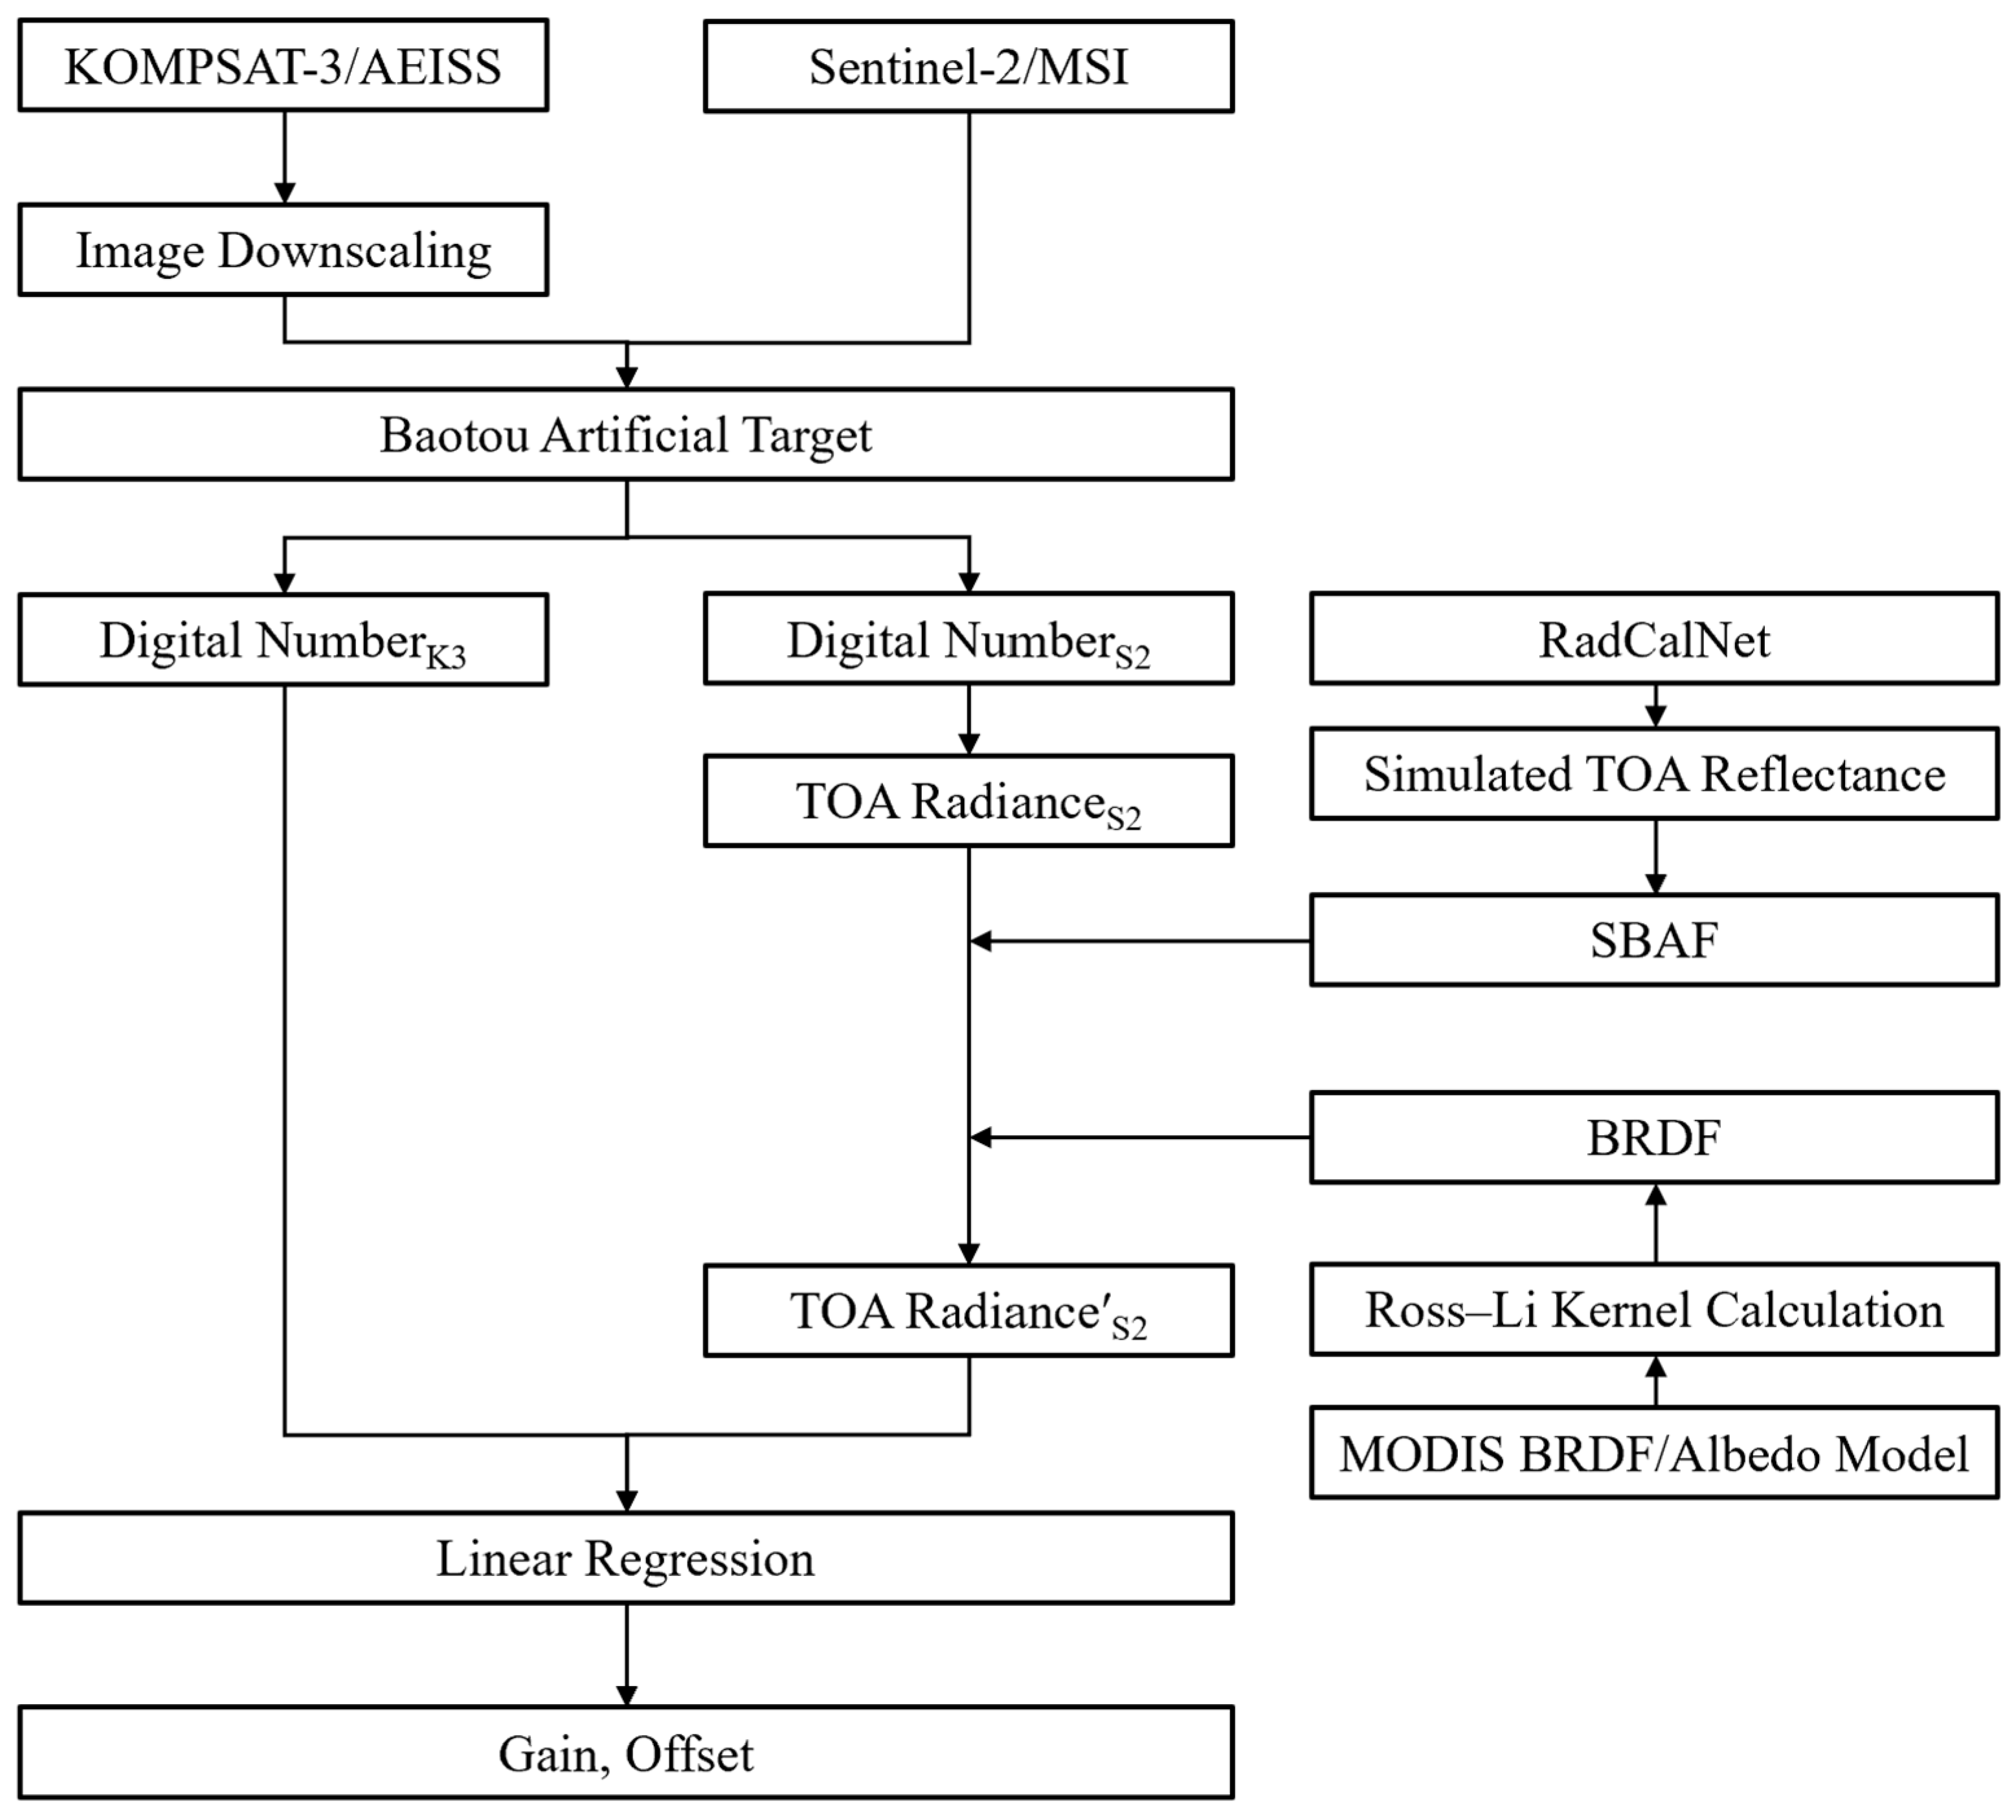
The combination of these steps—including ROI extraction, image downscaling, radiance conversion, application of SBAF and BRDF corrections, and linear regression calibration—ensures that the radiometric data from KOMPSAT-3/AEISS and Sentinel-2A/MSI can be effectively harmonized and integrated. The BRDF correction step, derived from the MODIS BRDF/Albedo model and Ross–Li kernel calculations, was applied to minimize directional reflectance differences caused by varying observation geometries. Alongside SBAF correction, which compensates for spectral response mismatches, this comprehensive calibration framework improves the reliability and consistency of satellite data. This harmonized process is critical for ensuring the compatibility of multi-sensor datasets in applications such as environmental monitoring, land-use classification, and disaster response, where radiometric consistency is essential. A detailed flowchart of the cross-calibration process for KOMPSAT-3/AEISS is shown in Figure 5, illustrating each step in the procedure—from ROI selection and image downscaling to TOA radiance conversion, SBAF and BRDF correction, and gain/offset estimation through linear regression. The figure provides a visual representation of the systematic and rigorous approach used to align and compare radiometric data from the two satellite systems.

2.4. Vicarious Calibration Method

The vicarious calibration method utilizes in situ measurements to validate and adjust the radiometric performance of satellite sensors, enabling accurate conversion from the DN values to physical radiance units. This method relies heavily on carefully selected calibration sites and ground-based measurements, which are then compared with simulated TOA radiance values derived from a radiative transfer model. A combination of field-based reflectance data, atmospheric measurements, and the MODTRAN6 model was employed to ensure that the radiometric performance of KOMPSAT-3/AEISS was accurately calibrated [53,54].
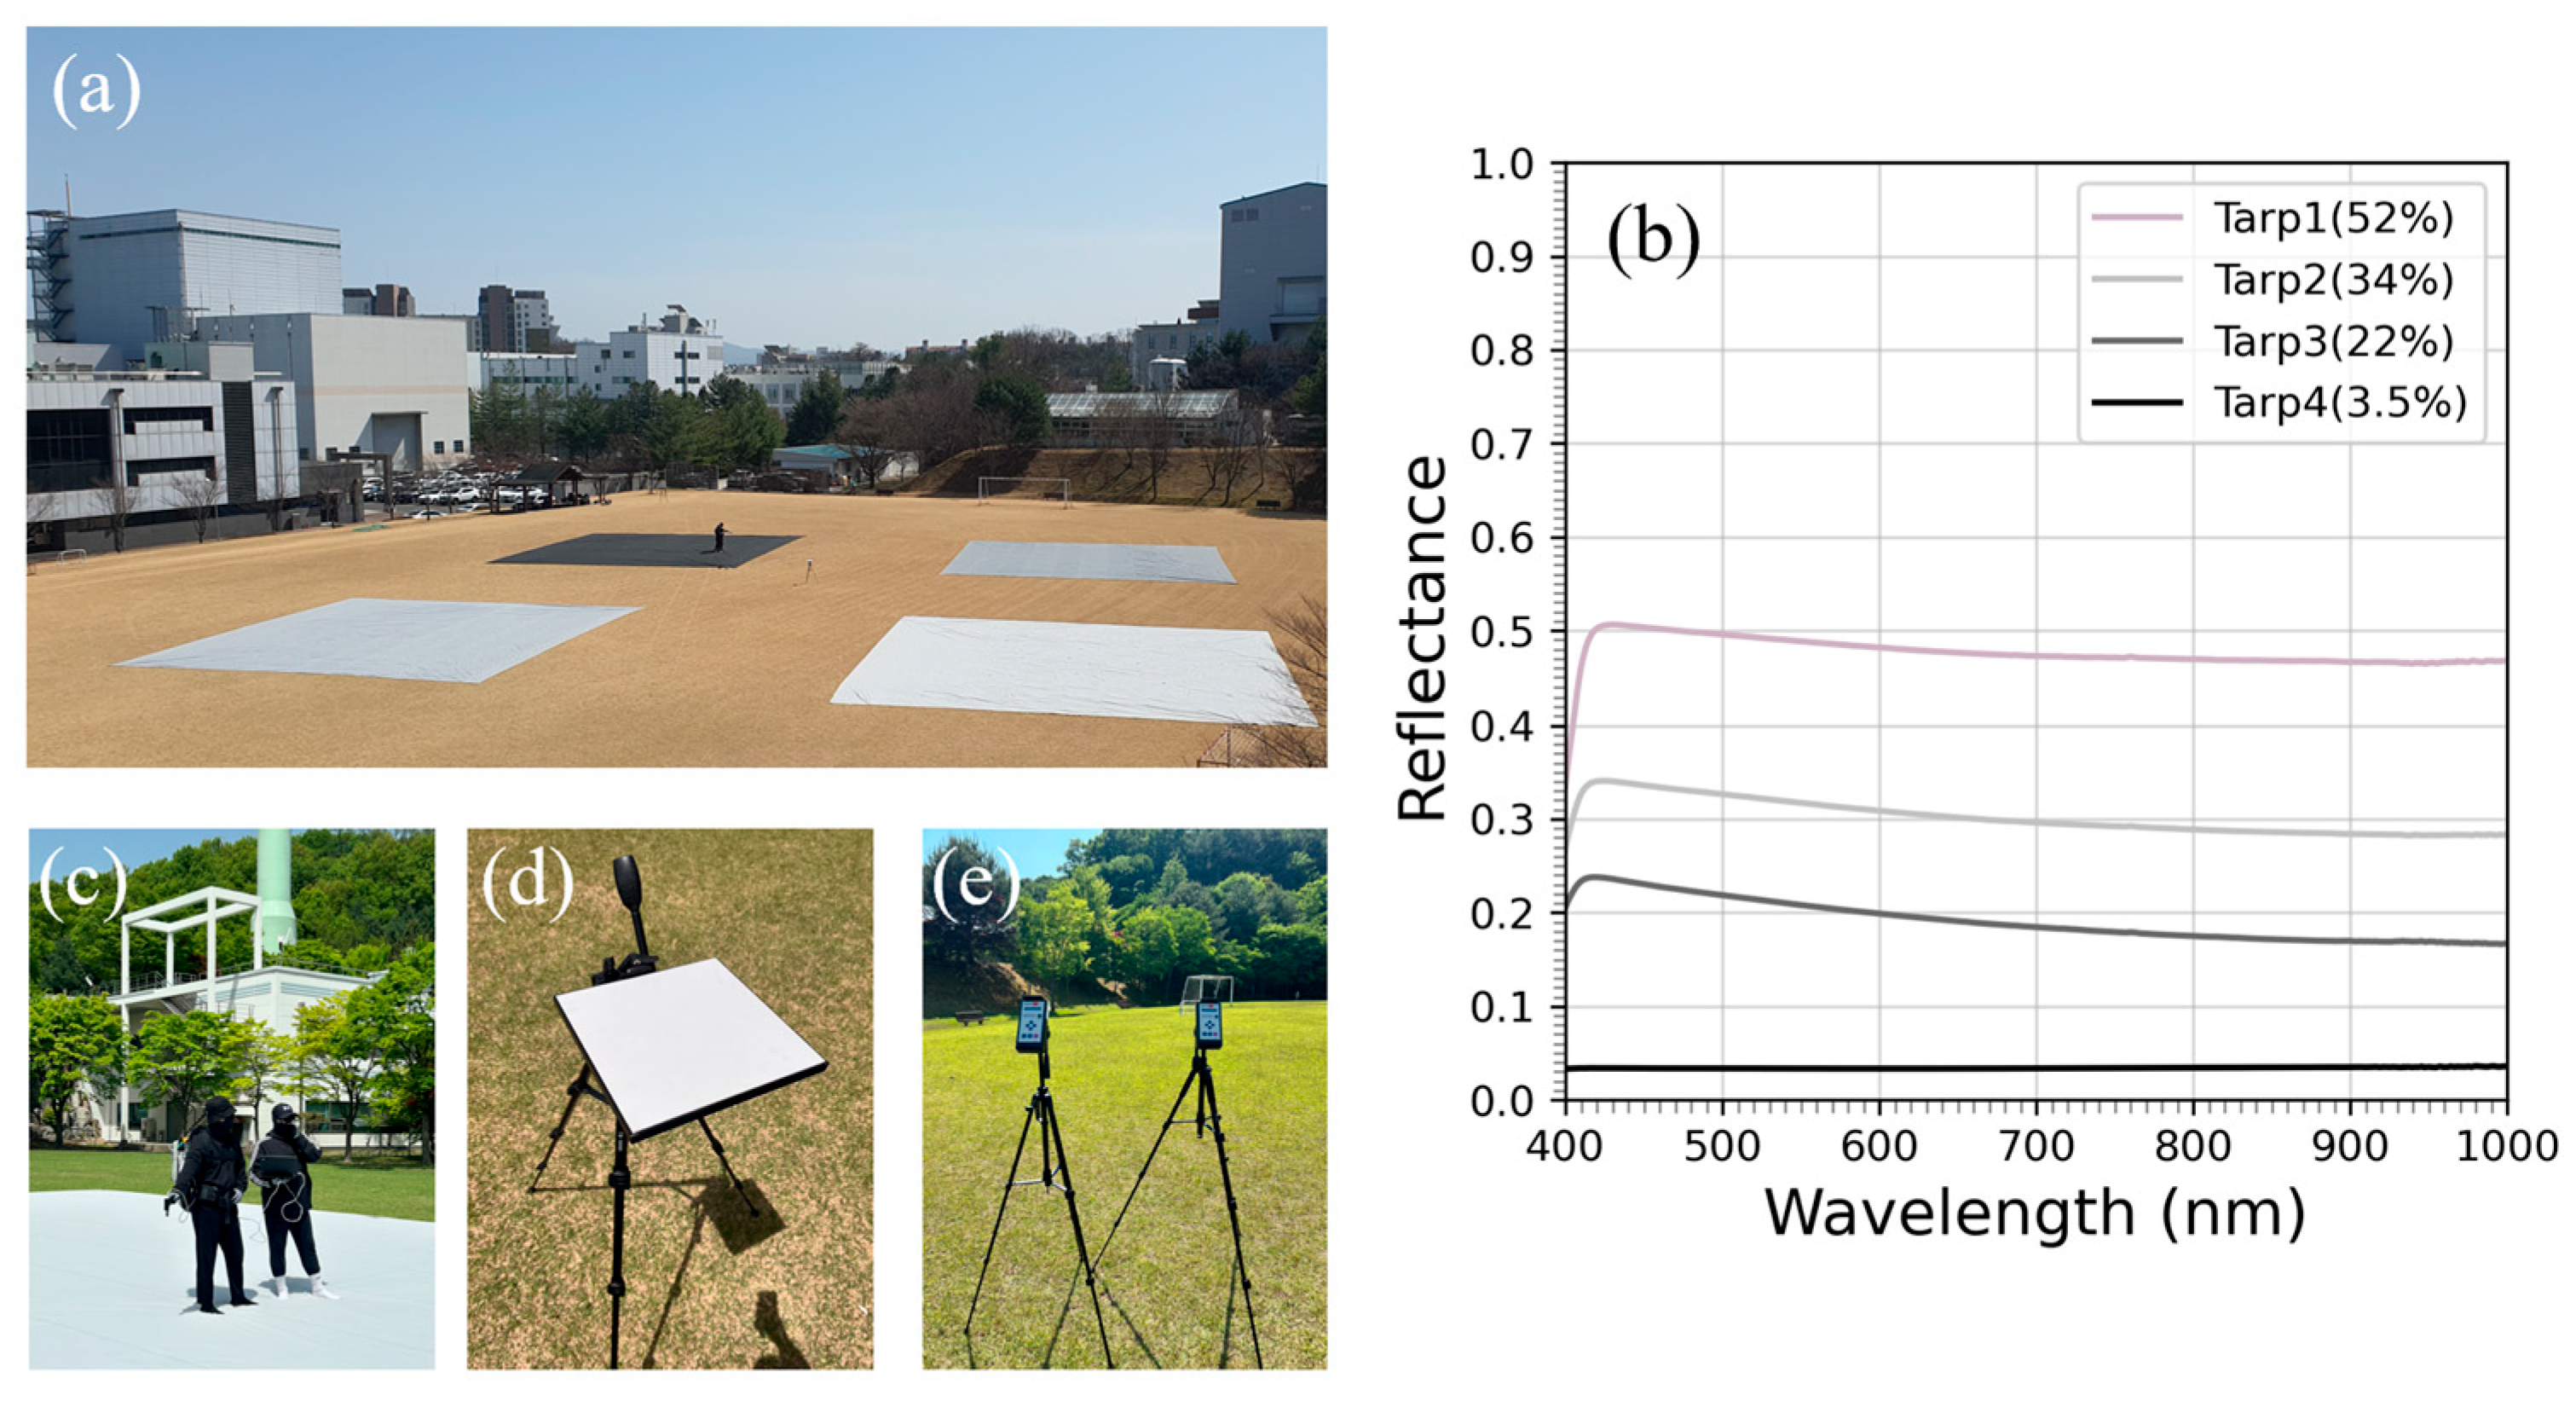
Figure 6 shows an example of the core procedures of the vicarious calibration performed in this study and the results of reflectance measurements using four artificial tarps (the reflectance of 3.5%, 22%, 34%, and 52%) with 15 m × 15 m, respectively. In this process, commercially available tarps with well-defined, near-Lambertian reflectance were employed, and their reflectance was measured using the ASD FieldSpec III spectroradiometer (Analytical Spectral Devices Inc., Boulder, CO, USA), which is known for high precision in the VNIR–SWIR range (350–2500 nm). Figure 6a is a photograph of four tarps installed at the KARI field site to observe distinct ROIs before and after the satellite overpasses. To minimize angular effects, the tarps were laid along the swath scan direction on flat surfaces. The reflectance measurements in the wavelength of 400–1000 nm for each tarp were presented in Figure 6b. Figure 6c is an example of measuring the tarp reflectance from ASD FieldSpec III, and observations were performed before and after the satellite overpasses, respectively. To reduce spatial variability, reflectance was measured at 10 points on each tarp, and the average was used as the representative reflectance; the standard deviation across the 10 measurements was within 2%. Additionally, a method of calibration from a Spectralon panel (reference white panel) was used before observing each tarp based on the reflectance observation guide, as shown in Figure 6d. This setup ensured the acquisition of reliable reflectance data, which served as a critical input for TOA radiance simulation using a radiative transfer model such as MODTRAN6. After measuring the surface reflectance, the next critical step is to simulate the TOA radiance using MODTRAN6. This model simulates the radiative transfer of sunlight through the atmosphere and incorporates various atmospheric parameters, including AOD, WV, O3 and so on. The atmospheric parameters representing the field conditions, such as AOD, WV, and O3, were measured using a Microtops II Sunphotometer (Solar Light Company Inc., Glenside, PA, USA) installed at the site. Figure 6e illustrates this equipment setup.
The field-based reflectance data were then compared with the simulated TOA radiance to derive an absolute radiometric calibration coefficient that allowed for calibration of the KOMPSAT-3/AEISS sensor. This vicarious calibration process ensures that the radiometric measurements of the sensor are aligned with known ground-truth values, providing accurate radiometric data for further analysis.
The primary goal of this vicarious calibration process was to update the radiometric calibration coefficients for KOMPSAT-3/AEISS to ensure that the DN values could be reliably converted into TOA radiance values. Using the MODTRAN6 model to obtain TOA radiance simulations and comparing them with field-based DN measurements allowed the radiometric calibration of the satellite to be refined.
This methodology is widely used in satellite calibration because it is a reliable and cost-effective means of validating the sensor performance without the need for complex onboard calibration systems. Previous studies, such as those by Yeom et al. [13] and Jin et al. [24], have demonstrated the effectiveness of vicarious calibration using well-characterized tarps and radiative transfer models. These studies emphasize the importance of precise ground-based measurements and accurate atmospheric modeling in ensuring that satellite sensors maintain a high calibration accuracy throughout their operational lifetimes.

3. Results and Discussion

3.1. Cross-Calibration

This section presents a cross-calibration analysis using KOMPSAT-3/AEISS and Sentinel-2A/MSI imagery acquired on the same dates over Baotou, China, with Sentinel-2A as the reference sensor. The analysis compares KOMPSAT-3/AEISS DN with Sentinel-2A/MSI TOA radiance to harmonize the datasets and assess their suitability for comparative analyses and subsequent investigations.
The key calibration conditions for the five dates are listed in Table 3 and includes parameters such as the overpass time (UTC), solar zenith angle, solar azimuth, viewing zenith angle, and viewing azimuth for each calibration date. These parameters are crucial because they define the geometry of the satellite observations during calibration. The solar zenith angle, which represents the angle at which sunlight reaches the Earth’s surface, is particularly important for understanding the amount of radiation measured by a satellite sensor. The solar azimuth provides the direction of the Sun’s rays relative to that of the satellite, influencing the radiometric response. The viewing zenith and azimuth angles indicate how the satellite sensor observes the Earth’s surface. These angles affect the degree to which atmospheric and surface features influence the measured radiance. To account for these directional effects, BRDF correction was applied using geometry-specific kernel models, allowing more accurate harmonization between the two sensors. By comparing these geometric parameters across different dates, the alignment of the radiometric measurements can be ensured during calibration under varying observational conditions. Table 4 summarizes the BRDF correction factors applied for each spectral band (Blue, Green, Red, and NIR) across five calibration dates. These correction factors were derived based on MODIS BRDF/albedo parameters and Ross–Li kernel calculations using site-specific solar and viewing geometry. The results show that the BRDF correction factors vary slightly by band and date, highlighting the importance of incorporating directional reflectance corrections in the cross-calibration process.
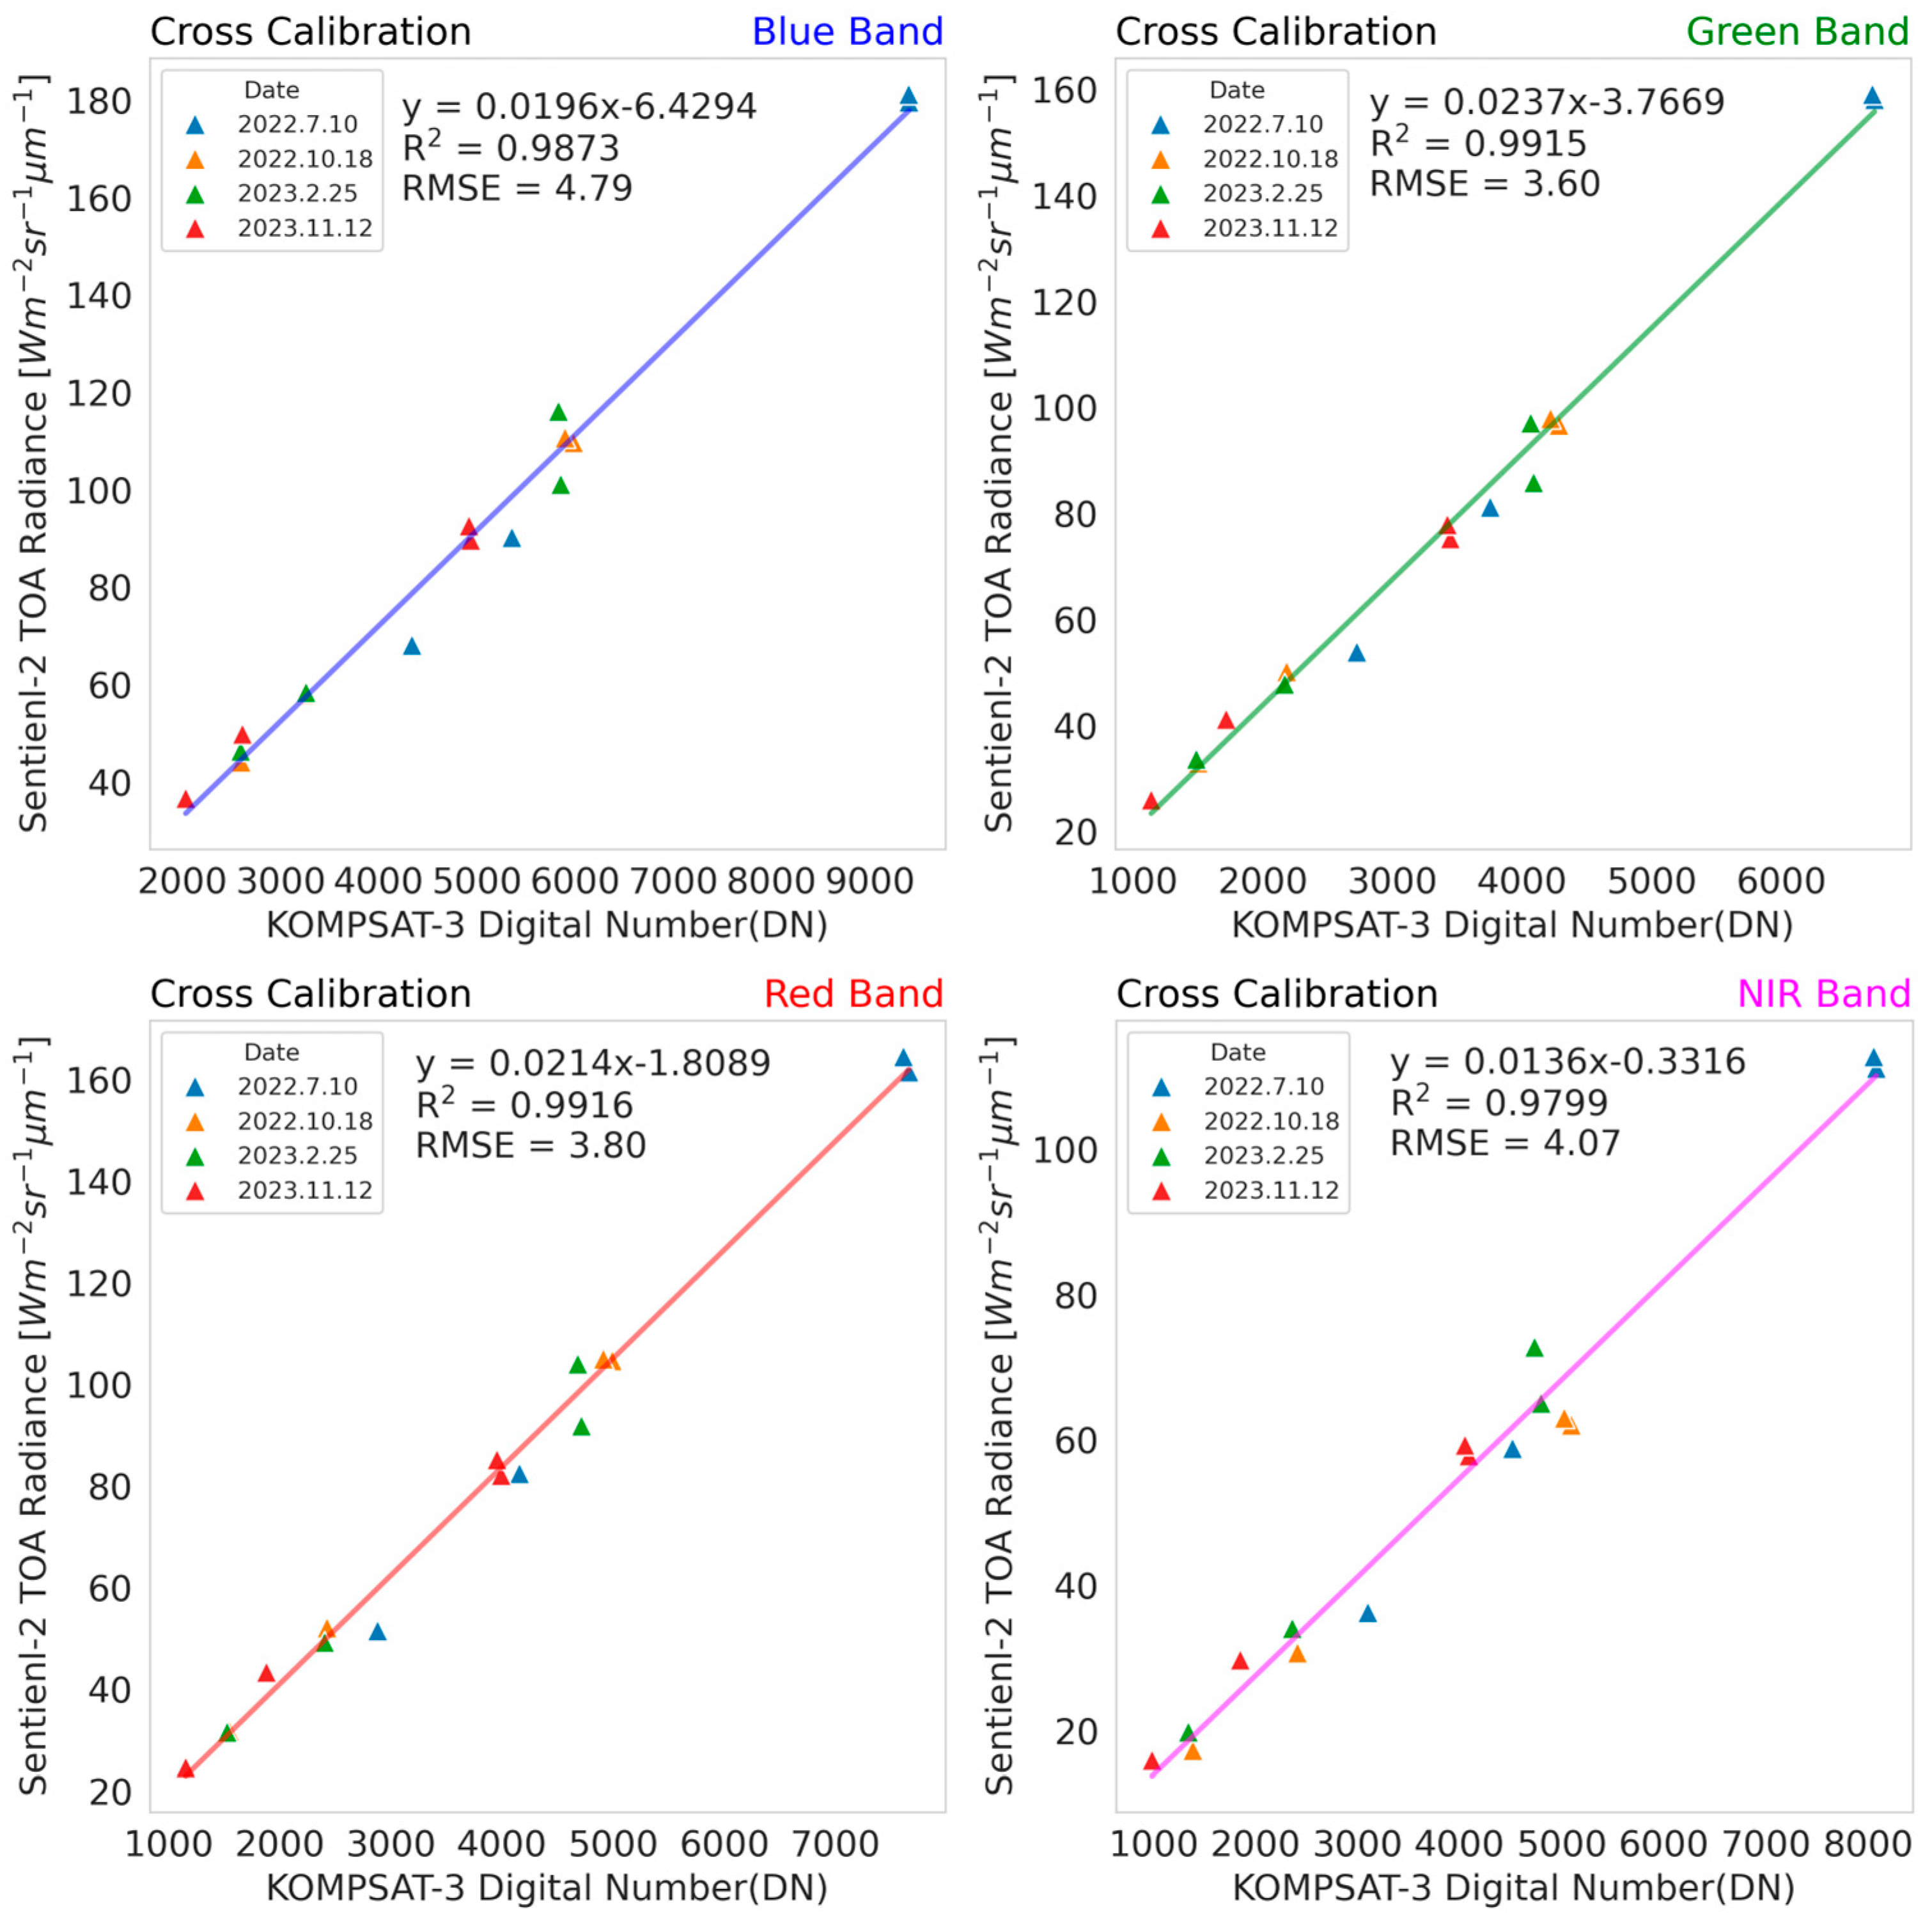
Figure 7 illustrates the cross-calibration results, illustrating the relationship between the DN values from KOMPSAT-3/AEISS and the corresponding TOA radiance values from Sentinel-2A/MSI. Calibration was performed for five dates, with the graph presenting the relationship for each spectral band: Blue, Green, Red, and NIR. The representation of each band by linear fit demonstrates how the DN values from KOMPSAT-3/AEISS correlate with the TOA radiance from Sentinel-2A/MSI. The equation of linear fit is y = ax + b, where “a” represents the gain, “b” represents the offset, and “x” is the DN value from KOMPSAT-3/AEISS. The y-value corresponds to the TOA radiance from Sentinel-2A/MSI. R2 values indicate how well results fit, and the high R2 values obtained suggest strong correlation between the DN values from KOMPSAT-3/AEISS and the TOA radiance from Sentinel-2A/MSI, confirming the effectiveness of the calibration and indicating that the two datasets are aligned and reliable.
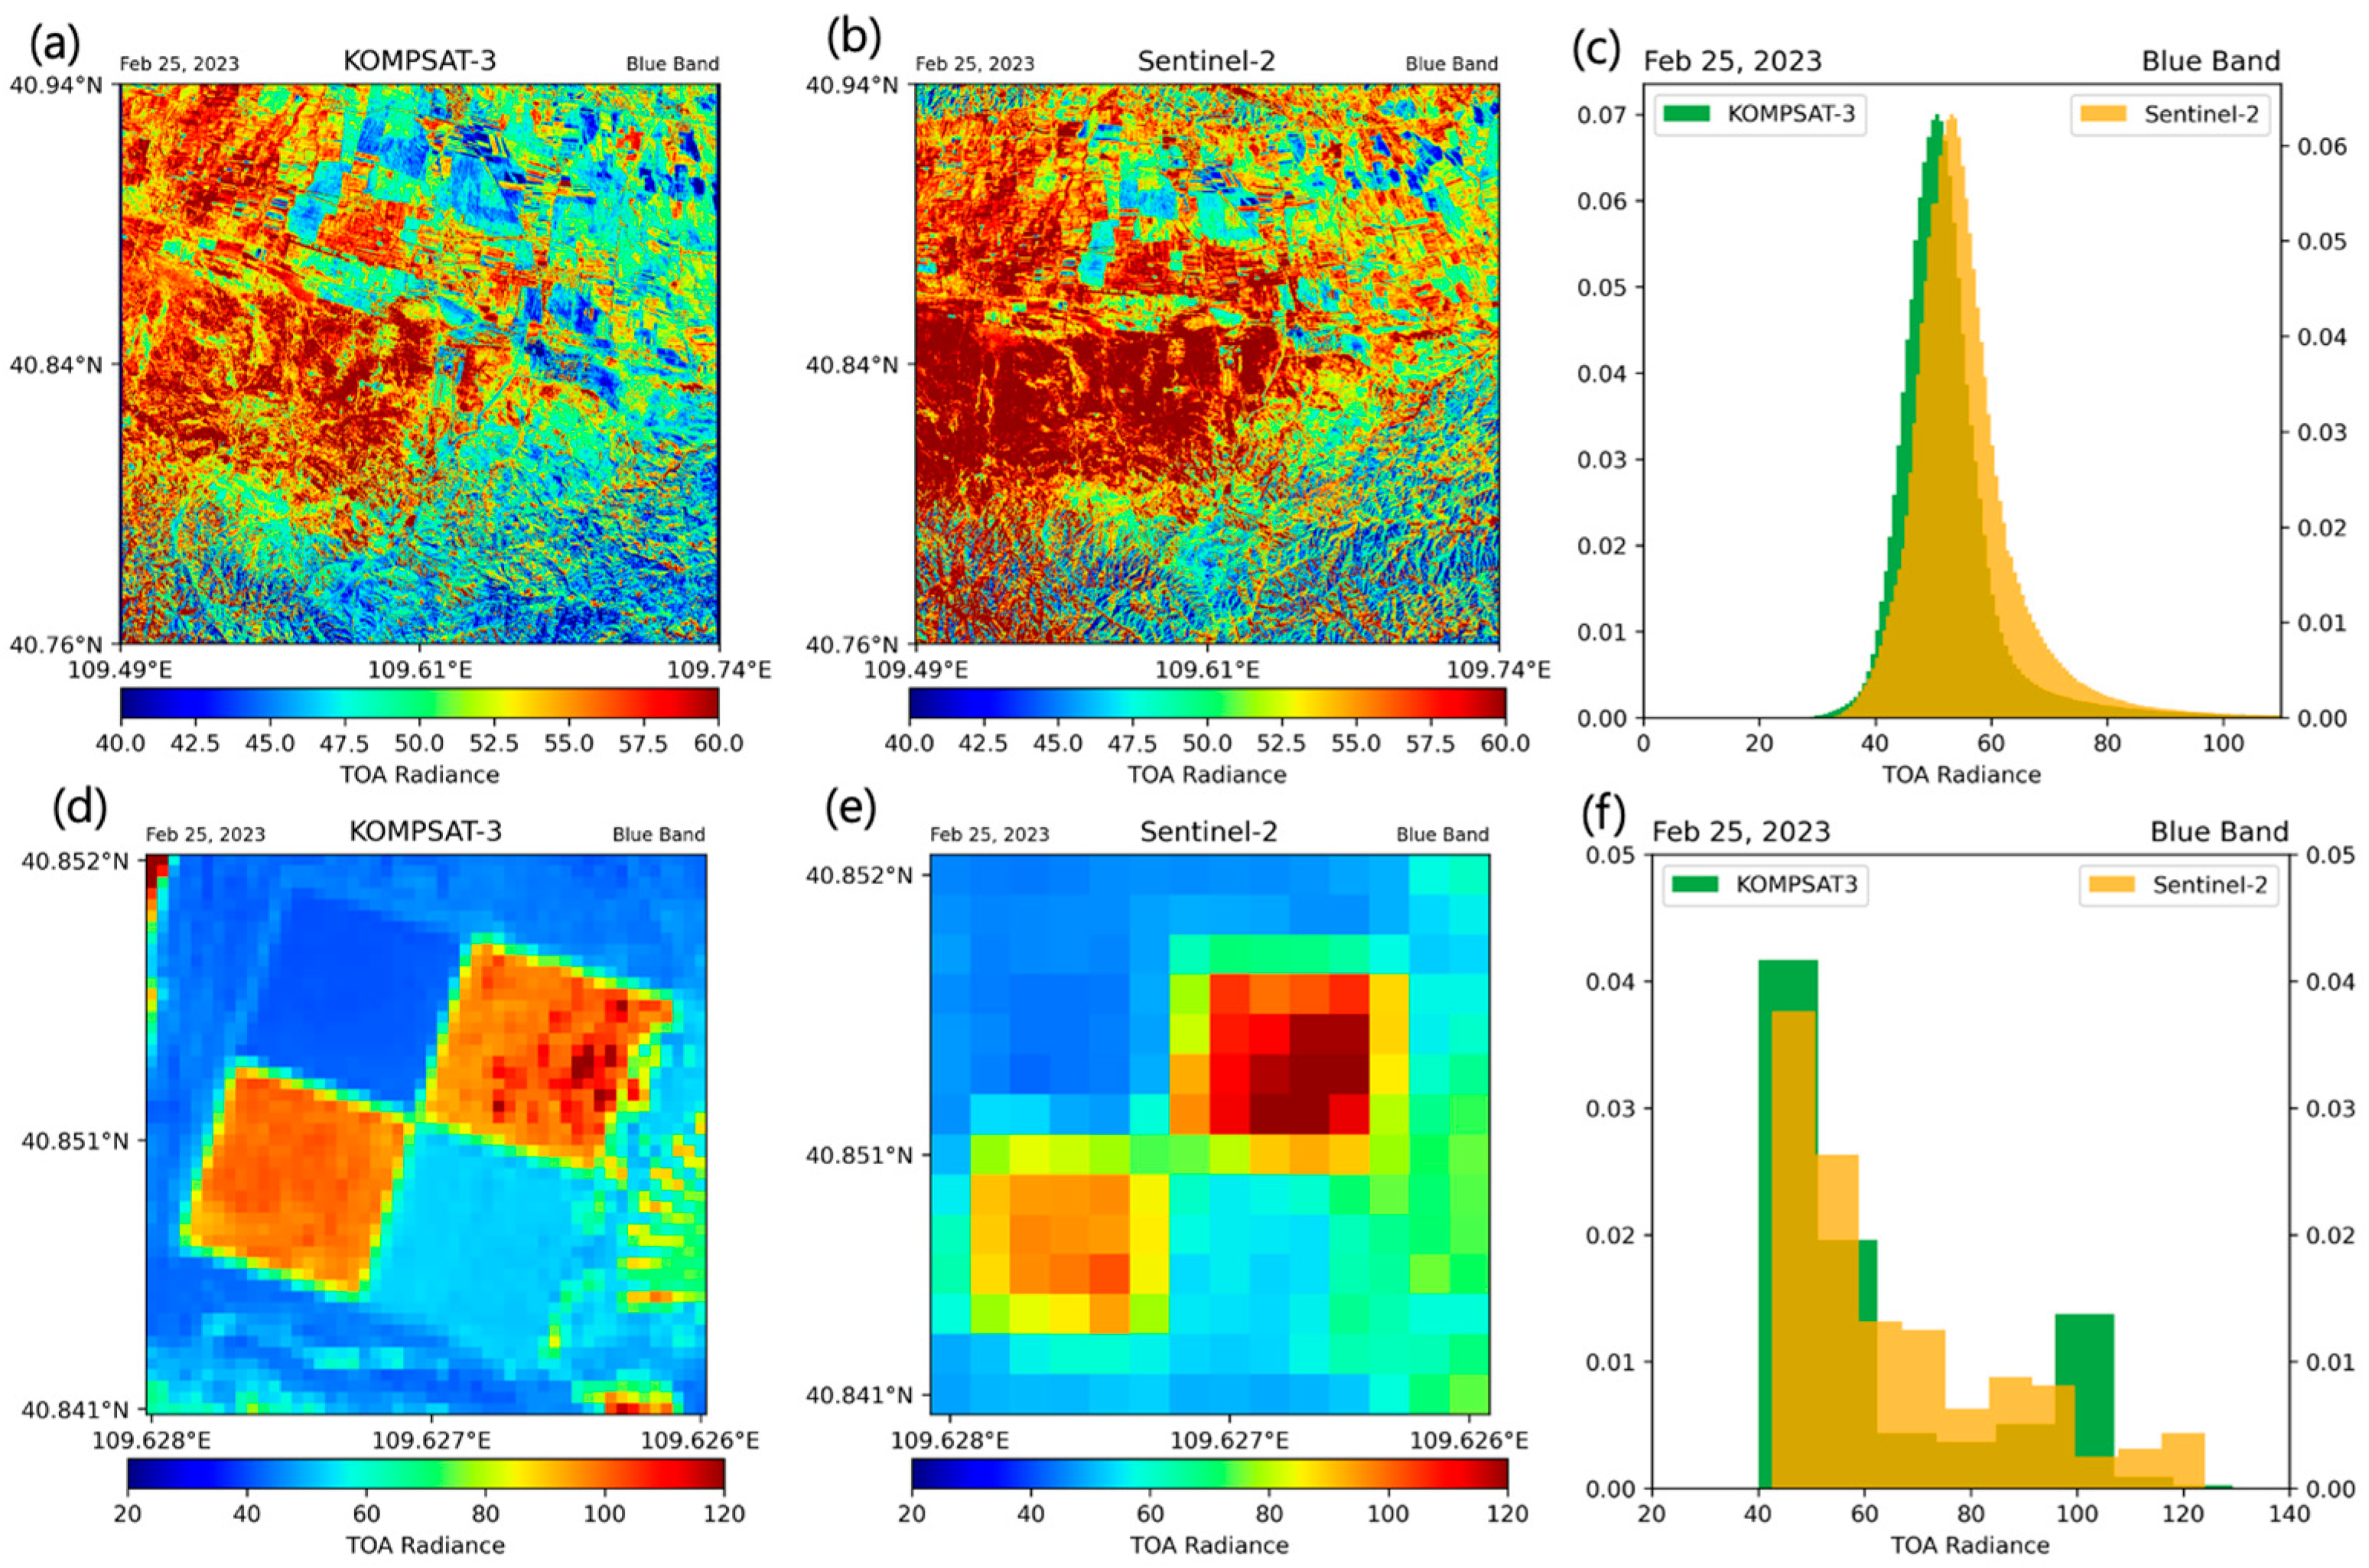
A detailed comparison of the TOA radiance values from KOMPSAT-3/AEISS and Sentinel-2A/MSI that uses the calibration coefficients (gain and offset) derived from Figure 7 is given in Figure 8. Panels (a), (b), and (c) show the TOA radiance and the spatial distribution of the TOA radiance measured by both satellites for the entire Baotou region on 25 February 2023, providing a visual comparison of the radiometric performances of KOMPSAT-3/AEISS and Sentinel-2A/MSI over the region. Panels (d), (e), and (f) focus on a smaller artificial target area within Baotou, where calibration was performed. The panels show the TOA radiances for both KOMPSAT-3/AEISS and Sentinel-2A/MSI within the artificial target region, which served as a reference for calibration. Zooming in on the artificial target area allows for a more detailed examination of the alignment of the radiometric data from both satellites, highlighting how well cross-calibration worked in this controlled setting. The histograms in panels (c) and (f) show the distribution of the TOA radiance values for the entire Baotou region and the artificial target area, respectively. These histograms help visualize the differences in the radiometric responses for KOMPSAT-3/AEISS and Sentinel-2A/MSI. The histograms for the artificial target area (Panel f) offer a focused comparison, demonstrating how effectively the gain and offset values derived from Figure 7 were applied to the target area. This result ensures that the calibration successfully reduced by discrepancies between the two datasets, resulting in more accurate and consistent radiometric data for further analyses.

3.2. Vicarious Calibration

In this section, we present the results of the vicarious calibration process conducted using KOMPSAT-3/AEISS data over the KARI field site on five different dates in 2023. Calibration was performed using field-based measurements of reflectance, AOD, WV, and O3, which were used together with satellite data to adjust the radiometric performance of KOMPSAT-3/AEISS, ensuring its consistency with the accurate ground-truth data.
The list of the key geometric parameters of the satellite images collected during the vicarious calibration process in Table 5 includes the “Overpass Time (UTC),” “Solar Zenith (°),” “Solar Azimuth (°),” “Viewing Zenith (°),” and “Viewing Azimuth (°)” for each of the five dates during the calibration period. These parameters are essential because they define the geometry of satellite observations, which significantly influence the radiometric measurements. Specifically, the solar zenith and azimuth angles describe the geometry of sunlight, whereas the viewing zenith and azimuth angles describe the satellite’s observation geometry, both of which affect the amount of atmospheric scattering and surface reflection captured by the sensor. The inclusion of these geometric parameters ensures that the calibration accounts for varying observation conditions during the five events, providing a foundation for understanding how these factors influence the radiometric response of a satellite and ensuring that the calibration coefficients derived are accurate.
For vicarious calibration, field-based measurements were collected using an ASD FieldSpec III spectroradiometer, providing precise reflectance data for the artificial targets at the KARI field site. Field-based reflectance measurements were used to simulate the TOA radiance values using the MODTRAN6 radiative transfer model. This simulation process accounts for atmospheric conditions including the AOD, WV, and O3, which were measured at the KARI site during calibration. The TOA radiance values, which were obtained using the MODTRAN6 model, were then compared with the DN obtained from KOMPSAT-3/AEISS, allowing determination of calibration coefficients (gain and offset) aligning the satellite data with the field-based measurements.
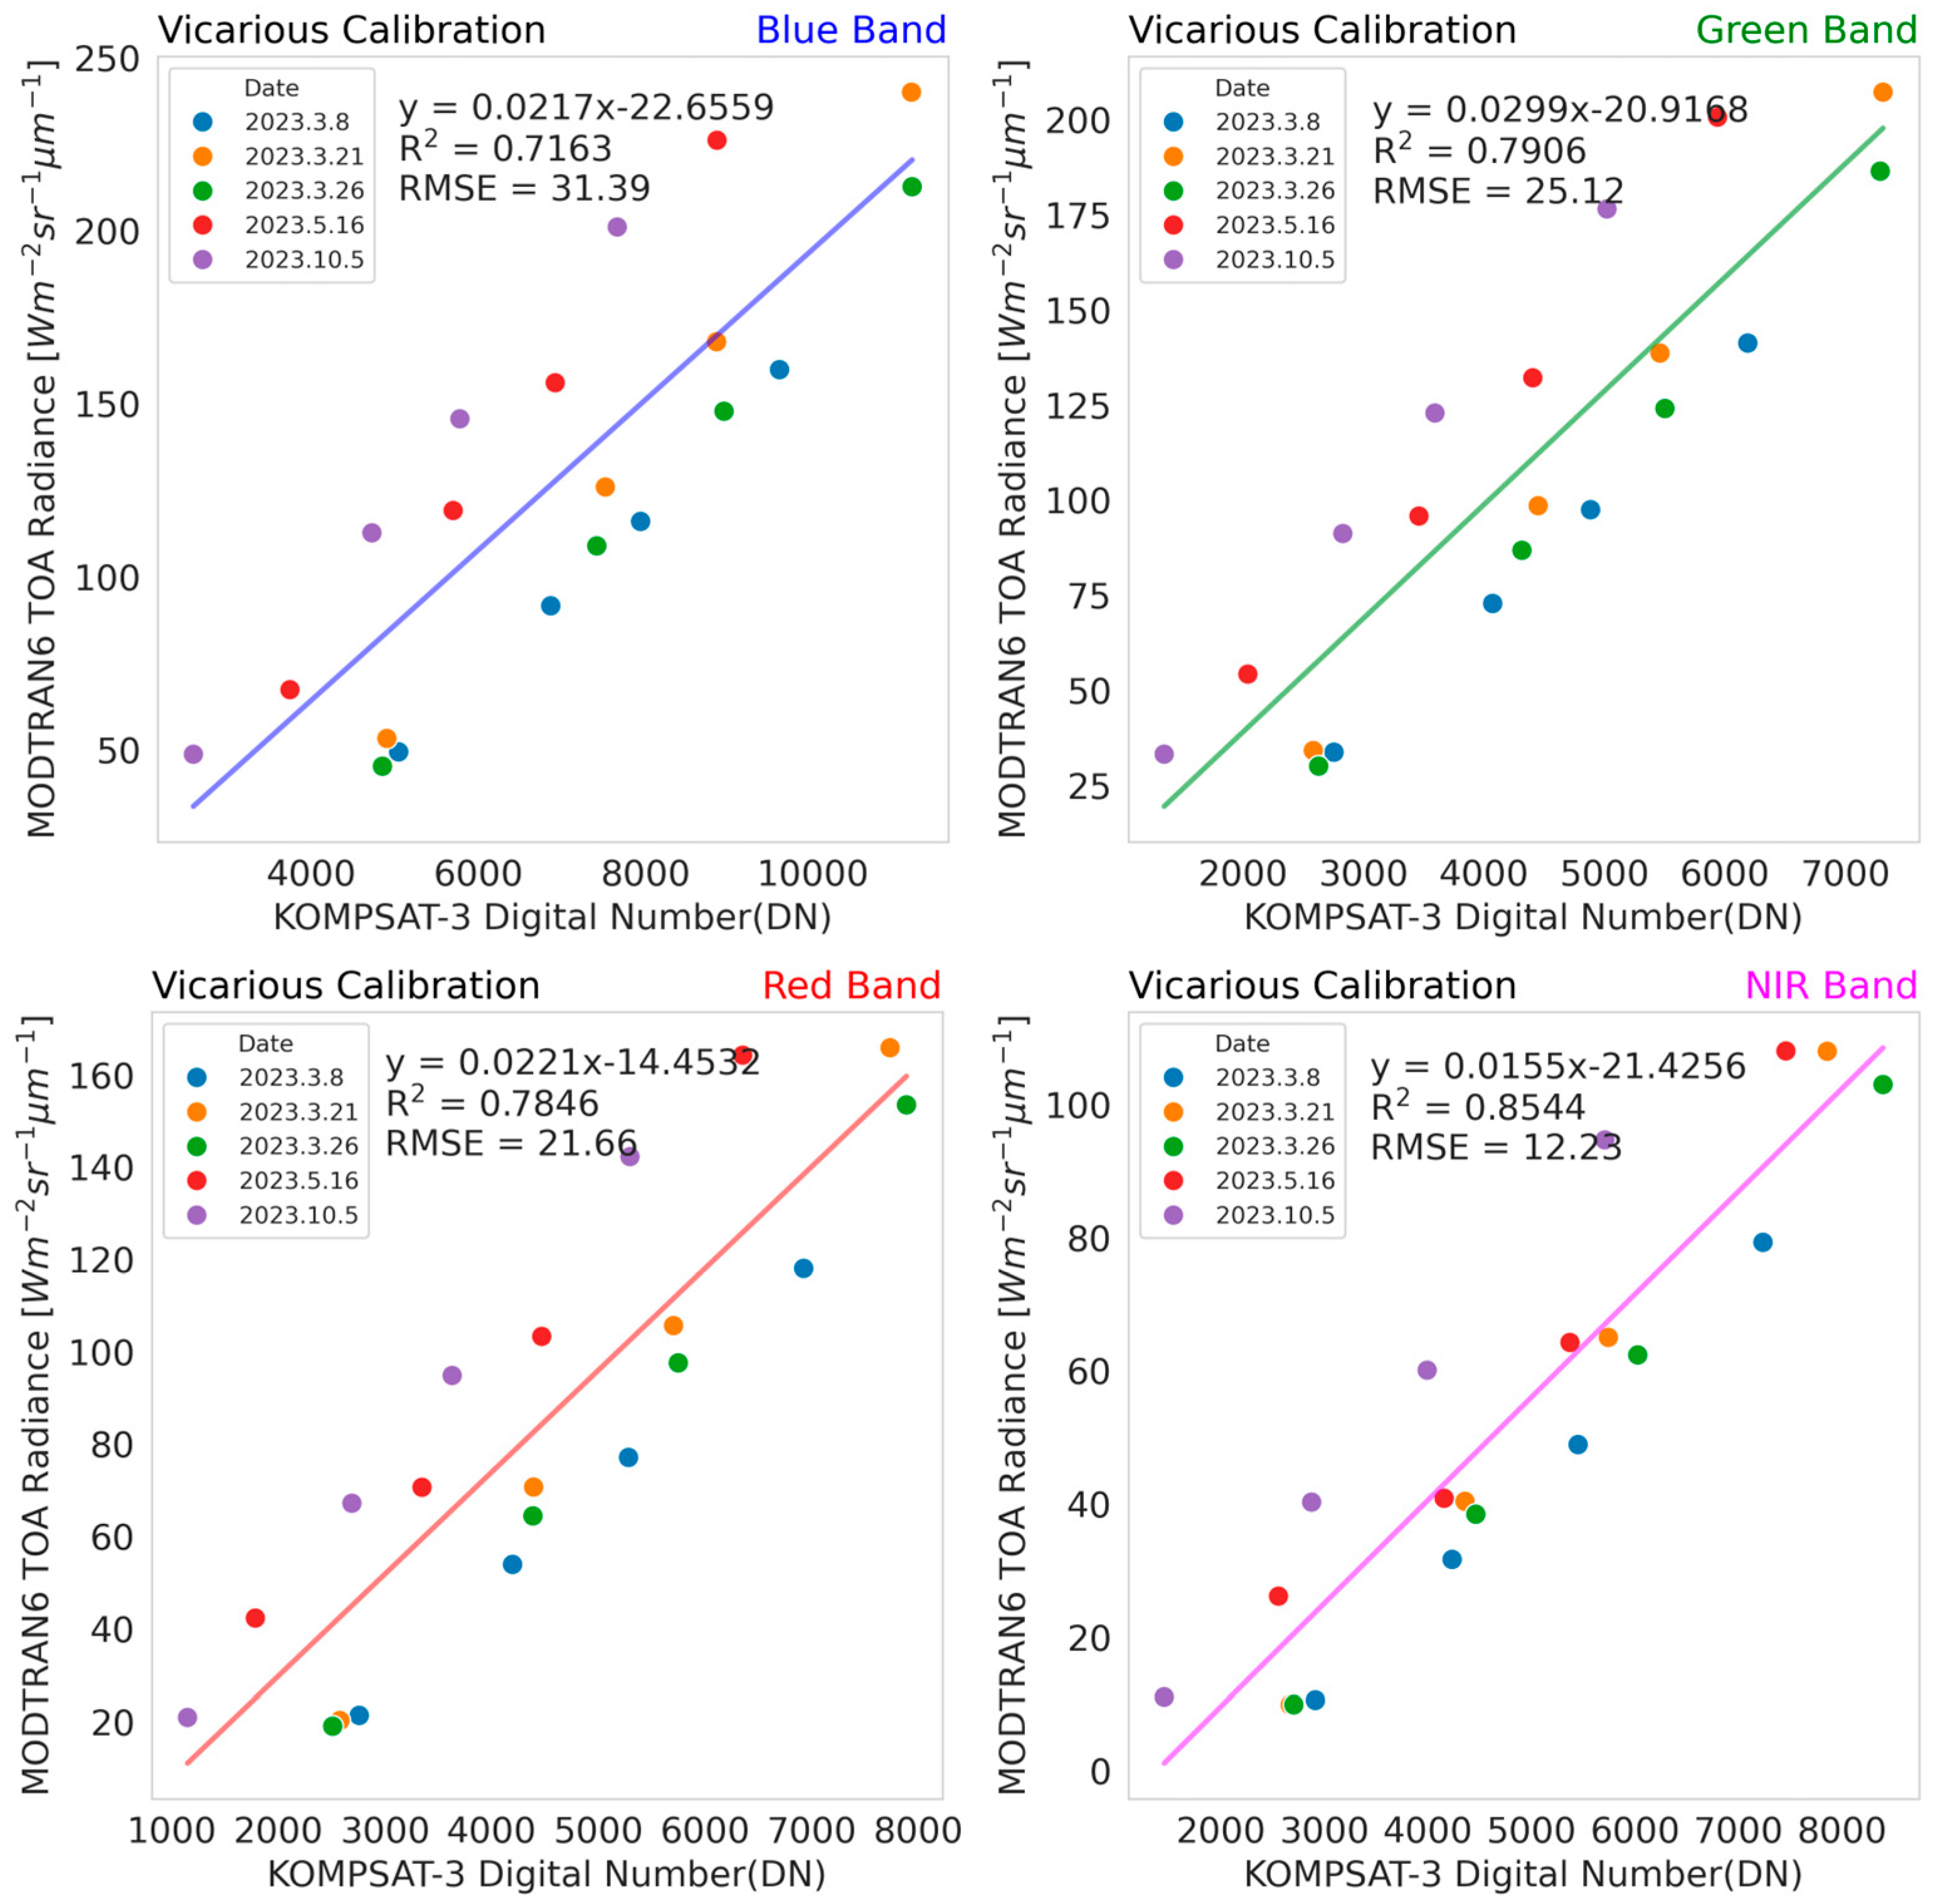
The results of the vicarious calibration in Figure 9 show the relationship between the DN and TOA radiance values derived from field-based measurements and simulated using MODTRAN6. The x-axis represents the DN values from KOMPSAT-3/AEISS, while the y-axis represents the TOA radiance values calculated using input data from the field measurements and MODTRAN6. Linear regression for each spectral band was used to obtain the gain and offset values that relate the KOMPSAT-3/AEISS DN values with the TOA radiance values. This relationship is essential for calibrating the radiometric measurements of the satellite and ensuring that they align with the actual physical radiance values. Comparing the field-based TOA radiance with the satellite DN values allowed us to refine the calibration coefficients and improve the accuracy and consistency of the radiometric data from KOMPSAT-3/AEISS. As seen in Figure 9, a strong linear relationship was observed between the DN values from KOMPSAT-3/AEISS and the TOA radiance values from MODTRAN6, indicating the effectiveness of the calibration process. The high R2 values observed for each spectral band in the calibration graphs demonstrate the successful alignment of the KOMPSAT-3/AEISS satellite data with ground-based measurements via calibration. By incorporating atmospheric parameters such as the AOD, WV, and O3 into the calibration process, vicarious calibration ensures that the atmospheric conditions at the time of the satellite overpass are considered, resulting in a more accurate radiometric performance adjustment for KOMPSAT-3/AEISS and allowing for more precise data comparison and integration with other satellite sensors, such as Sentinel-2A/MSI.

3.3. Validation

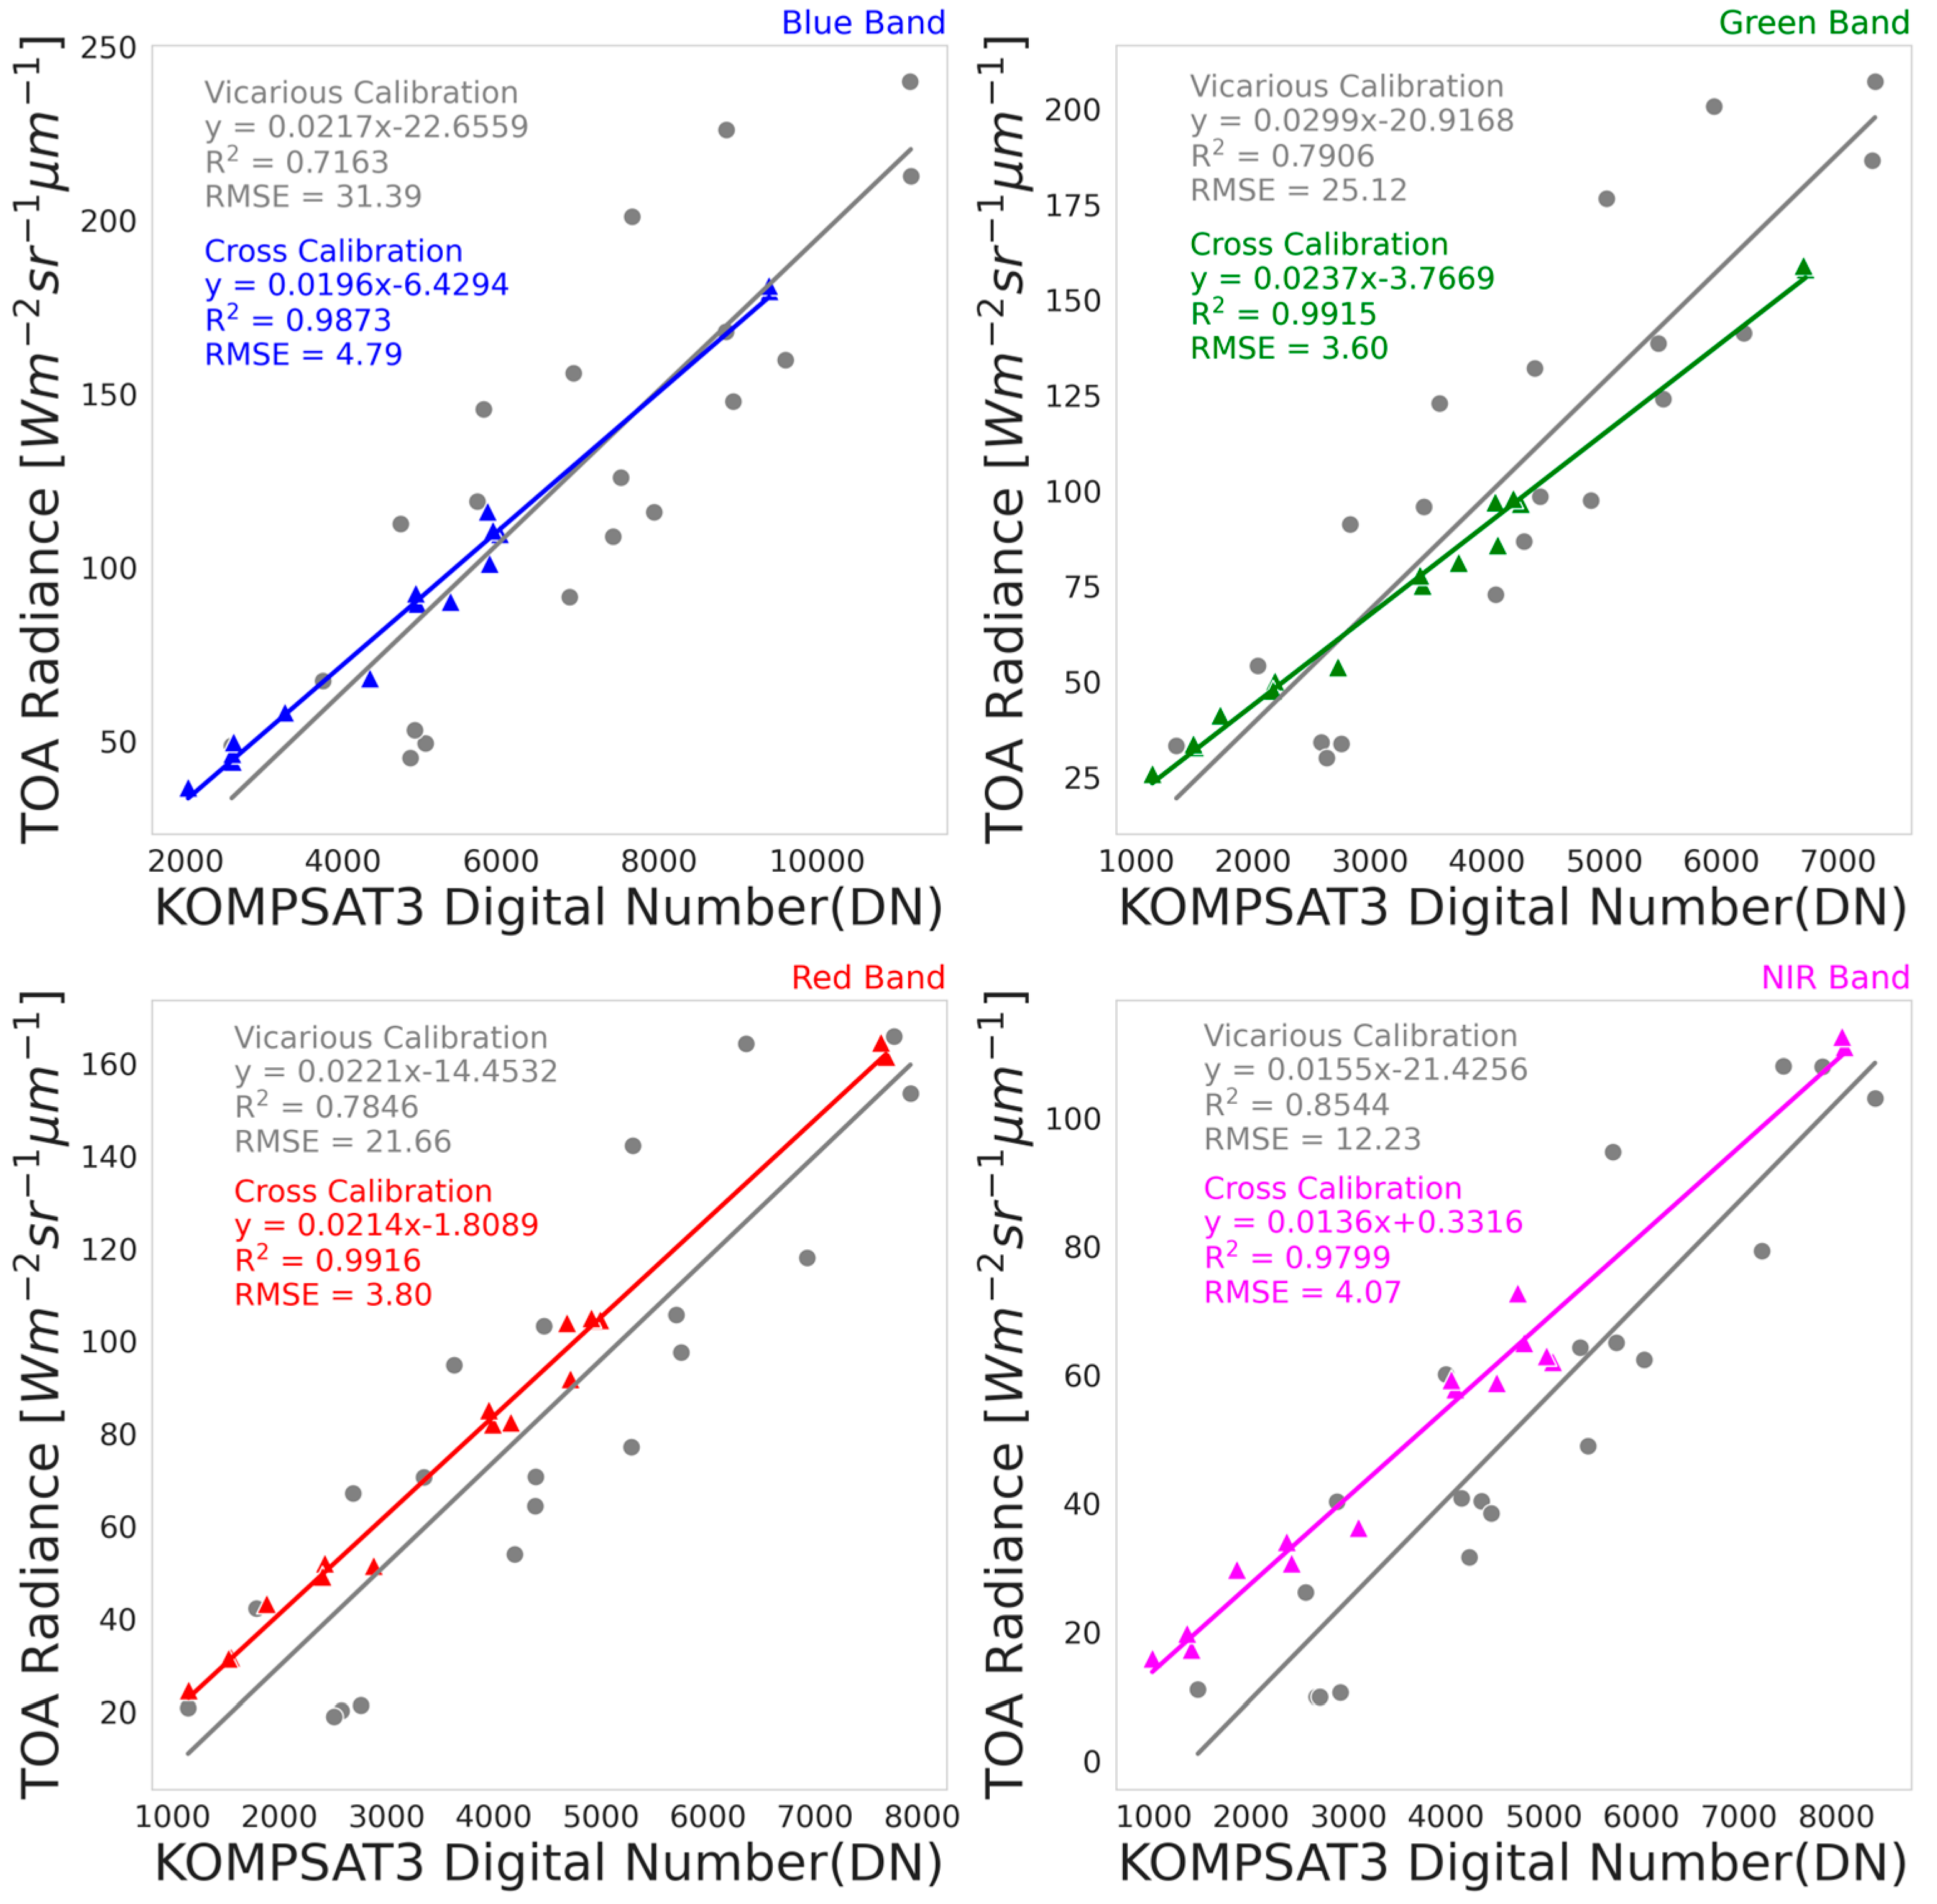
In this section, the results of the validation process are presented by comparing the outcomes of cross-calibration with those from vicarious calibration using the data shown in Figure 10, with the relationship between the DN obtained by KOMPSAT-3/AEISS and the corresponding TOA radiance values for each spectral band visually compared in the figure. The x-axis represents the DN values from KOMPSAT-3/AEISS and the y-axis represents the TOA radiance values.
Figure 10 presents, for each spectral band, the regression lines for both cross-calibration and vicarious calibration. Each fit is annotated with the linear equation, R2, and RMSE; the cross-calibration shows high R2 and low RMSE, indicating strong agreement with the reference and small errors. Using the gains and offsets from both methods to compare the high-reflectance portions of the Baotou artificial target, the differences were generally within ~5%.
The comparison between the two calibration methods demonstrates how well the DN values obtained from KOMPSAT-3/AEISS correspond with the TOA radiance values, while vicarious calibration provides a close fit using ground-based reflectance data and atmospheric simulation, and cross-calibration aligns the KOMPSAT-3/AEISS data with the TOA radiance measurements from Sentinel-2A/MSI. Both methods showed strong linear relationships; however, the different reference data used for calibration highlight the strengths of each approach in ensuring the consistency and reliability of KOMPSAT-3/AEISS ‘s radiometric performance.
This comparison was conducted against three prior studies (Ahn et al., 2017 [14]; Yeom et al., 2018 [13]; Jin et al., 2021 [24]), and as summarized in Table 6 and Table 7, the gain values were generally consistent across all spectral bands (Blue, Green, Red, NIR). For cross-calibration, the gains obtained in this study were 0.0196 (Blue), 0.0237 (Green), 0.0214 (Red), and 0.0136 (NIR); relative to Ahn et al. [14] (0.0177/0.0252/0.0214/0.0153) and Jin et al. [24] (0.0179/0.0255/0.0216/0.0130), the Blue band is slightly higher, the Green band is lower, the Red band is nearly identical, and the NIR band lies between the two studies. For vicarious calibration, the gains (0.0217/0.0299/0.0221/0.0155) are higher than Ahn et al. [14] but lower than Yeom et al. [13], placing our results in an intermediate range overall. Although small band-to-band differences arise due to acquisition-time atmospheric conditions (e.g., AOD), viewing–illumination geometry, SBAF/BRDF processing, and long-term sensor aging, all values remain within acceptable bounds, indicating that the radiometric performance of KOMPSAT-3/AEISS has been stably maintained even after more than a decade of operation.
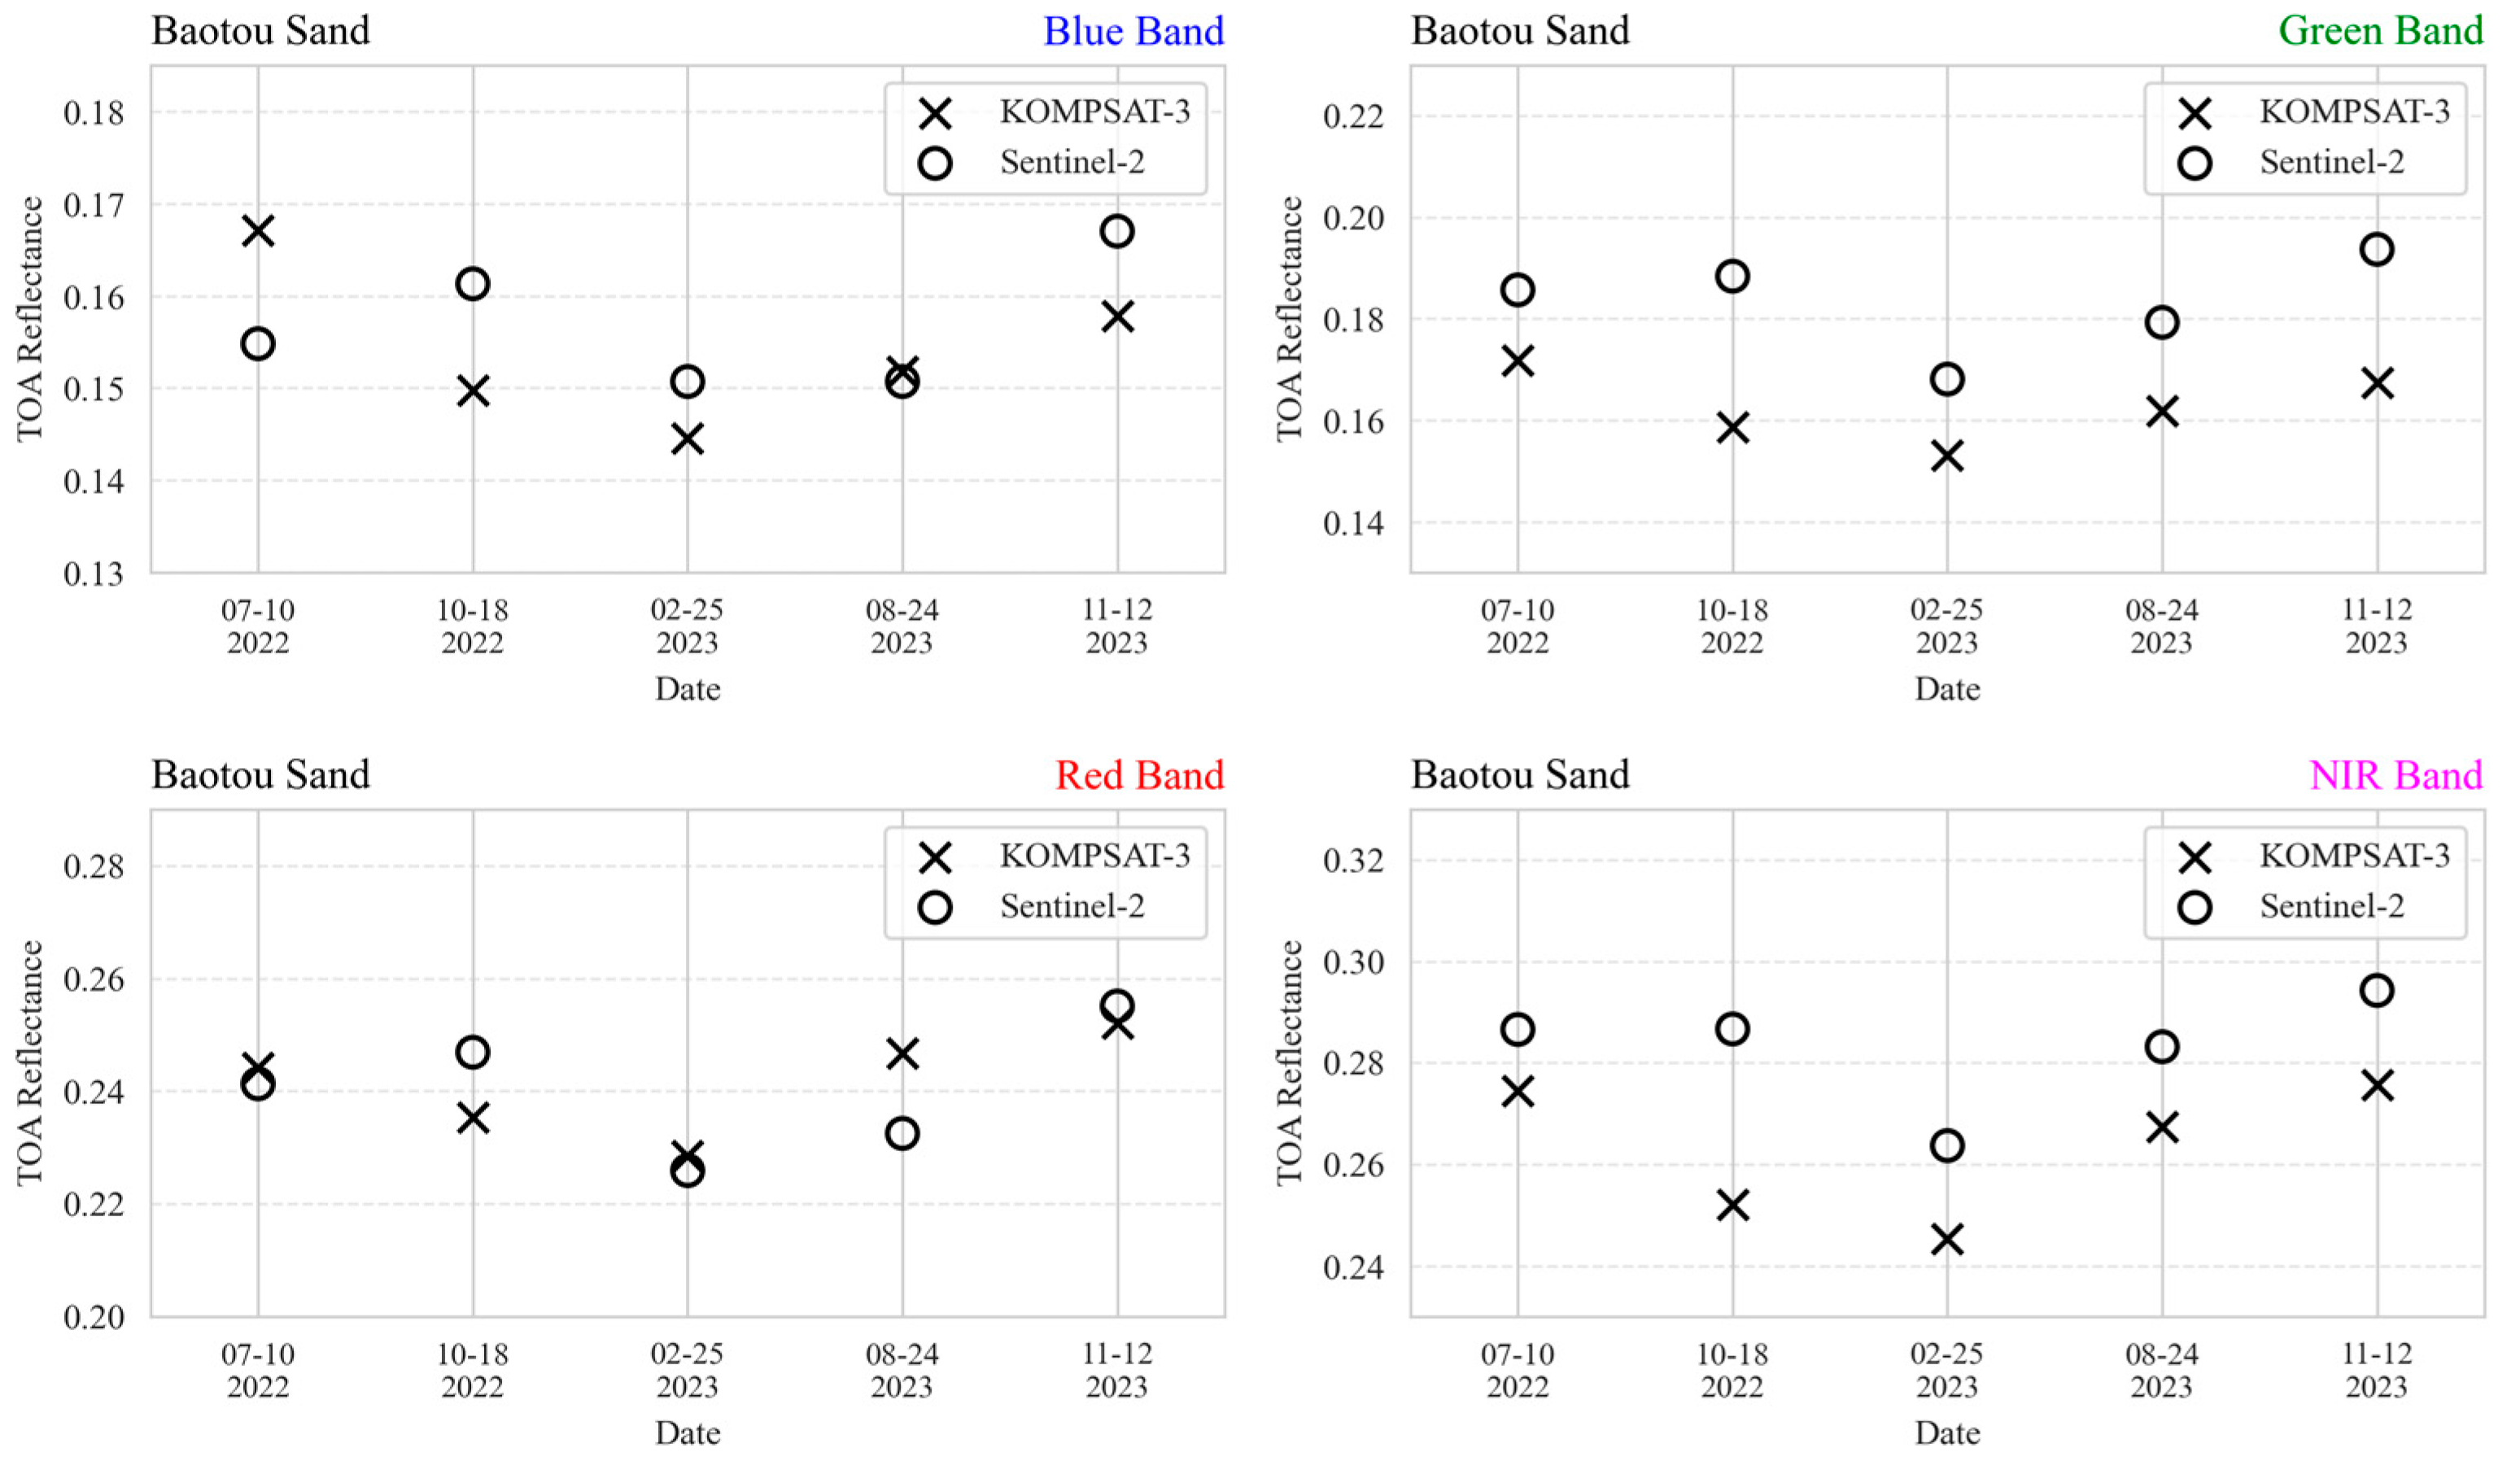
Band-specific gains derived from the cross-calibration were applied to convert KOMPSAT-3/AEISS DN to TOA reflectance over the Baotou Sand site (40.87°N, 109.62°E), and the results were compared with Sentinel-2A/MSI TOA reflectance acquired at the same times. Figure 11 illustrates the time series for the blue, green, red, and NIR bands across five acquisitions, while Table 8 summarizes the band-wise means ± standard deviations and the inter-sensor differences. The percentage differences were −1.77% (blue), −12.57% (green), +0.43% (red), and −7.56% (NIR). Excellent agreement within ±2% was achieved in the blue and red bands, whereas the green band exhibited the largest negative bias and the NIR band also showed a notable negative bias. These band-dependent discrepancies are attributed to the combined effects of atmospheric variability at acquisition (especially aerosol and water vapor) and the intrinsic uncertainties of absolute radiometric calibration. Nevertheless, the close agreement within a few percent in the key visible bands (blue and red) confirms the effectiveness of the SBAF + BRDF-based cross-calibration framework for validating the radiometric consistency of KOMPSAT-3/AEISS.

4. Conclusions

This study assessed the radiometric consistency of KOMPSAT-3/AEISS over Baotou scenes acquired in 2022–2023, derived band-specific calibration coefficients, compared them with prior post-launch results, and contrasted cross-calibration with vicarious calibration. To address this, cross-calibration and vicarious calibration methods were employed to validate and adjust the radiometric measurements of KOMPSAT-3/AEISS. By comparing KOMPSAT-3/AEISS data with Sentinel-2A/MSI, which has a well-established calibration framework, the study successfully mitigated the impact of degradation on radiometric performance. To address spectral discrepancies between KOMPSAT-3/AEISS and Sentinel-2A/MSI, the SBAF was calculated to minimize spectral uncertainties. During this process, atmospheric parameters such as AOD, WV, and O3, measured at the RadCalNet site, were used as input variables for MODTRAN6 to calculate the SBAF. In addition, BRDF correction was applied using the Ross–Li kernel model and MODIS MCD43A1 BRDF/albedo parameters to reduce angular reflectance effects due to differences in viewing and illumination geometry. This combined approach ensured robust corrections for both spectral and angular differences, improving the consistency and reliability of cross-calibration and vicarious calibration results. By incorporating site-specific atmospheric measurements, MODIS-based BRDF correction, and the SBAF, the results demonstrated improved radiometric consistency between KOMPSAT-3/AEISS and Sentinel-2A/MSI. These methods enhanced the reliability of the calibration results, further validating the robustness of the applied techniques and contributing to the overall confidence in the radiometric performance of the two sensors. The consideration of sensor degradation and uncertainties underscores the importance of ongoing post-launch calibration for long-operating satellite systems. This study highlights the value of cross-calibration in maintaining the precision and accuracy of satellite data, which is essential for applications such as environmental monitoring, land-use classification, and disaster management.

Author Contributions

Conceptualization, K.-W.J., D.-H.C., H.C. and Y.G.L.; Data curation, J.-H.C., K.-W.J., K.-B.C., Y.-H.J., K.-N.K., G.-B.K., H.-Y.S., J.-Y.L. and E.K.; Formal analysis, J.-H.C., K.-W.J., K.-B.C. and Y.G.L.; Funding acquisition, Y.G.L.; Investigation, D.-H.C., Y.-H.J., K.-N.K., G.-B.K., H.-Y.S., J.-Y.L. and E.K.; Methodology, J.-H.C., K.-W.J., K.-B.C. and Y.G.L.; Project administration, K.-W.J. and D.-H.C.; Resources, K.-W.J. and Y.-H.J.; Software, J.-H.C.; Supervision, Y.G.L.; Validation, J.-H.C.; Visualization, J.-H.C., K.-B.C. and H.C.; Writing—original draft, J.-H.C. and Y.G.L.; Writing—review & editing, H.C. and Y.G.L. All authors have read and agreed to the published version of the manuscript.

Funding

This research was conducted with the support of the “National Satellite Operation and Cal/Val infrastructure Advancement (RS-2023-00233889)” of the Korea Aerospace Administration.

Data Availability Statement

Data can be provided upon reasonable request to the corresponding author.

Conflicts of Interest

The authors declare no conflicts of interest.

References

  1. Baraldi, A. Impact of radiometric calibration and specifications of spaceborne optical imaging sensors on the development of operational automatic remote sensing image understanding systems. IEEE J. Sel. Top. Appl. Earth Obs. Remote Sens. 2009, 2, 104–134. [Google Scholar] [CrossRef]
  2. Chander, G.; Hewison, T.J.; Fox, N.; Wu, X.; Xiong, X.; Blackwell, W.J. Overview of intercalibration of satellite instruments. IEEE Trans. Geosci. Remote Sens. 2013, 51, 1056–1080. [Google Scholar] [CrossRef]
  3. Kabir, S.; Leigh, L.; Helder, D. Vicarious methodologies to assess and improve the quality of the optical remote sensing images: A critical review. Remote Sens. 2020, 12, 4029. [Google Scholar] [CrossRef]
  4. Khakurel, P.; Leigh, L.; Kaewmanee, M.; Pinto, C.T. Extended pseudo invariant calibration site-based trend-to-trend cross-calibration of optical satellite sensors. Remote Sens. 2021, 13, 1545. [Google Scholar] [CrossRef]
  5. Chen, Z.; Zhang, B.; Zhang, H.; Zhang, W. Vicarious calibration of Beijing-1 multispectral imagers. Remote Sens. 2014, 6, 1432–1450. [Google Scholar] [CrossRef]
  6. Datla, R.; Rice, J.P.; Lykke, K.R.; Johnson, B.C.; Butler, J.J.; Xiong, X. Best practice guidelines for pre-launch characterization and calibration of instruments for passive optical remote sensing. J. Res. Natl. Inst. Stand. Technol. 2011, 116, 621. [Google Scholar] [CrossRef] [PubMed]
  7. Chander, G.; Meyer, D.J.; Helder, D.L. Cross calibration of the Landsat-7 ETM+ and EO-1 ALI sensor. IEEE Trans. Geosci. Remote Sens. 2004, 42, 2821–2831. [Google Scholar] [CrossRef]
  8. Chander, G.; Mishra, N.; Helder, D.L.; Aaron, D.B.; Angal, A.; Choi, T.; Xiong, X.; Doelling, D.R. Applications of spectral band adjustment factors (SBAF) for cross-calibration. IEEE Trans. Geosci. Remote Sens. 2012, 51, 1267–1281. [Google Scholar] [CrossRef]
  9. Li, S.; Ganguly, S.; Dungan, J.L.; Wang, W.; Nemani, R.R. Sentinel-2 MSI radiometric characterization and cross-calibration with Landsat-8 OLI. Adv. Remote Sens. 2017, 6, 147. [Google Scholar] [CrossRef]
  10. Barsi, J.A.; Alhammoud, B.; Czapla-Myers, J.; Gascon, F.; Haque, M.O.; Kaewmanee, M.; Leigh, L.; Markham, B.L. Sentinel-2A MSI and Landsat-8 OLI radiometric cross comparison over desert sites. Eur. J. Remote Sens. 2018, 51, 822–837. [Google Scholar] [CrossRef]
  11. Dong, J.; Chen, Y.; Chen, X.; Xu, Q. Radiometric Cross-Calibration of Wide-Field-of-View Cameras Based on Gaofen-1/6 Satellite Synergistic Observations Using Landsat-8 Operational Land Imager Images: A Solution for Off-Nadir Wide-Field-of-View Associated Problems. Remote Sens. 2023, 15, 3851. [Google Scholar] [CrossRef]
  12. Li, X.; Strahler, A.H. Geometric-optical bidirectional reflectance modeling of the discrete crown vegetation canopy: Effect of crown shape and mutual shadowing. IEEE Trans. Geosci. Remote Sens. 1992, 30, 276–292. [Google Scholar] [CrossRef]
  13. Yeom, J.-M.; Ko, J.; Hwang, J.; Lee, C.-S.; Choi, C.-U.; Jeong, S. Updating absolute radiometric characteristics for KOMPSAT-3 and KOMPSAT-3A multispectral imaging sensors using well-characterized pseudo-invariant tarps and microtops II. Remote Sens. 2018, 10, 697. [Google Scholar] [CrossRef]
  14. Ahn, H.; Shin, D.; Lee, S.; Choi, C. Absolute Radiometric Calibration for KOMPSAT-3 AEISS and Cross Calibration Using Landsat-8 OLI. J. Korean Soc. Surv. Geod. Photogramm. Cartogr. 2017, 35, 291–302. [Google Scholar]
  15. Jin, C.; Ahn, H.; Seo, D.; Choi, C. Radiometric calibration and uncertainty analysis of KOMPSAT-3A using the reflectance-based method. Sensors 2020, 20, 2564. [Google Scholar] [CrossRef]
  16. Ma, L.; Zhao, Y.; Woolliams, E.R.; Dai, C.; Wang, N.; Liu, Y.; Li, L.; Wang, X.; Gao, C.; Li, C. Uncertainty analysis for RadCalNet instrumented test sites using the Baotou sites BTCN and BSCN as examples. Remote Sens. 2020, 12, 1696. [Google Scholar] [CrossRef]
  17. Han, J.; Tao, Z.; Xie, Y.; Li, H.; Yi, H.; Guan, X. Validation of the TOA products of the baotou sandy site with Landsat8/OLI considering BRDF correction. IEEE Trans. Geosci. Remote Sens. 2023, 61, 5401611. [Google Scholar] [CrossRef]
  18. Jing, X.; Leigh, L.; Helder, D.; Pinto, C.T.; Aaron, D. Lifetime absolute calibration of the EO-1 Hyperion sensor and its validation. IEEE Trans. Geosci. Remote Sens. 2019, 57, 9466–9475. [Google Scholar] [CrossRef]
  19. Jeon, M.-J.; Lee, S.-R.; Kim, E.; Lim, S.-B.; Choi, S.-W. Launch and early operation results of KOMPSAT-3A. In Proceedings of the 14th International Conference on Space Operations, Daejeon, Republic of Korea, 16–20 May 2016; p. 2394. [Google Scholar]
  20. Lee, S.-J.; Lee, Y.-W. Detection of wildfire-damaged areas using kompsat-3 image: A case of the 2019 unbong mountain fire in busan, South Korea. Korean J. Remote Sens. 2020, 36, 29–39. [Google Scholar]
  21. Lee, K.-J.; Chae, T.-B.; Jung, H.-S. Earth observation from KOMPSAT optical, thermal, and radar satellite images. Remote. Sens. 2021, 13, 139. [Google Scholar] [CrossRef]
  22. Che, X.; Feng, M.; Sexton, J.O.; Channan, S.; Yang, Y.; Sun, Q. Assessment of MODIS BRDF/Albedo model parameters (MCD43A1 Collection 6) for directional reflectance retrieval. Remote Sens. 2017, 9, 1123. [Google Scholar] [CrossRef]
  23. Spurr, R.J. A new approach to the retrieval of surface properties from earthshine measurements. J. Quant. Spectrosc. Radiat. Transf. 2004, 83, 15–46. [Google Scholar] [CrossRef]
  24. Jin, C.; Choi, C. The assessment of cross calibration/validation accuracy for KOMPSAT-3 using Landsat 8 and 6S. Korean J. Remote Sens. 2021, 37, 123–137. [Google Scholar]
  25. Zhang, J.; Zhou, X.; Liu, X.; Wang, X.; He, G.; Zhang, Y. Harmonizing Landsat-8 OLI and Sentinel-2 MSI: An assessment of surface reflectance and vegetation index consistency. Int. J. Digit. Earth 2025, 18, 2484667. [Google Scholar] [CrossRef]
  26. Lima, T.M.; Martins, V.S.; Paulino, R.S.; Caballero, C.B.; Maciel, D.A.; Giardino, C. A general spectral bandpass adjustment function (SBAF) for harmonizing landsat-sentinel over inland and coastal waters. Sci. Remote Sens. 2025, 11, 100225. [Google Scholar] [CrossRef]
  27. Yeom, J.-M.; Hwang, J.; Jin, C.-G.; Lee, D.-H.; Han, K.-S. Radiometric characteristics of KOMPSAT-3 multispectral images using the spectra of well-known surface tarps. IEEE Trans. Geosci. Remote Sens. 2016, 54, 5914–5924. [Google Scholar] [CrossRef]
  28. Drusch, M.; Del Bello, U.; Carlier, S.; Colin, O.; Fernandez, V.; Gascon, F.; Hoersch, B.; Isola, C.; Laberinti, P.; Martimort, P. Sentinel-2: ESA’s optical high-resolution mission for GMES operational services. Remote Sens. Environ. 2012, 120, 25–36. [Google Scholar] [CrossRef]
  29. Transon, J.; d’Andrimont, R.; Maugnard, A.; Defourny, P. Survey of hyperspectral earth observation applications from space in the sentinel-2 context. Remote Sens. 2018, 10, 157. [Google Scholar] [CrossRef]
  30. Pahlevan, N.; Sarkar, S.; Franz, B.A.; Balasubramanian, S.V.; He, J. Sentinel-2 MultiSpectral Instrument (MSI) data processing for aquatic science applications: Demonstrations and validations. Remote Sens. Environ. 2017, 201, 47–56. [Google Scholar] [CrossRef]
  31. Kuc, G.; Chormański, J. Sentinel-2 imagery for mapping and monitoring imperviousness in urban areas. Int. Arch. Photogramm. Remote Sens. Spat. Inf. Sci. 2019, 42, 43–47. [Google Scholar] [CrossRef]
  32. Phiri, D.; Simwanda, M.; Salekin, S.; Nyirenda, V.R.; Murayama, Y.; Ranagalage, M. Sentinel-2 data for land cover/use mapping: A review. Remote Sens. 2020, 12, 2291. [Google Scholar] [CrossRef]
  33. Kudela, R.M.; Hooker, S.B.; Houskeeper, H.F.; McPherson, M. The influence of signal to noise ratio of legacy airborne and satellite sensors for simulating next-generation coastal and inland water products. Remote Sens. 2019, 11, 2071. [Google Scholar] [CrossRef]
  34. Thome, K.J.; Biggar, S.F.; Wisniewski, W. Cross comparison of EO-1 sensors and other Earth resources sensors to Landsat-7 ETM+ using Railroad Valley Playa. IEEE Trans. Geosci. Remote Sens. 2003, 41, 1180–1188. [Google Scholar] [CrossRef]
  35. Marcq, S.; Meygret, A.; Bouvet, M.; Fox, N.; Greenwell, C.; Scott, B.; Berthelot, B.; Besson, B.; Guilleminot, N.; Damiri, B. New RadCalNet site at Gobabeb, Namibia: Installation of the instrumentation and first satellite calibration results. In Proceedings of the IGARSS 2018—2018 IEEE International Geoscience and Remote Sensing Symposium, Valencia, Spain, 22–27 July 2018; pp. 6444–6447. [Google Scholar]
  36. Kneubühler, M.; Schaepman, M.E.; Thome, K.; Danesy, D. Long-term vicarious calibration efforts of MERIS at railroad valley playa (NV)-An update. In ESA-SP; online; European Space Agency: Paris, France, 2006. [Google Scholar]
  37. Kuze, A.; O’Brien, D.M.; Taylor, T.E.; Day, J.O.; O’Dell, C.W.; Kataoka, F.; Yoshida, M.; Mitomi, Y.; Bruegge, C.J.; Pollock, H. Vicarious calibration of the GOSAT sensors using the Railroad Valley desert playa. IEEE Trans. Geosci. Remote Sens. 2010, 49, 1781–1795. [Google Scholar] [CrossRef]
  38. Scott, K.P.; Thome, K.J.; Brownlee, M.R. Evaluation of Railroad Valley playa for use in vicarious calibration. In Multispectral Imaging for Terrestrial Applications; SPIE—The International Society for Optical Engineering: Bellingham, WA, USA, 1996; pp. 158–166. [Google Scholar]
  39. Göttsche, F.-M.; Olesen, F.-S.; Bork-Unkelbach, A. Validation of land surface temperature derived from MSG/SEVIRI with in situ measurements at Gobabeb, Namibia. Int. J. Remote Sens. 2013, 34, 3069–3083. [Google Scholar] [CrossRef]
  40. Marcq, S.; Meygret, A.; Bialek, A.; Greenwell, C.; Scott, B.; Fox, N.; Bouvet, M.; Berthelot, B.; Damiri, B. New RadCalNet Instrumented Site at Gobabeb, Namibia: Installation Field Campaign and First Absolute Calibration Results. 2017. Available online: https://digitalcommons.usu.edu/calcon/CALCON2017/All2017Content/5/ (accessed on 19 September 2025).
  41. Jin, Y.; Schaaf, C.B.; Gao, F.; Li, X.; Strahler, A.H.; Lucht, W.; Liang, S. Consistency of MODIS surface bidirectional reflectance distribution function and albedo retrievals: 1. Algorithm performance. J. Geophys. Res. Atmos. 2003, 108. [Google Scholar] [CrossRef]
  42. Strahler, A.H.; Muller, J.; Lucht, W.; Schaaf, C.; Tsang, T.; Gao, F.; Li, X.; Lewis, P.; Barnsley, M.J. MODIS BRDF/albedo product: Algorithm theoretical basis document version 5.0. MODIS Doc. 1999, 23, 42–47. [Google Scholar]
  43. Ju, J.; Roy, D.P.; Shuai, Y.; Schaaf, C. Development of an approach for generation of temporally complete daily nadir MODIS reflectance time series. Remote Sens. Environ. 2010, 114, 1–20. [Google Scholar] [CrossRef]
  44. Schaaf, C.B.; Gao, F.; Strahler, A.H.; Lucht, W.; Li, X.; Tsang, T.; Strugnell, N.C.; Zhang, X.; Jin, Y.; Muller, J.-P. First operational BRDF, albedo nadir reflectance products from MODIS. Remote Sens. Environ. 2002, 83, 135–148. [Google Scholar] [CrossRef]
  45. Feng, L.; Li, J.; Gong, W.; Zhao, X.; Chen, X.; Pang, X. Radiometric cross-calibration of Gaofen-1 WFV cameras using Landsat-8 OLI images: A solution for large view angle associated problems. Remote Sens. Environ. 2016, 174, 56–68. [Google Scholar] [CrossRef]
  46. Farhad, M.M.; Kaewmanee, M.; Leigh, L.; Helder, D. Radiometric cross calibration and validation using 4 angle BRDF model between landsat 8 and sentinel 2A. Remote Sens. 2020, 12, 806. [Google Scholar] [CrossRef]
  47. Pan, Z.; Zhang, H.; Min, X.; Xu, Z. Vicarious calibration correction of large FOV sensor using BRDF model based on UAV angular spectrum measurements. J. Appl. Remote Sens. 2020, 14, 027501. [Google Scholar] [CrossRef]
  48. Zhong, B.; Ma, Y.; Yang, A.; Wu, J. Radiometric performance evaluation of FY-4A/AGRI based on Aqua/MODIS. Sensors 2021, 21, 1859. [Google Scholar] [CrossRef] [PubMed]
  49. Bouvet, M.; Thome, K.; Berthelot, B.; Bialek, A.; Czapla-Myers, J.; Fox, N.P.; Goryl, P.; Henry, P.; Ma, L.; Marcq, S. RadCalNet: A radiometric calibration network for Earth observing imagers operating in the visible to shortwave infrared spectral range. Remote Sens. 2019, 11, 2401. [Google Scholar] [CrossRef]
  50. Liu, L.; Shi, T.; Gao, H.; Zhang, X.; Han, Q.; Hu, X. Long-term cross calibration of HJ-1A CCD1 and Terra MODIS reflective solar bands. Sci. Rep. 2021, 11, 7386. [Google Scholar] [CrossRef]
  51. Jin, Y.; Schaaf, C.B.; Woodcock, C.E.; Gao, F.; Li, X.; Strahler, A.H.; Lucht, W.; Liang, S. Consistency of MODIS surface bidirectional reflectance distribution function and albedo retrievals: 2. Validation. J. Geophys. Res. Atmos. 2003, 108. [Google Scholar] [CrossRef]
  52. Ding, A.; Jiao, Z.; Zhang, X.; Dong, Y.; Kokhanovsky, A.A.; Guo, J.; Jiang, H. A practical approach to improve the MODIS MCD43A products in snow-covered areas. J. Remote Sens. 2023, 3, 0057. [Google Scholar] [CrossRef]
  53. Berk, A.; Hawes, F. Validation of MODTRAN® 6 and its line-by-line algorithm. J. Quant. Spectrosc. Radiat. Transf. 2017, 203, 542–556. [Google Scholar] [CrossRef]
  54. Berk, A.; Anderson, G.; Acharya, P.; Shettle, E. MODTRAN5: A Reformulated Atmospheric Band Model with Auxiliary Species and Advanced Multiple Scattering Options; Spectral Sciences, Inc.: Burlington, MA, USA, 2011. [Google Scholar]
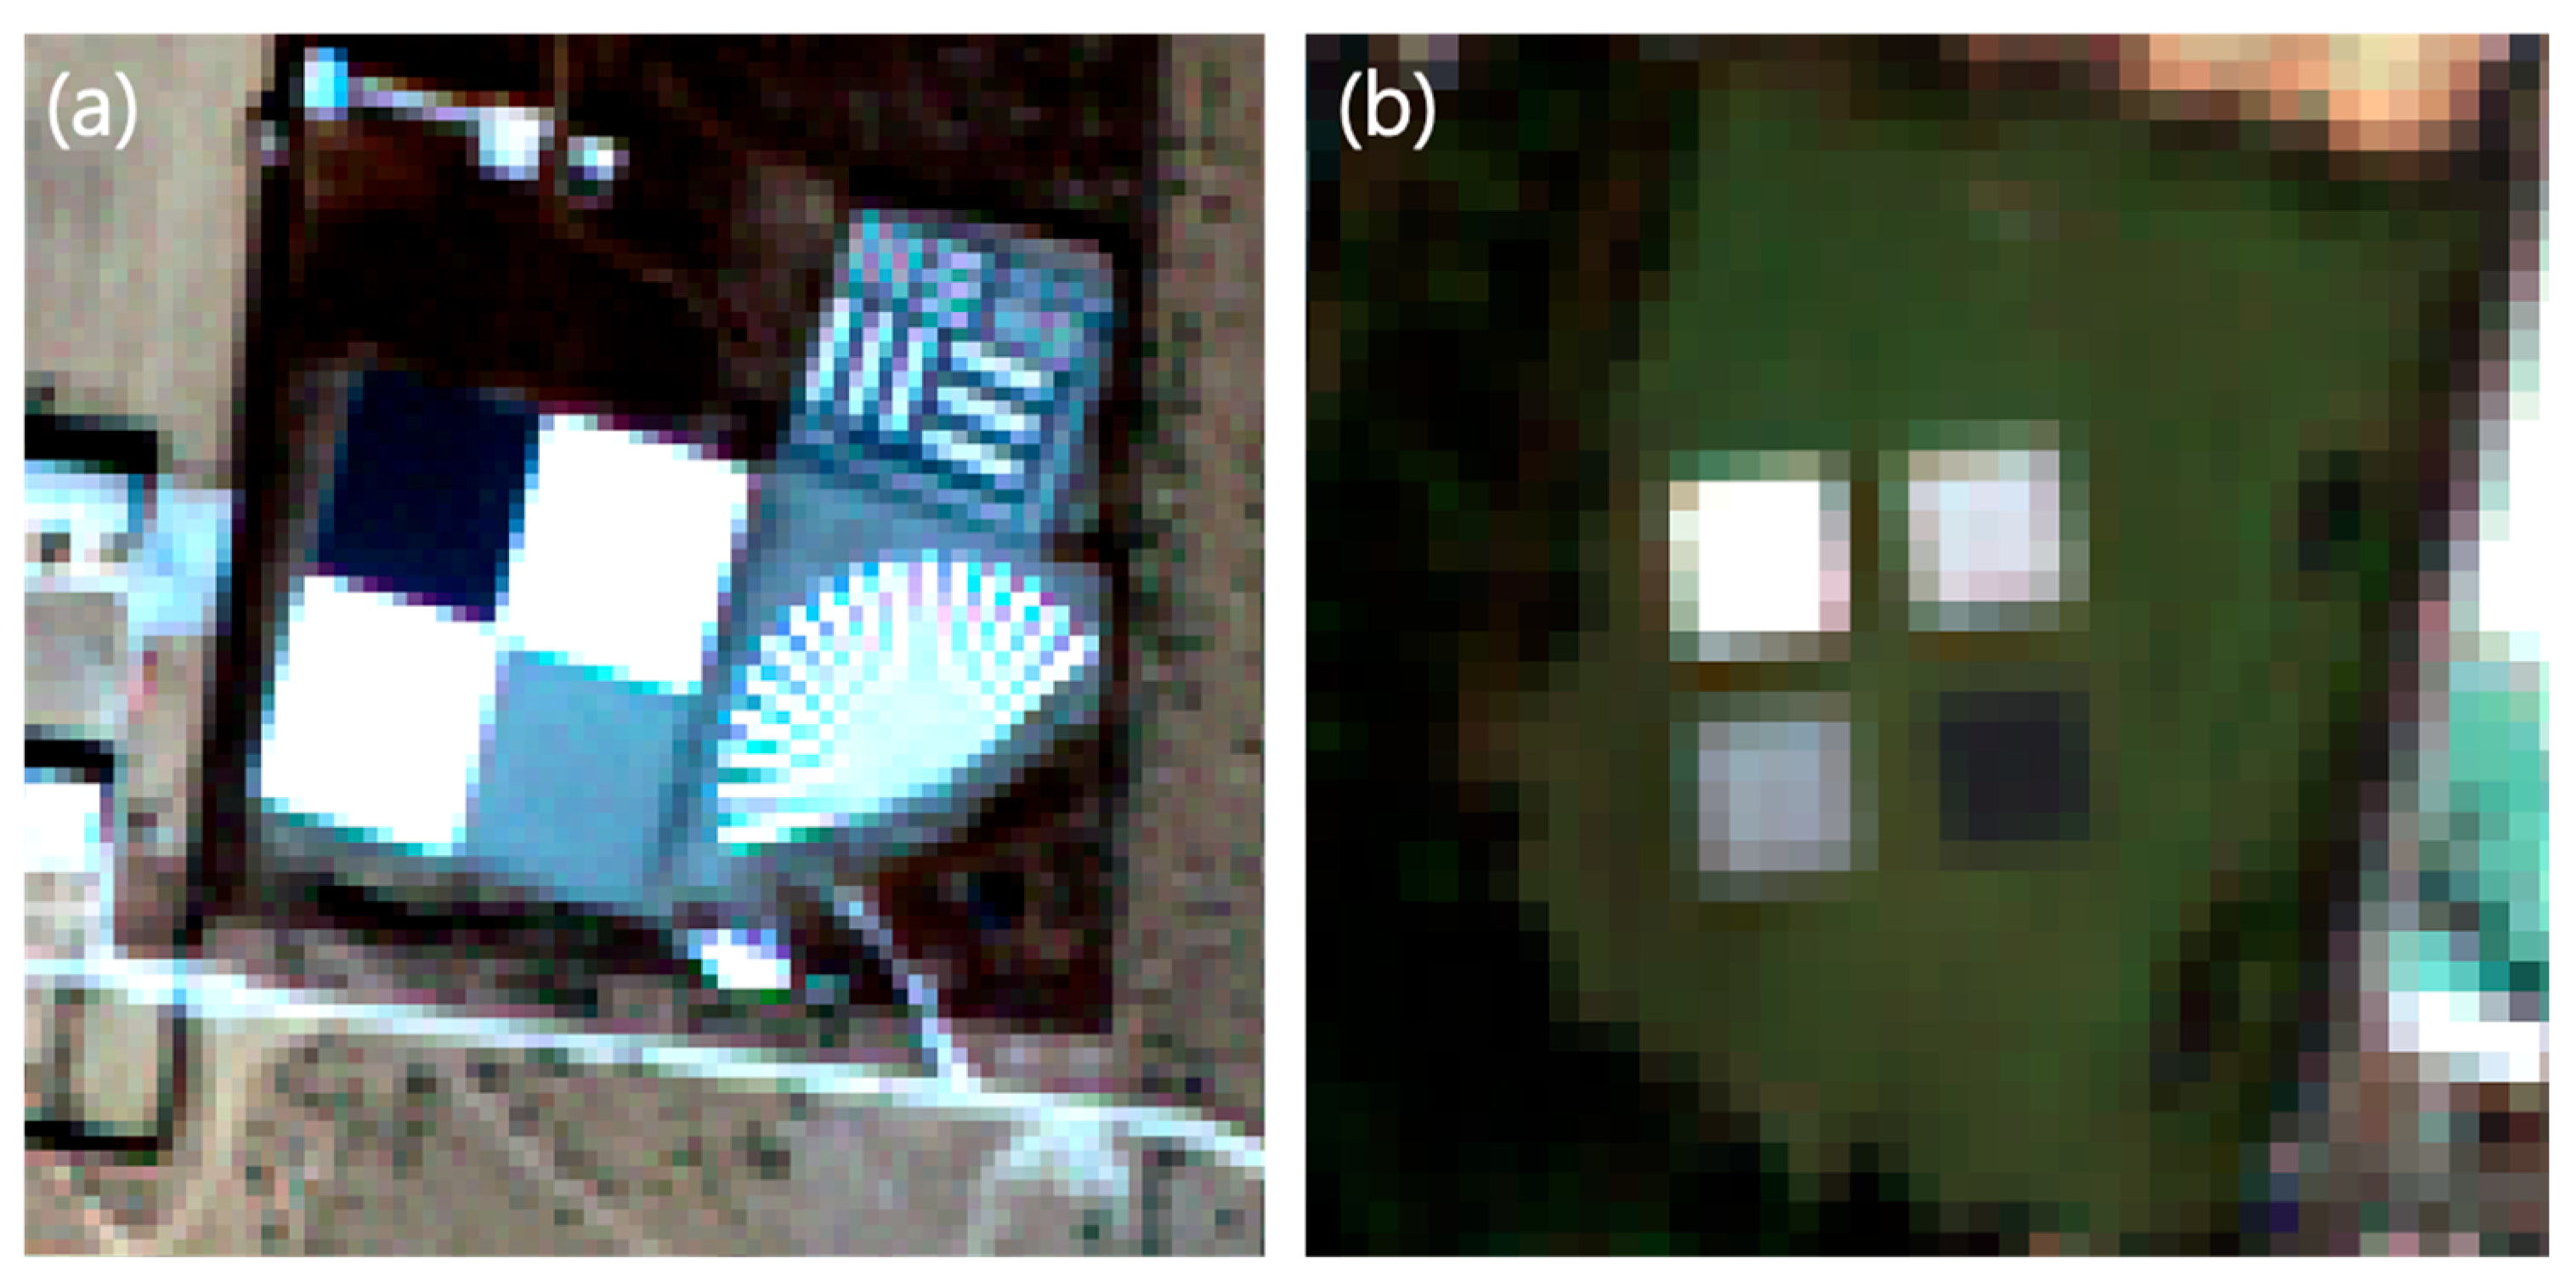
Figure 1. Calibration sites KOMPSAT-3/AEISS RGB images: (a) Baotou, 28 October 2023, (b) KARI, 5 October 2023.
Remotesensing 17 03280 g001
Figure 2. KOMPSAT-3/AEISS blue band (a) Baotou site (b) Artificial target (c) Rotated Artificial target (d) Downscaling of the artificial target.
Remotesensing 17 03280 g002
Figure 3. Sentinel-2A/MSI blue band (a) Baotou site (b) Artificial target.
Remotesensing 17 03280 g003
Figure 4. Relative Spectral Responses for KOMPSAT-3/AEISS and Sentinel-2A/MSI.
Remotesensing 17 03280 g004
Figure 5. Cross-calibration flow chart for KOMPSAT-3/AEISS.
Remotesensing 17 03280 g005
Figure 6. (a) Four artificial tarps installed at the KARI field site. (b) Spectral reflectance of the four tarps (3.5%, 22%, 34%, 52%) (c) BOA reflectance measurement using the ASD FieldSpec III (d) Spectralon panel (e) Microtops II Sunphotometer.
Remotesensing 17 03280 g006
Figure 7. Cross-calibration of KOMPSAT-3/AEISS DN with Sentinel-2A/MSI TOA Radiance.
Remotesensing 17 03280 g007
Figure 8. Comparison of TOA Radiance and Histograms: Baotou KOMPSAT-3/AEISS and Sentinel-2A/MSI (ac) and Artificial Target KOMPSAT-3/AEISS and Sentinel-2A/MSI (df).
Remotesensing 17 03280 g008
Figure 9. Vicarious calibration: KOMPSAT-3/AEISS DN to TOA Radiance.
Remotesensing 17 03280 g009
Figure 10. Comparison of DN with TOA radiance obtained via cross-calibration and vicarious calibration.
Remotesensing 17 03280 g010
Figure 11. Time series of TOA reflectance over the Baotou Sand site from KOMPSAT-3 and Sentinel-2 across MS bands.
Remotesensing 17 03280 g011
Table 1. Comparison of Mission Characteristics for the KOMPSAT-3/AEISS and Sentinel-2A/MSI Satellites.
Mission CharacteristicKOMPSAT-3/AEISSSentinel-2A/MSI
Orbit Altitude685 km786 km
Swath width15 km (at nadir)290 km
Ground Sample distanceMS: 2.8 mMS: 10 m
Spectral BandsBlue: 450–520 nmBlue: 458–453 nm
Green: 520–600 nmGreen: 543–578 nm
Red: 630–690 nmRed: 650–680 nm
NIR: 760–900 nmNIR: 785–900 nm
Signal-to-Noise Ratio>100 for MSBlue: 154
Green: 168
Red: 142
NIR: 174
Table 2. Calibration Sites for Cross-calibration and Vicarious Calibration Methods.
MethodSiteLongitudeLatitudeAltitude
Cross-calibrationBaotou109.628°E40.854°N1300 m
Vicarious CalibrationKARI127.352°E36.374°N60 m
Table 3. Satellite image geometry parameters used for cross-calibration.
DateSatelliteOverpass
Time (UTC)
Solar
Zenith (°)
Solar
Azimuth (°)
Viewing
Zenith (°)
Viewing
Azimuth (°)
2022.07.10KOMPSAT-35:52:1322.05218.4916.27260.61
Sentinel-2A3:46:5422.82140.856.44285.16
2022.10.18KOMPSAT-35:47:3653.66204.824.43259.68
Sentinel-2A3:46:4451.52166.946.28284.78
2023.02.25KOMPSAT-35:49:2851.59197.542.13259.58
Sentinel-2A3:46:3952.73158.316.37285.06
2023.11.12KOMPSAT-35:53:3662.61205.2010.49278.20
Sentinel-2A3:46:4159.39168.846.38284.96
Table 4. BRDF correction factors by spectral band and calibration date based on MODIS and Ross–Li model.
BandBRDF Correction Factor
2022.07.102022.10.182023.02.252023.11.12
Blue1.06 0.98 1.04 0.99
Green1.07 1.00 1.04 0.97
Red1.07 1.01 1.05 1.00
NIR1.05 1.01 1.05 0.99
Table 5. Satellite image geometry and atmospheric parameters used for the vicarious calibration.
DateOverpass Time (UTC)Solar
Zenith (°)
Solar Azimuth (°)Viewing Zenith (°)Viewing Azimuth (°)AOD
(550 nm)
Water Vapor
(g/cm2)
O3
(DU)
Cloud
Cover
2023.03.0804:38:4353.14 209.47 5.96 24.86 0.50 0.86 356.85 0
2023.03.2104:46:3157.22 215.28 −22.20 9.87 0.15 0.67 328.08 0
2023.03.2604:41:5131.40 217.75 13.04 22.86 0.26 0.39 371.59 3
2023.05.1604:30:5022.31 242.14 1.39 22.66 0.40 1.41 351.22 0
2023.10.0504:43:2647.88 217.48 −6.73 -0.15 0.07 0.63 281.39 0
Table 6. Comparison of KOMPSAT-3/AEISS cross-calibration gain values with those obtained in previous studies.
BlueGreenRedNIR
Cross Calibration0.0196 0.0237 0.0214 0.0136
Ahn et al. (2017) [14]0.0177 0.0252 0.0214 0.0153
Jin et al. (2021) [24]0.0179 0.0255 0.0216 0.0130
Table 7. Comparison of KOMPSAT-3/AEISS vicarious calibration gain values with those obtained in Previous Studies.
BlueGreenRedNIR
Vicarious Calibration0.0217 0.0299 0.0221 0.0155
Ahn et al. (2017) [14]0.0181 0.0254 0.0202 0.0130
Yeom et al. (2018) [13]0.0275 0.0382 0.0294 0.0192
Table 8. Comparison of TOA reflectance in each band of KOMPSAT-3/AEISS and Sentinel-2A/MSI images over the Baotou Sand sites.
SiteBandTOA ReflectanceDifferencePercentage
Difference (%)
KOMPSAT-3/AEISSSentinel-2A/MSI
Baotou Sand
(40.87°N, 109.62°E)
Blue0.154 ± 0.0090.157 ± 0.007−0.003 −1.77%
Green0.163 ± 0.0070.183 ± 0.010−0.020 −12.57%
Red0.241 ± 0.0090.240 ± 0.0120.001 0.43%
NIR0.263 ± 0.0140.283 ± 0.011−0.020 −7.56%
Disclaimer/Publisher’s Note: The statements, opinions and data contained in all publications are solely those of the individual author(s) and contributor(s) and not of MDPI and/or the editor(s). MDPI and/or the editor(s) disclaim responsibility for any injury to people or property resulting from any ideas, methods, instructions or products referred to in the content.