Article

Detection of Larch Caterpillar Infestation in Typical Forest Areas of Changbai Mountain, China, Based on Integrated Satellite Hyperspectral and Multispectral Data

1
College of Geoexploration Science and Technology, Jilin University, Changchun 130026, China
2
Information Technology Research Center, Beijing Academy of Agriculture and Forestry Sciences, Beijing 100097, China
3
Beijing Municipal Institute of City Planning & Design, Beijing 100045, China
4
Zhuhai Orbita Satellite Big Data Co., Ltd., Zhuhai 519085, China
*
Author to whom correspondence should be addressed.
Remote Sens. 2025, 17(19), 3274; https://doi.org/10.3390/rs17193274
Submission received: 14 August 2025 / Revised: 20 September 2025 / Accepted: 22 September 2025 / Published: 23 September 2025

Abstract

Highlights

What are the main findings?
  • Integrating Zhuhai-1 hyperspectral and Sentinel-2 multispectral data enabled collaborative monitoring of larch caterpillar infestations.
  • The 682–689 nm band and FOD features were highly sensitive to infestations, effectively capturing vegetation stress.
What is the implication of the main finding?
  • Demonstrates the potential of multi-source remote sensing for forest pest monitoring.
  • Provides sensitive indicators for detecting vegetation stress, supporting forest health protection and management.

Abstract

Forests, as one of the most vital ecosystems on Earth, play essential roles in climate regulation, water conservation, and resource provision. However, forest health is threatened by pests, among which the larch caterpillar (Dendrolimus superans) is one of the most destructive defoliators of coniferous forests in northern China. Previous studies have mostly relied on single data sources for pest detection, which are limited by insufficient spectral information or inappropriate selection of sensitive bands, making it difficult to achieve high detection accuracy. Therefore, this study integrates hyperspectral imagery from Zhuhai-1 and multispectral imagery from Sentinel-2, leveraging their high spectral resolution and broad spectral range, thus enhancing discrimination capability. Genetic algorithm (GA) was employed to select optimal features from spectral indices, texture features, and fractional-order derivatives (FOD). Random Forest (RF), Support Vector Machine (SVM), and eXtreme Gradient Boosting (XGBoost) were compared, and model interpretability was further analyzed using Shapley additive explanations (SHAP). The results showed that XGBoost achieved the highest performance, with an overall accuracy and Kappa coefficient of 93.47% and 89.81%, demonstrating superior adaptability. Moreover, the integration of hyperspectral and multispectral data significantly improved detection accuracy compared to using either data source alone. Among the GA-selected features, Band 15 of Zhuhai-1 hyperspectral imagery exhibited strong sensitivity to pest infestation. This study provides a novel and practical approach for forest pest monitoring based on the synergistic use of hyperspectral and multispectral remote sensing data.

1. Introduction

Forests constitute one of the most vital ecosystems on Earth, playing a crucial role in climate regulation, water conservation, biodiversity preservation, and resource provision. However, forest pests and diseases pose serious threats to forest ecological security and are among the leading causes of forest degradation in contemporary times [1]. Larch caterpillars are recognized as one of the most historically severe forest pests both within China and globally, inflicting damage on millions of hectares of forest annually. Consequently, timely and precise identification of infestation areas is critical for the development of targeted management strategies to reduce losses and protect forest ecosystems.
In the study of forest pest monitoring and information extraction, the main research approaches include traditional ground based surveys and remote sensing based methods [2]. Traditional ground sampling techniques, such as visual inspection, are time-consuming, labor-intensive, and highly subjective, limiting their applicability for large-scale forest monitoring [3]. In contrast, remote sensing technologies can detect and map pest-affected forest areas over large regions, enabling the implementation of timely control measures [4]. Pest outbreaks lead to significant changes in forest spectral characteristics, thus enabling the identification of pest-infested forests in remote sensing imagery by detecting these spectral differences [5]. This approach has been widely applied in forest pest and disease monitoring due to its advantages of multi-sensor and multi-temporal capabilities. Early studies on forest pests, including caterpillar outbreaks, primarily relied on multispectral satellite data. Multispectral data from Landsat-5 [6], Landsat-7 [7], and Sentinel-2 [8] have been widely used in the identification and monitoring of forest pests and diseases. For example, long-term Landsat time-series data were employed to assess and predict pine caterpillar infestations [9]. However, multispectral imagery contains relatively few bands that are sensitive to pest damage, which limits the ability to achieve high-accuracy identification. Compared with multispectral data, hyperspectral imagery contains more pest-related bands and provides a greater number of continuous spectral bands, making it suitable for a wider range of pest related studies [10]. In the past, commonly used hyperspectral data were obtained from airborne platforms. For instance, UAV-based hyperspectral imagery was employed for high-precision detection of pine caterpillar damage [11]. UAV hyperspectral imagery was combined with ground-collected data to estimate different infection stages of pine wilt disease (PWD), demonstrating the effectiveness of hyperspectral imagery in early detection [12]. However, UAV based hyperspectral systems are not suitable for large scale, long term, and stable observation applications. With the launch of hyperspectral satellites, hyperspectral remote sensing images are gradually becoming widely used. Among them, the Zhuhai-1 hyperspectral satellite constellation, consisting of eight satellites, offers a high spatial resolution of 10 m and a spectral resolution of 2.5 nm, a short revisit cycle of about one day, and a swath width of about 150 km [13]. Nevertheless, the spectral range of the Zhuhai-1 hyperspectral satellite is limited to 400 to 1000 nm, which excludes certain pest sensitive bands in the short-wave infrared region [14]. The Sentinel-2 multispectral satellite, however, complements this limitation by covering the missing short-wave infrared bands. Therefore, in this study, we effectively integrated imagery from Zhuhai-1 and Sentinel-2 to expand the overall spectral range and overcome the limitations associated with relying on a single data source.
In the process of hyperspectral satellite imaging, the data are often affected by factors such as moisture content, surface roughness, and atmospheric conditions [15]. The construction of spectral indices serves to mitigate these interferences and enables the efficient extraction and utilization of meaningful information embedded within the imagery. Therefore, this study constructed spectral index features, including the normalized difference index (NDI), to improve the accuracy of pest infestation detection. In addition, textural features are also widely used in remote sensing image analysis to describe spatial structural differences on the land surface. These features can provide supplementary information beyond spectral data, such as vegetation growth uniformity, crown fragmentation, and stand structure [16]. For spectral feature enhancement, first-order and second-order derivatives are commonly used to highlight spectral variation [17]. However, these conventional derivatives have limited sensitivity to gradual spectral slopes and curvature, which may carry important physiological information related to vegetation. As an extension of the integer-order derivative, fractional-order derivatives (FOD) demonstrates greater flexibility and precision compared to traditional integer order methods [18]. It can more effectively capture subtle variations in curvature and slope across spectral bands, enhancing relevant spectral features. In recent years, FOD-based spectral transformation methods have been widely applied in image enhancement [19], soil property estimation [20], and vegetation trait analysis, demonstrating promising potential for practical applications. In the field of vegetation trait estimation, FOD have been demonstrated to effectively estimate traits such as leaf water content [21] and photosynthetic capacity [22]. When plants are infested by pests or diseases, their photosynthetic capacity, leaf water content, and other physiological traits undergo significant changes. These alterations can be effectively detected using FOD, allowing the differentiation of forests infested by larch caterpillars from healthy ones. The large number of features, including index features, texture features, and FOD features, often leads to feature redundancy, which can easily cause overfitting, increase model complexity, and reduce classification accuracy. Therefore, this study employed a genetic algorithm (GA) for feature selection to identify an optimal subset of features, thereby reducing the influence of irrelevant or redundant features and improving the generalization ability and stability of the model.
For classification-based identification of larch caterpillar outbreak areas, model selection is crucial, as different models often have varying applicability and characteristics. With the continuous development of machine learning algorithms, an increasing number of studies have integrated hyperspectral remote sensing with machine learning techniques for pest detection [23,24]. Machine learning is widely applied in remote sensing analysis due to its ability to automatically learn the relationships between spectral reflectance, extracted features, and target variables, while also demonstrating robustness to noise and uncertainty in both spectral data and ground truth observations [25]. Commonly employed algorithms include decision trees (DT), Random Forest (RF), Support Vector Machine (SVM), and eXtreme Gradient Boosting (XGBoost) [26]. These methods have strong non-linear modeling capabilities, adapt well to high-dimensional data, and are capable of capturing complex relationships among features, making them well-suited for remote sensing classification tasks. Although deep learning has demonstrated strong feature learning capabilities in recent years, these machine learning methods offer certain advantages, such as requiring less data, lower training computational costs, and better result interpretability, making them more feasible for this study. To further clarify the specific impact of different features on the model’s prediction results and enhance interpretability, this study employed the Shapley additive explanations (SHAP) framework to analyze feature importance. SHAP provides a comprehensive explanation of machine learning model outputs by quantifying each feature’s contribution to a specific prediction, including both the magnitude and direction of its influence. It supports both local and global interpretability, helping to improve the transparency and credibility of model decisions [27].
Based on this, and to avoid limitations in spectral range and resolution imposed by a single data source, this study employed Zhuhai-1 hyperspectral imagery and Sentinel-2 multispectral imagery as primary data sources to extract information on larch caterpillar infestations through feature extraction, GA-based feature selection, and machine learning classification. The specific objectives are as follows:
(1)
Extracting spectral indices, texture features, and FOD features from the combined image and selecting the optimal feature subset using GA.
(2)
Comparing the accuracy of different machine learning models and data sources in detecting larch caterpillar infestations and identifying the most effective model.
(3)
Revealing sensitive features and bands related to larch caterpillar infestation and assessing the role of FOD features, providing a reference for future pest detection research.

2. Materials and Methods

2.1. Study Area

The study area is situated in southern Antu County and eastern Fusong County, Jilin Province, China. It lies within the Changbai Mountain National Nature Reserve and covers an area of approximately 2590 km2 (Figure 1). Geographically, the eastern and western regions of Jilin Province are divided by the Dahei Mountains, forming a landscape that transitions from the central-western plains to the eastern mountainous terrain. The forest coverage in the eastern mountainous region reaches approximately 45.27%, representing one of the highest levels nationwide. This area functions as a critical repository of biological diversity and serves as both a strategic timber reserve and a natural ecological museum. Climatically, the region experiences a temperate continental monsoon climate, with an average annual temperature of 3.6 °C and annual precipitation ranging from 700 to 1400 mm. Precipitation is primarily concentrated between June and August, providing favorable conditions for larch caterpillar development and proliferation. The elevation ranges from 828 to 1633 m, exhibiting distinct altitudinal zonation and ecological gradients. The vegetation is diverse, dominated by mixed coniferous–broadleaf forests. Dominant tree species include Korean pine, spruce, fir, and Manchurian ash. Larch caterpillars typically prefer warm and dry habitats. In such areas, due to restricted growing conditions, pine trees tend to have weaker physiological vigor and a significantly reduced resistance to pests. The insect’s life cycle exhibits clear seasonality: in late April, the larvae begin to climb trees to feed; by mid-May, feeding activity peaks; from June to July, the mature larvae descend to the ground to spin cocoons and pupate; and from July to August, they emerge as adults. Thus, imagery acquired after July is more suitable for observing pest occurrence. In recent years, the area has experienced recurrent outbreaks of larch caterpillar infestations, thereby threatening the ecological integrity and sustainable development of the Changbai Mountain National Nature Reserve.

2.2. Remote Sensing Data Sources and Processing

Based on the principle of temporal alignment between pest occurrence and remote sensing data acquisition, combined with relevant literature and field survey data, it was confirmed that an outbreak of larch caterpillar infestation occurred in the study area in 2022. For pest detection and modeling, this study utilized hyperspectral imagery from Zhuhai-1 and multispectral imagery from Sentinel-2 as the primary data sources. The Zhuhai-1 hyperspectral image was acquired on 30 October 2022, and downloaded from the Orbita Remote Sensing Data Service Platform (https://www.obtdata.com/). The image consists of 32 spectral bands covering the wavelength range of 443 to 940 nm, with a spatial resolution of 10 m. The Sentinel-2 image was acquired on 29 October 2022, and downloaded from the Copernicus Data Space Ecosystem platform (https://dataspace.copernicus.eu/). The image includes 13 spectral bands covering the wavelength range of 443 to 2190 nm. Among them, four bands (B2, B3, B4, and B8) have a spatial resolution of 10 m, six bands (B5, B6, B7, B8A, B11, and B12) have a resolution of 20 m, and the remaining three bands (B1, B9, and B10) are at 60 m resolution. The preprocessing of both Zhuhai-1 and Sentinel-2 consisted of three steps. First, radiometric calibration was performed to reduce sensor-related errors during image preprocessing. Subsequently, atmospheric correction was applied to minimize the influence of atmospheric and radiometric factors on surface reflectance. Finally, orthorectification was conducted to correct geometric distortions in the raw imagery. After processing with Sen2Cor (Version 2.12.03, European Space Agency, Paris, France), surface reflectance products of Sentinel-2 were obtained. To ensure consistency across multi-source datasets, bands with spatial resolutions greater than 10 m were resampled to 10 m using the ENVI 5.6 (Version 5.6, Exelis Visual Information Solutions, Boulder, CO, USA) software package. The Zhuhai-1 imagery was processed using the preprocessing software OpenOHS (Version 3.0, Zhuhai Orbita Aerospace Science & Technology Co., Ltd., Zhuhai, China) provided by the platform, in order to obtain surface reflectance imagery. Subsequently, Sentinel-2 data were used as the spatial reference to register the Zhuhai-1 image. To improve model accuracy, the Zhuhai-1 bands heavily affected by noise were removed. These bands exhibited distinct anomalies in spectral reflectance, with B1, B2, B3, B4, and B5 showing clearly negative reflectance values and B32 displaying abnormally high reflectance. After removing these bands, a total of 26 bands were retained for feature selection and modeling. Additionally, bands B1, B2, B11, and B12 from Sentinel-2 were incorporated into the Zhuhai-1 image to replace the corresponding initial bands and supplement short-wave infrared information, thereby enhancing data quality and expanding the original spectral coverage of Zhuhai-1. Ultimately, the integration of Zhuhai-1 and Sentinel-2 data resulted in a combined dataset comprising 30 bands (as shown in Table 1), covering the visible, near-infrared, and short-wave infrared regions, which was used for the larch caterpillar infestation modeling.

2.3. Method

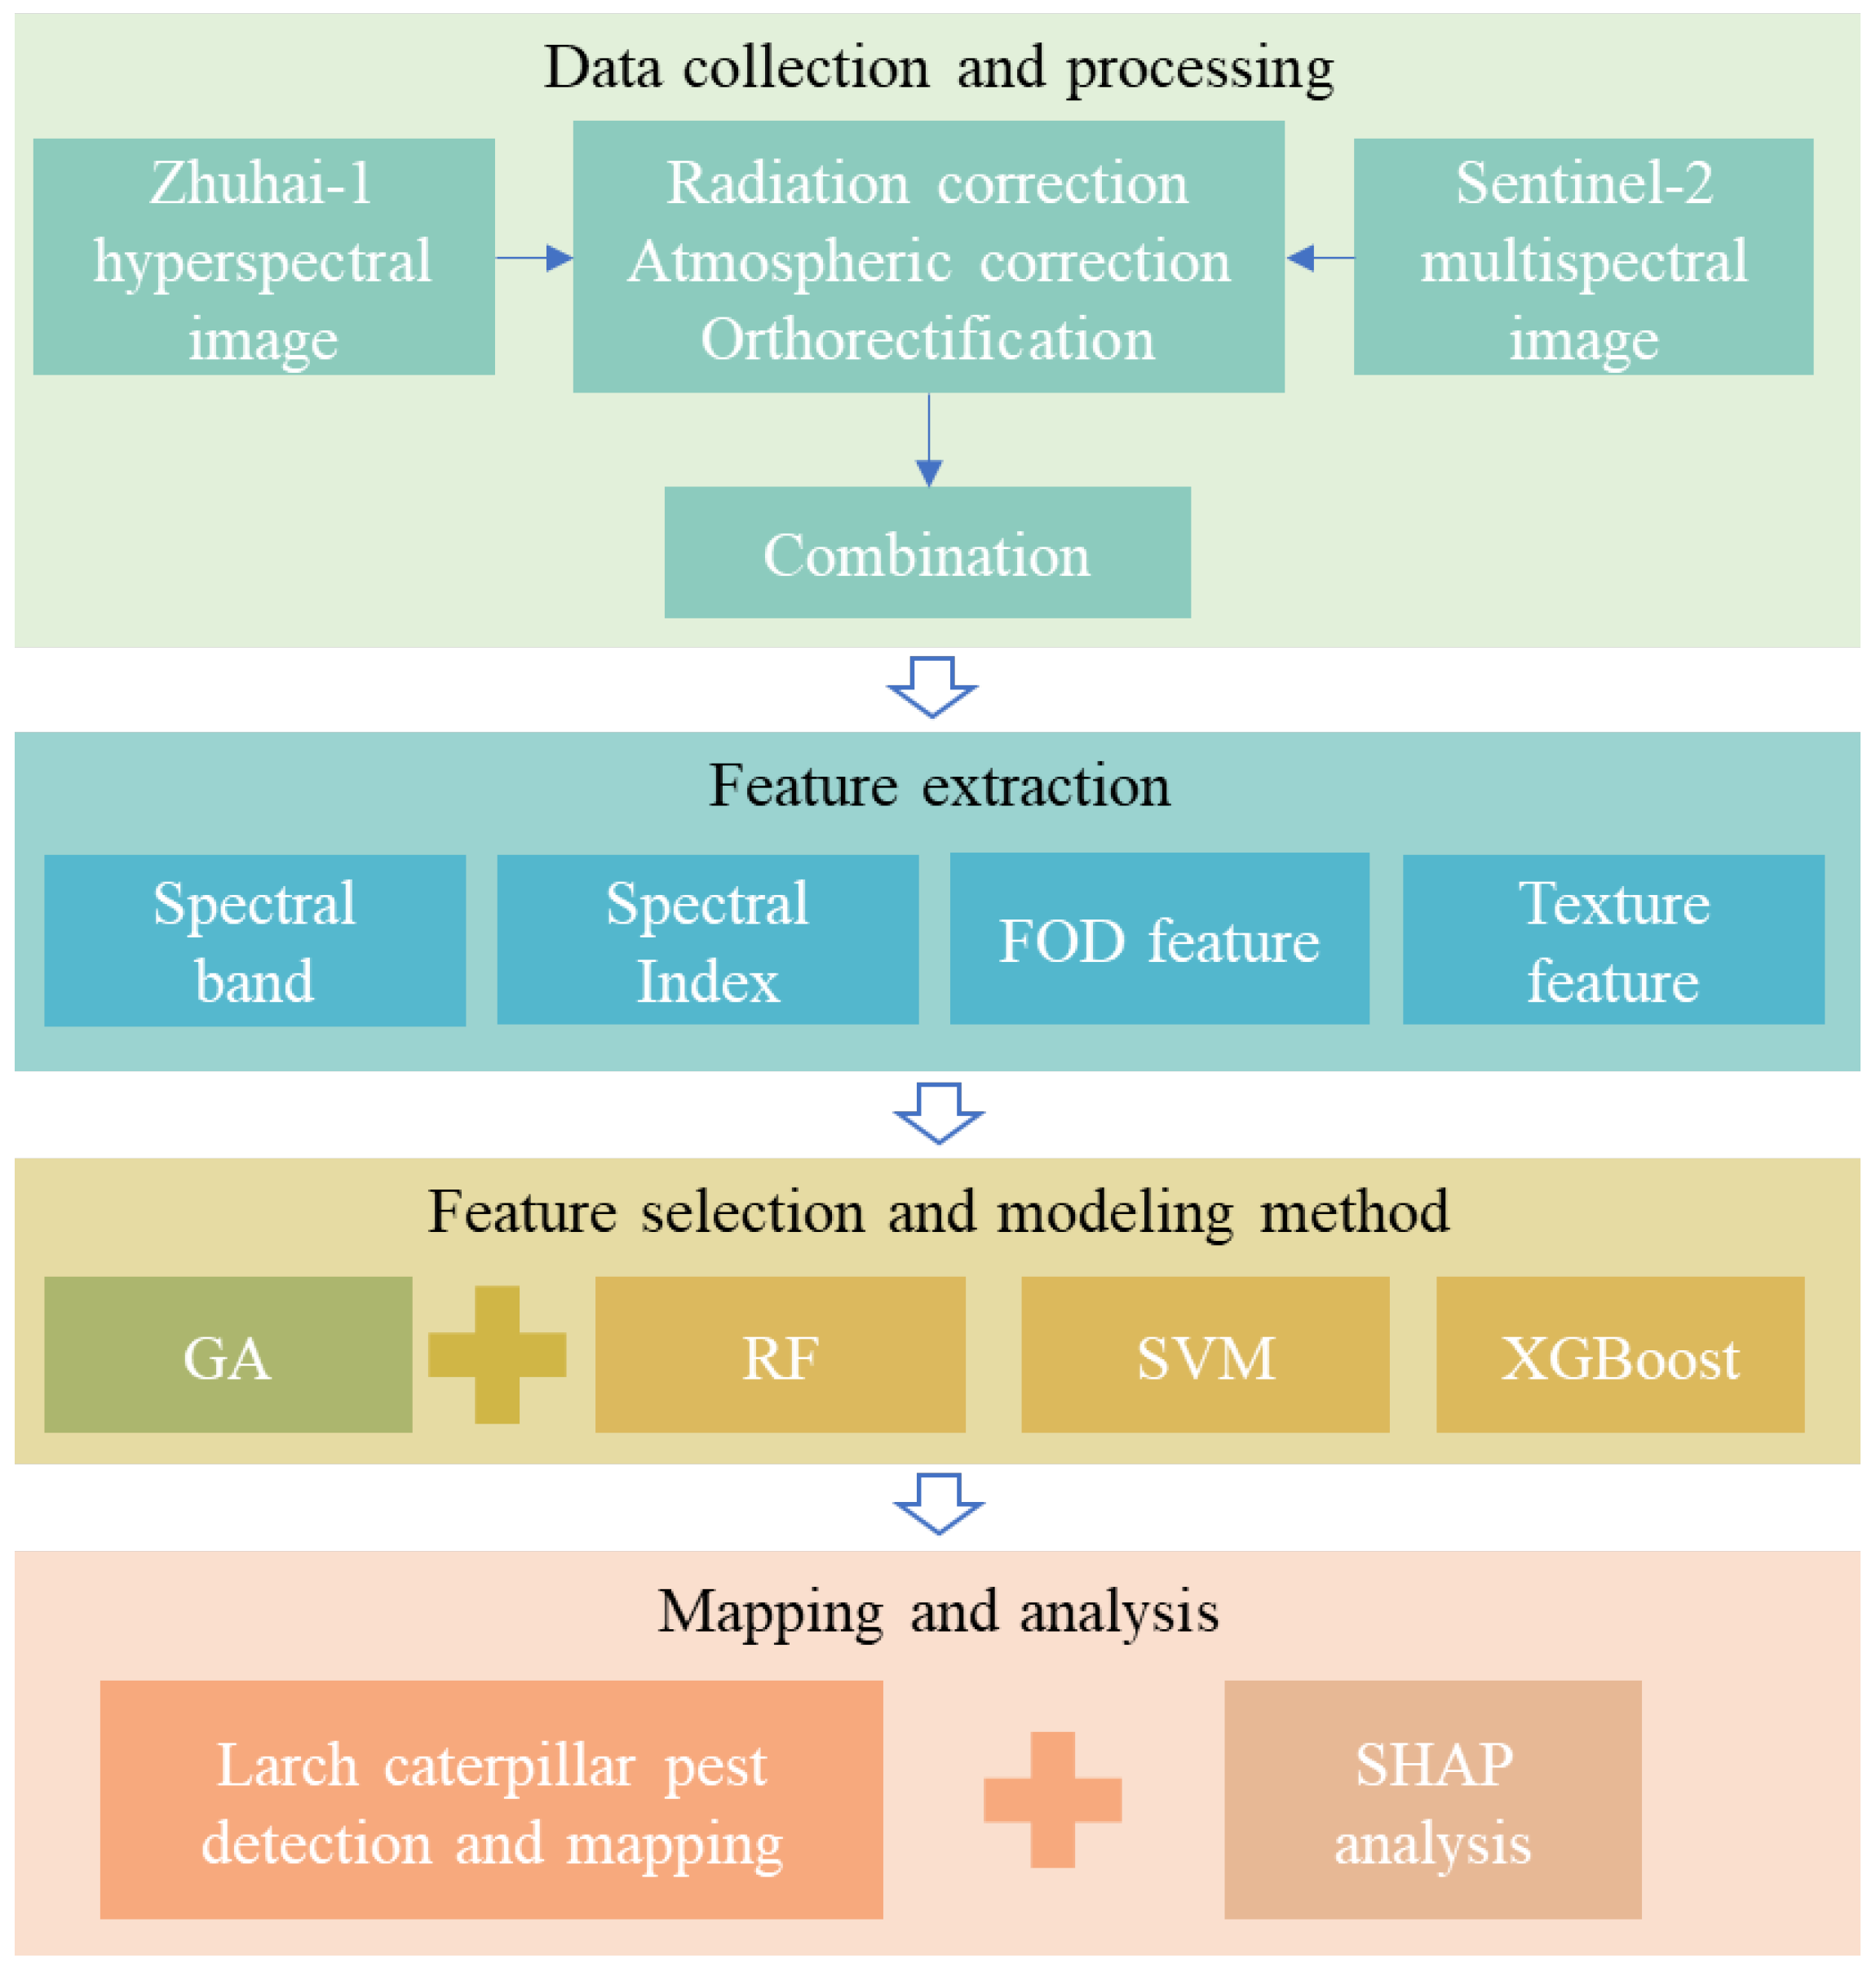
A flowchart of the proposed larch caterpillar infestation detection method is provided in Figure 2.

2.3.1. Feature Extraction

Spectral Indices: In this study, difference index (DI), ratio index (RI), and NDI were extracted based on the combined images. Rather than using all bands to construct two-band spectral indices, specific indices were constructed using pest-sensitive bands to improve detection accuracy of infested areas. The bands used for calculating the spectral indices were determined based on the spectral differences between healthy and infested forests, as well as the spectral absorption peaks. For each absorption peak, the two-band spectral indices were calculated using parameters bc and bi. The parameter bc is set as a constant equal to the reflectance value at the central wavelength band of the absorption peak, while bi composed of two parts: reflectance values from bands other than the central wavelength within the absorption peak, and reflectance values at short-wave infrared bands (1610 nm and 2190 nm). The calculation formulas for the three indices are as follows:
DI = b i b c
RI = b i / b c
NDI = b i b c / b i + b c
Spectral FOD: FOD was applied to the combined images. As an extension of integer-order derivative, FOD can be calculated using several methods, including Riemann–Liouville (R-L), Riesz, Weyl, Caputo, and Grünwald–Letnikov (G-L) methods [28]. Among these, R-L, G-L, and Caputo methods are the most commonly used. This study employs the G-L algorithm for FOD calculation due to its simplicity, ease of implementation, and comprehensiveness. The G-L definition is a difference-based fractional derivative method, with calculation formula as follows:
D a f x = lim h 0 1 h α j = 0 t α / h 1 m Γ α + 1 j ! Γ α j + 1 f x j h
Here, α denotes the order of the derivative, h represents the step size, t and j are the upper and lower bounds of differentiation limits, respectively. Γ refers to the Gamma function, commonly used in FOD definitions. The Gamma function, also known as the generalized factorial, extends the factorial operation from natural numbers (n!, n ∈ n) to the real (R) and complex (C) domains [29].
Γ β = 0 e t t β 1 d t = β 1 !
When f(x) represents a one-dimensional spectrum, t and α in the formula correspond to the wavelength interval, and h = 1 denotes the spectral sampling interval. Based on the relation (t − α)/h = t − α = n, the fractional-order derivative expression can be written as:
d v f λ d λ v f λ + v f λ 1 + v v 1 2 f λ 2 + + Γ v + 1 n ! Γ v + n + 1 f λ n
When v = 0, the 0th order derivative of f(x) is the function itself. When v = 1 or v = 2, it corresponds to the conventional first and second-order derivative. FOD extends integer-order differentiation to fractional orders. Notably, the integer order case of FOD is equivalent to the integer-order derivative, which is why FOD is considered an extension of traditional differentiation. However, a comparison of the formulas reveals a key difference: integer-order derivatives rely only on information from points within the differentiation window, whereas FOD considers both the points within the window and all preceding points. The closer a point is, the greater its weight, exhibiting the properties of “memorability” and “nonlocality” [30]. This distinction highlights the superior capability of FOD in data processing and information extraction compared to integer order differentiation.
Texture Features: Texture features, which reflect the distribution, structure, and arrangement of vegetation canopies, were extracted based on the Gray Level Co-occurrence Matrix (GLCM). A principal component analysis (PCA) was performed on the combined Zhuhai-1 hyperspectral and Sentinel-2 multispectral images to extract the first principal component. A window size of 3 × 3 was applied, and eight texture features were calculated from the first principal component using the GLCM method, including mean, variance, homogeneity, contrast, dissimilarity, entropy, angular second moment (ASM), and correlation.

2.3.2. Feature Selection

To select the optimal feature combination and reduce redundancy, GA was employed for feature selection of the extracted features. The fundamental principle of GA is to solve optimization problems by simulating biological evolution. The core idea of the algorithm is to encode the feature set as chromosomes (individuals), with each chromosome representing a potential feature subset [31]. The initial population is generated randomly, and the fitness of each individual reflects the effectiveness of the corresponding feature subset for a given task. Fitness is typically evaluated by classification performance metrics, such as classification accuracy or information gain. The population evolves through selection, crossover, and mutation until the optimal feature subset is obtained. The selection operation chooses individuals for reproduction based on their fitness values; the crossover operation simulates genetic recombination to generate new individuals; and the mutation operation introduces random genetic changes to increase diversity and prevent the algorithm from becoming trapped in local optima [32]. In this study, GA-based feature selection was conducted with a population size of 20 chromosomes, a crossover probability of 80%, a mutation probability of 20%, and 1000 iterations.

2.3.3. Model Construction and Evaluation

RF, SVM, and XGBoost are widely used machine learning methods for classification and related tasks [33]. RF is an ensemble learning algorithm that enhances classification accuracy and robustness by constructing multiple decision tree classifiers and aggregating their outputs. It employs bootstrap sampling to generate various training subsets from the original dataset and builds diverse decision trees. During node splitting, RF selects the optimal feature from a randomly chosen subset of all features rather than the full feature set, effectively reducing correlation among trees and enhancing model diversity [34]. The final classification result is determined by majority voting across all trees, achieving low bias and reduced variance. RF is valued for its robustness to outliers, strong generalization, and minimal parameter tuning requirements.
SVM is a supervised learning method based on statistical learning theory and the principle of structural risk minimization. Its core idea is to construct an optimal hyperplane that maximally separates classes in the feature space. For linearly separable problems, SVM directly solves for the maximum-margin classifier in the original space; for non-linearly separable problems, kernel functions (radial basis function, linear kernel, polynomial kernel) are used to map inputs to a high dimensional feature space, rendering the data linearly separable in that space [35]. SVM is known for its excellent generalization performance, suitability for high dimensional, small sample datasets, and effective control of overfitting.
XGBoost is an ensemble learning method based on the gradient boosting framework, known for its efficiency, scalability, and high accuracy. In classification tasks, XGBoost builds a sequence of weak classifiers (typically regression trees) in an iterative fashion, with each new tree fitted to the negative gradient of the loss from the previous iteration. Regularization terms are added to the loss function to control model complexity and prevent overfitting. Additionally, XGBoost incorporates fine-grained gain calculation and pruning strategies for feature splitting and supports missing value handling and parallel computation. These capabilities substantially improve training efficiency and enhance model generalization [36]. Its strong predictive power has led to its widespread use in classifying high dimensional, non-linear datasets.
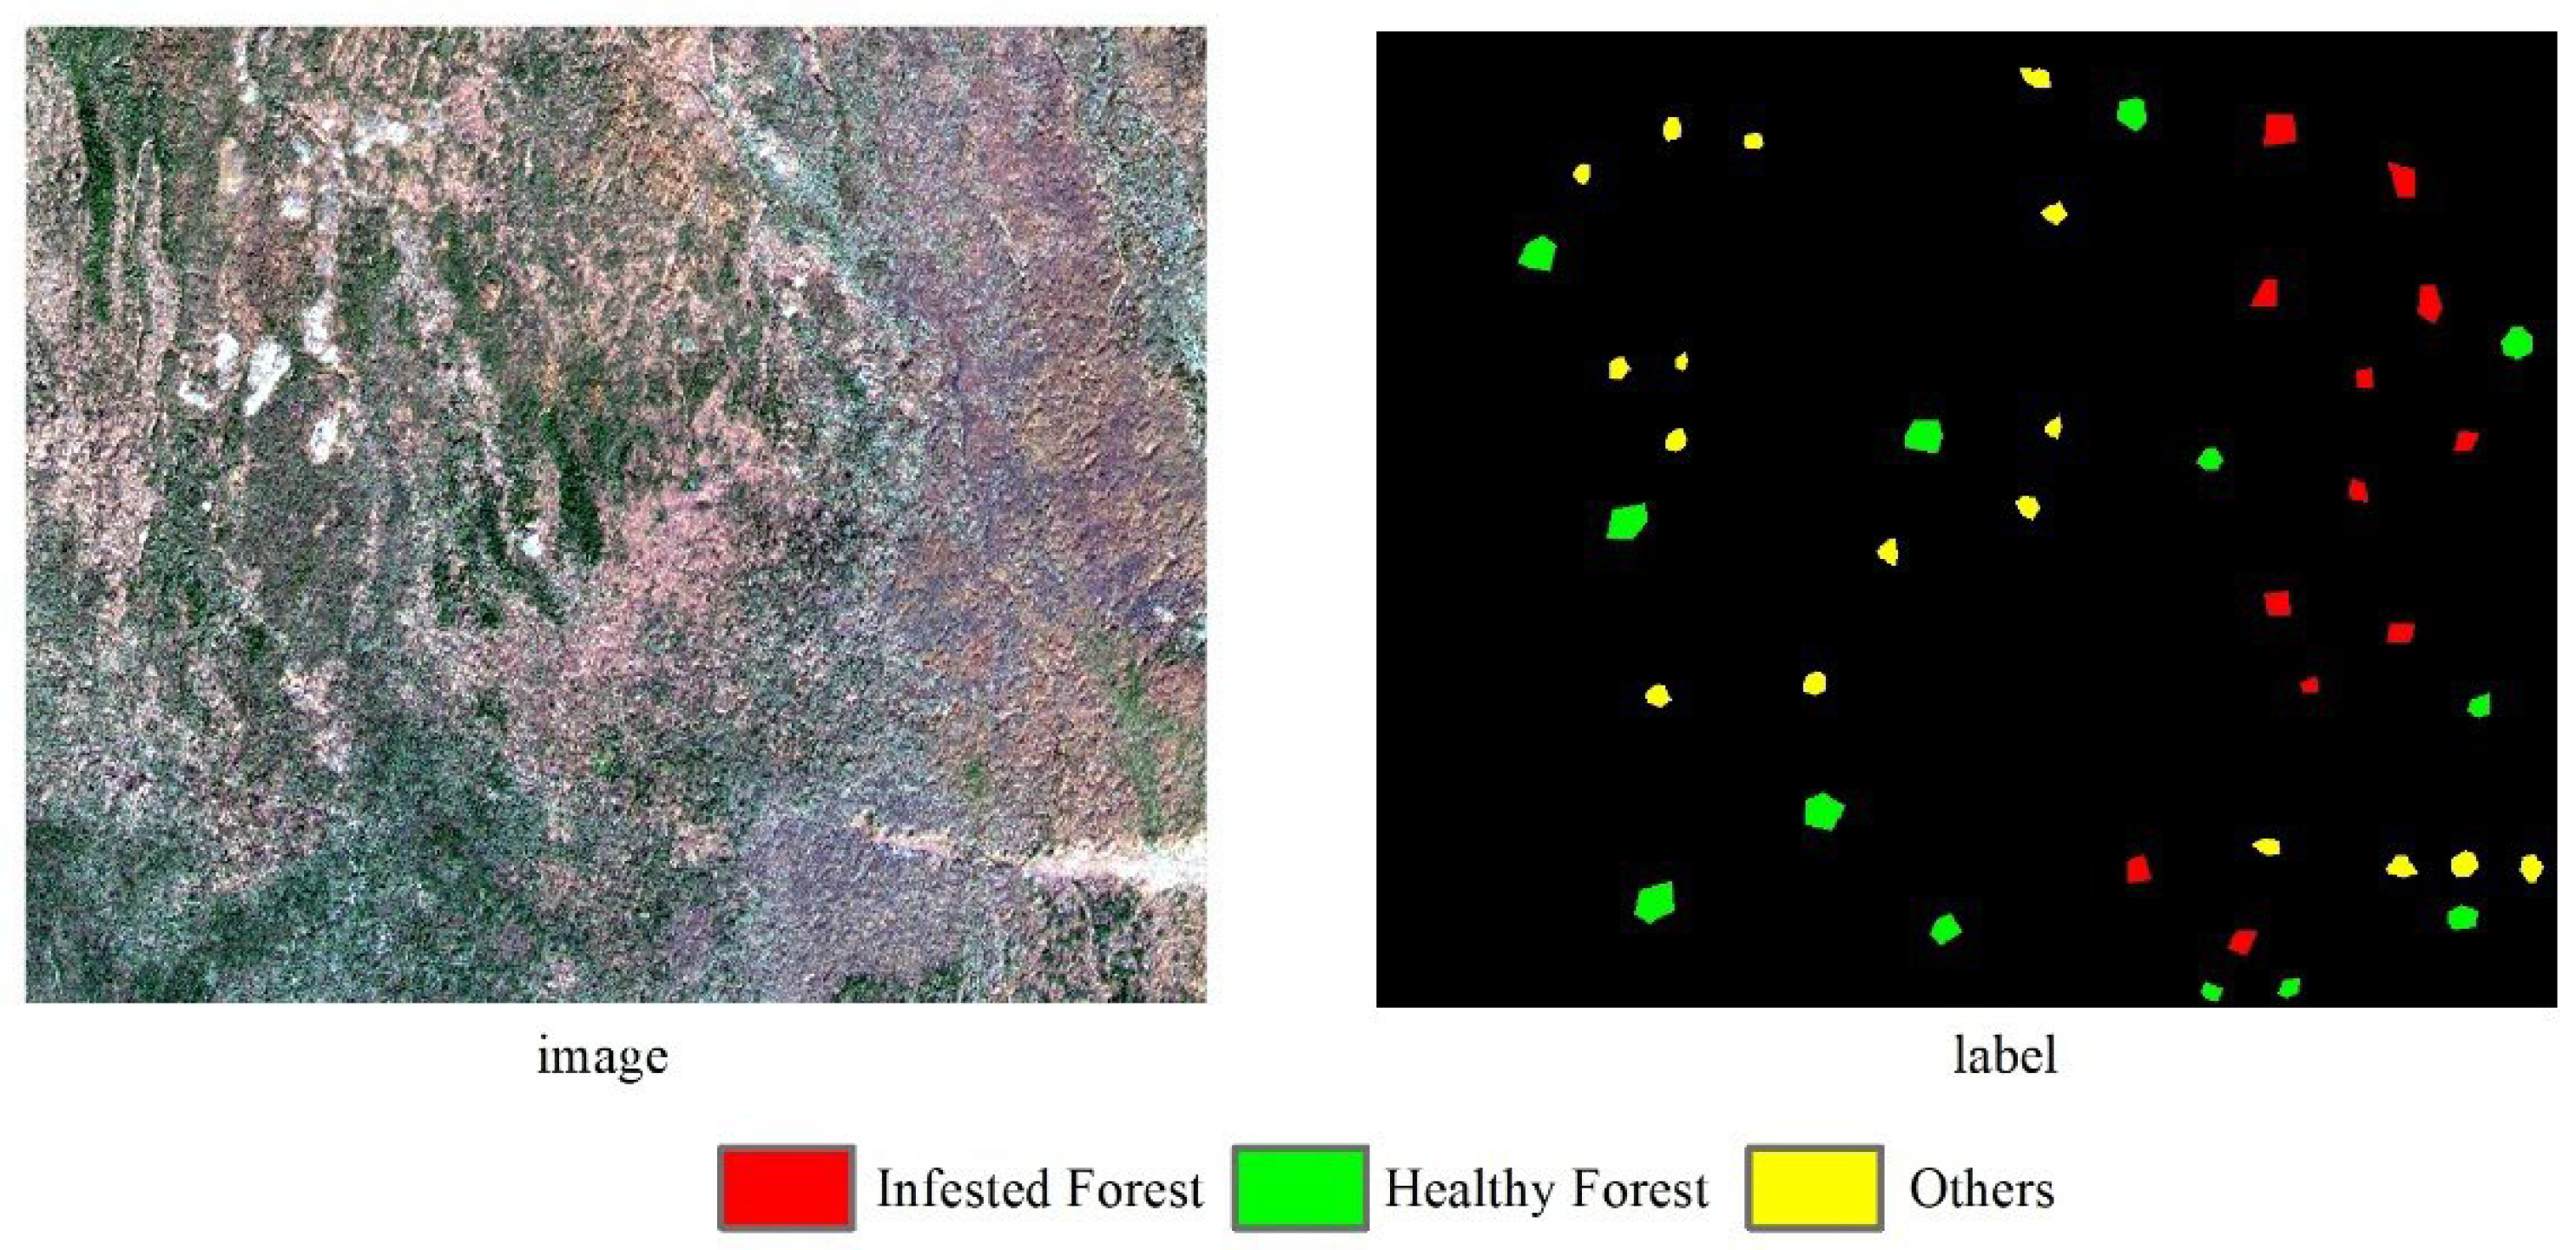
In this study, training samples were created by visual interpretation of true-color and false-color composite images. These samples were used to train RF, SVM, and XGBoost models. Forest land in the study area was categorized into three classes: infested forest, healthy forest, and others. A total of 92,892 labeled pixels were collected, including 24,694 infested samples, 20,409 healthy samples, and 47,789 samples classified as other (as shown in Figure 3). All samples were randomly split into training and testing sets in an 8:2 ratio. To optimize model performance, ten-fold cross-validation approach was used to tune hyperparameters, yielding the following optimal configurations: RF: n_estimators = 1250, random_state = 1200, max_depth = 3. SVM: C = 10, gamma = 0.1. XGBoost: n_estimators = 1400, learning_rate = 0.2, max_depth = 6.
Five metrics: Overall Accuracy (OA), Recall, F1-score, the Kappa coefficient and Precision were employed for accuracy assessment. To ensure a reliable evaluation of model performance, a block-based validation approach was adopted. Specifically, five labeled patches, each measuring 100 × 100 pixels, were manually created based on the imagery. These labeled patches were deliberately located as far as possible from existing labeled areas to minimize spatial autocorrelation effects. The corresponding image regions and their extracted features were then input into the trained models. The model predictions were compared against the ground truth labels within these patches to calculate the evaluation metrics, thereby enabling a comprehensive assessment of each model’s classification accuracy.

2.3.4. SHAP Analysis

To investigate the importance of different features and their specific contributions to the detection results, this study employed the SHAP method for interpretability analysis of the model input features. SHAP enables the assessment of how each input feature influences the output of a predictive model and evaluates both local and global feature importance. It quantitatively determines the positive or negative contribution of each feature variable to the model’s output [27]. The core idea of SHAP lies in computing the role each feature plays during prediction. Specifically, SHAP assesses a feature’s contribution by evaluating its impact across various subsets of features, thereby determining the SHAP value for each feature. These values can be either positive or negative: positive values indicate that the feature increases the predicted value, while negative values suggest a reduction. Finally, the average of the absolute SHAP values is calculated to represent the overall importance of each feature in the final prediction outcome.

3. Results

3.1. Spectral Features of the Combined Image

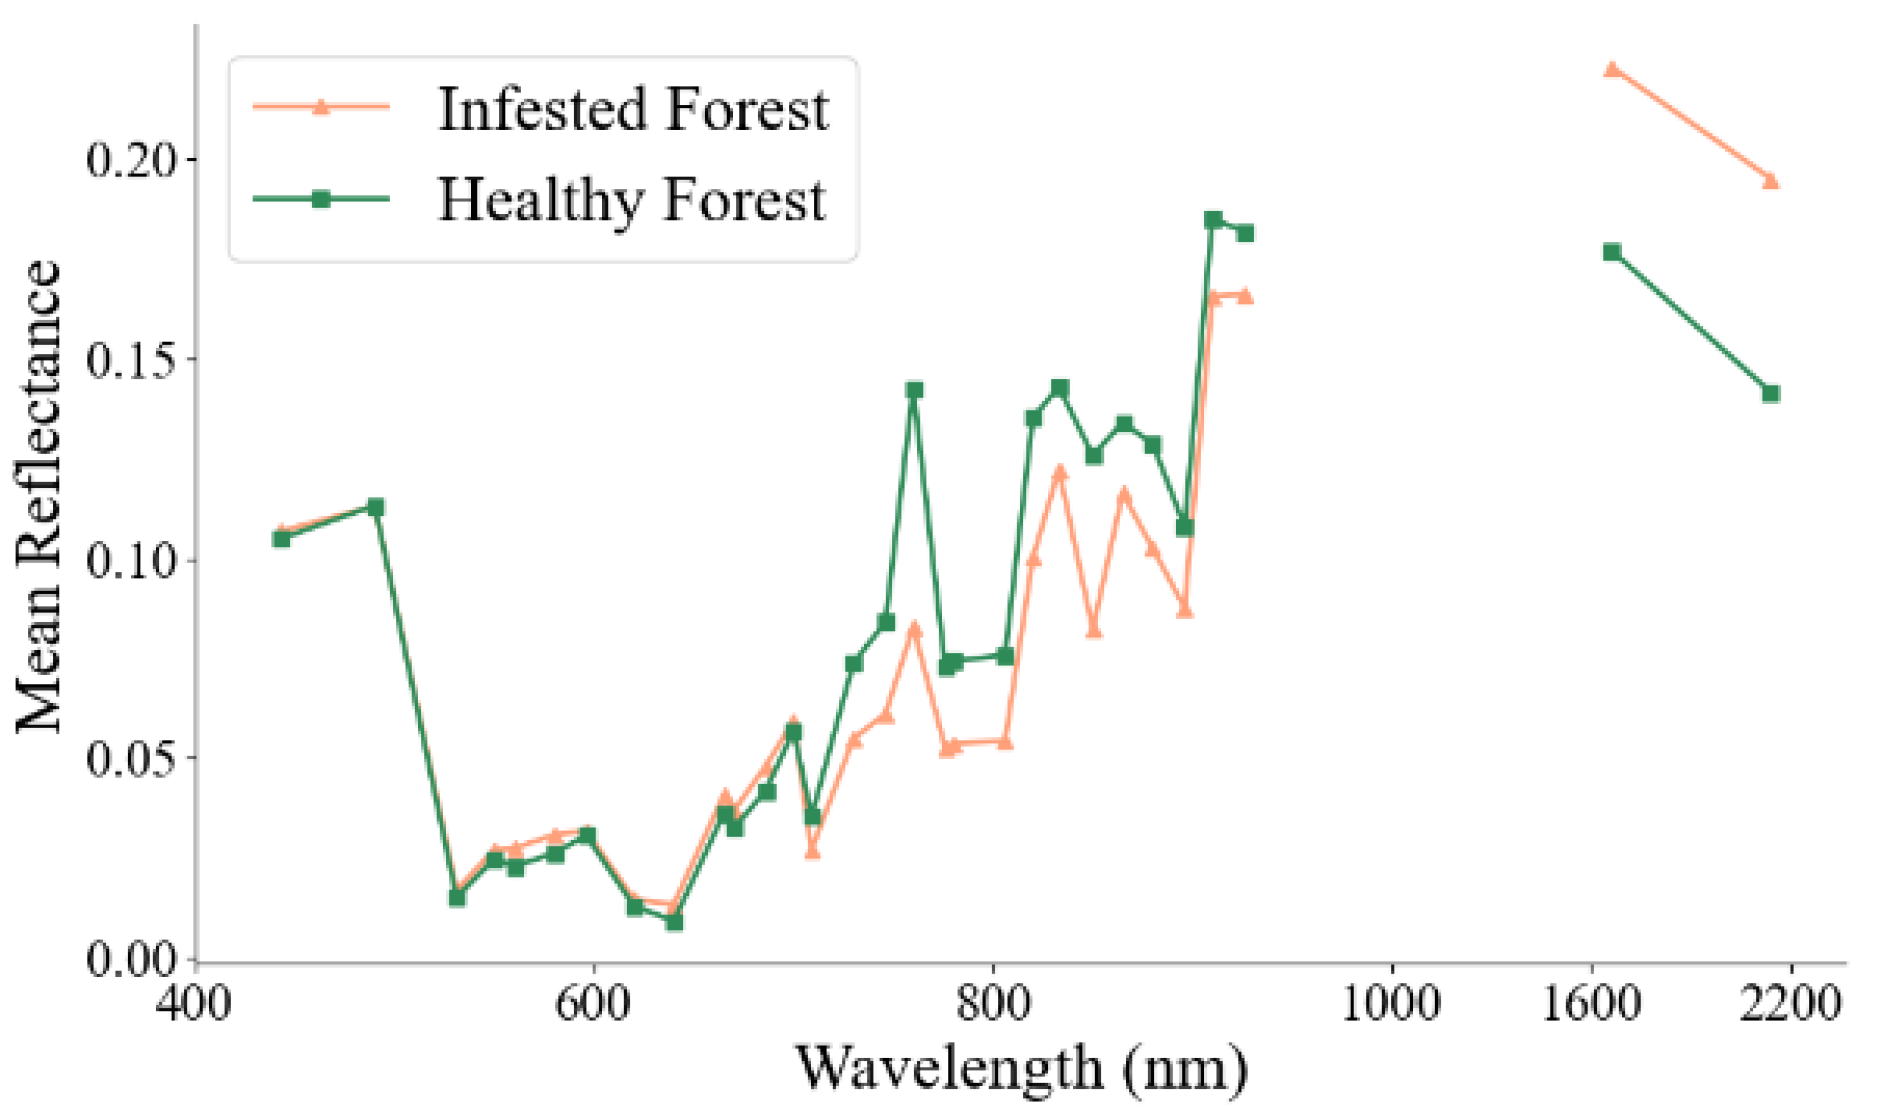
The average spectral reflectance curves of the combined image from Zhuhai-1 hyperspectral and Sentinel-2 multispectral data are shown in Figure 4. Based on whether the trees were affected by pest infestation, the areas were categorized into healthy forest and infested zones. The integrated image exhibits distinct spectral absorption features centered at bands 9, 14, 18, and 26. In the visible region, strong chlorophyll absorption leads to lower spectral reflectance. The average reflectance in infested areas is higher than that of healthy forests. In the near-infrared region, reflectance increases as it reflects the structure and health status of vegetation leaves. Reflectance is higher in leaves with more intact and compact structures. In areas affected by larch caterpillar infestation, leaf damage caused by feeding leads to significantly lower spectral reflectance compared to healthy forests. In the short-wave infrared region, vegetation reflectance begins to decline. This spectral region is highly sensitive to vegetation water content and chemical composition. Pest damage leads to reduced moisture content and structural damage or even partial loss of leaf tissue, resulting in higher spectral reflectance in infested areas compared to healthy forest areas in the short-wave infrared bands.

3.2. Feature Extraction and Selection Results

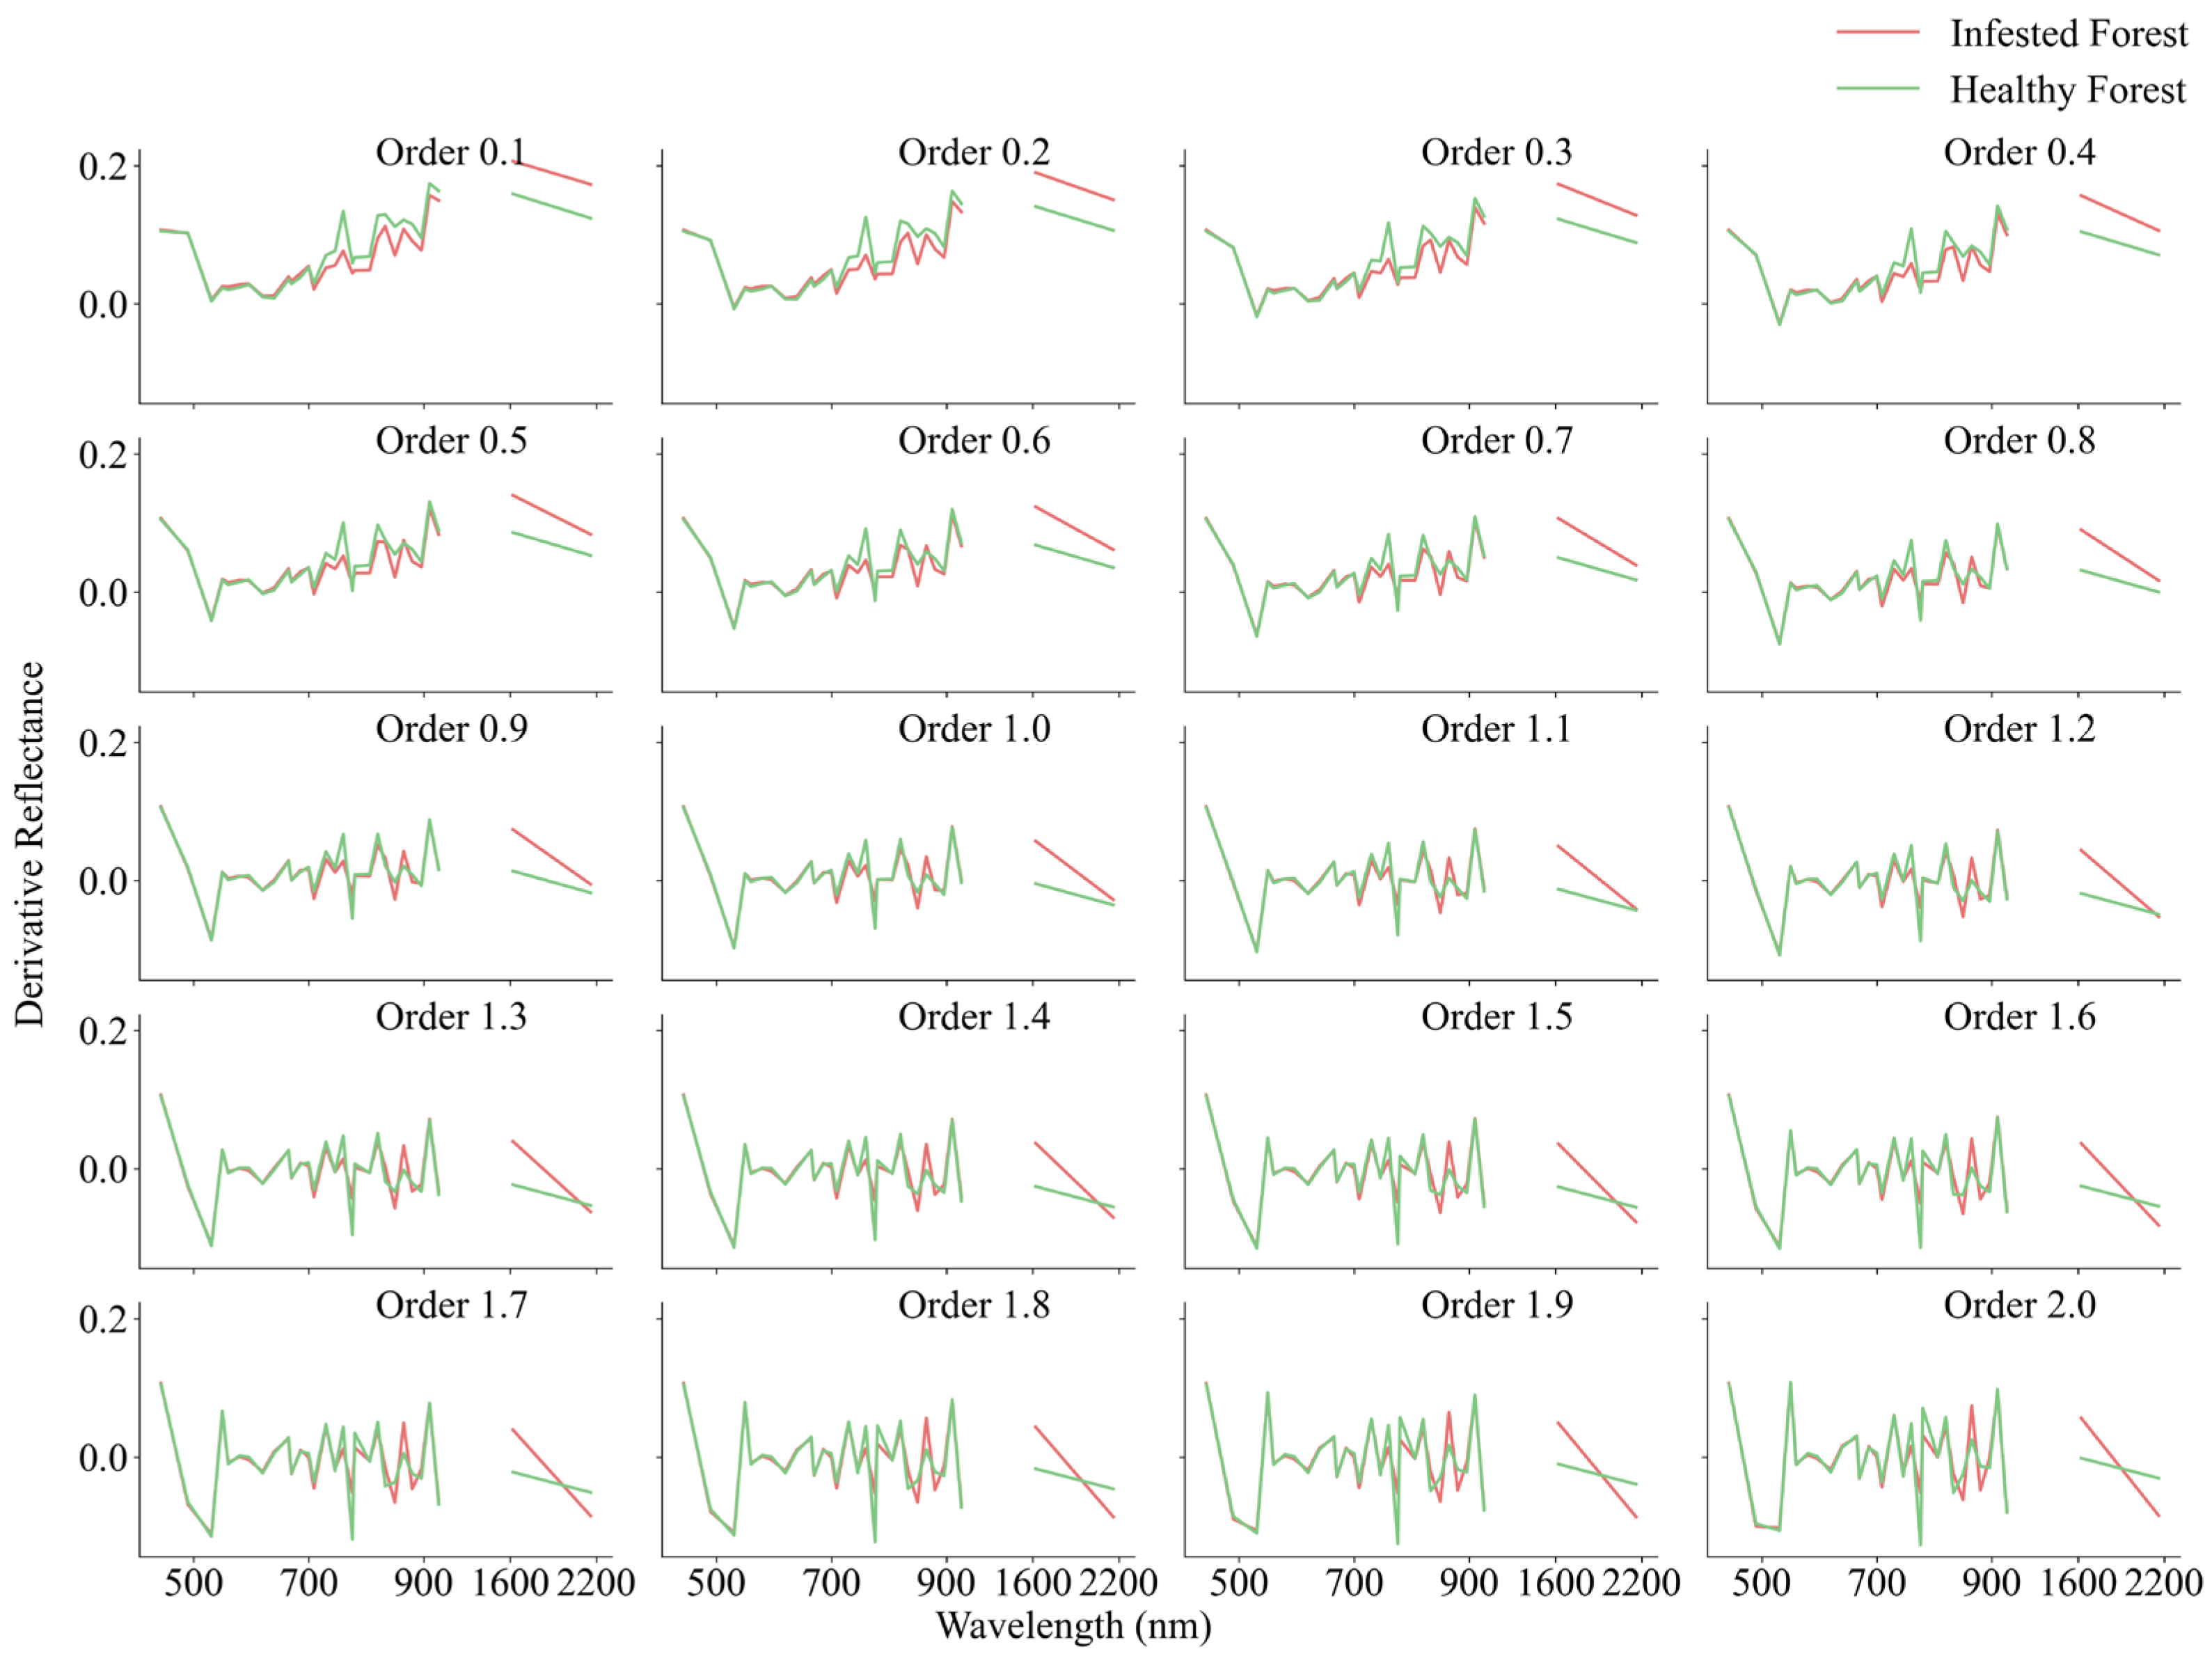
Based on the four spectral absorption peaks identified from the spectral reflectance curves, a total of 87 spectral index features were calculated, including 29 DI, 29 RI, and 29 NDI. FOD features were computed using the Grünwald–Letnikov (G–L) definition for 20 fractional derivative orders ranging from 0.1 to 2.0 with intervals of 0.1, as shown in Figure 5. At lower fractional orders, the FOD features showed minimal differences from the original spectral bands. As the order increased, the number of absorption peaks grew and their amplitudes became steeper, resulting in greater deviation from the original spectra. When the fractional order exceeded 1.6, noise amplification occurred, further increasing the number of peaks and sharpening their profiles. By calculating and comparing the spectral reflectance differences between infested and healthy forest areas for each band at different fractional orders, the ten bands that most frequently appeared among the top ten differences were identified: 15, 16, 17, 18, 21, 23, 24, 25, 29, and 30. Combining the performance of FOD features at different orders, their number, and the selection ranges reported in previous studies, FOD features within the order range of 0.8–1.6 were selected. In total, 215 features were obtained, including 30 original spectral bands, 87 spectral index features, 90 FOD features, and 8 texture features. To reduce redundancy and identify the optimal feature subset, GA was employed for feature selection. The resulting optimal subset contained 49 features, comprising 14 band features (11 from Zhuhai-1 and 3 from Sentinel-2), 17 spectral index features (including 8 DI, 4 RI, and 5 NDI), 17 FOD features (covering fractional orders from 0.8 to 1.6), and 1 texture feature (angular second moment). These selected features were subsequently used as model inputs for larch caterpillar damage detection.

3.3. Comparison of Accuracy and Applicability Across Different Models

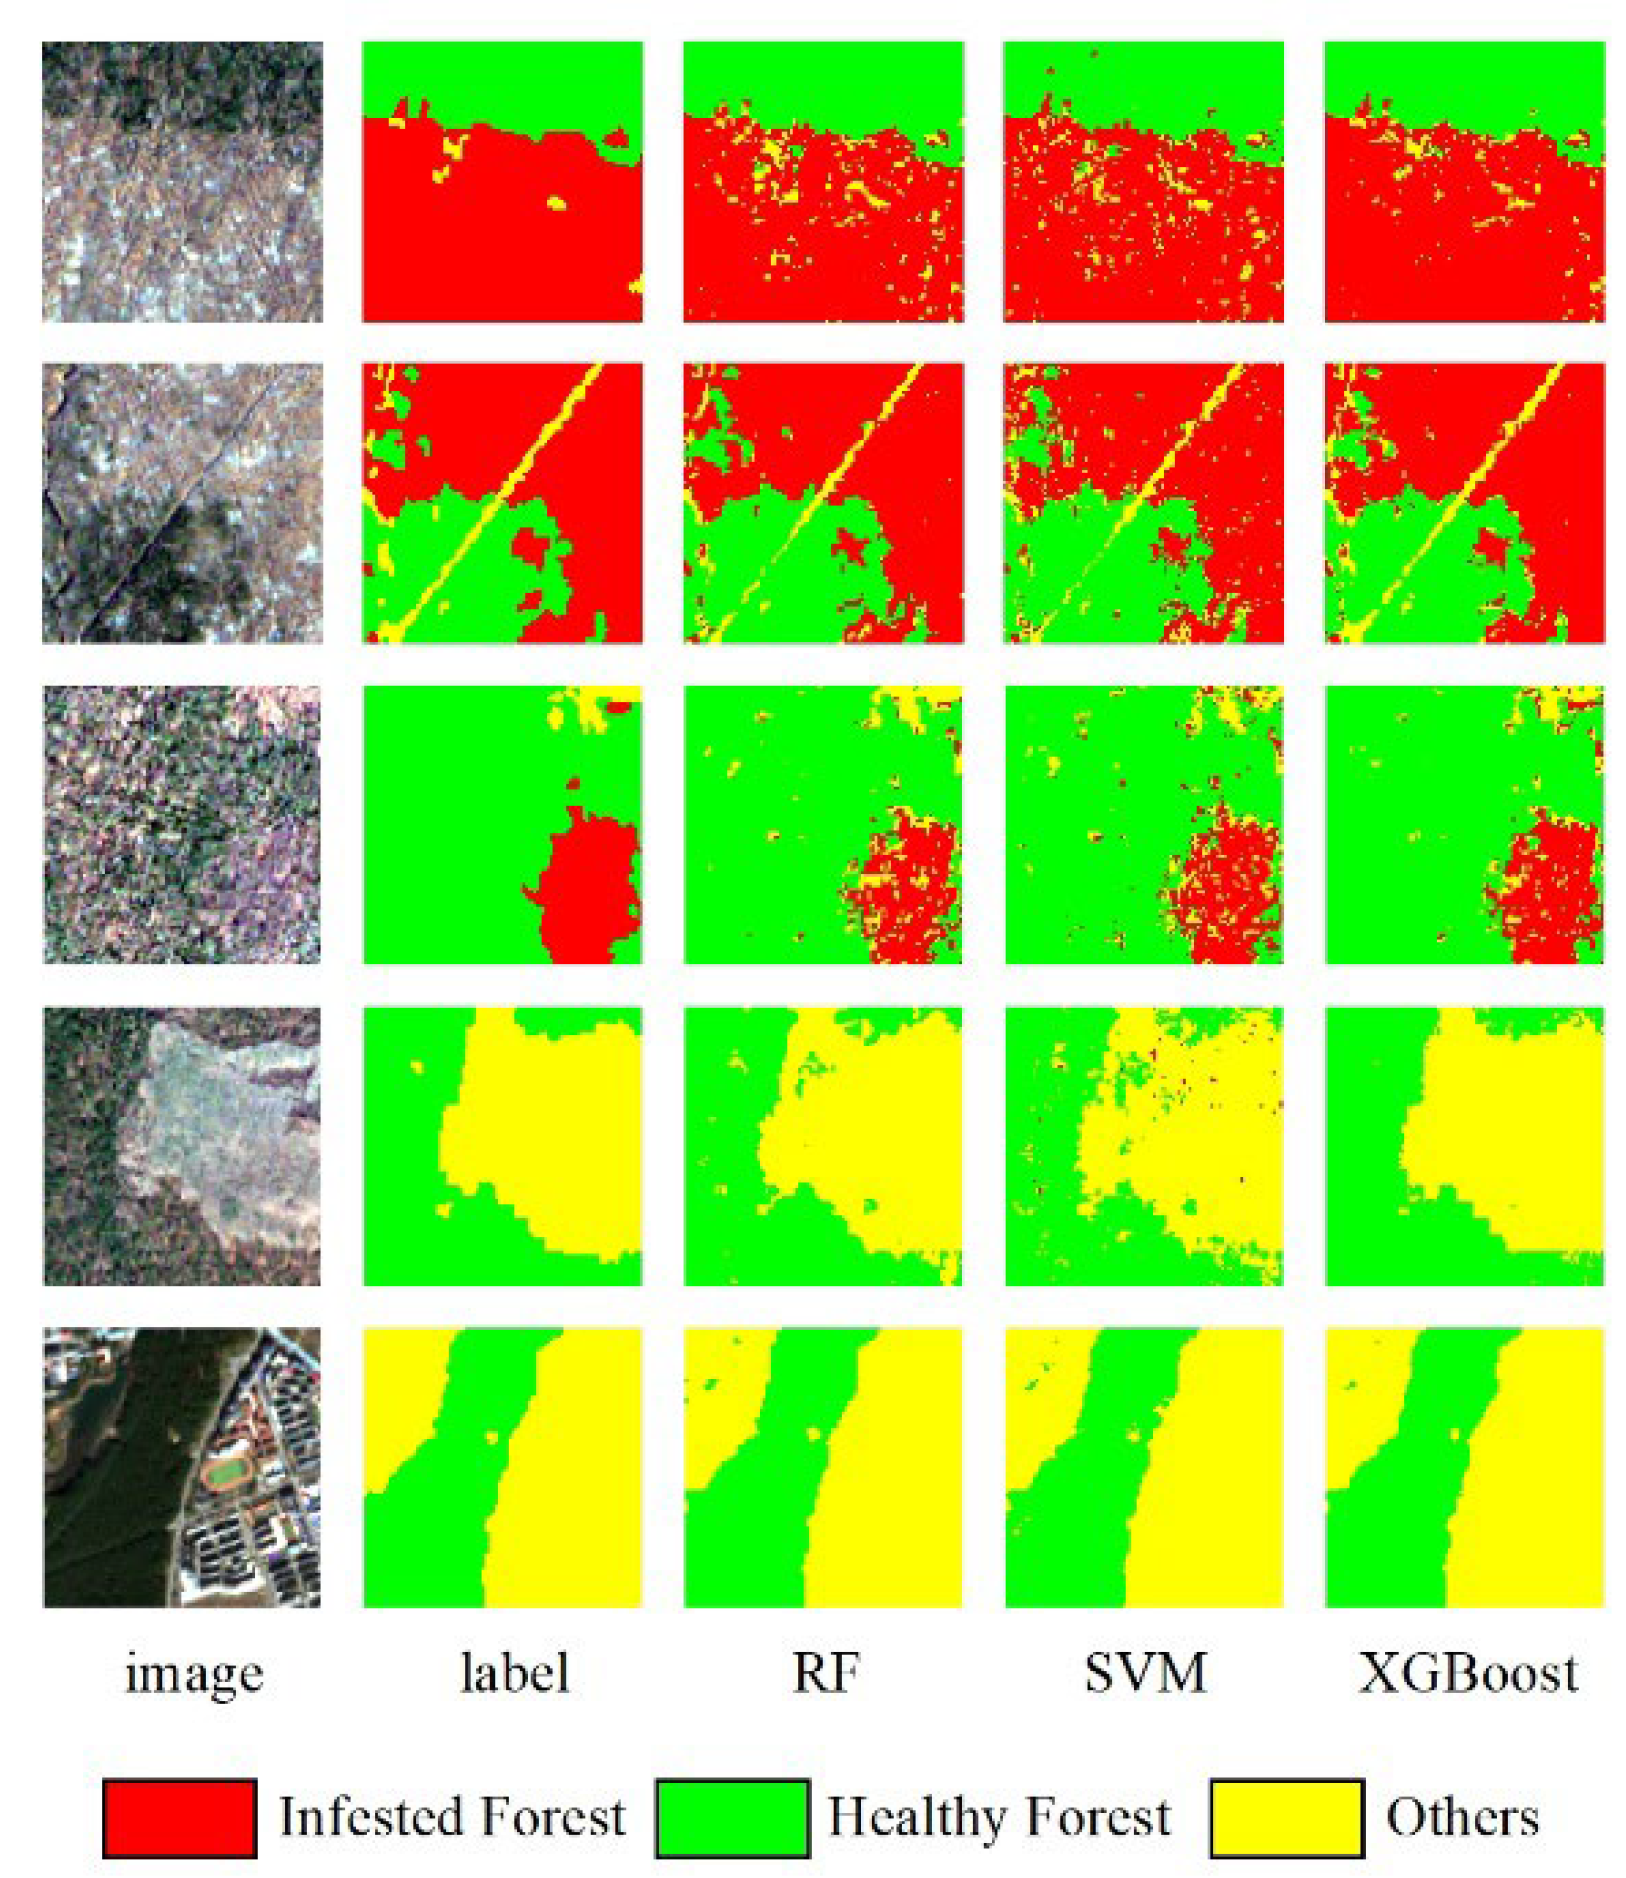
A comparison of the accuracies of the three models, RF, SVM, and XGBoost, is shown in Table 2. Among them, the XGBoost model achieved the highest overall accuracy of 93.47% and a Kappa coefficient of 89.81%. The overall accuracies of the RF and SVM models were 91.20% and 90.86%, respectively, with Kappa coefficients of 87.33% and 84.92%. These results indicate that the XGBoost model outperforms the other two models in all evaluation metrics, while the SVM model performs the worst. Validation using labeled image patches yielded results as shown in Figure 6 and Table 3. These results are consistent with the overall model evaluations, and the XGBoost model still demonstrates the highest accuracy, with an overall accuracy of 93.03%. The detection results indicate that some areas exhibit noticeable fragmentation, a common issue in pixel-based detection methods. However, the degree of fragmentation in the results from the XGBoost model is clearly lower than in the RF and SVM models. This demonstrates the effectiveness of the XGBoost method in handling high dimensional features and its suitability for detecting larch caterpillar infestations, effectively mitigating the issue of fragmented detection.
This study conducted a systematic comparison of the modeling performance of the XGBoost method under three image input scenarios: using only Zhuhai-1 bands, using only Sentinel-2 bands, and using a combination of both. As shown in Table 4, the model built with the combined bands outperformed those based on a single image source in identifying damaged forest areas. Specifically, the combined-band model achieved an overall accuracy of 88.78%, which is 5.88% and 1.11% higher than the models using only Sentinel-2 and Zhuhai-1 bands, respectively. The Kappa coefficient was 87.36%, 14.16% and 1.04% higher than those using Sentinel-2 and Zhuhai-1 alone, respectively. These findings indicate that fusing multi-source remote sensing data allows for more comprehensive capture of the spectral and spatial characteristics of affected areas, thereby enhancing the model’s discrimination ability. Additionally, the accuracy of models using Zhuhai-1 hyperspectral imagery was higher than that of models using Sentinel-2 multispectral imagery, with improvements of 4.77% in overall accuracy and 13.12% in the Kappa coefficient. This highlights the inherent advantage of hyperspectral data in capturing subtle spectral variations and detecting forest pest damage. In contrast, Sentinel-2 imagery, characterized by fewer bands and coarser spectral resolution, exhibited the weakest performance. These results further confirm the critical role of multi-source data and hyperspectral imagery in enhancing classification accuracy.
Four XGBoost models were constructed based on different feature combinations for comparison, including combinations of spectral bands with spectral indices, spectral bands with FOD features, spectral bands with texture features, and the optimal feature subset selected by the GA. As shown in Table 4, the experimental results showed that models incorporating two or more feature types significantly outperformed the model based solely on spectral bands, indicating that multi-feature integration substantially enhances the model’s capacity to identify infested forest areas. Among them, the models based on the combinations of spectral bands with spectral indices and spectral bands with FOD showed particularly strong performance, achieving overall accuracies of 92.44% and 91.86%, and Kappa coefficients of 88.28% and 88.73%, respectively. This confirms the important role of spectral indices and FOD in enhancing spectral differences and capturing features sensitive to larch caterpillar infestation. The model based on the optimal feature combination selected by GA achieved the highest performance. These results further validate the comprehensive advantages of multiple features in the detection of damaged forests and provide a solid foundation for subsequent modeling, demonstrating the effectiveness of GA-based feature selection.

3.4. Mapping of Infested Forest Detection Results

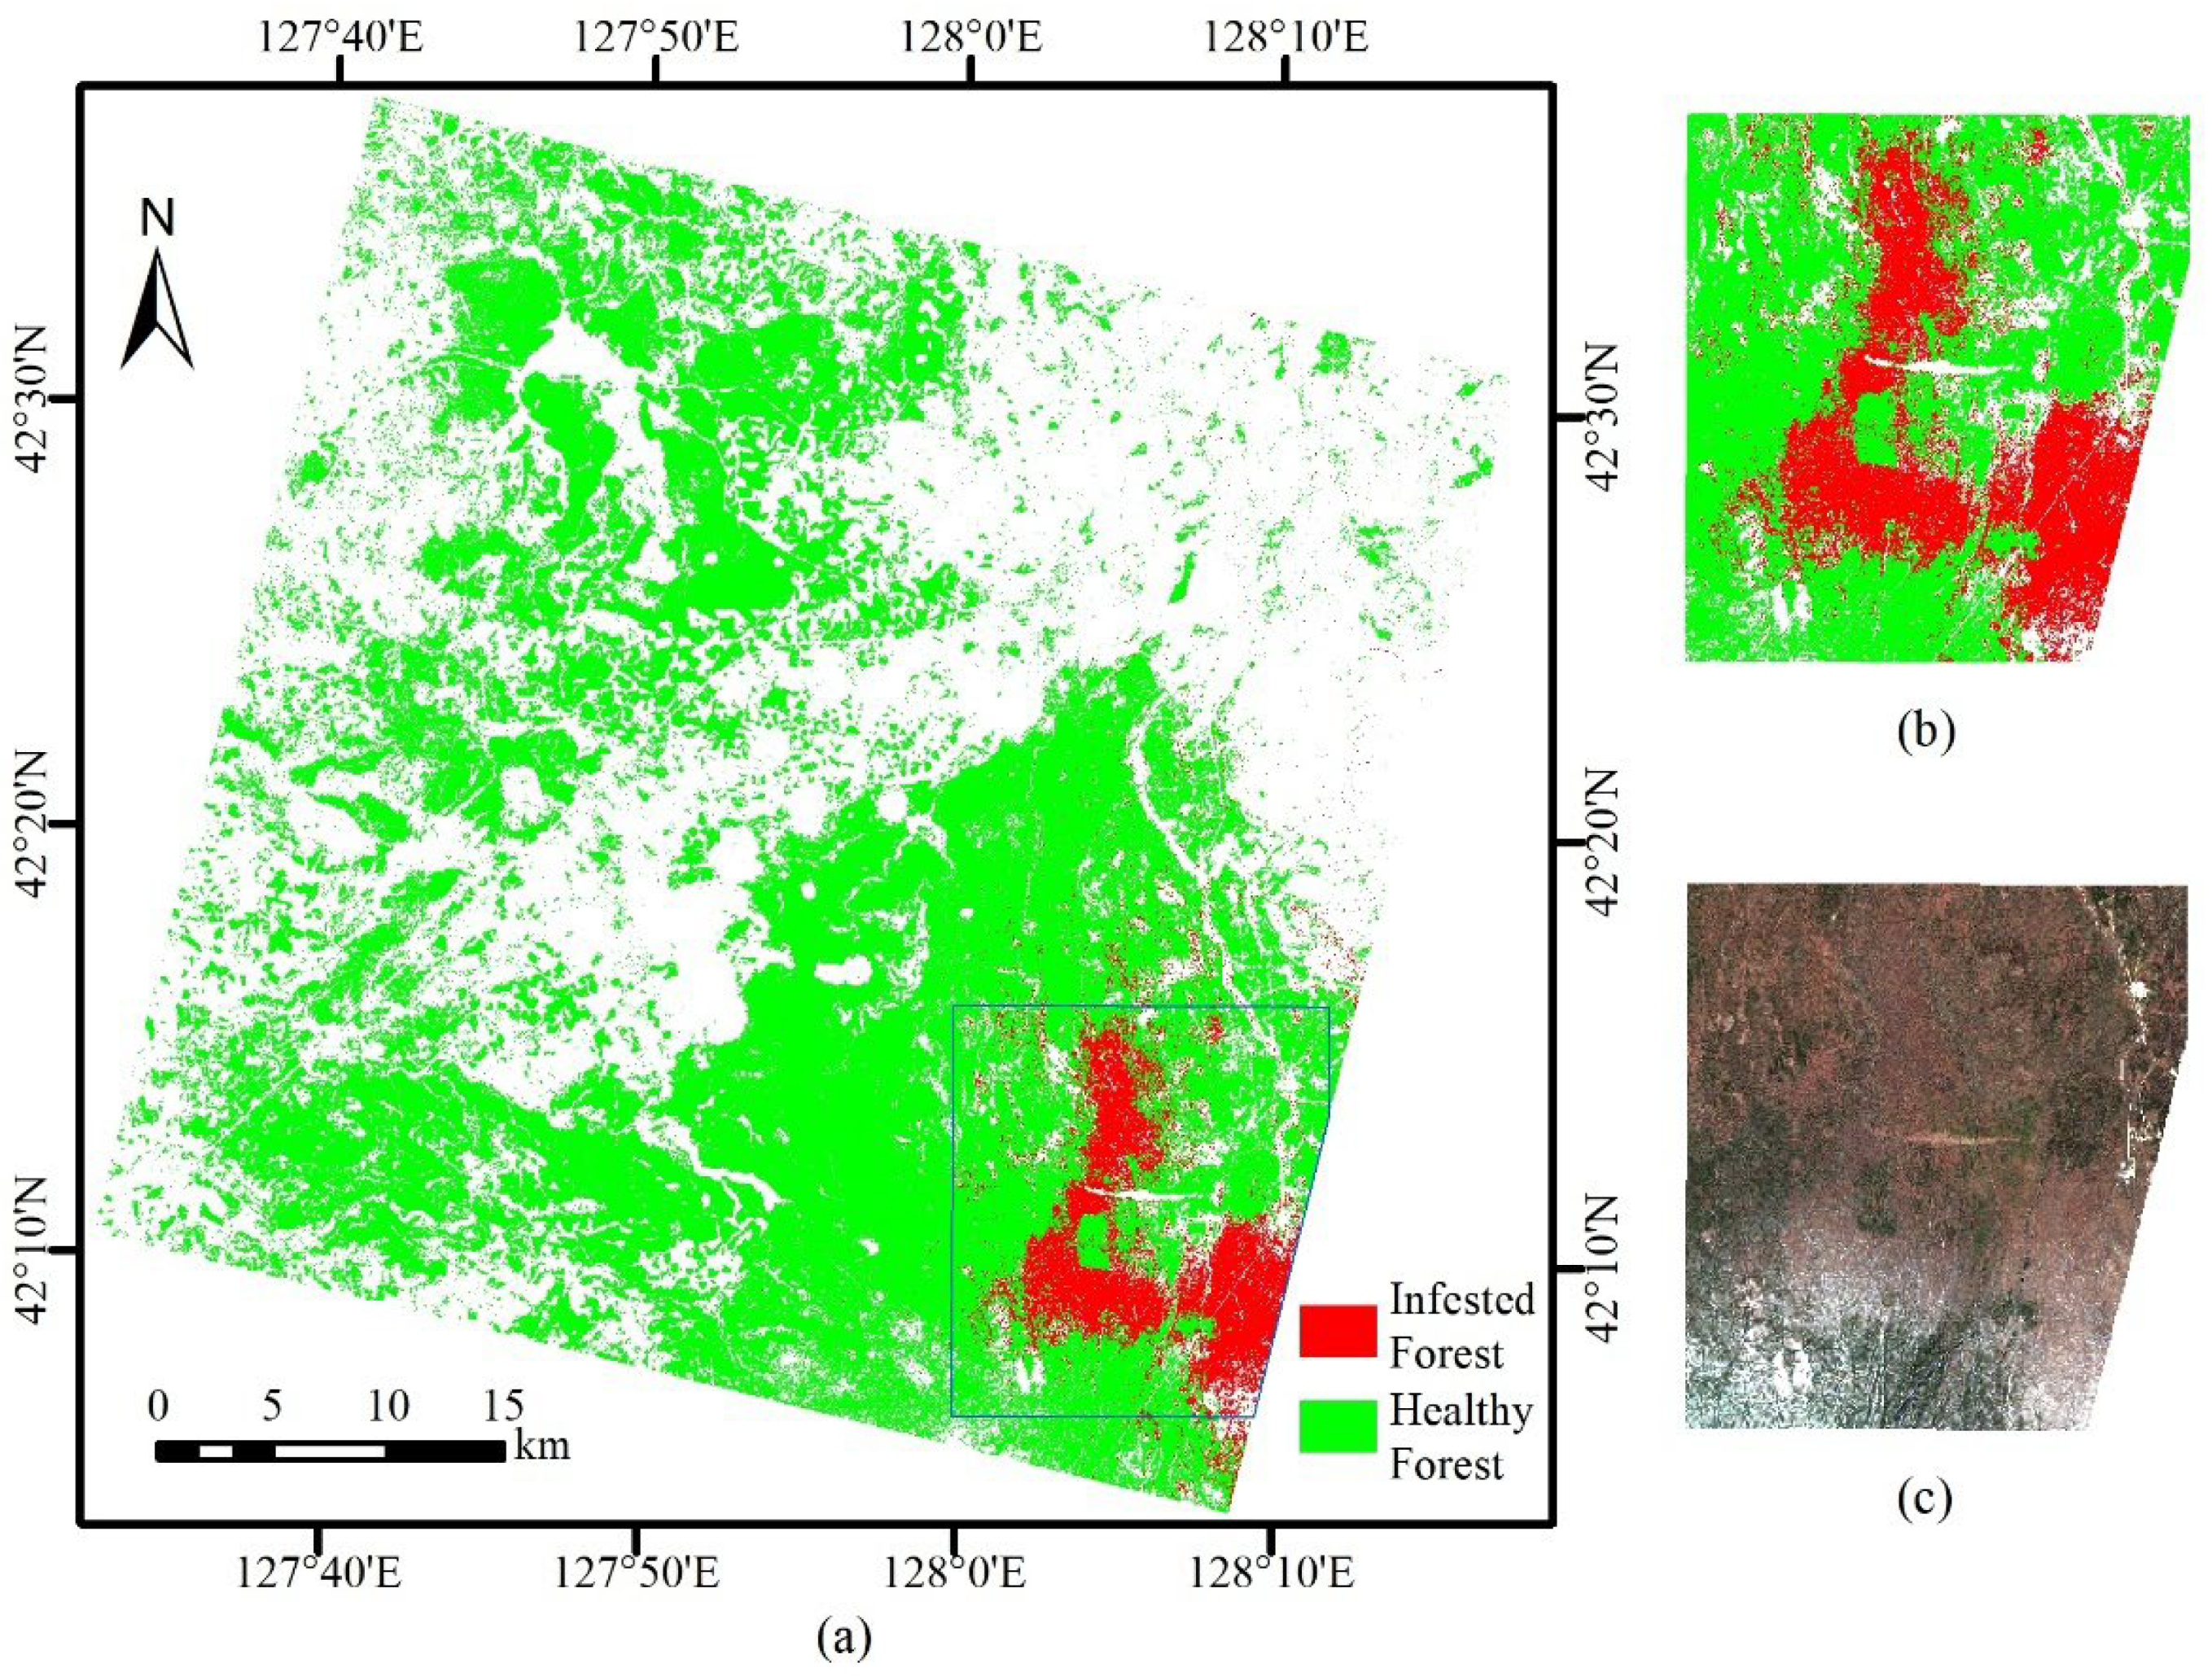
The GA-optimized XGBoost model (GA-XGBoost) was applied to the entire study area to comprehensively detect damaged forest regions. The final detection results are shown in Figure 7a, with Figure 7b showing the area where larch caterpillar infestations are concentrated, and Figure 7c presents the imagery of this region. According to the detection results, the area of healthy forest is approximately 1113.5 km2. The affected forest is primarily concentrated in the lower-right part of the study area, specifically on the northern slope of the Changbai Mountain National Nature Reserve, covering approximately 82.5 km2, which accounts for 6.90% of the total forested area. The infested forest in this region is distributed in a patchy pattern, with the pest outbreak exhibiting highly concentrated and large-scale spread characteristics, indicating a certain degree of spatial continuity and scale in the spread of larch caterpillar infestation. This observation is consistent with previous studies on larch caterpillar outbreaks in the region, further validating the reliability and applicability of the proposed model for practical pest detection. Since the first outbreak of larch caterpillars on the northern slope of Changbai Mountain in 2019, forest recovery has been slow, and large areas of yellowing or dead forest remain in some parts of the region. In addition to damaged and healthy forests, other land cover types such as residential areas, bare land, and water bodies are present in the study area, mainly distributed in the northeastern, central, and northwestern regions. The application of this model not only effectively identified the core impacted areas of the larch caterpillar infestation but also provides scientific support for future ecological monitoring and pest control planning.

3.5. Interpretability Analysis of Feature Importance Based on the SHAP Method

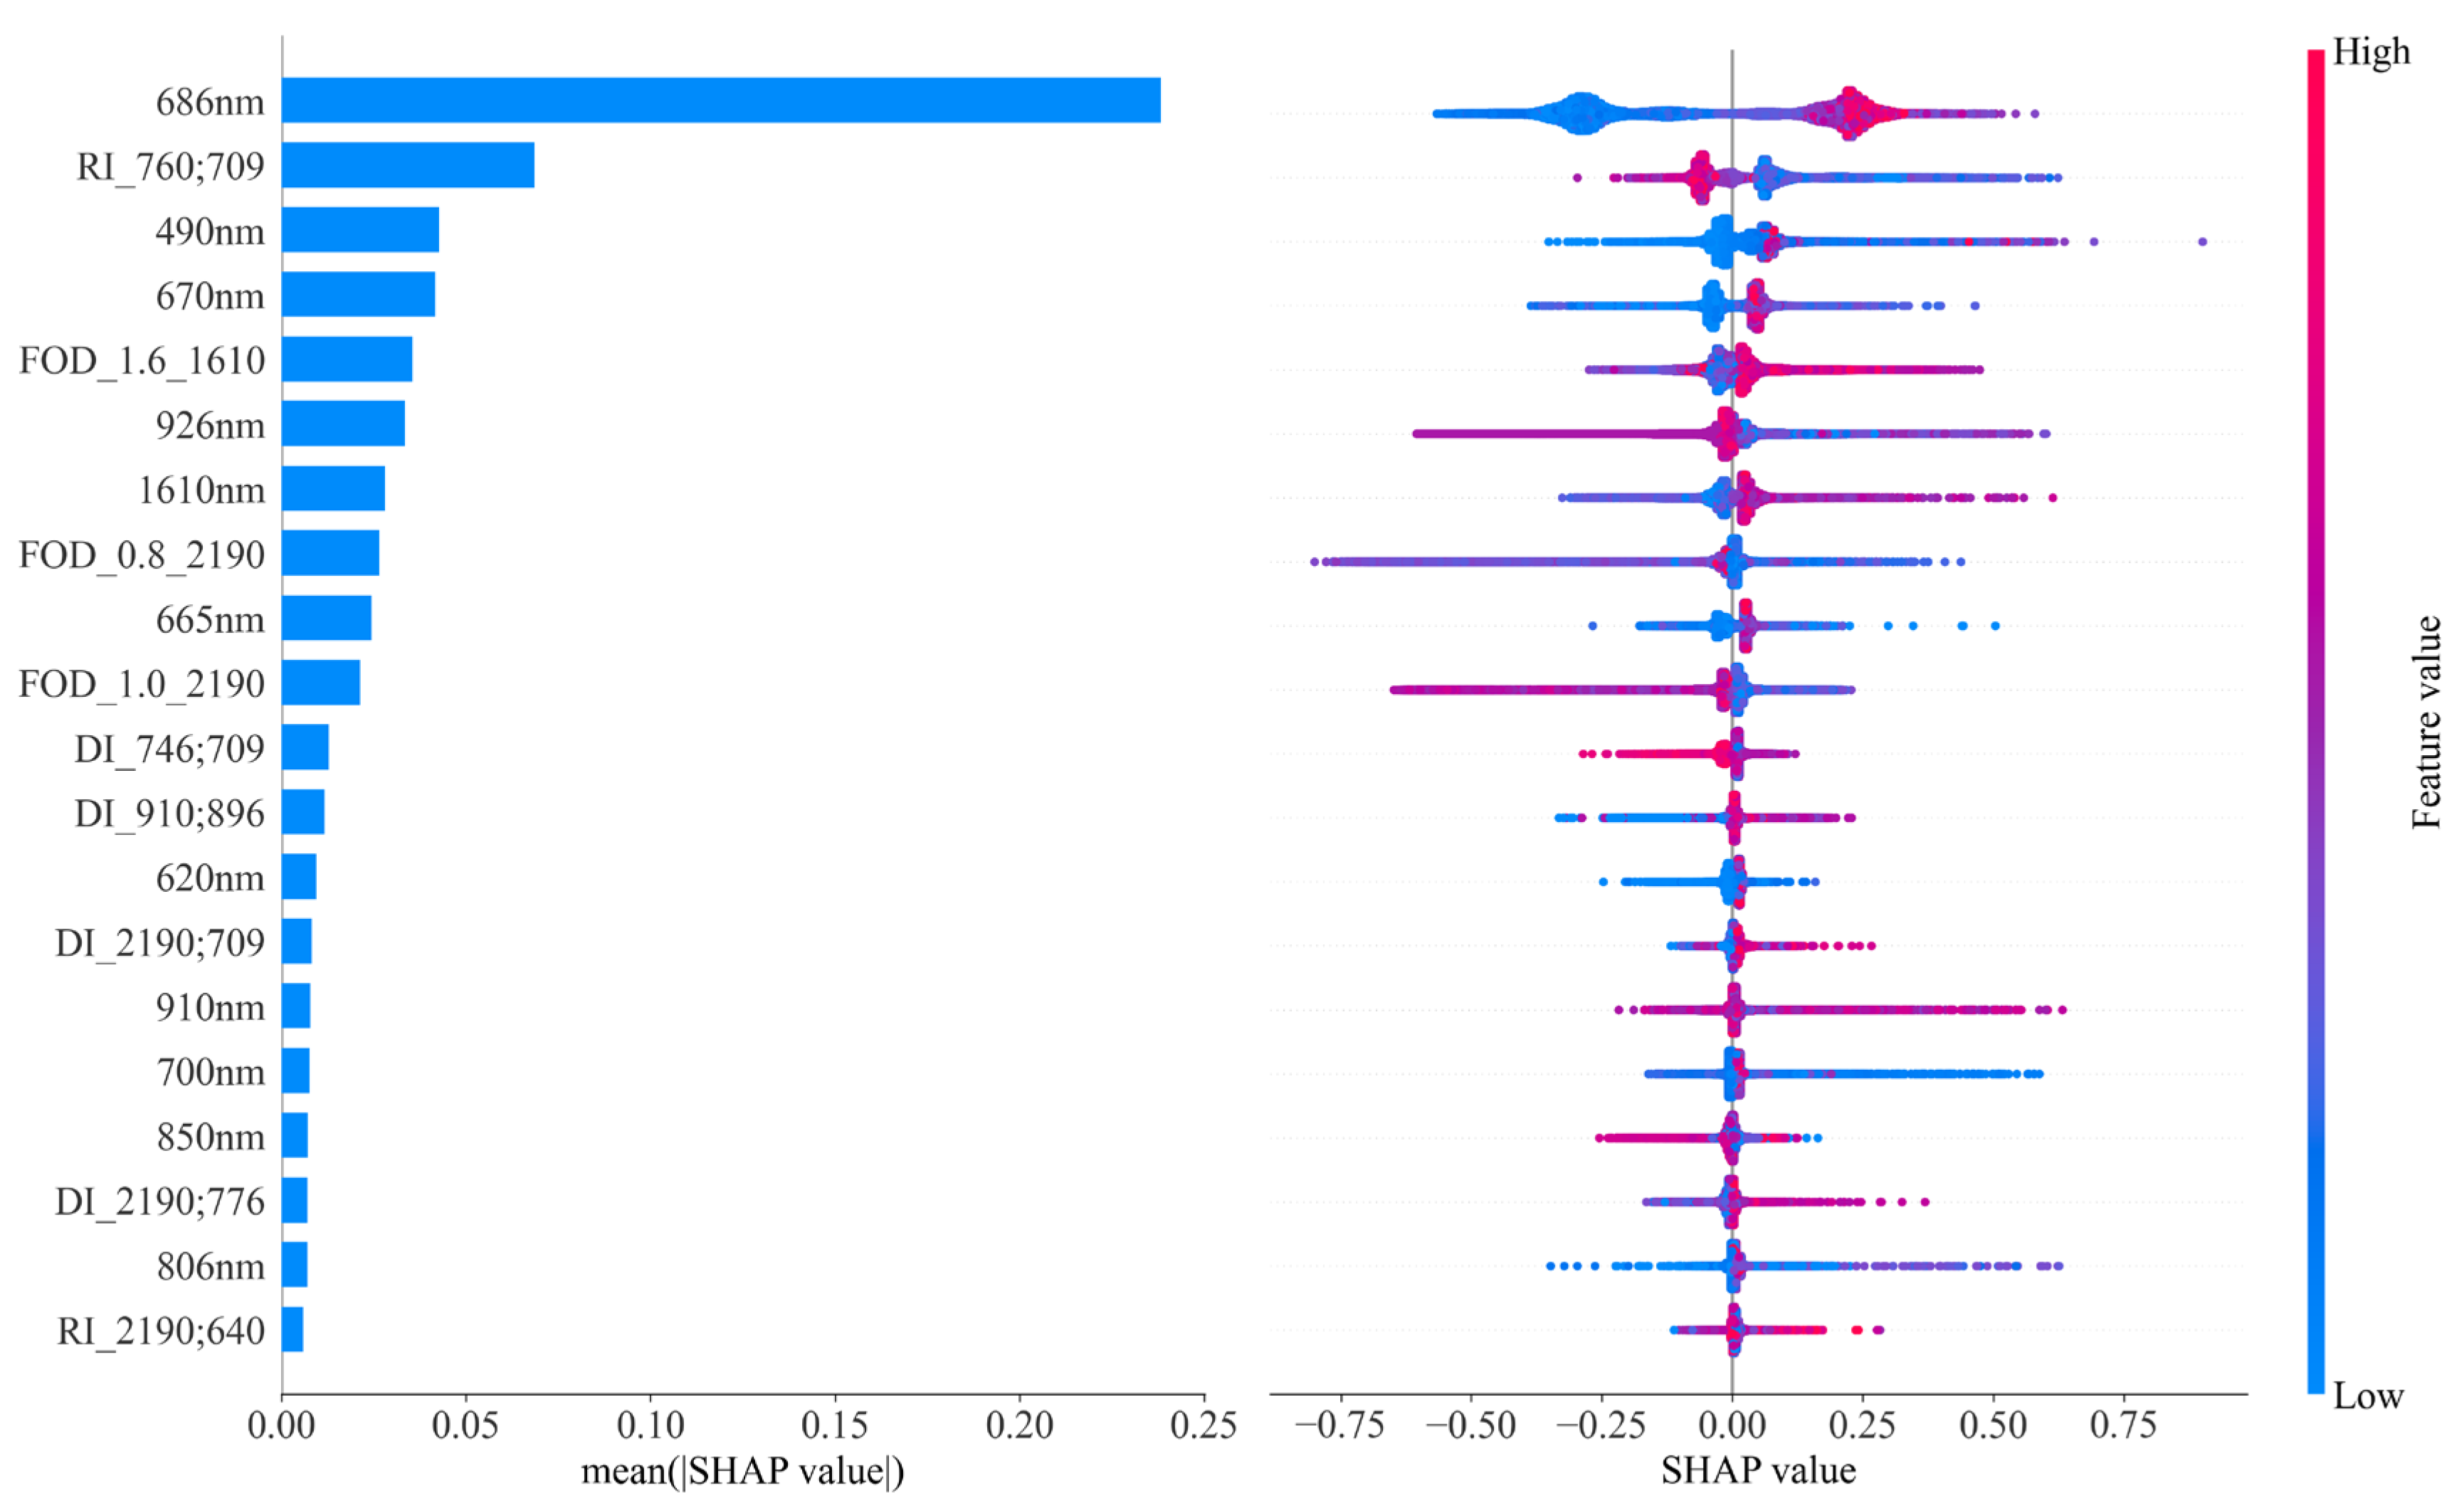
The feature importance analysis of the 49 features selected by the GA method based on SHAP is shown in Figure 8. The importance bar plots and scatter plots generated by SHAP clearly illustrate the varying influence levels of different feature types on model predictions. Among these, the Zhuhai-1 hyperspectral bands exhibited relatively high importance, with the band centered at 686 nm (the 15th band, covering 682–689 nm) displaying the highest importance among all features, indicating its strong discriminative capability for identifying damaged forest areas. Additionally, the 2nd and 11th bands of Sentinel-2 also exhibited considerable importance, highlighting the effectiveness of band integration and the significance of the short-wave infrared bands. Furthermore, spectral indices and FOD exhibited notable contributions, further confirming their unique advantages in enhancing spectral details and capturing subtle vegetation differences. This underscores their essential role in comprehensively characterizing vegetation health status.

4. Discussion

4.1. Effectiveness of Combining Hyperspectral and Multispectral Bands and Feature Selection

In forest pest monitoring, many studies are based on single-source data, using either multispectral or hyperspectral imagery alone. Even in multi-source approaches, the data are typically combined with UAV imagery or LiDAR, and there are few studies that integrate multispectral satellite imagery with hyperspectral satellite imagery. In other fields, Feng et al. used a convolutional neural network to fuse the spectral and spatial features of Zhuhai-1 hyperspectral and Sentinel-2 multispectral imagery, improving impervious surface detection accuracy at 10 m resolution [37]. Wang et al. expanded the spectral range and replaced noisy bands to fuse the two types of imagery, enhancing soil organic matter estimation accuracy and verifying the effectiveness of multi-source remote sensing data fusion [38]. These studies collectively indicate that integrating Zhuhai-1 hyperspectral and Sentinel-2 multispectral imagery can substantially enhance result accuracy. In this study, we applied this integration strategy to forest pest monitoring. The combination of Zhuhai-1 hyperspectral and Sentinel-2 multispectral imagery expanded the wavelength coverage, improved data quality, and significantly improved the detection accuracy of affected forest areas. Specifically, Zhuhai-1 hyperspectral data, with its high spectral resolution, effectively captures subtle variations in vegetation reflectance across different wavelengths, particularly in the near-infrared region, which is highly sensitive to vegetation health. The addition of Sentinel-2 multispectral imagery compensates for the lack of short-wave infrared bands in the Zhuhai-1 data and effectively replaces some visible bands that are heavily affected by noise. Compared with using the original Zhuhai-1 hyperspectral and Sentinel-2 multispectral imagery independently, the use of combined imagery significantly improved the detection accuracy of larch caterpillar infestations. The overall accuracy of the combined bands was 5.88% and 1.11% higher than using Sentinel-2 or Zhuhai-1 bands alone, respectively, indicating the effectiveness of band combination. Based on this, an optimal feature set was obtained through GA-based feature selection. This process effectively eliminating redundant information and retained the most informative features, improving the model’s processing speed, stability, and generalization ability. Comparative experimental results show that the optimal feature combination achieved an overall accuracy of 93.47%, which is 1.03%, 1.61%, and 3.97% higher than the combinations of spectral bands with spectral indices, FOD, and texture features, respectively. It also outperformed the OA of 91.72% reported by Wu et al., who used Sentinel-1 SAR and Sentinel-2 data for larch caterpillar detection [39]. He-Ya et al. combined UAV multispectral and LiDAR features achieved an accuracy of 95.8% in assessing the severity of pine caterpillar infestations [10], suggesting that satellite imagery is still less precise than UAV-based methods in terms of detail, but offers advantages such as broader spatial coverage. These results confirm the significant advantages and practical value of band combination and feature selection methods in the remote sensing detection of forest pest infestations. However, this study is limited to remote sensing data from a single period in 2022, which does not coincide with the optimal monitoring window for larch caterpillar infestations (July–August). Consequently, temporal and phenological variations may have affected the monitoring results, constraining the model’s transferability across outbreak years. Future work will leverage multi-year and multi-period data to rigorously evaluate the model’s robustness and generalizability.

4.2. Effectiveness of the XGBoost Model and Sensitivity of FOD Features to Pest Infestation

Traditional machine learning and deep learning models are the most commonly used approaches in forest pest monitoring. However, deep learning requires a large amount of training data and high-performance computing resources. Therefore, in this study, we chose the most commonly used models—RF, SVM and XGBoost—for comparative analysis [40]. A comparative evaluation of the RF, SVM, and XGBoost models shows that the XGBoost model has the best suitability for larch caterpillar infestation detection using multiple features. It achieved the highest overall accuracy of 93.47%, which is 2.27% and 2.61% higher in overall accuracy than RF and SVM, respectively. This conclusion is consistent with other studies, which have shown that, after appropriate hyperparameter tuning, XGBoost generally outperforms RF [41]. Since a pixel-based detection method was used, some degree of fragmentation is unavoidable. However, based on the detection results of 100 × 100-pixel patches, SVM produced the most fragmented results, followed by RF, while XGBoost yielded the least fragmented output. This further validates the suitability of XGBoost for larch caterpillar detection. Larch caterpillar infestation reduces pigment and moisture content and weakens vegetation activity, which manifests in hyperspectral data as increased reflectance in the visible region, decreased reflectance in the near-infrared region, and a slower rise in the red-edge region, resulting in a “red-edge blue shift” [42]. FOD features can enhance these spectral differences. Zhang et al. (2023) [43] applied FOD to wheat hyperspectral data and built 0–2.0 order spectral models, significantly improving stripe rust identification accuracy. The enhancement effect of FOD can be explained by the Grünwald–Letnikov (G-L) mathematical theory. In spectral curves with certain peak-valley structures, when the sampling interval is smaller than the peak-valley width, FOD calculations significantly amplify the relative rate of change, thereby enhancing the spectral response to vegetation stress [44]. Since fractional derivatives extend the order into non-integer domains, they enrich the curve details beyond those provided by integer-order derivatives, thereby enabling the extraction of more informative features from remote sensing data. Liu et al. applied FOD for soil organic matter prediction and used a significance level of 0.05 for feature selection. A large number of FOD features with orders ranging from 0.6 to 1.3 passed the significance test, providing a data basis for subsequent soil organic matter content prediction [20]. This demonstrates that FOD features within a similar order range can enhance feature representation, which is broadly consistent with the FOD order range selected in the present study. Consequently, FOD features can play a critical role in enhancing the remote sensing detection accuracy of larch caterpillar infestations and serve as important spectral parameters for vegetation stress detection and classification. However, the effectiveness of FOD strongly depends on factors such as sampling interval, spectral resolution, and the quality of atmospheric correction. In multispectral data with relatively low resolution or bands heavily affected by noise, FOD may amplify errors and reduce classification accuracy. Therefore, the advantages of FOD can only be fully realized when matched with appropriate data conditions.

5. Conclusions

In this study, we developed a novel method that integrates Zhuhai-1 hyperspectral imagery with corresponding Sentinel-2 multispectral imagery for the detection of larch caterpillar infestations. By combining techniques such as FOD, machine learning, and GA, we achieved high-precision detection of infested areas. The results show that the use of combined spectral bands significantly improved detection accuracy. Compared to XGBoost models using only Sentinel-2 or Zhuhai-1 hyperspectral bands, the combined spectral band approach increased the overall accuracy by 5.88% and 1.11%, respectively, reaching 88.78%. This highlights the importance of multi-source data integration in enhancing classification performance. Among the three machine learning models evaluated, XGBoost achieved the highest detection accuracy at 93.47%, outperforming RF and SVM by 2.27% and 2.61%, respectively. Furthermore, visual comparison using labeled patches indicates that the XGBoost model effectively reduced the fragmentation commonly seen in pixel-based detection methods. This demonstrates XGBoost’s effectiveness in handling high-dimensional features and its strong suitability for larch caterpillar detection. Feature importance was assessed using the SHAP method based on the optimal feature set. The results revealed that Band 15 of the Zhuhai-1 hyperspectral imagery was the most important and highly sensitive to infestation, with a wavelength range of 682 nm to 689 nm. FOD features, other hyperspectral and multispectral band features, and spectral indices also played critical roles in the detection process. In particular, FOD features enhanced the spectral response to vegetation stress variations, effectively capturing physiological changes induced by larch caterpillar infestation. These findings confirm the sensitivity of FOD features and Zhuhai-1 hyperspectral bands to pest damage, which is of great significance for the timely detection and prevention of larch caterpillar outbreaks. This study employed remote sensing data from a single time point for experimentation; consequently, the transferability of these results has not yet been verified in other regions or years. Future work will aim to test the proposed method across different periods and locations.

Author Contributions

Conceptualization, M.W. and D.C.; methodology, M.W. and D.C.; software, J.Z.; validation, M.W., D.C. and J.Z.; formal analysis, F.W.; investigation, D.C.; resources, M.W.; data curation, X.X. and L.L.; writing—original draft preparation, M.W. and D.C.; writing—review and editing, M.W., F.W. and Q.D.; visualization, M.W. and J.Z.; supervision, Y.Z. and J.C.; project administration, M.W.; funding acquisition, M.W. All authors have read and agreed to the published version of the manuscript.

Funding

This research was funded by the National Natural Science Foundation of China (No. 42171407, 42077242), the Key Program of the National Natural Science Foundation of China (No. 42330607).

Data Availability Statement

The data presented in this study are available upon request from the corresponding author. The data are not publicly available due to the university’s confidentiality agreement.

Conflicts of Interest

The authors declare no conflicts of interest.

References

  1. Freer-Smith, P.H.; Webber, J.F. Tree Pests and Diseases: The Threat to Biodiversity and the Delivery of Ecosystem Services. Biodivers. Conserv. 2017, 26, 3167–3181. [Google Scholar] [CrossRef]
  2. Mngadi, M.; Germishuizen, I.; Mutanga, O.; Naicker, R.; Maes, W.H.; Odebiri, O.; Schroder, M. A Systematic Review of the Application of Remote Sensing Technologies in Mapping Forest Insect Pests and Diseases at a Tree-Level. Remote Sens. Appl. 2024, 36, 101341. [Google Scholar] [CrossRef]
  3. Hua, G.Z.; Fa, X.W.; Zhen, Z.; Jie, C.C.; Wen, Z.X. Utilization of Remote Sensing for Detecting Forest Damage Caused by Insect Infestations or Diseases. J. Nat. Disasters 2003, 12, 73–81. [Google Scholar]
  4. Abdulridha, J.; Ehsani, R.; Abd-Elrahman, A.; Ampatzidis, Y. A Remote Sensing Technique for Detecting Laurel Wilt Disease in Avocado in Presence of Other Biotic and Abiotic Stresses. Comput. Electron. Agric. 2019, 156, 549–557. [Google Scholar] [CrossRef]
  5. Ye, W.; Lao, J.; Liu, Y.; Chang, C.-C.; Zhang, Z.; Li, H.; Zhou, H. Pine Pest Detection Using Remote Sensing Satellite Images Combined with a Multi-Scale Attention-UNet Model. Ecol. Inform. 2022, 72, 101906. [Google Scholar] [CrossRef]
  6. Rahimzadeh-Bajgiran, P.; Weiskittel, A.; Kneeshaw, D.; MacLean, D. Detection of Annual Spruce Budworm Defoliation and Severity Classification Using Landsat Imagery. Forests 2018, 9, 357. [Google Scholar] [CrossRef]
  7. Xu, Z.-H.; Huang, X.-Y.; Lin, L.; Wang, Q.-F.; Liu, J.; Chen, C.-C.; Yu, K.-Y.; Zhou, H.-K.; Zhang, H.-F. Dendrolimus Punctatus Walker Damage Detection Based on Fisher Discriminant Analysis and Random Forest. Spectrosc. Spect Anal. 2018, 38, 2888–2896. [Google Scholar]
  8. Abdullah, H.; Skidmore, A.K.; Darvishzadeh, R.; Heurich, M. Sentinel-2 Accurately Maps Green-attack Stage of European Spruce Bark Beetle (Ips typographus, L.) Compared with Landsat-8. Remote Sens. Ecol. Conserv. 2019, 5, 87–106. [Google Scholar] [CrossRef]
  9. Zhu, C.; Zhang, X.; Zhang, N.; Hassan, M.A.; Zhao, L. Assessing the Defoliation of Pine Forests in a Long Time-Series and Spatiotemporal Prediction of the Defoliation Using Landsat Data. Remote Sens. 2018, 10, 360. [Google Scholar] [CrossRef]
  10. He-Ya, S.; Huang, X.; Zhou, D.; Zhang, J.; Bao, G.; Tong, S.; Bao, Y.; Ganbat, D.; Tsagaantsooj, N.; Altanchimeg, D. Identification of Larch Caterpillar Infestation Severity Based on Unmanned Aerial Vehicle Multispectral and LiDAR Features. Forests 2024, 15, 191. [Google Scholar] [CrossRef]
  11. Zhang, N.; Zhang, X.; Yang, G.; Zhu, C.; Huo, L.; Feng, H. Assessment of Defoliation during the Dendrolimus tabulaeformis Tsai et Liu Disaster Outbreak Using UAV-Based Hyperspectral Images. Remote Sens. Environ. 2018, 217, 323–339. [Google Scholar] [CrossRef]
  12. Yu, R.; Ren, L.; Luo, Y. Early Detection of Pine Wilt Disease in Pinus tabuliformis in North China Using a Field Portable Spectrometer and UAV-Based Hyperspectral Imagery. For. Ecosyst. 2021, 8, 44. [Google Scholar] [CrossRef]
  13. Jiang, Y.; Wang, J.; Zhang, L.; Zhang, G.; Li, X.; Wu, J. Geometric Processing and Accuracy Verification of Zhuhai-1 Hyperspectral Satellites. Remote Sens. 2019, 11, 996. [Google Scholar] [CrossRef]
  14. Fassnacht, F.E.; Latifi, H.; Ghosh, A.; Joshi, P.K.; Koch, B. Assessing the Potential of Hyperspectral Imagery to Map Bark Beetle-Induced Tree Mortality. Remote Sens. Environ. 2014, 140, 533–548. [Google Scholar] [CrossRef]
  15. Liu, X.; Wang, M.; Liu, Z.; Bao, Y.; Li, X.; Wang, F.; Ji, X. Improving Spatial Prediction of Soil Organic Matter in Typical Black Soil Area of Northeast China Using Structural Equation Modeling Integration Framework. Comput. Electron. Agric. 2025, 236, 110404. [Google Scholar] [CrossRef]
  16. Haralick, R.M.; Shanmugam, K.; Dinstein, I.H. Textural Features for Image Classification. IEEE Trans. Syst. Man Cybern. 1973, 3, 610–621. [Google Scholar] [CrossRef]
  17. Torrecilla, E.; Piera, J.; Vilaseca, M. Derivative Analysis of Hyperspectral Oceanographic Data. In Advances in Geoscience and Remote Sensing; IntechOpen: London, UK, 2009. [Google Scholar]
  18. Tian, A.; Zhao, J.; Xiong, H.; Gan, S.; Fu, C. Application of Fractional Differential Calculation in Pretreatment of Saline Soil Hyperspectral Reflectance Data. J. Sens. 2018, 2018, 8017614. [Google Scholar] [CrossRef]
  19. Liu, J.; Li, Y.; Zhao, F.; Liu, Y. Hyperspectral Remote Sensing Images Feature Extraction Based on Spectral Fractional Differentiation. Remote Sens. 2023, 15, 2879. [Google Scholar] [CrossRef]
  20. Liu, Y.; Zhang, Y.; Lu, H.; Yang, Y.; Xie, J.; Chen, D. Application of Fractional-Order Differential and Ensemble Learning to Predict Soil Organic Matter from Hyperspectra. J. Soils Sediments 2024, 24, 361–372. [Google Scholar] [CrossRef]
  21. Sun, J.; Yang, W.; Zhang, M.; Feng, M.; Xiao, L.; Ding, G. Estimation of Water Content in Corn Leaves Using Hyperspectral Data Based on Fractional Order Savitzky-Golay Derivation Coupled with Wavelength Selection. Comput. Electron. Agric. 2021, 182, 105989. [Google Scholar] [CrossRef]
  22. Song, G.; Wang, Q.; Jin, J. Estimation of Leaf Photosynthetic Capacity Parameters Using Spectral Indices Developed from Fractional-Order Derivatives. Comput. Electron. Agric. 2023, 212, 108068. [Google Scholar] [CrossRef]
  23. Ma, Y.; Lu, J.; Huang, X. Damage Diagnosis of Pinus yunnanensis Canopies Attacked by Tomicus Using UAV Hyperspectral Images. Forests 2022, 14, 61. [Google Scholar] [CrossRef]
  24. Lausch, A.; Heurich, M.; Gordalla, D.; Dobner, H.-J.; Gwillym-Margianto, S.; Salbach, C. Forecasting Potential Bark Beetle Outbreaks Based on Spruce Forest Vitality Using Hyperspectral Remote-Sensing Techniques at Different Scales. For. Ecol. Manag. 2013, 308, 76–89. [Google Scholar] [CrossRef]
  25. Gewali, U.B.; Monteiro, S.T.; Saber, E. Machine Learning Based Hyperspectral Image Analysis: A Survey. arXiv 2018, arXiv:1802.08701. [Google Scholar]
  26. Marvasti-Zadeh, S.M.; Goodsman, D.; Ray, N.; Erbilgin, N. Early Detection of Bark Beetle Attack Using Remote Sensing and Machine Learning: A Review. ACM Comput. Surv. 2024, 56, 1–40. [Google Scholar] [CrossRef]
  27. Lundberg, S.M.; Lee, S.-I. A Unified Approach to Interpreting Model Predictions. Adv. Neural Inf. Process. Syst. 2017, 30, 4768–4777. [Google Scholar]
  28. Chen, Y.; Yan, Y.; Zhang, K. On the Local Fractional Derivative. J. Math. Anal. Appl. 2010, 362, 17–33. [Google Scholar] [CrossRef]
  29. Karaagac, B. New Exact Solutions for Some Fractional Order Differential Equations via Improved Sub-Equation Method. Discret. Contin. Dyn. Syst.-S 2019, 12, 447–454. [Google Scholar] [CrossRef]
  30. Bhadra, S.; Sagan, V.; Maimaitijiang, M.; Maimaitiyiming, M.; Newcomb, M.; Shakoor, N.; Mockler, T.C. Quantifying Leaf Chlorophyll Concentration of Sorghum from Hyperspectral Data Using Derivative Calculus and Machine Learning. Remote Sens. 2020, 12, 2082. [Google Scholar] [CrossRef]
  31. Whitley, D. A Genetic Algorithm Tutorial. Stat. Comput. 1994, 4, 65–85. [Google Scholar] [CrossRef]
  32. Taha, Z.Y.; Abdullah, A.A.; Rashid, T.A. Optimizing Feature Selection with Genetic Algorithms: A Review of Methods and Applications. Appl. Sci. 2025, 36, 1–40. [Google Scholar] [CrossRef]
  33. Ogutu, J.O.; Piepho, H.-P.; Schulz-Streeck, T. A Comparison of Random Forests, Boosting and Support Vector Machines for Genomic Selection. BMC Proc. 2011, 5, S11. [Google Scholar] [CrossRef] [PubMed]
  34. Breiman, L. Random Forest. Mach. Learn. 2001, 45, 5–32. [Google Scholar] [CrossRef]
  35. Cortes, C.; Vapnik, V. Support-Vector Networks. Mach. Learn. 1995, 20, 273–297. [Google Scholar] [CrossRef]
  36. Ester, M.; Kriegel, H.P.; Xu, X. XGBoost: A Scalable Tree Boosting System. In Proceedings of the 22Nd ACM SIGKDD International Conference on Knowledge Discovery and Data Mining, San Francisco, CA, USA, 13–17 August 2016; pp. 785–794. [Google Scholar]
  37. Feng, X.; Shao, Z.; Huang, X.; He, L.; Lv, X.; Zhuang, Q. Integrating Zhuhai-1 Hyperspectral Imagery with Sentinel-2 Multispectral Imagery to Improve High-Resolution Impervious Surface Area Mapping. IEEE J. Sel. Top. Appl. Earth Obs. Remote Sens. 2022, 15, 2410–2424. [Google Scholar] [CrossRef]
  38. Wang, W.; Zhang, X.; Shang, K.; Feng, R.; Wang, Y.; Ding, S.; Xiao, Q. Estimation of Soil Organic Matter Content by Combining Zhuhai-1 Hyperspectral and Sentinel-2A Multispectral Images. Comput. Electron. Agric. 2024, 226, 109377. [Google Scholar] [CrossRef]
  39. Wu, L.; Wang, M.; Du, J.; Zhao, J.; Wang, F. Monitoring of Larch Caterpillar (Dendrolimus superans) Infestation Dynamics Using Time-Series Sentinel Images in Changbai Mountains National Nature Reserve, Northeast China. Chin. Geogr. Sci. 2025, 35, 737–754. [Google Scholar] [CrossRef]
  40. Zhao, J.; Jin, Y.; Ye, H.; Huang, W.; Dong, Y.; Fan, L.; Ma, H.; Jiang, J. Remote Sensing Monitoring of Areca Yellow Leaf Disease Based on UAV Multi-Spectral Images. Trans. Chin. Soc. Agric. Eng. 2020, 36, 54–61. [Google Scholar]
  41. Cao, Z.; Ma, R.; Melack, J.M.; Duan, H.; Liu, M.; Kutser, T.; Xue, K.; Shen, M.; Qi, T.; Yuan, H. Landsat Observations of Chlorophyll-a Variations in Lake Taihu from 1984 to 2019. Int. J. Appl. Earth Obs. Geoinf. 2022, 106, 102642. [Google Scholar] [CrossRef]
  42. Goebel, M.; Iwaszczuk, D. Spectral Analysis of Images of Plants Under Stress Using a Close-Range Camera. Remote Sens. Spat. Inf. Sci. 2023, 48, 63–69. [Google Scholar] [CrossRef]
  43. Zhang, J.; Jing, X.; Song, X.; Zhang, T.; Duan, W.; Su, J. Hyperspectral Estimation of Wheat Stripe Rust Using Fractional Order Differential Equations and Gaussian Process Methods. Comput. Electron. Agric. 2023, 206, 107671. [Google Scholar] [CrossRef]
  44. Zununjan, Z.; Turghan, M.A.; Sattar, M.; Kasim, N.; Emin, B.; Abliz, A. Combining the Fractional Order Derivative and Machine Learning for Leaf Water Content Estimation of Spring Wheat Using Hyper-Spectral Indices. Plant Methods 2024, 20, 97. [Google Scholar] [CrossRef]
Figure 1. Study area is situated in southern Antu County and eastern Fusong County, Jilin Province, China.
Remotesensing 17 03274 g001
Figure 2. Flowchart of the proposed method.
Remotesensing 17 03274 g002
Figure 3. Original imagery and generated labels, labels are infested forest, healthy forest, and others.
Remotesensing 17 03274 g003
Figure 4. Spectral reflectance differences between infested and healthy forest areas of the integrated image.
Remotesensing 17 03274 g004
Figure 5. Infested and healthy forest areas with FOD orders ranging from 0.1 to 2.0, totaling 20 orders, the green line represents the healthy forest, while the red line represents the infested forest.
Remotesensing 17 03274 g005
Figure 6. Accuracy validation of the RF, SVM, and XGBoost models based on five patches of 100 × 100 pixels.
Remotesensing 17 03274 g006
Figure 7. Detection results of the infested forest, (a) the overall results of the study area, (b) the concentrated outbreak area, (c) the outbreak area imagery.
Remotesensing 17 03274 g007
Figure 8. Feature importance and scatter plot. The bar chart on the left shows the importance of different features, while the scatter plot on the right illustrates the specific influence of these features on the model.
Remotesensing 17 03274 g008
Table 1. Combination of 30 spectral bands from Zhuhai-1 and Sentinel-2 imagery.
Data SourceBand NameCentral
Wavelength (nm)
Data SourceBand NameCentral
Wavelength (nm)
Sentinel-2B1443Zhuhai-1B19746
Sentinel-2B2490Zhuhai-1B20760
Zhuhai-1B06531Zhuhai-1B21776
Zhuhai-1B07550Zhuhai-1B22780
Zhuhai-1B08560Zhuhai-1B23806
Zhuhai-1B09580Zhuhai-1B24820
Zhuhai-1B10596Zhuhai-1B25833
Zhuhai-1B11620Zhuhai-1B26850
Zhuhai-1B12640Zhuhai-1B27865
Zhuhai-1B13665Zhuhai-1B28880
Zhuhai-1B14670Zhuhai-1B29896
Zhuhai-1B15686Zhuhai-1B30910
Zhuhai-1B16700Zhuhai-1B31926
Zhuhai-1B17709Sentinel-2B111610
Zhuhai-1B18730Sentinel-2B122190
Table 2. Accuracy of the RF, SVM, and XGBoost models.
OARecallF1KappaPrecision
RF91.20%92.57%90.48%87.33%88.48%
SVM90.86%89.74%88.17%84.92%86.65%
XGBoost93.47%93.21%92.78%89.81%92.35%
Table 3. Accuracy validation results of the RF, SVM, and XGBoost models.
OARecallF1KappaPrecision
RF91.22%92.22%90.13%86.12%88.13%
SVM89.29%89.68%87.85%83.02%86.09%
XGBoost93.03%93.61%92.12%88.92%90.68%
Table 4. Accuracy comparison of XGBoost model results using different data sources and different feature combinations.
OARecallF1KappaPrecision
Sentinel-282.90%82.08%79.97%73.20%77.97%
Zhuhai-187.67%86.11%84.94%86.32%83.80%
Combined88.78%87.40%86.21%87.36%85.05%
Band + Index92.44%90.61%90.47%88.28%90.33%
Band + FOD91.86%90.42%91.13%88.73%91.85%
Band + Texture89.50%87.41%88.34%87.62%89.29%
GA Feature93.47%93.21%92.78%89.81%92.35%
Disclaimer/Publisher’s Note: The statements, opinions and data contained in all publications are solely those of the individual author(s) and contributor(s) and not of MDPI and/or the editor(s). MDPI and/or the editor(s) disclaim responsibility for any injury to people or property resulting from any ideas, methods, instructions or products referred to in the content.