Author Contributions
Conceptualization, Z.Z., Z.H., F.K. and X.L.; methodology, Z.Z., Z.H. and F.K.; software, Z.Z. and F.K.; validation, Z.Z. and Z.H.; formal analysis, Z.Z. and Z.H.; investigation, Z.Z., X.L. and H.S.; resources, Z.Z., Z.H., F.K. and J.W.; data curation, Z.Z. and H.S.; writing—original draft preparation, Z.Z. and Z.H.; writing—review and editing, Z.Z., Z.H., F.K. and X.L.; visualization, Z.Z.; supervision, Y.Y. and J.W.; project administration, Z.Z., F.K., J.W. and Y.Y.; funding acquisition, F.K. All authors have read and agreed to the published version of the manuscript.
Figure 1.
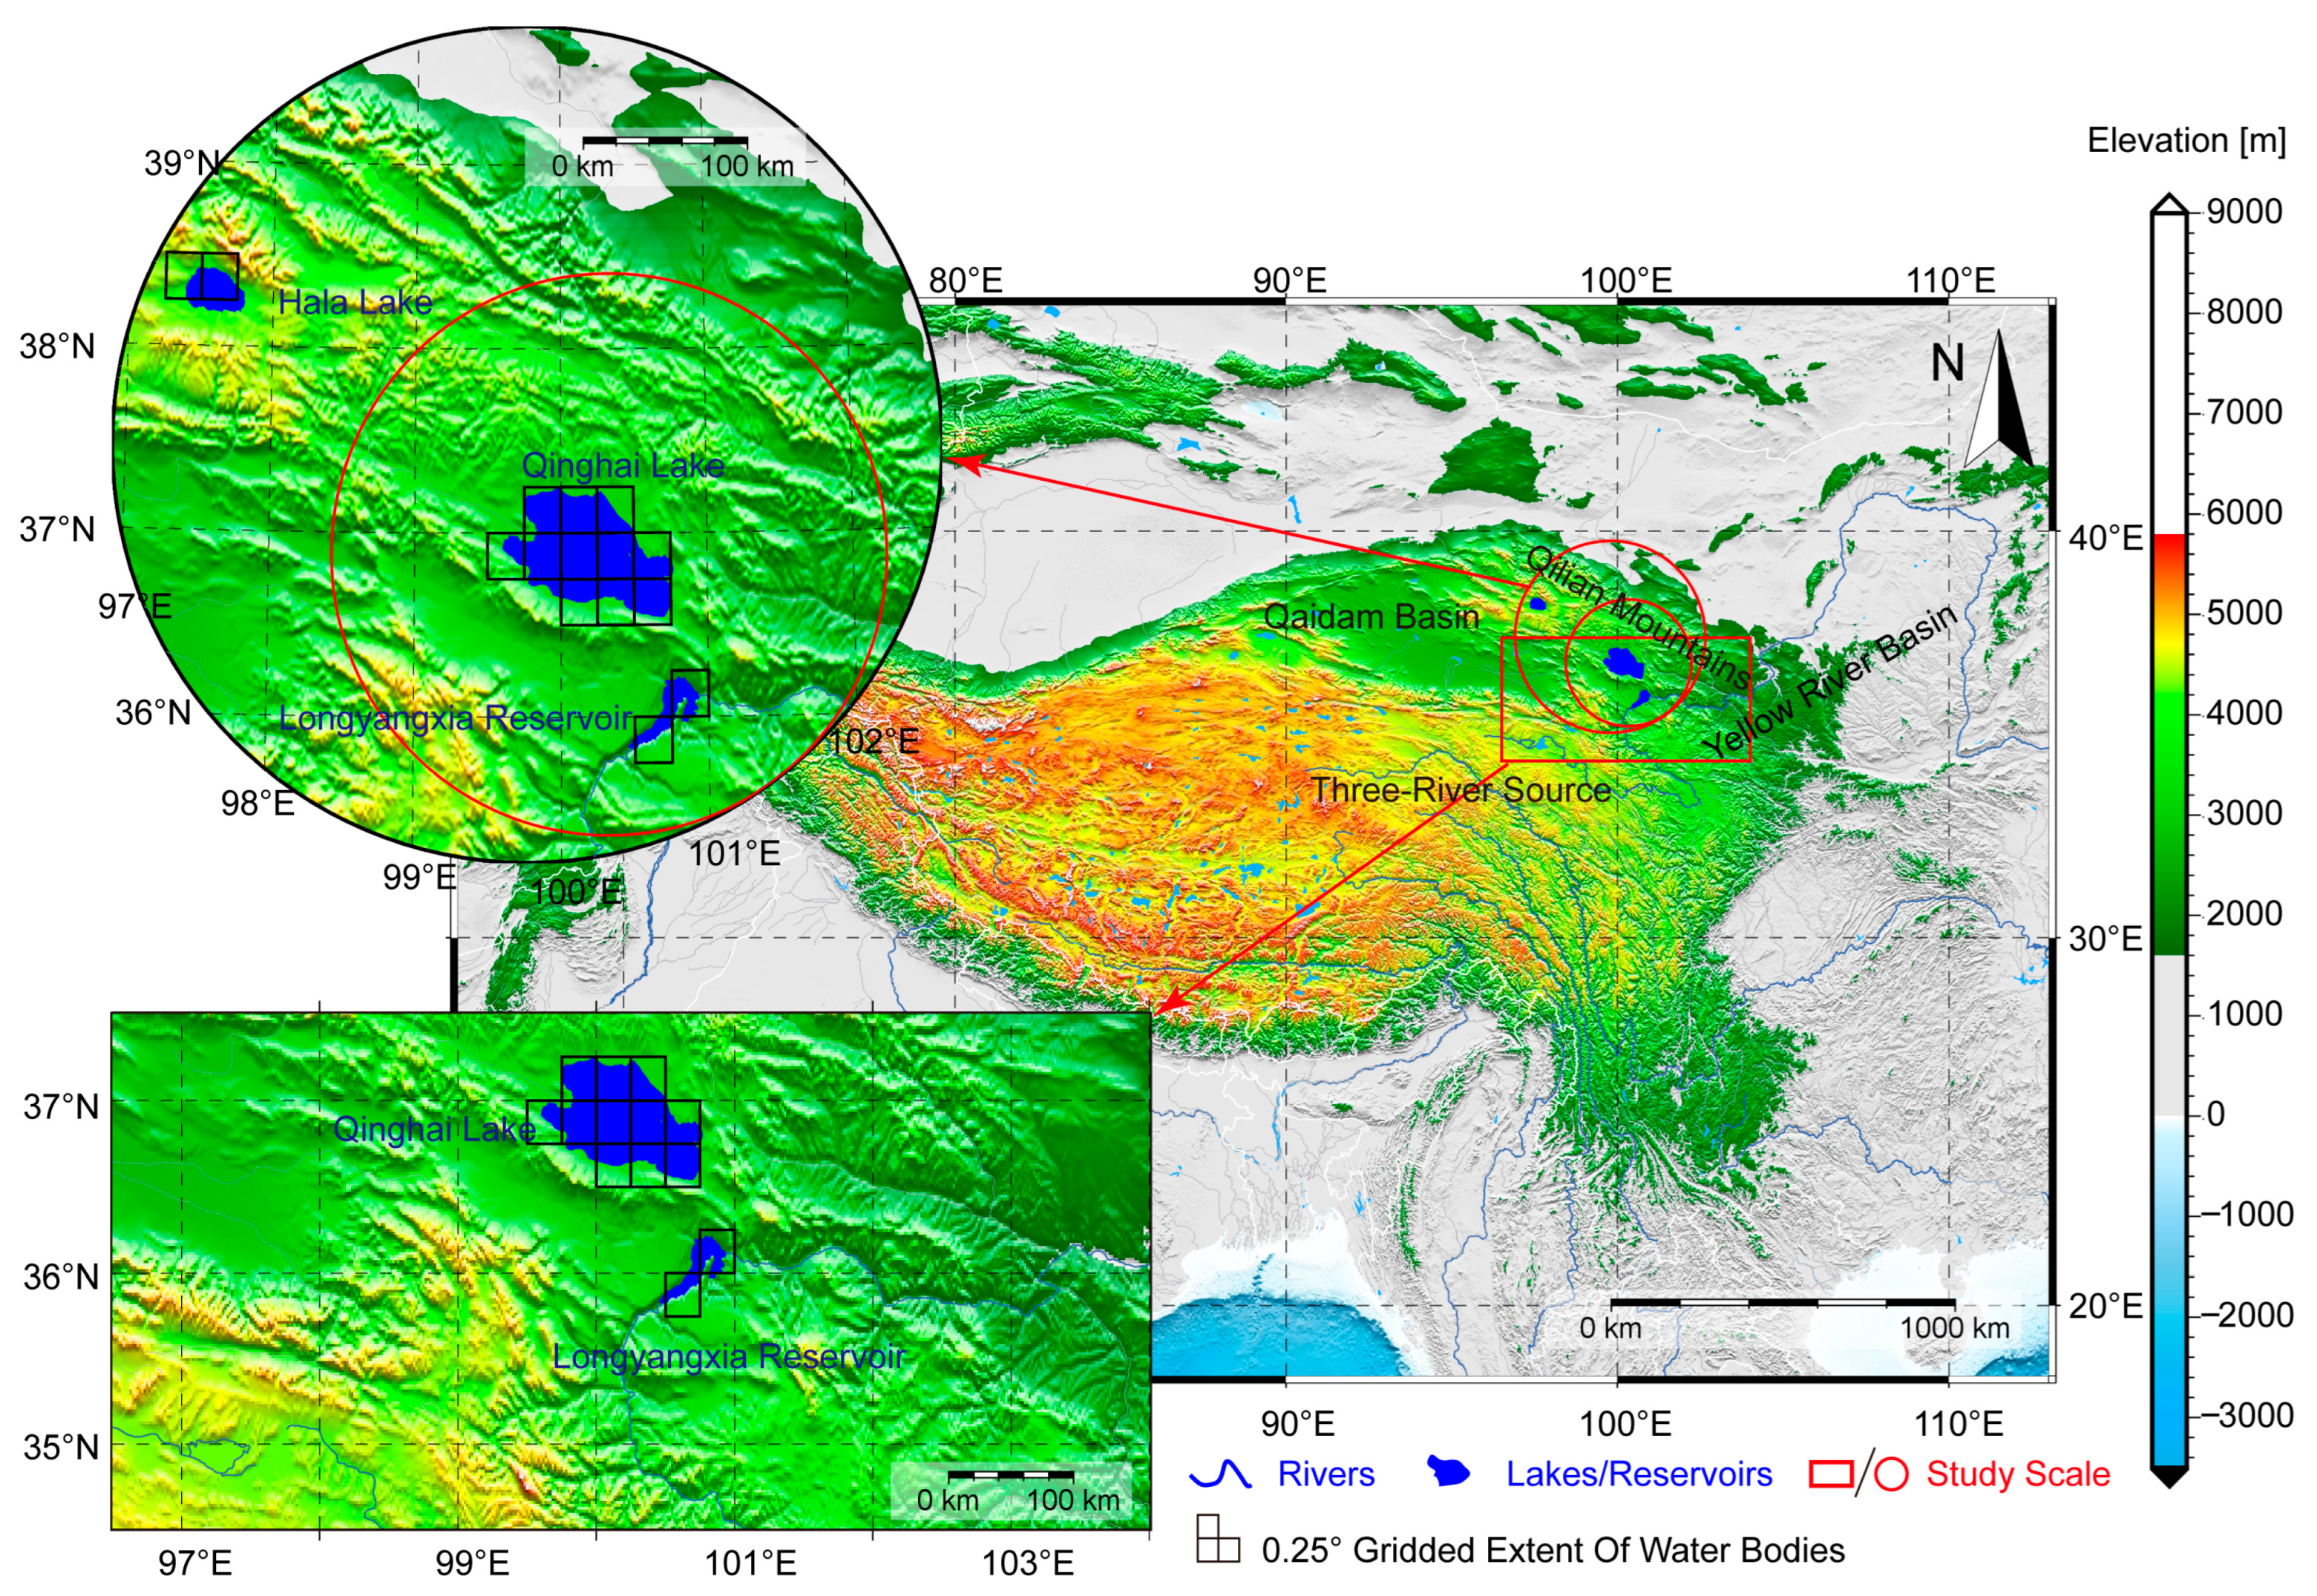
Spatial distribution of lake, reservoir, and study scales in the northeastern Tibetan Plateau. The black grids at 0.25 degrees represent the spatial extent used for forward modeling.
Figure 1.
Spatial distribution of lake, reservoir, and study scales in the northeastern Tibetan Plateau. The black grids at 0.25 degrees represent the spatial extent used for forward modeling.
Figure 2.
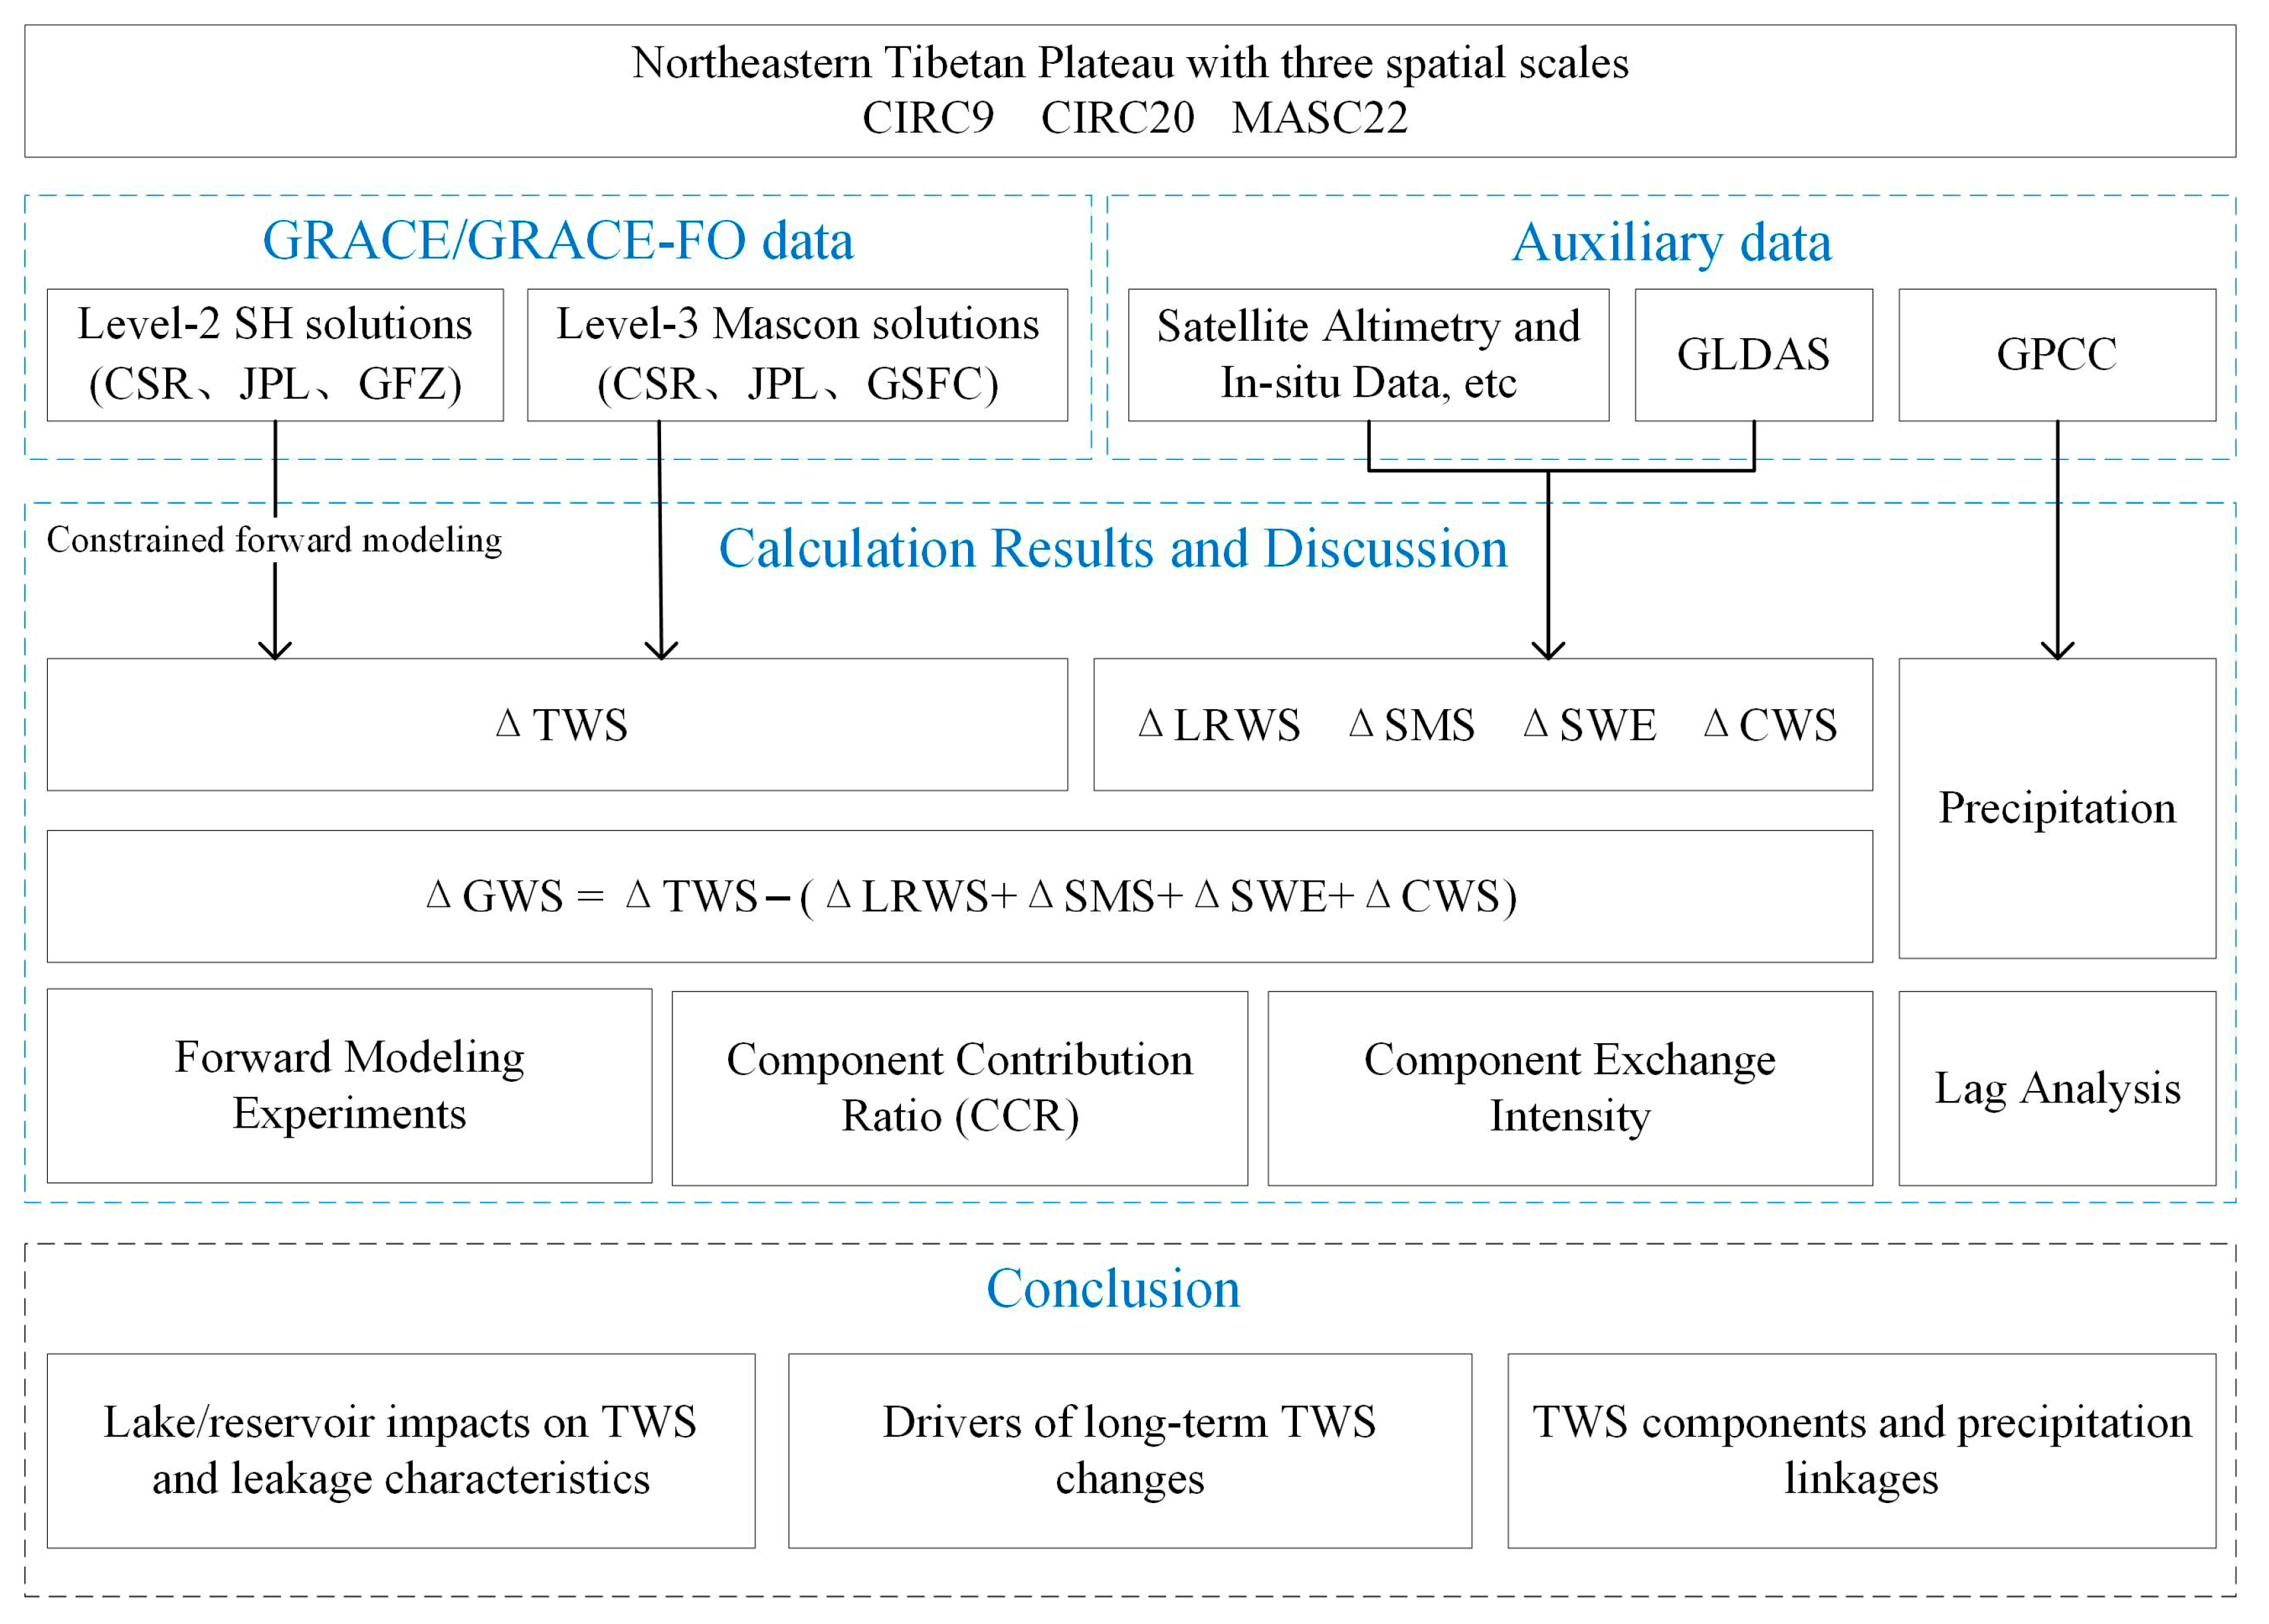
Flow chart with the major methodology and processing in this study.
Figure 2.
Flow chart with the major methodology and processing in this study.
Figure 3.
The relationship between water level and water storage changes in QHL, HLL, and LYXR. (a) Relationship for QHL; (b) Relationship for HLL; (c) Relationship for LYXR. The colored markers at the bottom represent the 95% confidence intervals of the fitted results.
Figure 3.
The relationship between water level and water storage changes in QHL, HLL, and LYXR. (a) Relationship for QHL; (b) Relationship for HLL; (c) Relationship for LYXR. The colored markers at the bottom represent the 95% confidence intervals of the fitted results.
Figure 4.
(a) Water storage changes of QHL, HLL, and LYXR from 2003 to 2022; (b) Water storage changes of QHL derived from the Hydroweb database and in situ measurements of the water storage at the Xiashe station. (c) LRWS changes at different spatial scales, including CIRC9, CIRC20, and MASC22. Note: the “±” denotes the standard error.
Figure 5.
Forward modeling results for the VSE. A volume of 1-km3 of water was distributed over the gridded extent (0.25-degree resolution) for QHL, HLL, and LYXR. The spatial distribution of the signals was obtained by forward modeling with T60, T60F300, and T60F500. Four scenarios were considered: the three water bodies together and each water body individually. (a–d) The results of forward modeling for QHL, HLL, and LYXR; (e–h) The results of forward modeling for QHL; (i–l) The results of forward modeling for HLL; (m–p) The results of forward modeling for LYXR.
Figure 6.
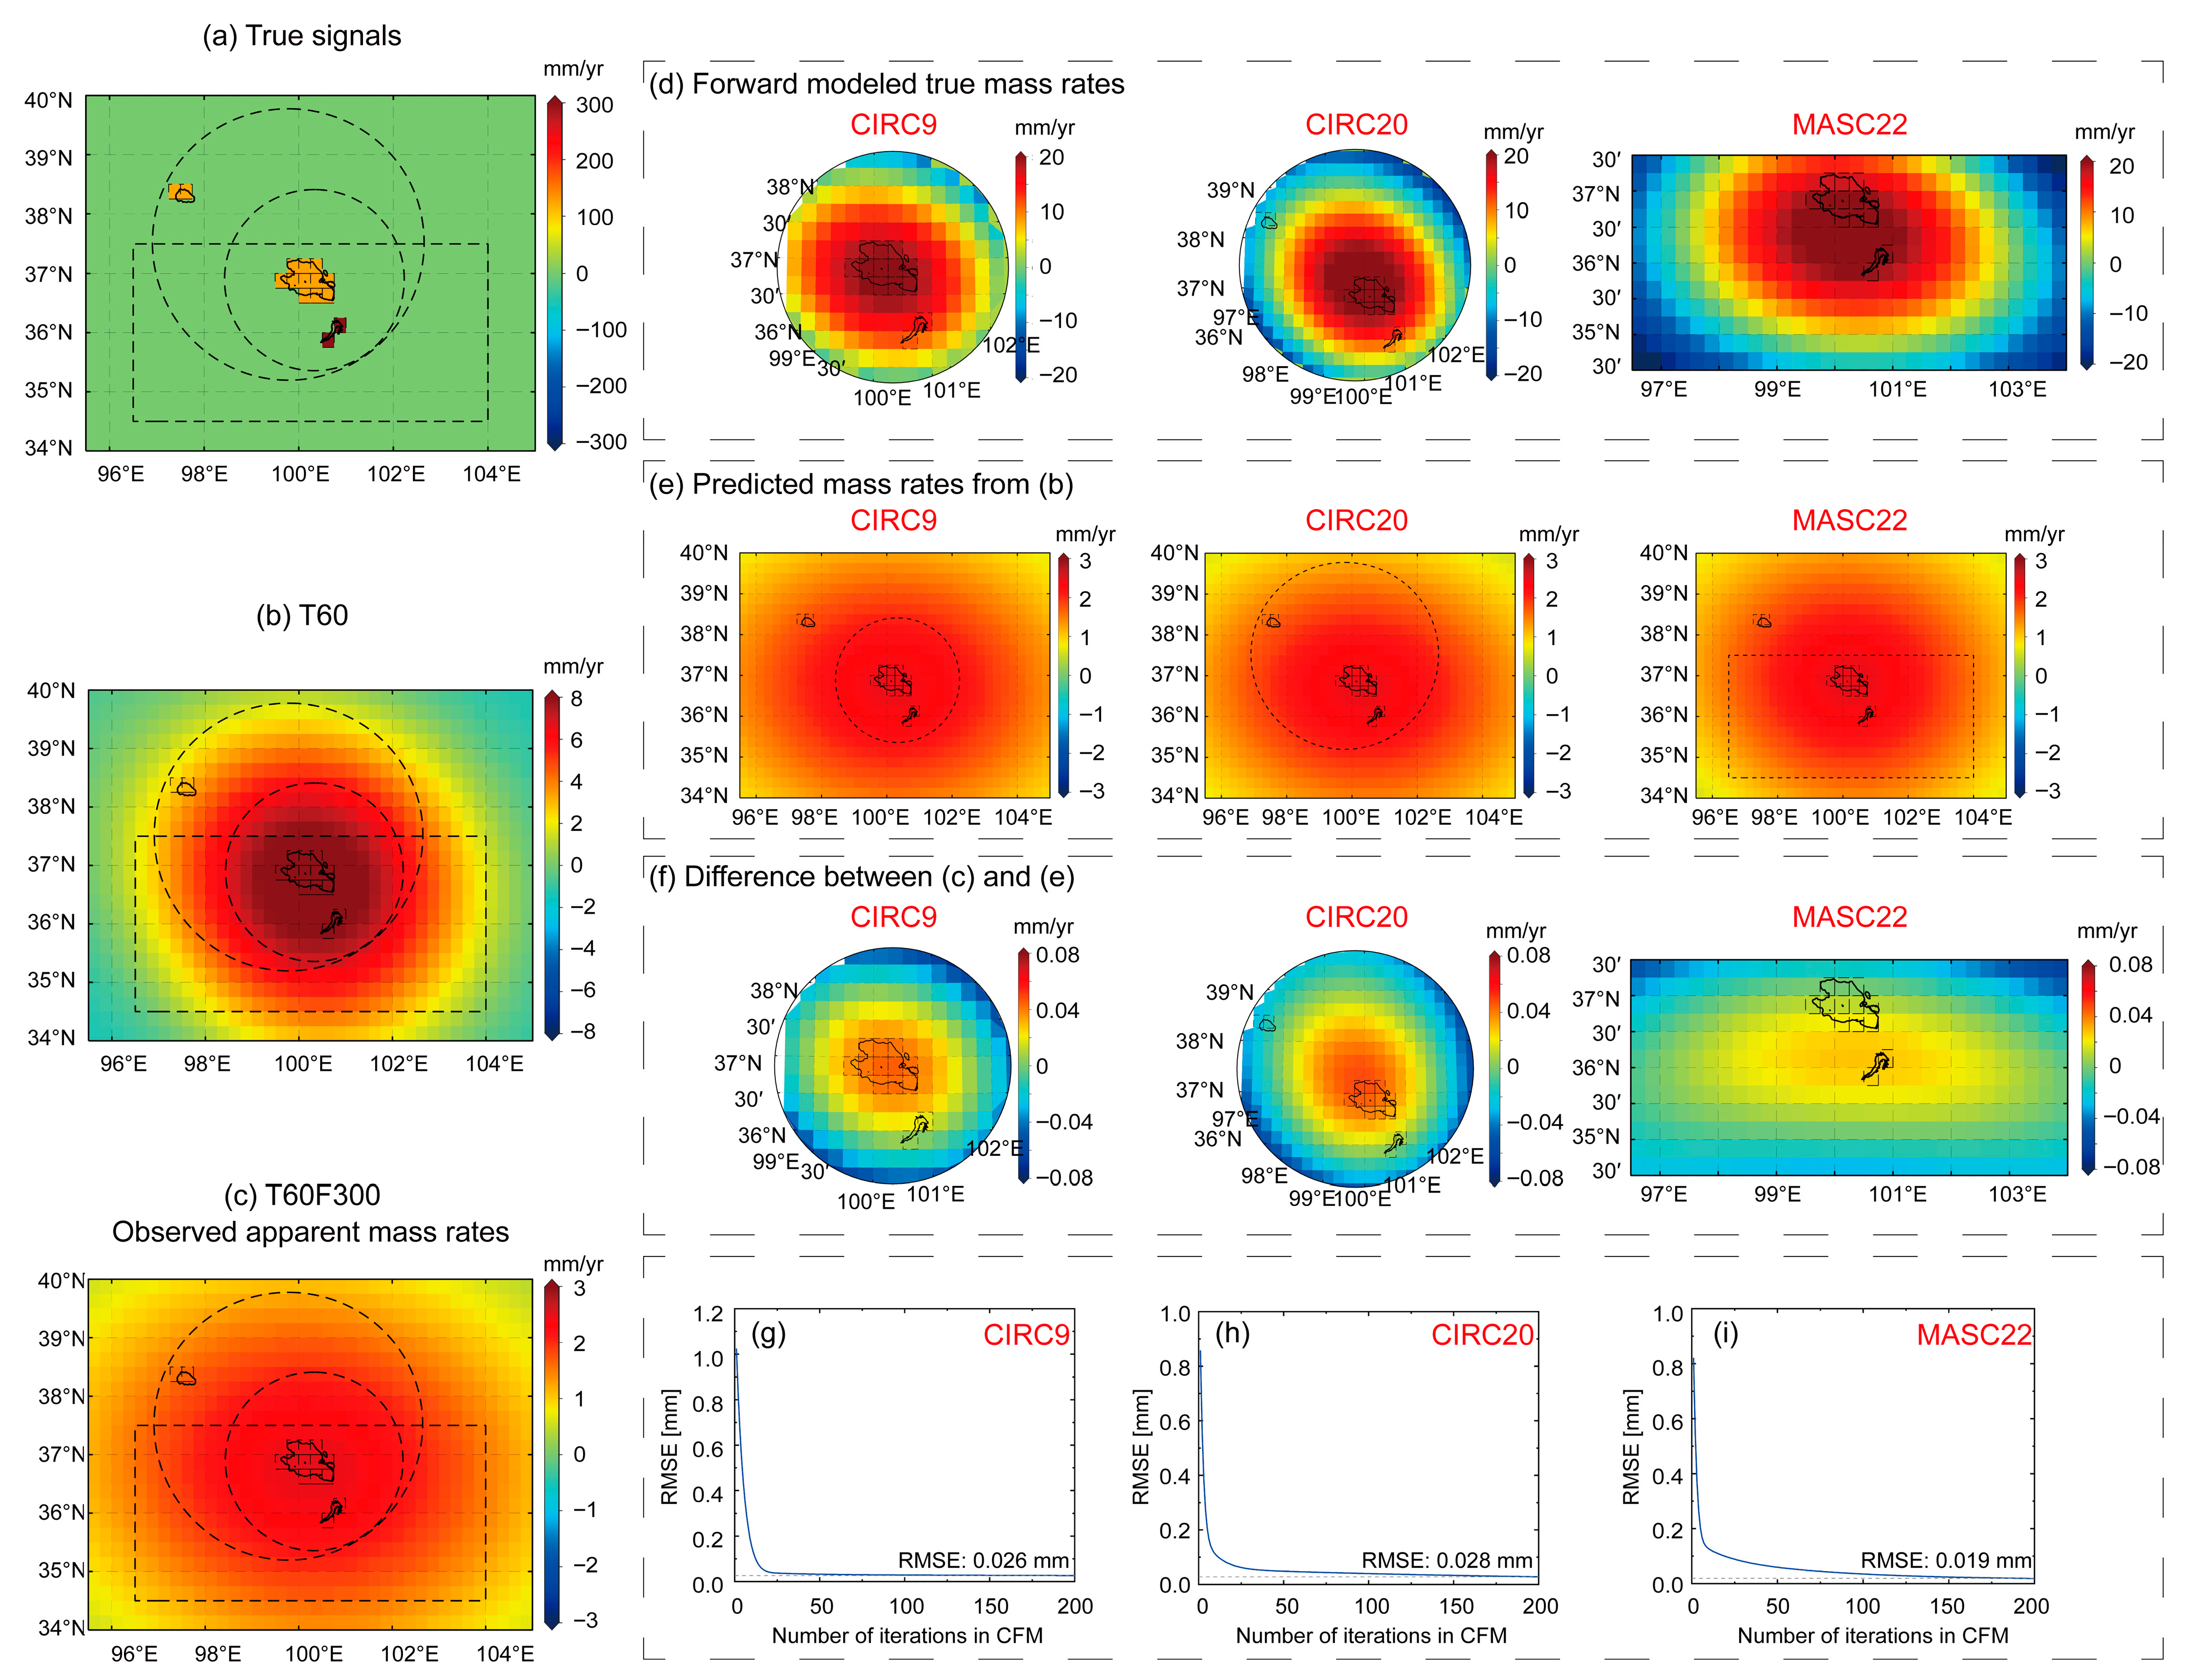
Forward modeling results for the RSE and the corrected results based on the CFM method. (a) Long-term LRWS change rates from 2003 to 2022; (b) Apparent long-term LRWS change rates after T60; (c) Apparent long-term LRWS change rates after T60F300; (d) “True” long-term LRWS change rates recovered by the CFM method after 200 iterations; (e) Predicted long-term LRWS change rates derived from (d) after T60F300; (f) Difference between the apparent and predicted long-term LRWS change rates (i.e., (c–e)). Please note the different color scale ranges in the subplots. The three columns in (d), (e), and (f) correspond to the spatial constraint scales of CIRC9, CIRC20, and MASC22, respectively. (g–i) show the residuals change between the (c,e) for the corresponding spatial constraint scales. The residuals are calculated as the root mean square error of the differences between the (c,e) at each grid point within the corresponding constraint range.
Figure 7.
The SH-CFM TWS, Mascon TWS, and LYXR water storage changes under the spatial scales of CIRC9, CIRC20, and MASC22, respectively, as well as the monthly precipitation from GPCC. Note: The shaded region of the TWS changes curve represents the standard deviation for the mean values of different solutions, while the “±” denotes the standard error. The four vertically shaded light gray periods indicate multiple local peaks in LYXR water storage changes.
Figure 8.
(a–c): GWS, SMS, SWE, and CWS changes at three spatial scales (CIRC9, CIRC20, MASC22), along with component exchange intensity and annual precipitation anomalies. (d–f): CCR of each TWS component, with outer and inner rings indicating SH-CFM-based and Mascon-based results, respectively. Note: Percentages may not add up to 100% due to rounding.
Figure 9.
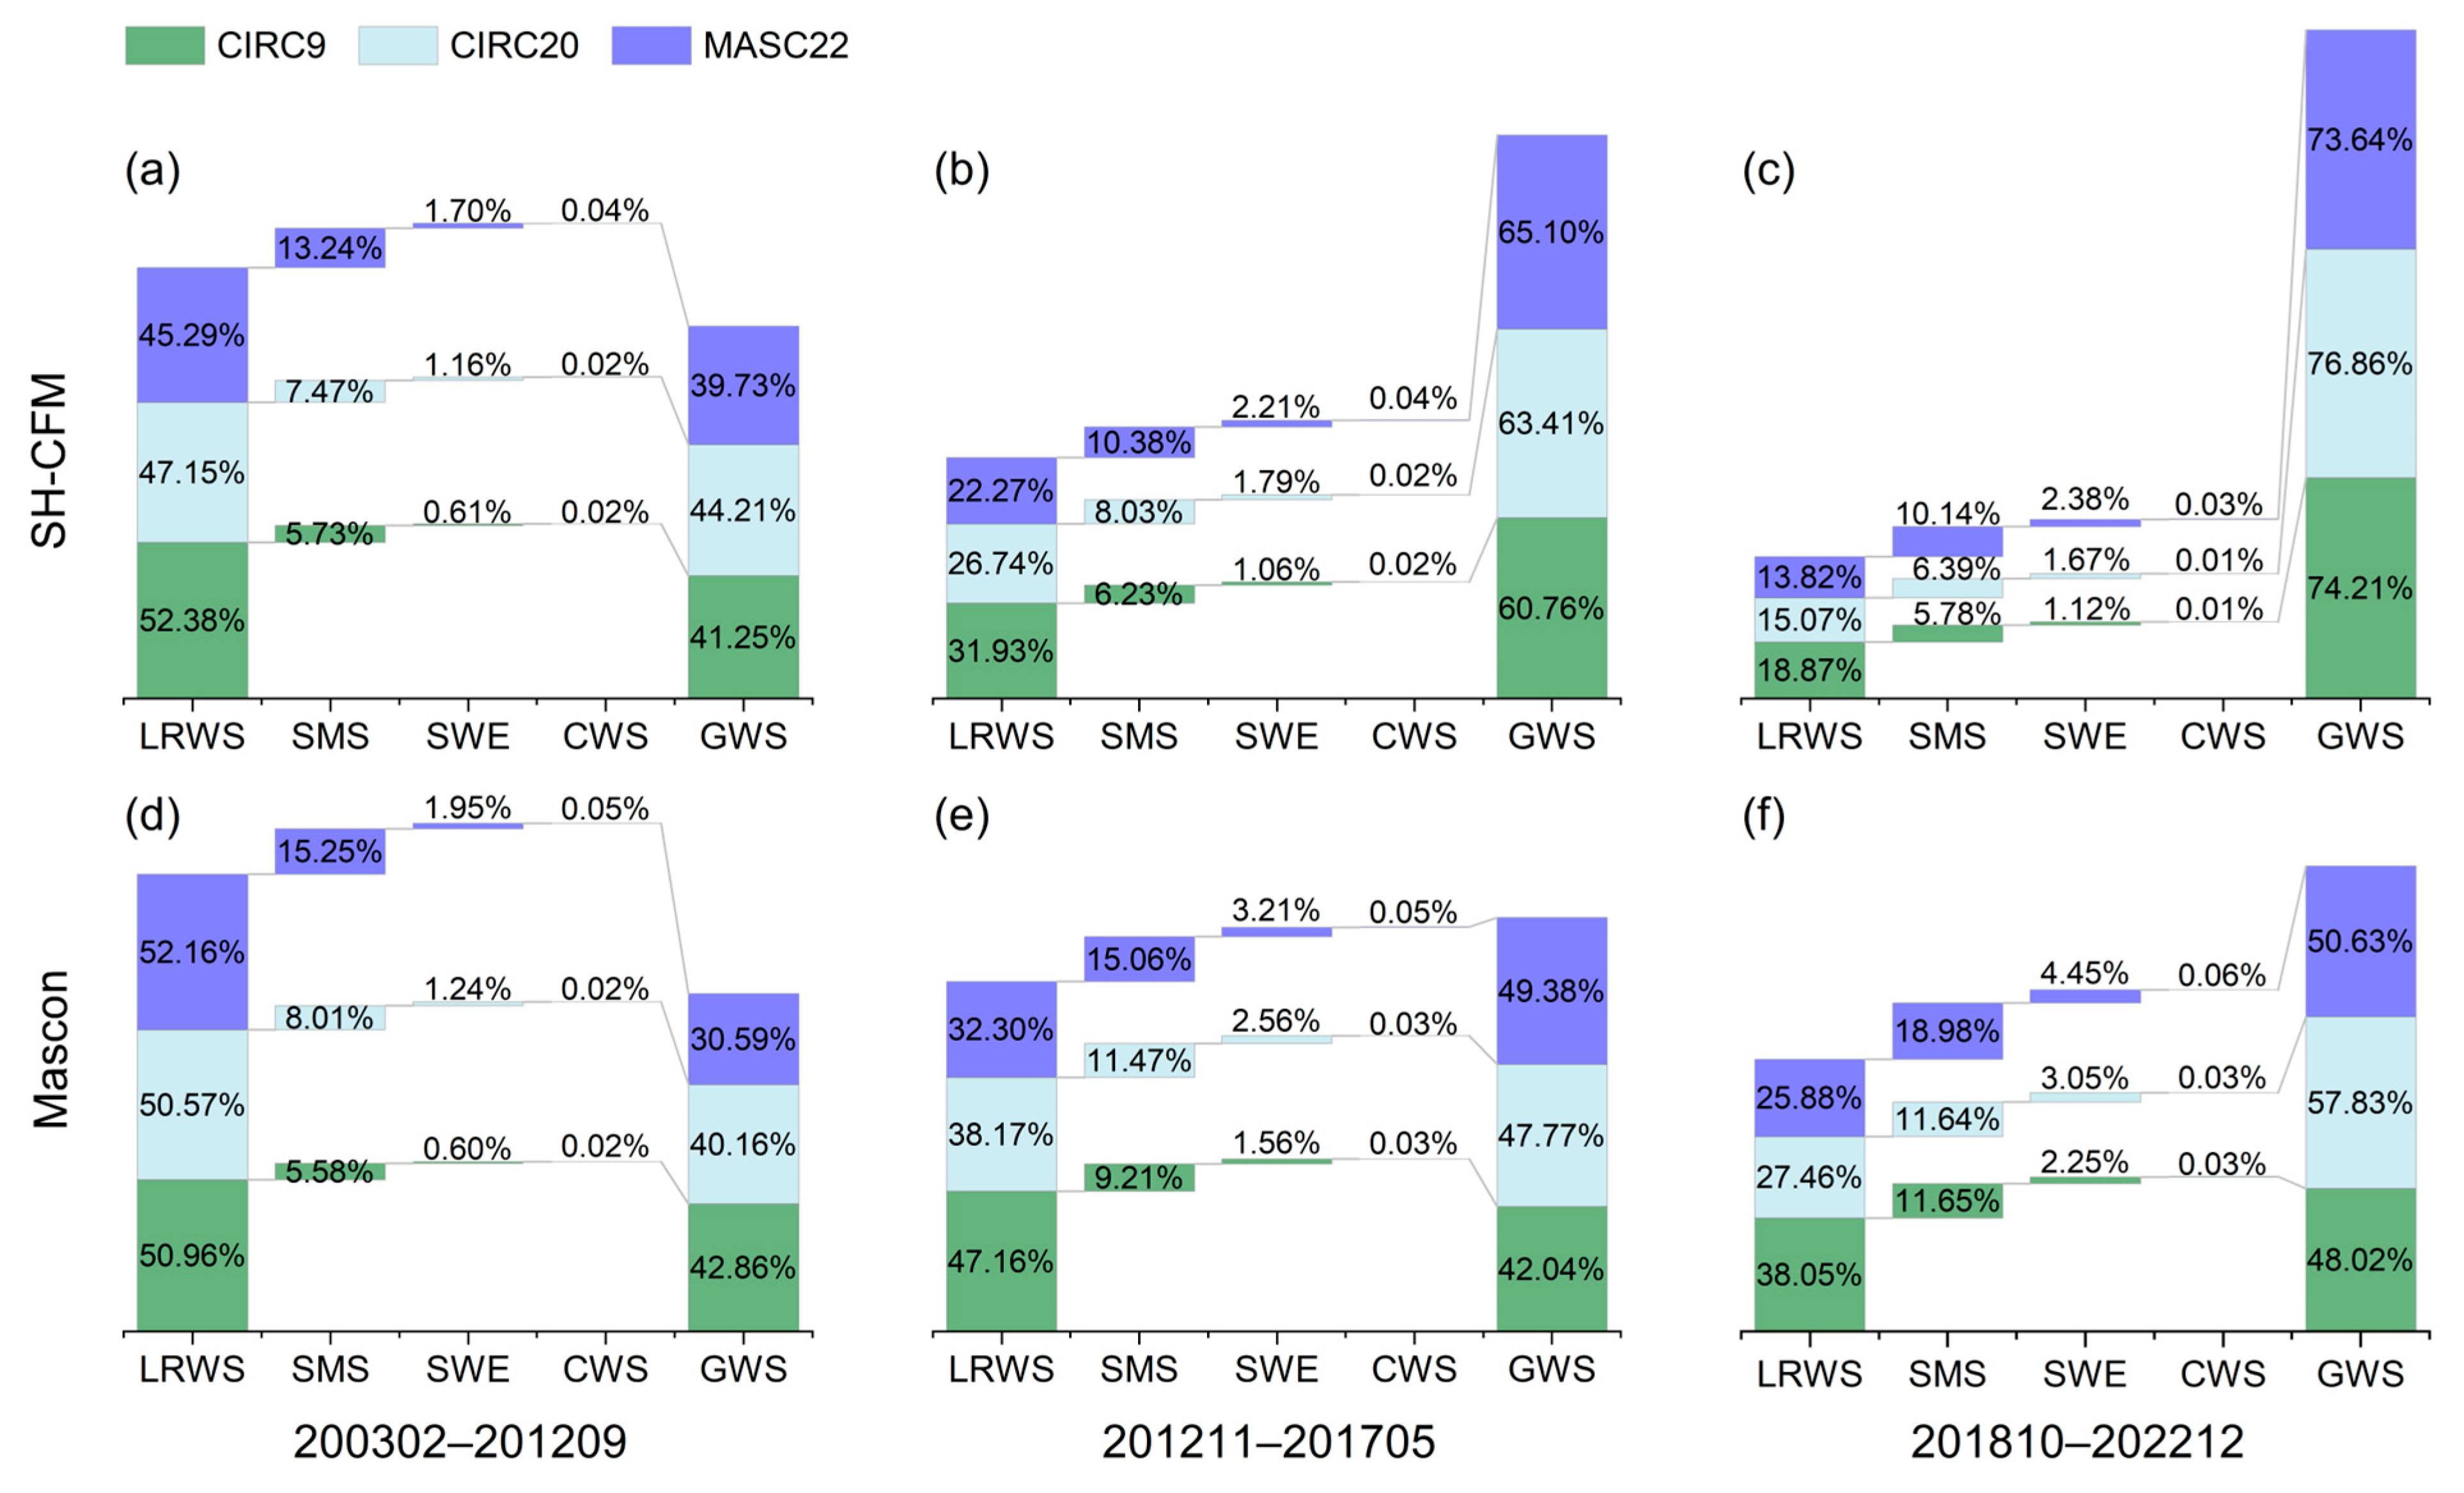
CCR of water storage components to SH-CFM and Mascon TWS changes at different spatial scales across three piecewise periods: (a,d) February 2003 to September 2012, (b,e) November 2012 to May 2017, and (c,f) October 2018 to December 2022, with SH-CFM-based results in (a–c) and Mascon-based results in (d–f). Note: Percentages may not add up to 100% due to rounding.
Table 1.
The trend rates of LRWS over the total period and three piecewise periods at the spatial scales of CIRC9, CIRC20, and MASC22.
Table 1.
The trend rates of LRWS over the total period and three piecewise periods at the spatial scales of CIRC9, CIRC20, and MASC22.
| Time | LRWS [mm/yr] |
|---|
| CIRC9 | CIRC20 | MASC22 |
|---|
| 200301–202212 | 12.60 ± 0.41 | 6.52 ± 0.20 | 5.57 ± 0.18 |
| 200301–201209 | 14.04 ± 1.22 | 7.07 ± 0.56 | 6.21 ± 0.54 |
| 201211–201705 | −5.92 ± 2.08 | −2.20 ± 0.96 | −2.62 ± 0.92 |
| 201810–202212 | −0.62 ± 2.08 | 0.33 ± 0.99 | −0.28 ± 0.92 |
Table 2.
LRWS changes, remaining signal ratio, and contribution ratio for four water body combinations under forward modeling with T60, T60F300, and T60F500 at three spatial scales.
Table 2.
LRWS changes, remaining signal ratio, and contribution ratio for four water body combinations under forward modeling with T60, T60F300, and T60F500 at three spatial scales.
| Combined Methods | Contents | True (T0) | T60 (T1) | T60F300 (T2) | T60F500 (T3) |
|---|
| CIRC9 | CIRC20 | MASC22 | CIRC9 | CIRC20 | MASC22 | CIRC9 | CIRC20 | MASC22 | CIRC9 | CIRC20 | MASC22 |
|---|
| ALL (A) | LRWS (A0, mm) | 20.09 | 13.94 | 8.88 | 13.26 | 10.83 | 8.97 | 4.49 | 4.11 | 3.75 | 1.94 | 1.87 | 1.78 |
| RSR (Tn/T0) | - | - | - | 66.00% | 77.69% | 100.95% | 22.34% | 29.52% | 42.17% | 9.64% | 13.42% | 20.06% |
| QHL (B) | LRWS (B0, mm) | 10.04 | 4.65 | 4.44 | 5.97 | 4.51 | 3.81 | 1.73 | 1.52 | 1.43 | 0.69 | 0.65 | 0.63 |
| RSR (Tn/T0) | - | - | - | 59.47% | 96.98% | 85.76% | 17.22% | 32.68% | 32.19% | 6.85% | 14.03% | 14.30% |
| CR (B0/A0) | 50.00% | 33.33% | 50.00% | 45.05% | 41.61% | 42.47% | 38.53% | 36.91% | 38.16% | 35.50% | 34.85% | 35.63% |
| HLL (C) | LRWS (C0, mm) | 0.00 | 4.65 | 0.00 | 1.99 | 3.00 | 0.97 | 1.14 | 1.29 | 0.81 | 0.58 | 0.61 | 0.50 |
| RSR (Tn/T0) | - | - | - | L-in | 64.49% | L-in | L-in | 27.87% | L-in | L-in | 13.15% | L-in |
| CR (C0/A0) | 0.00% | 33.33% | 0.00% | 15.00% | 27.67% | 10.86% | 25.40% | 31.47% | 21.71% | 30.03% | 32.67% | 27.99% |
| LYXR (D) | LRWS (D0, mm) | 10.04 | 4.65 | 4.44 | 5.30 | 3.33 | 4.18 | 1.62 | 1.30 | 1.50 | 0.67 | 0.61 | 0.65 |
| RSR (Tn/T0) | - | - | - | 52.73% | 71.61% | 94.21% | 16.12% | 28.00% | 33.85% | 6.65% | 13.08% | 14.60% |
| CR (D0/A0) | 50.00% | 33.33% | 50.00% | 39.95% | 30.72% | 46.66% | 36.07% | 31.62% | 40.13% | 34.47% | 32.48% | 36.38% |
Table 3.
LRWS changes, remaining signal ratio, contribution ratio, and annual amplitude variation for four water body combinations under forward modeling with T60 and T60F300 at three spatial scales.
Table 3.
LRWS changes, remaining signal ratio, contribution ratio, and annual amplitude variation for four water body combinations under forward modeling with T60 and T60F300 at three spatial scales.
| Combined Methods | Contents | True (T0) | T60 (T1) | T60F300 (T2) |
|---|
| CIRC9 | CIRC20 | MASC22 | CIRC9 | CIRC20 | MASC22 | CIRC9 | CIRC20 | MASC22 |
|---|
| ALL (A) | LRWS (A1, mm/yr) | 12.60 | 6.52 | 5.57 | 7.52 | 5.63 | 5.07 | 2.30 | 2.01 | 1.94 |
| RSR (Tn/T0) | - | - | - | 59.69% | 86.34% | 91.05% | 18.22% | 30.85% | 34.89% |
| Amplitude (mm) | 24.7 ± 5.99 | 11.6 ± 2.85 | 10.9 ± 2.65 | - | - | - | - | - | - |
| QHL (B) | LRWS (B1, mm/yr) | 8.61 | 3.98 | 3.81 | 5.12 | 3.86 | 3.27 | 1.48 | 1.30 | 1.23 |
| RSR (Tn/T0) | - | - | - | 59.47% | 96.98% | 85.76% | 17.22% | 32.68% | 32.19% |
| CR (B1/A1) | 68.33% | 61.07% | 68.33% | 60.47% | 63.15% | 54.76% | 57.37% | 58.61% | 54.69% |
| Amplitude (mm) | 4.02 ± 2.71 | 1.86 ± 1.25 | 1.78 ± 1.20 | - | - | - | - | - | - |
| HLL (C) | LRWS (C1, mm/yr) | 0.00 | 0.69 | 0.00 | 0.30 | 0.45 | 0.15 | 0.17 | 0.19 | 0.12 |
| RSR (Tn/T0) | - | - | - | L-in | 64.49% | L-in | L-in | 27.87% | L-in |
| CR (C1/A1) | 0.00% | 10.63% | 0.00% | 3.95% | 7.94% | 2.87% | 7.41% | 9.61% | 6.24% |
| Amplitude (mm) | - | 0.34 ± 0.17 | - | - | - | - | - | - | - |
| LYXR (D) | LRWS (D1, mm/yr) | 3.99 | 1.85 | 1.76 | 2.10 | 1.32 | 1.66 | 0.64 | 0.52 | 0.60 |
| RSR (Tn/T0) | - | - | - | 52.73% | 71.61% | 94.21% | 16.12% | 28.00% | 33.85% |
| CR (D1/A1) | 31.67% | 28.30% | 31.67% | 27.98% | 23.47% | 32.77% | 28.02% | 25.69% | 30.72% |
| Amplitude (mm) | 20.9 ± 5.18 | 9.68 ± 2.40 | 9.26 ± 2.29 | - | - | - | - | - | - |
Table 4.
The trend rates of GWS changes over the total period and three piecewise periods at the spatial scales of CIRC9, CIRC20, and MASC22.
Table 4.
The trend rates of GWS changes over the total period and three piecewise periods at the spatial scales of CIRC9, CIRC20, and MASC22.
| Time | SH-CFM GWS [mm/yr] | Mascon GWS [mm/yr] |
|---|
| CIRC9 | CIRC20 | MASC22 | CIRC9 | CIRC20 | MASC22 |
|---|
| 200302–202212 | −8.98 ± 0.52 | −4.68 ± 0.32 | −2.45 ± 0.34 | −11.04 ± 0.33 | −5.38 ± 0.16 | −2.65 ± 0.16 |
| 200302–201209 | −9.22 ± 1.24 | −4.36 ± 0.75 | −1.46 ± 0.72 | −11.31 ± 1.10 | −5.02 ± 0.51 | −1.74 ± 0.46 |
| 201211–201705 | −16.82 ± 4.66 | −12.15 ± 2.42 | −17.77 ± 2.45 | −3.85 ± 2.31 | −5.70 ± 1.30 | −7.94 ± 1.36 |
| 201810–202212 | −42.77 ± 5.39 | −27.33 ± 3.21 | −25.47 ± 3.18 | −9.57 ± 2.30 | −10.01 ± 1.46 | −6.79 ± 1.45 |
Table 5.
SH-CFM and Mascon TWS change rates across multiple spatiotemporal scales, along with their correlation and RMSE.
Table 5.
SH-CFM and Mascon TWS change rates across multiple spatiotemporal scales, along with their correlation and RMSE.
| Time | Methods | Trend [mm/yr] | Correlation Coefficients | RMSE [mm] |
|---|
| CIRC9 | CIRC20 | MASC22 | CIRC9 | CIRC20 | MASC22 | CIRC9 | CIRC20 | MASC22 |
|---|
| 200301–201209 | SH-CFM TWS | 1.79 ± 1.16 | 1.09 ± 0.77 | 3.96 ± 0.95 | 0.49 | 0.66 | 0.83 | 29.57 | 16.86 | 16.70 |
| Mascon TWS | 3.27 ± 0.51 | 2.41 ± 0.44 | 5.11 ± 0.60 |
| 201211–201705 | SH-CFM TWS | −20.76 ± 4.42 | −14.19 ± 2.52 | −21.78 ± 2.57 | 0.65 | 0.80 | 0.84 | 41.77 | 19.34 | 24.08 |
| Mascon TWS | −10.03 ± 1.54 | −8.06 ± 1.37 | −11.61 ± 1.68 |
| 201810–202212 | SH-CFM TWS | −47.31 ± 5.46 | −30.07 ± 3.39 | −29.31 ± 3.46 | 0.78 | 0.82 | 0.83 | 60.01 | 36.45 | 35.66 |
| Mascon TWS | −12.02 ± 1.93 | −11.33 ± 1.62 | −10.08 ± 1.92 |
Table 6.
The component exchange intensity of SH-CFM and Mascon TWS changes at the spatial scales of CIRC9, CIRC20, and MASC22 across three piecewise periods.
Table 6.
The component exchange intensity of SH-CFM and Mascon TWS changes at the spatial scales of CIRC9, CIRC20, and MASC22 across three piecewise periods.
| Time | Methods | CIRC9 | CIRC20 | MASC22 |
|---|
| 200302–201209 | SH-CFM | 0.67 | 0.61 | 0.44 |
| Mascon | 0.84 | 0.72 | 0.52 |
| 201211–201705 | SH-CFM | 0.39 | 0.30 | 0.21 |
| Mascon | 0.61 | 0.41 | 0.31 |
| 201810–202212 | SH-CFM | 0.20 | 0.17 | 0.18 |
| Mascon | 0.53 | 0.39 | 0.37 |
Table 7.
The cross-correlation between TWS changes and its water storage components with precipitation at three spatial scales.
Table 7.
The cross-correlation between TWS changes and its water storage components with precipitation at three spatial scales.
| Spatial Scale | Time Lags [month] | LRWS | SMS | SWE | CWS | SH-CFM TWS | Mascon TWS | SH-CFM GWS | Mascon GWS |
|---|
| CIRC9 | 0 | 0.14 | 0.16 * | 0.11 | 0.11 | 0.05 | 0.11 | −0.11 | −0.14 |
| 1 | 0.17 * | 0.20 * | 0.07 | −0.06 | 0.14 * | 0.17 * | −0.07 | −0.16 * |
| 2 | 0.17 * | 0.14 * | 0.07 | −0.08 | 0.06 | 0.16 * | −0.12 | −0.16 * |
| 3 | 0.16 * | 0.09 | 0.03 | −0.06 | 0.10 | 0.10 | −0.07 | −0.16 * |
| 4 | 0.18 * | 0.11 | 0.09 | 0.01 | 0.08 | 0.11 | −0.10 | −0.18 * |
| 5 | 0.16 * | 0.13 | 0.09 | 0.03 | 0.13 | 0.14 | −0.05 | −0.15 * |
| 6 | 0.18 * | 0.13 | 0.01 | 0.04 | 0.17 * | 0.19 * | −0.03 | −0.15 * |
| CIRC20 | 0 | 0.14 * | 0.21 * | 0.11 | 0.13 | 0.09 | 0.12 | −0.06 | −0.13 |
| 1 | 0.18 * | 0.22 * | 0.07 | −0.07 | 0.17 * | 0.20 * | −0.02 | −0.13 |
| 2 | 0.17 * | 0.14 * | 0.05 | −0.09 | 0.10 | 0.17 * | −0.07 | −0.13 |
| 3 | 0.16 * | 0.08 | 0.02 | −0.07 | 0.12 | 0.12 | −0.03 | −0.14 * |
| 4 | 0.17 * | 0.10 | 0.09 | 0.01 | 0.05 | 0.10 | −0.11 | −0.17 * |
| 5 | 0.16 * | 0.13 | 0.07 | 0.03 | 0.11 | 0.13 | −0.04 | −0.14 |
| 6 | 0.18 * | 0.13 | −0.02 | 0.04 | 0.15 * | 0.20 * | −0.01 | −0.11 |
| MASC22 | 0 | 0.15 * | 0.25 * | 0.09 | 0.12 | 0.19 * | 0.20 * | 0.04 | −0.05 |
| 1 | 0.20 * | 0.26 * | 0.05 | −0.06 | 0.27 * | 0.26 * | 0.12 | −0.05 |
| 2 | 0.19 * | 0.20 * | 0.07 | −0.05 | 0.23 * | 0.23 * | 0.08 | −0.05 |
| 3 | 0.18 * | 0.13 | 0.03 | −0.04 | 0.19 * | 0.16 * | 0.07 | −0.11 |
| 4 | 0.19 * | 0.15 * | 0.11 | 0.00 | 0.14 | 0.16 * | −0.02 | −0.14 * |
| 5 | 0.18 * | 0.15 * | 0.07 | 0.01 | 0.20 * | 0.19 * | 0.07 | −0.09 |
| 6 | 0.20 * | 0.15 * | −0.01 | 0.01 | 0.20 * | 0.23 * | 0.06 | −0.05 |


