Article

Analysis of Geometric Distortion in Sentinel-1 Images and Multi-Dimensional Spatiotemporal Evolution Characteristics of Surface Deformation Along the Central Yunnan Water Diversion Project

1
Faculty of Land Resources Engineering, Kunming University of Science and Technology, Kunming 650093, China
2
Yunnan Key Laboratory of Intelligent Monitoring and Spatiotemporal Big Data Governance of Natural Resources, Kunming 650051, China
3
Yunnan Institute of Geological Environment Monitoring, Kunming 650216, China
*
Author to whom correspondence should be addressed.
Remote Sens. 2025, 17(18), 3250; https://doi.org/10.3390/rs17183250
Submission received: 16 August 2025 / Revised: 3 September 2025 / Accepted: 17 September 2025 / Published: 20 September 2025

Abstract

Highlights

What are the main findings?
  • A systematic quantification of the geometric distortion distribution characteristics of SAR images along the Central Yunnan Water Diversion Project (CYWDP) for the first time.
  • Significant deformation areas along the CYWDP were identified, and their deformation characteristics were revealed.
What is the implication of the main finding?
  • Providing a scientific basis for geological disaster prevention and mitigation along the CYWDP.
  • Providing a methodological reference for safety monitoring of major projects in complex terrain.

Abstract

The Central Yunnan Water Diversion Project (CYWDP) is currently under construction and represents China’s most extensive and geologically challenging water transfer infrastructure, facing significant geohazard risks induced by intensive engineering activities, posing severe threats to its entire lifecycle safety. Therefore, monitoring and spatiotemporal evolution analysis of surface deformation along the CYWDP is critically important. This study presents the first integrated analysis of geometric distortions and multi-dimensional spatiotemporal deformation characteristics along the CYWDP, utilizing both ascending and descending orbit data from Sentinel-1. First, by integrating the Layover-Shadow Mask (LSM) model and R-Index method, we identified geometric distortion types in SAR imagery and evaluated their suitability for deformation monitoring. Subsequently, SBAS-InSAR technology was employed to derive line-of-sight (LOS) deformation information from 124 images (ascending) and 90 images (descending) acquisitions (2022–2024), enabling the identification of significant deformation zones and analyzing their spatial distribution characteristics. Finally, two-dimensional (2D) deformation fields were obtained through the joint inversion of ascending and descending orbit data in typical deformation zones. The results reveal that geometric distortions in Sentinel-1 imagery along the CYWDP are dominated by foreshortening effects, accounting for 35.3% of the study area in the ascending-orbit data and 37.9% in the descending-orbit data. A total of 10 significant deformation-prone areas were detected, and the most pronounced subsidence, amounting to −164 mm/y, was observed in the northern Jinning District (Luoci-Qujiang section), showing expansion trends toward water conveyance infrastructure. This study reveals surface deformation’s multi-dimensional spatiotemporal evolution patterns along the CYWDP. The findings support geohazard mitigation and provide a methodological reference for safety monitoring of major water conservancy projects in complex geological environments.

1. Introduction

Global climate change intensifies uncertainties in water security and exacerbates the uneven distribution of water resources. Inter-basin water transfer offers a viable solution to mitigate the imbalance between water supply and demand, particularly in regions characterized by significant spatial and temporal disparities in water availability [1]. The central Yunnan region has experienced chronic water scarcity for decades due to limited water resources and high water consumption, making it one of China’s most severely arid regions. This persistent water shortage significantly constrains regional socioeconomic development.
As the most extensive water transfer infrastructure in Southwest China, the CYWDP originates in Shigu Town, Lijiang, and spans the entire water supply regions of Lijiang, Dali, Chuxiong, Kunming, Yuxi, and Honghe Prefecture. The project terminates at Xinpobei in Honghe Prefecture, with a total water transmission length of approximately 664 km [2]. Upon completion, the CYWDP will significantly alleviate water scarcity in central Yunnan, delivering substantial socioeconomic benefits to the region. However, under conditions of complex and diverse geological environments and widespread distribution of fault zones and seismic belts, the construction of large-scale water conveyance infrastructure projects over extensive areas poses numerous technical challenges during implementation and substantial risks to safety monitoring along the route. Local adverse geological conditions, such as surrounding rock deformation and mining-induced disturbances [3,4], render artificial water conveyance systems highly vulnerable to geological hazards. China’s accelerating urbanization has positioned urban development as the dominant driver of land subsidence phenomena, resulting in a continuous expansion of ground deformation in both magnitude and spatial extent [5]. Furthermore, urban construction activities can subject water supply pipelines to external loads, leading to differential deformation. This phenomenon may subsequently cause pipeline bending, localized stress accumulation, and potential structural failures [6]. Land subsidence, sinkholes, or collapses pose significant threats to long-distance pipelines, severely compromising their structural stability and operational safety, thereby introducing potential risks to the future reliability of water supply. Early-stage monitoring and analysis of route-specific surface deformation patterns are essential to safeguard water supply security for 15 million beneficiaries and prevent significant socioeconomic impacts in receiving basins. Conventional surface deformation monitoring techniques, such as leveling, Global Navigation Satellite System (GNSS) measurements, or subsurface inclinometers, are constrained by terrain conditions or sparse spatial sampling, making it difficult to achieve wide-area deformation monitoring [7,8,9]. Moreover, high-frequency monitoring of deformation across the entire project extent would require substantial human and material resources. As a result, there exists a pressing requirement for a method that is economical, efficient, and highly precise to carry out large-scale deformation monitoring.
InSAR is a technology based on the use of SAR images. Satellite SAR is a sensor that operates continuously, regardless of weather or time, enabling the observation of slight surface deformations. Consequently, InSAR has emerged as a pivotal technology for large-scale surface deformation monitoring [10]. Although Differential InSAR (D-InSAR) is prone to decorrelation effects and atmospheric-induced phase delays, Multi-Temporal InSAR (MT-InSAR) techniques overcome these limitations by exploiting high-coherence targets [11], enabling the extraction of long-term surface deformation time series from repeated satellite acquisitions [12]. MT-InSAR techniques are predominantly categorized into two main approaches: Persistent Scatterer (PS) [13] and the Small Baseline Subset (SBAS) method [14]. These approaches differ fundamentally in their pixel selection criteria: PSI targets PS exhibiting stable phase characteristics, while SBAS focuses on Distributed Scatterers (DS) [15] that require multi-looking processing for phase optimization. These methods have been successfully employed by numerous researchers to monitor and analyze deformation at various stages of water conservancy projects and their surrounding areas. For instance, Lyu et al. employed the PS-InSAR method to acquire surface deformation information in Beijing over a 13-year period [16]. The derived deformation data enabled further analysis of the spatiotemporal relationship between the South-to-North Water Diversion Project and land subsidence in Beijing. The results indicated that the South-to-North Water Diversion Project slowed down the land subsidence rate and significantly alleviated the groundwater shortage in Beijing. Utilizing the techniques of PS-InSAR and SBAS-InSAR, Dong et al. conducted a monitoring task of multi-scale deformation along the middle route of the South-to-North Water Diversion Project [17]. They identified unstable canal sections by detecting obvious deformation areas within the buffer zones. The findings demonstrated that InSAR has remarkable advantages in monitoring the deformation of hydraulic engineering projects. Nevertheless, owing to the imaging properties of SAR and the intricate environmental circumstances, MT-InSAR continues to encounter problems like decorrelation, a low spatial density of measurement points, and subpar interferogram quality during the monitoring of surface deformation in plateau and mountainous areas [18]. As an advanced technique relying on DS, the SBAS method significantly mitigates decorrelation by limiting spatiotemporal baseline variations [14], further expanding the application scope of time-series InSAR [19,20]. Currently, no studies have applied InSAR technology for systematic deformation monitoring along the route area of the CYWDP.
Therefore, this study employs the SBAS-InSAR technique for the first time to analyze surface deformation along the route of the CYWDP. First, a geometric distortion analysis of Sentinel-1 images is performed to assess their suitability for monitoring surface deformation associated with the project. Subsequently, the SBAS-InSAR method is applied to gain the annual average deformation rate in the LOS direction. Additionally, optical images are combined to analyze the deformation areas’ spatial distribution and evolutionary characteristics. Eventually, through combining the deformation results from ascending and descending orbits, 2D deformation information in both the vertical and horizontal directions of typical deformation zones is inverted. Furthermore, time-series evolutionary characteristics of characteristic points in local areas are analyzed. This serves as a scientific foundation for the safe construction and operation of the CYWDP and the prevention and mitigation of geological disasters occurring along its route.

2. Study Area and Datasets

2.1. Study Area

The Yangtze River Basin in China boasts abundant water resources. The renowned South-to-North Water Diversion Project has successfully diverted water from the Yangtze River, thereby effectively mitigating the water shortage crisis in Northern China. As the upper section of the Yangtze River, the Jinsha River is characterized by profound river valleys and precipitous slopes, which render it a highly suitable site for the development of large-scale water conservancy projects [7]. CYWDP aims to channel water from the Jinsha River to the arid central Yunnan region, traversing the entire province of Yunnan. Taking the water conveyance route of the CYWDP as the axis, we selected core research areas with 10 km equidistant buffer zones. The study area is divided into three segments: Shigu (Lijiang) to Wanjia, Wanjia to Luoci, and Luoci to Qujiang, as illustrated in Figure 1a.
Influenced by dynamic effects resulting from the west-to-east and south-to-north movement of the Indian–Eurasian plate collision, the faults along the water conveyance project are densely developed, with intense crustal movements. Seismic activities in the area are characterized by high frequency, large magnitudes, and widespread distribution. The distribution of faults and earthquakes in the study area is illustrated in Figure 1a. The seismic data are sourced from the China Earthquake Science Data Center (https://data.earthquake.cn/). From 2014 to 2024, a total of 145 seismic events have occurred along the route of the CYWDP. These earthquakes are predominantly shallow-focus events, with focal depths mainly concentrated within the 5–18 km range. Table 1 presents details of seven earthquakes with magnitudes exceeding 5.0 that took place during this decade. These significant seismic events are primarily clustered in Dali Prefecture, with the largest-scale earthquake being the 2021 magnitude 6.4 Yangbi County earthquake in Yunnan Province. From the perspective of fault zone distribution, the Shigu-Wanjia segment primarily involves the Xiaojinhe-Lijiang Fault Zone, the Heqing-Eryuan Fault Zone, and the Cangshan Piedmont Fault Zone. The second segment is situated within the Yuanmou Fault Zone and the Lufeng Fault Zone. The third segment is mainly located within multiple minor fault zones, including the Xiaojiang Fault Zone, the Yujiawan Fault Zone, and the Qujiang Fault Zone.
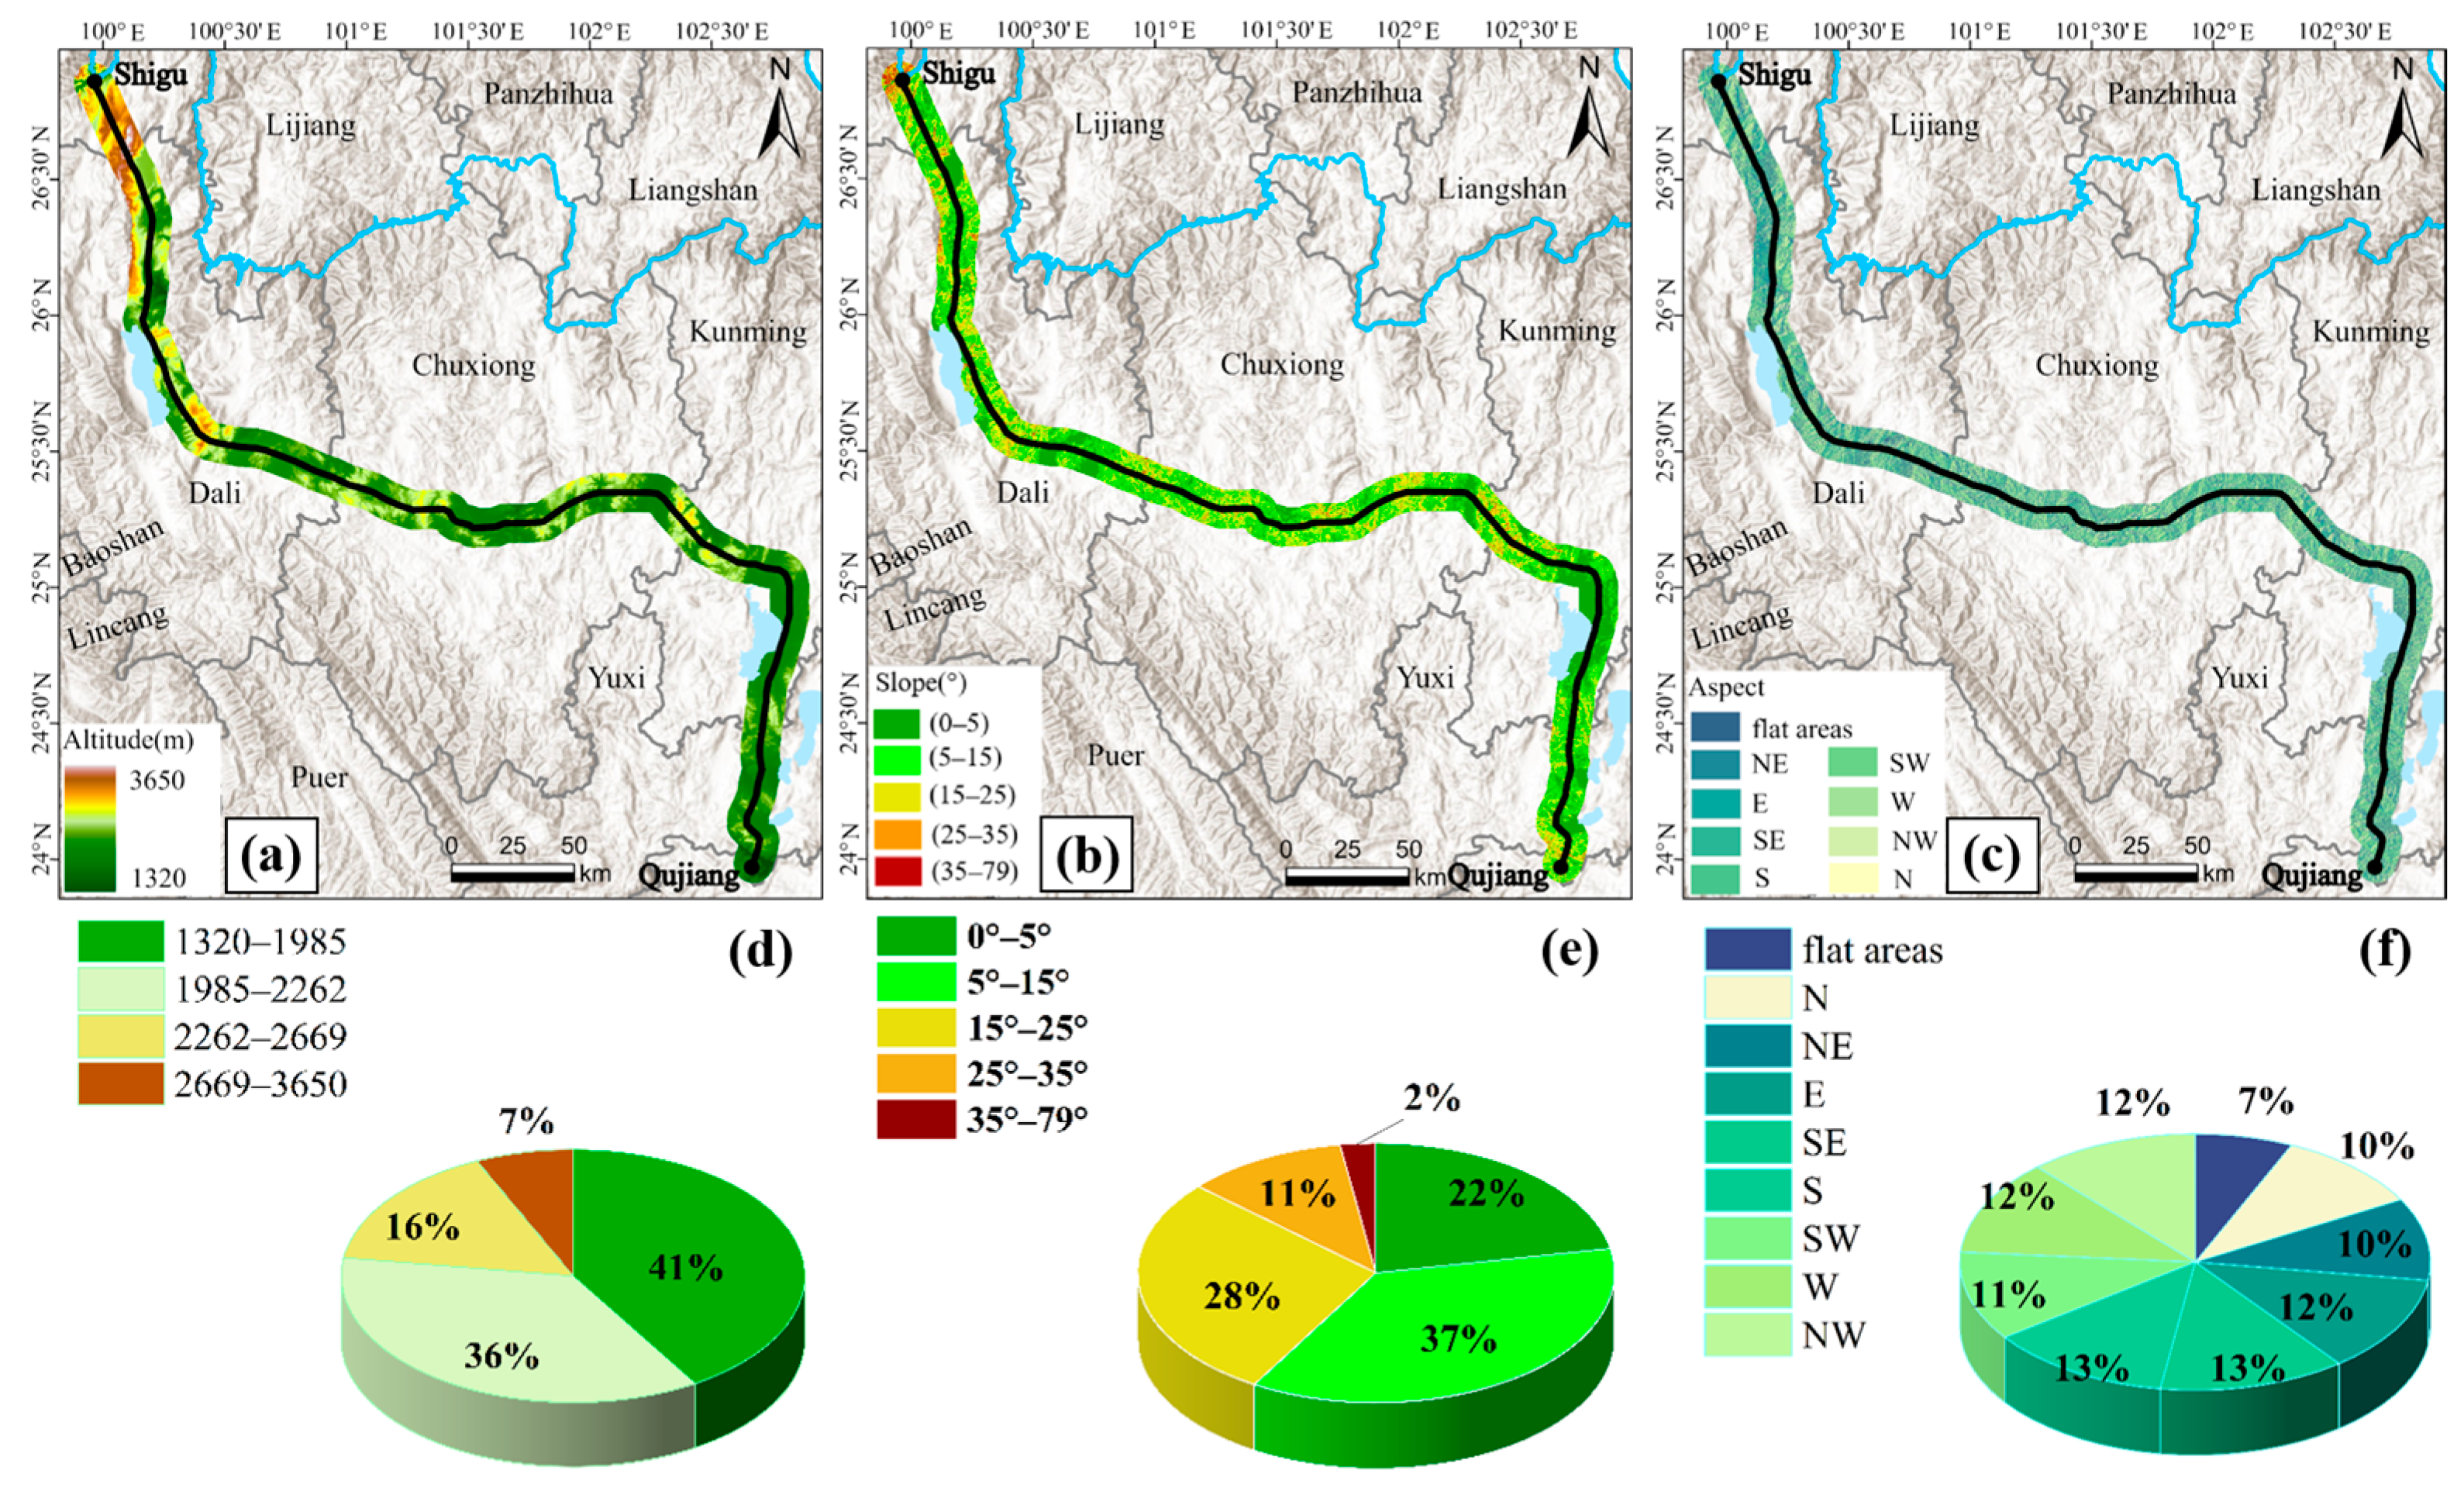
The study area’s elevations range from 1320 m to 3650 m, creating a maximum elevation difference of 2330 m. The elevation data were sourced from the Shuttle Radar Topography Mission (SRTM) provided by NASA (https://earthexplorer.usgs.gov/). The vertical elevation difference along the water conveyance route is approximately 1537 m (Figure 1d). Using the natural breaks classification method, we categorized the study area’s elevation into four distinct classes (Figure 2a,d). The low-elevation zone (<1985 m) predominantly occupies the central-eastern region, covering 41% of the total area. In contrast, the high-elevation zone (>2262 m) is primarily concentrated in the western sector. Overall, the terrain exhibits a pattern of higher elevations in the northwest and lower elevations in the southeast, which provides natural advantages for self-flowing water conveyance. We reclassified the slope gradient (ranging from 0° to 79°) in the study area into five grades (Figure 2b,e). Among them, gentle slopes encompass the largest proportion (37%) and are mainly distributed in the central part of the study area. Flat or very gentle slopes are concentrated in the Central Yunnan Urban Agglomeration, covering 22% of the total area, while escarpments are chiefly located in the high-elevation regions in the northwest, constituting 2% of the total area. Due to the relatively low sensitivity of InSAR technology in acquiring north–south surface deformation information, we calculated that the total area with north- and south-facing slopes accounts for 23% (Figure 2c,f).
Located in a warm-temperate zone with a subtropical plateau monsoon climate, this region undergoes marked seasonal precipitation. The surface runoff exhibits strong erosive capacity. Under the combined effects of heavy rainfall, active fault zones, seismic activity, and anthropogenic engineering activities (particularly open-pit mining), the risk levels associated with geohazards such as landslides, debris flows, and rockfalls are substantially increased [21,22]. Moreover, the steep terrain poses substantial challenges for InSAR side-looking imaging observation.

2.2. Datasets

Surface uplift and river incision have led to the development of alpine-gorge landforms in the mountainous regions of the southwest plateau. The integration of Sentinel-1 ascending and descending orbit data enhances InSAR deformation monitoring capabilities by improving visibility in complex terrains [23]. Hence, a total of 124 ascending and 90 descending Sentinel-1 images, obtained from October 2022 to February 2024, were chosen by this study for conducting SBAS-InSAR surface deformation processing. Table 2 provides detailed parameters of the Sentinel-1A datasets, while Figure 1b,c displays the coverage regions of the ascending and descending track images, respectively. We employed the 30 m-resolution SRTM digital elevation model (DEM) from NASA to generate terrain-related factors and eliminate topographic phase effects from the image data [24]. All optical images were obtained from the Google Earth platform.

3. Materials and Methods

3.1. Method for Identifying Geometric Distortions in SAR Imagery

The side-looking imaging geometry and steep, rough topography may cause geometric distortions in the imagery [25]. Conducting precise quantitative analysis of geometric distortions is beneficial for reasonably evaluating the applicability of SAR data in monitoring deformations along the CYWDP. Particularly, in alpine-gorge areas characterized by substantial elevation disparities and complex slope orientation variations, the slope gradient and aspect attributes of terrain features constitute the principal factors that give rise to geometric distortions [26]. To effectively identify geometric distortions in the study area, this study integrates the LSM model with the R-Index method.
Reference [25] proposed the LSM model, which takes into account the satellite position, azimuth angle, and terrain elevation parameters to quantify the relative positions between the surface of the ground and the satellite LOS direction to distinguish various distortion patterns. The fundamental concept is as follows: On the satellite-facing slope, active layover occurs when the slope angle exceeds the incidence angle, with adjacent areas classified as passive layover due to radar wave interference. On the opposite slope, active shadow forms when the slope gradient surpasses a critical threshold (90°—the incidence angle), while occluded adjacent zones are identified as passive shadow.
The R-Index model was initially proposed by Reference [27], with subsequent studies contributing to its refinement and enhancement [28]. The fundamental concept involves acquiring satellite parameters and topographic parameters, then converting the topographic effects into the ratio of slant-range resolution to ground-range resolution for SAR image pixels. The R-Index can be specifically expressed as [29]:
R = sin θ β sin A
where θ , β and A represent the incidence angle in the LOS direction, the slope gradient, and the aspect correction factor, respectively.
The aspect correction factor A has different calculation formulas for descending and ascending orbit SAR images: A = α + γ + 180 for ascending and A = α γ for descending, where α is the slope aspect, and γ is the angle between the satellite’s flight direction and true north (Table 2). Different R-Index thresholds can define distinct regions within SAR imagery, enabling the quantification of the influence of topographic factors on radar imaging and ultimately facilitating a quantitative analysis of geometric distortions in SAR images.
However, both methods exhibit inherent limitations. The LSM model can only simulate active and passive layover and shadow areas, but fails to identify foreshortening distortion regions that are more prevalent in real-world scenarios. Conversely, the R-Index method can detect active layover and foreshortening areas, yet demonstrates difficulties in extracting complete layover and shadow regions. Furthermore, due to the near-polar sun-synchronous orbit from which Sentinel-1 satellite data are obtained, their observation geometry exhibits limited sensitivity to north–south deformation in non-polar regions [30,31]. Given the discrepancies in geometric distortion identification results between the aforementioned two methods, to enhance the accuracy of distortion identification, during the experimental process, subsequent statistical analyses in this study excluded areas with north- and south-facing slopes. Moreover, the results from the two algorithms were fused using ENVI software (Version 5.6; developed by NV5 Geospatial Solutions, Inc., Broomfield, CO, USA; https://www.nv5geospatialsoftware.com/Products/ENVI (accessed on 16 September 2025)) and ArcGIS Pro software (Version 3.0.2; developed by Esri Inc., Redlands, CA, USA; https://www.esri.com/en-us/arcgis/products/arcgis-pro/overview (accessed on 16 September 2025)) to achieve more precise geometric distortion identification.

3.2. SBAS-InSAR Processing

InSAR technology is inherently limited by phase decorrelation phenomena. Variations in target scattering mechanisms and atmospheric effects (the impact of temporal delays in dataset acquisition on atmospheric phase) make it challenging to separate atmospheric phase components from deformation signals [32]. The study area’s plateau-mountainous location further exacerbates susceptibility to atmospheric delay effects in InSAR processing. SBAS-InSAR is a multi-temporal interferometric SAR analysis method based on multiple master images, as proposed in reference [14]. This approach fully utilizes the acquired SAR imagery through the selection of interferometric pairs that possess short temporal and spatial baselines. It leverages highly coherent points to extract time-series deformation information across the region, thereby enhancing the overall temporal sampling rate of the observed data and the spatial density of measurement points. We performed SBAS processing using the ENVI software, with the temporal baseline threshold set to 120 days and the coherence threshold set to 0.15.
Assuming that SAR image sequences covering the area are acquired at times t 0 , t 1 ,…, t N , we optimally form interferometric pairs based on the connectivity graph and perform differential interferometric processing. This yields M differential interferograms adhere to the following mathematical relationship:
N + 1 2 M N N + 1 2
The phase value of the i differential interferogram can be represented in the following form:
δ φ i ( a , b ) = φ ( t E , a , b ) φ ( t F , a , b ) 4 π λ [ d ( t E , a , b ) d ( t F , a , b ) ] + δ φ e l e v a t i o n i + δ φ n o i s e i
here, ( a , b ) represents the coordinates of the i pixel, δ φ i ( a , b ) denotes the phase value relative to the phase unwrapping reference point; φ ( t E , a , b ) and φ ( t F , a , b ) denote the SAR image phases at times t E and t F ( t F > t E ), respectively; d ( t E , a , b ) and d ( t F , a , b ) represent the displacements along the radar LOS direction at times t E and t F , respectively; δ φ e l e v a t i o n i and δ φ n o i s e i denote the phase differences induced by topography, atmospheric effects, and noise. We used GACOS (Generic Atmospheric Correction Online Service) data to correct the large-scale tropospheric delay phases in the interferograms [33]. Following temporal processing, nonlinear deformation signals were isolated through spatiotemporal filtering. Ultimately, the deformation field was generated by superimposing the linear deformation component (obtained via least squares estimation) with the nonlinear deformation component [34].
As delineated in Equation (3), the differential interferometric phase is equal to the product of the average phase velocity over the period between the acquisition of the two images and the time duration. To be precise, the phase value of the interferogram can be formulated as:
k = t A , i + 1 t B , i t k t k 1 v k = δ φ i
where v i = φ i φ i 1 t i t i 1 . For all interferograms, the corresponding linear deformation model can be represented by a M × N coefficient matrix, expressed in matrix form as:
A v = δ φ
where A represents a M × N matrix. The generalized inverse matrix of A is obtained through singular value decomposition (SVD), yielding the minimum-norm solution for deformation velocity. Finally, by integrating the velocities over respective time intervals, we obtain the cumulative deformation for each period. Consequently, the SBAS-InSAR approach demonstrates capability in processing limited datasets with high computational efficiency, making it particularly suitable for non-urban areas or regions with extensive coverage.
This study disregards the north–south component. Instead, a two-dimensional decomposition method, which is constrained by combined ascending and descending orbit data, is utilized to conduct SBAS-InSAR deformation inversion. To prevent the estimation of false deformation signals caused by data gaps, in this study, the horizontal and vertical components for a given pixel are calculated only when both the ascending-orbit and descending-orbit data for that pixel are valid. If either of the input values is null, the corresponding output component is automatically flagged as invalid. Theoretically, the horizontal and vertical deformation components for that pixel should simultaneously output null values. The underlying principle is delineated in the following manner:
It is assumed that during the observation, the flight azimuth angles of the two SAR satellites are α 1 and α 2 , respectively, and the corresponding local incidence angles for a specific ground pixel are θ 1 and θ 2 . Then, the estimated two-dimensional deformation d e , d u in the east–west and vertical directions can be expressed as:
d e d u = K d l o s , 1 d l o s , 2
where K = K 1 K 2 = s i n θ 1 c o s a 1 c o s θ 1 s i n θ 2 c o s a 2 c o s θ 2 - 1 , and d l o s , 1 , d l o s , 2 represent the InSAR observations in two LOS directions. The variance corresponding to two-dimensional deformation can be expressed as:
σ e 2 σ u 2 = K 1 D X X K 1 T K 2 D X X K 2 T
where D x x is a covariance matrix, which can be expressed as D X X = s l o s , 1 2 s l o s , 1 , l o s , 2 s l o s , 1 , l o s , 2 s l o s , 2 2 , and s l o s , 1 2 , s l o s , 2 2 represents the observation error. Based on this, the LOS deformation rate can be converted into the surface deformation rates in the east–west and vertical directions.
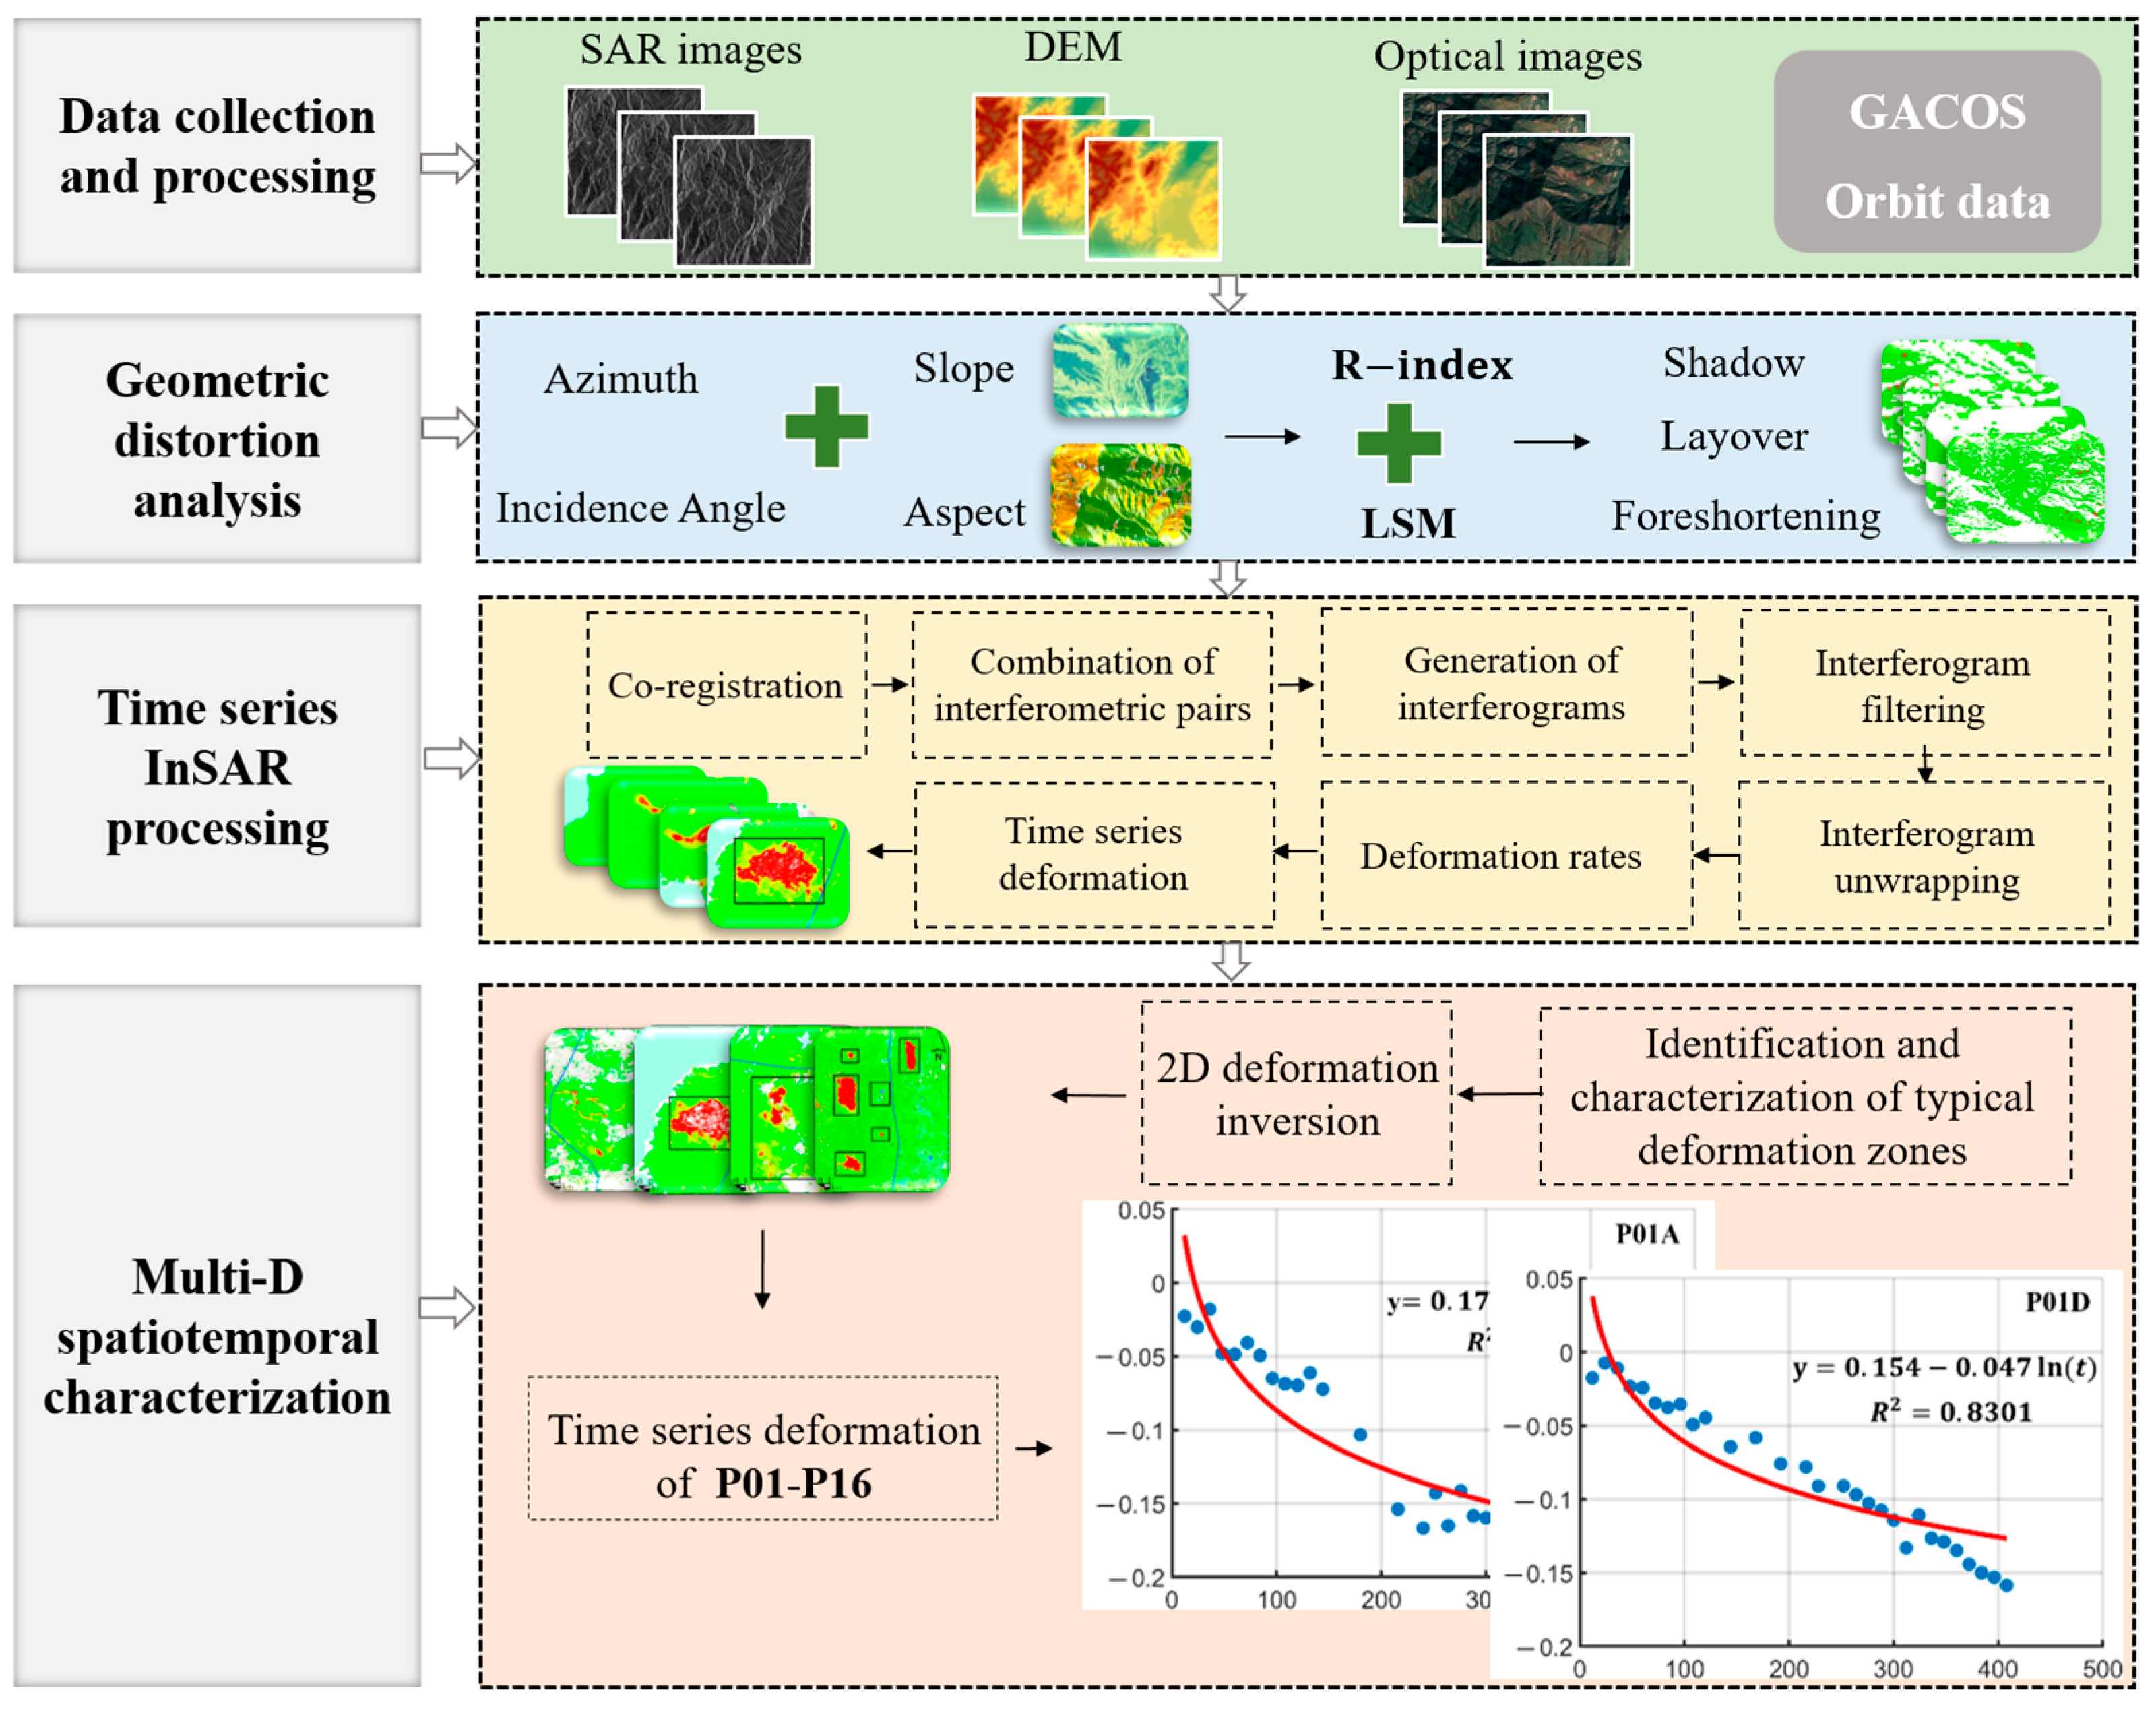
This study analyzes the geometric distortion characteristics of Sentinel-1 images to determine their suitability for monitoring surface deformation along the CYWDP. On this basis, SBAS-InSAR processing is implemented to capture LOS-direction deformation rates along the project route. Subsequent integration of dual-orbit datasets allows for the inversion of comprehensive 2D surface movement patterns in selected deformation zones. The time-series characteristics of feature points are then extracted, providing crucial reference values for the proactive prevention and control of geological hazards along the CYWDP. The overall workflow is illustrated in Figure 3.

4. Results

4.1. Results and Analysis of Geometric Distortion Identification

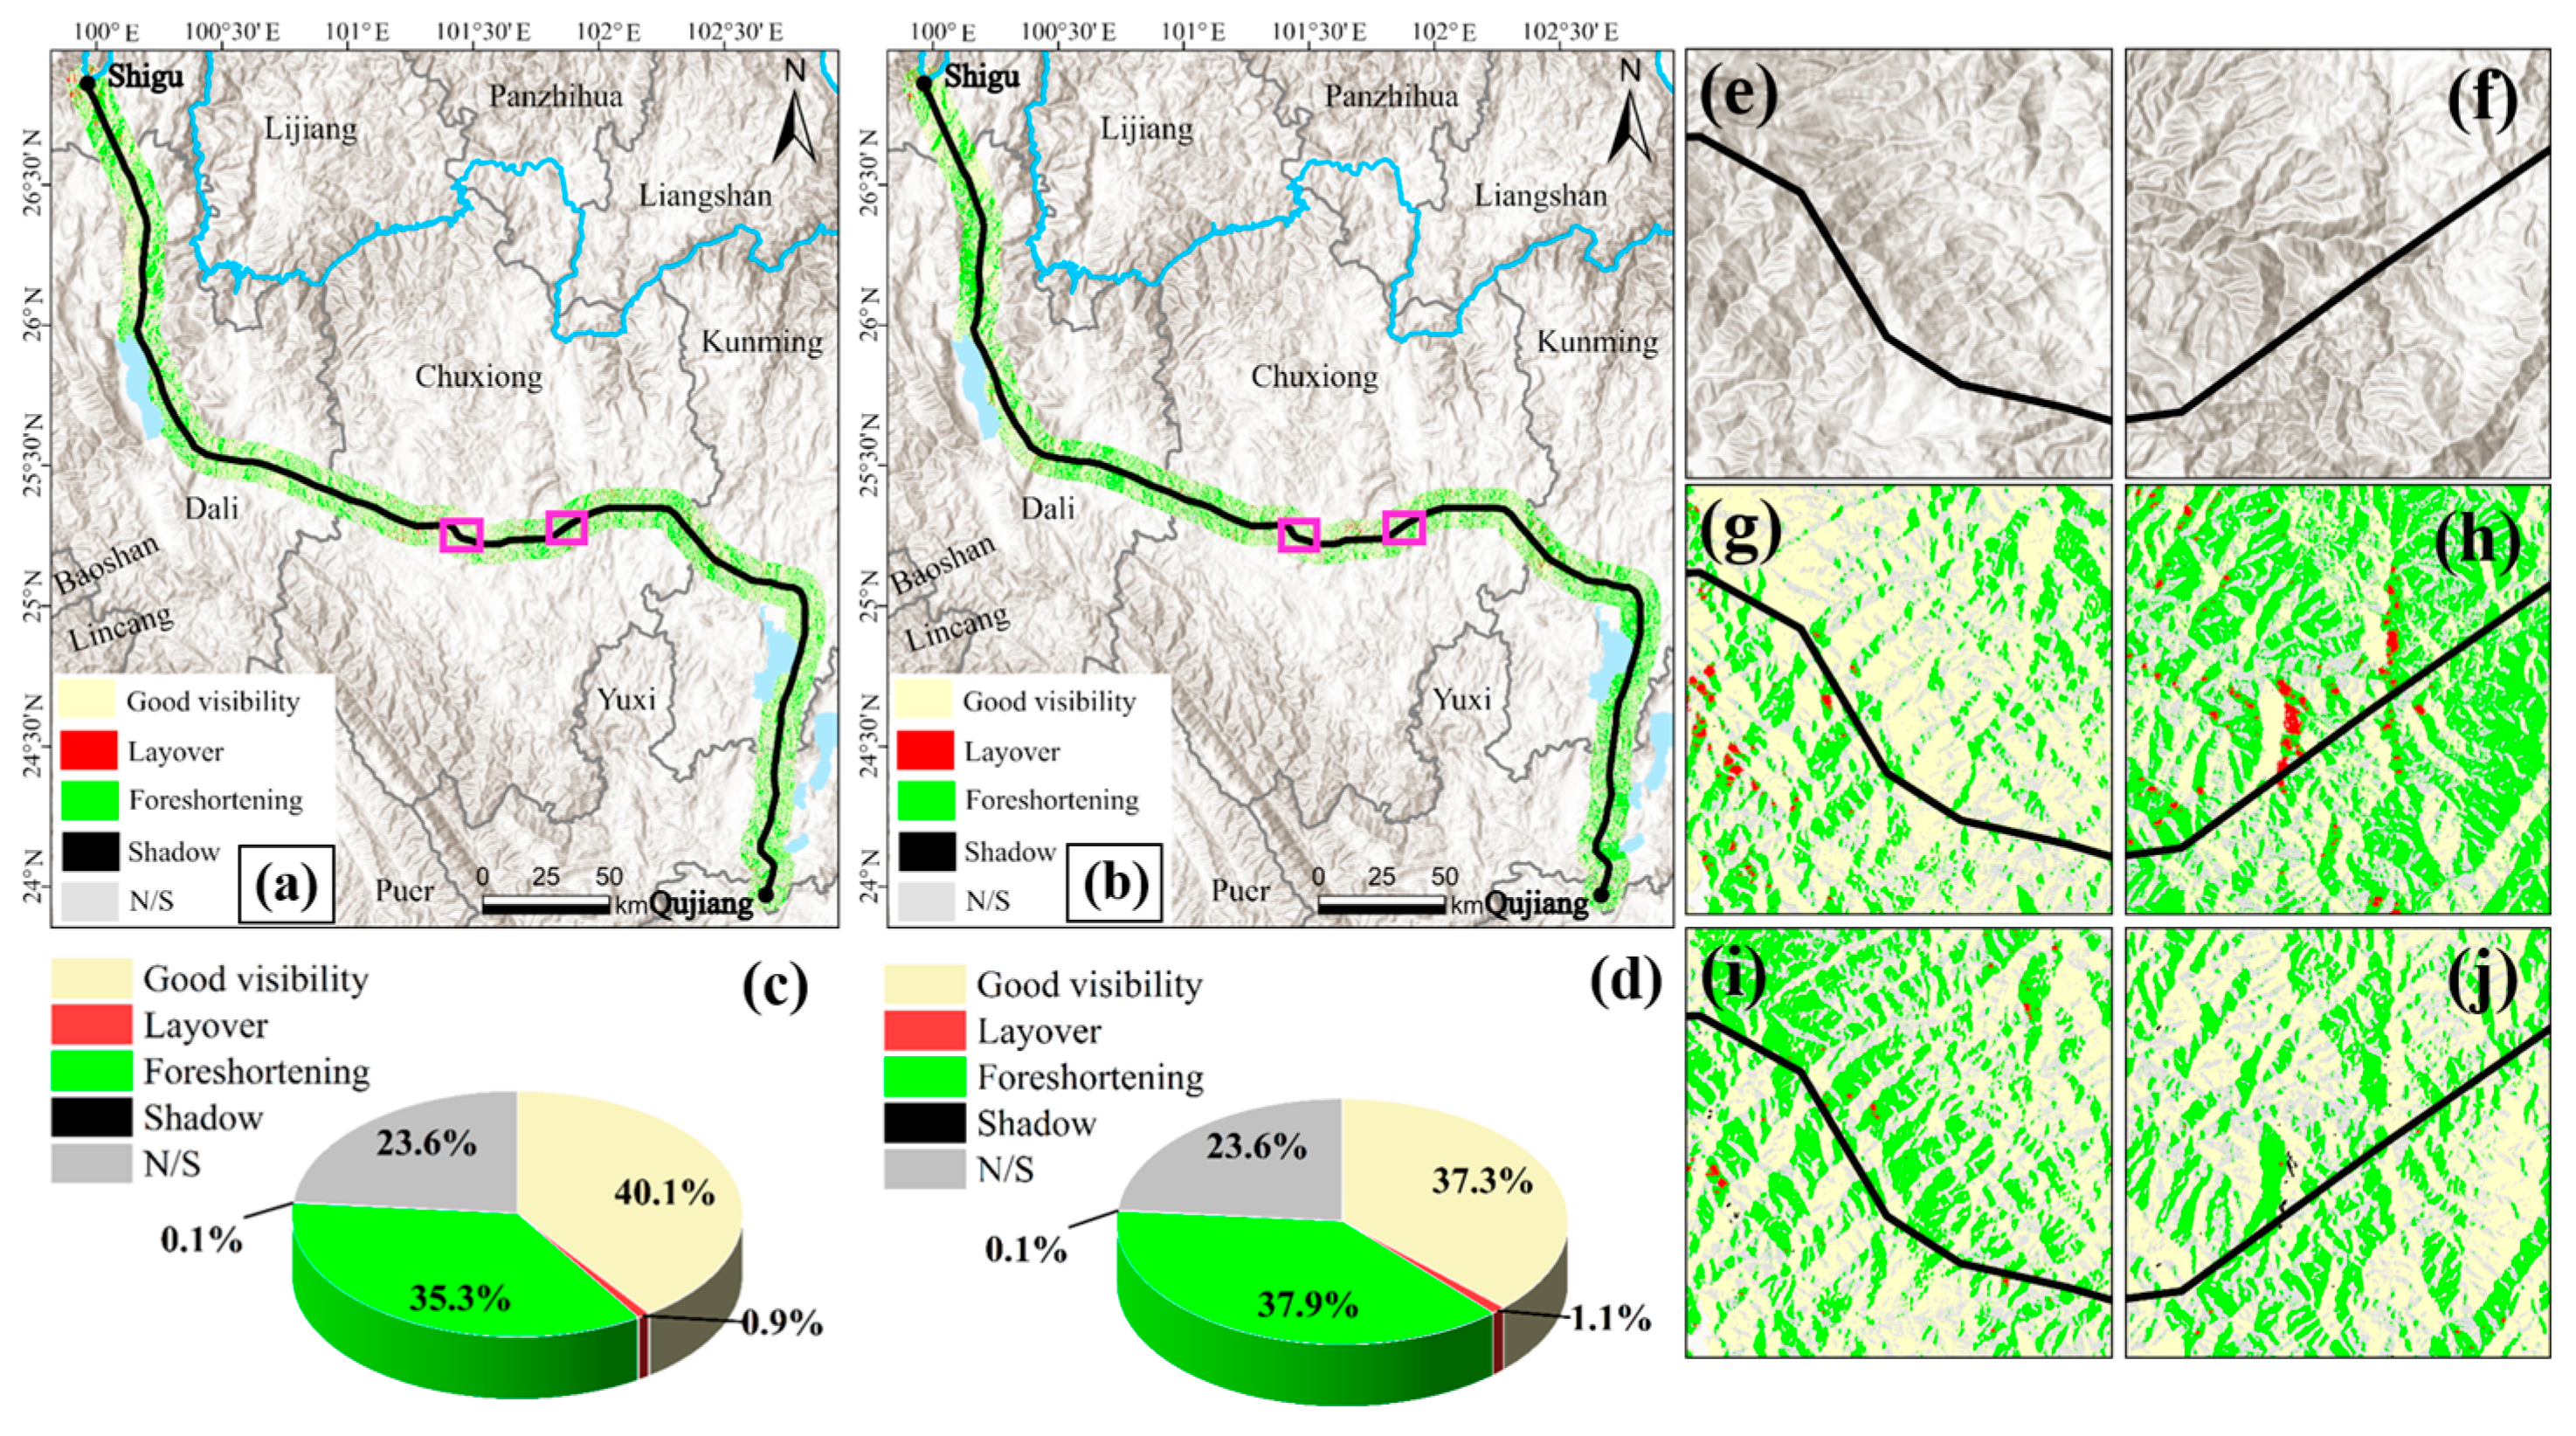
Figure 4 illustrates the spatial distribution of geometric distortions in the study area. Our analysis reveals that shadow effects account for only 0.1% of the total study area under both data conditions, indicating minimal radar signal occlusion by steep terrain that can be considered negligible in practical research. Meanwhile, layover effects maintain approximately 1% coverage under both data conditions, exerting limited influence on spatial positioning errors induced by topographic relief. The comprehensive analysis reveals that foreshortening dominates the types of geometric distortion across the study area. Specifically, foreshortening covers approximately 3698 km2 (35.3% of the study area) in ascending orbit data and 3970 km2 (37.9%) in descending orbit data. Unlike other geometric distortion types, foreshortening primarily compresses target features in the imagery while preserving partial backscattering signals, enabling a certain ability to acquire surface information and exhibiting moderate visibility. Based on this characteristic, we can still employ InSAR technology to conduct a certain degree of monitoring in the study area. In the ascending-orbit data, the area with good visibility is approximately 4201 km2, accounting for 40.1% of the total area. In contrast, in the descending-orbit data, the area with good visibility is about 3908 km2, representing 37.3% of the total. The aforementioned quantitative statistical results demonstrate that, regardless of whether ascending or descending orbit data are used, the areas suitable for InSAR observation still exceed 70% of the total area, respectively. Moreover, the ascending data have a larger area with good visibility compared to the descending data. This implies that the ascending data exhibit better adaptability within the study area. For a more detailed comparative analysis of multi-orbit detection capabilities, we selected two local regions for examination. Figure 4e–j presents the corresponding detection results. Upon observation, it can be found that within the same region, areas with good visibility and foreshortening areas in the ascending data and descending data generally exhibit an opposite spatial distribution pattern. This phenomenon is consistent with the actual topographic conditions, and it also validates the accuracy and reliability of the geometric distortion detection results in the study area.

4.2. SBAS-InSAR Deformation Results

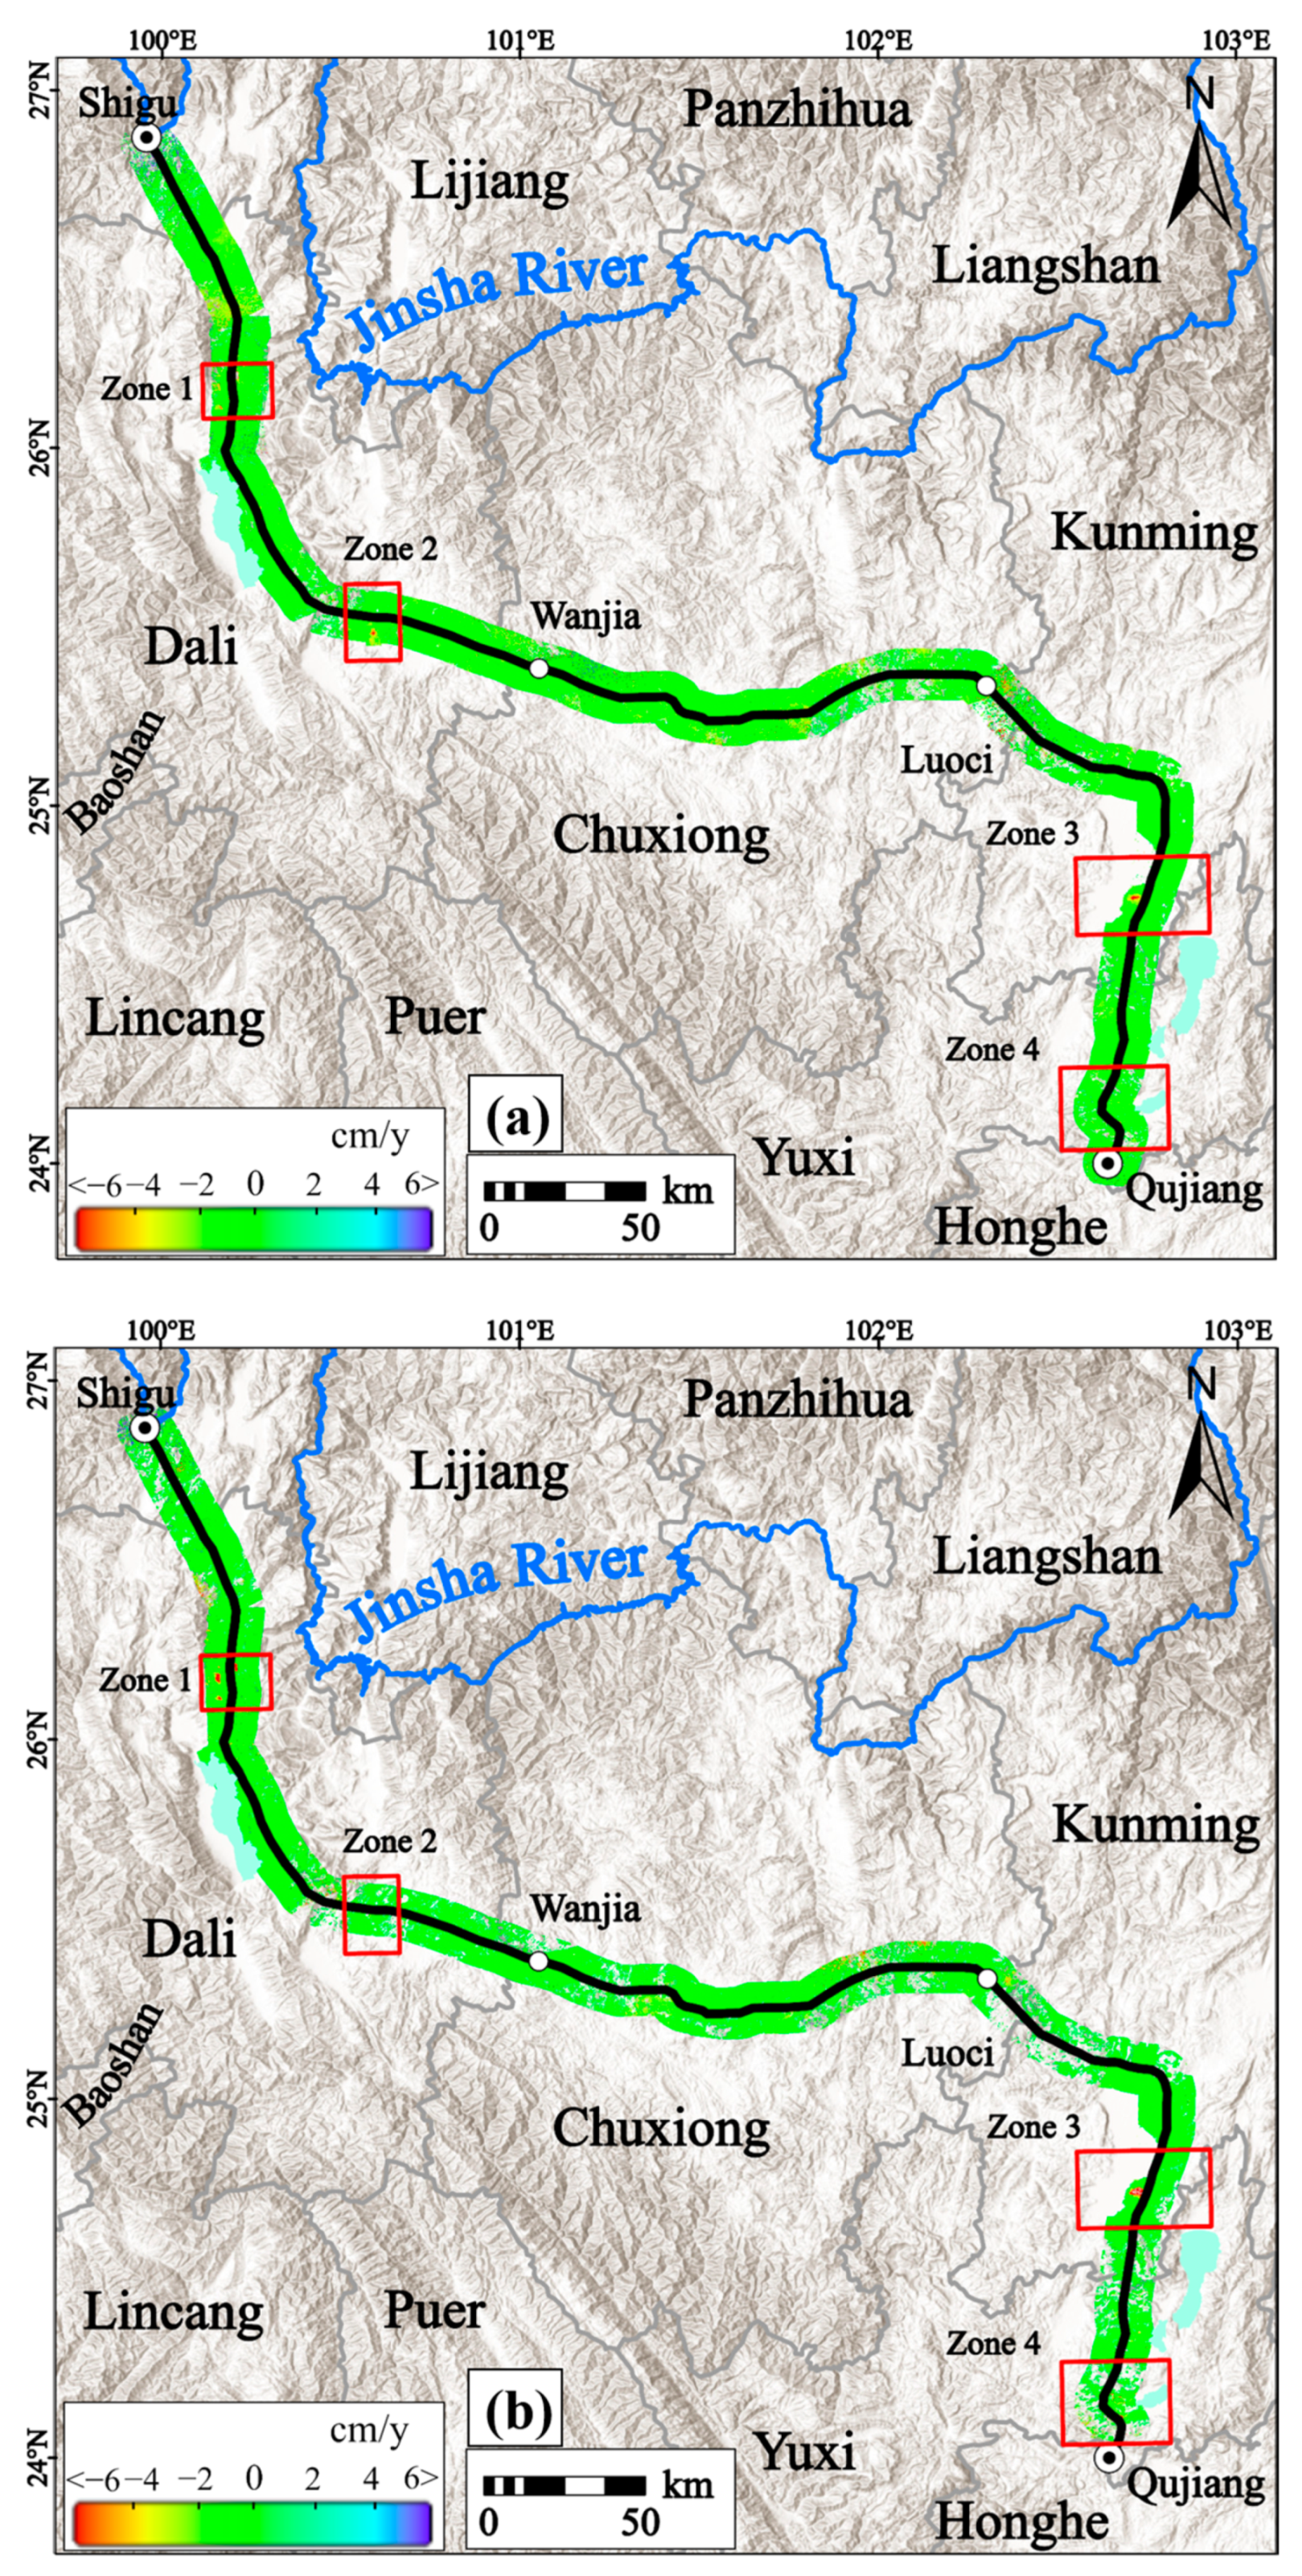
Figure 5 presents the annual mean deformation velocity in the LOS direction which is obtained from Sentinel-1 ascending and descending imagery for the CYWDP. The area covered is approximately 10,476 km2. Positive deformation values, indicated by blue, signify that the ground surface is moving closer to the satellite. Conversely, negative deformation values, denoted by red, represent movement of the ground surface away from the satellite. Figure 5a illustrates the LOS deformation velocity derived from ascending data, with values ranging from −160~160 mm/yr. Figure 5b displays the deformation velocity based on descending data, spanning a range of −154~166 mm/yr. Regardless of whether ascending or descending data are considered, the deformation distribution along the CYWDP area is generally uneven. The surface in the section from Wanjia to Luoci remains relatively stable. A total of 10 distinct deformation areas have been monitored along the route, exhibiting roughly similar spatial distribution patterns. These areas are concentrated in four zones along the section from Shigu to Wanjia and from Luoci to Qujiang (as indicated by the red boxes in Figure 5): the junction of Heqing County and Eryuan County (Zone 1); Xiangyun County (Zone 2); Jinning District, Kunming (Zone 3) and Tonghai County, Yuxi (Zone 4).
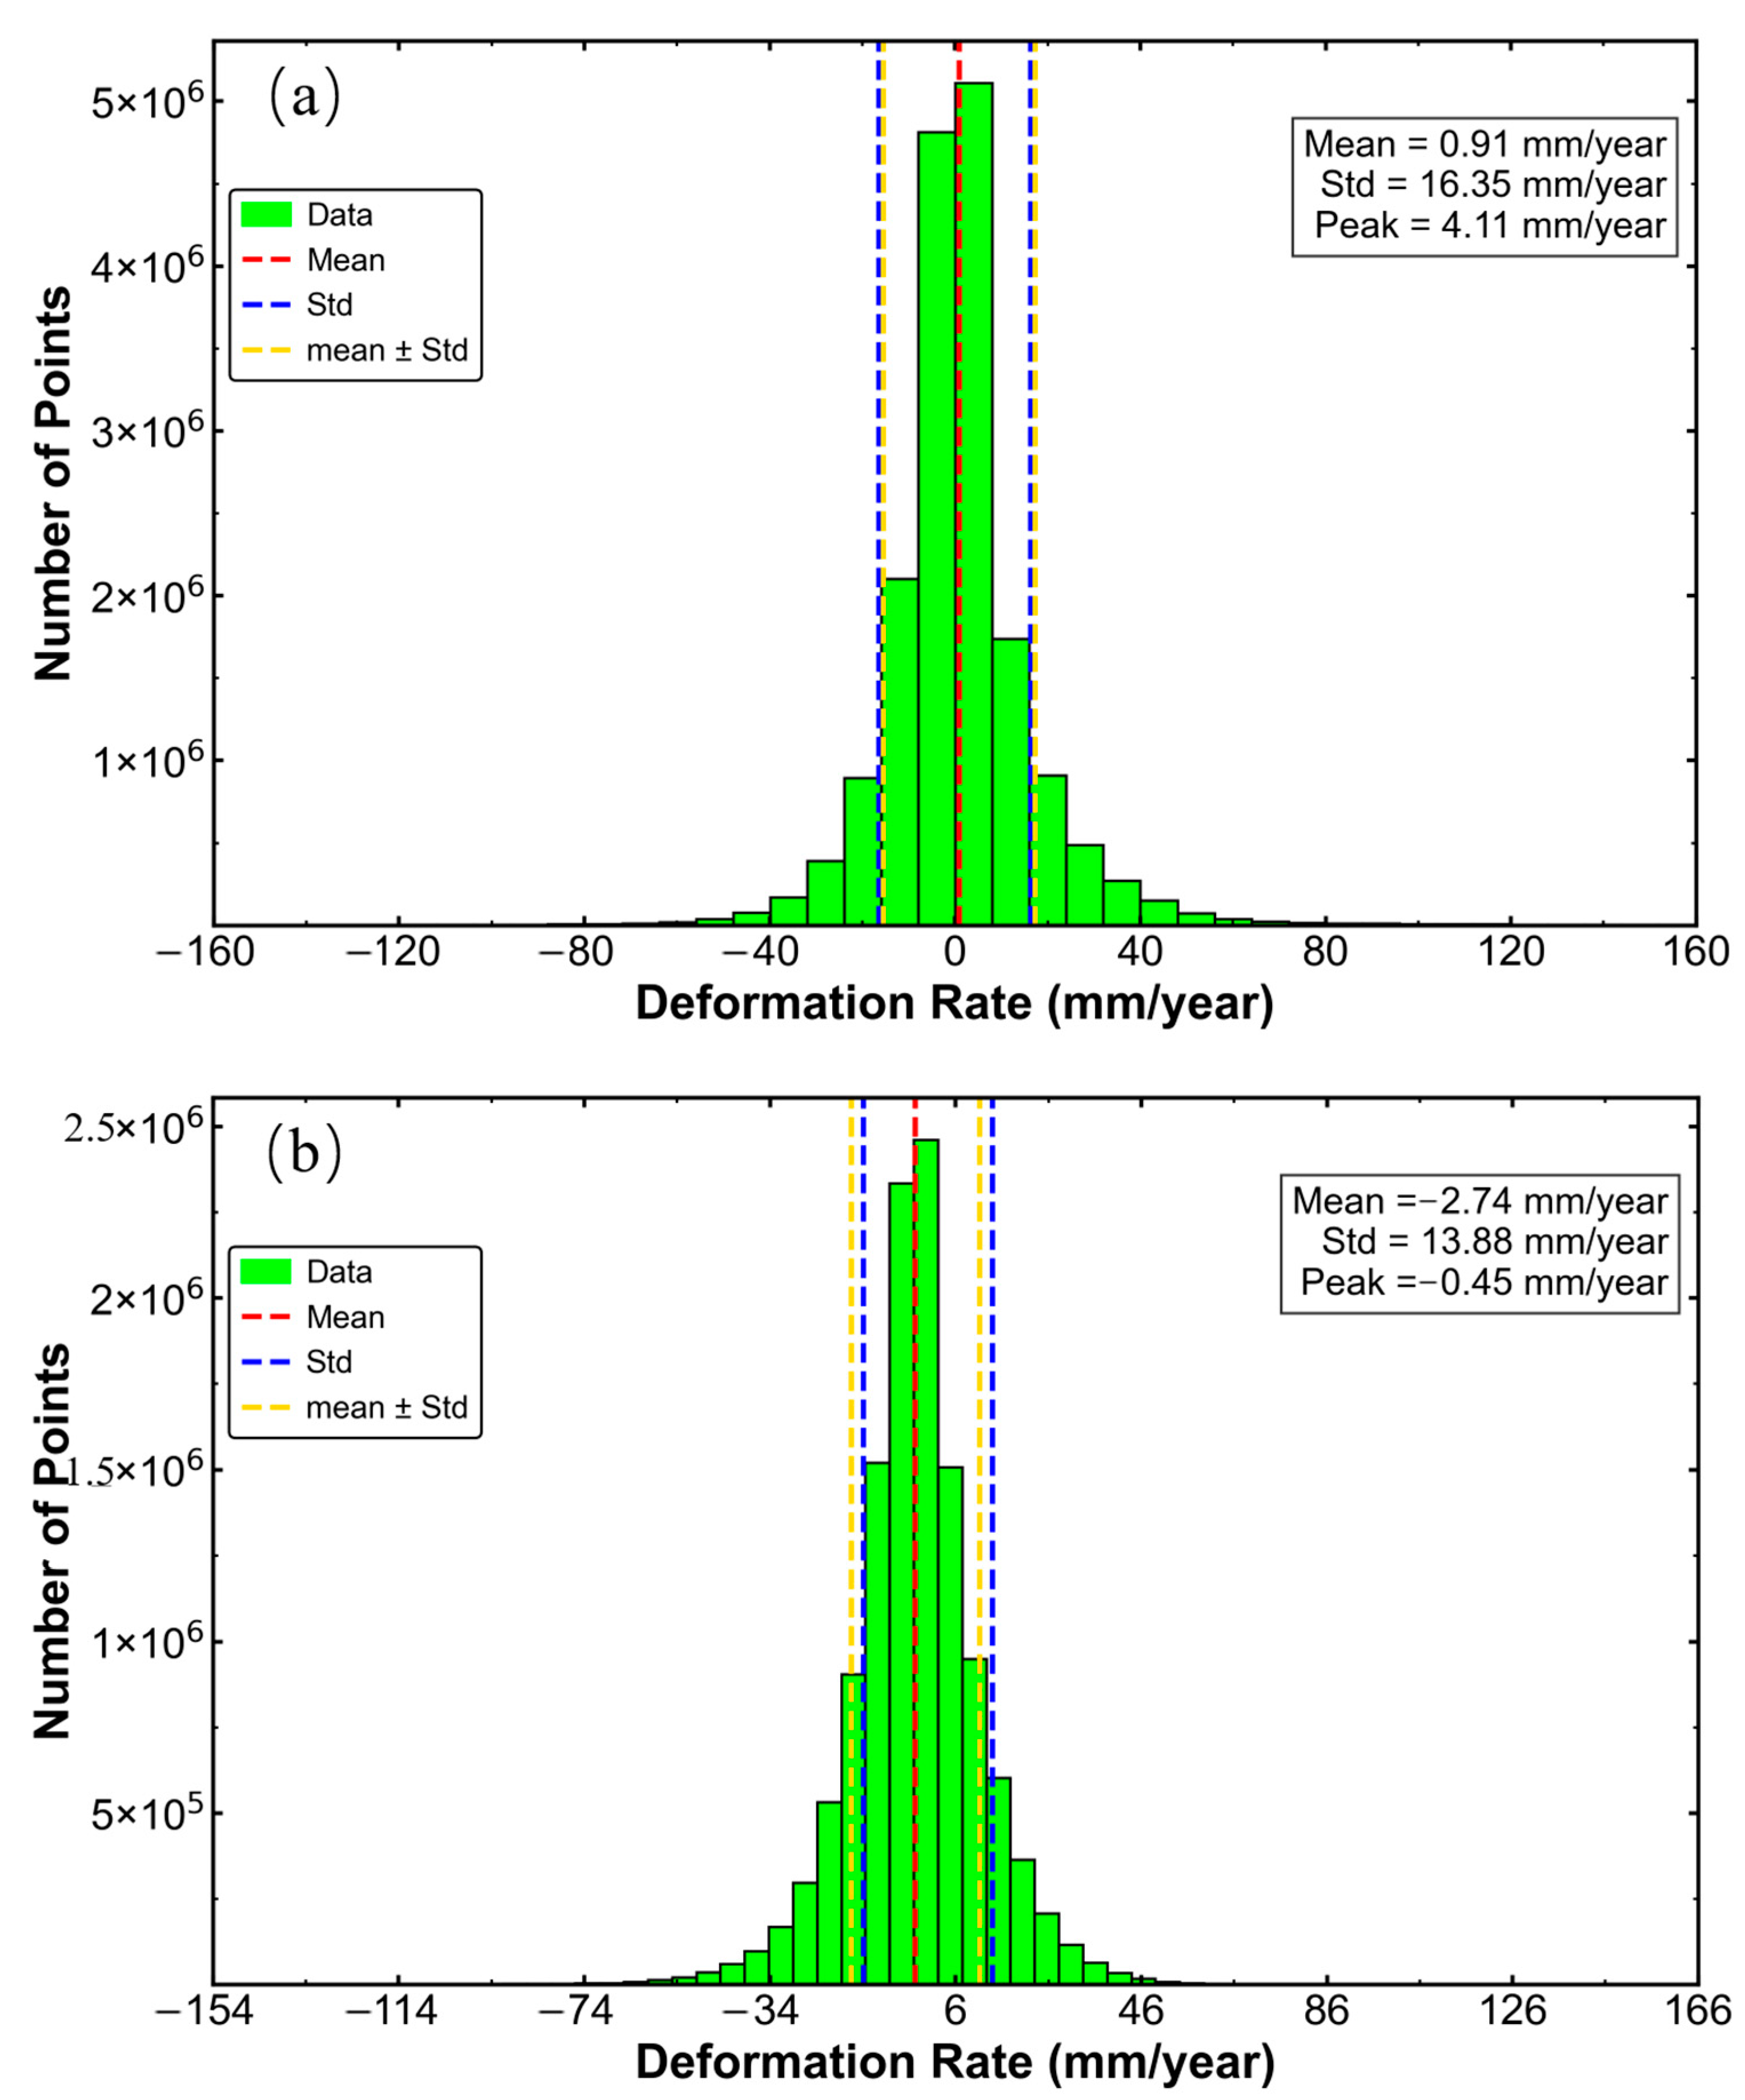
By processing the ascending and descending orbit data, we extracted deformation velocity points across the study area and generated corresponding statistical histograms (Figure 6). The mean values and standard deviations were calculated to quantify the central tendency, dispersion degree, and primary distribution ranges of the deformation velocities. To assess regional stability, we statistically defined the stability range using (mean − standard deviation, mean + standard deviation) as the reliable monitoring threshold for InSAR measurements (demarcated by yellow dashed lines in Figure 6). The analysis reveals: (1) ascending orbit data show a stability range of −15 to 17 mm/y (mean: 0.91 mm/y, SD: 16.35 mm/y, with 80.3% of measurement points falling within this range; (2) descending orbit data exhibit a stability range of −17 to 11 mm/y (mean: −2.74 mm/y, SD: 13.88 mm/y), containing 74.3% of valid measurement points. As illustrated in Figure 6a, the histogram of deformation velocity derived from ascending orbit data exhibits a unimodal distribution, with the peak located near 4.11 mm/y. The deformation velocity shows a wide distribution range with standard deviations substantially exceeding the mean values, indicating pronounced spatial variability in deformation patterns and suggesting the potential presence of significant uplift or subsidence in localized areas. The deformation velocity histogram of descending orbit data similarly exhibits a unimodal distribution. The majority of the study area shows deformation rates concentrated around −0.45 mm/y. Notably, the descending data demonstrate a narrower deformation velocity range compared to the ascending orbit results. The statistical findings show that there is a bit of a difference in the mean values of deformation velocities obtained from ascending and descending orbit data (ascending: 0.91 mm/y; descending: −2.74 mm/y). This difference may stem from variations in the observation geometries of the ascending and descending orbits, which lead to differences in the radar’s sensitivity to surface deformation and its spatial coverage [35]. Nevertheless, the average values of both datasets are in close proximity to zero (with absolute values < 3 mm/y), suggesting that the deformation velocities in most parts of the study area are relatively low, and the overall region is in a relatively stable state. Although the standard deviation of descending orbit data (13.88 mm/y) is lower than that of ascending data (16.35 mm/y), it remains substantially higher than the corresponding mean value, reflecting significant spatial heterogeneity in surface deformation across the study area. The greater standard deviation exhibited by the ascending orbit data further highlights its augmented capacity for detecting localized deformations. These results demonstrate that SBAS-InSAR can effectively monitor deformation in topographically complex plateau-mountain regions while successfully identifying local instability zones. This outcome validates the applicability of this method in complex terrain areas and simultaneously highlights the importance of combined analysis of multi-orbit data in reducing observational uncertainties and enhancing the spatial resolution of deformation fields.

4.3. Analysis of Spatiotemporal Evolution Characteristics of Multi-Dimensional Deformation in Typical Regions

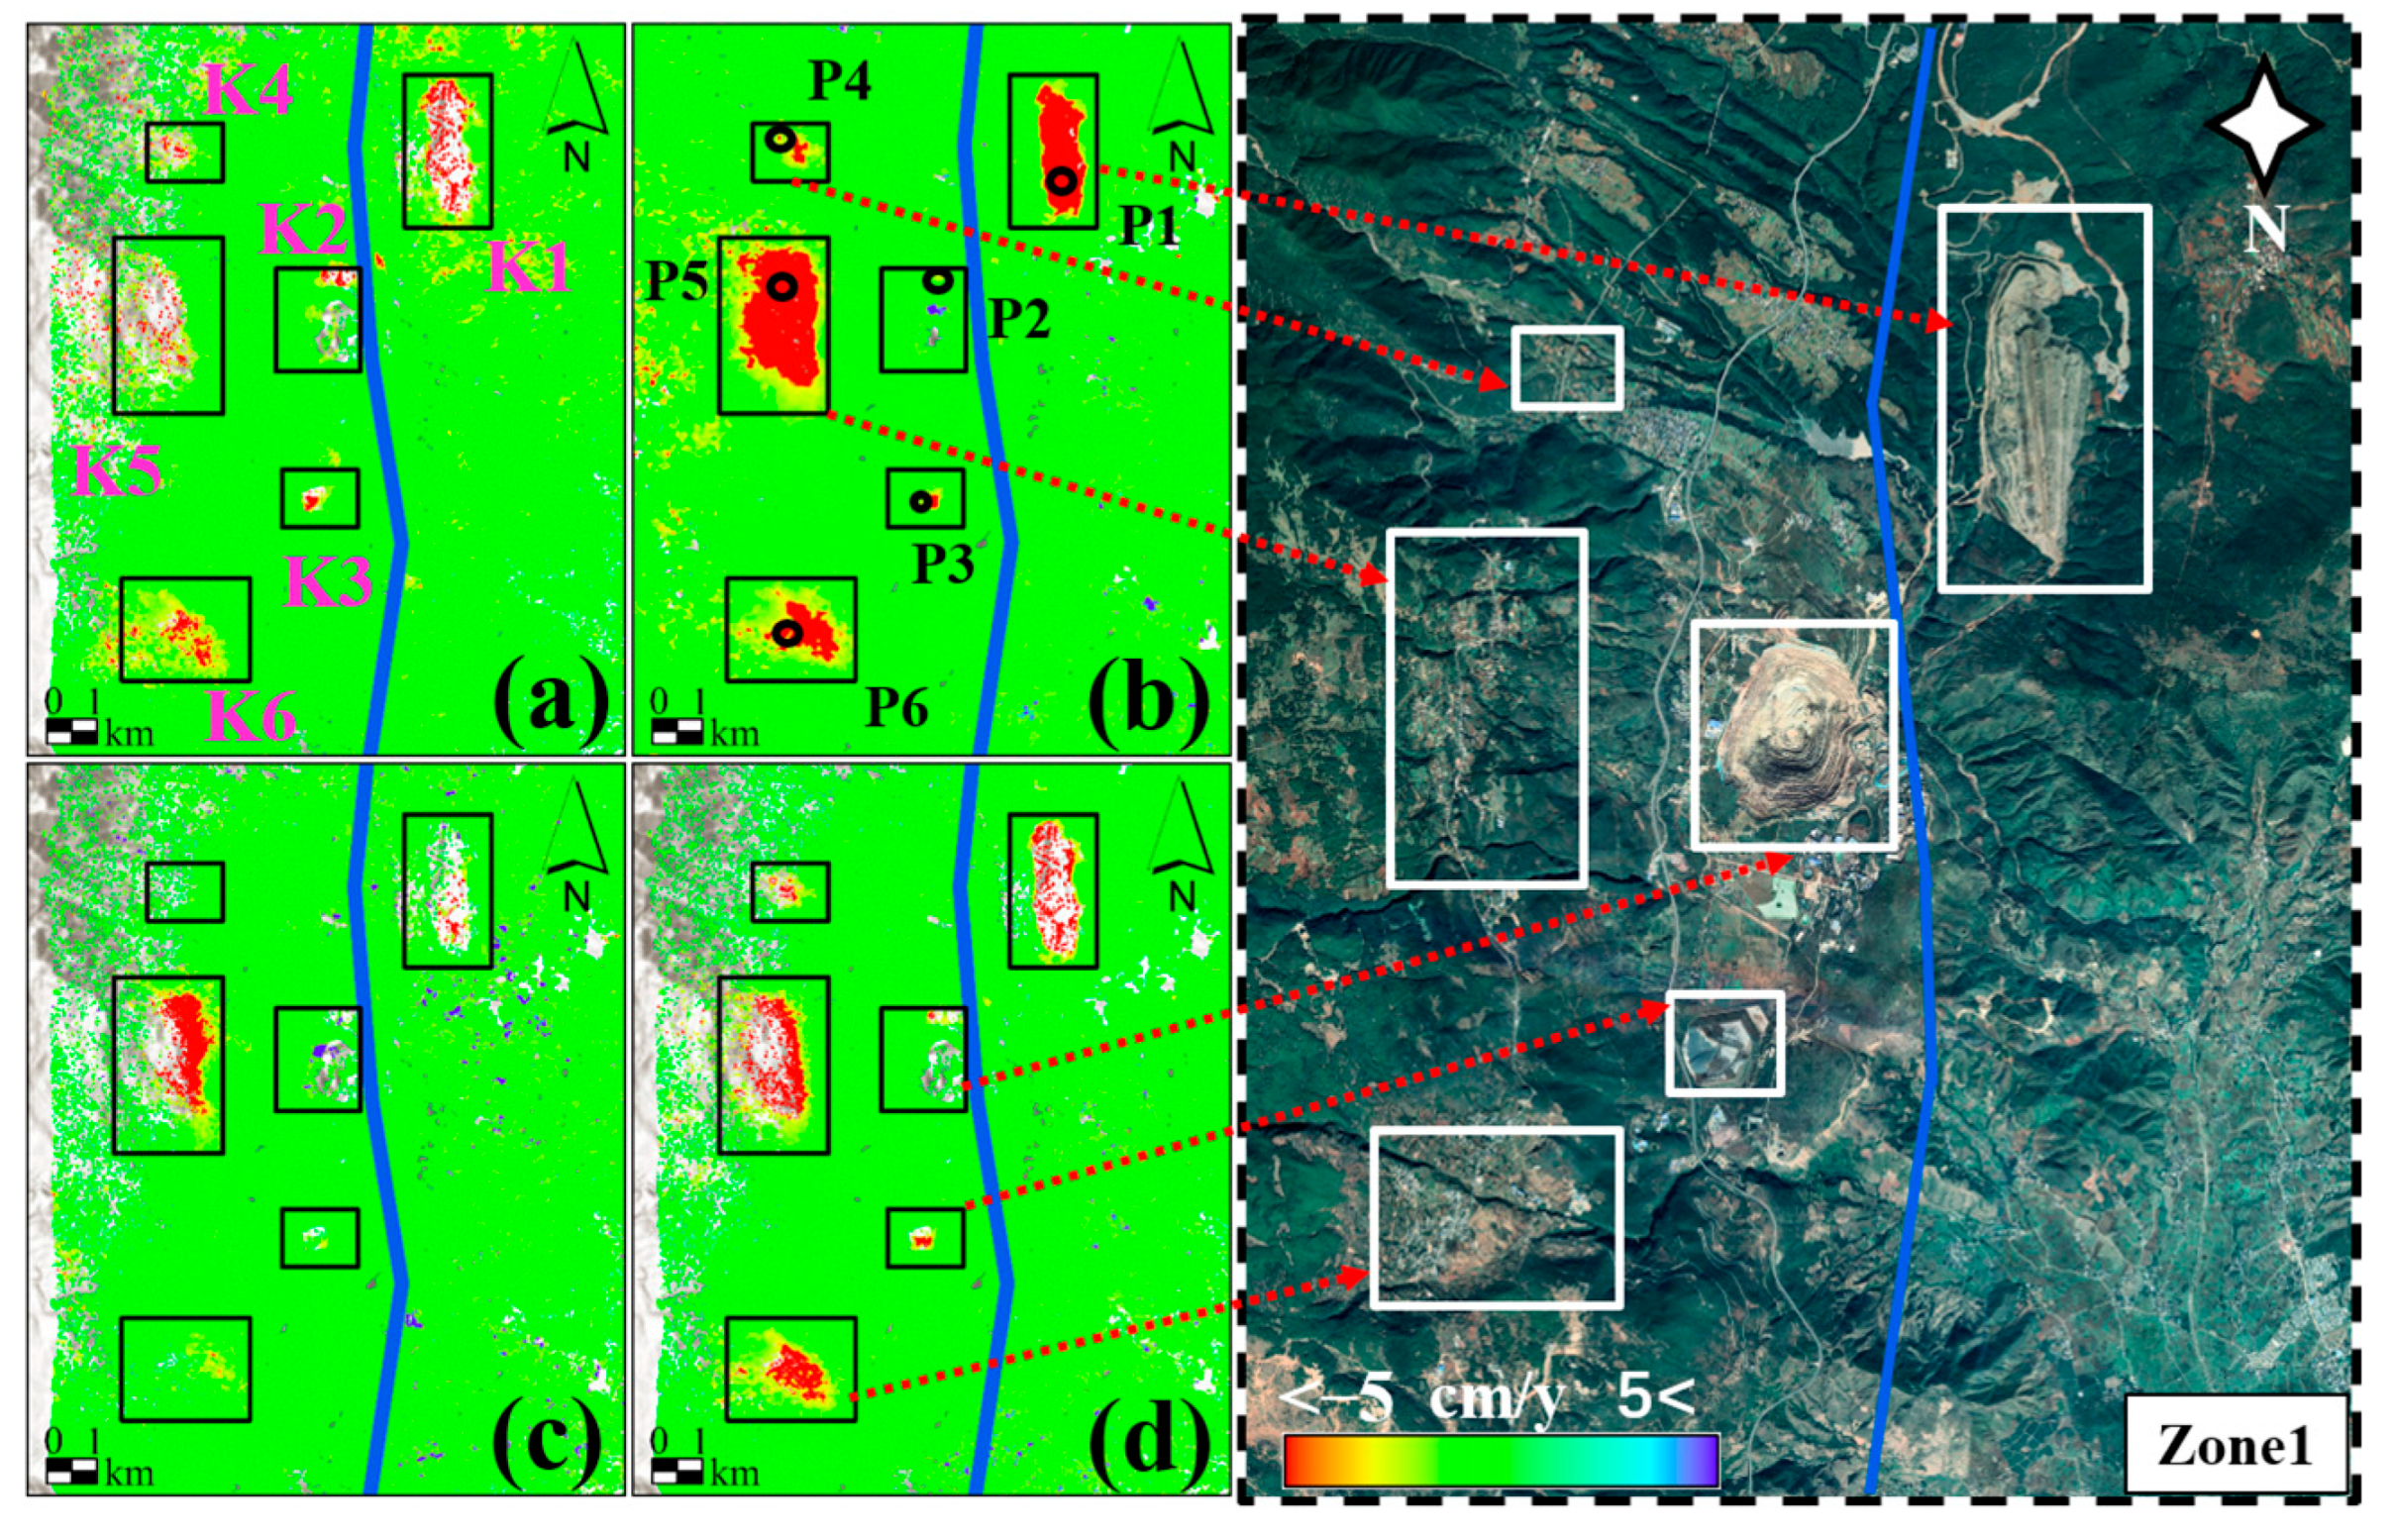
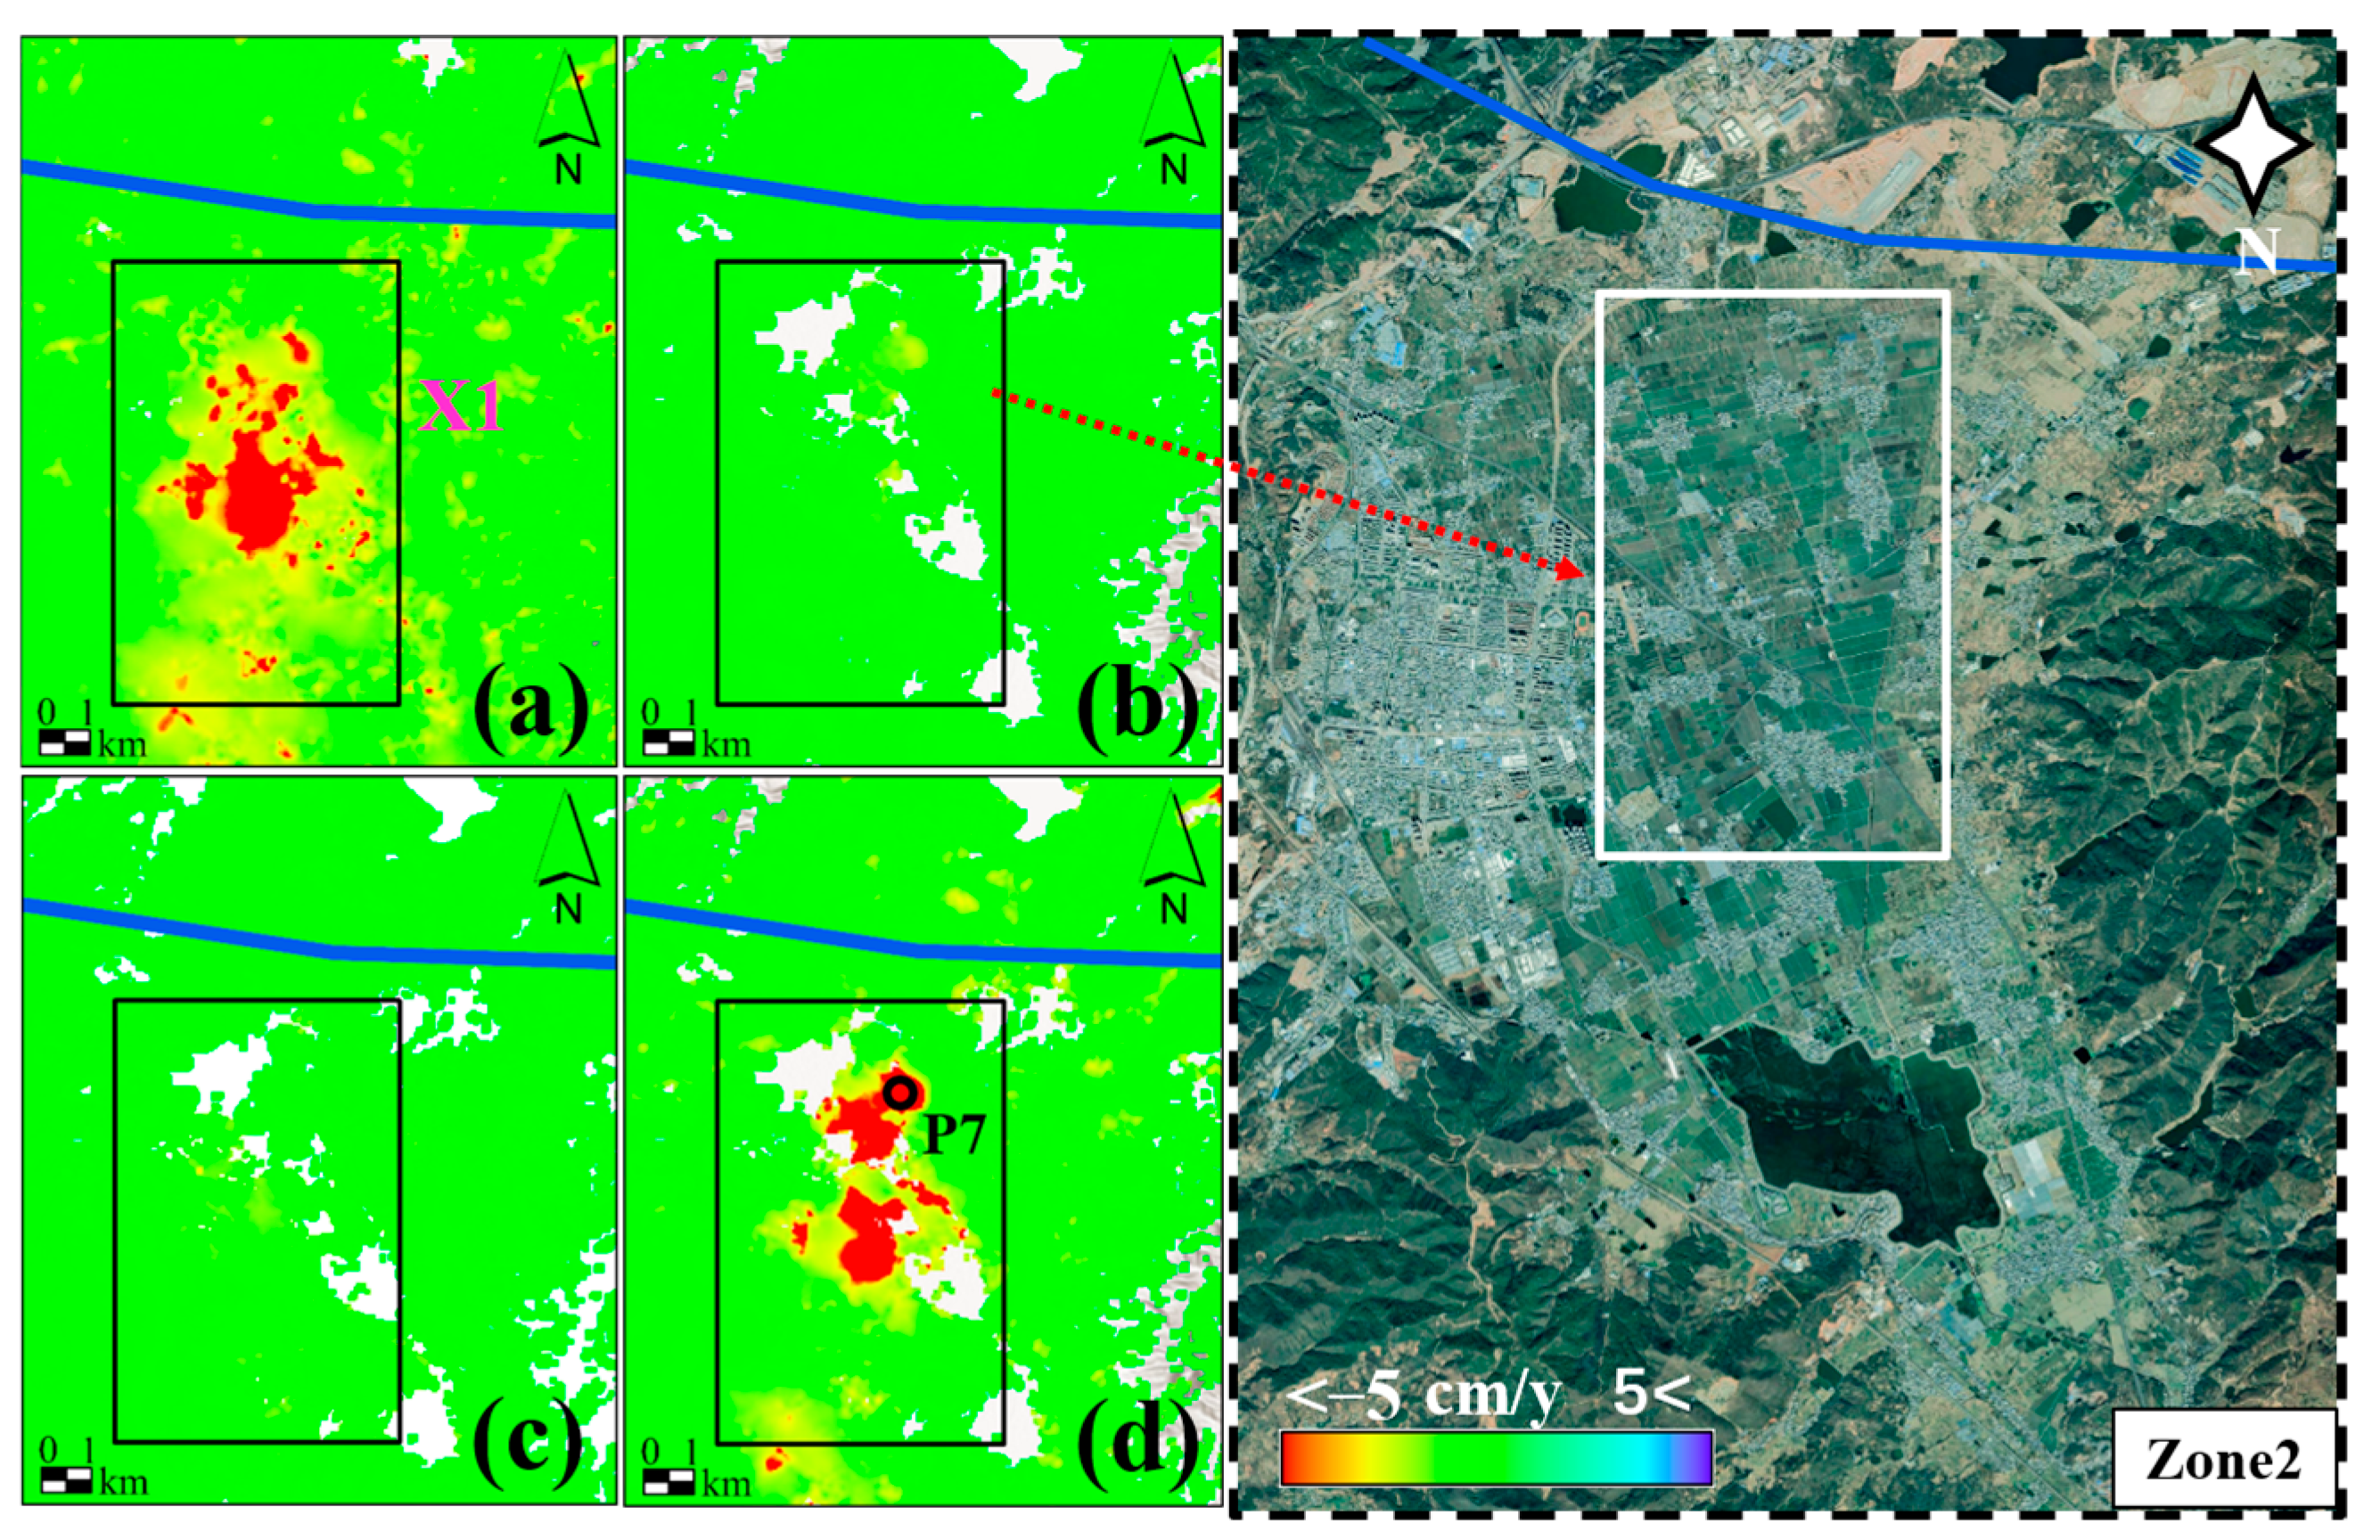
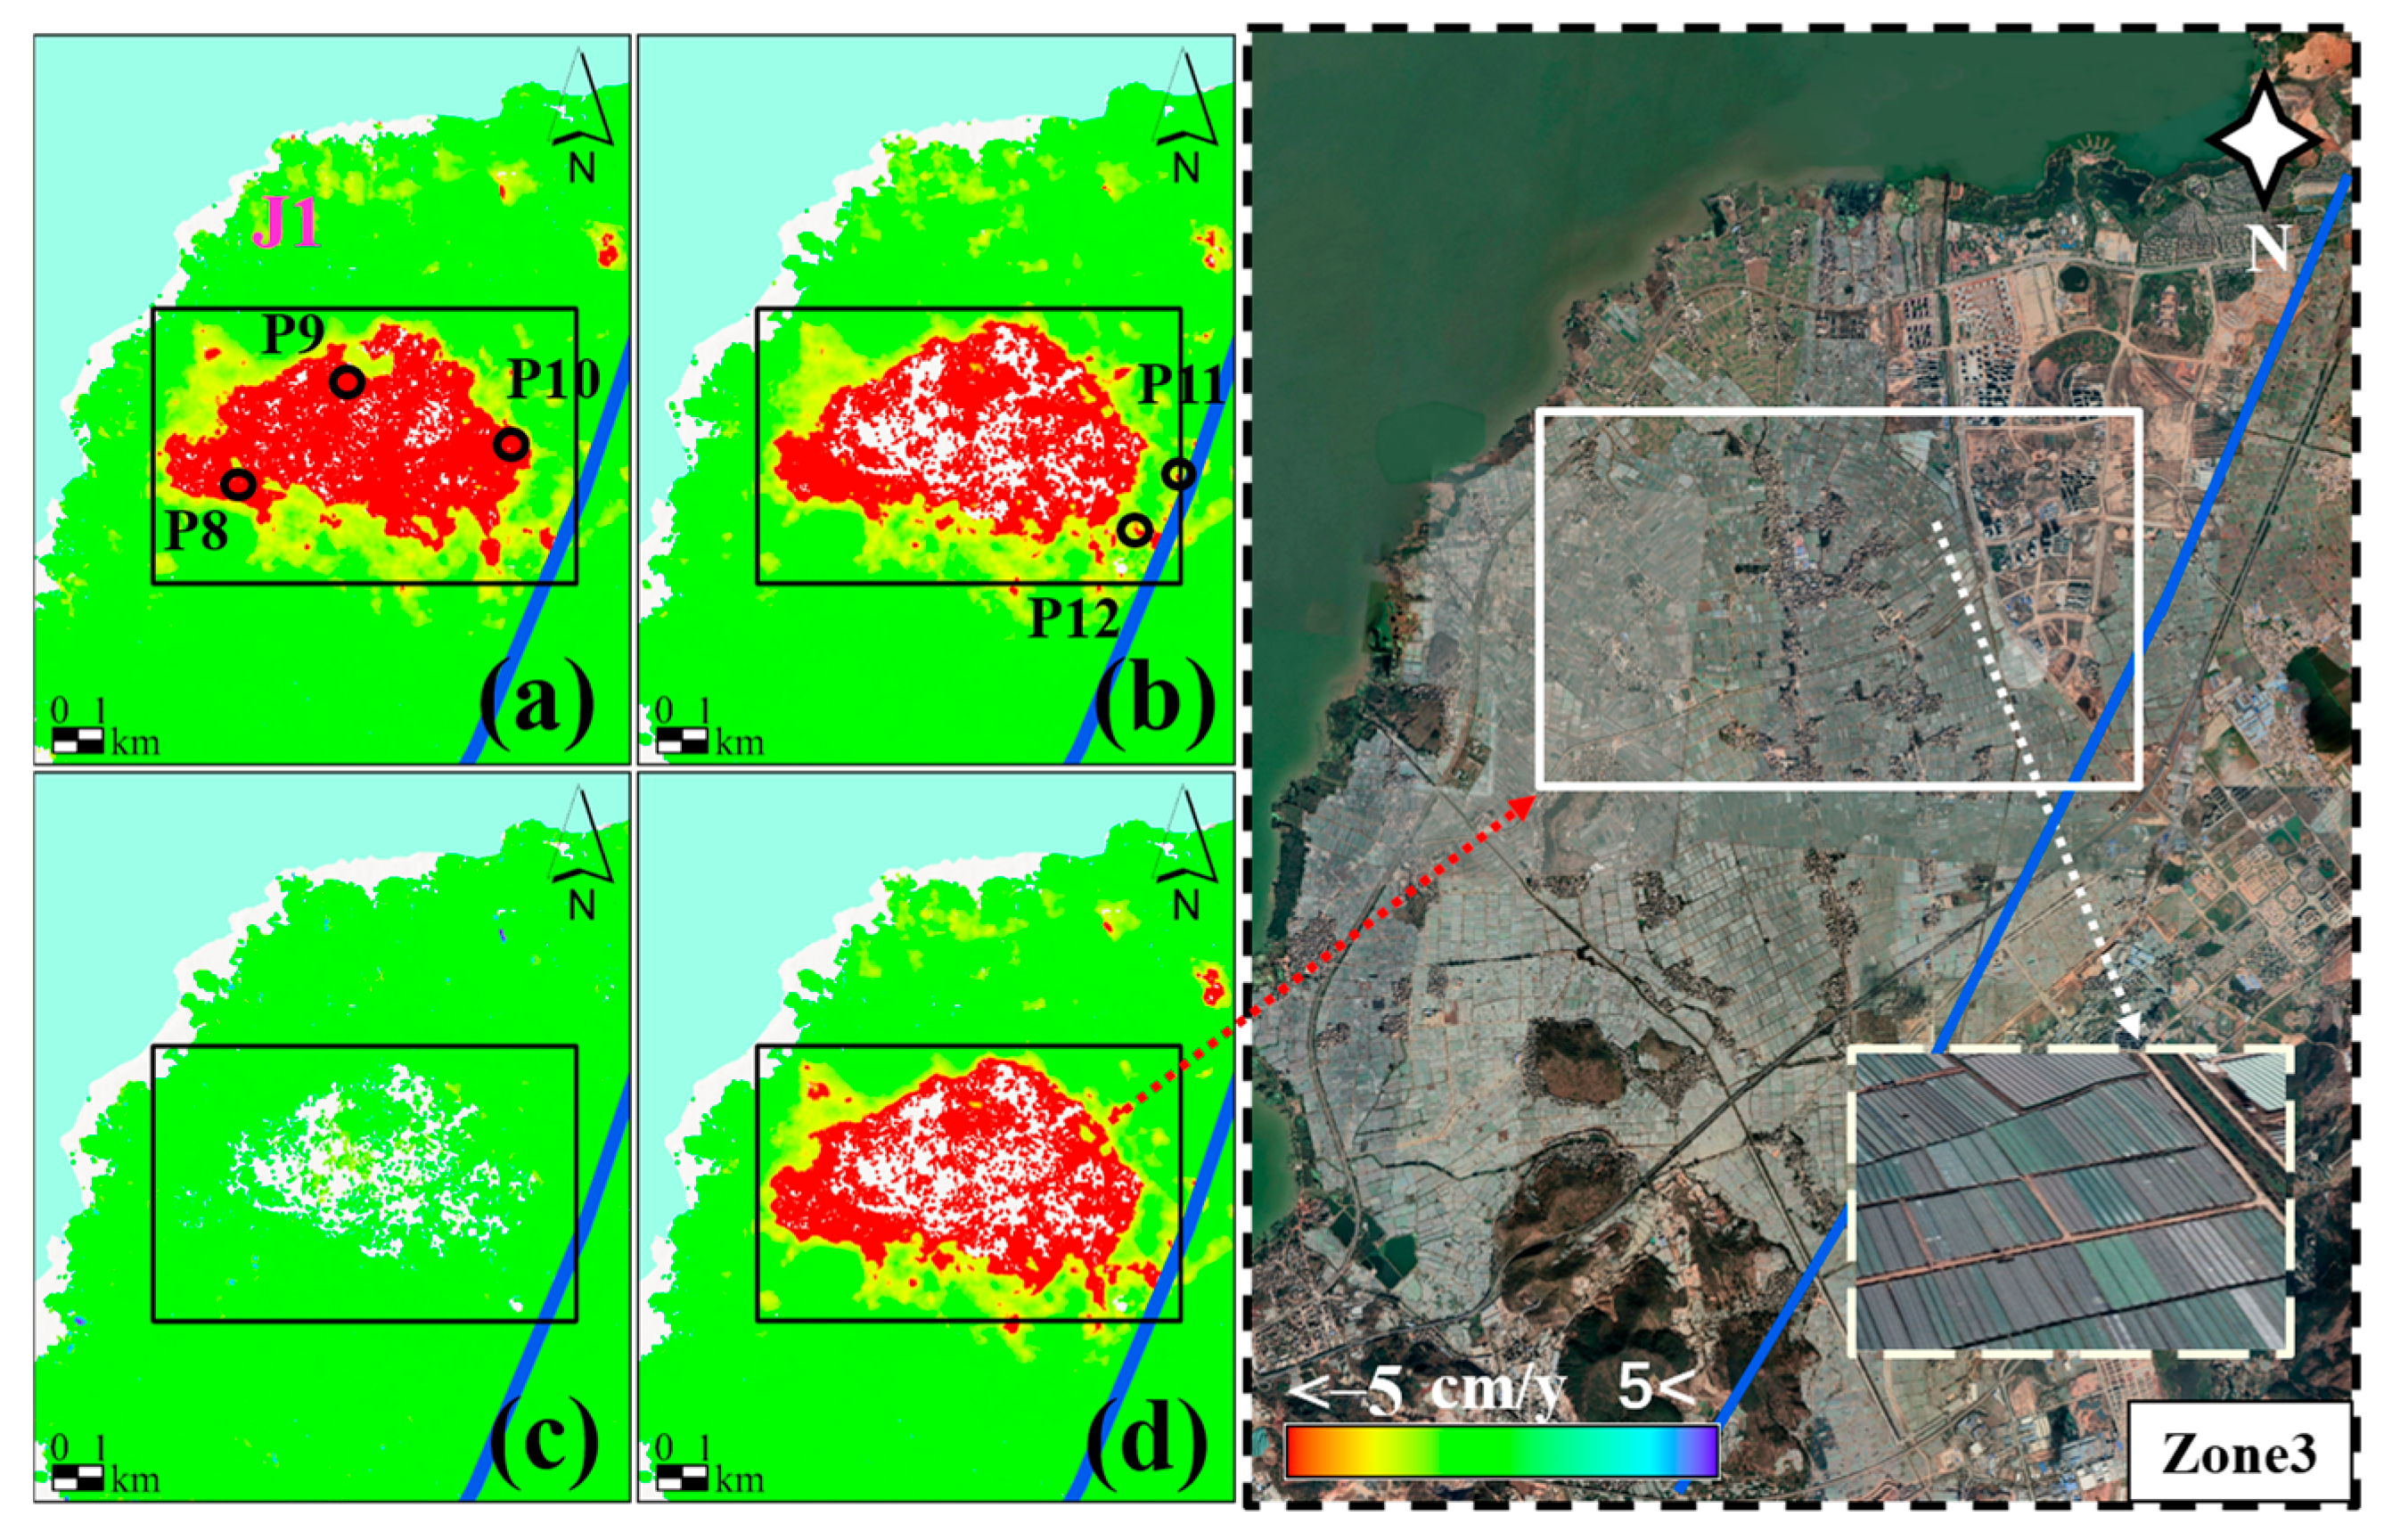
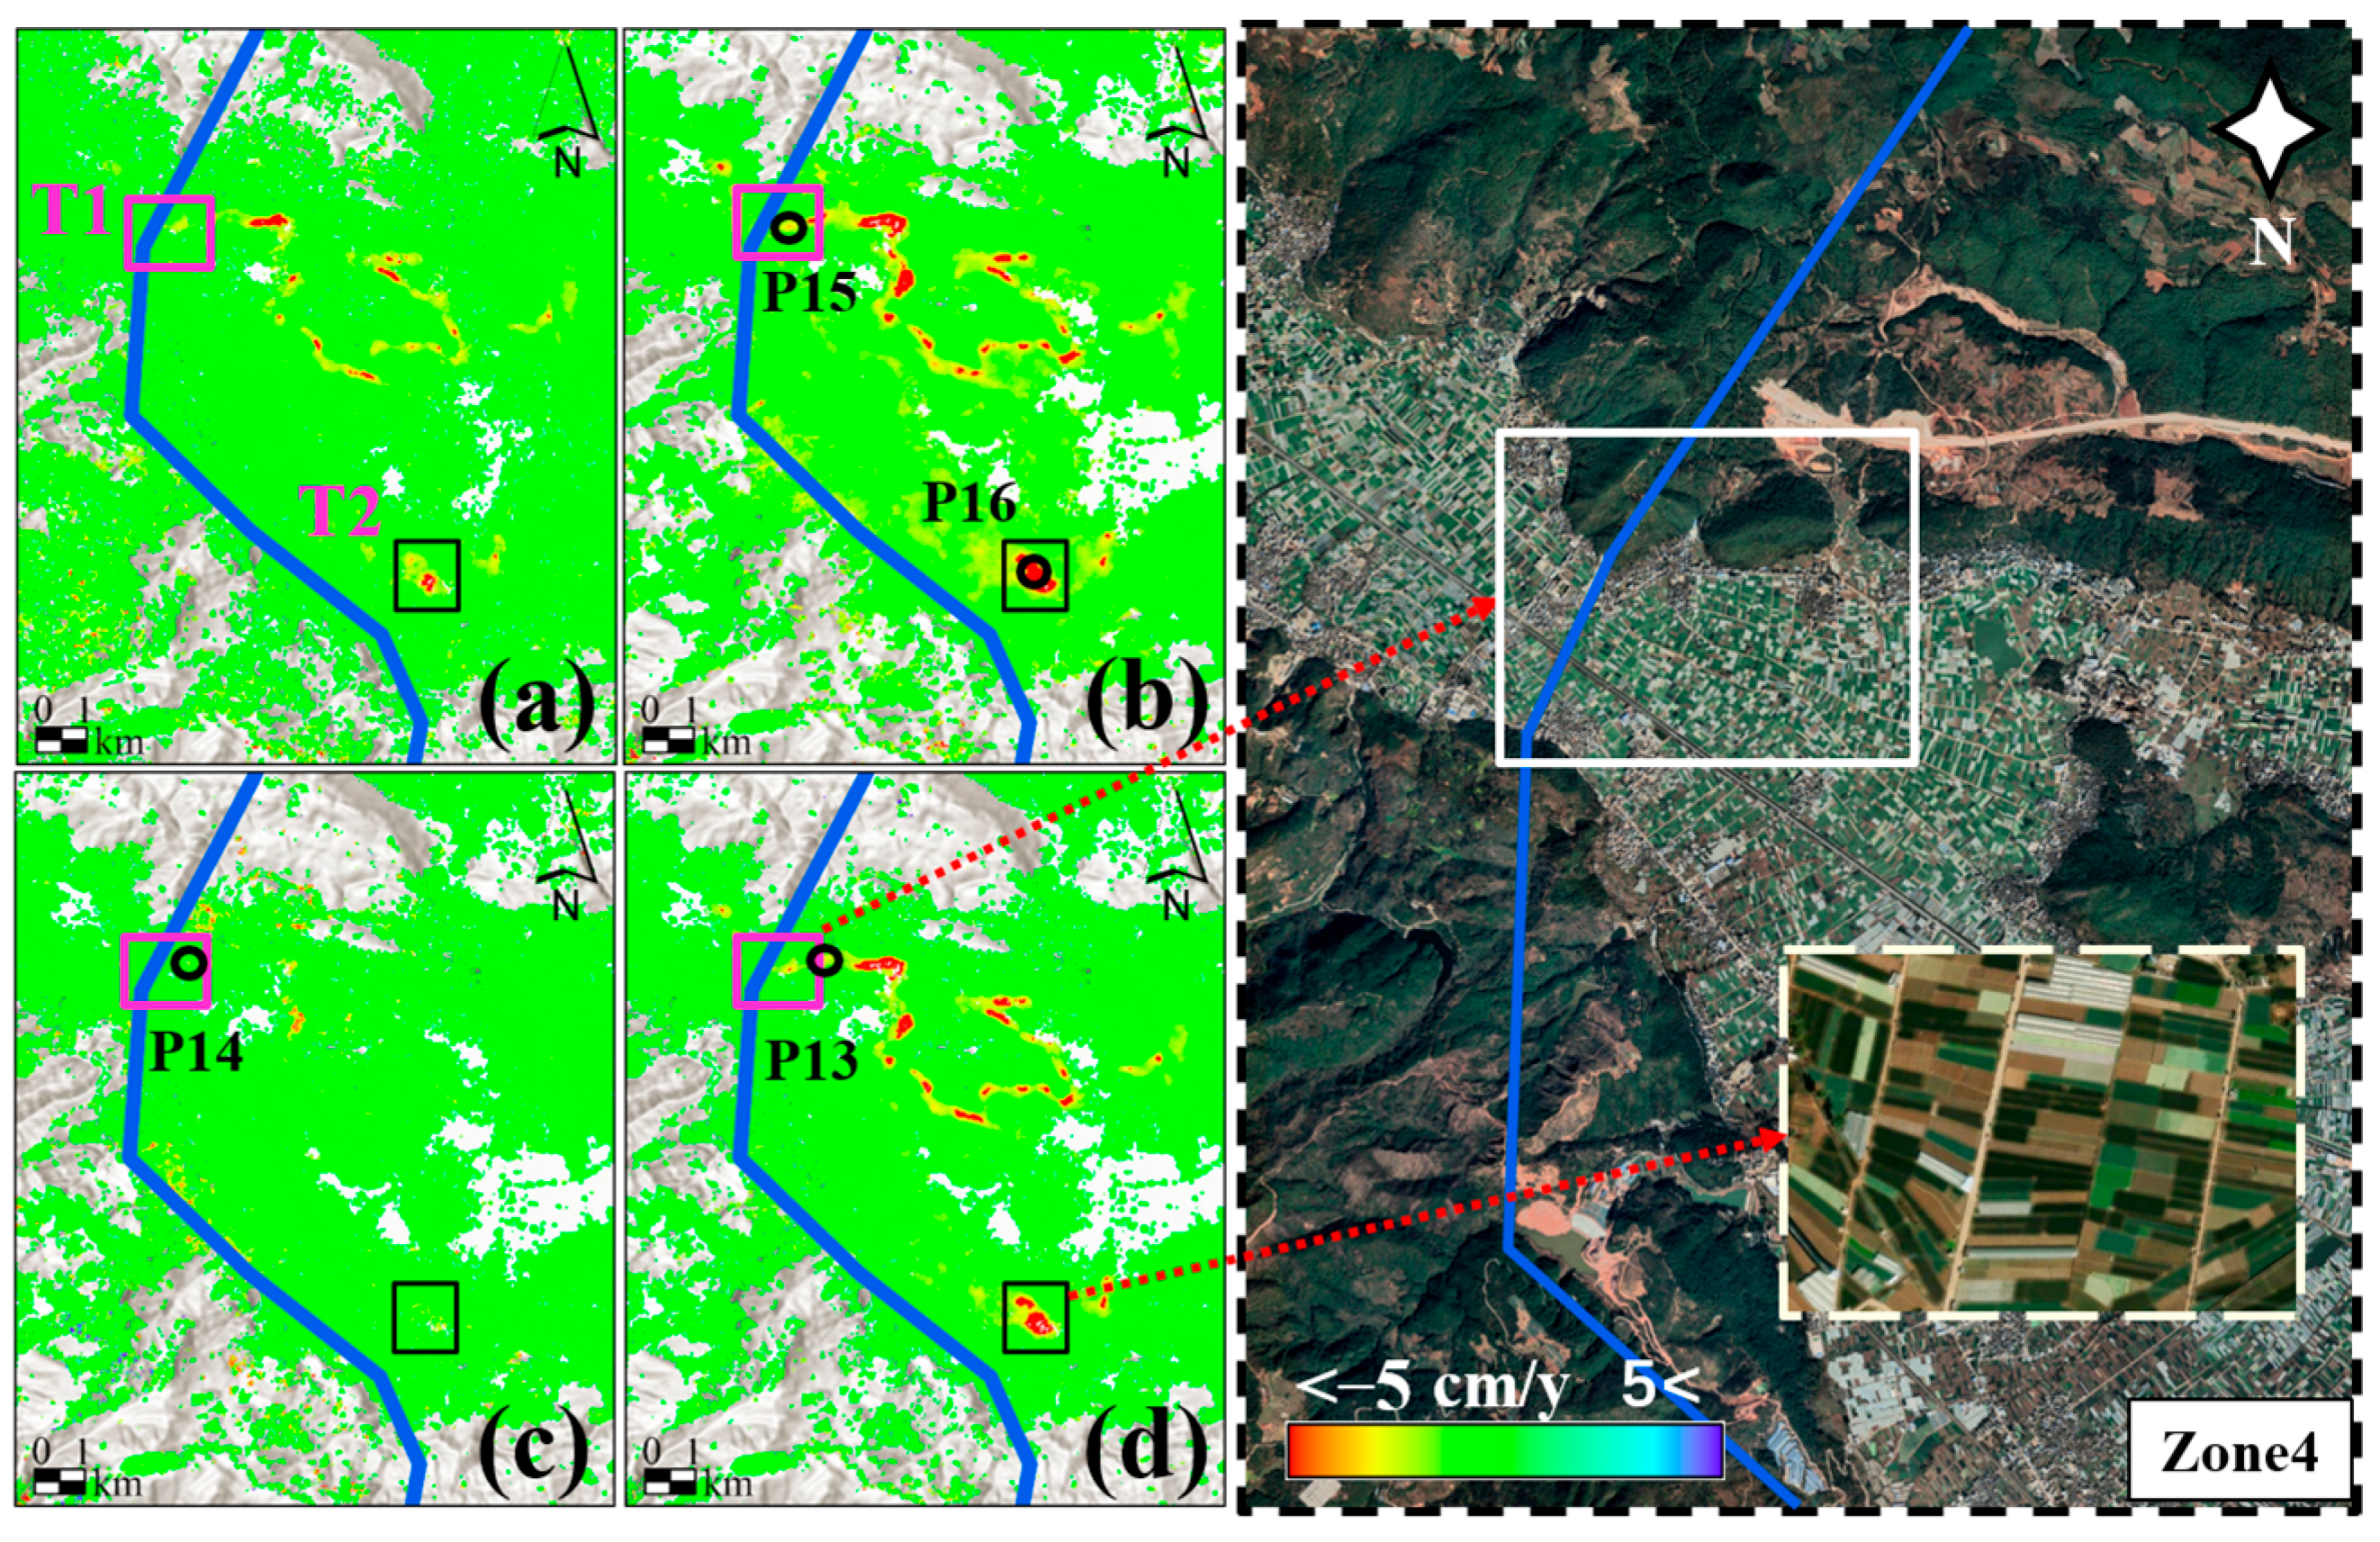
Figure 7, Figure 8, Figure 9 and Figure 10 present magnified views of the annual mean deformation rates and corresponding optical images for the Zone 1 to 4. The panel layout is consistently organized as follows: (a) the top-left shows LOS deformation from ascending data, (b) the top-right displays LOS deformation from descending data, (c) the bottom-left illustrates horizontal displacement, and (d) the bottom-right presents the vertical displacement. The CYWDP route is indicated by solid blue lines in all subfigures. Numerous deformation-prone areas exhibit LOS deformation rates exceeding 5 cm/y. To further analyze the potential impacts of these deformation regions on the CYWDP, we compiled statistics on the geometric and deformation characteristics of 10 deformation-prone areas (as shown in Table 3), as well as the distances from the deformation centers to the water diversion project. Subsequently, we combined remote-sensing images to explore the possible causes of deformation.
Figure 7 presents the deformation velocity results for Zone 1, located at the border between Heqing and Eryuan counties. By integrating ascending and descending orbit deformation results with optical imagery, we successfully identified six potential hazard areas (K1–K6) exhibiting significant deformation characteristics. The analysis reveals that the deformation signals estimated from the descending data are more pronounced (Figure 7b), while in some areas of the ascending data, due to the influence of geometric distortions, continuous null-value regions appear at K1 and K5 (Figure 7a). Notably, both horizontal and vertical displacement components derived from inversion also show synchronized null values in these affected regions, which aligns with the theoretical expectations of our 2D inversion methodology. Therefore, when conducting InSAR deformation monitoring in regions with complex topography and geomorphology, single-orbit data often have limitations. It is necessary to rely on the complementarity of multi-orbit data. By comprehensively analyzing the information provided by different orbital data, the accuracy of identifying deformation-prone areas can be improved. Areas K1-K3 demonstrate predominant vertical deformation, exhibiting particularly severe ground displacement with maximum rates reaching −154 mm/y, −85 mm/y, and −71 mm/y, respectively. Concurrently, these areas demonstrate considerable horizontal displacement, with rates of −127 mm/y, 65 mm/y, and −42 mm/y (Table 3). More critically, three of the deformation-prone areas are located near the water conveyance route. In particular, the distance from the K2 deformation center to the route is even less than 1 km, posing a potential threat to the safety of the CYWDP. Once the deformation progresses further, it may ultimately jeopardize the structural integrity and normal functioning of the water delivery system. The K4-K6 area is predominantly a human-activity zone, with a large number of rural houses and basic road infrastructure distributed within it. Both the foundation construction of houses and the construction and renovation of roads can disturb the underground rock and soil masses, disrupting their original equilibrium state. This disruption triggers a redistribution of stress in the surrounding strata, potentially leading to various degrees of surface deformation such as subsidence, uplift, or tilting. According to Table 3, these areas exhibit distinct deformation signals in both the horizontal and vertical directions. Taking into account the actual conditions of this area, under the influence of natural factors such as heavy rainfall and earthquakes, these deformation-prone zones may be prone to geological disasters like landslides, thereby exerting adverse impacts on the CYWDP.
Figure 8 shows the deformation rate results of Zone 2. X1 is located in the urban area of Xiangyun County in the southern part of the CYWDP, with flat terrain (slope < 5°), a relatively large area, length exceeding 5 km, and width exceeding 3 km (see Table 3). The ascending orbit data manifest distinct deformation features, with a maximum deformation velocity reaching −68 mm/y. However, null value areas appear locally in the descending orbit data. By combining with optical images, it is found that these null value areas are distributed in flat agricultural regions. It is inferred that the primary reason for the null values is that seasonal crop rotation, farming, and other human activities result in high-frequency changes in surface scattering characteristics, leading to severe decorrelation phenomena. Consequently, it becomes impossible to effectively extract deformation information. The deformation core area, predominantly comprising agricultural land and infrastructure construction sites, requires continuous monitoring as cumulative deformation and the expansion of its scope may induce pipeline bending or structural deformation in the CYWDP. Deformation rate analysis reveals distinct vertical displacement characteristics, with maximum subsidence reaching −53 mm/y. In contrast, horizontal deformation remains relatively minor at −41 mm/y.
Integrated analysis of optical imagery and field investigations reveals distinct deformation mechanisms between urban areas (J1, T1, T2) and the X1 region. To meet the demands for domestic and industrial water supply, these areas have been engaged in long-term groundwater extraction. Excessive groundwater extraction leads to a decline in the groundwater level, which in turn increases the effective stress in the soil. As a result, the moisture content between soil particles decreases, the soil becomes more compacted, and ultimately, surface subsidence occurs. With the accelerating process of urbanization, a large number of engineering activities continuously alter the original surface morphology. Especially in areas with dense buildings, the decline in the groundwater level may also cause differential settlement of building foundations, exacerbating the degree of surface deformation. Taking J1 as an example, this area is located in the northern urban sector of Jinning District, situated southeast of Dianchi Lake (see Figure 9). The region has experienced long-term, large-scale greenhouse farming operations, where agricultural production heavily relies on groundwater extraction for irrigation needs, which has induced severe land subsidence, exhibiting both remarkable deformation intensity and extensive spatial impacts. Both the ascending and descending deformation results reveal an extensive deformation phenomenon in this area. The area of the deformation-prone zone is approximately 14 km2, and the distance from the deformation center to the CYWDP is about 2.6 km. As evidenced in Figure 9c,d, vertical deformation dominates in this region, with a maximum annual subsidence rate of −164 mm/y. The subsidence funnel is clearly defined and shows a tendency to expand towards the route of the CYWDP. This dynamic change characteristic not only exacerbates the instability of the regional geological environment but also poses a significant threat to the safe operation of the CYWDP. Based on the aforementioned circumstances, further monitoring and analysis of the land subsidence issue in this area are required in the follow-up to ensure the safety and stability of the CYWDP as well as the regional geological environment.
Figure 10 demonstrates the deformation velocity results for Zone 4, located in the urban area west of Qilu Lake in Tonghai County, Yuxi City. The CYWDP pipeline traverses this deformation area, hereafter labeled T1 for subsequent discussion and analysis. There exists another area on the eastern side of the CYWDP that exhibits distinct deformation characteristics under both ascending and descending data conditions. The deformation center of this area is approximately 1.46 km away from the water conveyance route, with an area of about 0.87 km2. We have labeled it as T2 (see Table 3 for specific information). During the monitoring period, T1 exhibited pronounced vertical deformation with a maximum subsidence rate of −64 mm/y, while the east–west deformation rates reached −42 mm/y. Considering the combined results of vertical and horizontal deformations (as shown in Figure 10c,d), it can be observed that T1 experienced varying degrees of deformation in 2D, and there remained a potential trend of surface subsidence as well as a certain extent of east–west expansion. Notably, the distance between this deformation-prone area and the water conveyance pipeline is less than 1 km, posing a serious safety concern for the CYWDP. Area T2, similarly dominated by greenhouse cultivation, exhibits primarily vertical deformation with a maximum subsidence rate of −84 mm/y. Given the deformation conditions observed in T1 and T2, as well as the potential threats they may pose to the CYWDP, continuous monitoring and the implementation of preventive measures are essential for this section.

4.4. Analysis of Temporal Variation Characteristics

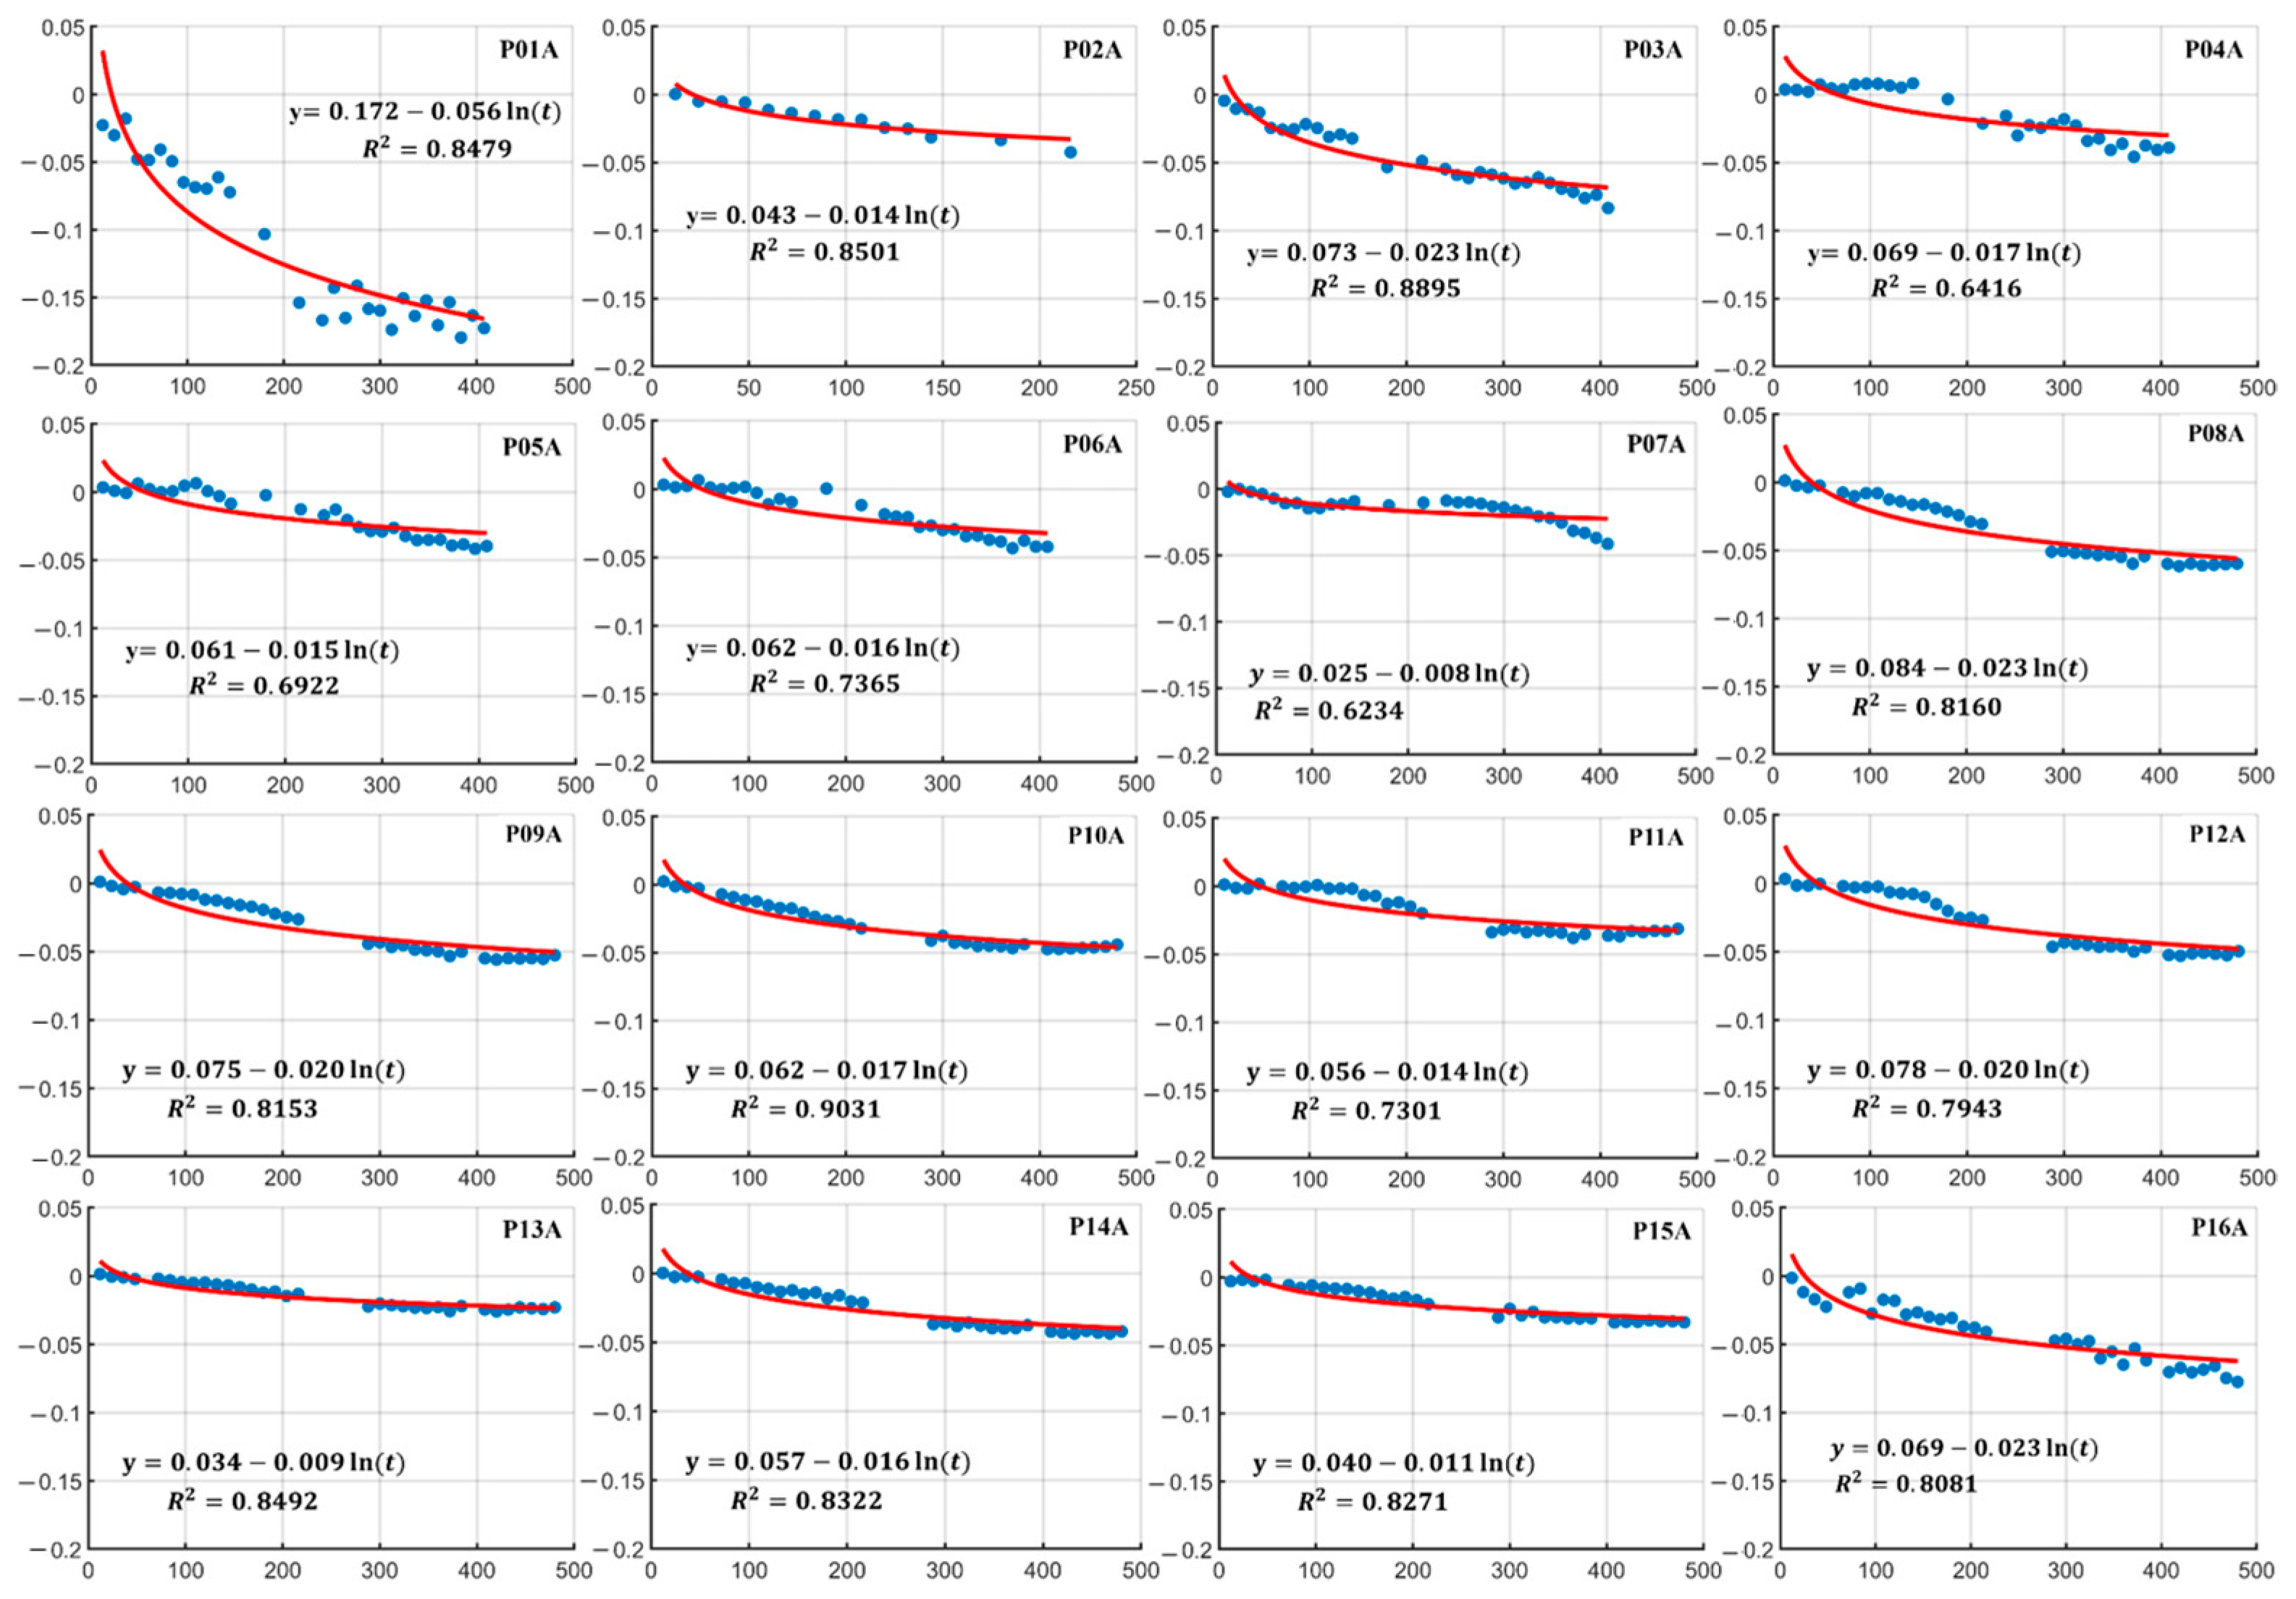
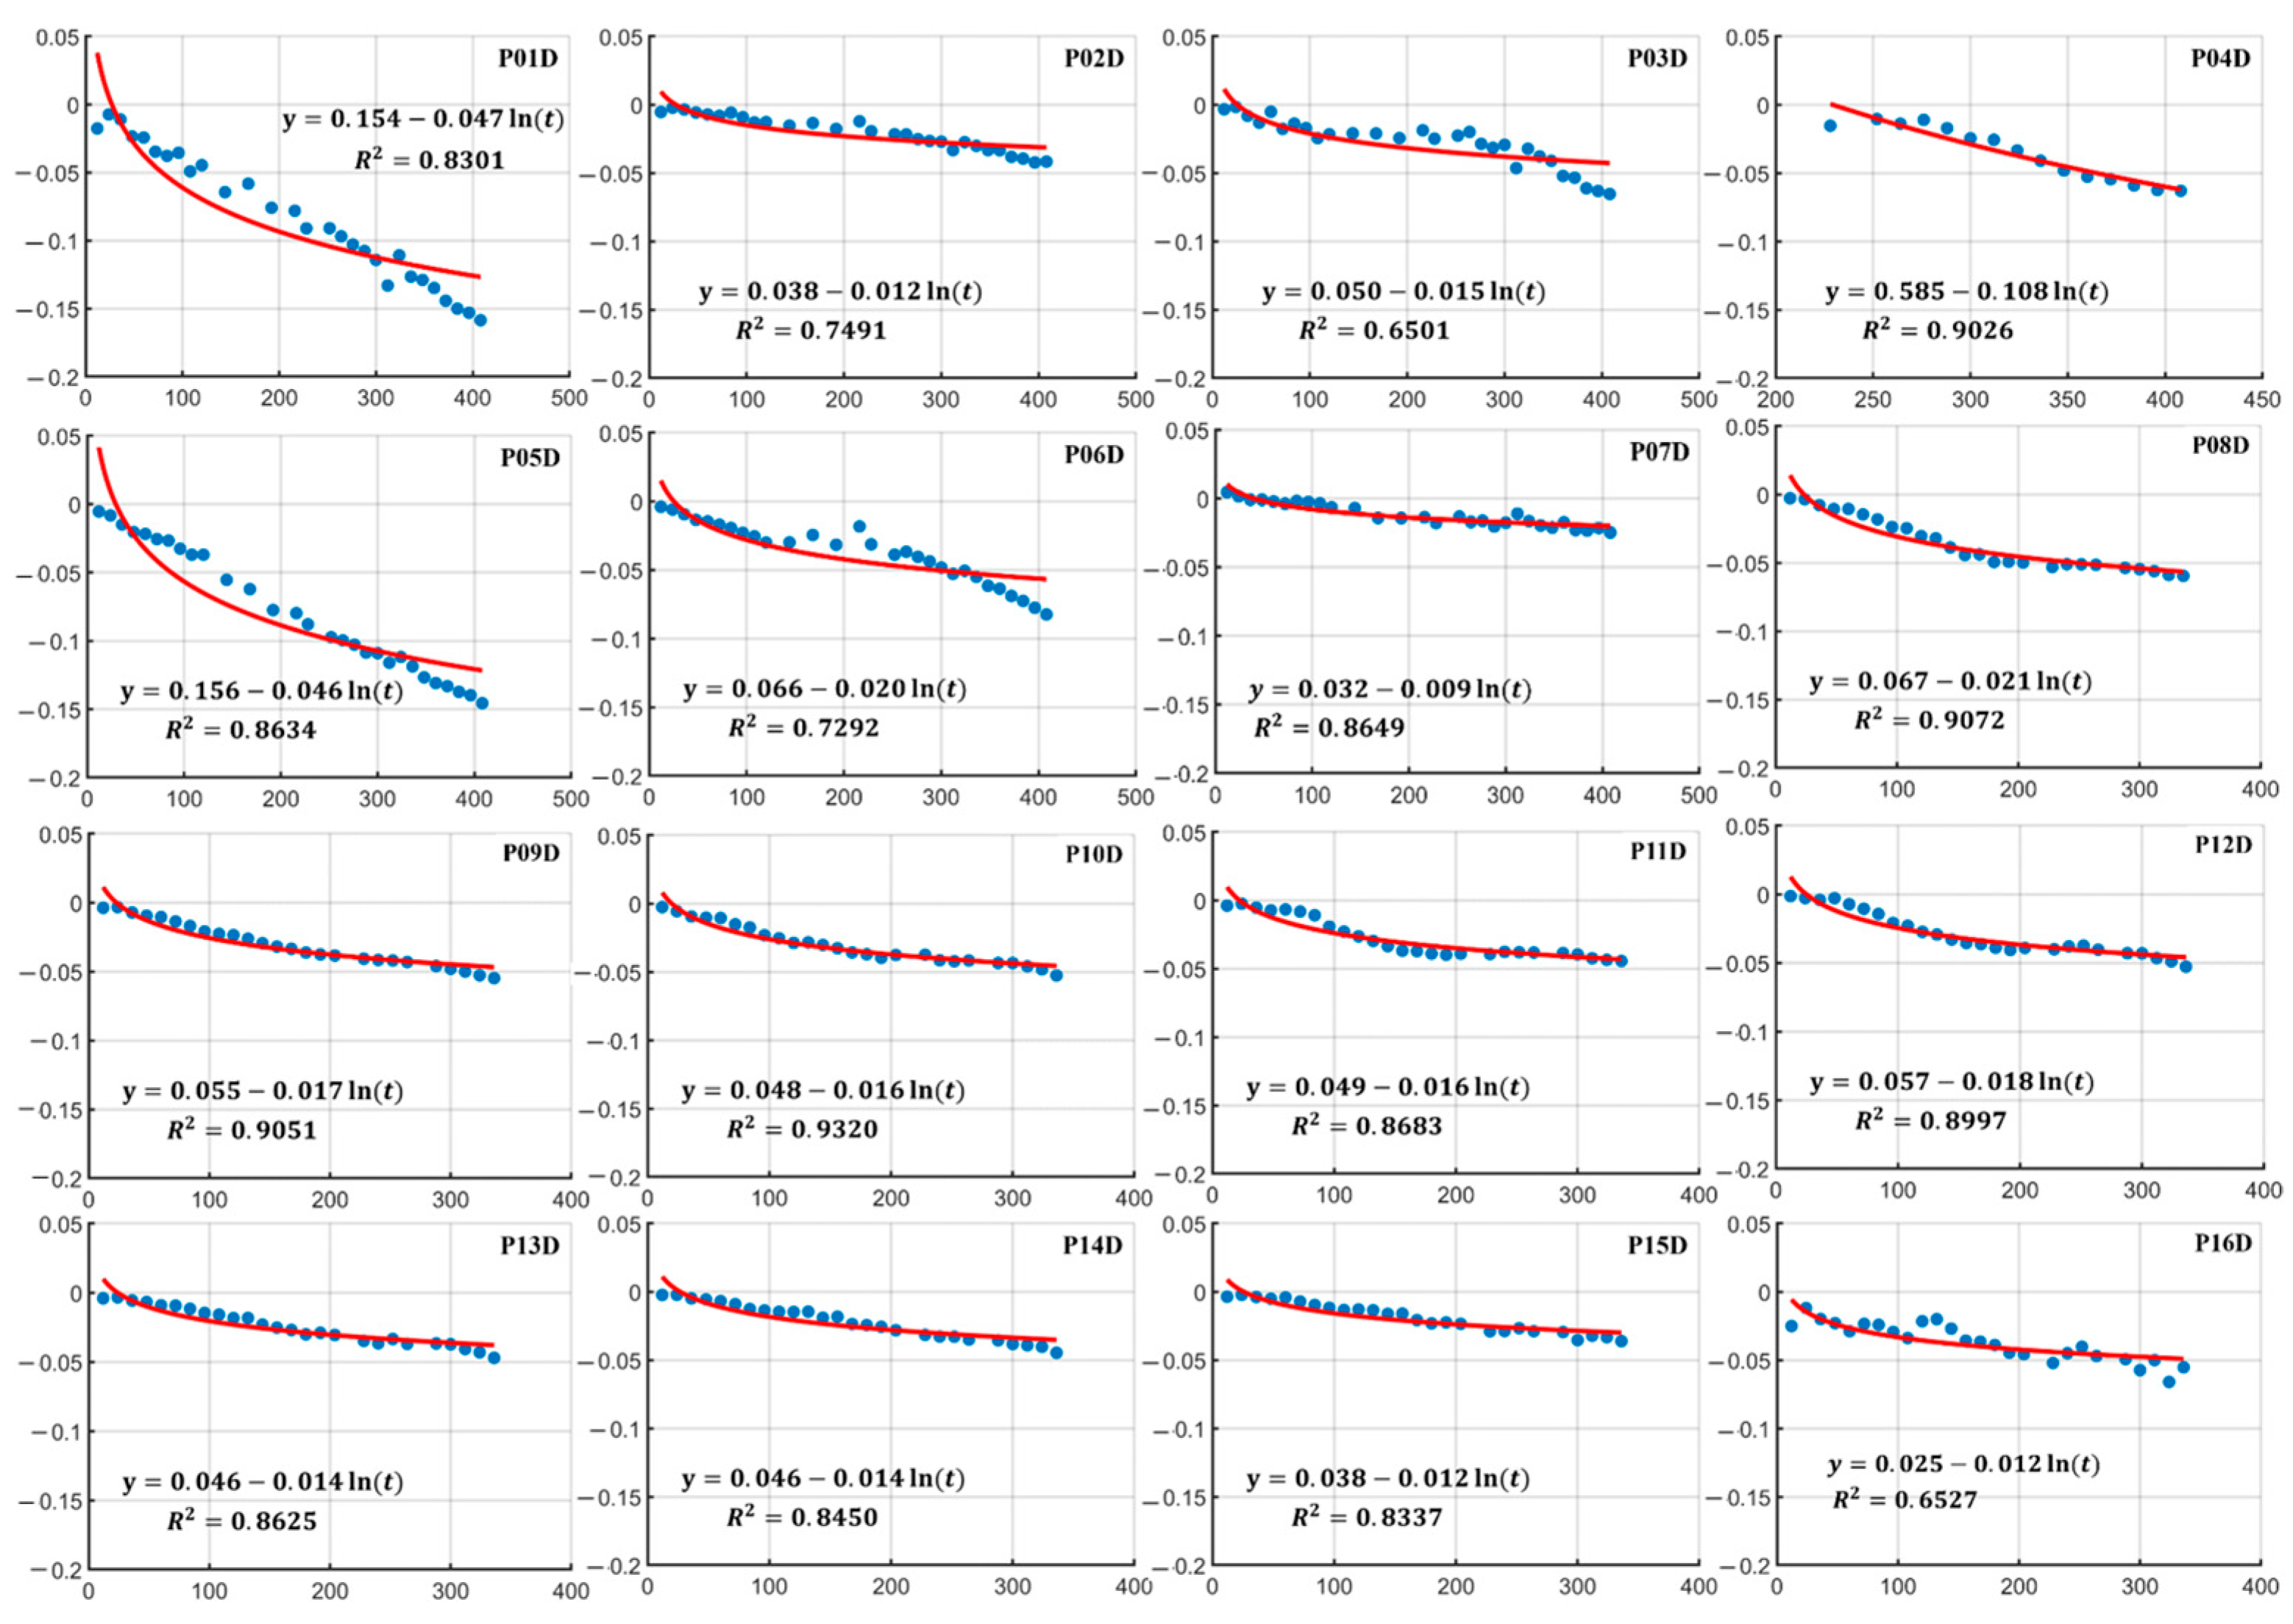
To better elucidate the temporal evolution patterns of surface deformation along the CYWDP, a temporal analysis was conducted on multiple time-series characteristic points selected at various geographical locations along the route. This analysis further summarizes the temporal characteristics of surface deformation along the project. In this study, 16 time-series characteristic points were selected from Zone 1–Zone 4 (the specific distribution of characteristic points P01–P16 is illustrated in Figure 7, Figure 8, Figure 9 and Figure 10). To more precisely quantify the deformation activities, we focused on the deformation data of each characteristic deformation point over the study period. By constructing an exponential decay mathematical model to fit the cumulative deformation curves, we aimed to reveal the dynamic variation patterns of surface deformation. Figure 11 and Figure 12 present the time-series cumulative deformation curves for all 16 feature points derived from ascending and descending data, respectively. The x-axis denotes the monitoring timeline (days), and the y-axis indicates the cumulative deformation (m). In the ascending orbit data, the correlation coefficients ( R 2 ) between the cumulative deformation and time for each characteristic point range from 0.6234 (P07) to 0.9031 (P10), with an average goodness-of-fit reaching 0.7910. For the descending orbit data, the correlation coefficients fall within the range of 0.6501 (P03) to 0.9320 (P10), and the average goodness-of-fit is 0.8310. Surface deformation at multiple characteristic points has stabilized, with a corresponding reduction in deformation rates. However, subsequent seasonal fluctuations in groundwater levels may still trigger continued surface deformation in certain areas.

5. Discussion

This study pioneers the integrated use of ascending and descending Sentinel-1 data to investigate geometric distortions and multi-dimensional deformation characteristics along the CYWDP. Initially, the geometric distortion and applicability analysis of satellite radar images along the water diversion route were carried out by using Sentinel-1A data. Following that, SBAS-InSAR was utilized to extract LOS deformation from ascending (124 scenes) and descending (90 scenes) data spanning the period from 2022 to 2024. Through the combination of ascending and descending data, two-dimensional deformations, encompassing vertical and horizontal components, were calculated for typical deformation areas, and the temporal evolution patterns of characteristic points were analyzed. The research findings have unveiled the distribution of surface deformation and the multi-dimensional spatiotemporal evolution characteristics along the CYWDP, providing critical scientific support for project construction, operational safety, and geological hazard mitigation.
Unfortunately, due to objective constraints, some of the study areas are still in the pre-construction phase, and the project has a vast scale. As a result, it is difficult to conduct comprehensive on-site measurement surveys. Consequently, we have been unable to obtain corresponding on-site measured data for cross-validation. However, it is expected that this task can be accomplished during the subsequent continuous monitoring process.
In addition, although the SBAS-InSAR technique boasts monitoring precision at the millimeter level, phase decorrelation in areas with thick vegetation cover may potentially lead to an underestimation of deformation. Furthermore, all the data utilized in this study are from Sentinel-1A, resulting in a single data source and relatively insufficient data diversity. Therefore, to more comprehensively investigate the dynamic evolution of surface deformation before and after the construction of the CYWDP, future research will integrate multi-band SAR data (such as LT-1 in L-band) to enhance monitoring reliability. Meanwhile, more factors influencing surface deformation, such as groundwater data and land-use types, will be incorporated to explore the relationships between these factors and surface deformation. This will enable a better analysis of the long-term development pattern of surface deformation across the entire region after the completion of the CYWDP.

6. Conclusions

The CYWDP has garnered significant attention due to its profound strategic significance and unprecedented construction challenges. The extremely complex topography and geomorphology result in highly variable hydrogeological conditions along the project route, thereby increasing construction difficulties, and pose substantial challenges for time-series InSAR-based surface deformation monitoring and early identification of geological hazards. This research endeavored to explore the applicability of InSAR along the project route using the LSM model and R-Index. InSAR technology was employed to monitor the area by extracting time-series and 2D deformation information. The key findings are presented as follows:
1.
The geometric distortion analysis reveals that foreshortening dominates most study areas, accounting for 35.3% of the ascending orbit coverage and 37.9% of the descending orbit coverage. Both ascending and descending data show consistent geometric distortion patterns, with layover and shadow effects covering approximately 1% and 0.1% the study area, respectively. Furthermore, the proportion of regions suitable for InSAR monitoring remains consistently above 70% in both ascending and descending observations.
2.
The SBAS-InSAR analysis identified 10 deformation areas along the CYWDP, which were categorized into Zone 1–Zone 4 and mainly distributed in the Shigu-Wanjia and Luoci-Qujiang segments. The deformation rate results reveal significant spatial heterogeneity in surface displacement across the study area, with localized zones exhibiting pronounced uplift or subsidence. Two-dimensional deformation inversion demonstrated high spatial consistency among the four deformation results. Notably, the most severe deformation occurs in the northern urban sector of Jinning District, where the maximum subsidence rate reaches −164 mm/y and shows a tendency to expand towards the water conveyance route, posing potential risks to the infrastructure’s long-term stability.

Author Contributions

Conceptualization, X.G. and Y.L.; methodology, X.G.; software, X.G., Y.Y. and Z.R.; validation, C.H., J.X. and Q.Z.; formal analysis, X.G.; resources, C.H. and Y.L.; data curation, C.S. and M.X.; writing—original draft preparation, X.G.; writing—review and editing, X.G., Y.L. and X.Z.; visualization, C.S. and M.X.; supervision, Y.L.; funding acquisition, Y.L. and X.Z. All authors have read and agreed to the published version of the manuscript.

Funding

This research was funded by the National Natural Science Foundation of China (Grant Nos. 42471483, 42161067, 42361054), the Open Fund Program of Yunnan Key Laboratory of Intelligent Monitoring and Spatiotemporal Big Data Governance of Natural Resources (Grant No. 202449CE340023), the Pilot Cooperation Project between the Ministry of Natural Resources of China and Yunnan Province (Grant No. 2023ZRBSHZ048), the Yunnan Fundamental Research Projects (Grant Nos. 202501AT070310 and 202401AU070173), the Scientific Research Fund of Yunnan Provincial Department of Education (Grant No. 2024J0067) and the Talent Development Program of Kunming University of Science and Technology (Grant No. KKZ3202421128).

Data Availability Statement

The Sentinel-1 SAR data used in this study were obtained from the European Space Agency (ESA) (https://dataspace.copernicus.eu/). The DEM data were sourced from the Shuttle Radar Topography Mission (SRTM) provided by NASA (https://earthexplorer.usgs.gov/). Atmospheric correction data (GACOS) were acquired from http://www.gacos.net/. Optical imagery was accessed through Google Earth (https://earth.google.com/web/). The earthquake data are sourced from the China Earthquake Science Data Center (https://data.earthquake.cn/).

Acknowledgments

The authors would like to express their sincere gratitude to the various websites and organizations that provided the data. The authors also thank the editorial team of Remote Sensing for their valuable assistance during the review process.

Conflicts of Interest

The authors declare no conflicts of interest.

Abbreviations

The following abbreviations are used in this manuscript:
CYWDPCentral Yunnan Water Diversion Project
LSMLayover-Shadow Mask
LOSLine-of-sight
2DTwo-dimensional
GNSSGlobal Navigation Satellite System
InSARInterferometric Synthetic Aperture Radar
D-InSARDifferential InSAR
MT-InSARMulti-Temporal InSAR
PSPersistent Scatterer
SBASSmall Baseline Subset
DSDistributed Scatterers
SRTMShuttle Radar Topography Mission
DEMDigital elevation model
GACOSGeneric Atmospheric Correction Online Service
SVDSingular Value Decomposition

References

  1. Yan, H.; Lin, Y.; Chen, Q.; Zhang, J.; He, S.; Feng, T.; Wang, Z.; Chen, C.; Ding, J. A review of the eco-environmental impacts of the South-to-North Water Diversion: Implications for in terbasin water transfers. Engineering 2023, 30, 161–169. [Google Scholar] [CrossRef]
  2. Zhang, X.; Yang, A.; Xu, Q.; Jiang, B. Key technology on establishment of an independent coordinate system for water diversion project in central Yunnan. Geomat. Inf. Sci. Wuhan Univ. 2014, 39, 1047–1051. [Google Scholar]
  3. Zhang, Y.; Pu, S.; Zhou, H.; Wang, J.; Wu, S.; Ding, X. Research progress on key technologies for safe construction and efficient operation of the Dianzhong water diversion project-underground engineering. Chin. J. Rock Mech. Eng. 2024, 43, 333–357. [Google Scholar]
  4. Hu, M.T.; Zhang, Y.J.; Xu, W.Y.; Wang, H.L.; Wang, R.B.; Yang, X.L.; Ma, J.W.; Huang, W. Large deformations and numerical analysis of a typical soft rock tunnel in the Chuxiong section of the Yunnan Central Water Diversion Project. Int. J. Geomech. 2024, 24, 05024002. [Google Scholar] [CrossRef]
  5. He, Y.F.; Xu, G.C.; Kaufmann, H.; Wang, J.T.; Ma, H.; Liu, T. Integration of InSAR and LiDAR technologies for a detailed urban subsidence and hazard assessment in Shenzhen, China. Remote Sens. 2021, 13, 2366. [Google Scholar] [CrossRef]
  6. Xue, L.; Zhao, X.; Li, H.; Zheng, J.; Lei, X.Q.; Gong, X. Genetic algorithm-based parameter inversion and pipeline subsidence prediction. J. Appl. Geophys. 2023, 215, 105133. [Google Scholar] [CrossRef]
  7. Liu, X.; Zhao, C.; Zhang, Q.; Lu, Z.; Li, Z.; Yang, C.; Zhu, W.; Liu-Zeng, J.; Chen, L.; Liu, C. Integration of Sentinel-1 and ALOS/PALSAR-2 SAR datasets for mapping active landslides along the Jinsha River corridor, China. Eng. Geol. 2021, 284, 106033. [Google Scholar] [CrossRef]
  8. Li, P.; Li, Z.; Li, T.; Shi, C.; Liu, J. Wide-Swath InSAR geodesy and its applications to large-scale deformation monitoring. Geomat. Inf. Sci. Wuhan Univ. 2017, 42, 1195–1202. [Google Scholar]
  9. Kim, T.; Han, H.Y.S. Coseismic displacement fields and the slip mechanism of the 2021 Mw 6.7 Hovsgol earthquake in Mongolia constrained by Sentinel-1 and ALOS-2 InSAR. GIScience Remote Sens. 2023, 60, 2180026. [Google Scholar] [CrossRef]
  10. Zhang, G.; Xu, Z.X.; Chen, Z.W.; Wang, S.Y.; Liu, Y.T.; Gong, X.H. Analyzing surface deformation throughout China’s territory using multi-temporal InSAR processing of Sentinel-1 radar data. Remote Sens Environ. 2024, 305, 114105. [Google Scholar] [CrossRef]
  11. Macchiarulo, V.; Milillo, P.; DeJong, M.J.; Martí, J.G.; Sánchez, J.; Giardina, G. Integrated InSAR monitoring and structural assessment of tunnelling-induced building deformations. Struct. Control. Health Monit. 2021, 28, e2781. [Google Scholar] [CrossRef]
  12. Jia, H.; Liu, L. A technical review on persistent scatterer interferometry. J. Mod. Transp. 2016, 24, 153–158. [Google Scholar] [CrossRef]
  13. Ferretti, A.; Prati, C.; Rocca, F. Permanent scatterers in SAR interferometry. IEEE Trans. Geosci. Remote Sens. 2001, 39, 8–20. [Google Scholar] [CrossRef]
  14. Berardino, P.; Fornaro, G.; Lanari, R.; Sansosti, E. A new algorithm for surface deformation monitoring based on small baseline differential SAR interferograms. IEEE Trans. Geosci. Remote Sens. 2002, 40, 2375–2383. [Google Scholar] [CrossRef]
  15. Ferretti, A.; Fumagalli, A.; Novali, F.; Prati, C.; Rocca, F.; Rucci, A. A new algorithm for processing interferometric data-stacks: SqueeSAR. IEEE Trans. Geosci. Remote Sens. 2011, 49, 3460–3470. [Google Scholar] [CrossRef]
  16. Lyu, M.; Ke, Y.; Guo, L.; Li, X.; Zhu, L.; Gong, H.; Constantinos, C. Change in regional land subsidence in Beijing after south-to-north water diversion project observed using satellite radar interferometry. GISci. Remote Sens. 2020, 57, 140–156. [Google Scholar] [CrossRef]
  17. Dong, J.; Lai, S.; Wang, N.; Wang, Y.; Zhang, L.; Liao, M. Multi-scale deformation monitoring with Sentinel-1 InSAR analyses along the Middle Route of the South-North Water Diversion Project in China. Int. J. App. Earth Obs. Geoinf. 2021, 100, 102324. [Google Scholar] [CrossRef]
  18. Hu, J.; Wu, W.; Motagh, M.; Qin, F.; Wang, J.; Pan, S.; Guo, J.; Zhang, C. FIM-based DSInSAR method for mapping and monitoring of reservoir bank landslides: An application along the Lancang River in China. Landslides. 2023, 20, 2479–2495. [Google Scholar] [CrossRef]
  19. Xiao, H.P.; Xia, Y.Q.; Fan, Y.C.; Chen, L.L.; Duan, R.P. Identification and prediction inversion of mining area subsidence by integrating SBAS-InSAR and EMD-ARIMA model. IEEE Access. 2024, 12, 85822–85835. [Google Scholar] [CrossRef]
  20. Wang, S.Y.; Zhang, G.; Chen, Z.W.; Cui, H.; Zheng, Y.Z.; Xu, Z.X.; Li, Q.H. Surface deformation extraction from small baseline subset synthetic aperture radar interferometry (SBAS-InSAR) using coherence-optimized baseline combinations. GIScience Remote Sens. 2022, 59, 295–309. [Google Scholar] [CrossRef]
  21. He, Y.; Wang, W.H.; Zhang, L.F.; Chen, Y.D.; Chen, Y.; Chen, B.S.; He, X.; Zhao, Z.A. An identification method of potential landslide zones using InSAR data and landslide susceptibility. Geomat. Nat. Hazards Risk. 2023, 14, 2185120. [Google Scholar] [CrossRef]
  22. Ma, X.; Peng, J.; Su, Y.; Shi, M.; Zheng, Y.; Li, X.; Jiang, X. Deformation characteristics and activation dynamics of the Xiaomojiu landslide in the upper Jinsha River Basin revealed by multi-track InSAR analysis. Remote Sens. 2024, 16, 1940. [Google Scholar] [CrossRef]
  23. Li, Y.; Zuo, X.; Zhu, D.; Wu, W.; Yang, X.; Guo, S.; Shi, C.; Huang, C.; Li, F.; Liu, X. Identification and analysis of landslides in the Ahai reservoir area of the Jinsha River Basin using a combination of DS-InSAR, optical images, and field surveys. Remote Sens. 2022, 14, 6274. [Google Scholar] [CrossRef]
  24. Gu, X.; Li, Y.; Zuo, X.; Bu, J.; Yang, F.; Yang, X.; Li, Y.; Zhang, J.; Huang, C.; Shi, C.; et al. Image compression–based DS-InSAR method for landslide identification and monitoring of alpine canyon region: A case study of Ahai Reservoir area in Jinsha River Basin. Landslides 2024, 21, 2501–2517. [Google Scholar] [CrossRef]
  25. Kropatsch, W.G.; Strobl, D. The generation of SAR layover and shadow maps from digital elevation models. IEEE Trans. Geosci. Remote Sens. 1990, 28, 98–107. [Google Scholar] [CrossRef]
  26. Dai, K.R.; Deng, J.; Xu, Q.; Li, Z.H.; Shi, X.L.; Hancock, C.; Wen, N.L.; Zhang, L.L.; Zhuo, G.C. Interpretation and sensitivity analysis of the InSAR line of sight displacements in landslide measurements. GIScience Remote Sens. 2022, 59, 1226–1242. [Google Scholar] [CrossRef]
  27. Notti, D.; Davalillo, J.C.; Herrera, G.; Mora, O. Assessment of the performance of X-band satellite radar data for landslide mapping and monitoring: Upper Tena Valley case study. Nat. Hazards Earth Syst. Sci. 2010, 10, 1865–1875. [Google Scholar] [CrossRef]
  28. Notti, D.; Herrera, G.; Bianchini, S.; Meisina, C.; García-Davalillo, J.C.; Zucca, F. A methodology for improving landslide PSI data analysis. Int. J. Remote Sens. 2014, 35, 2186–2214. [Google Scholar] [CrossRef]
  29. Cigna, F.; Bateson, L.B.; Jordan, C.J.; Dashwood, C. Simulating SAR geometric distortions and predicting Persistent Scatterer densities for ERS-1/2 and ENVISAT C-band SAR and InSAR applications: Nationwide feasibility assessment to monitor the landmass of Great Britain with SAR imagery. Remote Sens. Environ. 2014, 152, 441–466. [Google Scholar] [CrossRef]
  30. Fuhrmann, T.; Garthwaite, M.C. Resolving three-dimensional surface motion with InSAR: Constraints from multi-geometry data fusion. Remote Sens. 2019, 11, 241. [Google Scholar] [CrossRef]
  31. Cigna, F.; Tapete, D. Satellite InSAR survey of structurally-controlled land subsidence due to groundwater exploitation in the Aguascalientes Valley, Mexico. Remote Sens. Environ. 2021, 254, 112254. [Google Scholar] [CrossRef]
  32. Maghsoudi, Y.; Hooper, A.J.; Wright, T.J.; Lazecky, M.; Ansari, H. Characterizing and correcting phase biases in short-term, multilooked interferograms. Remote Sens. Environ. 2022, 275, 113022. [Google Scholar] [CrossRef]
  33. Xiao, R.; Yu, C.; Li, Z.; He, X. Statistical assessment metrics for InSAR atmospheric correction: Applications to generic atmospheric correction online service for InSAR (GACOS) in Eastern China. Int. J. Appl. Earth Obs. Geoinf. 2021, 96, 102289. [Google Scholar] [CrossRef]
  34. Li, Y.; Ji, P.; Liu, S.; Zhao, J.; Yang, Y. Susceptibility evaluation of highway landslide disasters based on SBAS-InSAR: A case study of S211 highway in Lanping County. Nat. Hazards 2025, 121, 2587–2612. [Google Scholar] [CrossRef]
  35. Fattahi, H.; Amelung, F. InSAR bias and uncertainty due to the systematic and stochastic tropospheric delay. J. Geophys. Res. Solid Earth. 2015, 120, 8758–8773. [Google Scholar] [CrossRef]
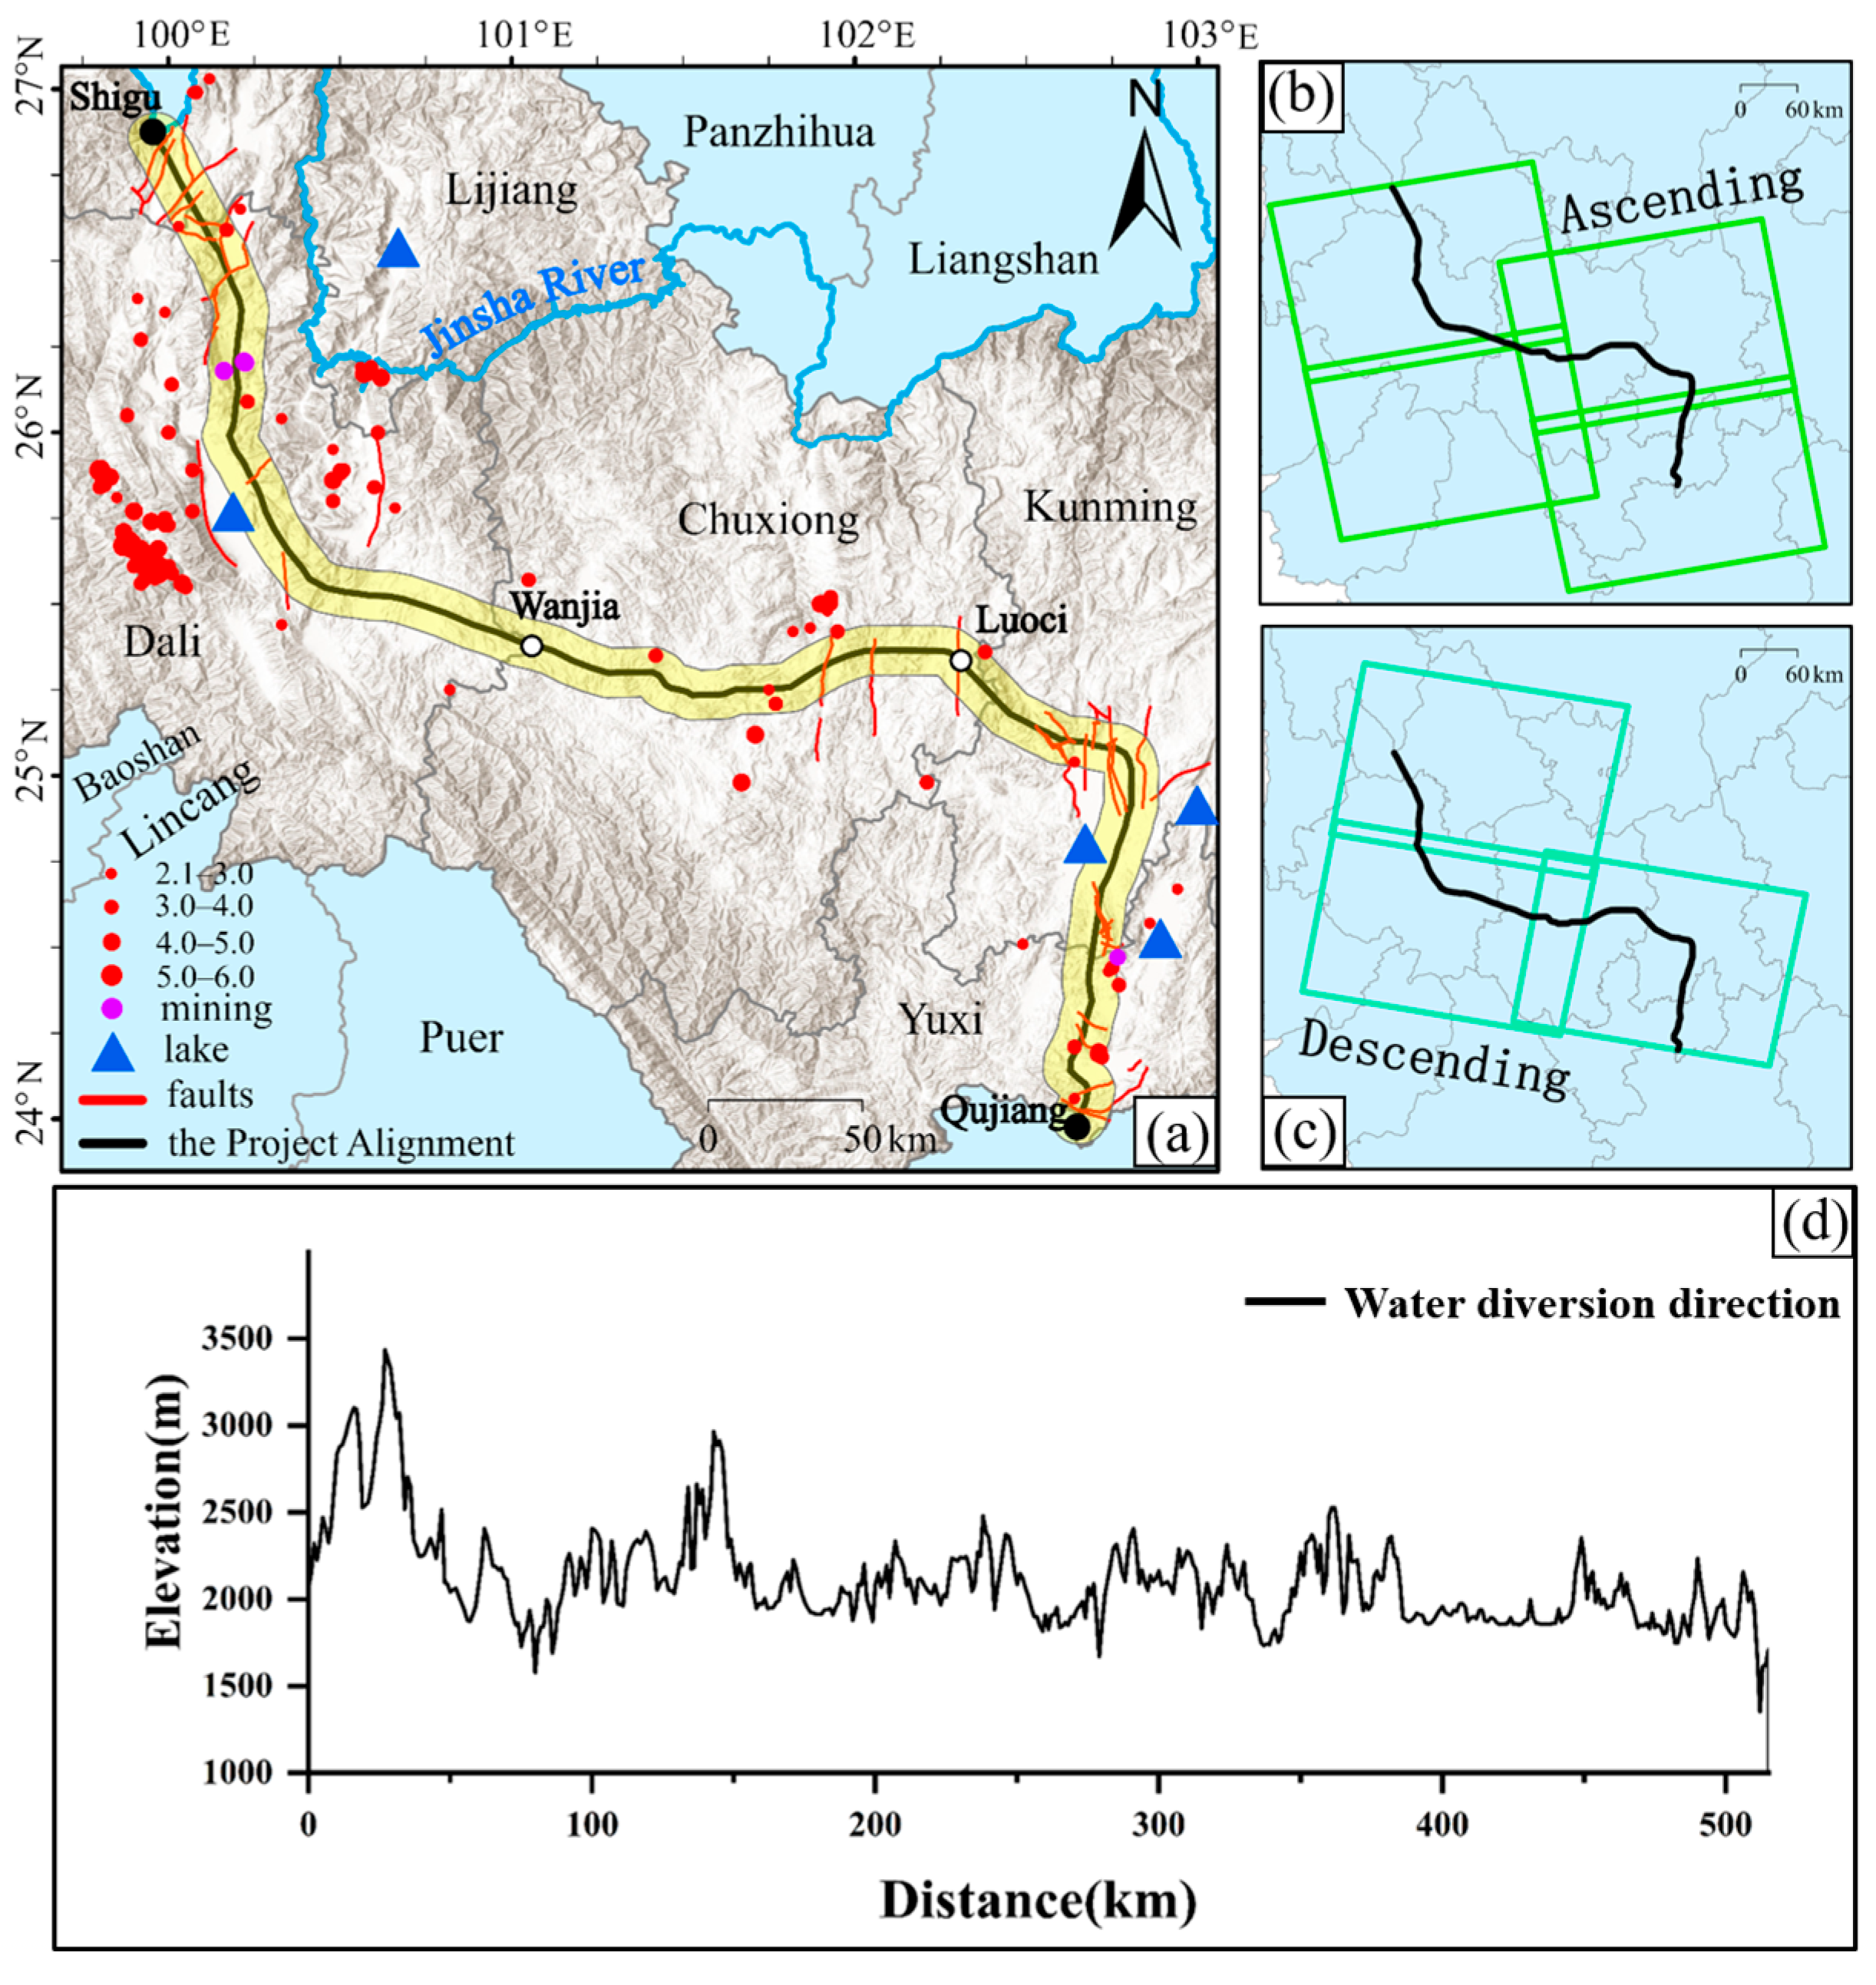
Figure 1. Geographical location map of the research area: (a) Route of the Central Yunnan Water Diversion Project. (b,c) Coverage of Sentinel-1 data. (d) Elevation profile of water conveyance route.
Remotesensing 17 03250 g001
Figure 2. Spatial distribution and area proportion of elevation, slope, and aspect in the study area: (a) Elevation, (b) slope, (c) aspect, (d) elevation classification area percentage, (e) slope classification area percentage, (f) aspect classification area percentage.
Remotesensing 17 03250 g002
Figure 3. Overall Workflow Diagram.
Remotesensing 17 03250 g003
Figure 4. Geometric distortion results under ascending and descending data conditions in the study area: (a) ascending results; (b) descending results; (c,d) corresponding statistical area distributions of (a) and (b), respectively; (e,f) are enlarged views of two local regions (mark with pink boxes in figures (a,b)); (g,h) show the geometric distortion results for the local regions under ascending data; (i,j) present the geometric distortion results for the local regions under descending data.
Remotesensing 17 03250 g004
Figure 5. Annual deformation velocity from SBAS-InSAR (red boxes indicate deformation zones): (a) for the ascending orbit, (b) for the descending orbit.
Remotesensing 17 03250 g005
Figure 6. Statistical histograms of deformation velocity points: (a) ascending orbit, (b) descending orbit.
Remotesensing 17 03250 g006
Figure 7. Deformation velocity and corresponding optical imagery for Zone 1: (a) LOS deformation velocity (ascending), (b) LOS deformation velocity (descending), (c) horizontal deformation velocity, (d) vertical deformation velocity.
Remotesensing 17 03250 g007
Figure 8. Deformation velocity and corresponding optical imagery for Zone 2: (a) LOS deformation velocity (ascending), (b) LOS deformation velocity (descending), (c) horizontal deformation velocity, (d) vertical deformation velocity.
Remotesensing 17 03250 g008
Figure 9. Deformation velocity and corresponding optical imagery for Zone 3: (a) LOS deformation velocity (ascending), (b) LOS deformation velocity (descending), (c) horizontal deformation velocity, (d) vertical deformation velocity.
Remotesensing 17 03250 g009
Figure 10. Deformation velocity and corresponding optical imagery for Zone 4: (a) LOS deformation velocity (ascending), (b) LOS deformation velocity (descending), (c) horizontal deformation velocity, (d) vertical deformation velocity.
Remotesensing 17 03250 g010
Figure 11. Time-series cumulative deformation curves of 16 feature points from ascending orbit data (x-axis: days; y-axis: m).
Remotesensing 17 03250 g011
Figure 12. Time-series cumulative deformation curves of 16 feature points from descending orbit data (x-axis: days; y-axis: m).
Remotesensing 17 03250 g012
Table 1. Earthquakes with magnitude ≥5.0 along the Central Yunnan Water Diversion Project (2014–2024).
DateLocationMagnitudeDepth(km)
21 May 2021Yangbi, Yunnan6.48
21 May 2021Yangbi, Yunnan5.610
21 May 2021Yangbi, Yunnan5.28
27 March 2017Yangbi, Yunnan5.112
21 May 2021Yangbi, Yunnan58
13 August 2018Tonghai, Yunnan57
14 August 2018Tonghai, Yunnan56
Table 2. Parameter table of Sentinel-1A data.
ParameterAscendingDescending
Microwave band (wavelength)C-band (5.6 cm)C-band (5.6 cm)
Repeat cycle/d1212
PolarizationVVVV
Path99, 26135, 62
Incidence angle (°)39.9 (99), 39.9 (26)39.9 (135), 39.9 (62)
Heading (°)347.5 (99), 347.5 (26)192.5 (135), 192.5 (62)
Pixel spacing(m)2.3 × 142.3 × 14
Resolution(m)5 × 205 × 20
No. of images12490
Temporal coverage25 October 2022–22 February 202431 December 2022–12 February 2024
Table 3. Geometric and deformation characteristics of potential hazard areas.
Area IDZoneLength (km)Width (km)Slope (°)Distance to CYWDP (km)Max Vert. Disp. (mm/y)Max Hor. Disp. (mm/y)Likely Phenomenon
K1Zone13.071.120~331.33−154−127Mining activities
K2Zone11.681.510~320.59−8565Mining activities
K3Zone10.880.830~401.48−71−42Mining activities
K4Zone11.461.080~362.68−74−36Infrastructure construction
K5Zone12.941.650~523.78−154−114Infrastructure construction
K6Zone12.381.880~413.99−87−52Infrastructure construction
X1Zone25.703.750~53.77−53−41Urban engineering
J1Zone35.252.680~52.61−164−37Groundwater extraction, greenhouse farming, and urban engineering
T1Zone42.391.980~490.66−64−42Groundwater extraction, greenhouse farming, and urban engineering
T2Zone41.060.820~51.46−84−34Groundwater extraction, greenhouse farming
Disclaimer/Publisher’s Note: The statements, opinions and data contained in all publications are solely those of the individual author(s) and contributor(s) and not of MDPI and/or the editor(s). MDPI and/or the editor(s) disclaim responsibility for any injury to people or property resulting from any ideas, methods, instructions or products referred to in the content.