Article

Assessing the Long-Term Changes in the Suspended Particulate Matter in Hangzhou Bay Using MODIS/Aqua Data

by
Xinyi Lu
1,2,
Xianqiang He
2,*,
Yaqi Zhao
1,2,
Palanisamy Shanmugam
3,
Fang Gong
2,
Teng Li
2 and
Xuchen Jin
2
1
Ocean College, Zhejiang University, Zhoushan 316021, China
2
State Key Laboratory of Satellite Ocean Environment Dynamics, Second Institute of Oceanography, Ministry of Natural Resources, Hangzhou 310012, China
3
Department of Ocean Engineering, Indian Institute of Technology Madras, Chennai 600036, India
*
Author to whom correspondence should be addressed.
Remote Sens. 2025, 17(18), 3248; https://doi.org/10.3390/rs17183248
Submission received: 16 August 2025 / Revised: 15 September 2025 / Accepted: 16 September 2025 / Published: 19 September 2025

Abstract

Highlights

What are the main findings?
  • Long-term MODIS/Aqua data (2003–2024) revealed a significant decline in suspended particulate matter (TSM) in Hangzhou Bay (HZB), linked to reduced sediment discharge from the Yangtze River.
  • Interannual TSM variations in winter were associated with Yangtze River sediment discharge and regional wind forcing, with bridge construction causing spatial contrasts across the Hangzhou Bay Bridge and reclamation altering TSM around Yushan Island.
What is the implication of the main finding?
  • The results highlight the combined influence of natural factors and human activities on sediment dynamics, revealing significant spatiotemporal changes and regulatory mechanisms of TSM in HZB.
  • The findings provide valuable insights into the long-term changes in suspended sediment and water quality in HZB, supporting sustainable water management and effective water strategies.

Abstract

Hangzhou Bay (HZB) has become a hot spot in hydro-morphodynamic research due to human impacts and natural influences, as well as the substantial quantities of water discharge and sediment load of the Yangtze River and Qiantang River. Although many previous studies have analyzed the spatial–temporal variations in suspended particulate matter (TSM) from in situ and satellite observations, the long-term changes in suspended sediment dynamics remain unclear. In this study, we quantified the long-term variation in TSM load using MODIS/Aqua data during 2003–2024. The TSM products in the HZB displayed a decreasing trend from 2003 to 2024 (k = −1.90 mg/L/year, p < 0.05), which may be attributed to decreased sediment discharge from the Yangtze River. The spatial variation in TSM provided quantitative results for HZB, with a substantially increasing trend in the southern shallow areas and a decreasing trend in the northern deep troughs and central bay. The interannual variations in TSM in winter displayed a positive correlation with the sediment load from the Yangtze River (R = 0.640 for the data during 2014–2022) and with wind speed (R = 0.676 for the data during 2009–2021). The TSM of HZB was partly affected by the combined impacts of human activities and climate change. A distinct difference in TSM concentrations on both sides of the Hangzhou Bay Bridge was observed, with higher TSM on the western side than on the eastern side for most of the year during 2003–2024. A decline in TSM was observed near Yushan Island from 2003 to 2024, attributed to large-scale land reclamation and associated alterations in tide-dominated areas. This study provides valuable insights into the long-term changes in suspended sediment and water quality in HZB, which is crucial for managing water resources, creating effective water strategies, predicting future needs, and ensuring sustainable water management.

1. Introduction

Hangzhou Bay (HZB) is the largest bay located on the west coast of the East China Sea, where suspended particulate matter (TSM) concentrations are significantly influenced by tidal oscillations and amplified by human activities and climate variability. Large-scale reclamation in this region in the past few decades has altered the hydrodynamics of the bay and TSM distribution patterns. For example, since 2000, over 40,000 dams and reservoirs [1] have been constructed along the Yangtze River, which significantly reduced the sediment load and impacted the TSM concentrations in HZB water [2]. These structural changes and urban land expansion adjacent to the economically developed Yangtze River Delta have intensified in recent years. Large-scale coastal reclamation projects have been implemented [3,4,5], along with the construction of deep-water ports such as Zhoushan and Ningbo, and major infrastructure projects, like the Hangzhou Bay Bridge. These reclamation and construction activities have altered the distribution of suspended sediments and resulted in complex hydrodynamic and TSM distribution within HZB. In 2022, the Chinese Ministry of Ecology and Environment, along with six other governmental departments, issued a plan for significantly improving the ecological environment of adjacent seas, including the Bohai Sea, the Yangtze River Estuary–Hangzhou Bay, and the Pearl River Estuary [6]. The goal was to improve surface water quality by approximately 2% by 2025. It is thus crucial to identify the driving forces and understand the historical and present trends of TSM in HZB water for effective environmental and water resource management.
Compared to traditional water quality monitoring methods that involve costly and time-exhaustive sample collection and analysis for fixed point locations, remote sensing technology offers the advantages of providing rapid and periodic data products over large areas. This not only improves the temporal frequency but also enables dynamic monitoring and long-term trend analysis. Recent studies have demonstrated the practical utility of remote sensing technology for studying the spatial and temporal variations in TSM in coastal and estuarine systems [7,8,9,10,11,12,13,14,15].
According to recent investigations of spatiotemporal variations and regulatory mechanisms of TSM in HZB using satellite data and in situ measurement data, the sediment load from the Yangtze River and human activities in the region caused dramatic changes in TSM transport [2,7,16,17]. Since the year 2000, a sharp decline in the annual sediment load of the Yangtze River occurred in association with the sediment interception caused by the upstream dam construction and the relative contributions of climate change [16,18]. Shen et al. (2013) [19] reported a delayed response of TSM in HZB to a reduction in sediment load from the Yangtze River during 2003–2010. Although short-term sediment load changes have a minimal effect on TSM in HZB, a long-term decrease could reduce TSM over time. Additionally, human interventions such as offshore construction [20,21,22] and land reclamation [3,4,5,23] caused significant changes in the suspended sediment load in HZB, resulting in complex impacts on TSM distributions.
The substantial seasonal variations in TSM in HZB are also largely caused by natural factors, such as the Yangtze River discharge and wind speed. Gao et al. (2008) [24] concluded that the TSM of the Yangtze River is relatively much lower than that of HZB, suggesting that flood discharges through the river had a diluting effect on the hydro-sediment dynamics of the bay. Dan et al. (2014) [25] and Liu et al. (2013) [26] noted that higher wind speeds in the autumn and winter months could easily cause sediment resuspension and transport in the shallow regions of HZB, where initiation of sediment resuspension is modulated by prevailing winds.
Despite many studies focusing on hydro-sediment dynamics in HZB, the spatiotemporal variations and regulatory mechanisms of sediment load in the bay remain unclear. Firstly, previous studies have only focused on short-term or seasonal variations in TSM without further analysis of its long-term trends. Secondly, studies on the spatial and temporal distribution characteristics and evolution of TSM in HZB are limited. Although many studies qualitatively analyzed the influencing factors of TSM, only a few studies employed quantitative methods to explore the correlations between the above factors and TSM concentrations. To address this gap, our study produced long-term TSM products, providing quantitative, long-term analysis of the spatiotemporal variations in TSM and its primary driving factors.
In this study, we utilized the time-series satellite data from the Moderate Resolution Imaging Spectroradiometer (MODIS) to investigate the long-term changes in TSM in HZB. To deliver high-accuracy TSM products, we processed the MODIS data using the shortwave infrared atmospheric correction algorithm (SWIR-AC) and a regional TSM retrieval algorithm. Finally, we analyzed the spatiotemporal variations and regulatory mechanisms of TSM in HZB for the period from 2003 to 2024.

2. Data and Methods

2.1. Study Area

HZB is the largest macro-tidal bay located south of the Yangtze River Estuary and bounded by 29.8°N to 31°N latitude and 120.15°E to 122.5°E longitude (Figure 1). It features a funnel-shaped geometry, measuring 86 km in length and 100 km in width, and covers an area of about 8500 square kilometers. It is characterized by high TSM concentrations (50–5300 mg/L) [27], as a result of the sediment load of the Yangtze River and Qiantang River, as well as high wind speeds and human activities. For this study, five regions were selected to extract satellite-derived TSM data for spatial analysis (Figure 1). These regions (box0, box1, box2, box3, and box4) are located at the top of Hangzhou Bay, the north shore, the middle of the bay, the south shore, and the northern entrance of Hangzhou Bay, respectively.

2.2. Data

2.2.1. Satellite Data

The MODIS/Aqua L1B data were obtained from the Atmosphere Archive and Distribution System Distributed Active Archive Center (LAADS DAAC, https://ladsweb.modaps.eosdis.nasa.gov, last accessed on 9 August 2025). The MODIS/Aqua L1B products include data over a number of spectral bands at 412 nm, 443 nm, 488 nm, 531 nm, 551 nm, 667 nm, 678 nm, 748 nm, and 869 nm, with a spatial resolution of 1 km, and 469 nm, 555 nm, 645 nm, 859 nm, 1240 nm, 1640 nm, and 2130 nm, with a spatial resolution of 500 m.
Using the MODIS Cloud Mask product (MOD35; NASA, Washington, D.C., USA) with a 30% cloud coverage threshold for HZB, MODIS/Aqua L1B data from January 2003 to December 2024 were processed, and 2817 high-quality cloud-screened scenes were obtained for this study. These products ensure data continuity at up to daily time steps over 22 years, beginning from the first full calendar year of MODIS/Aqua observations (2003) to the last complete year (2024). The data density analysis for the L1B data after atmospheric correction shows index values ranging from 0 to 1 (Figure 2a), where the values approaching 1 indicate more complete data coverage and the values near 0 reflect significant data deficiencies. The overall number of valid data from 2003 to 2024 is fairly good for the analysis (Figure 2a), which represents a density above 50% for most areas of HZB and 80% for the bay entrance. A stacked monthly time series dataset from 2003 to 2024 shows colored segments representing the monthly counts and the contribution of each month to the annual total (Figure 2b). The black line on the top panel represents the annual total every year, highlighting the interannual variability and long-term trends. The analysis revealed a pronounced seasonal pattern, with data availability reaching its highest level in summer and dropping to its lowest level in winter. Notably, data availability in December is often limited due to frequent cloud cover and bad weather conditions. Despite this limitation, the annual image count remains consistently above 100 every year throughout the study period, highlighting the dataset’s reliability for long-term analysis.

2.2.2. In Situ TSM Data

The TSM data were collected from two cruises in the East China Sea, which spanned from 29°N to 33°N latitude and 120°E to 128°E longitude (including HZB, the Yangtze River Estuary, and the East China Sea shelf) [17,27]. The summer cruise was conducted from 18 July to 23 August 2006, while the winter cruise was conducted from 23 December 2006 to 4 February 2007. During both cruises, TSM and remote sensing reflectance ( R r s ) data were concurrently obtained at the sampling stations. TSM was measured gravimetrically using pre-weighed cellulose acetate membrane filters (47 mm diameter, 0.45 μm pore size). R r s was measured aboard the ship with an ASD FieldSpec HandHeld Spectroradiometer (FSHH). The R r s data covered wavelengths from 413 nm to 865 nm, and the corresponding TSM concentrations ranged from 8 to 5300 mg/L. This range fully encompasses the TSM variations in HZB [27].

2.2.3. In Situ R r s Data

The in situ R r s data for the validation of the atmospheric correction method were obtained from a high-frequency water spectral observation system established at the Hai-Tian-Yi-Zhou (HTYZ) site (121.12528°E, 30.46278°N), located approximately 16 km and 19 km from the southern and northern coasts of the Hangzhou Bay Bridge, respectively. This system was equipped with two hyperspectral radiance sensors and one hyperspectral irradiance sensor to measure sea surface upwelling radiance ( L w ), sky radiance ( L s k y ), and downwelling irradiance ( E s ). The observation system operated daily from 07:00 to 17:00 local time, recording measurements at 15 min intervals. The radiometric data were collected over the spectral range of 320–950 nm, with a spectral resolution of 3.3 nm [28,29]. R r s was derived using the following equation:
R r s = L w ρ L s k y / E s
where ρ represents the sea surface reflectance coefficient, set to 0.028 [30,31].

2.2.4. Environmental Data

To explore spatiotemporal variations in TSM and its driving mechanisms in HZB, surface environmental data, such as monthly discharge, sediment load, and wind speed, were collected for the period from 2003 to 2024. Due to the unavailability of 2024 records, the monthly discharge and sediment load of the Yangtze River and Qiantang River were obtained (up to 2023) from the China River Sediment Bulletin (http://mwr.gov.cn/zzsc/tjgb/zghlnsgb/, last accessed on 9 August 2025). To ensure temporal consistency with the discharge and sediment load data, the time series of TSM used in the subsequent correlation analyses were also limited to the period of 2003–2023. Monthly average wind speeds at a height of 10 m were obtained from the CCMP dataset, with a spatial resolution of 0.25° × 0.25° (http://www.remss.com/measurements/ccmp/, last accessed on 9 August 2025).

2.3. Atmospheric Correction Method

Atmospheric correction (AC) is the process of retrieving the water-leaving reflectance from the top-of-atmosphere (TOA) reflectance, ρ t λ , measured by the satellite sensor. The water-leaving reflectance ( ρ w λ ) is then converted to R r s to derive the water color products, such as TSM, according to:
R r s λ = ρ w λ π · t s λ
where t s λ is the diffuse transmission coefficient from the sun to the sea surface.
In this process, when avoiding the sun glint area and empirically removing white cap reflectance on the sea surface [32,33,34,35,36], the total reflectance ρ t λ measured at a wavelength λ can be decomposed into different contributions simply as follows [37,38]:
ρ t λ = ρ r λ + ρ a λ + t λ ρ w λ
where ρ r ( λ ) is the Rayleigh reflectance due to air molecules, ρ a ( λ ) is the aerosol reflectance (including Rayleigh–aerosol interactions) due to aerosol particles, ρ w ( λ ) is the water-leaving reflectance [37,39,40,41,42], and t ( λ ) is the diffuse transmittance at the sensor viewing angle [43]. To derive ρ w ( λ ) , the atmospheric effects, i.e., ρ r ( λ ) and ρ a ( λ ) , are removed. The standard atmospheric correction algorithm computes ρ r ( λ ) from Rayleigh lookup tables with the inputs of the solar-sensor geometry, atmospheric pressure, and wind speed [39,40,41,44,45].
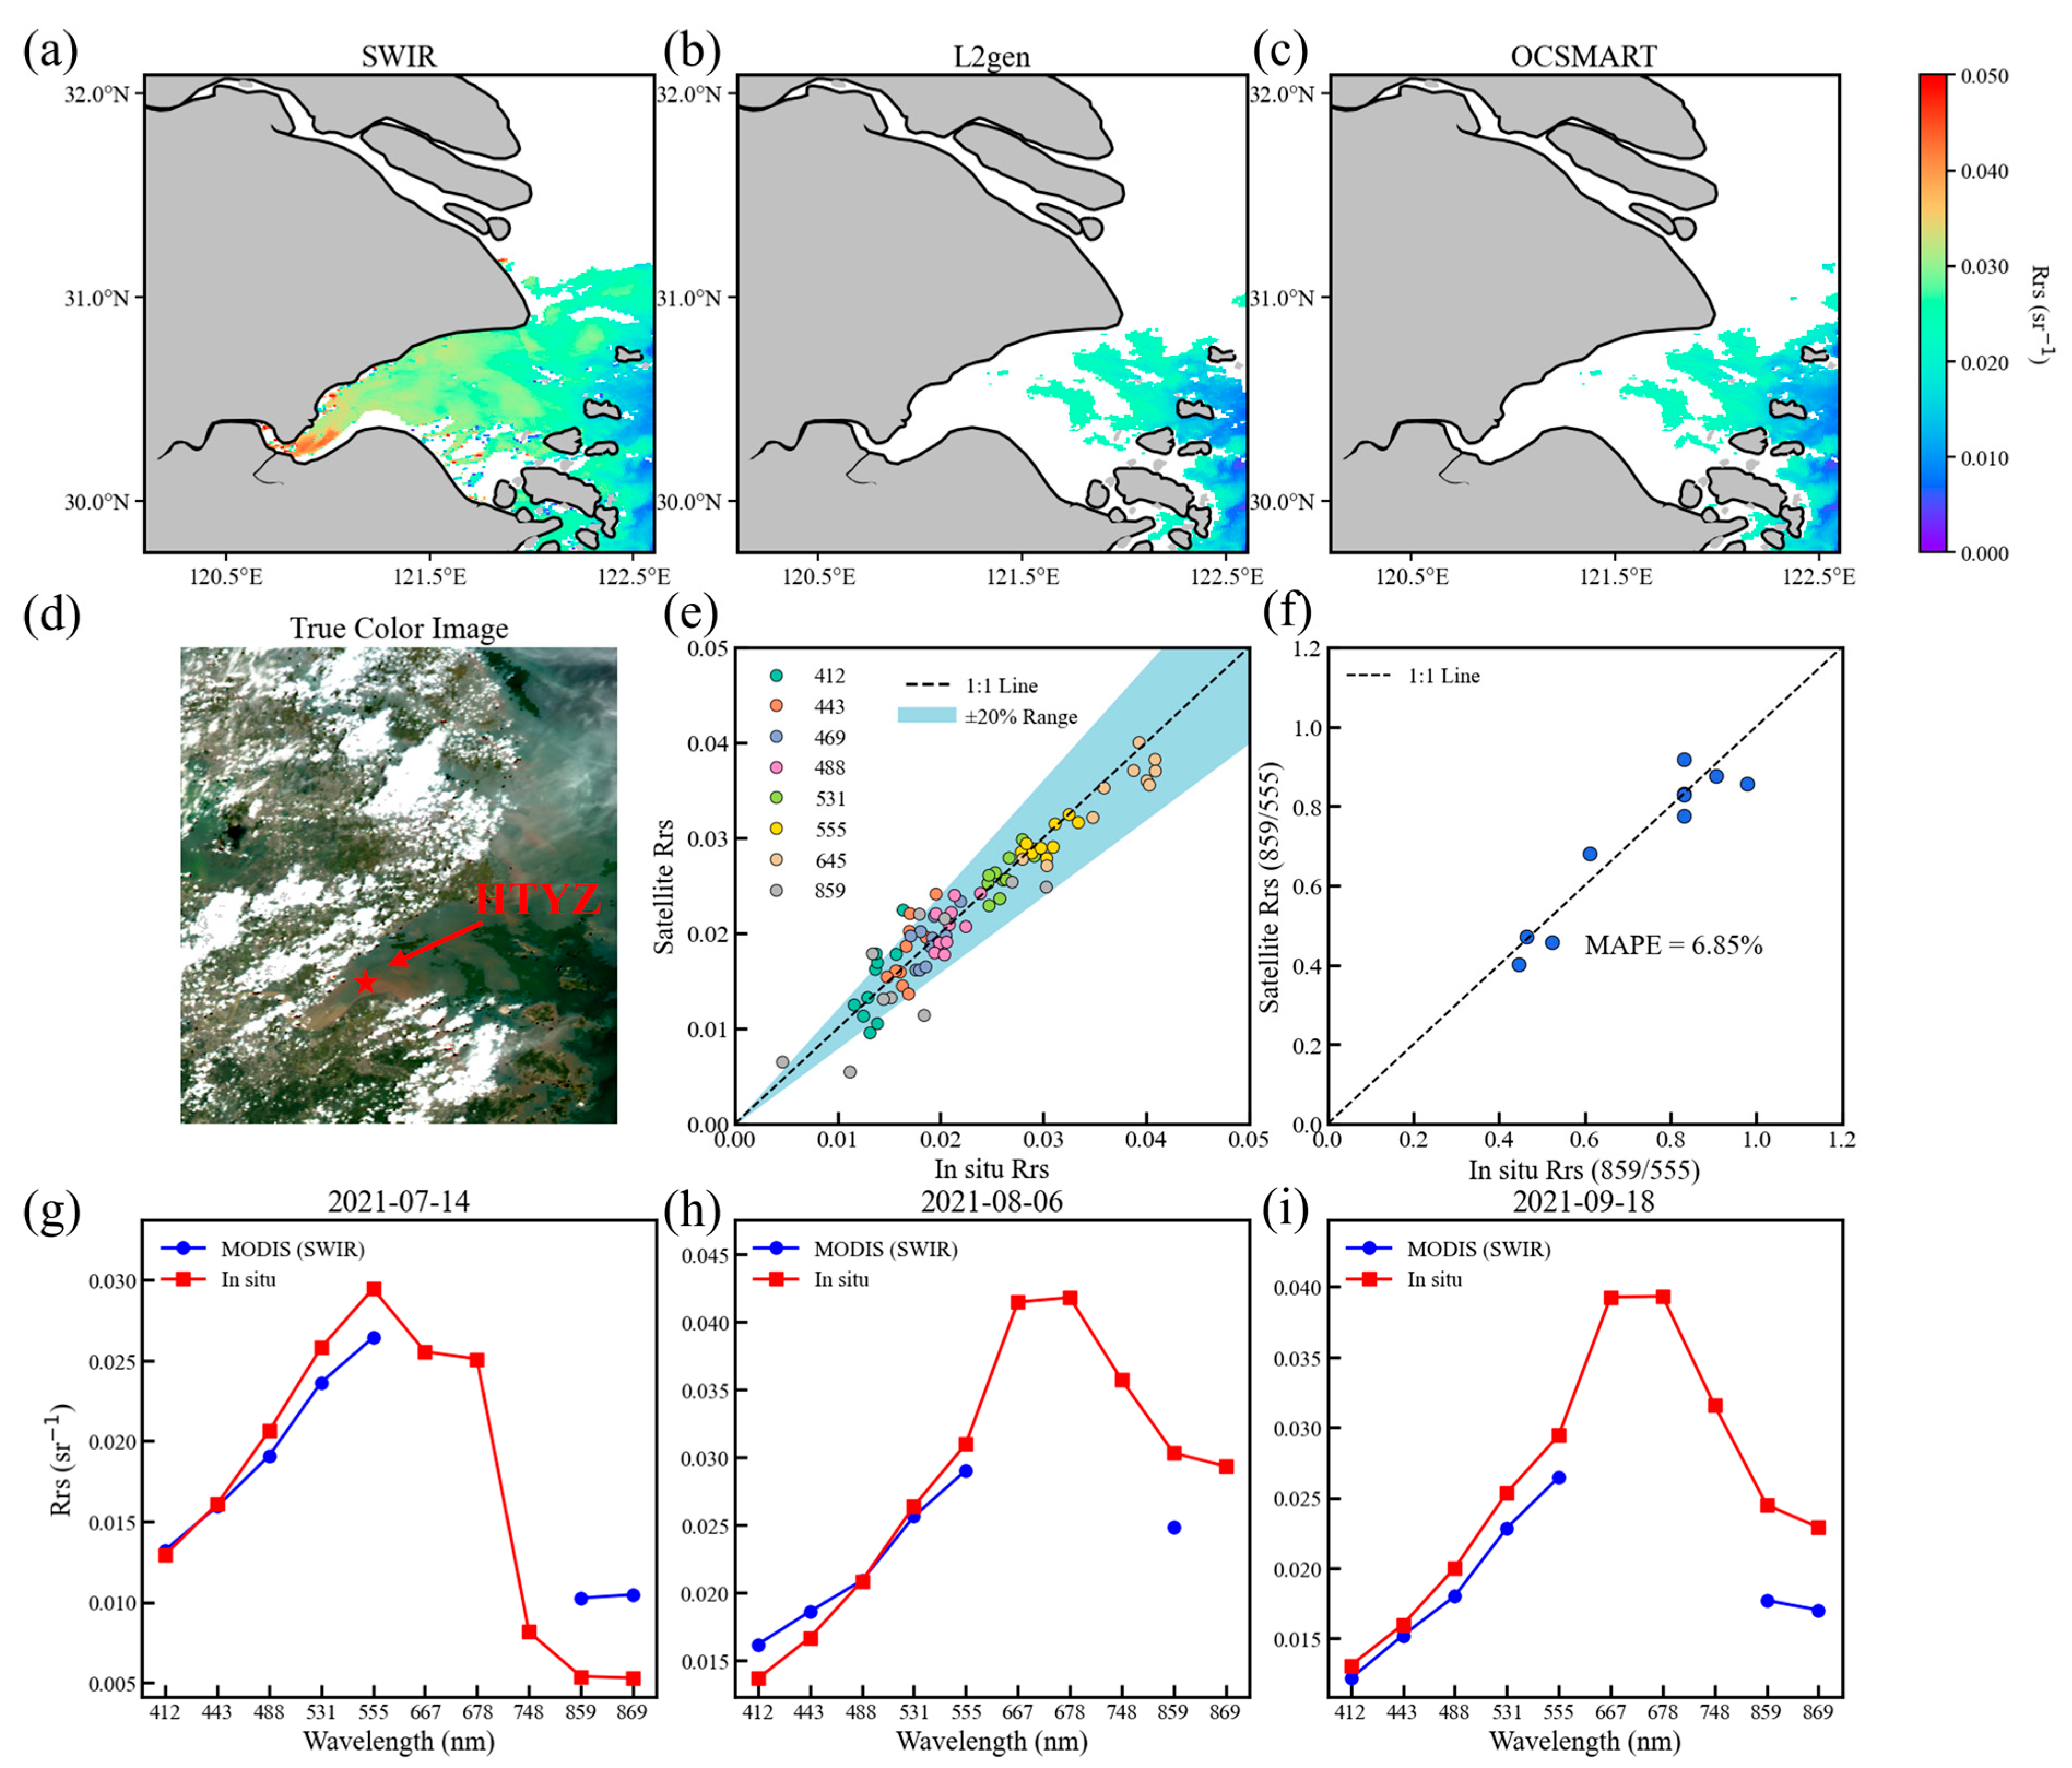
For open ocean water, the AC algorithm estimates ρ a ( λ ) with the assumption of negligible water-leaving reflectance (black ocean approximation) at two NIR wavelengths [46]. For turbid coastal waters, the black ocean approximation becomes quickly invalid because ρ a ( λ ) at NIR wavelengths can be significant [47,48,49]. This makes the standard atmospheric correction algorithm invalid in HZB water. An alternative AC algorithm was proposed by He et al. (2012) [50] using the ultraviolet (UV) wavelength for turbid waters, but it is not suitable for MODIS data due to the absence of UV bands. Another AC algorithm, developed by Wang and Shi (2007) [51], estimates ρ a ( λ ) using two SWIR bands (1240 nm and 2130 nm for MODIS), where the black ocean assumption may still hold, and then obtains ρ w ( λ ) in the visible bands by extrapolation, from which R r s ( λ ) is subsequently derived using Equation (2). In addition, Wang et al. (2009) [52] developed an NIR-SWIR-based AC algorithm based on the turbidity level, which effectively combines the strengths of both SWIR-based and NIR-based AC methods. Before atmospheric correction, turbid water detection is performed using the turbid water index criterion. The SWIR-AC algorithm is applied to identify turbid water pixels, whereas the standard NIR-AC algorithm is employed for non-turbid ocean waters. Recently, AC approaches have explored the application of machine learning under complex environmental conditions. For instance, the Ocean Color–Simultaneous Marine and Aerosol Retrieval Tool (OC-SMART) platform proposed a multilayer fully connected neural network (FCNN), combined with extensive radiative transfer simulations, to directly retrieve R r s from TOA radiances over coastal waters. In this study, three well-established atmosphere correction approaches, namely, SWIR-AC, L2gen from SeaDAS with the NIR-SWIR AC option, and OC-SMART, were employed on the MODIS/Aqua data. The performance of the three atmosphere correction algorithms was validated by comparing the satellite-derived R r s ( λ ) at 555 nm (Figure 3a–c).
Both L2gen and OC-SMART yielded numerous invalid retrievals, which necessitated masking out the affected pixels during the atmospheric correction process (Figure 3b,c). Thus, the SWIR-AC method was applied to the MODIS data to correct the atmospheric effects. The satellite-derived R r s values were matched with in situ R r s data of HTYZ during 2021, and the fitting results are shown in Figure 3e. To further assess the performance of the SWIR-AC algorithm, the MODIS-retrieved and in situ R r s data were compared across ten spectral bands in the visible and near-infrared range at HTYZ on three dates: 14 July, 6 August, and 18 September 2021 (Figure 3g–i). In general, the MODIS-retrieved R r s matched the in situ values well in both quantity and spectral shape.
To evaluate the specific correction effect of the SWIR-AC algorithm, the root mean squared errors (RMSEs) and mean absolute percentage errors (MAPEs) of the R r s products were calculated through Equations (4) and (5). Although there is a slight underestimation at 645 nm, the RMSE values across all bands remain below 0.005 and the MAPE values below 24%, suggesting that the SWIR-AC algorithm performs well overall (Table 1).
R M S E = i = 1 N R r s c o r r e c t e d , i R r s i n s i t u , i 2 N
M A P E = 100 % n i = 1 n R r s i n s i t u , i R r s c o r r e c t e d , i R r s i n s i t u , i

2.4. Description of the TSM Retrieval Algorithm

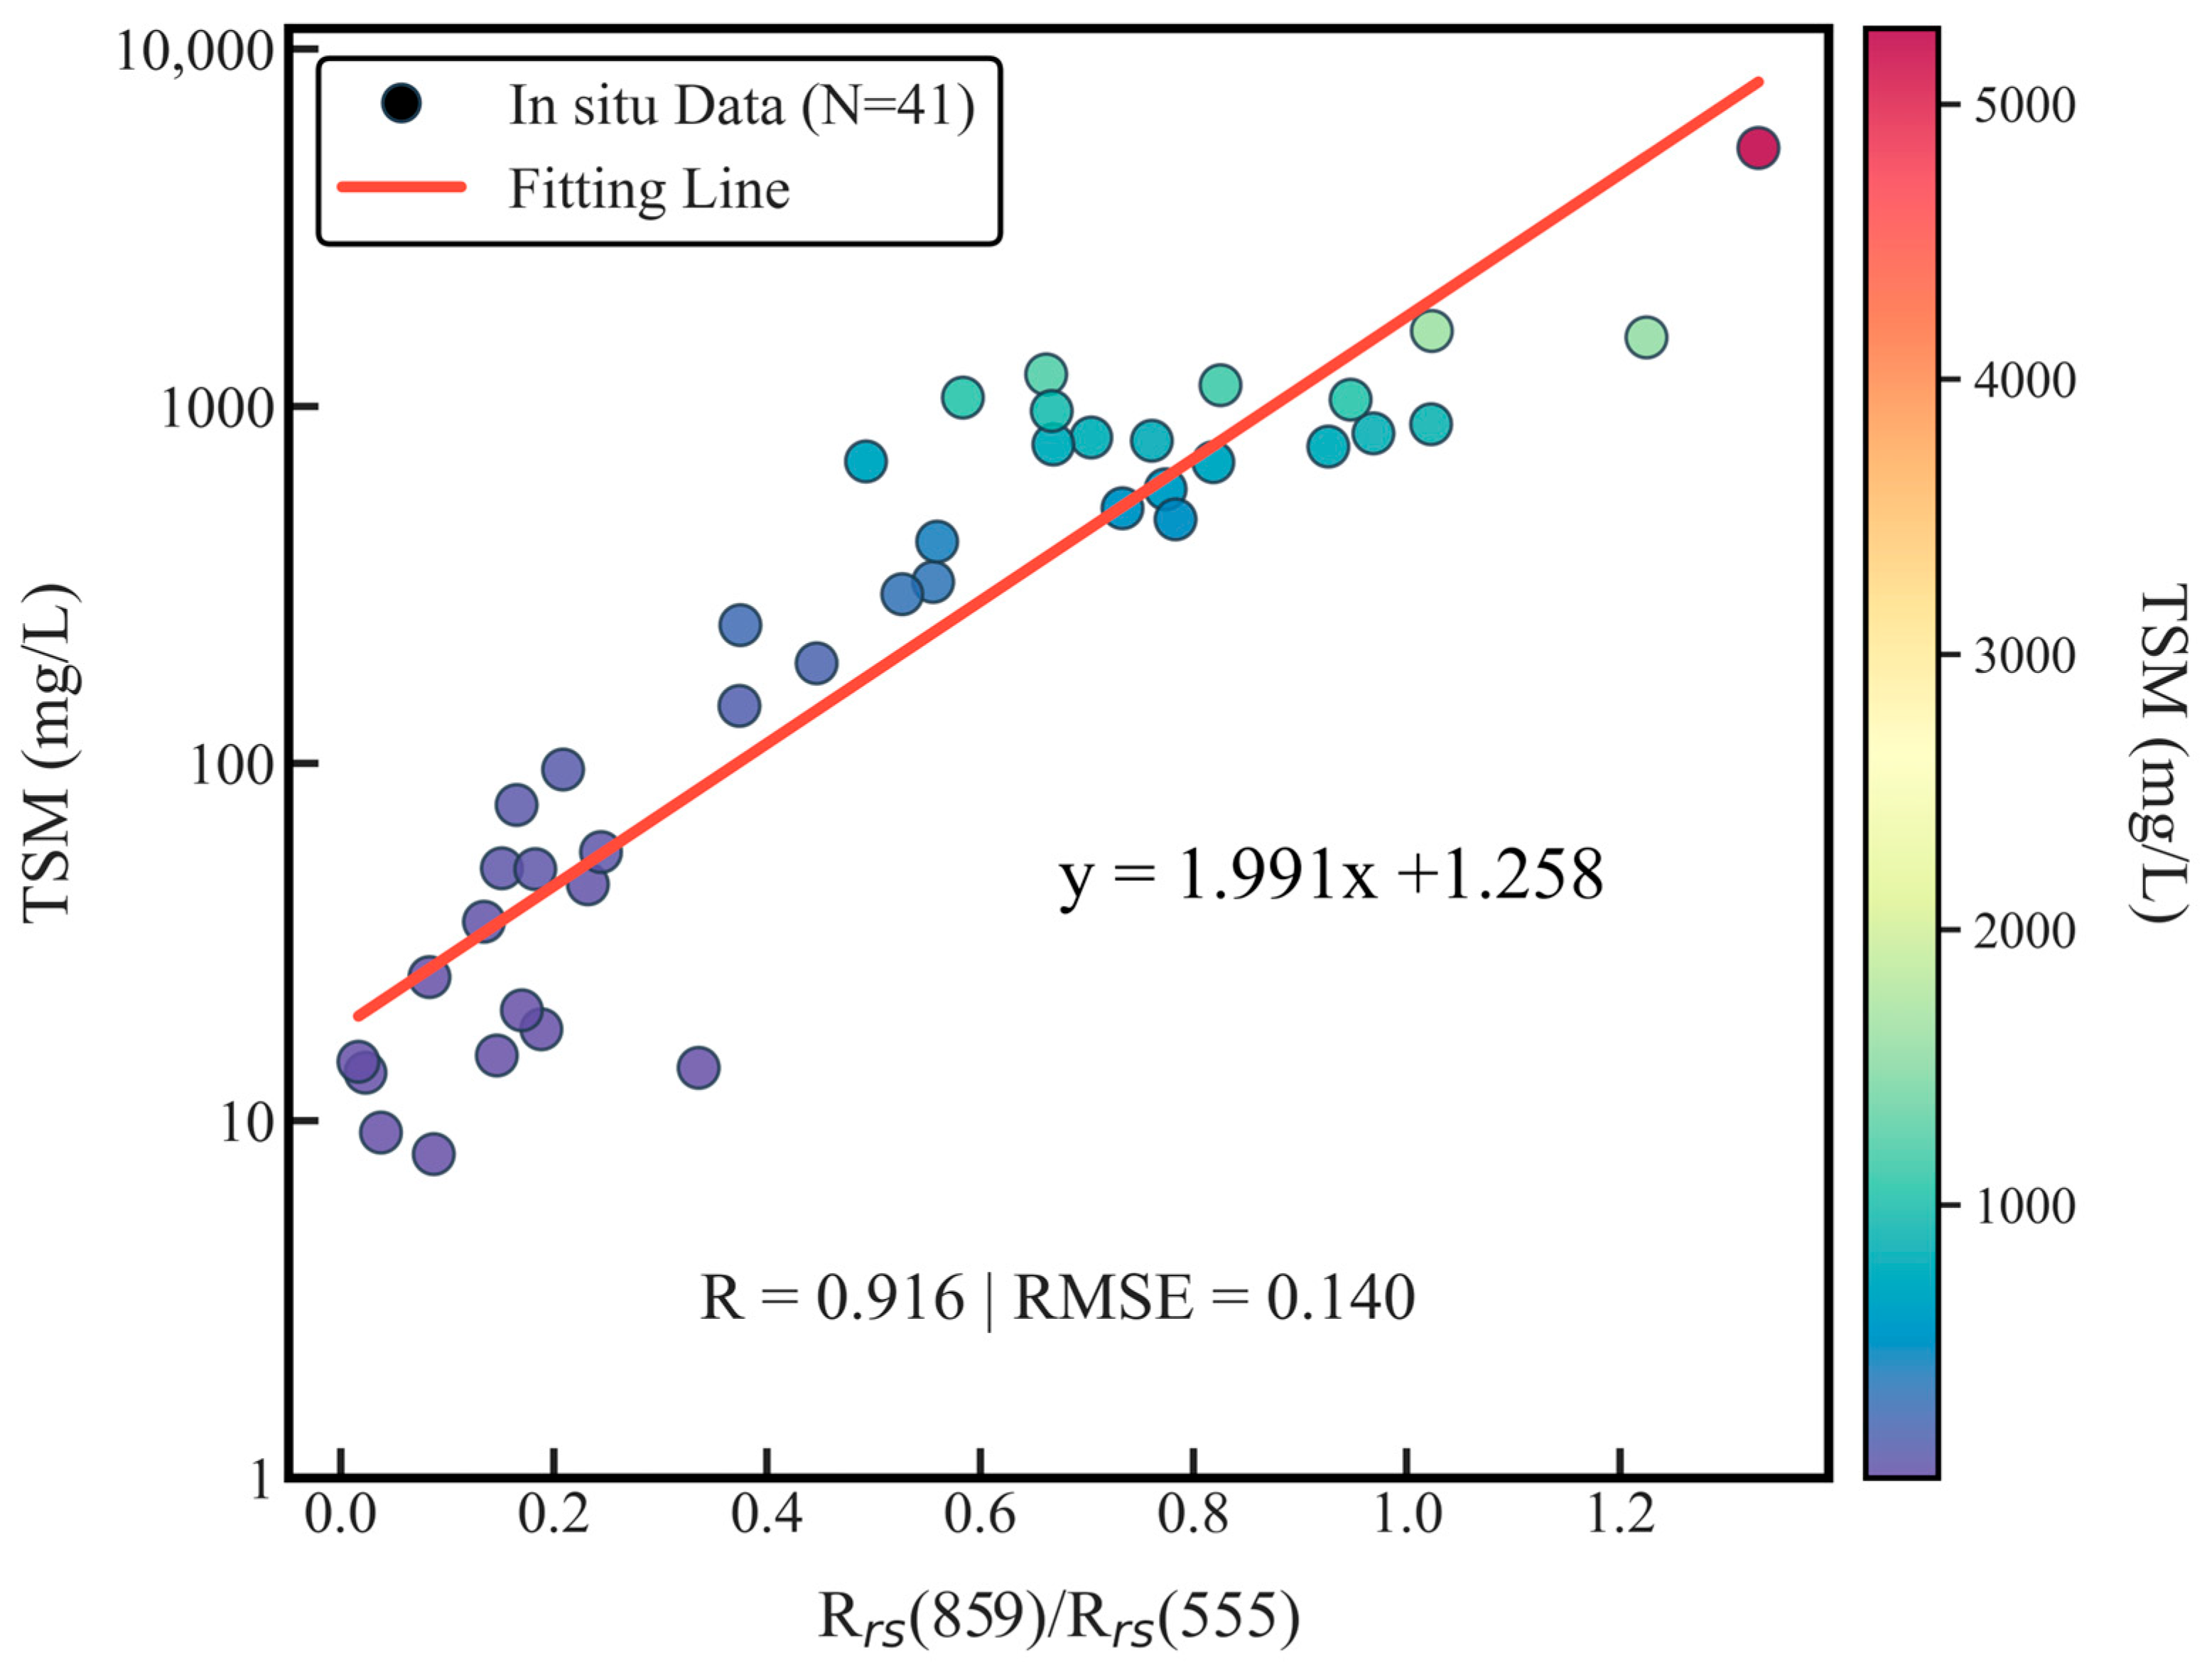
Over the past decades, several empirical algorithms for TSM concentration were reported using single or combined visible band reflectance data, but their applicability is limited in extremely turbid waters, such as the Changjiang River Estuary and HZB [53,54]. To overcome this limitation, Bai et al. (2010b) [27] established good linear relationships between TSM and the R r s band ratio of the near-infrared (779 nm) and visible (560nm) bands for HZB water from MERIS (Medium Resolution Imaging Spectrometer) data. Similarly, He proposed an empirical model between TSM and the R r s band ratio of 745 nm and 490 nm bands for moderate to extreme turbid waters of the Changjiang River Estuary and HZB (TSM from 8 mg/L to 5275 mg/L) from GOCI (Geostationary Ocean Color Imager) data. Considering 1 km resolution MODIS NIR saturation (745 and 869 nm) in highly turbid waters, the 500 m resolution 859 nm band was selected as a substitute in this study. Using the in situ data of R r s and TSM reported by Bai et al. (2010a) [27] and He et al. (2013) [17], we developed an empirical algorithm for a wide range of TSM concentrations in HZB (8~5300 mg/L) (Figure 4). This algorithm relies on MODIS R r s ( 859 ) and R r s ( 555 ) data to estimate TSM concentrations using the following equation:
T S M = 10 1.991 × R a t i o + 1.258
R a t i o = R r s 859 R r s 555
While SWIR-AC-retrieved R r s ( 859 ) showed a relatively high MAPE (23.60%) compared to the in situ measurements (Table 1), the impact on TSM retrieval was minimal. This is because the proposed TSM algorithm uses the spectral ratio R r s ( 859 ) / R r s ( 555 ) , which demonstrated significantly lower error (MAPE = 6.85%, Figure 3f). The ratio-based approach effectively reduces atmospheric correction error propagation, ensuring the robustness and reliability of derived TSM products.

3. Results

3.1. TSM Retrieval Algorithm Validation

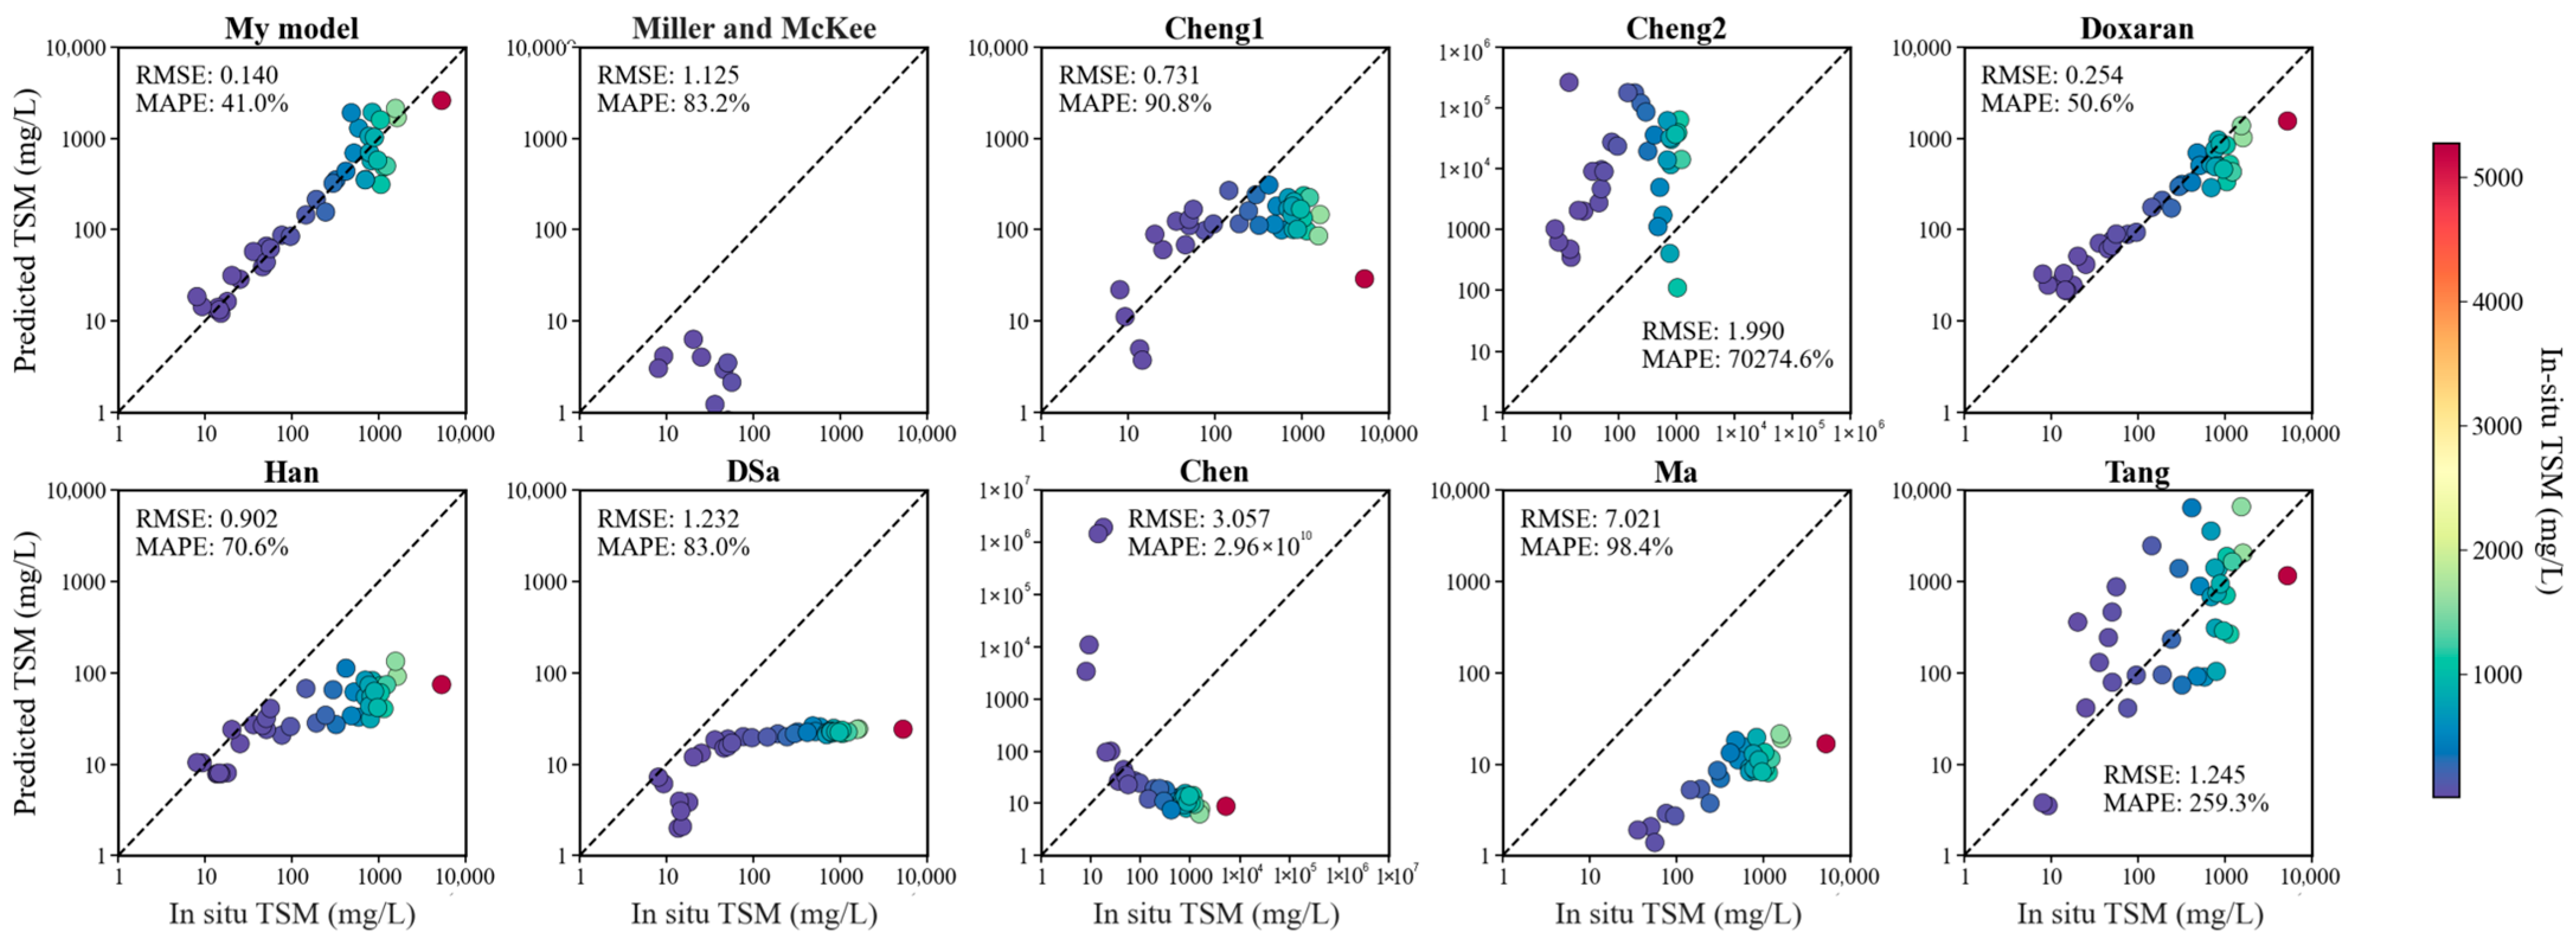
For comparative validation, nine other empirical TSM algorithms constructed by Miller and McKee [55], Cheng et al. [56], Doxaran et al. [57], Han et al. [58], D’Sa et al. [59], Chen et al. [60], Ma et al. [61], and Tang et al. [62] were also applied to the same dataset. The formulas of these algorithms are summarized in Table 2. Their performances were evaluated by comparing the algorithm-derived TSM with in situ measured TSM concentrations (Figure 5). The algorithms proposed by Miller and McKee [55], Cheng et al. [56], Han et al. [58], D’Sa et al. [59], Chen et al. [60], and Ma et al. [61] exhibit poor performance in HZB, which is characterized by high TSM concentrations, with RMSE exceeding 0.7 and MAPE over 83%. Doxaran’s algorithm overestimates TSM at low concentrations, while Tang’s algorithm shows larger deviations (RMSE = 1.245, MAPE = 259.3%) than our model (RMSE = 0.140, MAPE = 41.0%). Overall, the model proposed in this study has better accuracy and is more suitable for retrieving TSM in HZB.
Using MODIS/Aqua derived R r s data from 2003 to 2024, a long-term TSM dataset for HZB waters was obtained. Note that that TSM concentrations exceeding 5300 mg/L were considered anomalies and excluded from the analysis according to previous studies [17,27,50]. Based on this dataset, the spatiotemporal distribution patterns and long-term trends were analyzed.

3.2. Spatial Distribution of TSM in HZB

3.2.1. Long-Term Average Spatial Distribution

The SWIR-AC method and TSM retrieval algorithm were applied to MODIS/Aqua L1B data to derive the long-term average spatial distribution of TSM in HZB from 2003 to 2024 (Figure 6). The TSM concentrations are significantly higher in the upper reaches of the bay (>450 mg/L) and in shallow areas of Andong Shoal on the southern shore (>415 mg/L), while the TSM range is mostly at a lower level (<350 mg/L) in the region between Luchaogang and Jinshan on the northern shore. These variations are primarily influenced by underwater topography, coastal geometry, and tidal dynamics (Figure 1). The deep coastal trough near the northern shore reduces sediment resuspension, whereas Andong Shoal on the southern shore, with its flat topography and shallow water depth, experiences strong wave-driven sediment resuspension [63]. Additionally, high TSM at the northern part of the bay mouth near the Yangtze River Estuary and around the islands at the bay mouth may be influenced by the sediment load from the Yangtze River [2,64].

3.2.2. Long-Term Monthly Average Spatial Distribution

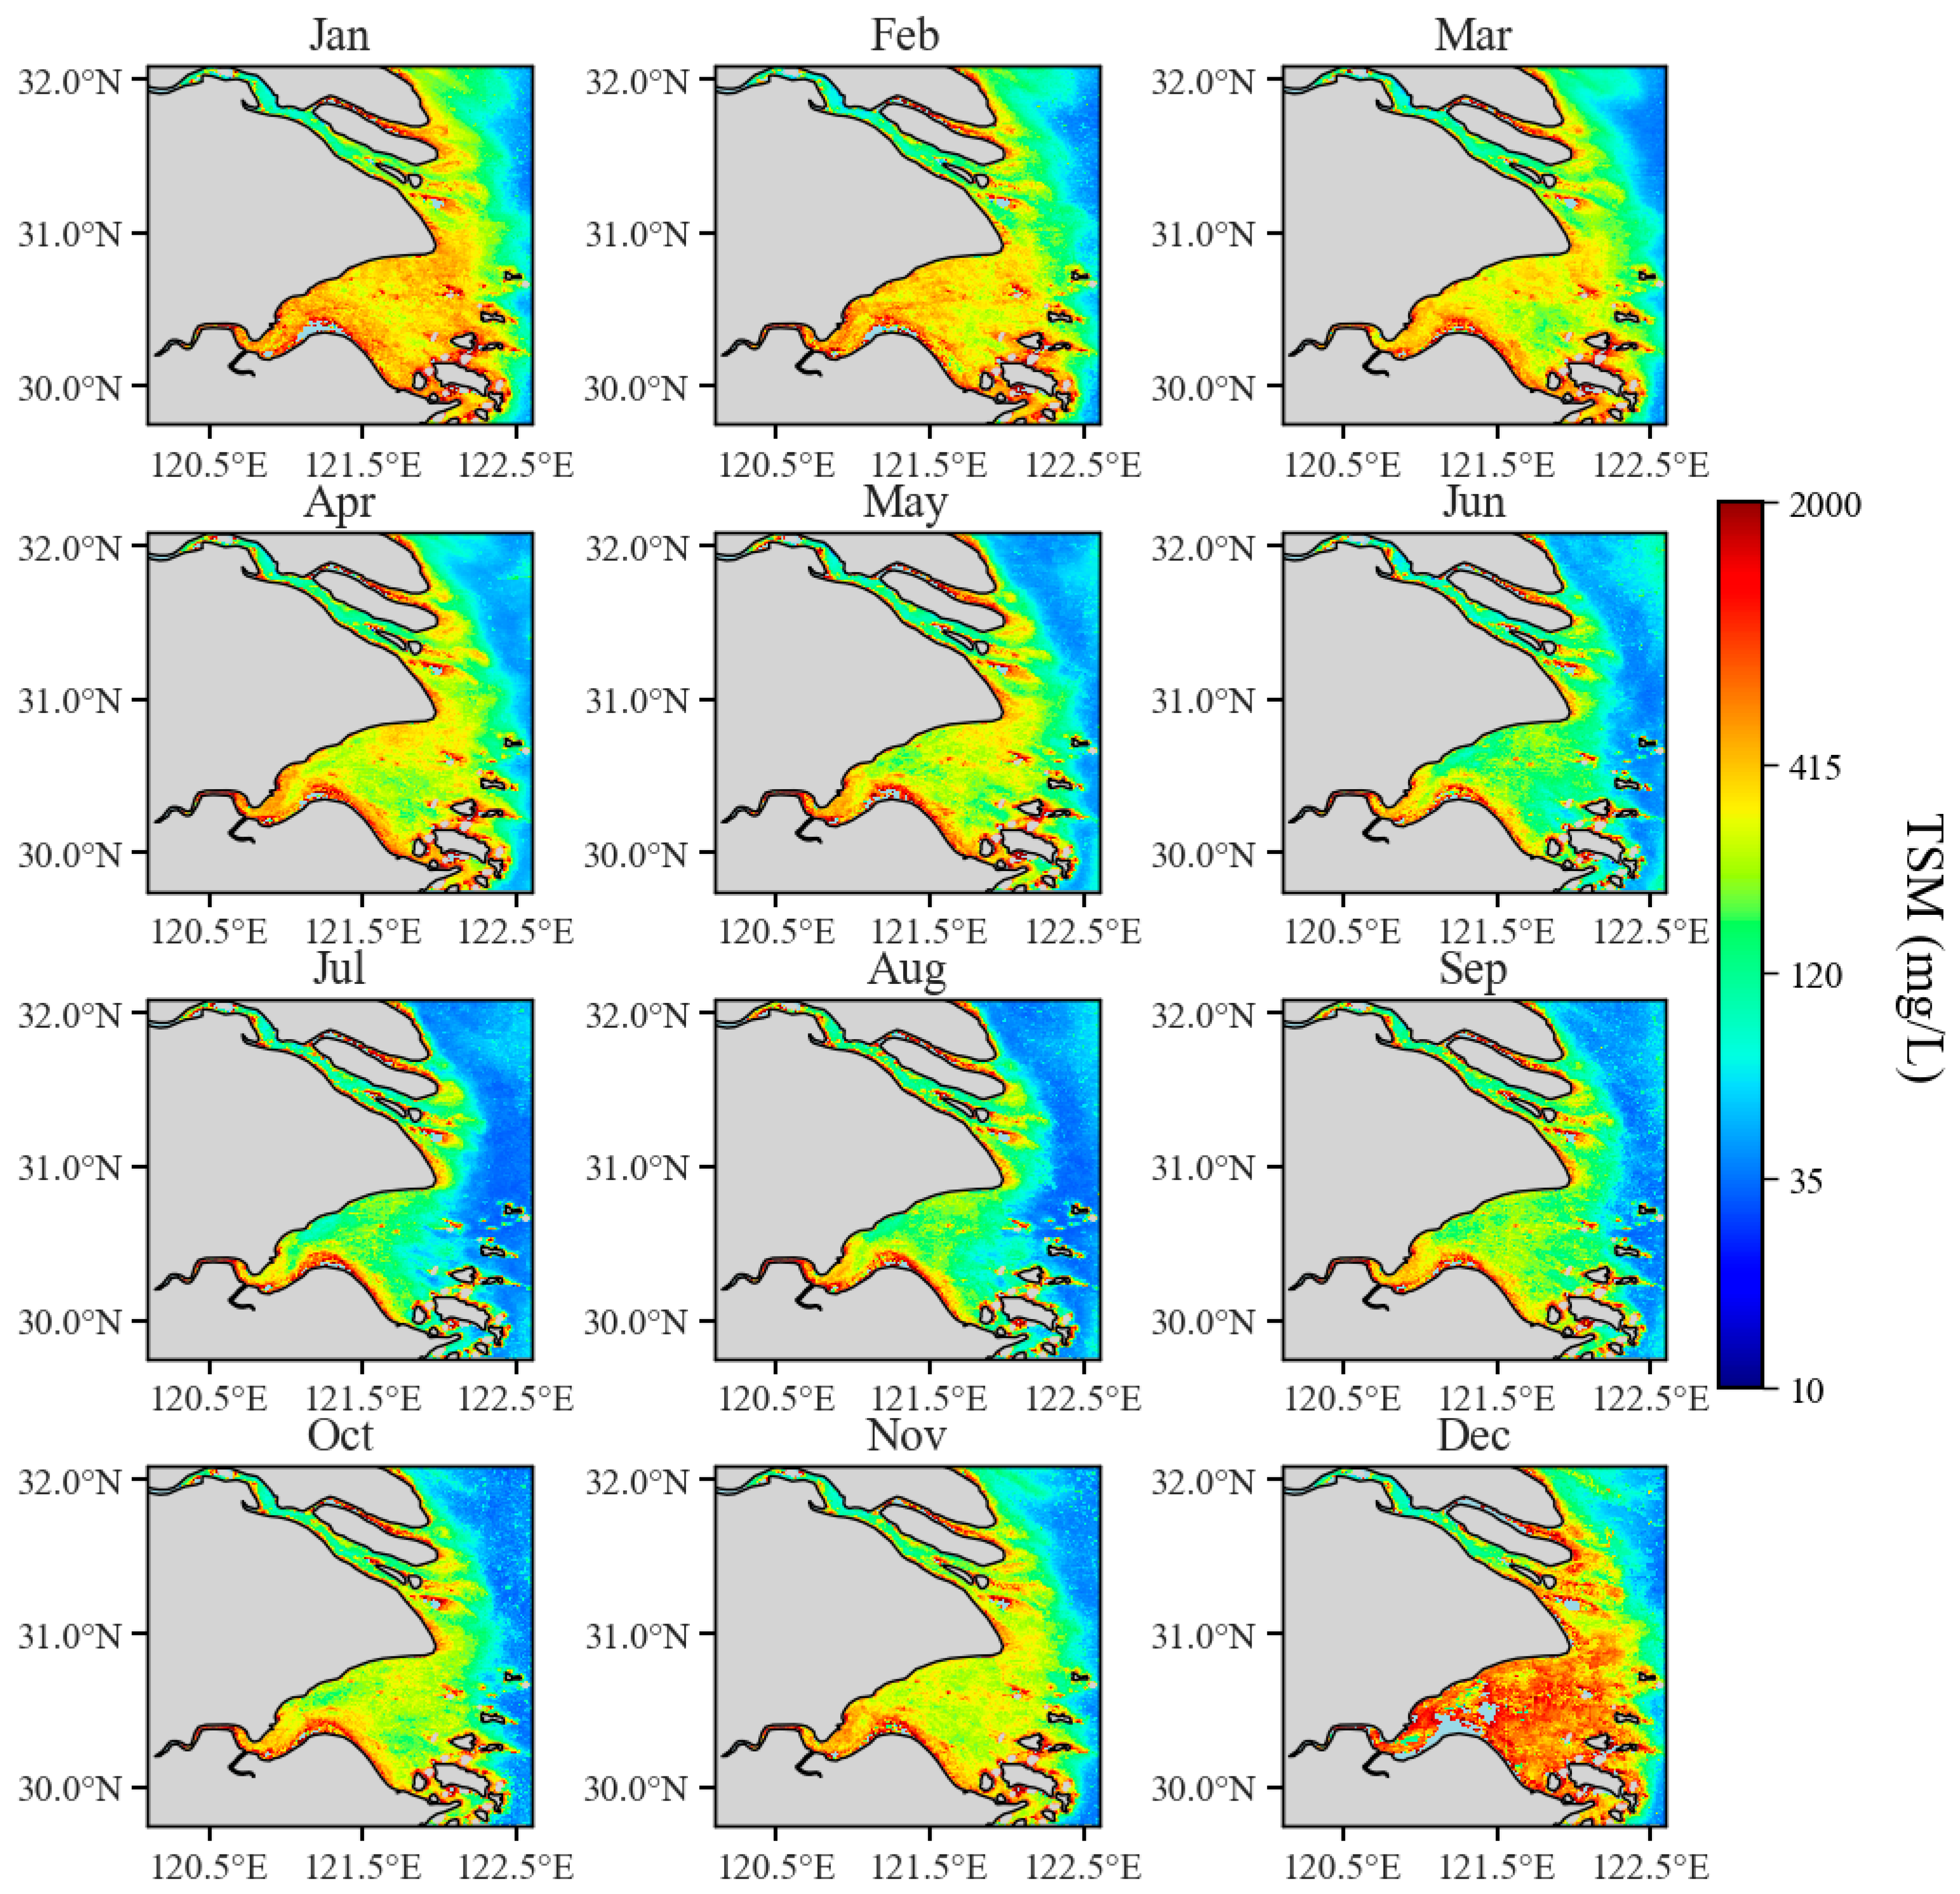
Monthly average TSM variations from 2003 to 2024 were analyzed (Figure 7, Table 3). Generally, monthly mean TSM in HZB ranges from 327.10 mg/L in July, when values reach their annual minimum, to 773.80 mg/L in December. In winter (December–February), the strong northeast monsoon enhances sediment resuspension, resulting in the highest TSM concentrations, particularly along the southern shore, where wave-driven turbulent conditions in shallow waters likely caused more resuspended sediments. Additionally, the high-concentration zone also extends further during winter. In spring (March–May), the monsoon weakens, leading to a general decrease in TSM concentration. While the high-concentration zone remains near the southern coast and islands at the bay mouth, its extent is significantly reduced compared to winter. In summer (June–August), despite the maximum discharge over the year, sediment loads from the Yangtze River are transported to the northeast direction instead of entering HZB [65]. Moreover, due to the weak southwest monsoon, sediment resuspension weakens, causing low TSM concentrations in HZB water, except for the south shore and islands at the mouth of the bay. In autumn (September–November), the northeast monsoon intensifies, causing strong sediment resuspension and a gradual rise in TSM. The high-TSM zone expands, and the distribution pattern transitions towards that of winter [2,19]. Due to high cloud coverage in winter, data in December are available for only a few years, but the available data reliably capture the spatial patterns of TSM.

3.3. Long-Term Changes in TSM in HZB

3.3.1. Long-Term Changes in Annual Mean TSM in HZB

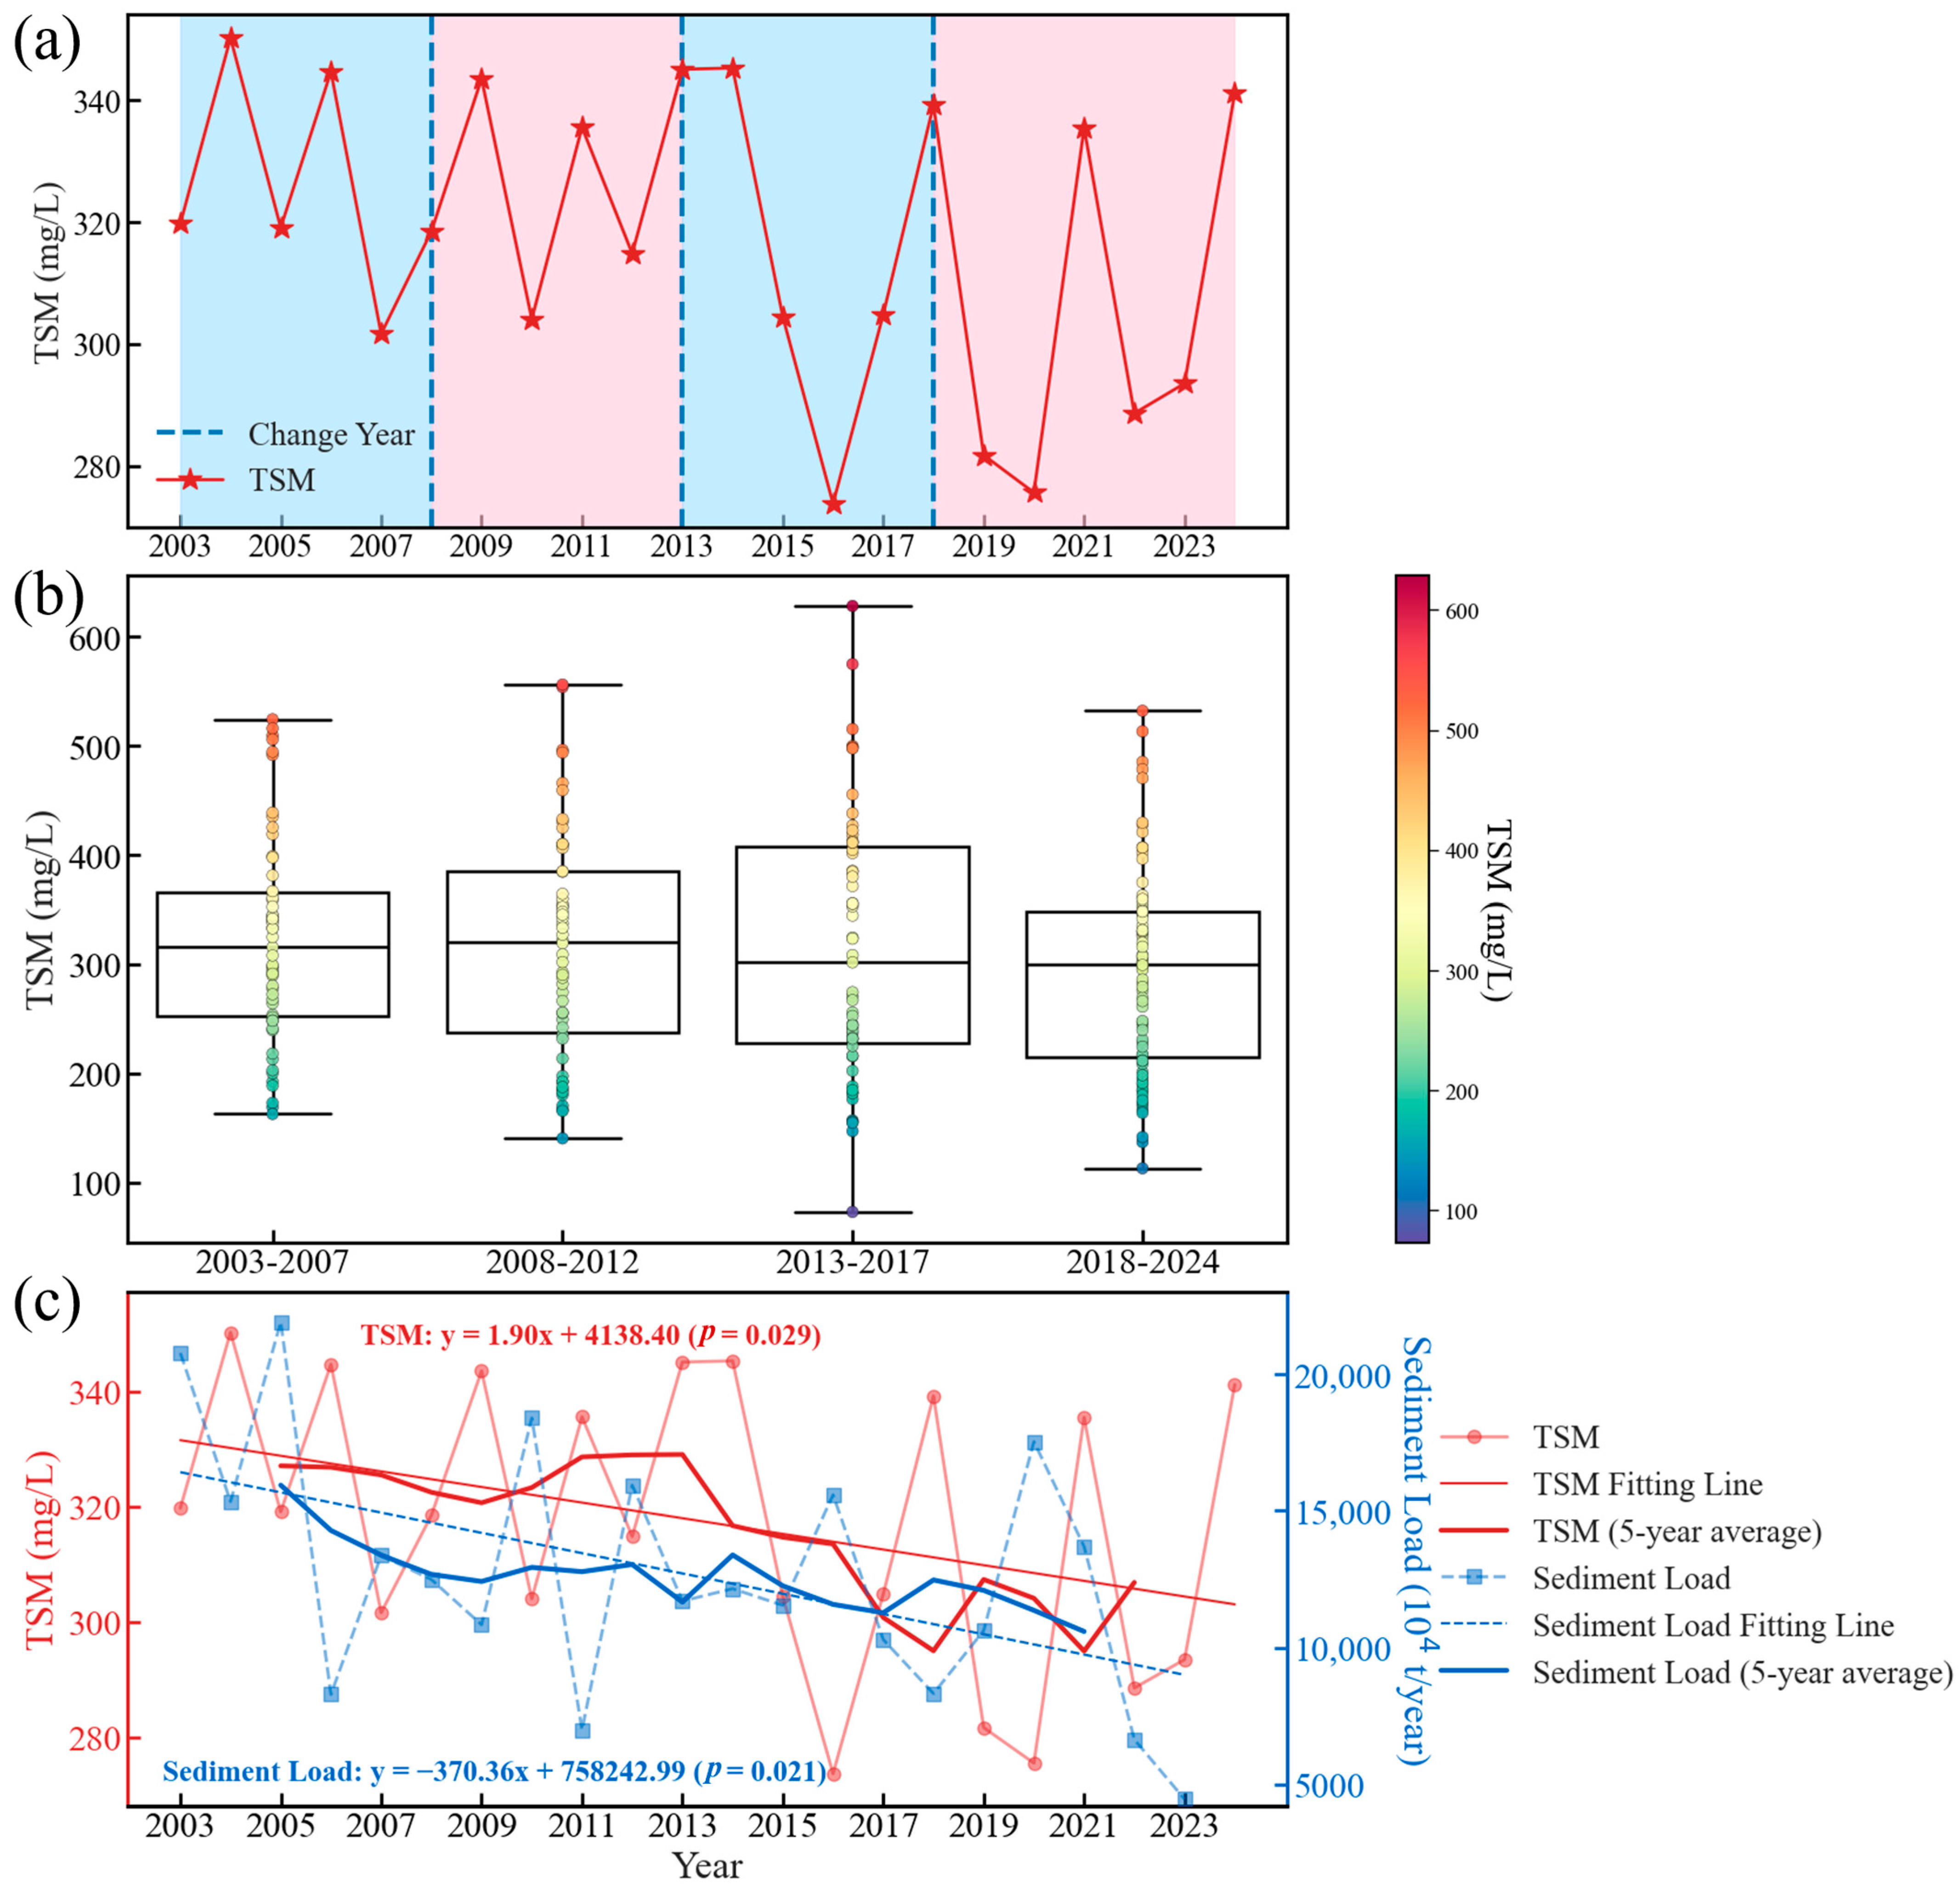
To detect TSM dynamics over the past two decades, we employed the Python (v3.9.16) package ruptures (v1.1.10) [66], which provides algorithms for the detection of change points in time series data. The algorithms combine a cost function, a search method, and a constraint on the number of changes. Based on this package, we selected the Pruned Exact Linear Time (PELT) algorithm, using a radial basis function (rbf) cost model and a penalty value of 0.01, to detect change points in the annual mean TSM data from 2003 to 2024. PELT is a dynamic programming-based algorithm known for its high efficiency and ability to identify change points. The penalty value controls the sensitivity of the algorithm to the number of change points, with a lower penalty leading to more change points. Three change points were detected in the years 2008, 2013, and 2018 (Figure 8a). Based on this result, the MODIS/Aqua-derived TSM data were grouped into four sub-periods (2003–2007, 2008–2012, 2013–2017, and 2018–2024), and the distribution patterns were analyzed using box plots (showing median, quartiles, and outliers). As shown in Figure 8b, the median TSM in HZB notably decreased from the period 2008–2012 to the period 2013–2017. Additionally, the minimum TSM consistently decreased across the time intervals (2003–2007, 2008–2012, and 2013–2017). For quantitative analysis, we extracted the annual mean TSM values in HZB and collected the annual sediment discharge from the Yangtze River during 2003–2024 (Figure 8c). Both these variables exhibit significant decreasing trends, with a rate of TSM decline of 1.90 mg/L·year−1 (p = 0.029) and a decrease in sediment discharge of 370.36 × 10⁴ t/year (p = 0.021). To better highlight long-term trends and reduce interannual fluctuations, a centered five-year moving average was applied to both the annual mean TSM and sediment discharge. The smoothed curves further displayed their consistent decreasing trends over the past two decades. These findings indicate that the reduction in TSM in HZB is likely associated with a declining Yangtze River sediment load.
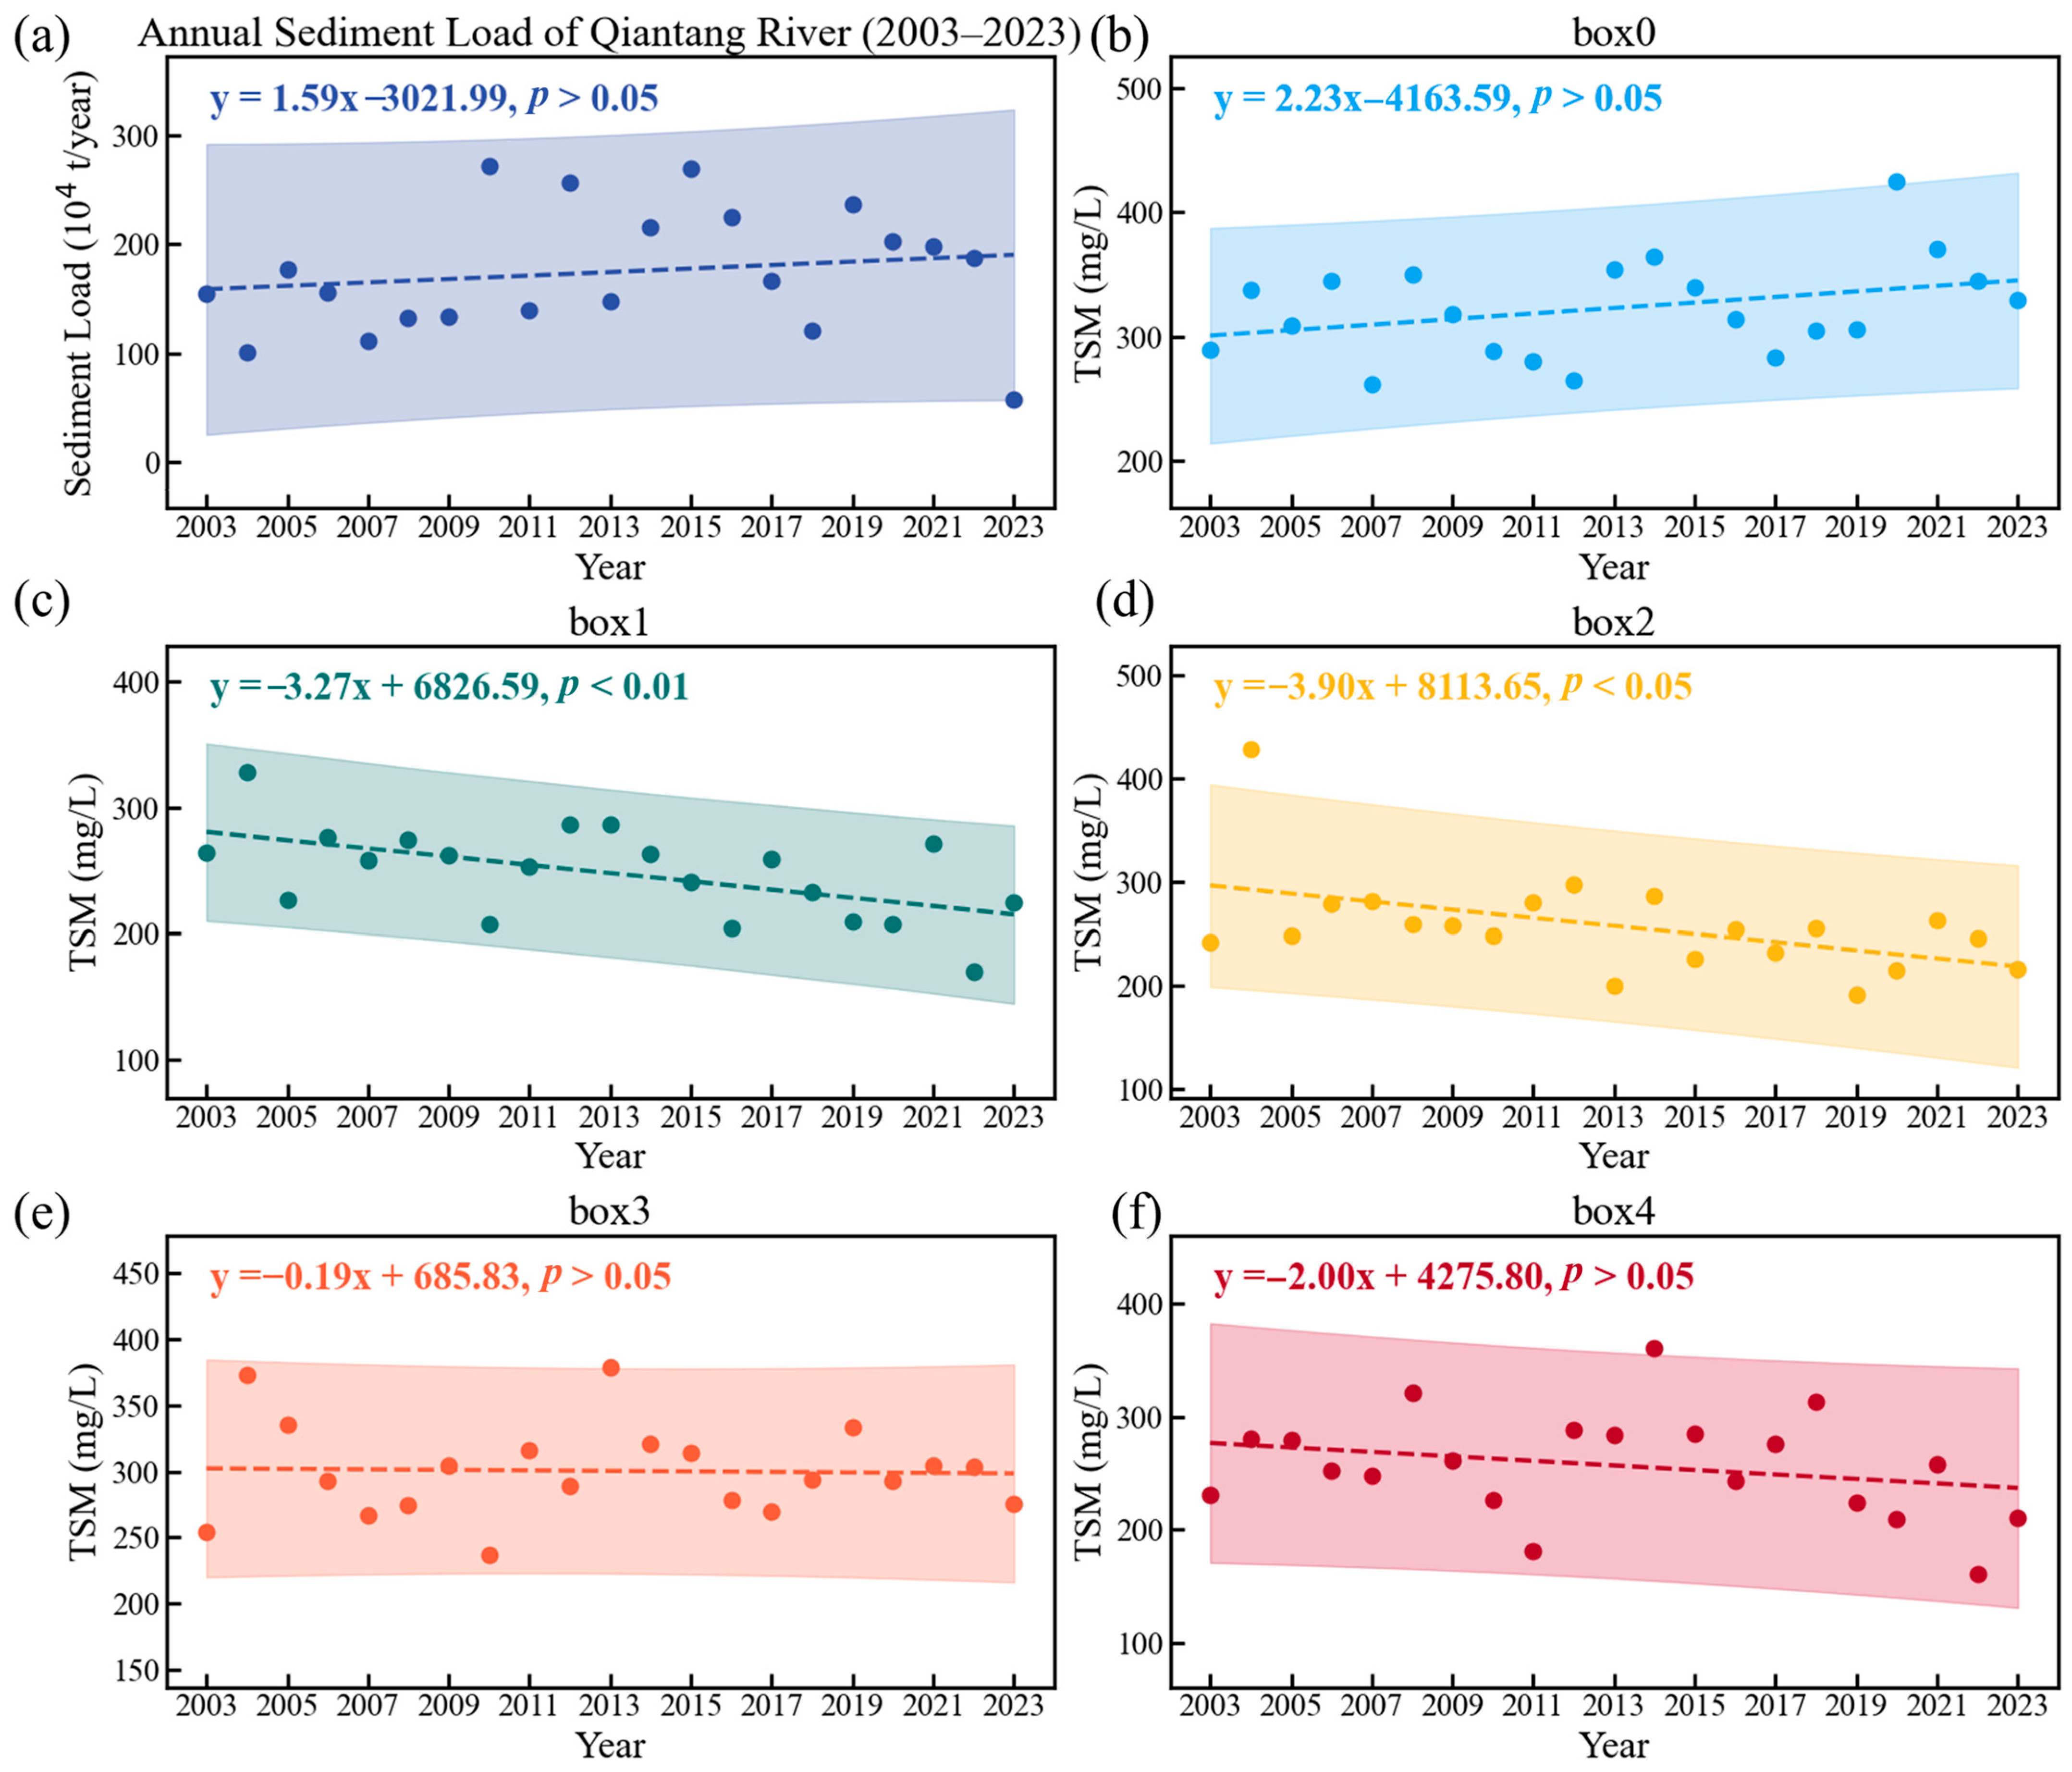
To further analyze the long-term trend in TSM changes across specific areas of HZB, we selected five representative locations from the upper bay to the bay mouth and calculated the monthly mean TSM values for each year (Figure 1). These locations were chosen based on the spatial distribution patterns of TSM shown in Figure 6, capturing different topographic and TSM conditions across the bay. As shown in Figure 9c–f, the TSM concentrations at the north shore display a significant decreasing trend (p < 0.05) and little variation in the middle and south shores and northern entrance of HZB, which are consistent with the decreasing trend of sediment load from the Yangtze River (Figure 8b). This decline in sediment load inputs is directly related to the construction of the Three Gorges Dam, which reduced the sediment load movements entering HZB and thereby decreased the TSM concentrations. However, TSM at the top of HZB (Figure 9b) displays an observed increasing trend, though not statistically significant over the study period, possibly influenced by the increased sediment load of the Qiantang River (Figure 9a). The long-term regression analysis for TSM concentrations at each location detected these variations (Table 4).

3.3.2. Long-Term Changes in Seasonal Mean TSM in HZB

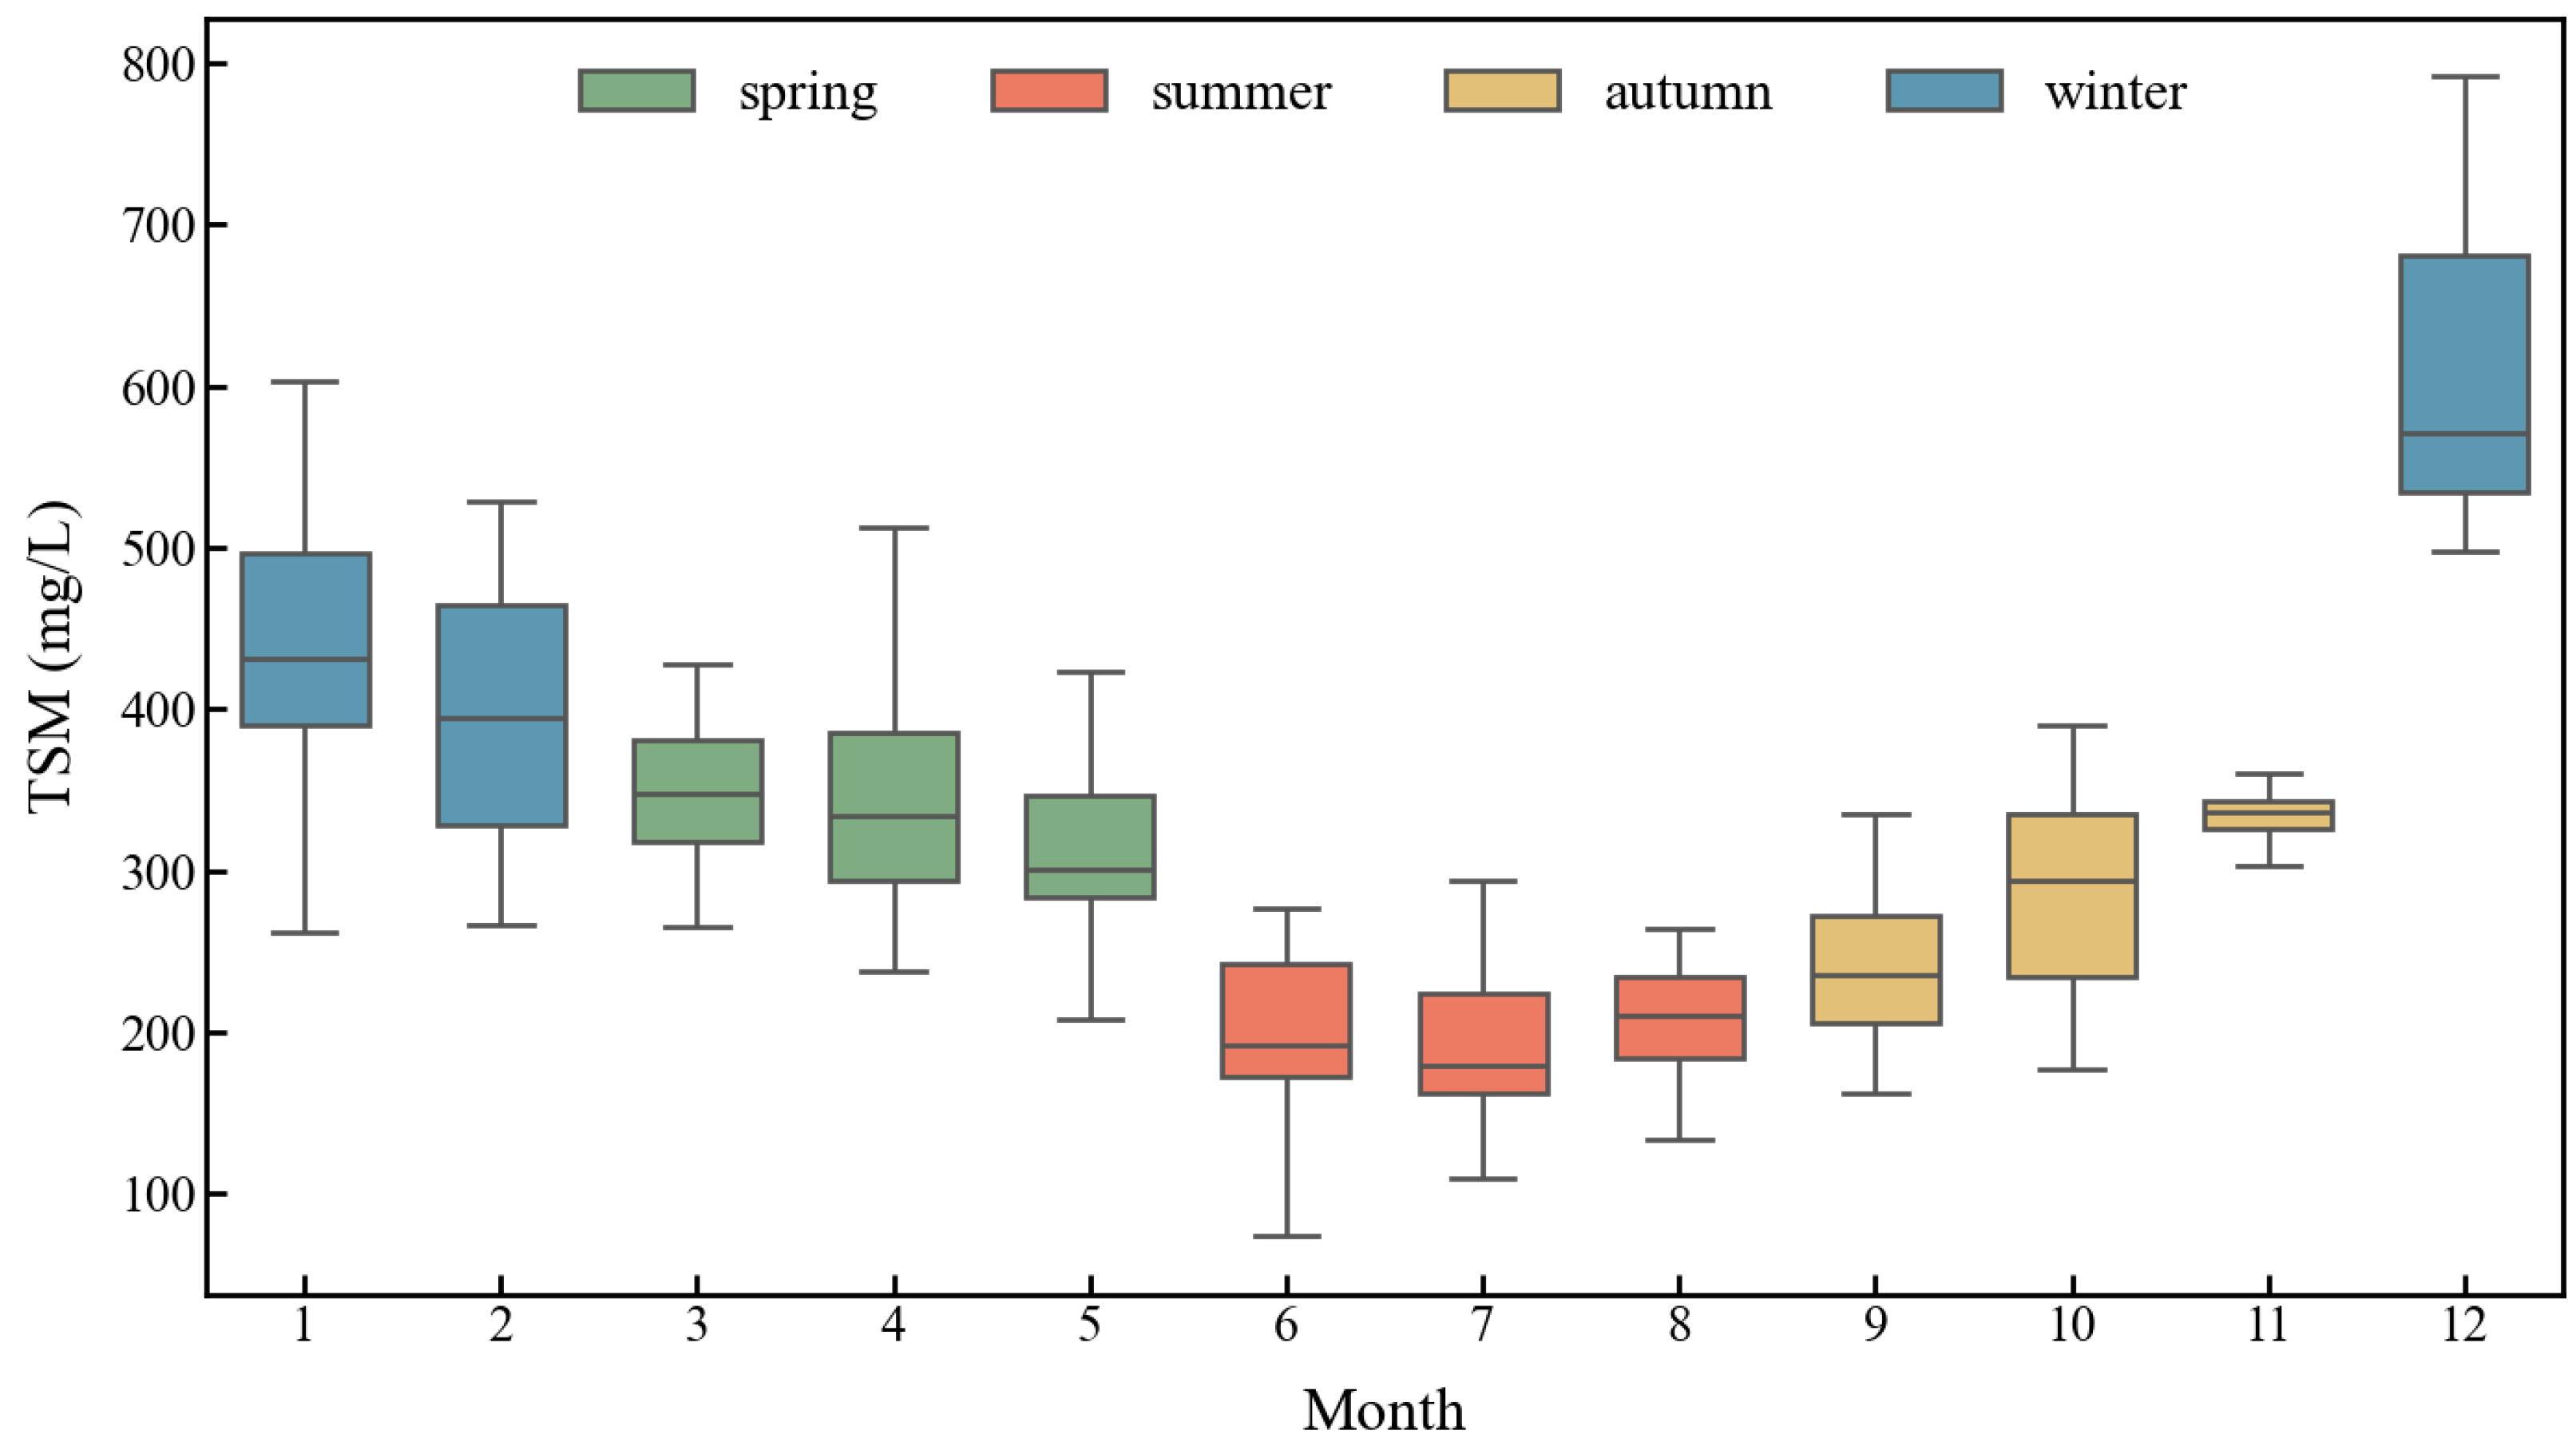
Further analysis of the TSM concentrations in HZB waters showed significant seasonal differences (Figure 10). The TSM concentration was the lowest in summer, with an average value of 200.70 mg/L, and the highest in winter, with an average value of 431.89 mg/. In spring and autumn, the TSM concentrations averaged 334.27 mg/L and 282.75 mg/L, respectively.
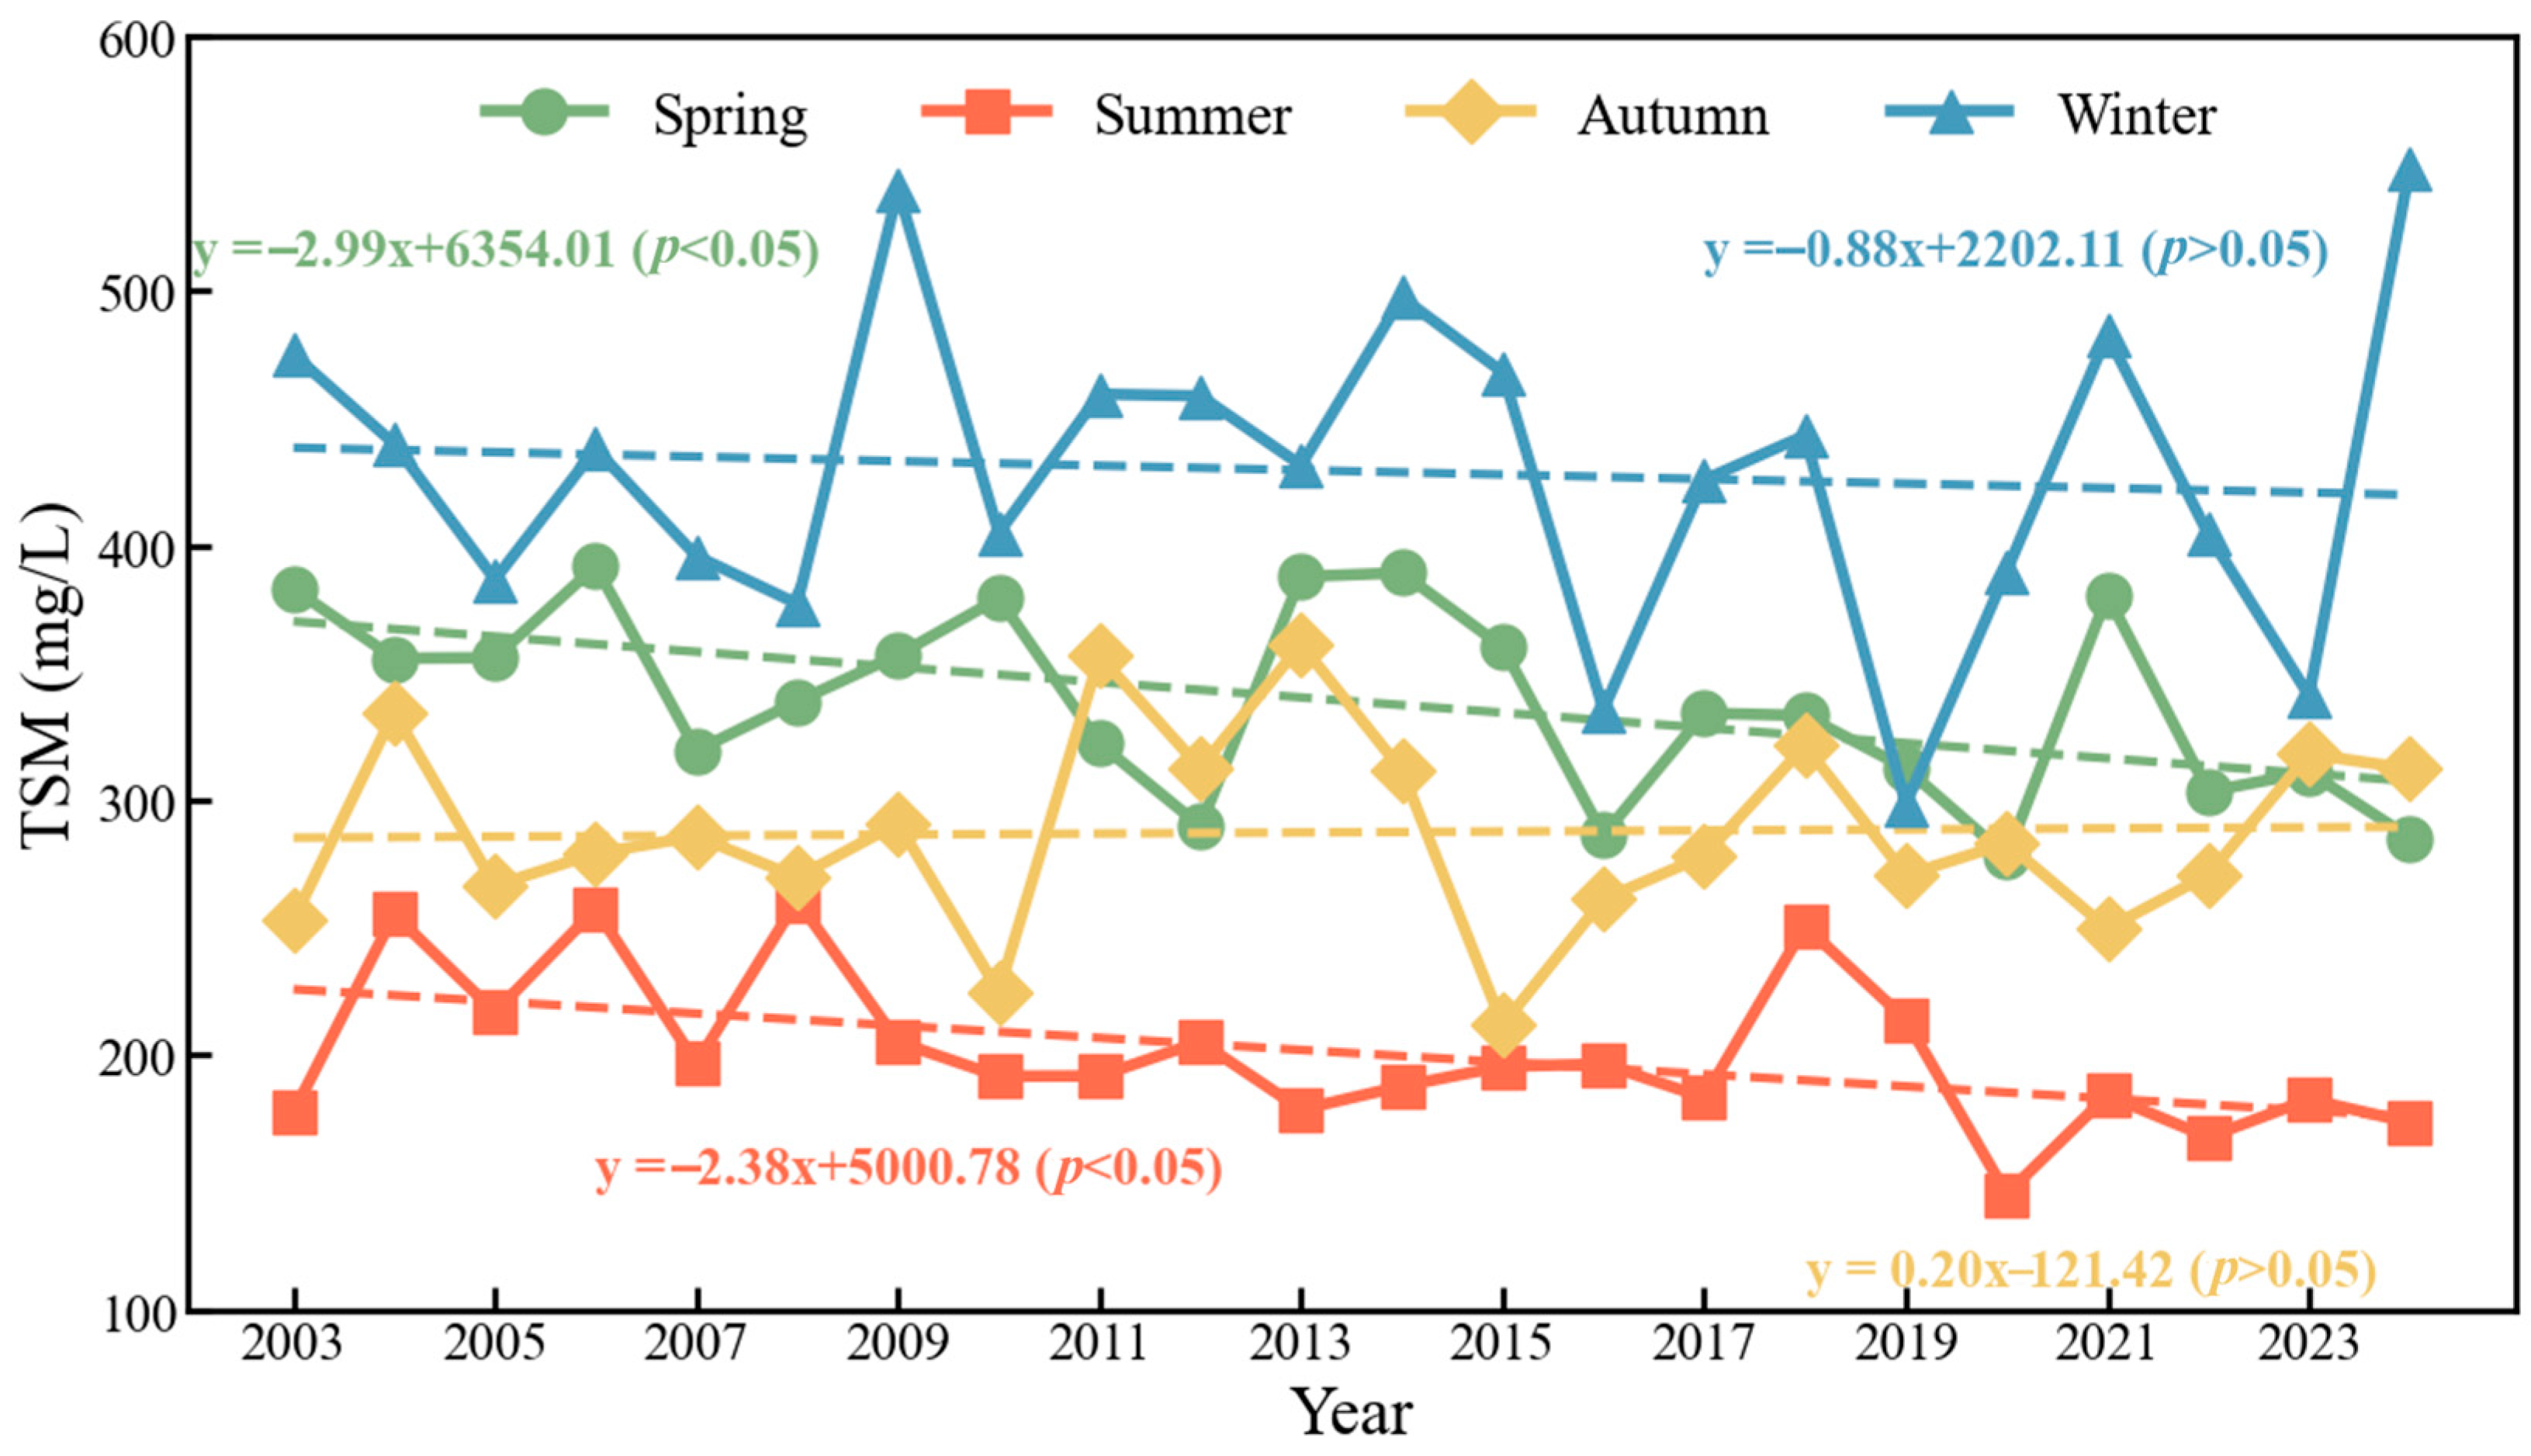
From 2003 to 2024, the seasonal TSM products display a long-term trend (Figure 11). For example, TSM shows a decreasing trend (p < 0.05) in both spring and summer, a slightly increasing trend in autumn, and a slightly decreasing trend in winter (Table 5). Although data in December are available for only a limited number of years due to frequent winter cloud coverage, the available data are reliable for interpreting long-term seasonal variations.

3.3.3. The Rate of TSM Variation in HZB

To estimate the long-term variation rate of TSM at each pixel in HZB, a linear regression was applied to the annual TSM data from 2003 to 2024. The slope of the regression line represents the rate of TSM change over time. The calculation is based on the equation:
T S M t = a × t + b
where a is the annual rate of change.
Trend analysis of TSM shows an increasing trend in the southern bay, particularly at Andong Shoal and the bay mouth islands (Figure 12). In contrast, there is a decreasing trend in TSM in the nearshore waters off Jinshan on the north shore and the central area of the bay. These spatial differences are likely due to the combined effects of the underwater topography of HZB and human activities. The relatively flat and shallow Andong Shoal in the south promotes strong sediment resuspension, making it more responsive to human impacts. Sediment resuspension is weak in the northern bay due to deep coastal troughs, which leads to the decreased TSM concentration, attributable to sediment settling and declining sediment load inputs from the Yangtze River.

4. Discussion

4.1. Uncertainties in the Atmospheric Correction Method and theTSM Retrieval Algorithm

The atmospheric correction method and the TSM retrieval algorithm are crucial for obtaining reliable TSM products. Therefore, we assess the performance of the atmospheric correction method and the TSM retrieval algorithm applied in this study.
While SWIR-AC-retrieved R r s ( 859 ) showed a relatively high error (Table 3), the use of the spectral ratio R r s ( 859 ) / R r s ( 555 ) in the TSM retrieval algorithm significantly reduces error propagation (Figure 3f). Furthermore, SWIR-AC provides better data validity compared to L2gen and OC-SMART, ensuring more reliable results. Therefore, SWIR-AC remains a robust and suitable atmospheric correction method for our study.
Although the proposed algorithm outperforms the other tested models in terms of accuracy, the resulting MAPE of 41.0% still indicates uncertainty. This is attributed to the inherent challenges of TSM retrieval in highly turbid coastal waters, where extremely high TSM concentrations significantly enhance surface reflectance and lead to the saturation of R r s . As a result, the sensitivity of R r s to changes in TSM concentrations decreases, increasing the retrieval errors. In addition, dynamic processes, such as wind-induced waves, tidal forcing, and sediment resuspension, take place regularly in highly turbid coastal waters, leading to pronounced spatiotemporal variability in TSM concentrations. Consequently, while the algorithm provides relatively reliable estimates, it is advisable to apply the model cautiously to regions or periods with rapidly changing turbidity.

4.2. Factors Influencing TSM Interannual Variations

The sediments of HZB are transported by the freshwater flow from the Yangtze River [67]. The Yangtze River flow displays a clear seasonal pattern, with the sediment load accounting for about 78% of the annual discharge during the flood season and 22% during the dry season [68]. However, due to the high river discharge, the surface TSM is dispersed in HZB during summer, which implies that the sediment discharge carried by the river flow does not directly affect the TSM concentration in HZB waters. Previous studies on sediment transport in HZB found that the turbulence of wind–wave actions is the primary driving force for the resuspension of sediments in shallow HZB waters [26,69]. As a consequence, the wind-induced vertical mixing and stirring mechanism caused by wave kinetic energy induces surface TSM fluctuations in previously settled sediments in HZB waters during summer, leading to high TSM in HZB waters during winter [26,70,71,72,73,74].
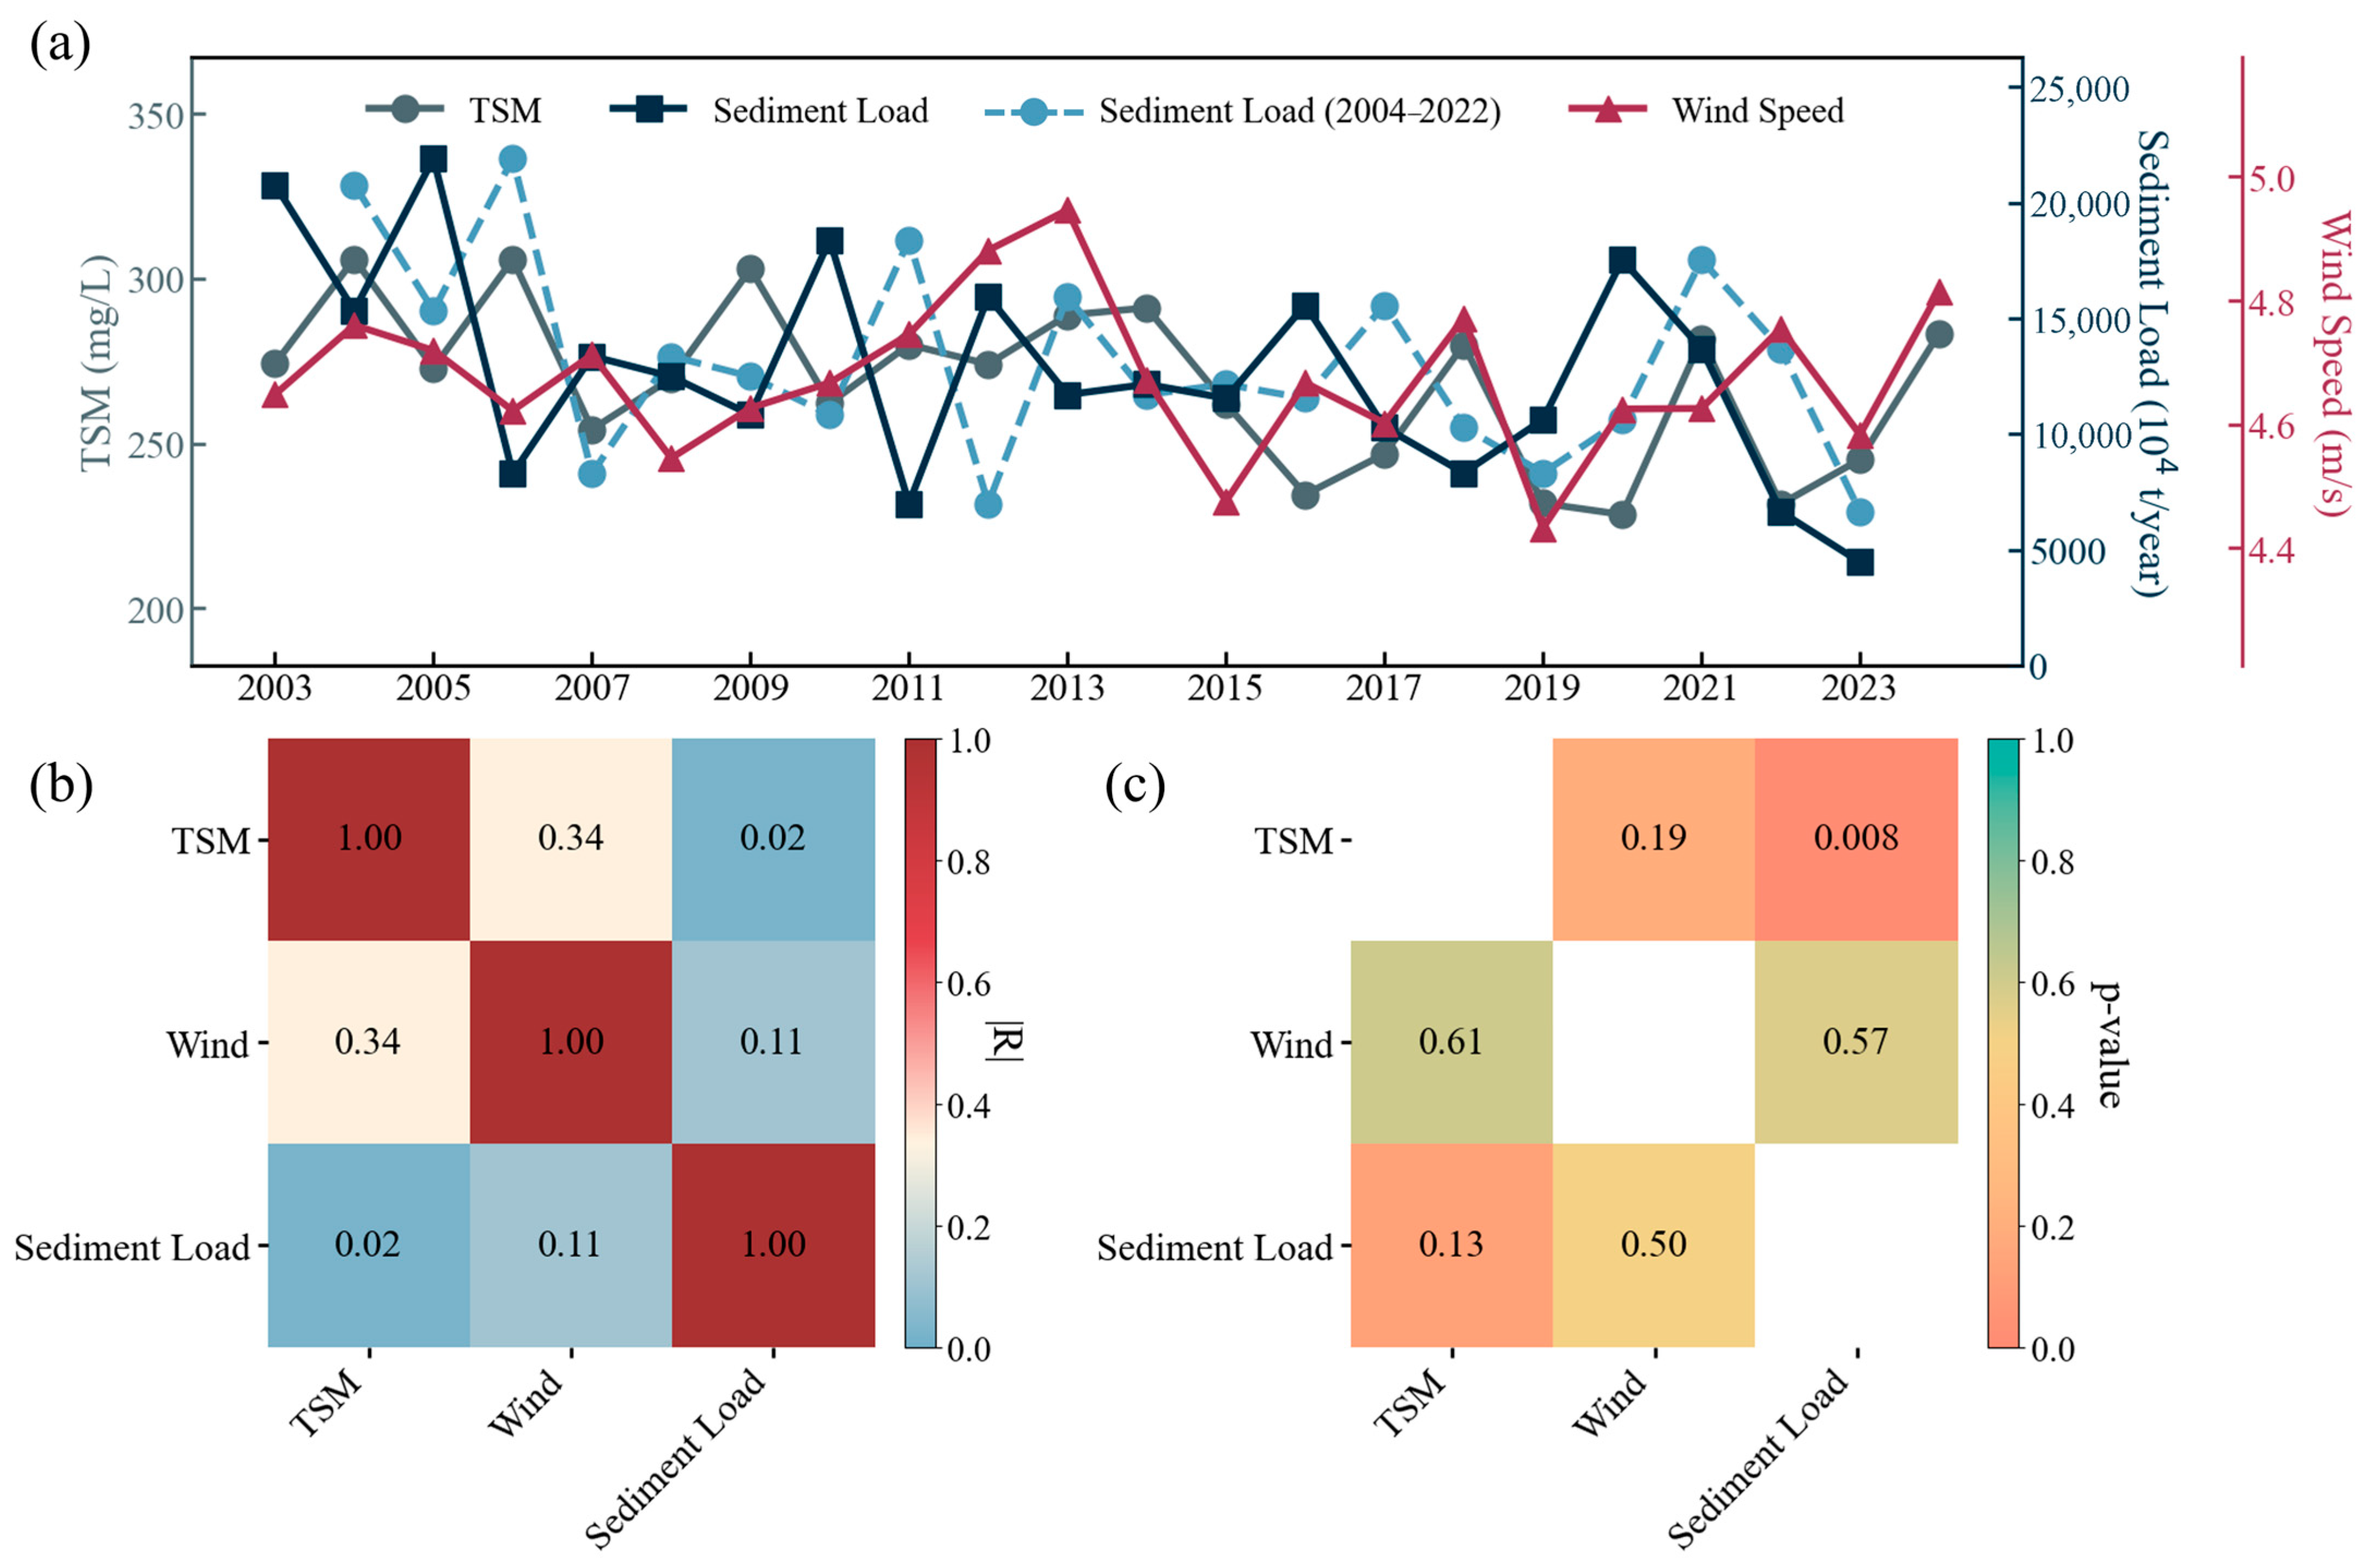
To investigate the driving factors of the interannual variations in TSM of HZB, the Yangtze River sediment load and regional mean wind speed were selected for correlation analysis with annual mean TSM concentrations (Figure 13). However, both correlation coefficients were statistically insignificant, suggesting no clear linear relationship between TSM and either sediment load or wind speed (Figure 13b). Therefore, further analysis using Granger causality tests was performed to investigate potential lagged effects of the Yangtze River sediment load and wind speed on TSM, which is a statistical method used in time series analysis to determine whether there is a causal relationship between variables. Granger causality tests compare two time series of data by calculating a Pearson correlation coefficient (R) between the corresponding values at each time step within a time window. Additionally, one of the time series is time-lagged relative to the other, and new correlations are calculated for various time lags. This allows for the estimation of delayed effects between the two time series. At a one-year lag, the test reveals a significant influence of the Yangtze River sediment load on the TSM in HZB (p < 0.01, Figure 13c), suggesting that the sediment load from the Yangtze River is an important driving factor of TSM in HZB on interannual timescales.
To further support this finding, the Pearson correlation coefficient between TSM and the Yangtze River sediment load delayed by one year was calculated (R = 0.58), indicating that changes in the TSM in HZB respond to variations in the Yangtze River sediment load with a one-year delay, which is consistent with the findings reported in previous studies [18,19]. This may be attributed to the fact that sediment transported into HZB during the flood season is initially diluted and settles to the bottom; it is then resuspended in winter due to wind-induced vertical mixing, resulting in increased surface TSM concentrations in January and February of the next year (Figure 10).
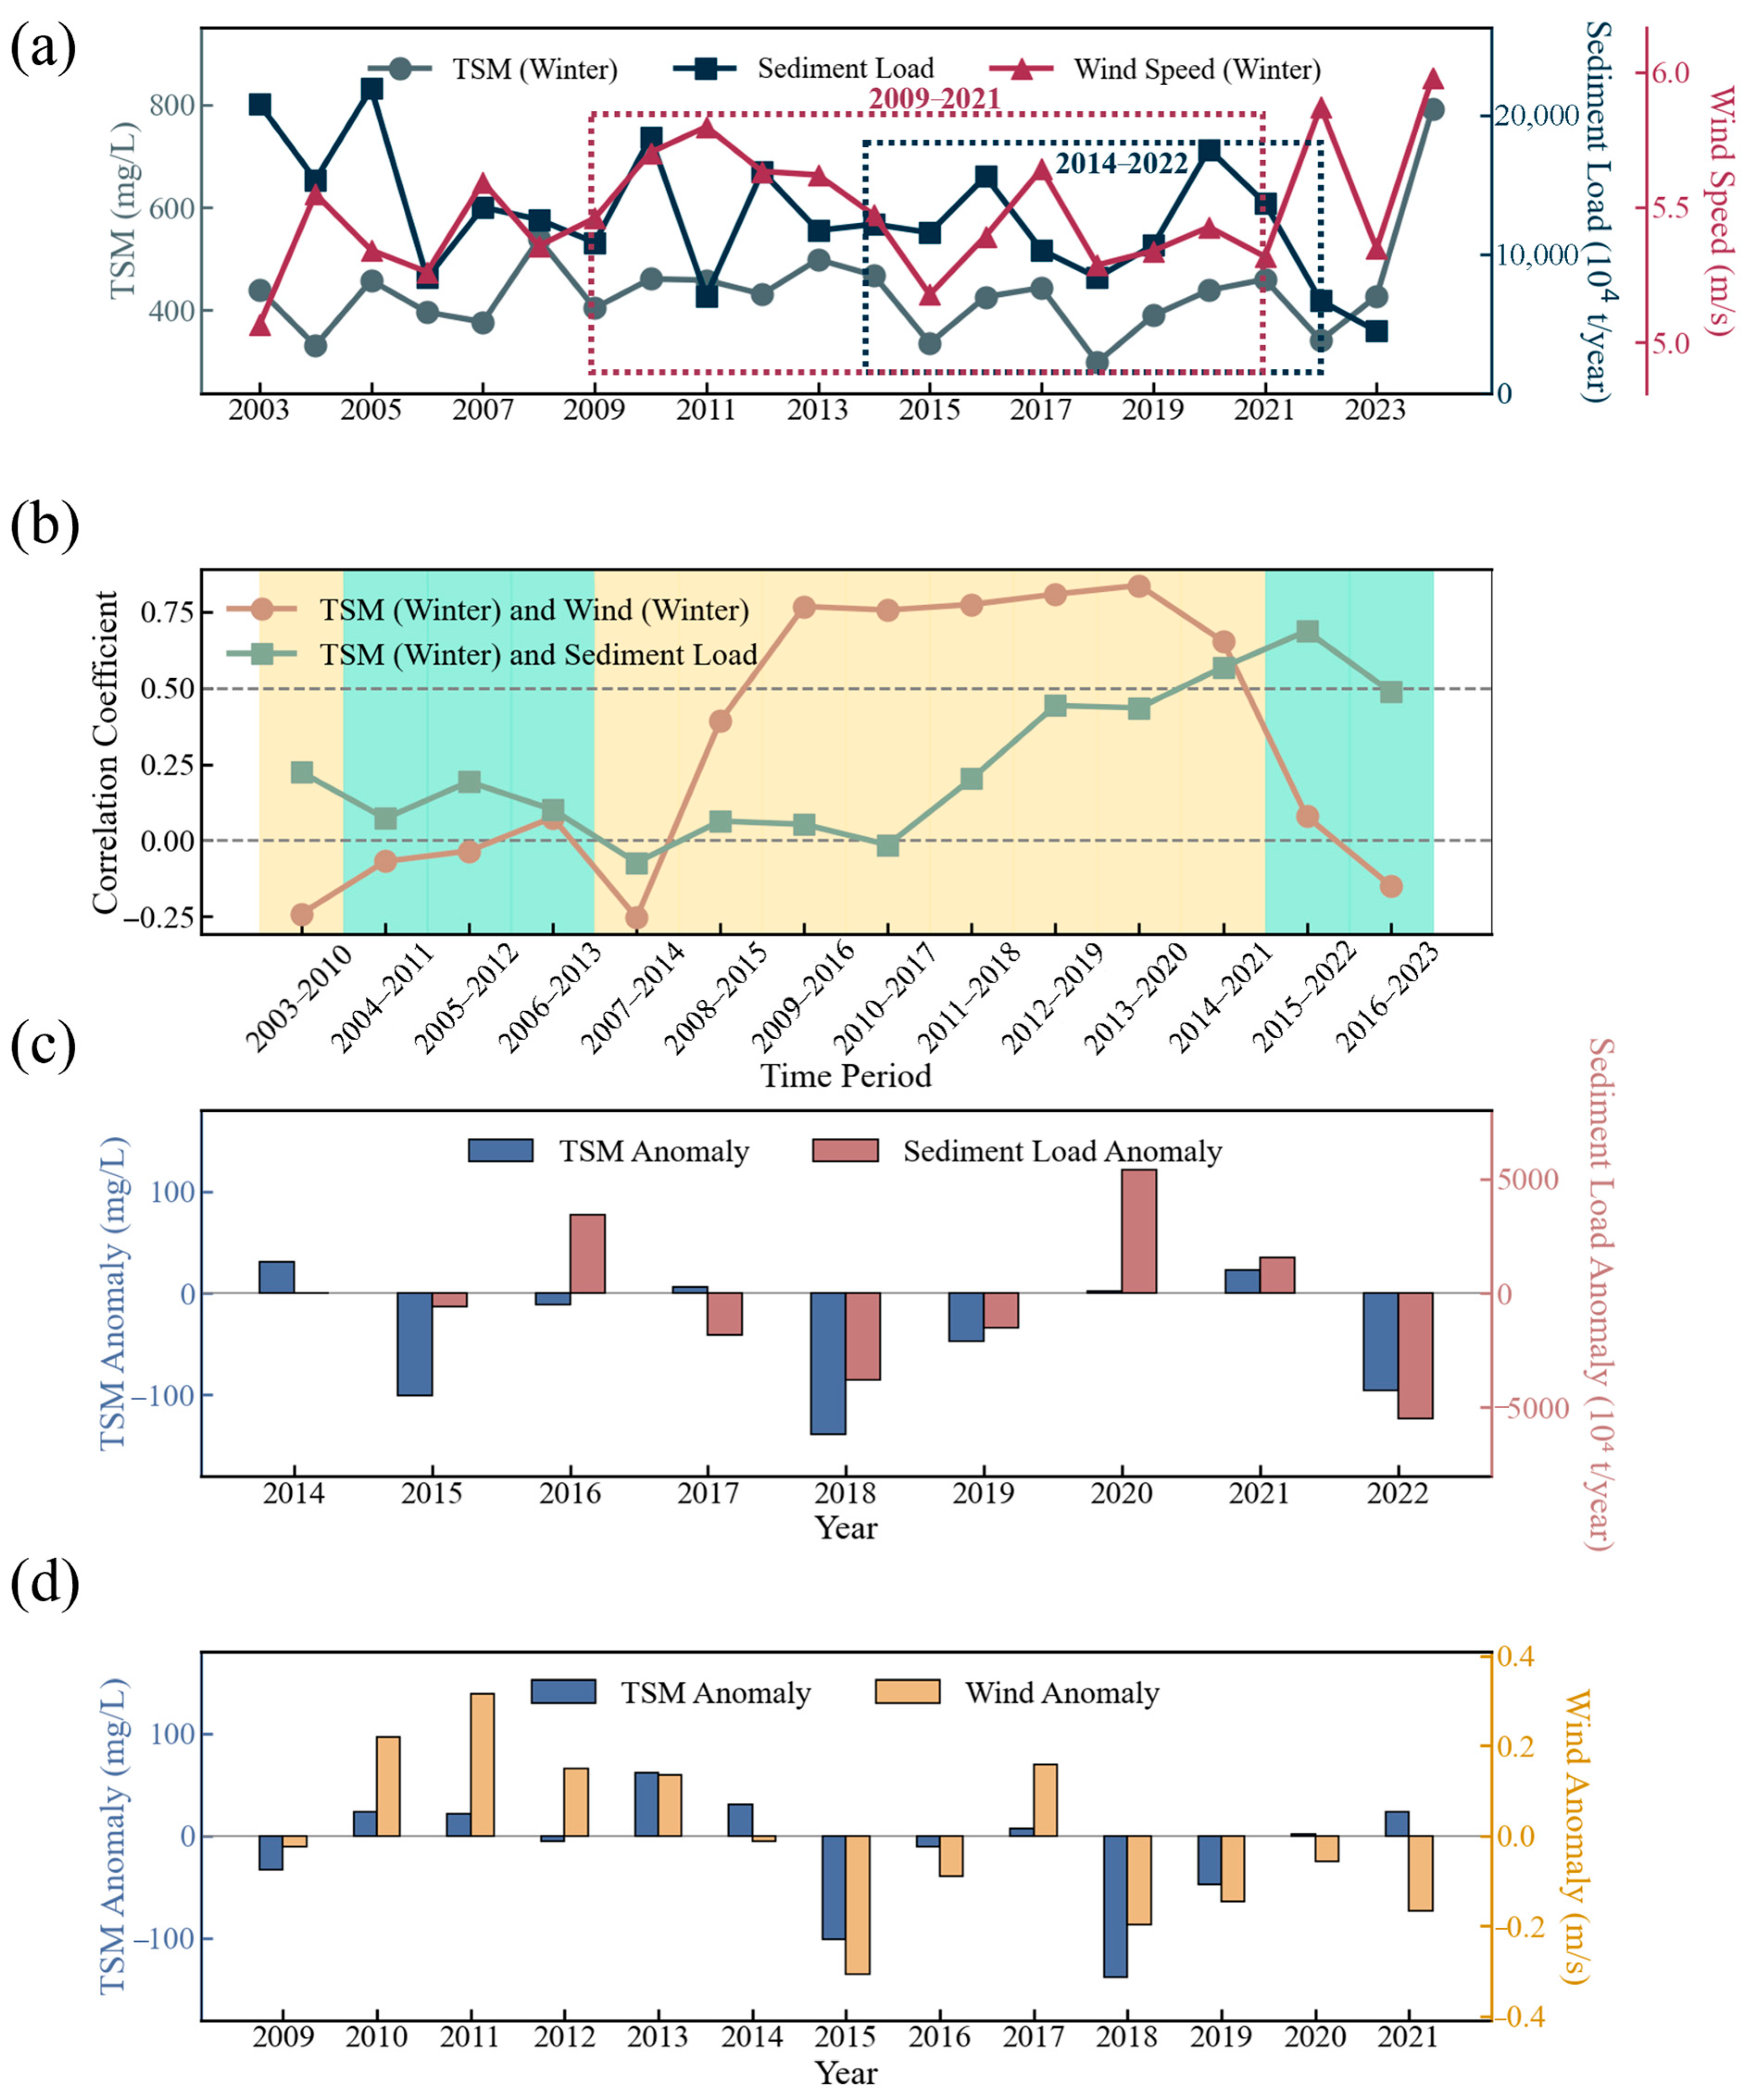
Due to the strong resuspension of sediments in winter, the TSM concentration peaks during winter, making winter TSM a good indicator for analyzing its long-term driving mechanisms. Since winter TSM is influenced by both the Yangtze River sediment load and wind speed, Pearson correlation coefficients between TSM and each factor were calculated using an 8-year moving window (Figure 14b). Overall, during 2014–2022, the sediment load had a statistically significant influence on TSM, with the Pearson correlation coefficient consistently exceeding 0.5, which was confirmed by a recalculated positive correlation coefficient (R = 0.640) for the same period. Similarly, in 2009–2021, the correlation coefficient between wind speed and winter TSM remained above 0.5, indicating a significant impact of wind speed on TSM during the period, as confirmed by a recalculated positive correlation coefficient (R = 0.676). Additionally, except for a few years, the anomalies of TSM and sediments in 2014–2022 displayed consistent positive and negative trends. During 2009–2021, TSM and wind anomalies also showed consistent trends, indicating that wind-induced hydrodynamic changes impacted the sediment resuspension processes.
Due to the significant reduction in the sediment load following the construction of the Three Gorges Dam, which significantly reduced the annual sediment load by approximately 60% [19], the long-term variability in TSM in HZB may correspondingly be influenced by the sediment load from the Yangtze River. Wind-driven resuspension during winter has also played a crucial role in influencing TSM concentrations in recent years. Moreover, the spatial distribution and temporal variations in TSM concentrations in HZB could be explained by other complex factors, such as human activities (e.g., offshore construction and land reclamation) and tidal dynamics.
The TSM concentration in HZB is influenced not only by sediment load and wind speed, but also by many other dynamic processes, such as water stratification, wind-induced mixing, tidal dynamics, and sediment resuspension [26,75,76,77,78,79,80,81]. For example, the blocking effect of the Zhoushan Islands restricts current velocity on the southern side of HZB, causing it to be slower than on the northern side. The weaker currents lead to reduced turbulence and vertical water motions that normally cause sediment resuspension, resulting in lower surface TSM on the southern side. However, the higher velocity between and along the Zhoushan Islands triggers sediment resuspension from the bottom, causing elevated TSM in this region [75]. In addition, HZB is a tide-dominated estuary with one of the world’s strongest tides, where tidal amplitudes range from 3–4 m at the mouth to 4–6 m at the head, and can reach 9 m [82,83]. High-velocity tidal currents trigger resuspension of previously deposited sediments, resulting in high TSM, whereas the reduction in current velocity towards the end of the ebb tide allows for the deposition of suspended sediments [75,78,79,80,81]. However, our study does not aim to comprehensively address all potential driving factors of seasonal and interannual variability in TSM. We focused on important environmental factors with pronounced seasonal and interannual variability, including river discharge, sediment load, and wind speed, based on a thorough review of previous studies [2,7,16,17,18,19,24,25,26]. Hydrodynamic processes, such as tidal dynamics, can cause short-term variations in TSM on hourly or daily scales, while others, such as sediment resuspension influenced by current velocity, take place on longer time scales but are not major drivers of seasonal and interannual variability in TSM. Considering space limitations, we do not discuss these factors in detail here.

4.3. Impacts of Human Activities

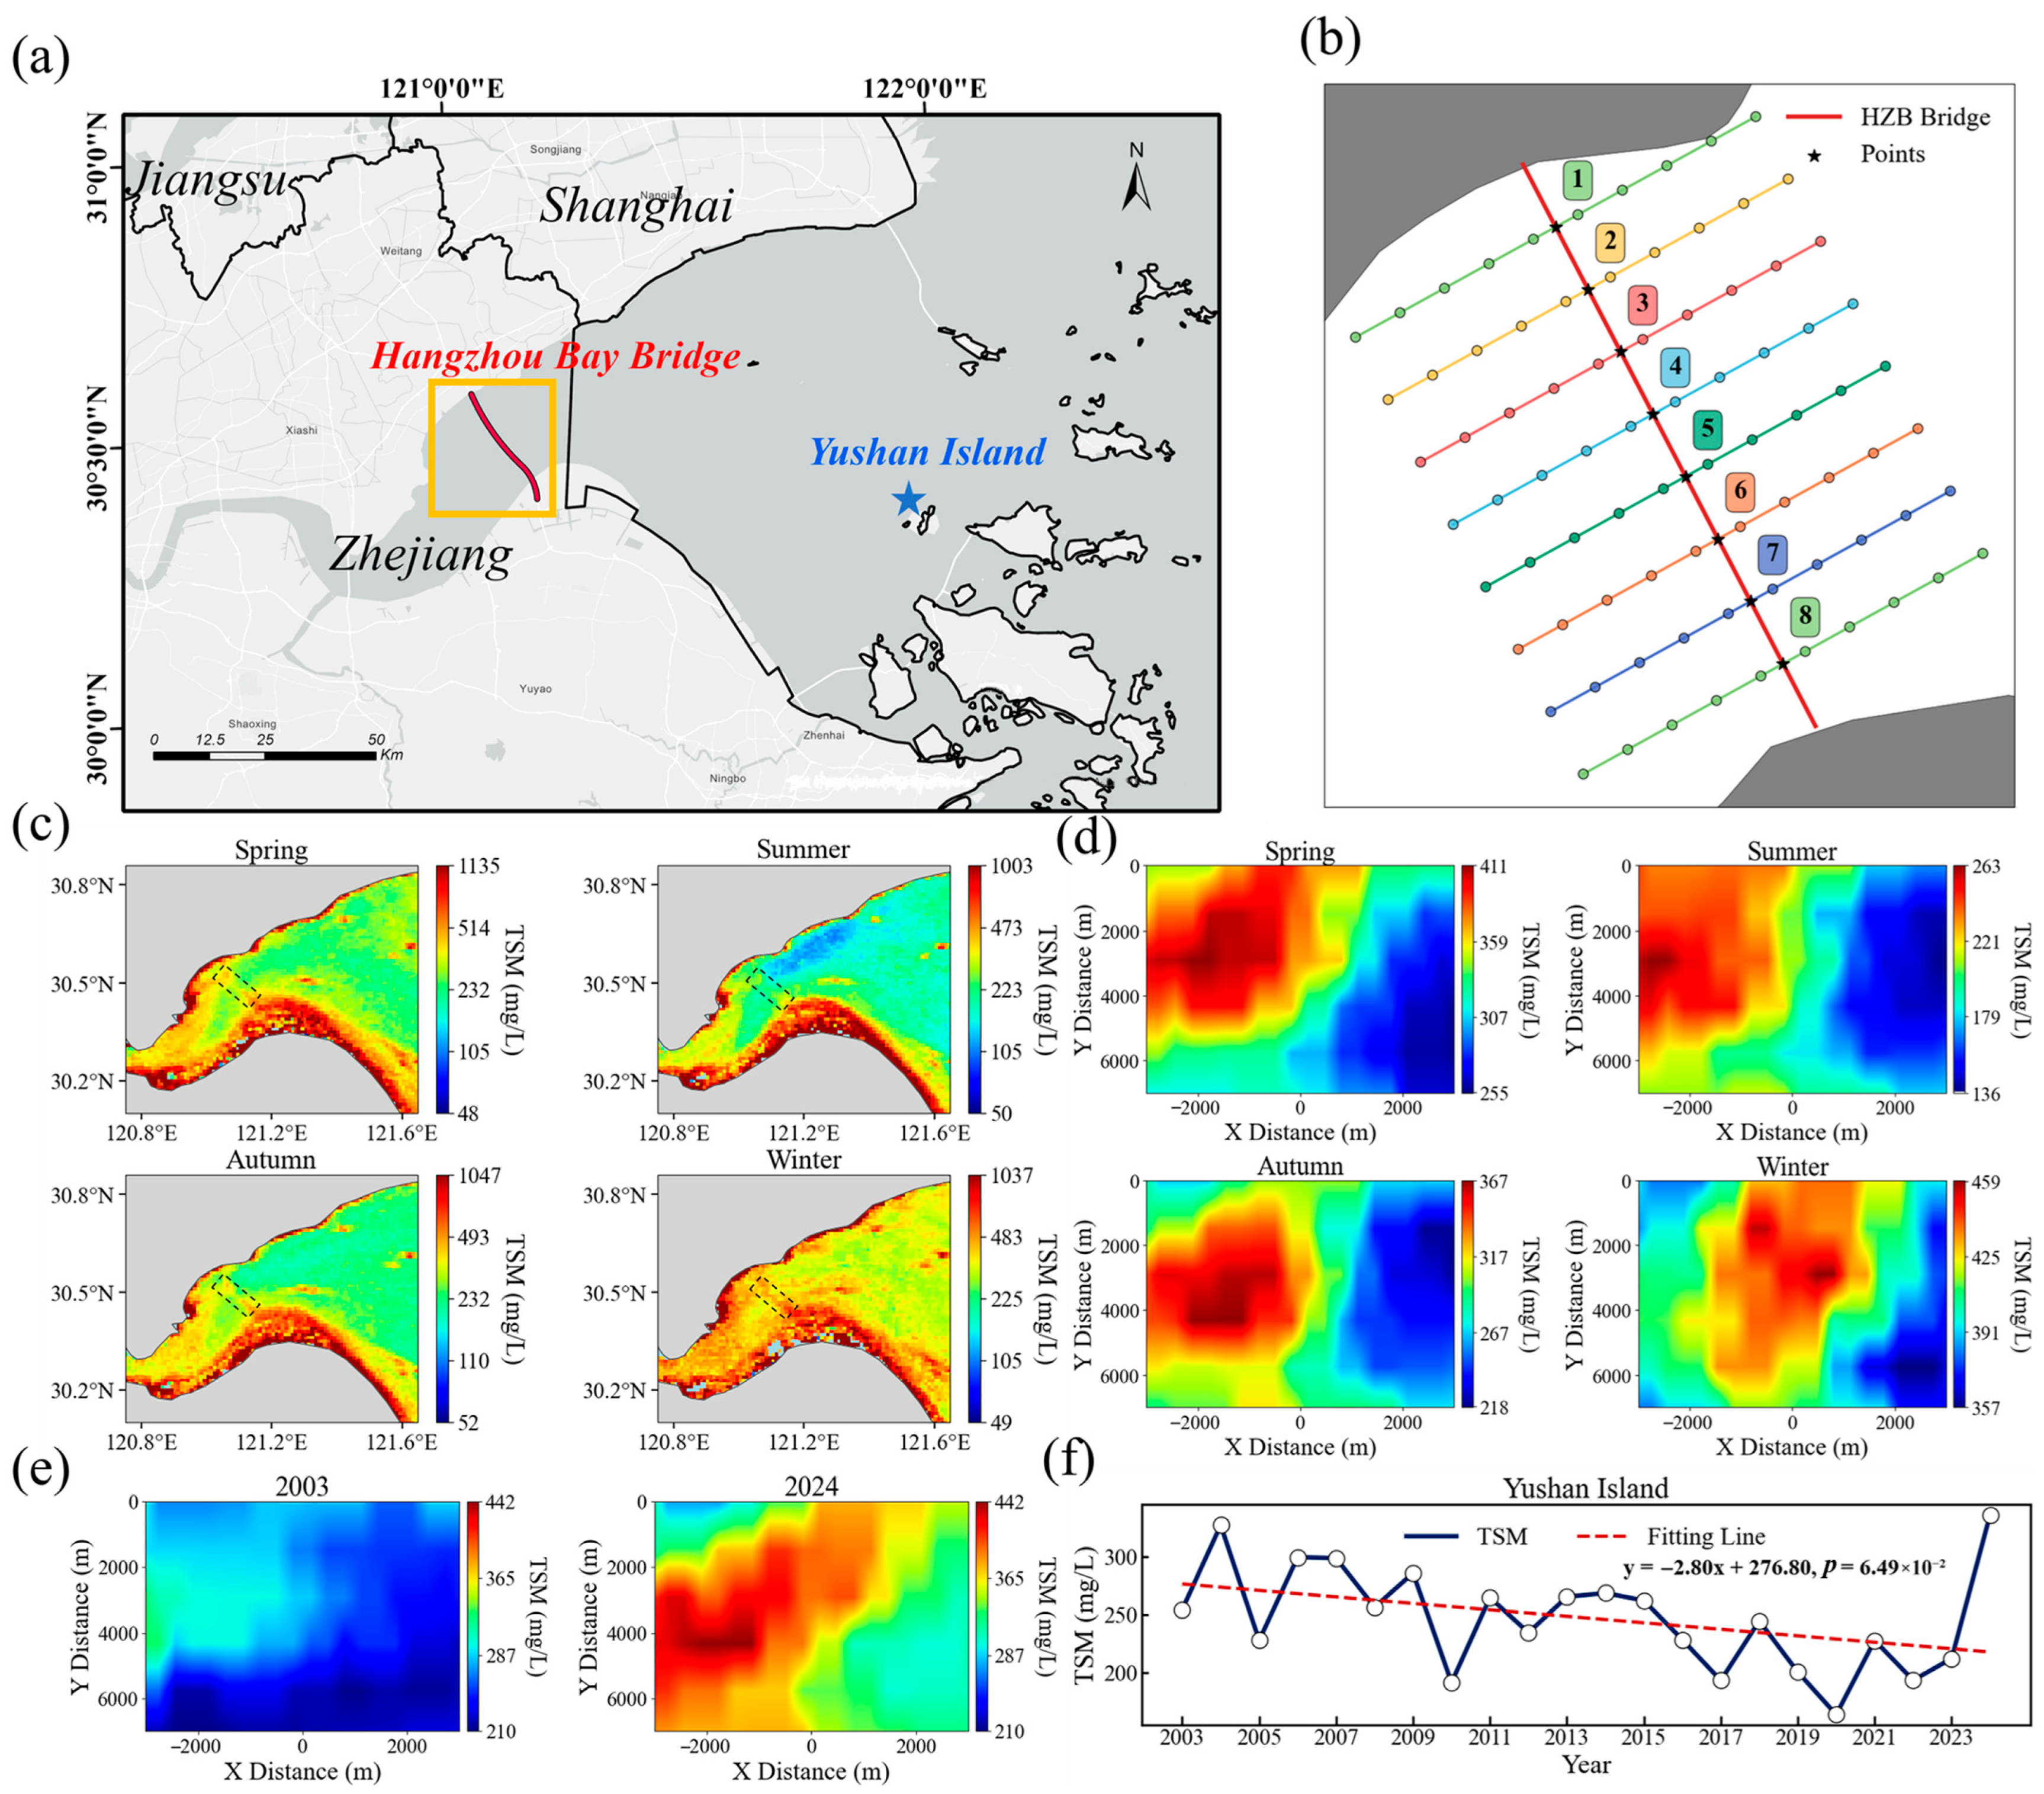
Bridge engineering facilities in nearshore areas are known to cause changes in the hydrodynamic environment through the interaction between currents and bridge piers, leading to increased sediment concentrations in downstream areas of bridges [20,21,22,56,84,85,86]. Bridge piers can block water currents from upstream [20,21,22], thereby promoting sediment deposition in downstream areas while simultaneously inducing local scouring near the bridge and resulting in sediment resuspension [84,85]. A pronounced increase in downstream suspended sediment concentration is observed during westward flows, whereas eastward flows result in only a modest increase [87,88]. The Hangzhou Bay Bridge spans approximately 36 km across the main channel of HZB, close to the Zhoushan Archipelago. It began operation in 2003, providing enhanced transportation connectivity for cities in northeastern Zhejiang Province and connecting Jiaxing, Ningbo, and Cixi cities. This study analyzed the impacts of the Hangzhou Bay Bridge on the distribution of TSM in the surrounding sea areas. For this analysis, eight equally spaced points were chosen along the Hangzhou Bay Bridge. At each point, cross-sections extending 3 km on either side perpendicular to the bridge were created (Figure 15b). The TSM variation data along these transects were then extracted for seasonal analysis (Figure 15c,d). Since the construction of the bridge began in 2003, TSM distributions in 2003 (at the beginning of the bridge construction) and 2024 (after the bridge construction) were also considered for comparison to investigate the influence of the bridge (Figure 15e).
A distinct difference in TSM concentrations on both sides of the Hangzhou Bay Bridge is shown in Figure 15c. The details are highlighted in Figure 15d, showing that the western side of the bridge consistently displays significantly higher TSM concentrations than the eastern side in spring, summer, and autumn. This difference in TSM concentrations between the western and eastern sides of the bridge can be attributed to two factors. First, the hydrodynamic influence of the bridge plays a key role. When the current flows westward, the TSM concentrations in downstream areas of the bridge increased significantly, whereas the increase in downstream TSM concentrations was less pronounced during the eastward flow [87,88]. Second, the western side of the bridge is affected by sediment input from the Qiantang River, which contributes to higher TSM concentrations on the western side for most of the year. However, this spatial pattern weakens in winter, during which high TSM concentrations are observed on both sides of the bridge. As discussed previously in Section 3.3, strong winds in winter lead to resuspension of bottom sediments, resulting in overall high surface TSM concentrations, which weakens the influence of the bridge on the TSM distribution during winter. A comparison between 2003 and 2024 indicates that the distinct concentration difference between the western and eastern sides observed in 2024 was not evident in 2003, when the TSM distribution was more continuous and the west–east concentration difference was less pronounced. In general, the clear boundary shown along the bridge in Figure 15c–e supports the conclusion that the TSM distribution on both sides is indeed influenced by the bridge.
Yushan Island, a part of the Zhoushan Archipelago, was once small, covering 8.44 square kilometers with a population of 3000. Since 2017, the island has been developed into an oil refining base, with the aim of becoming a world-class chemical industrial hub. Initially, the island comprised a limited flat terrain. However, by 2020, the area of the islands expanded to 21 square kilometers due to the extensive land excavation and reclamation activities. From 2003 to 2024, TSM in the waters near Yushan Island showed an overall declining trend (Figure 15f). This decrease may be attributed to large-scale land reclamation and tidal dynamic alterations [89,90].

5. Conclusions

The time series of MODIS/Aqua L1B data from 2003 to 2024 revealed the spatial and temporal characteristics of TSM and driving mechanisms in the HZB. The results generally indicated a decreasing trend in TSM concentration in HZB waters, which can be attributed to declines in sediment discharge from the Yangtze River. Spatially, TSM exhibited an increasing trend in the southern shallow regions and a decreasing trend in the northern deep troughs and the central bay. Interannual variations in the wintertime TSM products were closely associated with sediment discharge from the Yangtze River and wind-driven sediment resuspension. Furthermore, anthropogenic activities have increasingly altered the sediment dynamics of HZB. TSM on the western sides of the Hangzhou Bay Bridge remained higher than on the eastern side for most of the year from 2003 to 2024, which is likely attributable to the influence of the bridge on regional hydrodynamic conditions. Additionally, a notable and continuous decline in TSM near Yushan Island was observed, likely due to the extensive land reclamation projects and local tidal dynamics. These findings highlight the combined impacts of human activities and natural factors on the sediment dynamics of HZB over the past decades. The long-term TSM products and observed trends provide important insights into the regulatory mechanisms governing the suspended sediment concentrations and their temporal trends, supporting informed decision-making for water resource management and environmental protection in HZB and other similar urbanized estuarine systems.

Author Contributions

X.L.: data curation, methodology, validation, visualization, and writing—original draft. X.H.: conceptualization, funding acquisition, supervision, and writing—review and editing. Y.Z.: methodology, supervision, writing—original draft, and writing—review and editing. P.S.: writing—review and editing. F.G.: validation. T.L.: validation and formal analysis. X.J.: validation. All authors have read and agreed to the published version of the manuscript.

Funding

This research was funded by the “Pioneer” R&D Program of Zhejiang (2023C03011), the National Natural Science Foundation of China (Grants #U23A2037, #U22B2012, and #42176177), and the Zhejiang Provincial Natural Science Foundation of China (Grant #LDT23D06021D06).

Data Availability Statement

The data presented in this study are available in the Zenodo repository at https://doi.org/10.5281/zenodo.15729776. These data were derived from the following resources available in the public domain: MODIS/Aqua data from the Atmosphere Archive and Distribution System Distributed Active Archive Center (https://ladsweb.modaps.eosdis.nasa.gov/search/order/1/MYD021KM--61, last accessed on 9 August 2025).

Acknowledgments

The authors would like to thank the National Aeronautics and Space Administration (NASA) for the MODIS/Aqua L1B data. We are also grateful to the staff of the satellite ground station, the satellite data processing and sharing center, and the marine satellite data online analysis platform of the State Key Laboratory of Satellite Ocean Environment Dynamics, Second Institute of Oceanography, Ministry of Natural Resources (SOED/SIO/MNR), Hangzhou, China, for their help in data collection and processing.

Conflicts of Interest

The authors declare no conflicts of interest.

References

  1. Yun, C. China River Delta Crisis; Ocean Press: Beijing, China, 2010. [Google Scholar]
  2. Feng, L.; Hu, C.; Chen, X.; Song, Q. Influence of the Three Gorges Dam on total suspended matters in the Yangtze Estuary and its adjacent coastal waters: Observations from MODIS. Remote Sens. Environ. 2014, 140, 779–788. [Google Scholar] [CrossRef]
  3. Li, L.; Ye, T.; Zhang, L.; Yao, Y.; Xia, Y. Influences of reclamation location on the water and sediment environment in Hangzhou Bay. J. Harbin Eng. Univ. 2019, 40, 1870–1875. [Google Scholar]
  4. Fang, Q.; Huang, S.; Xu, X. Analysis of the influence of reclamation engineering group on the accumulated hydrodynamics in the south coast of Hangzhou Bay. Sci. Technol. Eng. 2020, 20, 5338–5344. [Google Scholar]
  5. Huang, S.; Zhang, Q.; Yan, J. Impact of shoreline changes caused by Hangzhou Bay Reclamation Project on water environment. J. North China Univ. Water Resour. Electr. Power (Nat. Sci. Ed.) 2021, 42, 32–41. [Google Scholar]
  6. Ministry of Ecology and Environment of China. The Ministry of Ecology and Environment and Six Other Departments Jointly Issued the “Action Plan for the Comprehensive Governance Campaign in Key Sea Areas”. Available online: https://www.gov.cn/xinwen/2022-02/17/content_5674359.htm (accessed on 9 August 2025).
  7. Ouillon, S.; Douillet, P.; Petrenko, A.; Neveux, J.; Dupouy, C.; Froidefond, J.-M.; Andréfouët, S.; Muñoz-Caravaca, A. Optical algorithms at satellite wavelengths for total suspended matter in tropical coastal waters. Sensors 2008, 8, 4165–4185. [Google Scholar] [CrossRef] [PubMed]
  8. Güttler, F.N.; Niculescu, S.; Gohin, F. Turbidity retrieval and monitoring of Danube Delta waters using multi-sensor optical remote sensing data: An integrated view from the delta plain lakes to the western–northwestern Black Sea coastal zone. Remote Sens. Environ. 2013, 132, 86–101. [Google Scholar] [CrossRef]
  9. Constantin, S.; Doxaran, D.; Constantinescu, Ș. Estimation of water turbidity and analysis of its spatio-temporal variability in the Danube River plume (Black Sea) using MODIS satellite data. Cont. Shelf Res. 2016, 112, 14–30. [Google Scholar] [CrossRef]
  10. Knaeps, E.; Ruddick, K.G.; Doxaran, D.; Dogliotti, A.I.; Nechad, B.; Raymaekers, D.; Sterckx, S. A SWIR based algorithm to retrieve total suspended matter in extremely turbid waters. Remote Sens. Environ. 2015, 168, 66–79. [Google Scholar] [CrossRef]
  11. Mao, Z.; Chen, J.; Pan, D.; Tao, B.; Zhu, Q. A regional remote sensing algorithm for total suspended matter in the East China Sea. Remote Sens. Environ. 2012, 124, 819–831. [Google Scholar] [CrossRef]
  12. Nazirova, K.; Alferyeva, Y.; Lavrova, O.; Shur, Y.; Soloviev, D.; Bocharova, T.; Strochkov, A. Comparison of in situ and remote-sensing methods to determine turbidity and concentration of suspended matter in the estuary zone of the mzymta river, black sea. Remote Sens. 2021, 13, 143. [Google Scholar] [CrossRef]
  13. Wen, Z.; Wang, Q.; Liu, G.; Jacinthe, P.-A.; Wang, X.; Lyu, L.; Tao, H.; Ma, Y.; Duan, H.; Shang, Y. Remote sensing of total suspended matter concentration in lakes across China using Landsat images and Google Earth Engine. ISPRS J. Photogramm. Remote Sens. 2022, 187, 61–78. [Google Scholar] [CrossRef]
  14. Mohseni, F.; Saba, F.; Mirmazloumi, S.M.; Amani, M.; Mokhtarzade, M.; Jamali, S.; Mahdavi, S. Ocean water quality monitoring using remote sensing techniques: A review. Mar. Environ. Res. 2022, 180, 105701. [Google Scholar] [CrossRef] [PubMed]
  15. Ma, Y.; Song, K.; Wen, Z.; Liu, G.; Shang, Y.; Lyu, L.; Du, J.; Yang, Q.; Li, S.; Tao, H. Remote sensing of turbidity for lakes in northeast China using Sentinel-2 images with machine learning algorithms. IEEE J. Sel. Top. Appl. Earth Obs. Remote Sens. 2021, 14, 9132–9146. [Google Scholar] [CrossRef]
  16. Ye, T.; Li, L.; Yao, Y.; Xia, Y.; Guan, W. Inter-Annual Variability of the Turbidity Maximum Zone in Hangzhou Bay Based on Landsat Imagery. Geomat. Inf. Sci. Wuhan Univ. 2019, 44, 1377–1384. [Google Scholar]
  17. He, X.; Bai, Y.; Pan, D.; Huang, N.; Dong, X.; Chen, J.; Chen, C.T.A.; Cui, Q. Using geostationary satellite ocean color data to map the diurnal dynamics of suspended particulate matter in coastal waters. Remote Sens. Environ. 2013, 133, 225–239. [Google Scholar] [CrossRef]
  18. Li, P.; Yang, S.; Milliman, J.; Xu, K.; Qin, W.; Wu, C.; Chen, Y.; Shi, B. Spatial, temporal, and human-induced variations in suspended sediment concentration in the surface waters of the Yangtze Estuary and adjacent coastal areas. Estuaries Coasts 2012, 35, 1316–1327. [Google Scholar] [CrossRef][Green Version]
  19. Shen, F.; Zhou, Y.; Li, J.; He, Q.; Verhoef, W. Remotely sensed variability of the suspended sediment concentration and its response to decreased river discharge in the Yangtze estuary and adjacent coast. Cont. Shelf Res. 2013, 69, 52–61. [Google Scholar] [CrossRef]
  20. Liu, H. Hydrodynamic problems associated with construction of sea-crossing bridges. J. Hydrodyn. Ser. B 2006, 18, 13–18. [Google Scholar] [CrossRef]
  21. Pasiok, R.; Stilger-Szydło, E. Sediment particles and turbulent flow simulation around bridge piers. Arch. Civ. Mech. Eng. 2010, 10, 67–79. [Google Scholar] [CrossRef]
  22. Qiao, S.; Pan, D.; He, X.; Cui, Q. Numerical Study of the Influence of Donghai Bridge on Sediment Transport in the Mouth of Hangzhou Bay. Procedia Environ. Sci. 2011, 10, 408–413. [Google Scholar] [CrossRef]
  23. Liu, Y. Recent evolution process and influencing factors of Jinshan Trough in Hangzhou Bay. Ph.D. Thesis, East China Normal University, Shanghai, China, 2019. [Google Scholar]
  24. Gao, A.; Zhao, H.; Yang, S. Seasonal and tidal variations in suspended sediment concentration under the influence of River runoff, tidal current and wind waves-taking the Nanhui headland, the joint area between Changjiang Estuary and Hangzhou Bay as an Example. Adv. Mar. Sci. 2008, 26, 44. [Google Scholar]
  25. Dan, Y.; Zhifeng, Y.; Wenjie, D. Hourly Variability of Surface Suspended Sediment Concen--tration in Hangzhou Bay in Winter. J. Hangzhou Norm. Univ. (Nat. Sci. Ed.) 2014, 13, 373–379. [Google Scholar]
  26. Liu, M.; Shen, F.; Ge, J.; Kong, Y. Diurnal variation of suspended sediment concentration in Hangzhou Bay from geostationary satellite observation and its hydrodynamic analysis. J. Sediment Res. 2013, 1, 7–13. [Google Scholar]
  27. Bai, Y.; He, X.; Pan, D.; Zhu, Q.; Lei, H.; Tao, B.; Hao, Z. The extremely high concentration of suspended particulate matter in Changjiang Estuary detected by MERIS data. In Proceedings of the Remote Sensing of the Coastal Ocean, Land, and Atmosphere Environment, Incheon, Republic of Korea, 11–14 October 2010; pp. 250–257. [Google Scholar]
  28. Xu, Y.; He, X.; Bai, Y.; Wang, D.; Zhu, Q.; Ding, X. Evaluation of remote-sensing reflectance products from multiple ocean color missions in highly turbid water (Hangzhou bay). Remote Sens. 2021, 13, 4267. [Google Scholar] [CrossRef]
  29. Bai, R.; He, X.; Bai, Y.; Gong, F.; Zhu, Q.; Wang, D.; Li, T. Atmospheric correction algorithm based on the interpolation of ultraviolet and shortwave infrared bands. Opt. Express 2023, 31, 6805–6826. [Google Scholar] [CrossRef]
  30. Mobley, C.D. Estimation of the remote-sensing reflectance from above-surface measurements. Appl. Opt. 1999, 38, 7442–7455. [Google Scholar] [CrossRef]
  31. Dai, Q.; Pan, D.; He, X.; Zhu, Q.; Gong, F.; Huang, H. High-Frequency Observation of Water Spectrum and Its Application in Monitoring of Dynamic Variation of Suspended Materials in the Hangzhou Bay. Spectrosc. Spectr. Anal. 2015, 35, 3247–3254. [Google Scholar]
  32. Fraser, R.S.; Mattoo, S.; Yeh, E.N.; McClain, C. Algorithm for atmospheric and glint corrections of satellite measurements of ocean pigment. J. Geophys. Res. Atmos. 1997, 102, 17107–17118. [Google Scholar] [CrossRef]
  33. Wang, M.; Bailey, S.W. Correction of sun glint contamination on the SeaWiFS ocean and atmosphere products. Appl. Opt. 2001, 40, 4790–4798. [Google Scholar] [CrossRef]
  34. Frouin, R.; Schwindling, M.; Deschamps, P.Y. Spectral reflectance of sea foam in the visible and near–infrared: In situ measurements and remote sensing implications. J. Geophys. Res. Ocean. 1996, 101, 14361–14371. [Google Scholar] [CrossRef]
  35. Gordon, H.R.; Wang, M. Influence of oceanic whitecaps on atmospheric correction of ocean-color sensors. Appl. Opt. 1994, 33, 7754–7763. [Google Scholar] [CrossRef] [PubMed]
  36. Moore, K.D.; Voss, K.J.; Gordon, H.R. Spectral reflectance of whitecaps: Their contribution to water--leaving radiance. J. Geophys. Res. Ocean. 2000, 105, 6493–6499. [Google Scholar] [CrossRef]
  37. Gordon, H.R.; Wang, M. Retrieval of water-leaving radiance and aerosol optical thickness over the oceans with SeaWiFS: A preliminary algorithm. Appl. Opt. 1994, 33, 443–452. [Google Scholar] [CrossRef] [PubMed]
  38. Gordon, H.R. Atmospheric correction of ocean color imagery in the Earth Observing System era. J. Geophys. Res. Atmos. 1997, 102, 17081–17106. [Google Scholar] [CrossRef]
  39. Gordon, H.R.; Wang, M. Surface-roughness considerations for atmospheric correction of ocean color sensors. 1: The Rayleigh-scattering component. Appl. Opt. 1992, 31, 4247–4260. [Google Scholar] [CrossRef]
  40. Wang, M. The Rayleigh lookup tables for the SeaWiFS data processing: Accounting for the effects of ocean surface roughness. Int. J. Remote Sens. 2002, 23, 2693–2702. [Google Scholar] [CrossRef]
  41. Wang, M. A refinement for the Rayleigh radiance computation with variation of the atmospheric pressure. Int. J. Remote Sens. 2005, 26, 5651–5663. [Google Scholar] [CrossRef]
  42. Deschamps, P.; Herman, M.; Tanre, D. Modeling of the atmospheric effects and its application to the remote sensing of ocean color. Appl. Opt. 1983, 22, 3751–3758. [Google Scholar] [CrossRef]
  43. Gordon, H.R.; Franz, B.A. Remote sensing of ocean color: Assessment of the water-leaving radiance bidirectional effects on the atmospheric diffuse transmittance for SeaWiFS and MODIS intercomparisons. Remote Sens. Environ. 2008, 112, 2677–2685. [Google Scholar] [CrossRef]
  44. Gordon, H.R.; Brown, J.W.; Evans, R.H. Exact Rayleigh scattering calculations for use with the Nimbus-7 coastal zone color scanner. Appl. Opt. 1988, 27, 862–871. [Google Scholar] [CrossRef]
  45. He, X.; Pan, D.; Bai, Y.; Mao, Z.; Gong, F. General exact Rayleigh scattering look-up-table for ocean color remote sensing. In Proceedings of the Remote Sensing of the Marine Environment, Goa, India, 13–17 November 2006; pp. 319–328. [Google Scholar]
  46. Wang, M.; Shi, W. Estimation of ocean contribution at the MODIS near--infrared wavelengths along the east coast of the US: Two case studies. Geophys. Res. Lett. 2005, 32, L13606. [Google Scholar] [CrossRef]
  47. Siegel, D.A.; Wang, M.; Maritorena, S.; Robinson, W. Atmospheric correction of satellite ocean color imagery: The black pixel assumption. Appl. Opt. 2000, 39, 3582–3591. [Google Scholar] [CrossRef] [PubMed]
  48. Stumpf, R.; Arnone, R.; Gould, R.; Martinolich, P.; Ransibrahmanakul, V. A partially coupled ocean-atmosphere model for retrieval of water-leaving radiance from SeaWiFS in coastal waters. NASA Tech. Memo 2003, 206892, 51–59. [Google Scholar]
  49. Ruddick, K.G.; Ovidio, F.; Rijkeboer, M. Atmospheric correction of SeaWiFS imagery for turbid coastal and inland waters. Appl. Opt. 2000, 39, 897–912. [Google Scholar] [CrossRef]
  50. He, X.; Bai, Y.; Pan, D.; Tang, J.; Wang, D. Atmospheric correction of satellite ocean color imagery using the ultraviolet wavelength for highly turbid waters. Opt. Express 2012, 20, 20754–20770. [Google Scholar] [CrossRef]
  51. Wang, M.; Shi, W. The NIR-SWIR combined atmospheric correction approach for MODIS ocean color data processing. Opt. Express 2007, 15, 15722–15733. [Google Scholar] [CrossRef]
  52. Wang, M.; Son, S.; Shi, W. Evaluation of MODIS SWIR and NIR-SWIR atmospheric correction algorithms using SeaBASS data. Remote Sens. Environ. 2009, 113, 635–644. [Google Scholar] [CrossRef]
  53. Zhang, M.; Tang, J.; Dong, Q.; Song, Q.; Ding, J. Retrieval of total suspended matter concentration in the Yellow and East China Seas from MODIS imagery—ScienceDirect. Remote Sens. Environ. 2010, 114, 392–403. [Google Scholar] [CrossRef]
  54. Han, Z.; Jin, Y.; Yun, C. Suspended sediment concentrations in the Yangtze River estuary retrieved from the CMODIS data. Int. J. Remote Sens. 2006, 27, 4329–4336. [Google Scholar] [CrossRef]
  55. Miller, R.L.; McKee, B.A. Using MODIS Terra 250 m imagery to map concentrations of total suspended matter in coastal waters. Remote Sens. Environ. 2004, 93, 259–266. [Google Scholar] [CrossRef]
  56. Cheng, Q.; Liu, B.; Li, T.; Zhu, L. Research on remote sensing retrieval of suspended sediment concentration in Hangzhou Bay by GF-1 satellite. Mar. Environ. Sci. 2015, 34, 558–563+577. [Google Scholar]
  57. Doxaran, D.; Froidefond, J.-M.; Lavender, S.; Castaing, P. Spectral signature of highly turbid waters: Application with SPOT data to quantify suspended particulate matter concentrations. Remote Sens. Environ. 2002, 81, 149–161. [Google Scholar] [CrossRef]
  58. Han, B.; Loisel, H.; Vantrepotte, V.; Mériaux, X.; Bryère, P.; Ouillon, S.; Dessailly, D.; Xing, Q.; Zhu, J. Development of a semi-analytical algorithm for the retrieval of suspended particulate matter from remote sensing over clear to very turbid waters. Remote Sens. 2016, 8, 211. [Google Scholar] [CrossRef]
  59. D’Sa, E.J.; Miller, R.L.; McKee, B.A. Suspended particulate matter dynamics in coastal waters from ocean color: Application to the northern Gulf of Mexico. Geophys. Res. Lett. 2007, 34, L23611. [Google Scholar] [CrossRef]
  60. Chen, X.; Lu, J.; Cui, T.; Jiang, W.; Tian, L.; Chen, L.; Zhao, W. Coupling remote sensing retrieval with numerical simulation for SPM study—Taking Bohai Sea in China as a case. Int. J. Appl. Earth Obs. Geoinf. 2010, 12, S203–S211. [Google Scholar] [CrossRef]
  61. Ma, W.-D.; Wu, C.-Q.; Yin, S.-J.; Wang, C.; Nie, Y.-H.; Lin, H.; Li, J.-R. The remote sensing retrieval of total suspended matter in Xiamen bay. Mar. Environ. Sci. 2016, 35, 770–773+786. [Google Scholar]
  62. Tang, J.; Wang, X.; Song, Q.; Li, T.; Huang, H.; Ren, J.; Jian, W. Statistical inversion models for case II water color elements in the Yellow Sea and East China Sea. Adv. Mar. Sci. 2004, 22, 7. [Google Scholar]
  63. Wang, F.; Wang, S.; Wang, X.; Song, L.; Xu, Q.; Zheng, H. Remote sensing retrieval and dynamic driving force analysis of suspended sediment in Hangzhou Bay. J. Huazhong Norm. Univ. 2014, 48, 112–116+135. [Google Scholar]
  64. Chen, S. Seasonal, neap-spring variation of sediment concentration in the joint area between Yangtze Estuary and Hangzhou Bay. Sci. China Ser. B Chem. 2001, 44, 57–62. [Google Scholar] [CrossRef]
  65. Bai, Y.; He, X.; Pan, D.; Chen, C.u.A.; Kang, Y.; Chen, X.; Cai, W.u. Summertime Changjiang River plume variation during 1998–2010. J. Geophys. Res. Ocean. 2014, 119, 6238–6257. [Google Scholar] [CrossRef]
  66. Truong, C.; Oudre, L.; Vayatis, N. Selective review of offline change point detection methods. Signal Process. 2020, 167, 107299. [Google Scholar] [CrossRef]
  67. Chen, J.; Chen, S.; Ding, P.; Yang, S. Sediment transport along the Nanhui submerged spit of the Yangtze Estuary. Resour. Environ. Yangtze Basin 2001, 10, 166–172. [Google Scholar]
  68. Chen, J.; Wang, B.; Yu, Z. Developments and Evolution of China’s Coast; Shanghai Scientific & Technical Publishers: Shanghai, China, 1989. [Google Scholar]
  69. Liu, J.; Liu, J.; He, X.; Chen, T.; Zhu, F.; Wang, Y.; Hao, Z.; Chen, P. Retrieval of total suspended particulate matter in highly turbid Hangzhou Bay waters based on geostationary ocean color imager. In Proceedings of the Remote Sensing of the Ocean, Sea Ice, Coastal Waters, and Large Water Regions 2017, Warsaw, Poland, 11–14 September 2017; pp. 105–111. [Google Scholar]
  70. Cao, P.; Gu, G.; Dong, Y.; Hu, F. Basic characteristics of sediment transport in Hangzhou Bay. J. East China Norm. Univ. 1985, 3, 75–84. [Google Scholar]
  71. Chen, B.; Liu, J.; Bai, D. Variation of suspended sediment concentretion in offshore Yangtze Estuary. Mar. Geol. Front. 2011, 27, 39–44. [Google Scholar]
  72. Wu, M.; Xu, J.; Feng, Y. Spacial-temporal distribution of suspended sediment concentration in Hangzhou Bay. J. Sediment Res. 2011, 1, 33–37. [Google Scholar]
  73. Zuo, S.; Li, B.; Yang, H. Remote sensing analysis on distribution and movement of surface suspended sediment in the Nanhuizui tidal flat, Yangtze Estuary. J. Waterw. Harb. 2010, 31, 384–389. [Google Scholar]
  74. Zhang, G.; Yang, S.; Yu, Z. Temporal and spatial changes of suspended sediment concentration and resuspension in the Yangtze River Estuary and its adjacent waters. Acta Geogr. Sin. 2004, 59, 260–266. [Google Scholar]
  75. Yang, X.; Mao, Z.; Huang, H.; Zhu, Q. Using GOCI Retrieval Data to Initialize and Validate a Sediment Transport Model for Monitoring Diurnal Variation of SSC in Hangzhou Bay, China. Water 2016, 8, 108. [Google Scholar] [CrossRef]
  76. Du, P.; Ding, P.; Hu, K. Simulation of three-dimensional cohesive sediment transport in Hangzhou Bay, China. Acta Oceanol. Sin. 2010, 29, 98–106. [Google Scholar] [CrossRef]
  77. Zhao, J.; Dai, Z.; Li, J.; Li, W. Study on the characteristics of temporal and spatial changes in properties of surface sediment on near-shore seabed of strong-tide bay: A case from the north bank of Hangzhou Bay in Shanghai. Acta Sedimentol. Sin. 2008, 26, 49–57. [Google Scholar]
  78. Wang, F.; Zhou, B.; Xu, J.; Song, L.; Wang, X. Application of neural network and MODIS 250 m imagery for estimating suspended sediments concentration in Hangzhou Bay, China. Environ. Geol. 2009, 56, 1093–1101. [Google Scholar] [CrossRef]
  79. Su, J.; Wang, K. Changjiang river plume and suspended sediment transport in Hangzhou Bay. Cont. Shelf Res. 1989, 9, 93–111. [Google Scholar] [CrossRef]
  80. Chen, S.; Zhang, G.-a.; Yang, S.; Shi, J.Z. Temporal variations of fine suspended sediment concentration in the Changjiang River estuary and adjacent coastal waters, China. J. Hydrol. 2006, 331, 137–145. [Google Scholar] [CrossRef]
  81. Hu, Y.; Yu, Z.; Zhou, B.; Li, Y.; Shum, C.K. Tidal-driven variation of suspended sediment in Hangzhou Bay based on GOCI data. Int. J. Appl. Earth Obs. Geoinf. 2019, 82, 101920. [Google Scholar] [CrossRef]
  82. Sternberg, R.; Larsen, L.; Miao, Y. Tidally driven sediment transport on the East China Sea continental shelf. Cont. Shelf Res. 1985, 4, 105–120. [Google Scholar] [CrossRef]
  83. Lin, C.-M.; Zhuo, H.-C.; Gao, S. Sedimentary facies and evolution in the Qiantang River incised valley, eastern China. Mar. Geol. 2005, 219, 235–259. [Google Scholar] [CrossRef]
  84. Baker, C.J. The Laminar Horseshoe Vortex. J. Fluid Mech. 1979, 95, 347–367. [Google Scholar] [CrossRef]
  85. Unger, J.; Hager, W.H. Down-flow and horseshoe vortex characteristics of sediment embedded bridge piers. Exp. Fluids 2007, 42, 1–19. [Google Scholar] [CrossRef]
  86. Liu, B.; Cheng, Q.; Zeng, H.; Yang, R. On the suspended sediment concentration distribution and diversity of the waters on both sides of Hangzhou Bay sea-crossing bridge based on GOCI data. J. Hangzhou Norm. Univ. (Nat. Sci. Ed.) 2016, 15, 102–107. [Google Scholar]
  87. Huang, S.; Liu, J.; Cai, L.; Zhou, M.; Bu, J.; Xu, J. Satellites HY-1C and Landsat 8 combined to observe the influence of bridge on sea surface temperature and suspended sediment concentration in Hangzhou Bay, China. Water 2020, 12, 2595. [Google Scholar] [CrossRef]
  88. Zhou, M. Research on the Influence of Sea-crossing Bridge and Island on Suspended Sediment Concentration Based on HY-1C. Ph.D. Thesis, Zhejiang Ocean University, Zhoushan, China, 2021. [Google Scholar]
  89. Sun, X.; Li, C. Influence of Yushan Islands reclamation on growth of south and north deep channels and development of port shoreline. Port Waterw. Eng. 2021, 81–85. [Google Scholar] [CrossRef]
  90. Gao, Y. Study on Three-dimensional Hydrodynamic and Suspended Sediment Transport and Diffusion Characteristics Before and After Yushan Reclamation Project. Ph.D. Thesis, Zhejiang Ocean University, Zhoushan, China, 2022. [Google Scholar]
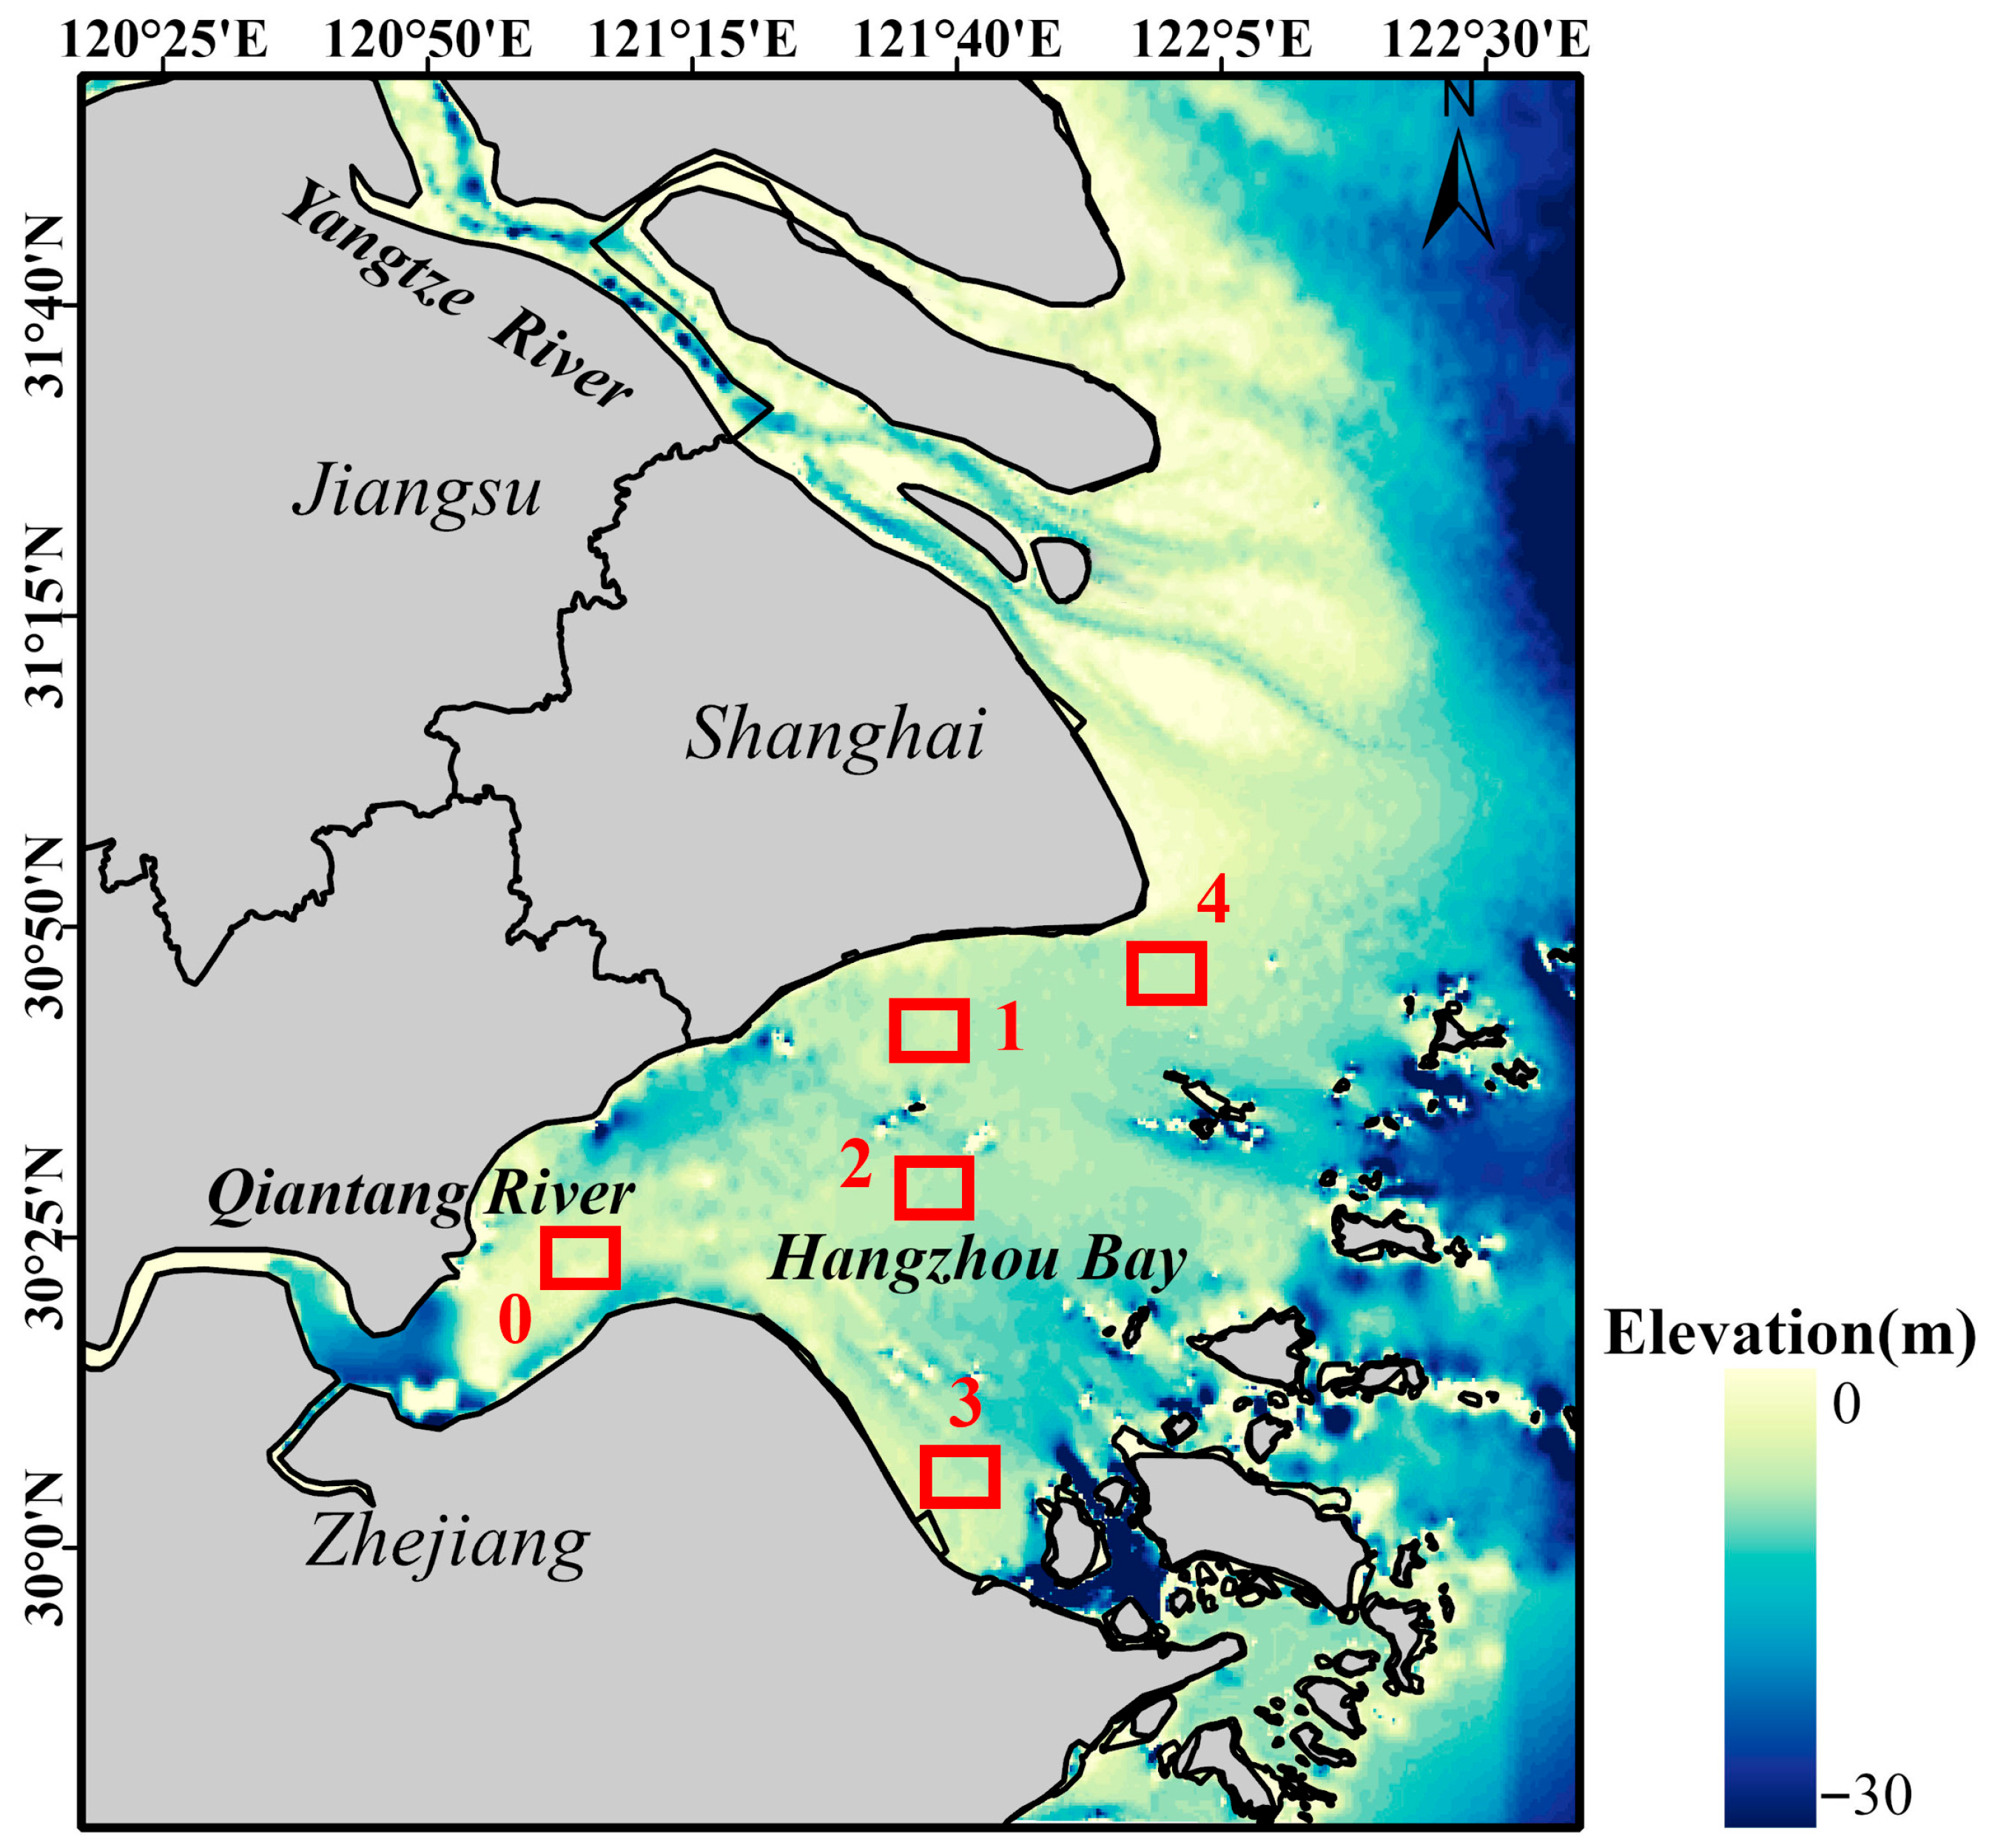
Figure 1. Geographic location of HZB marked with six representative sampling sites. Five regions (box0, box1, box2, box3, and box4) are outlined with red boxes and labeled with corresponding numbers.
Remotesensing 17 03248 g001
Figure 2. Data density and quantity diagram. (a) Density of satellite data in HZB. (b) Number of data by month and year.
Remotesensing 17 03248 g002
Figure 3. Comparison of the R r s values retrieved by MODIS/Aqua using different atmosphere correction algorithms and validation of SWIR-AC-retrieved R r s with in situ data. (a) R r s retrieved by SWIR-AC at 555 nm; (b) R r s retrieved by L2gen at 555 nm; (c) R r s retrieved by OC-SMART at 555 nm; (d) true color image of HZB with the location of HYZY; (e) comparison between SWIR-AC-retrieved and in situ R r s ; (f) comparison of R r s ( 859 ) / R r s ( 555 ) values from SWIR-AC-retrieved and in situ R r s ; (gi) comparison between MODIS-retrieved and in situ R r s at HYZY on (g) 14 July 2021, (h) 6 August 2021, and (i) 18 September 2021.
Remotesensing 17 03248 g003
Figure 4. The empirical retrieval algorithm for TSM in HZB. The color bar on the right side indicates the TSM concentrations for scatter points. The coefficient of determination (R) and RMSE are provided to assess the retrieval performance.
Remotesensing 17 03248 g004
Figure 5. The empirical retrieval algorithms of TSM in HZB. The color bar on the right side indicates in situ TSM concentrations for scatter points. The dashed line represents the 1:1 fitting line.
Remotesensing 17 03248 g005
Figure 6. Long-term average spatial distribution of TSM in HZB averaged from 2003 to 2024.
Remotesensing 17 03248 g006
Figure 7. Monthly average spatial distribution of TSM in HZB from 2003 to 2024.
Remotesensing 17 03248 g007
Figure 8. Long-term trends of TSM in HZB and sediment load from the Yangtze River. (a) Change points detected from the annual mean TSM time series during 2003–2024. (b) Boxplots of TSM in HZB during four time periods: 2003–2007, 2008–2012, 2013–2017, and 2018–2024. The boxplots display the median, interquartile range, and outliers. Colored scatter points represent the monthly mean TSM values in HZB for each year, with colors corresponding to the TSM concentration, as indicated by the color bar on the right. (c) Interannual variations in the mean TSM in HZB and annual sediment load from the Yangtze River. Linear fitting was performed, with k and p representing the slope of the fitting lines and p-value, respectively. Five-year average lines were calculated using a centered five-year sliding window for both variables.
Remotesensing 17 03248 g008
Figure 9. Long-term trends of TSM at five locations in HZB and sediment load of the Qiantang River. (a) Annual average sediment load of the Qiantang River from 2003 to 2023; (bf) TSM trends at box0, box1, box2, box3, and box4. The scatter points represent the annual mean of TSM. The fitting lines show the trend of TSM at each location, with k, p, and shaded areas representing the slope of the fitting lines, p-value, and the 95% confidence intervals, respectively.
Remotesensing 17 03248 g009
Figure 10. Seasonal variations in TSM from 2003 to 2024. The boxplots of TSM values by month are calculated from the monthly average values in HZB over the period 2003–2024. The boxplots display the median and interquartile range. Green, red, yellow, and blue represent the spring, summer, autumn, and winter seasons, respectively.
Remotesensing 17 03248 g010
Figure 11. Long-term seasonal variations in TSM in HZB.
Remotesensing 17 03248 g011
Figure 12. Spatial change rate of TSM in HZB from 2003 to 2024.
Remotesensing 17 03248 g012
Figure 13. Interannual variations and driving factor analysis of TSM in HZB. (a) Interannual variations in annual mean TSM, Yangtze River sediment load, and wind speed; (b) Pearson correlation (|R|) matrix of annual mean TSM in HZB, Yangtze River sediment load, and wind speed; (c) Granger causality p-value matrix (lag = 1 year) of annual mean TSM, sediment load, and wind speed.
Remotesensing 17 03248 g013
Figure 14. Interannual variations in TSM in HZB waters in winter and related environmental factors. (a) Interannual variations in winter TSM, Yangtze River sediment load, and winter wind speed; (b) Pearson correlation coefficients with an eight-year moving window between winter TSM, Yangtze River sediment load, and winter wind speed during 2003–2023, with yellow and green shading indicating periods when winter wind speed and Yangtze River sediment load were the dominant factors for winter TSM; (c) interannual variations in anomalies of TSM in HZB in winter and Yangtze River sediment load; (d) interannual variations in anomalies of TSM and wind speed in winter.
Remotesensing 17 03248 g014
Figure 15. Spatiotemporal distribution of TSM around the Hangzhou Bay Bridge and Yushan Island during 2003–2024. (a) Location of the Hangzhou Bay Bridge and the sampling point of Yushan Island, where the yellow box outlines the area illustrated in (b). (b) Eight cross-sections along the Hangzhou Bay Bridge. (c) Seasonal average distribution of TSM around the Hangzhou Bay Bridge during 2003–2024, with the bridge location displayed by a black rectangular box. (d) TSM seasonal variations along cross-sections within 3 km east and west of the Hangzhou Bay Bridge, extracted from the transects shown in (b). The X-axis represents the perpendicular distance from the Hangzhou Bay Bridge, with the bridge itself marked as 0 (negative to the west; positive to the east). The Y-axis indicates the longitudinal distance along the bridge, measured southward from its northern end. (e) TSM along cross-sections within 3 km east and west of the Hangzhou Bay Bridge in 2003 and 2024. (f) Interannual variations in TSM in the offshore waters of Yushan Island, marked by the blue star in (a).
Remotesensing 17 03248 g015
Table 1. RMSE and MAPE of HTYZ in situ R r s validation of the SWIR-AC algorithm.
Wavelength (nm)NumberRMSE ( s r 1 )MAPE (%)
412100.0031619.09
443100.0027412.56
469100.001728.32
488100.001737.22
531100.001354.73
555100.001263.24
645100.002906.56
859100.0040223.60
Table 2. The empirical TSM algorithms.
AuthorEquation X
Miller and McKee [55] T S M = 1140.25 X 1.91 X = R r s ( 620 ~ 670 )
Cheng1 [56] T S M = 217266 X 2 + 8608.5 X + 3.4644 X = R r s ( 750 ~ 900 )
Cheng2 [56] T S M = 255.84 X 2 + 1141 X + 429.86 X = R r s ( 750 ~ 900 ) / R r s ( 620 ~ 700 )
Doxaran [57] T S M = e x p ( 3.132 X + 3.01 ) X = R r s ( 862 ) / R r s ( 551 )
Han [58] T S M = 10 6.2244 X + 0.892 X = [ R r s 550 + R r s ( 670 ) ] / [ R r s ( 550 ) / R r s ( 670 ) ]
D’Sa [59] T S M = 17.783 X 1.11 X = R r s ( 670 ) / R r s ( 555 )
Chen [60] l g T S M = 4.782 R r s 555 + R r s 670 + 1.490 R r s ( 555 ) R r s ( 670 ) + 0.384
Ma [61] l g T S M = 3.76862 R r s 555 + R r s 670 3.87735 R r s 555 R r s 670 + 3.71737
Tang [62] l g T S M = 23.84071 R r s 555 + R r s 670 0.48532 R r s 555 R r s 670 + 0.58213
Table 3. Long-term (2003–2024) monthly mean, maximum, and minimum TSM in HZB (units: mg/L).
MonthMeanMaxMin
January589.805871.3236.16
February566.345799.3939.53
March499.385785.8329.25
April485.985943.9555.62
May469.875676.1253.56
June337.825853.4322.44
July327.105962.1026.26
August353.055793.7329.49
September393.805929.9925.75
October434.615990.3530.47
November477.775975.6730.42
December773.805994.2238.60
Table 4. Statistical regression analysis of TSM at different locations in HZB.
Locationkp-Value
box02.230.122
box1−3.270.009 **
box2−3.900.021 *
box3−0.190.885
box4−2.000.250
Notes: k is the slope, and p is the p-value. * indicates p < 0.05, while ** indicates p < 0.01.
Table 5. Seasonal statistical regression analysis of TSM in HZB.
Seasonkp-Value
Spring−2.990.014 *
Summer−2.380.017 *
Autumn0.200.879
Winter−0.880.685
Notes: k is the slope, and p is the p-value. * indicates p < 0.05.
Disclaimer/Publisher’s Note: The statements, opinions and data contained in all publications are solely those of the individual author(s) and contributor(s) and not of MDPI and/or the editor(s). MDPI and/or the editor(s) disclaim responsibility for any injury to people or property resulting from any ideas, methods, instructions or products referred to in the content.