Article

Submesoscale Eddies Identified by SWOT and Their Comparison with Mesoscale Eddies in the Tropical Western Pacific

by
Lunyi Cao
1,
Yongchui Zhang
2,*,
Yang Wang
2,
Mei Hong
2,
Yongliang Wei
1,
Chunhua Qiu
3 and
Xingyue Xia
2
1
College of Marine Science and Ecological Environment, Shanghai Ocean University, Shanghai 201306, China
2
College of Meteorology and Oceanography, National University of Defense Technology, Changsha 410073, China
3
College of Marine Science, Sun Yat-sen University, Guangzhou 510275, China
*
Author to whom correspondence should be addressed.
Remote Sens. 2025, 17(18), 3242; https://doi.org/10.3390/rs17183242
Submission received: 9 August 2025 / Revised: 7 September 2025 / Accepted: 18 September 2025 / Published: 19 September 2025

Abstract

Highlights

What are the main findings?
  • SWOT identifies 176 mesoscale eddies (vs. 162 by DUACS) and shows 15% stronger amplitudes.
  • The distribution of submesoscale eddies’ abundance, size, and amplitude across the tropical western Pacific.
What is the implication of the main finding?
  • Conventional DUACS-based studies underrepresent submesoscale eddies, calling for updated parameterizations in ocean and climate models.
  • It is conducive to revealing the potential role of submesoscale eddies in the multi-scale dynamic processes of the ocean.

Abstract

Conventional altimeter satellites, such as TOPEX/Poseidon and Jason series, can identify ocean mesoscale eddies (MEs) but cannot effectively distinguish submesoscale eddies (SMEs) due to horizontal resolution limitations. The emergence of the Surface Water and Ocean Topography (SWOT) satellite has enabled the resolution (or detection) of SMEs. At present, Data Unification and Altimeter Combination System (DUACS) (MEs-resolving) and SWOT (SMEs-resolving) satellites operate concurrently in orbit, however a systematic comparison and analysis of their observational outputs has yet to be conducted. Using a closed-contour scalar analysis method, this study identifies SMEs in the tropical western Pacific Ocean and compares the results with those from the dataset. The latitude-dependent Rossby deformation radius is employed to differentiate MEs from SMEs. For MEs, SWOT detects 176 per 10.5-day sub-cycle, while DUACS detects 162, which are roughly equivalent. For SMEs, SWOT identifies 273 per sub-cycle, far exceeding the 13 detected by DUACS. For amplitudes, DUACS measures 5.22 cm and 3.67 cm for MEs and SMEs, respectively, while the values reported by the SWOT satellite are 6.13 cm and 4.49 cm. In both datasets, cyclonic eddies are more prevalent in all cases except for the SMEs detected by SWOT, where anticyclonic eddies slightly outnumber cyclonic eddies. Additionally, during the trial operation and scientific orbit phases, SWOT is able to resolve 29 SMEs per orbit. The results indicate that high-resolution data can distinguish phenomena that conventional satellite altimeters cannot capture, providing valuable references for the analysis and application of SME characteristics.

1. Introduction

Submesoscale eddies (SMEs) are key elements in ocean dynamics, bridging mesoscale eddies (MEs) and microscale turbulence and facilitating the ocean energy cascade [1,2]. SMEs significantly influence vertical energy transfer, material/tracer transport, and upper-ocean stratification [2,3,4,5,6]. Characterized by spatiotemporal heterogeneity, quasi-geostrophic SMEs typically have horizontal scales of 1–50 km and vertical extents of 10–200 m, which are approximately 1–2 orders of magnitude smaller than MEs. Lifespans range from 1 to 10 days, indicative of transient evolution [3,7,8]. Radial scales increase latitudinally, from ~25 km at ±25° latitude to ~115 km near the equator, following a distinct linear dependence [9]. Near the equator, however, eddy boundaries are not defined by the excessively large Rossby deformation radius [9,10]. SMEs interact with frontal processes and baroclinic instabilities, influencing localized energy dissipation and material transport [1,11,12].
Research on SMEs has primarily utilized numerical simulations. These simulations demonstrate that SME processes exhibit high sensitivity to model parameterizations. Their diabatic mixing effects can introduce thermohaline transport prediction biases of 15–20%, underscoring the need to improve subgrid parameterization schemes [13,14,15]. Model outputs also show significant discrepancies due to SMEs’ rapid evolution and the idealized fluid parameters used in simulations [15]. In contrast, in situ measurements, satellite observations, and laboratory experiments provide higher accuracy but face stringent observational constraints. Resource-intensive methods—such as dense underwater buoy arrays and ship-towed CTD (Conductivity Temperature Depth) measurements—have proven insufficient for systematic global-scale mapping of SME spatiotemporal distributions [16].
To address observational limitations for SMEs, the Surface Water and Ocean Topography (SWOT) satellite was launched in December 2022 through a joint U.S.–French initiative [17,18,19]. Its dual-sensor payload combines a Ka-band Radar Interferometer (KaRIn) with a Nadir altimeter. With a 120-km swath width achieving ≥90% global coverage, SWOT provides continuous ocean topography data critical for hydrological cycles, climate studies, and water resource management [20,21]. Recent analyses confirm SWOT’s capacity to resolve fine-scale eddies [22] and demonstrate high accuracy in capturing SME dynamics when validated against moored observations in the northwestern Pacific [23].
During the SWOT Calibration/Validation (Cal/Val) phase with a 1-day revisit cycle, a dataset of 28 orbital passes was cumulatively acquired along the satellite ground tracks. While this limited spatial sampling proved inadequate for global coverage, it validated the satellite’s measurement accuracy [17]. Following transition to the 21-day revisit scientific orbit phase, SWOT achieved ≥90% global coverage. However, the extended revisit interval combined with rapid sea level anomaly (SLA) variability has induced data continuity gaps during repeat observations [24,25,26], necessitating enhanced data inversion and application methodologies.
The western Pacific Warm Pool (100°E–180°E, 25°S–25°N) exhibits dense island distributions and enhanced submesoscale variability, creating favorable conditions for SME generation [22]. Conventional satellite altimetry reveals regularly structured SLA patterns in this region. However, traditional observational limitations persistently constrain SME detection, hindering understanding of SME dynamics and accurate representation of fine-scale processes in ocean models. With its 2-km grid resolution and ≥90% global coverage, the SWOT satellite significantly improves SME detection efficiency.
This study investigates SME characteristics by integrating SWOT satellite data with traditional SLA products derived from Nadir altimetry. Results demonstrate SWOT’s enhanced capability in SME identification, enabling advanced analysis of generation mechanisms and dynamic properties. The article structure comprises Section 2 detailing datasets (sources/spatiotemporal coverage), data processing techniques (SLA reconstruction/quality control), and a multi-scale eddy detection scheme; Section 3 analyzing ME and SME distributions in the tropical western Pacific using conventional altimetry, with comparative assessment leveraging SWOT Cal/Val data and one year of scientific orbit observations; Section 4 conducting quantitative evaluation of eddy identification differences between datasets, including in situ validation; Section 5 examining sensitivity of eddy characteristics to globally unified versus latitude-dependent variable radius thresholds; and Section 6 summarizing key findings on SME dynamics and broader implications for ocean modeling.

2. Materials and Methods

2.1. Altimetry Datasets

The gridded SLA product originates from the Data Unification and Altimeter Combination System (DUACS) processing chain. Developed collaboratively by CNES and CLS Satellite Oceanography Division, DUACS integrates Level-3 along-track data from TOPEX/Poseidon, Jason-series satellites, and other missions. Its workflow encompasses preprocessing, quality control, and optimal interpolation, generating SLA products relative to a 1993–2012 mean field [27,28]. A global ocean fitting procedure ensures data consistency. The standard DUACS dataset maintains 0.25° × 0.25° spatial and 1-day temporal resolution.
This study utilizes Level-3 ocean products from the SWOT mission to investigate SME dynamics [29,30]. During the commissioning phase, 28 orbital passes with 120-km swath widths provide daily resolved observations critical for initial validation [19,24,31]. Following transition to the science orbit phase, the 21-day repeat cycle expands cross-track coverage significantly, supporting global-scale SME research despite reduced temporal resolution [25,26].

2.2. Data Processing

2.2.1. Preprocessing of Single-Orbit Data

As Figure 1a shows, the Nadir altimeter provides uniform measurements across the central swath along the satellite track, but systematic differences exist with KaRIn observations. Although nadir data fill central swath gaps, interpolation induces mismatches in the study region. Direct interpolation of merged data causes spatial discontinuities in the central swath (Figure 1b). Excluding nadir data prior to interpolation eliminates this effect, yielding smoother results with enhanced data integrity (Figure 1c) [32].
Figure 1b exhibits a 20% wider cross-track swath than Figure 1a due to interpolation filling 10-km data-void margins flanking the satellite track. However, these interpolated margins are excluded from the final product to maintain centimeter-level accuracy. After excluding interpolated margins, the effective swath width is reduced to 100 km.

2.2.2. Conversion to Gridded Datasets and the Sub-Cycling Strategy

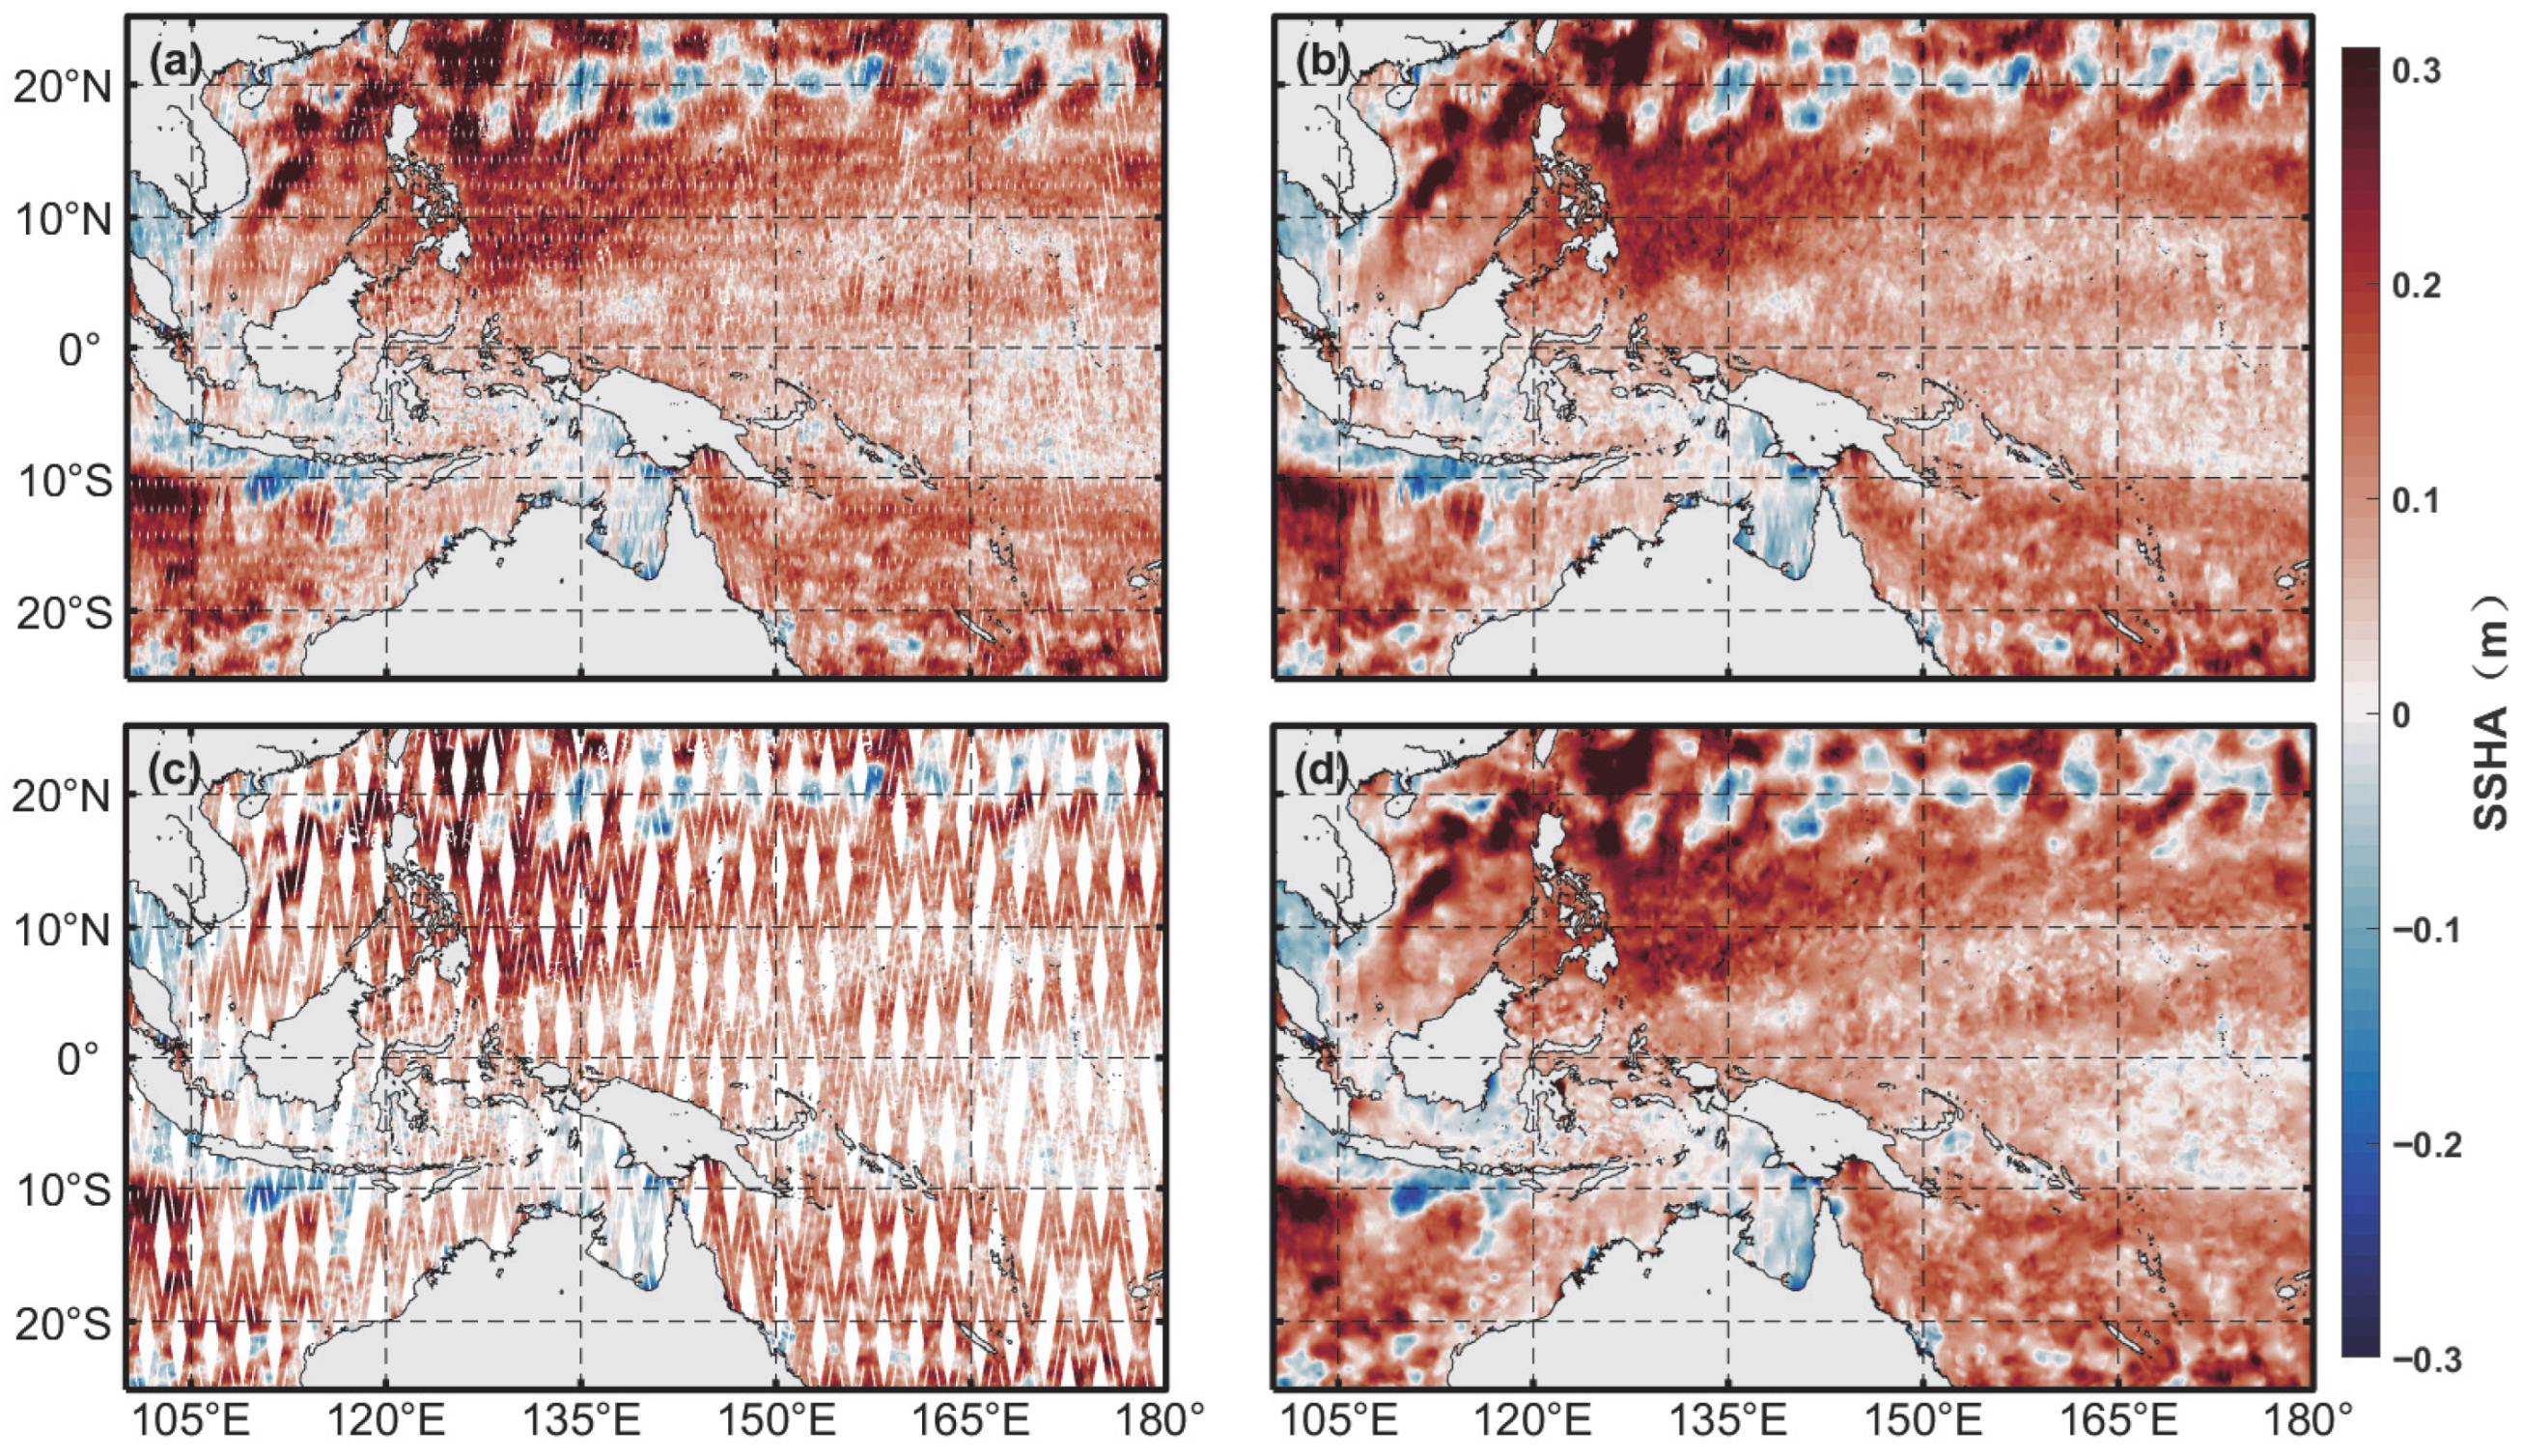
After resolving single-orbit artifacts, processed swaths are gridded. SWOT’s 21-day global coverage cycle (Figure 2a) causes spatiotemporal mismatches as the orbital revisit interval exceeds the 7–10-day lifespan of SMEs. This results in spatial discrepancies during direct gridding (Figure 2b).
Considering the operating mechanism of the SWOT satellite, its orbital cycle can be divided into two sub-cycles: the first sub-cycle scans roughly half of the globe but leaves gaps between adjacent ground tracks, and the second sub-cycle fills these gaps. This leads to a 10–12 day time offset between the two sub-cycles, causing severe spatiotemporal mismatches. To resolve this, the 21-day orbital cycle is divided into two 10.5-day sub-cycles, reducing temporal gaps between adjacent orbits to ≤2 days (Figure 2c). This sub-cycling strategy improves temporal consistency and data fusion but introduces diamond-shaped gaps (Figure 2d), filled via optimized interpolation. Qiu et al. [33] refined this approach, achieving:
(1)
≤2-day temporal gaps mitigating decorrelation-induced inconsistencies (Figure 2c);
(2)
Enhanced cross-orbit data fusion coherence.
While this strategy reduces spatial discrepancies (cf. Figure 2b), diamond-shaped gaps require interpolation. Additionally, sub-cycling doubles eddy sampling density, this makes it possible to more fully detect all eddies within a single cycle, enabling precise characterization of SME temporal evolution and mechanistic studies.

2.2.3. Inland Water Detection and Land Masking

A 0.125° DUACS land mask invalidates terrestrial and freshwater pixels while preserving oceanic data. Minor coastal boundary mismatches may persist due to resolution differences between datasets, potentially causing limited false eddy identifications.

2.3. Eddy Detection Methodology

Common approaches for eddy detection includes: Closed Contour method, which identifies eddy features using SLA anomalies observed by satellite altimeters [34]; The Locally Averaged Velocity Gradient Tensor (WA) method identifies vortices based on the necessary condition for vortex existence [35]; Stream vector method, similar to the WA method, determines whether the velocity field exhibits rotational flow characteristics [36]. Under different environmental conditions, each method possesses its own respective advantages [37].
Although these methods were originally designed for ME detection, they remain applicable to SMEs due to structural similarities despite differences in spatiotemporal scales [38]. This study employs the closed contour method for SME detection in the western Pacific.
Leveraging SWOT’s high-resolution capabilities, the eddy detection parameters are configured as follows:
  • SLA values are constrained between −100 cm and 100 cm. This threshold aligns with the intensity spectrum of SMEs, filtering out extreme values associated with larger ME or basin-scale phenomena.
  • Closed contours must exhibit genuine closure, defined as a continuous loop consisting of at least three discrete points. Additionally, the longitudinal and latitudinal spans of these contours must exceed 0.1°, effectively excluding artifacts generated by noise or subgrid-scale fluctuations.
  • The maximum distance between any two points on a closed contour is limited to ensure that the detected features conform to local SME-specific spatial scales (with diameters ranging from 15 km to 80 km depending on the latitude).
  • Consistency between eddy core location and contour geometry is rigorously validated. The geometric centroid of each closed contour must lie within its boundaries, and deviations between the centroid and dynamically derived eddy centers are minimized.
  • Leveraging the high-resolution capabilities of SWOT, amplitude and radius thresholds are applied: eddies are retained only if their SLA amplitudes exceed 2 cm, and their equivalent radii (calculated from contour areas) surpass 7 km. These thresholds mitigate false detections induced by instrumental noise or small-scale turbulent motions.

2.4. Criteria for Distinguishing ME and SME

MEs typically exhibit horizontal scales comparable to or exceeding the regional Rossby radius, whereas SMEs show spatial scales 1–2 orders of magnitude smaller than the local Rossby radius [10]. In this study, the Rossby deformation radii is defined as the ME-SME boundary. For example, at 25° latitude (both hemispheres), the boundary occurs at 25 km, increasing toward the equator.
Given the extensive latitudinal coverage of this study (25°S–25°N), particular attention must be paid to the significant latitudinal variation in the Rossby radius of deformation within this domain. In the equatorial proximity zone (5°S–5°N), the drastic reduction in the planetary vorticity gradient causes the magnitude of the Rossby deformation radius to exceed typical dynamic thresholds, thereby invalidating its conventional hydrodynamic significance. Consequently, the demarcation criteria for MEs and SMEs in this core region require the adoption of parameter systems derived from adjacent latitude bands. Accordingly, based on the variations in the Rossby deformation radius, this study divides the research area into four latitudinal sub-regions: the first sub-region covers 10°S–10°N; the second sub-region comprises 10°S–15°S and 10°N–15°N; the third sub-region spans 15°S–20°S and 15°N–20°N; and the fourth sub-region encompasses 20°S–25°S and 20°N–25°N. As shown in Table 1, based on the local Rossby deformation radius in each sub-region, the threshold radii for MEs and SMEs are calculated as 60 km, 45 km, 35 km, and 30 km, respectively. In low-latitude regions, the Rossby deformation radius exhibits extremely sharp meridional variations; therefore, the threshold for this area is set to be the same as that for the 5°N–10°N region. Within only a few degrees from latitude 0°, the Rossby deformation radius drops abruptly from several hundred kilometers to just a few tens of kilometers. This steep change not only reflects the unique dynamics of the equatorial region but also poses challenges for the classification of eddy scales. Merging the equatorial region with adjacent low-latitude regions and applying a unified threshold can avoid classification biases caused by extreme values, while also increasing the sample size and improving statistical robustness. However, such merging may obscure the distinctive dynamical characteristics of the equatorial zone and should therefore be treated with caution in future studies when data with sufficiently high spatial and temporal resolution become available.
SWOT satellite’s eddy observation capability exhibits regional heterogeneity. In high-energy zones (e.g., mid-latitude western boundary currents), intense submesoscale turbulent processes cause energy cascades that elevate the detection threshold to 30–45 km. Conversely, in low-latitude quiescent hydrodynamic regions, stable stratification and reduced inertial-turbulent energy enable SWOT to resolve SME structures down to 15 km [39]. Given the study area’s low-latitude focus (25°S–25°N), SWOT can detect eddies >15 km. Subsequent analyses will integrate latitudinal observation gradients via a 3D parameterized correction model.

3. Results

3.1. Eddies Identified by DUACS

3.1.1. Typical Eddies

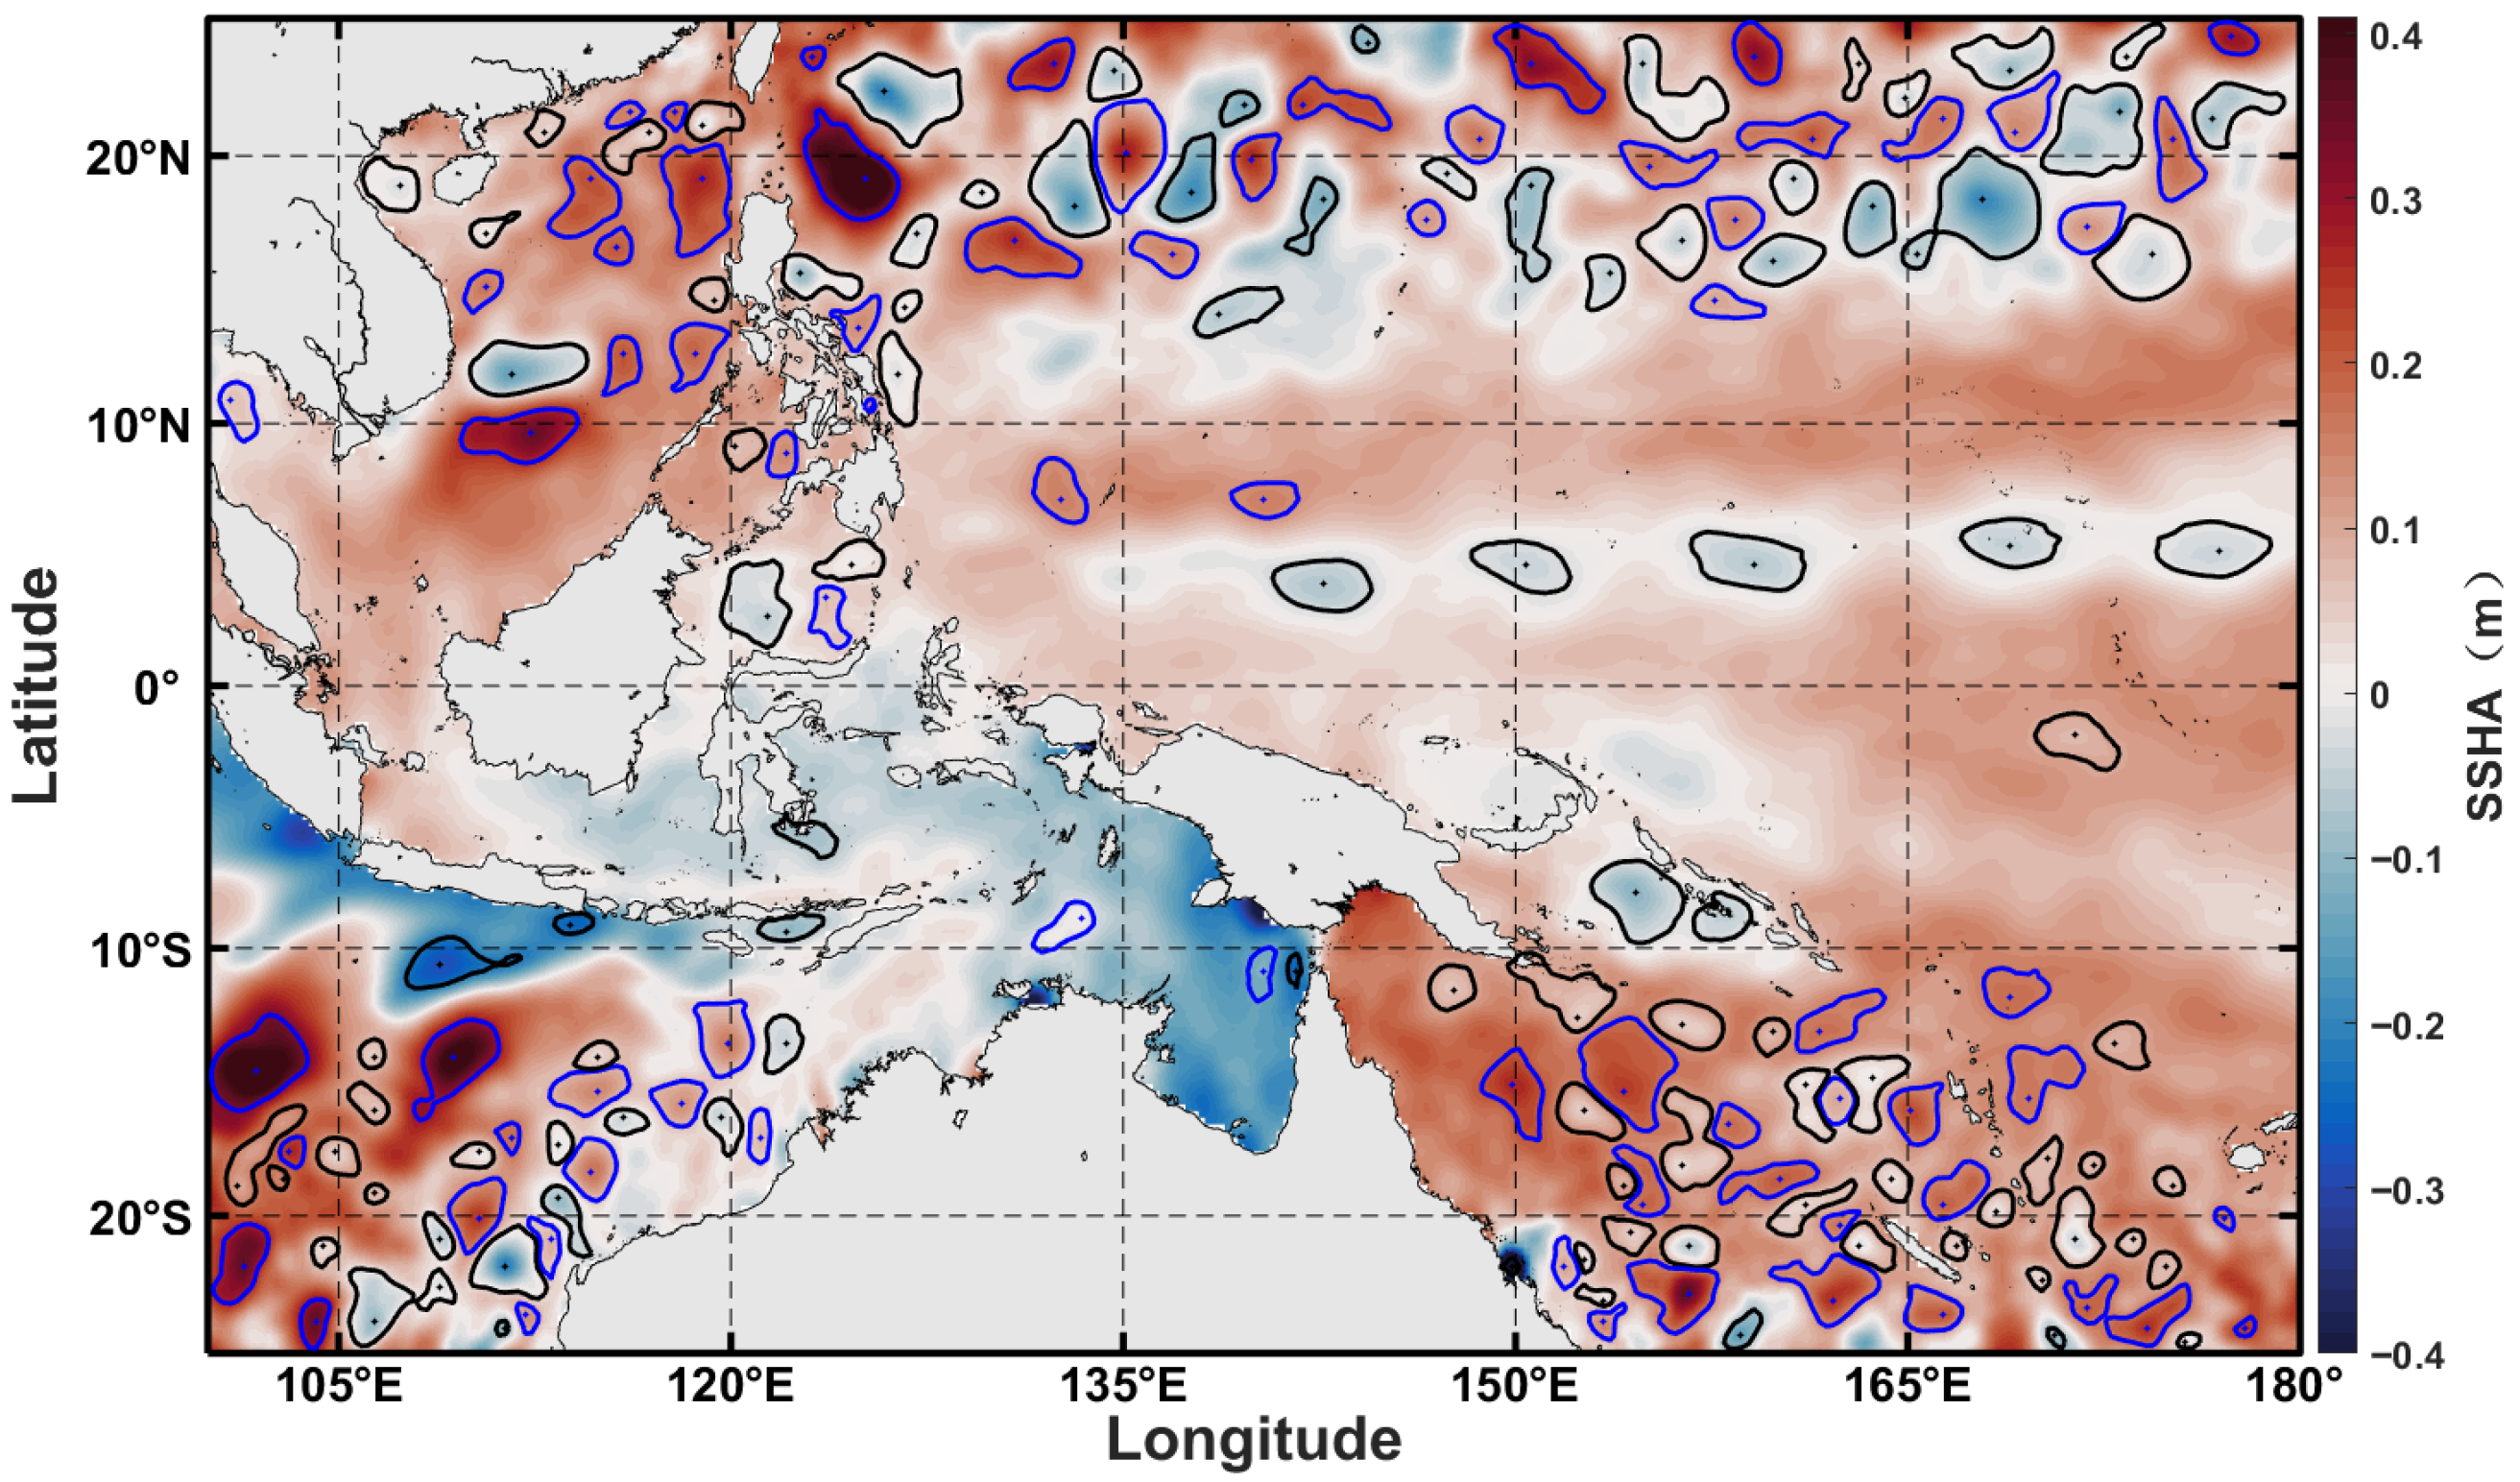
As shown in Figure 3, the independent detection results of eddies on September 18, 2023, are presented, with SLA values as the background field, overlaid with eddy boundaries: cyclonic eddies (black contours) and anticyclonic eddies (blue contours). MEs are mainly concentrated in the mid-latitude zones (10°N–25°N and 10°S–25°S), while eddy activity in the equatorial region is minimal.

3.1.2. Statistical Characteristics

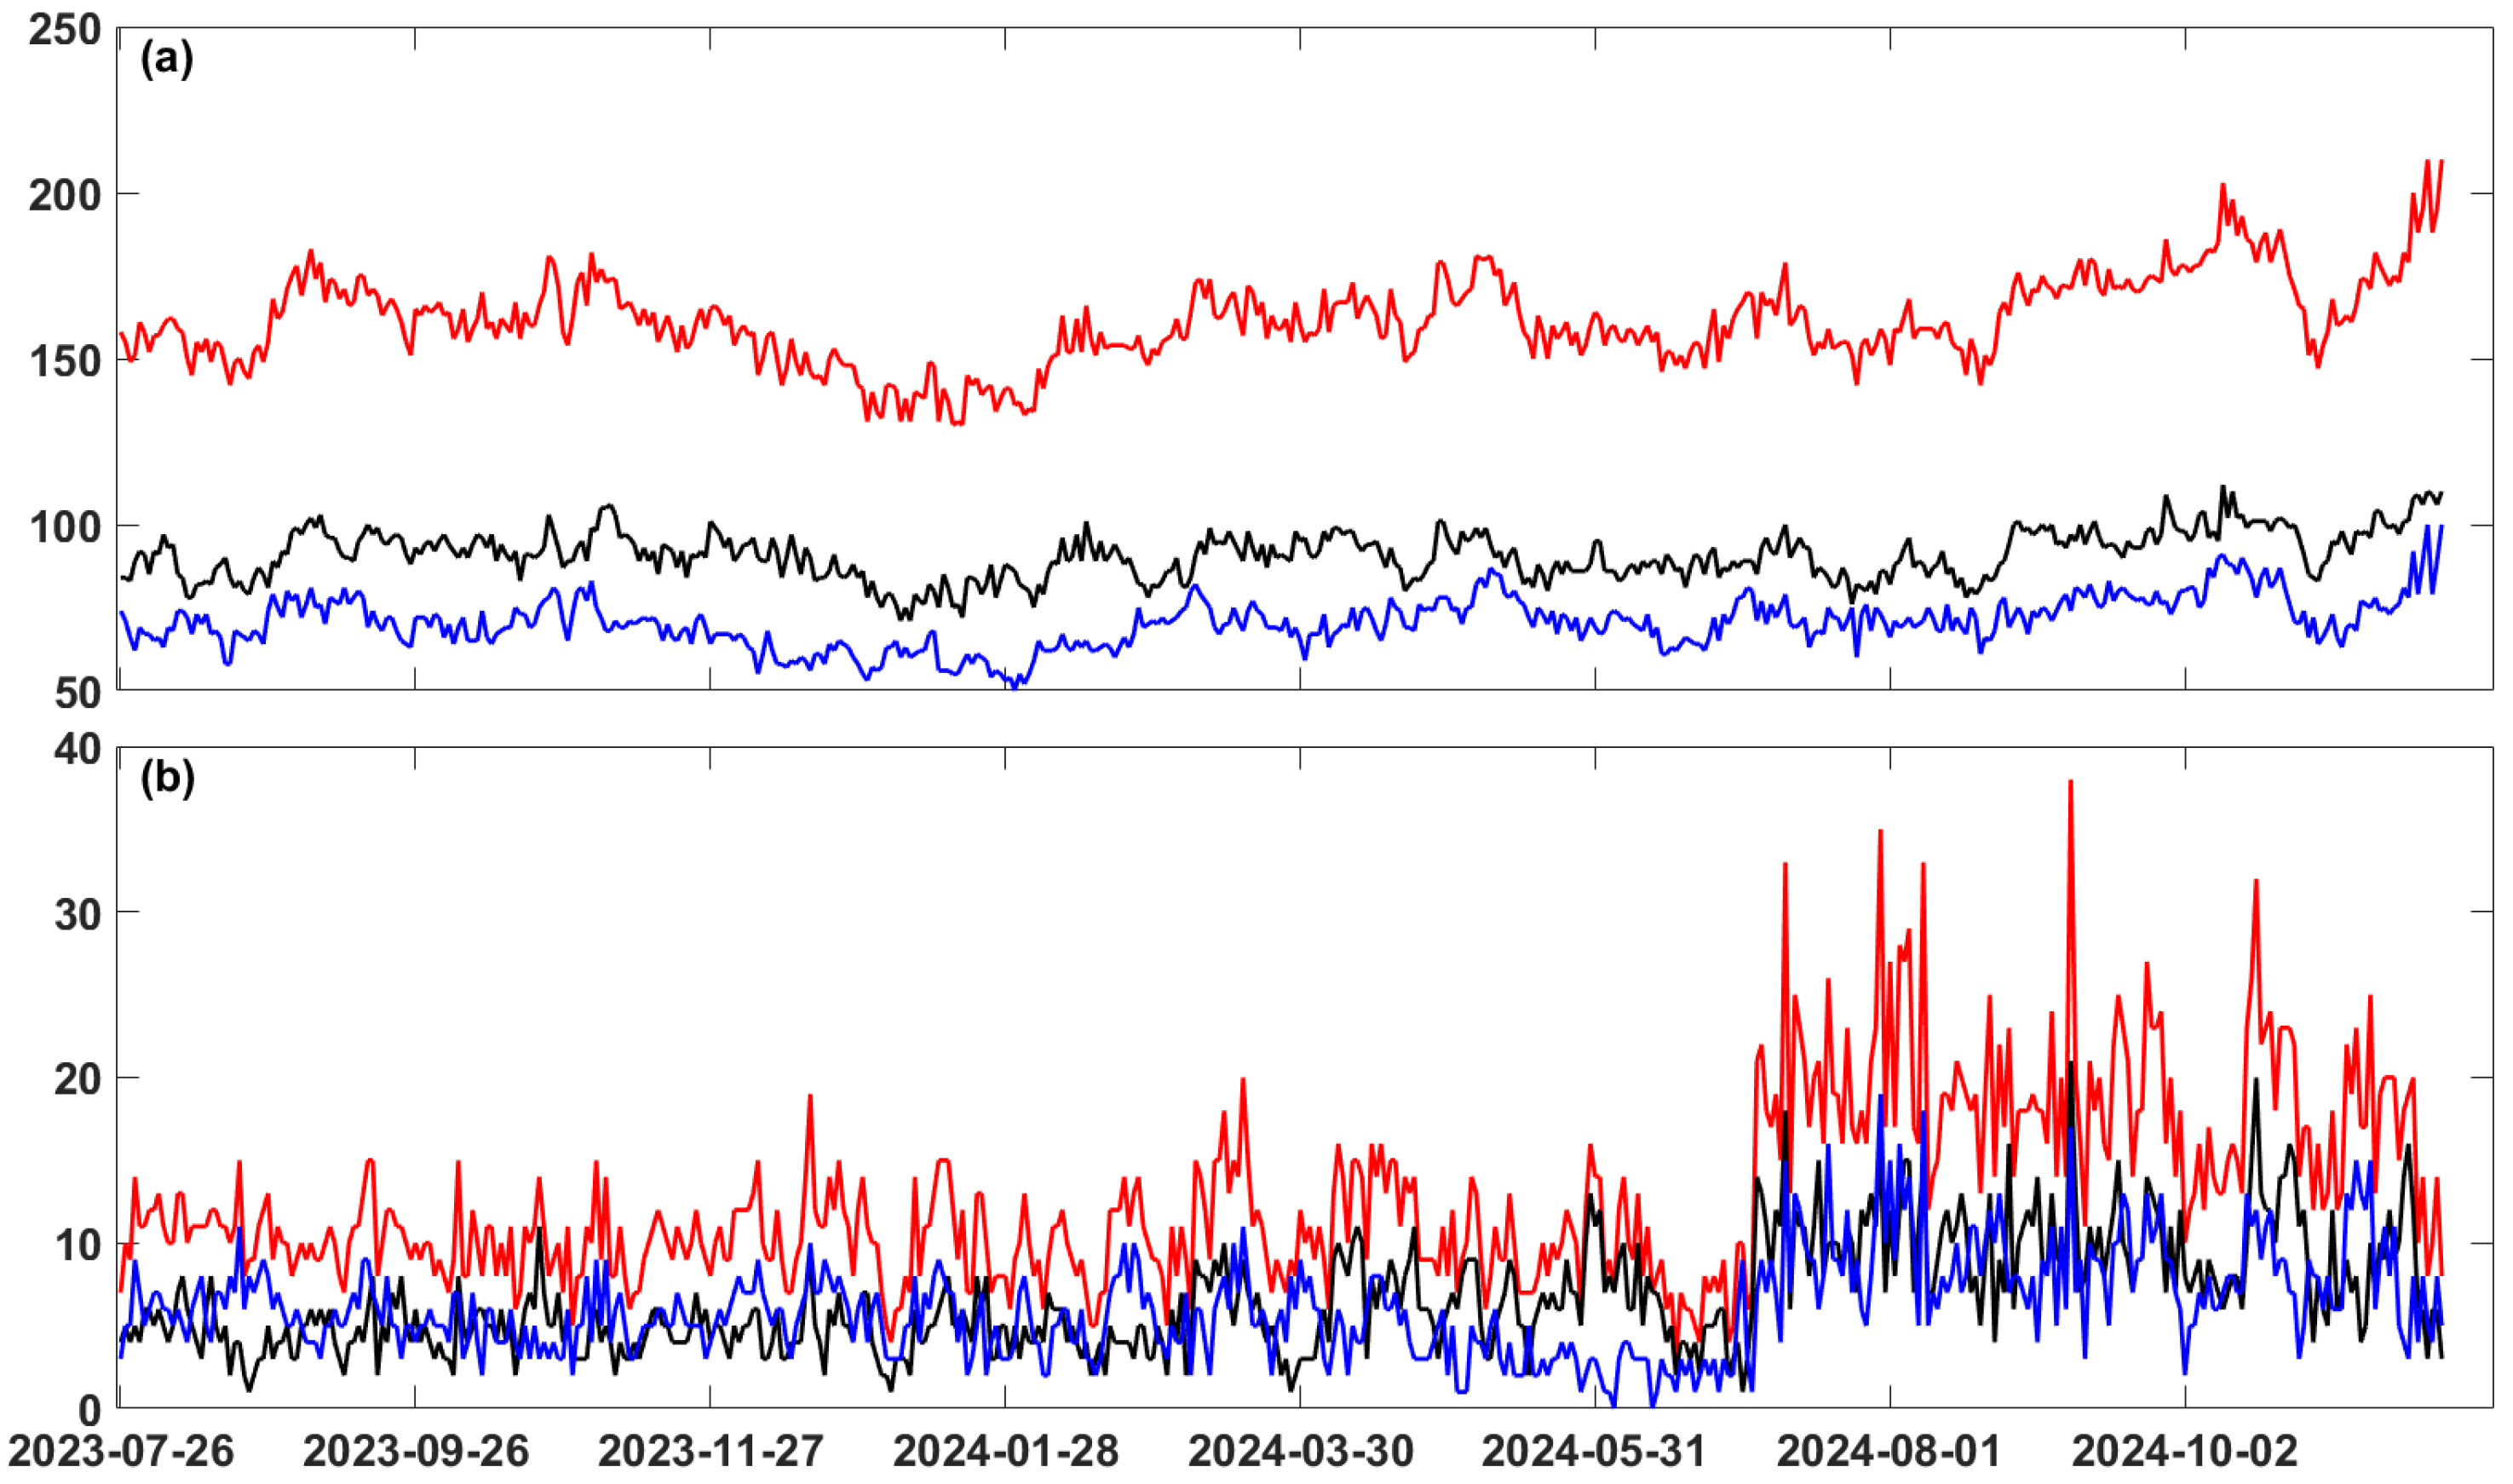
First, MEs in the tropical western Pacific are statistically characterized using DUACS data to extract spatiotemporal features. During 26 July 2023–25 November 2024, the region averaged 161 MEs per day. Figure 4a illustrates the temporal evolution of eddy counts, revealing a marked increase in eddy numbers during the autumn and winter seasons of 2023 and 2024. Among all detected eddies, cyclonic eddies exhibit a significantly higher mean daily count (91) compared to anticyclonic eddies (71). As shown by the black curve (cyclonic) consistently exceeding the blue curve (anticyclonic) in Figure 4a, this asymmetric distribution persisted throughout the study period.
While conventional DUACS data identified MEs in the tropical western Pacific, SME detection is also attempted. However, DUACS’ 0.25° resolution captured limited SMEs, averaging 13 per day (7 cyclonic, 6 anticyclonic)—only 8% of ME counts. Figure 4b shows SME counts consistently below ME levels with no significant cyclonic-anticyclonic asymmetry. Notably, SME numbers increases from July to mid-November 2024, a phenomenon requiring further mechanistic investigation.
Evaluating DUACS performance in ME/SME identification reveals its capabilities and limitations, establishing a baseline for SWOT analysis. Comparative assessment of conventional versus SWOT high-resolution observations across eddy scales clarifies their complementary roles in resolving eddy distributions and dynamics, providing empirical foundations for understanding SME generation mechanisms.
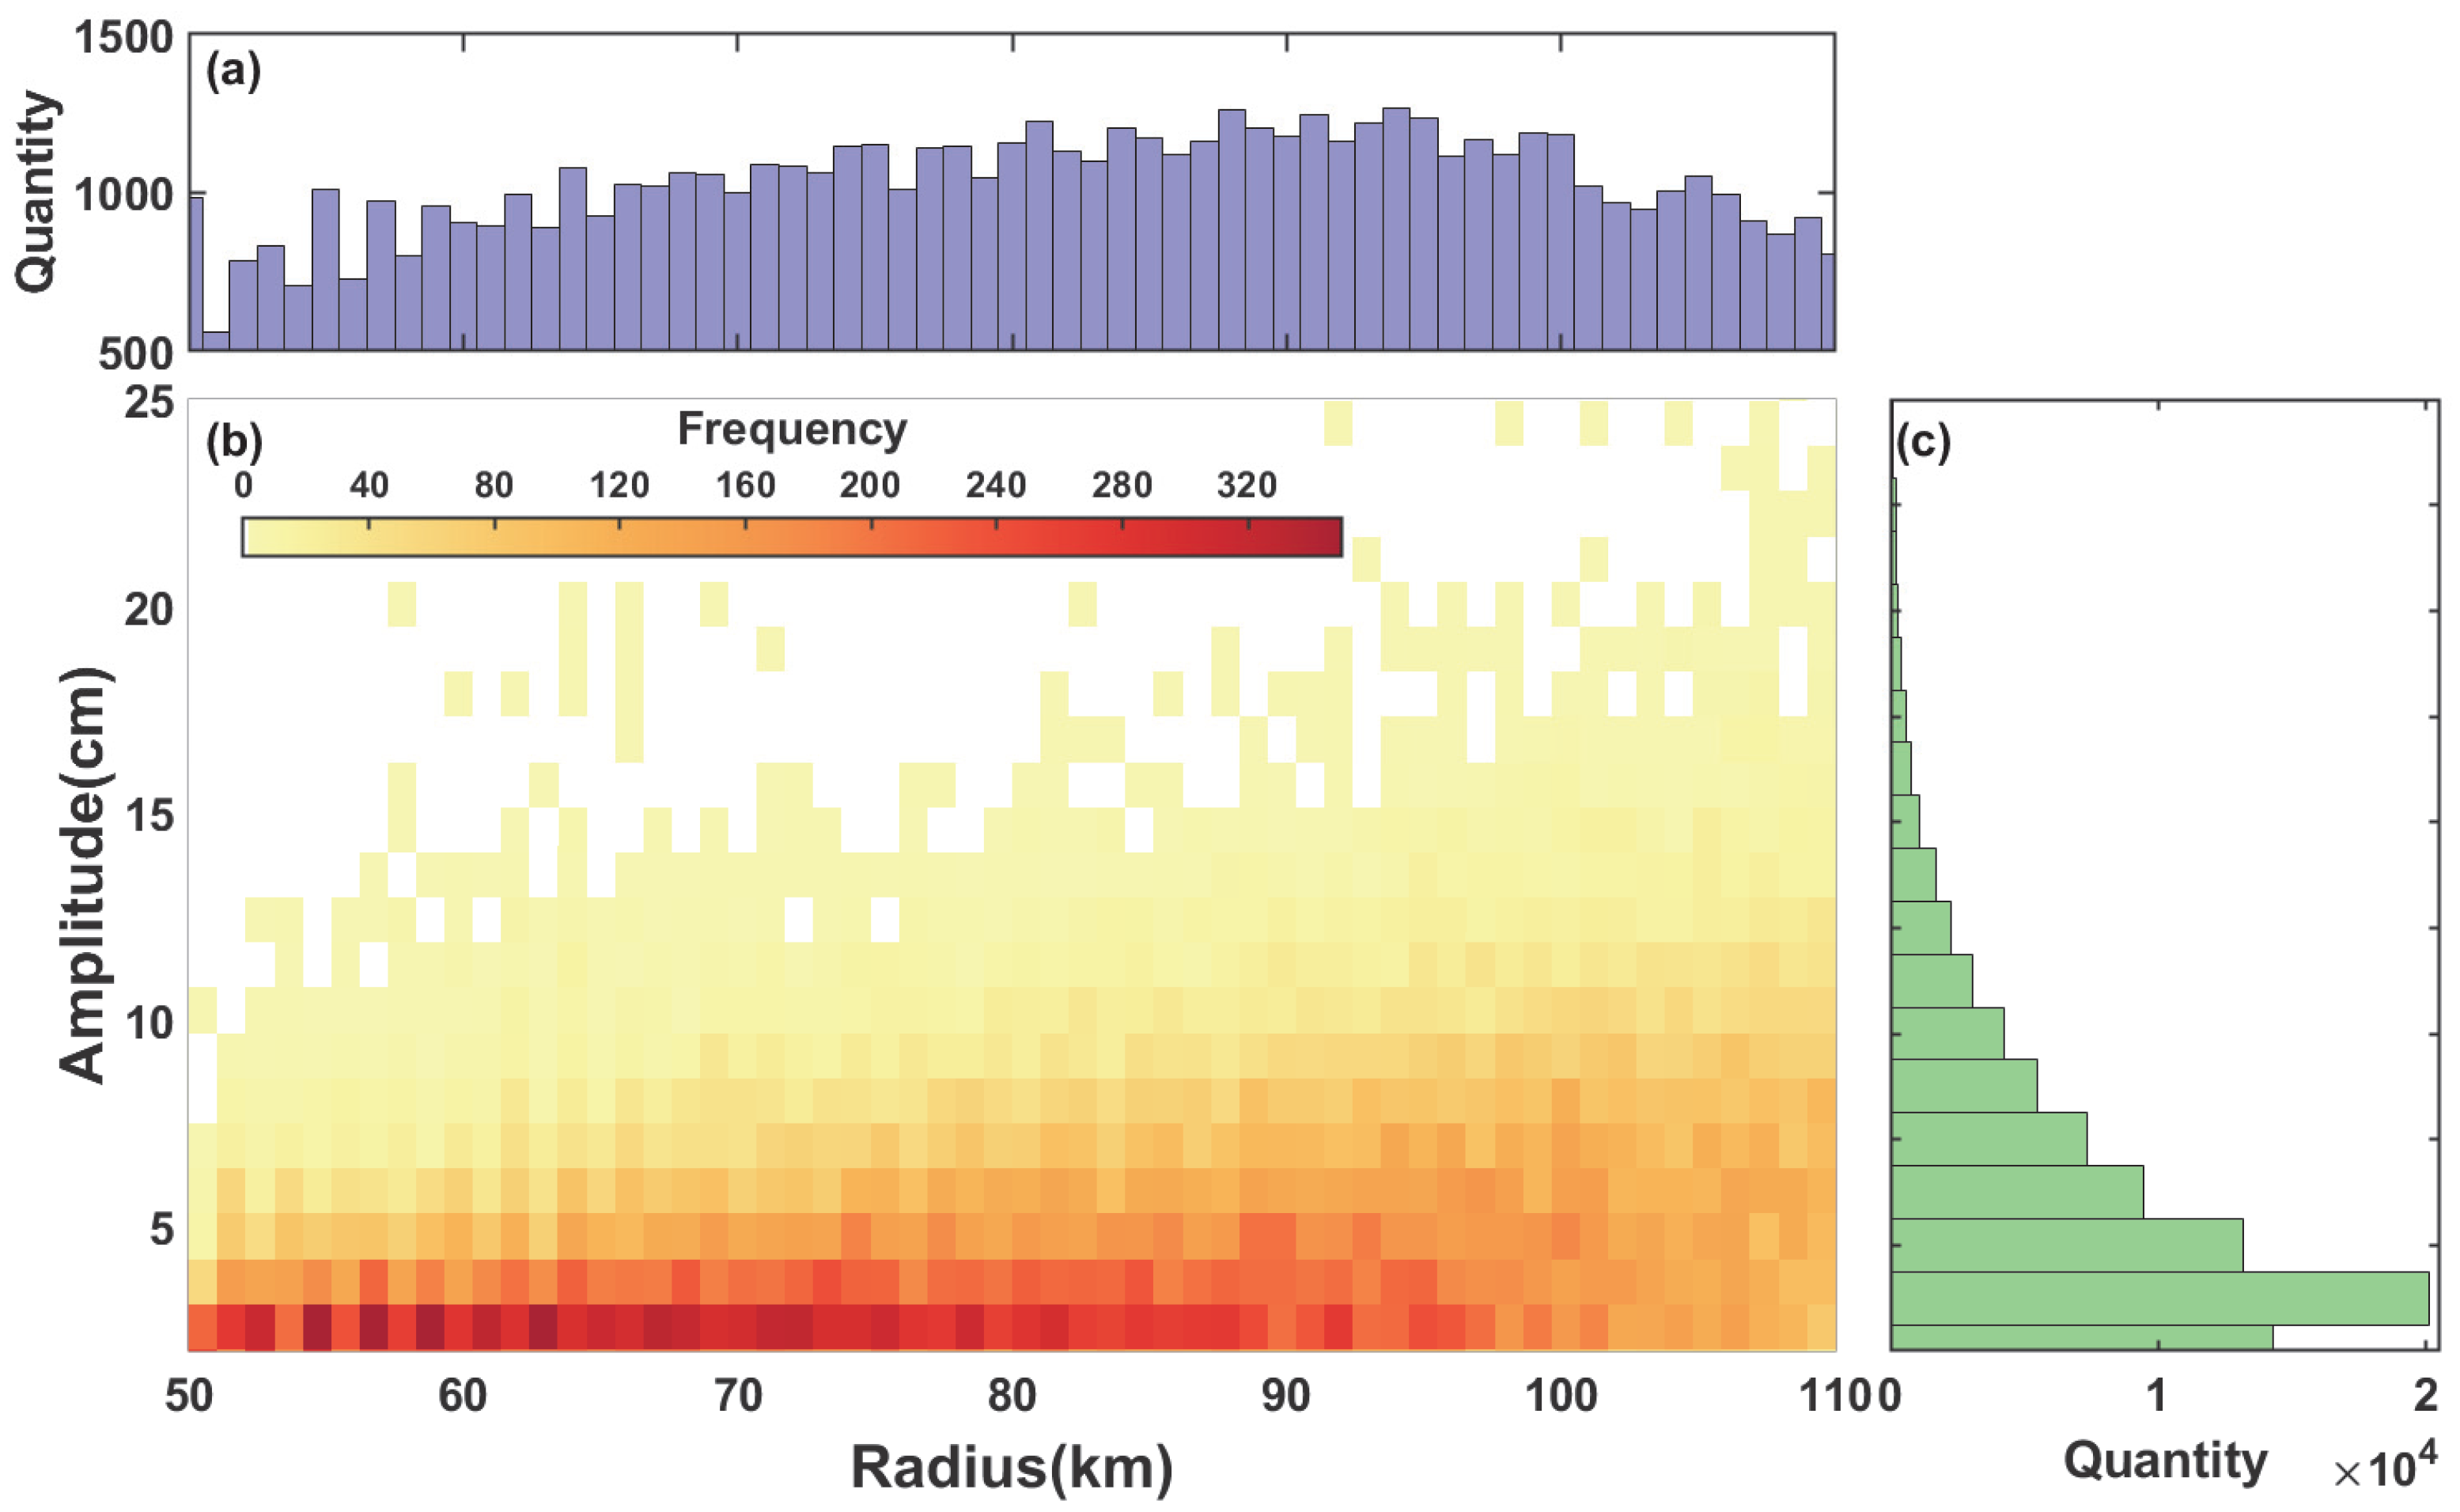
Subsequent analysis employs frequency maps to investigate the characteristics of MEs and SMEs in the western tropical Pacific, focusing on their counts, radii, and amplitudes. As illustrated in Figure 5, eddy distributions reveal distinct trends. Radii of MEs exhibit relatively uniform spatial patterns, with a gradual increase in size across the region. However, the limitations of the DUACS dataset introduce uncertainties: eddies with radii below 50 km likely represent spurious detections lacking physical coherence, whereas those exceeding 50 km demonstrate stable counts (1000), which is only about forming the valid ME population.
Amplitude distributions show stronger clustering than those of radii, with most values concentrated between 2 cm and 8 cm. Few eddies surpass 8 cm, indicating that while eddy sizes vary widely, their energy metrics (amplitude) remain tightly constrained.

3.2. Eddies Identified by SWOT

3.2.1. Eddies During Commissioning Phase

This section validates SWOT’s eddy detection capability using single-orbit swaths. Based on Section 2 single-orbit processing results, eddies identified within 100-km swath widths demonstrate SWOT’s resolution capacity for SMEs.
To minimize the detection of spurious eddies, a minimum radius threshold of 7 km is established as a screening criterion. Additionally, an amplitude threshold of 2 cm is applied to further ensure the reliability of the identification results. These thresholds are empirically determined to balance sensitivity and specificity, consistent with the SWOT mission’s preliminary objectives for validating SME dynamics [39].
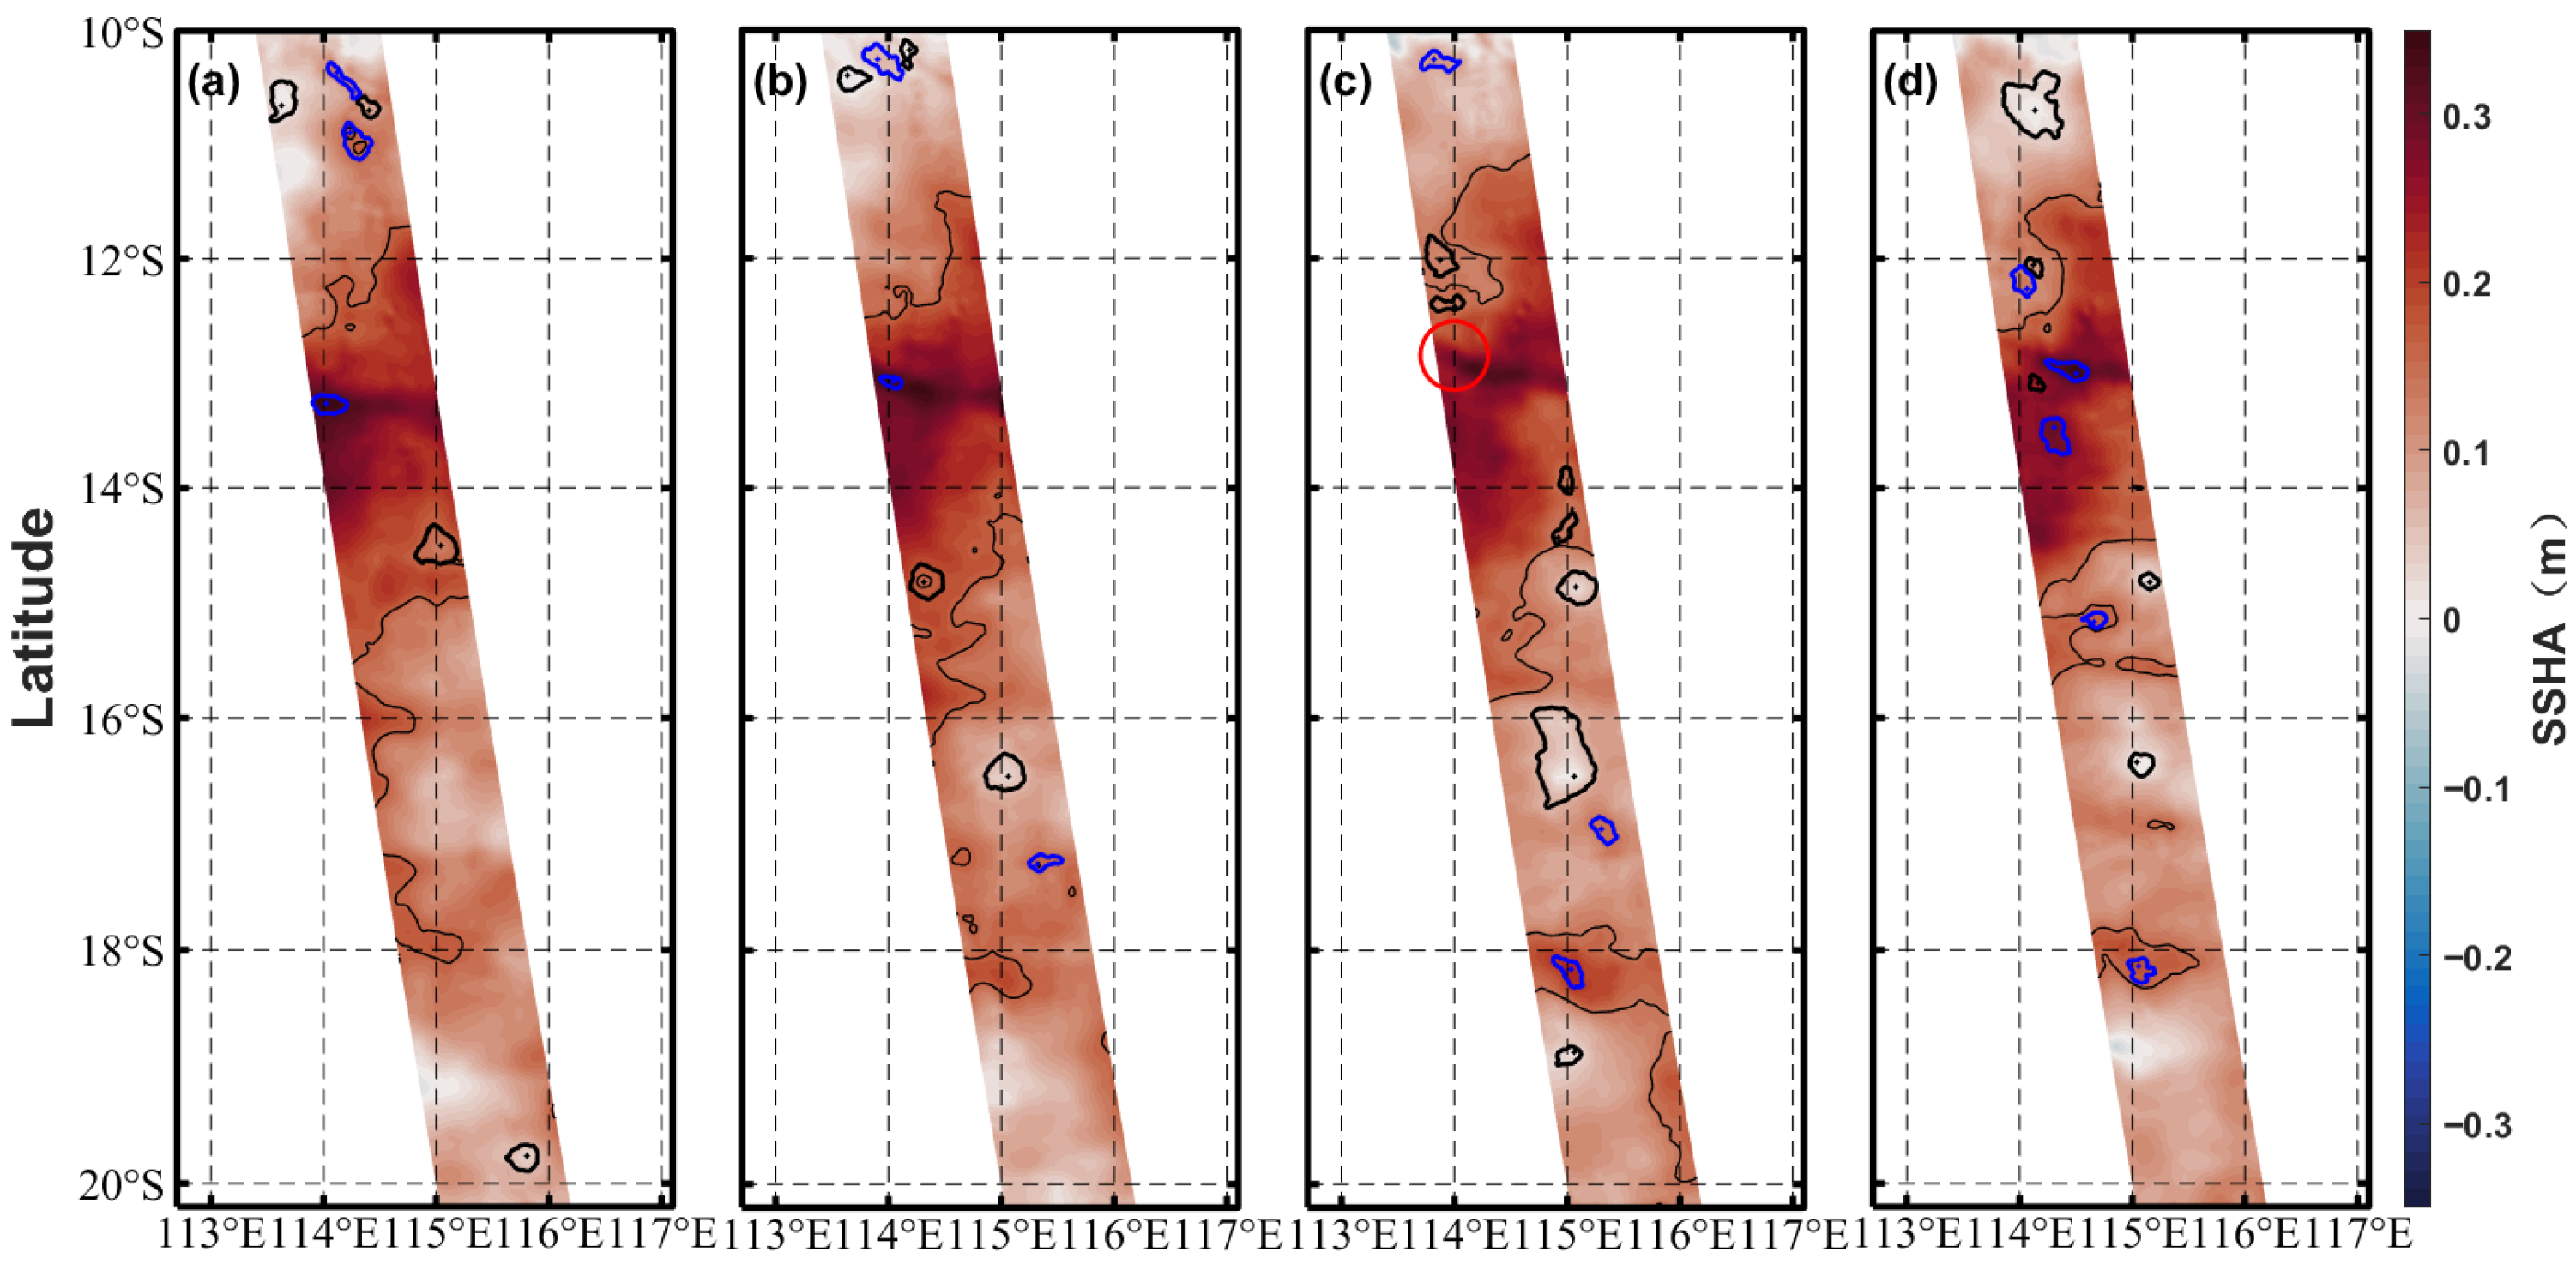
The four orbital datasets presented in Figure 6 are derived from single-pass observations by the SWOT satellite during its Cal/Val phase, spanning 17–20 June 2023. During this period, the repeated orbital tracks consistently cover the same oceanic region with identical parameters, enabling clear tracking and observation of SME evolution over four consecutive days. Following data processing, eddies within the single orbital swath are identified: A persistent anomaly near 13°S is detected, corresponding to a SME anticyclonic eddy that exhibits an elongated morphology and slow eastward propagation over multiple days. However, this eddy is not identified in the third panel (June 19) due to its partial boundary extending beyond the orbital swath, which results in incomplete contour closure and thus precluded definitive detection. A cold-core eddy near 17.5°S displays rapid intensity fluctuations, weakening, intensifying, and then weakening again within the four-day window, underscoring the rapid variability characteristic of SME dynamics.
During the SWOT satellite’s Cal/Val phase (28 March–10 July 2023), seven fixed orbital tracks pass over the western tropical Pacific region daily. Statistical analysis of SMEs across these tracks reveals that Track 023 is predominantly land-covered, leaving six usable tracks per day for quantitative assessment. Based on eddy identification results from all tracks during the Cal/Val phase, an average of 29 SMEs per track per day are detected. This directly validates SWOT’s exceptional performance and stability in SME detection.
The SWOT satellite’s nominal swath width of 120 km is reduced to an effective width of 100 km after data processing. This spatial constraint limits the ability to capture complete ME features within a single orbital pass, as MEs often exceed this width, resulting in truncated structural and dynamical representations. To mitigate incomplete characterization caused by swath-edge truncation, this study focuses exclusively on SME statistics within individual tracks, avoiding ME identification from single-pass data.

3.2.2. Eddies During Science Orbit Phase

Reanalysis of ME characteristics in the western tropical Pacific reveals SWOT’s exceptional capability in resolving SMEs. Subsequent statistical analysis is conducted on eddies identified from SWOT data spanning 26 July 2023, to 31 December 2024. Each sub-cycle (10.5-day interval) of the SWOT scientific operational phase is processed as an independent dataset.
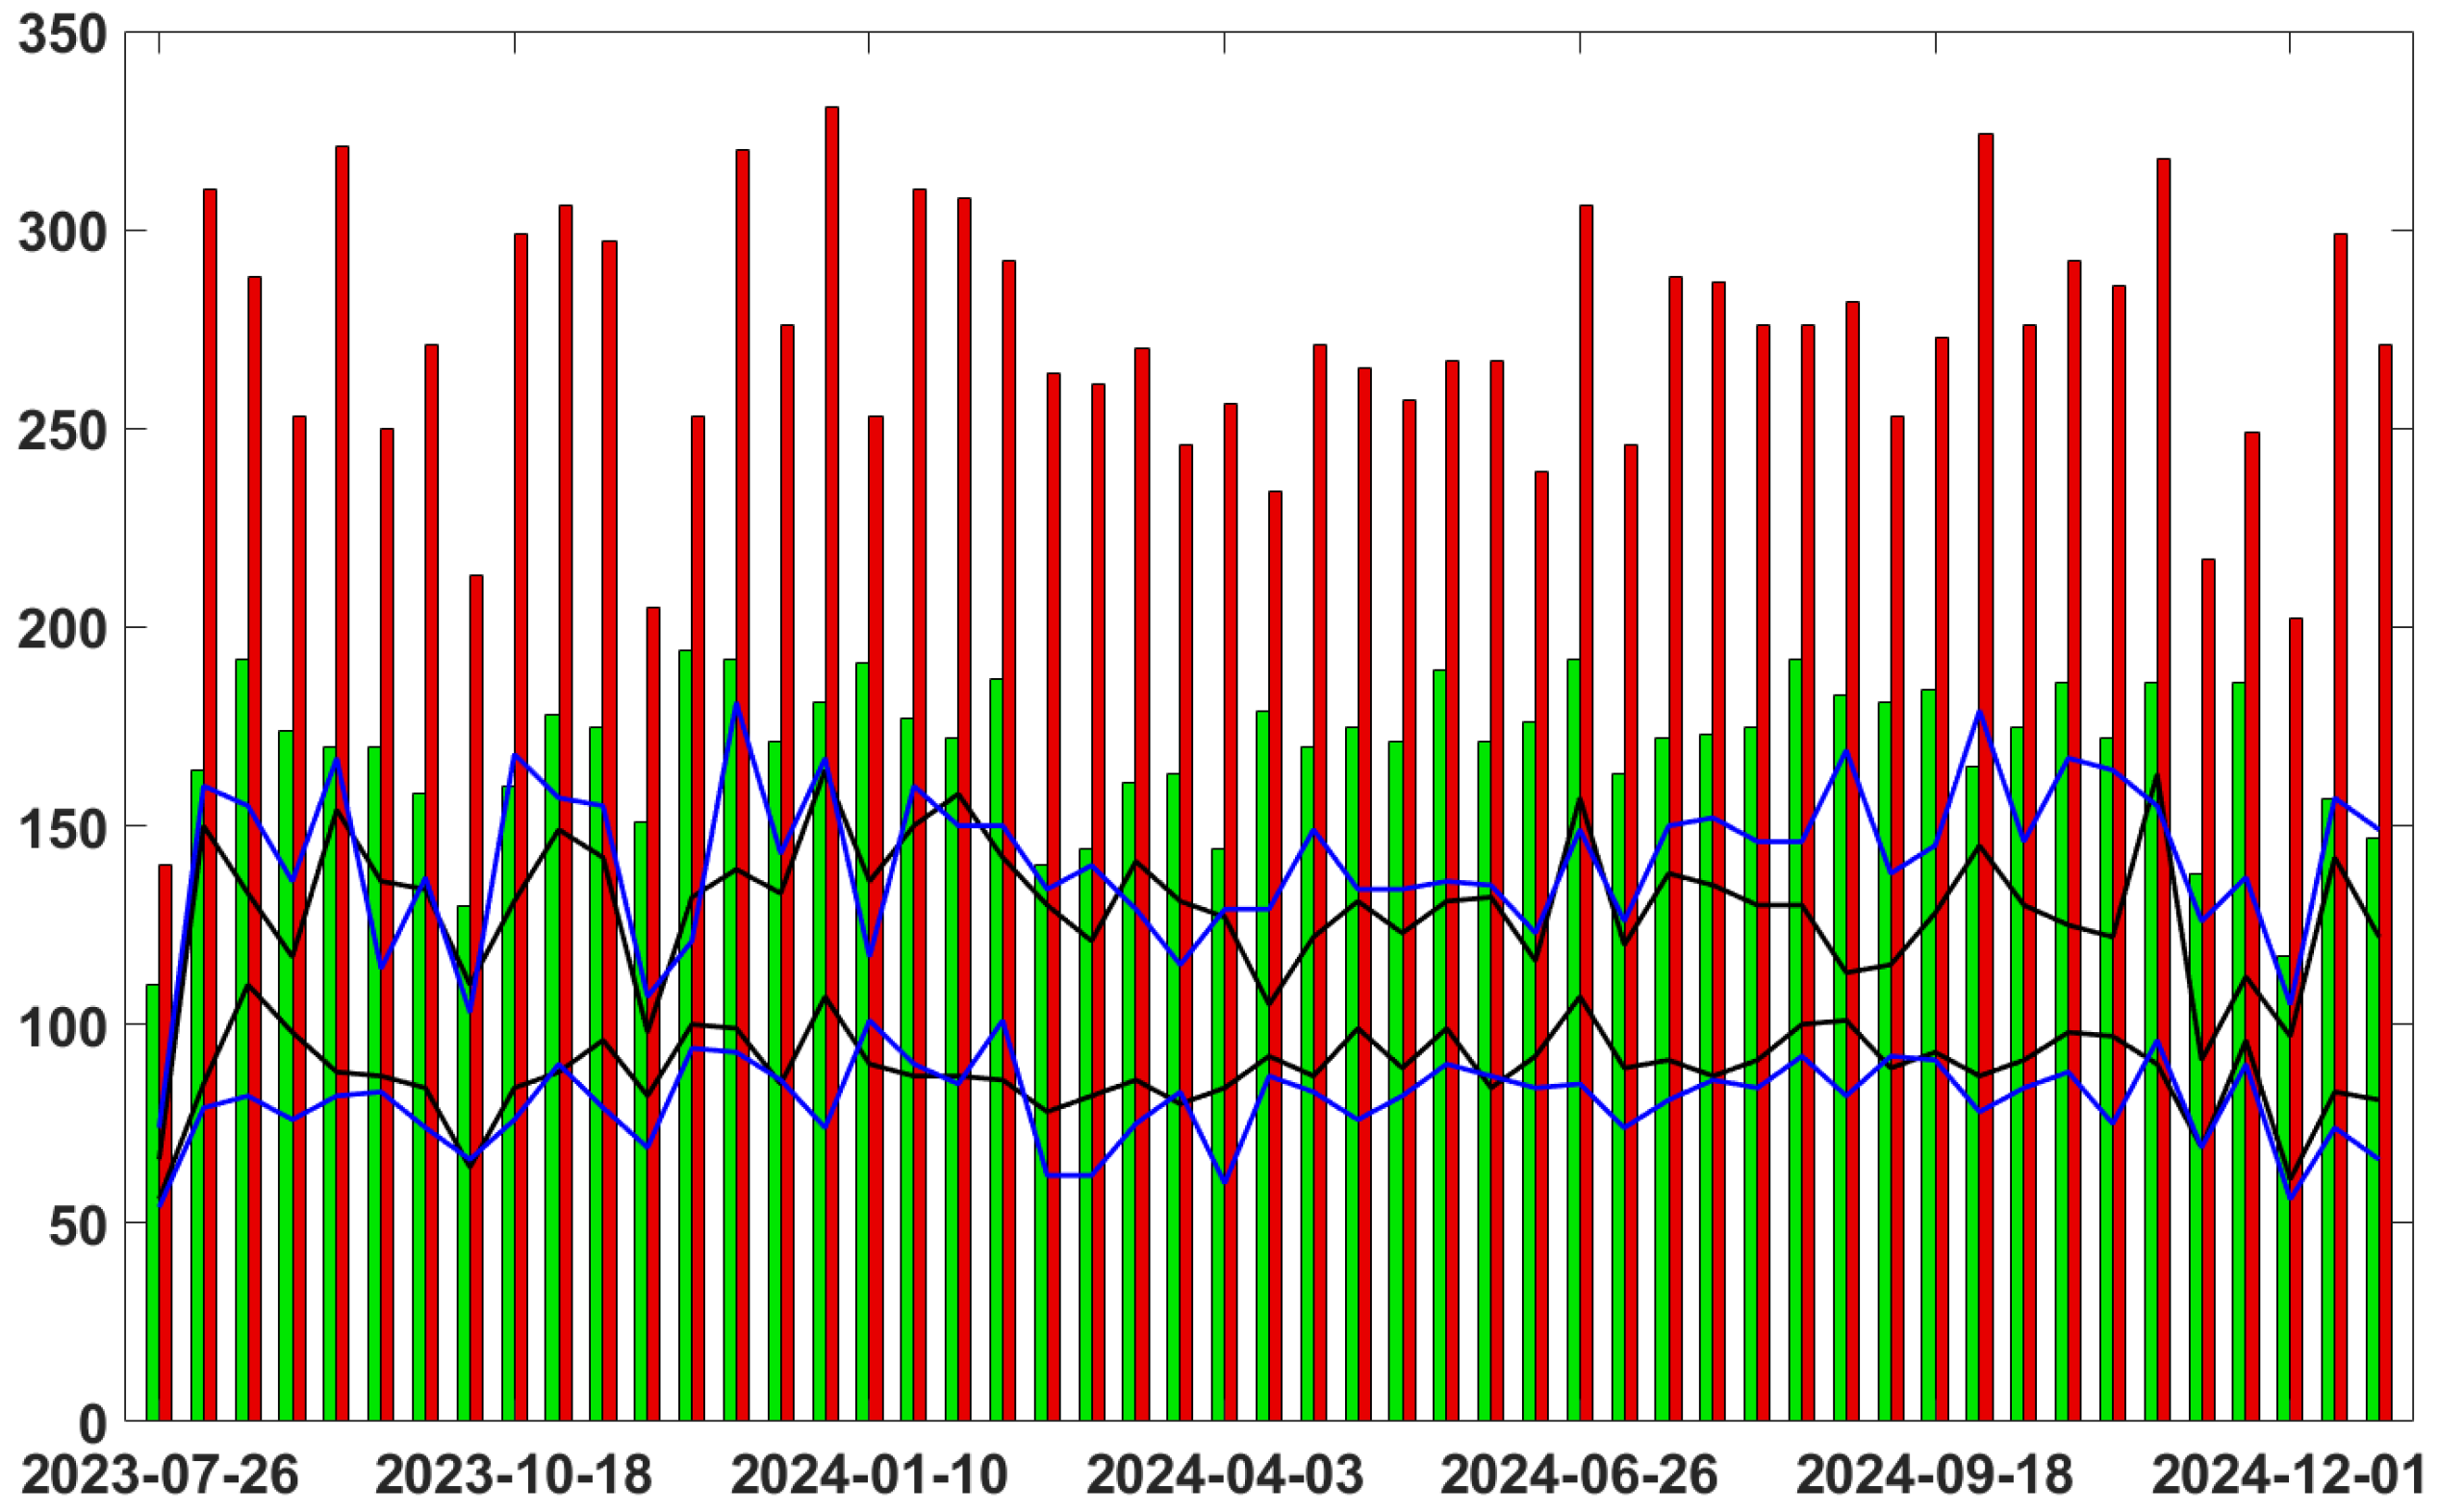
Statistical results indicate that, as shown in Figure 7, the western tropical Pacific region hosts an average of 169 MEs per observational sub-cycle, comprising 89 cyclonic eddies and 81 anticyclonic eddies. For SMEs, the mean count per sub-cycle is 271 (129 cyclonic and 141 anticyclonic eddies). Unlike MEs, anticyclonic eddies are anomalously more abundant than cyclonic eddies in this case.
The time series analysis in Figure 7 highlights the synchronous variability between MEs and SMEs: periods of ME intensification (weakening) correspond to proportional increases (decreases) in SME abundance, indicating that mesoscale eddies influence the generation and decay of submesoscale eddies [11,40].
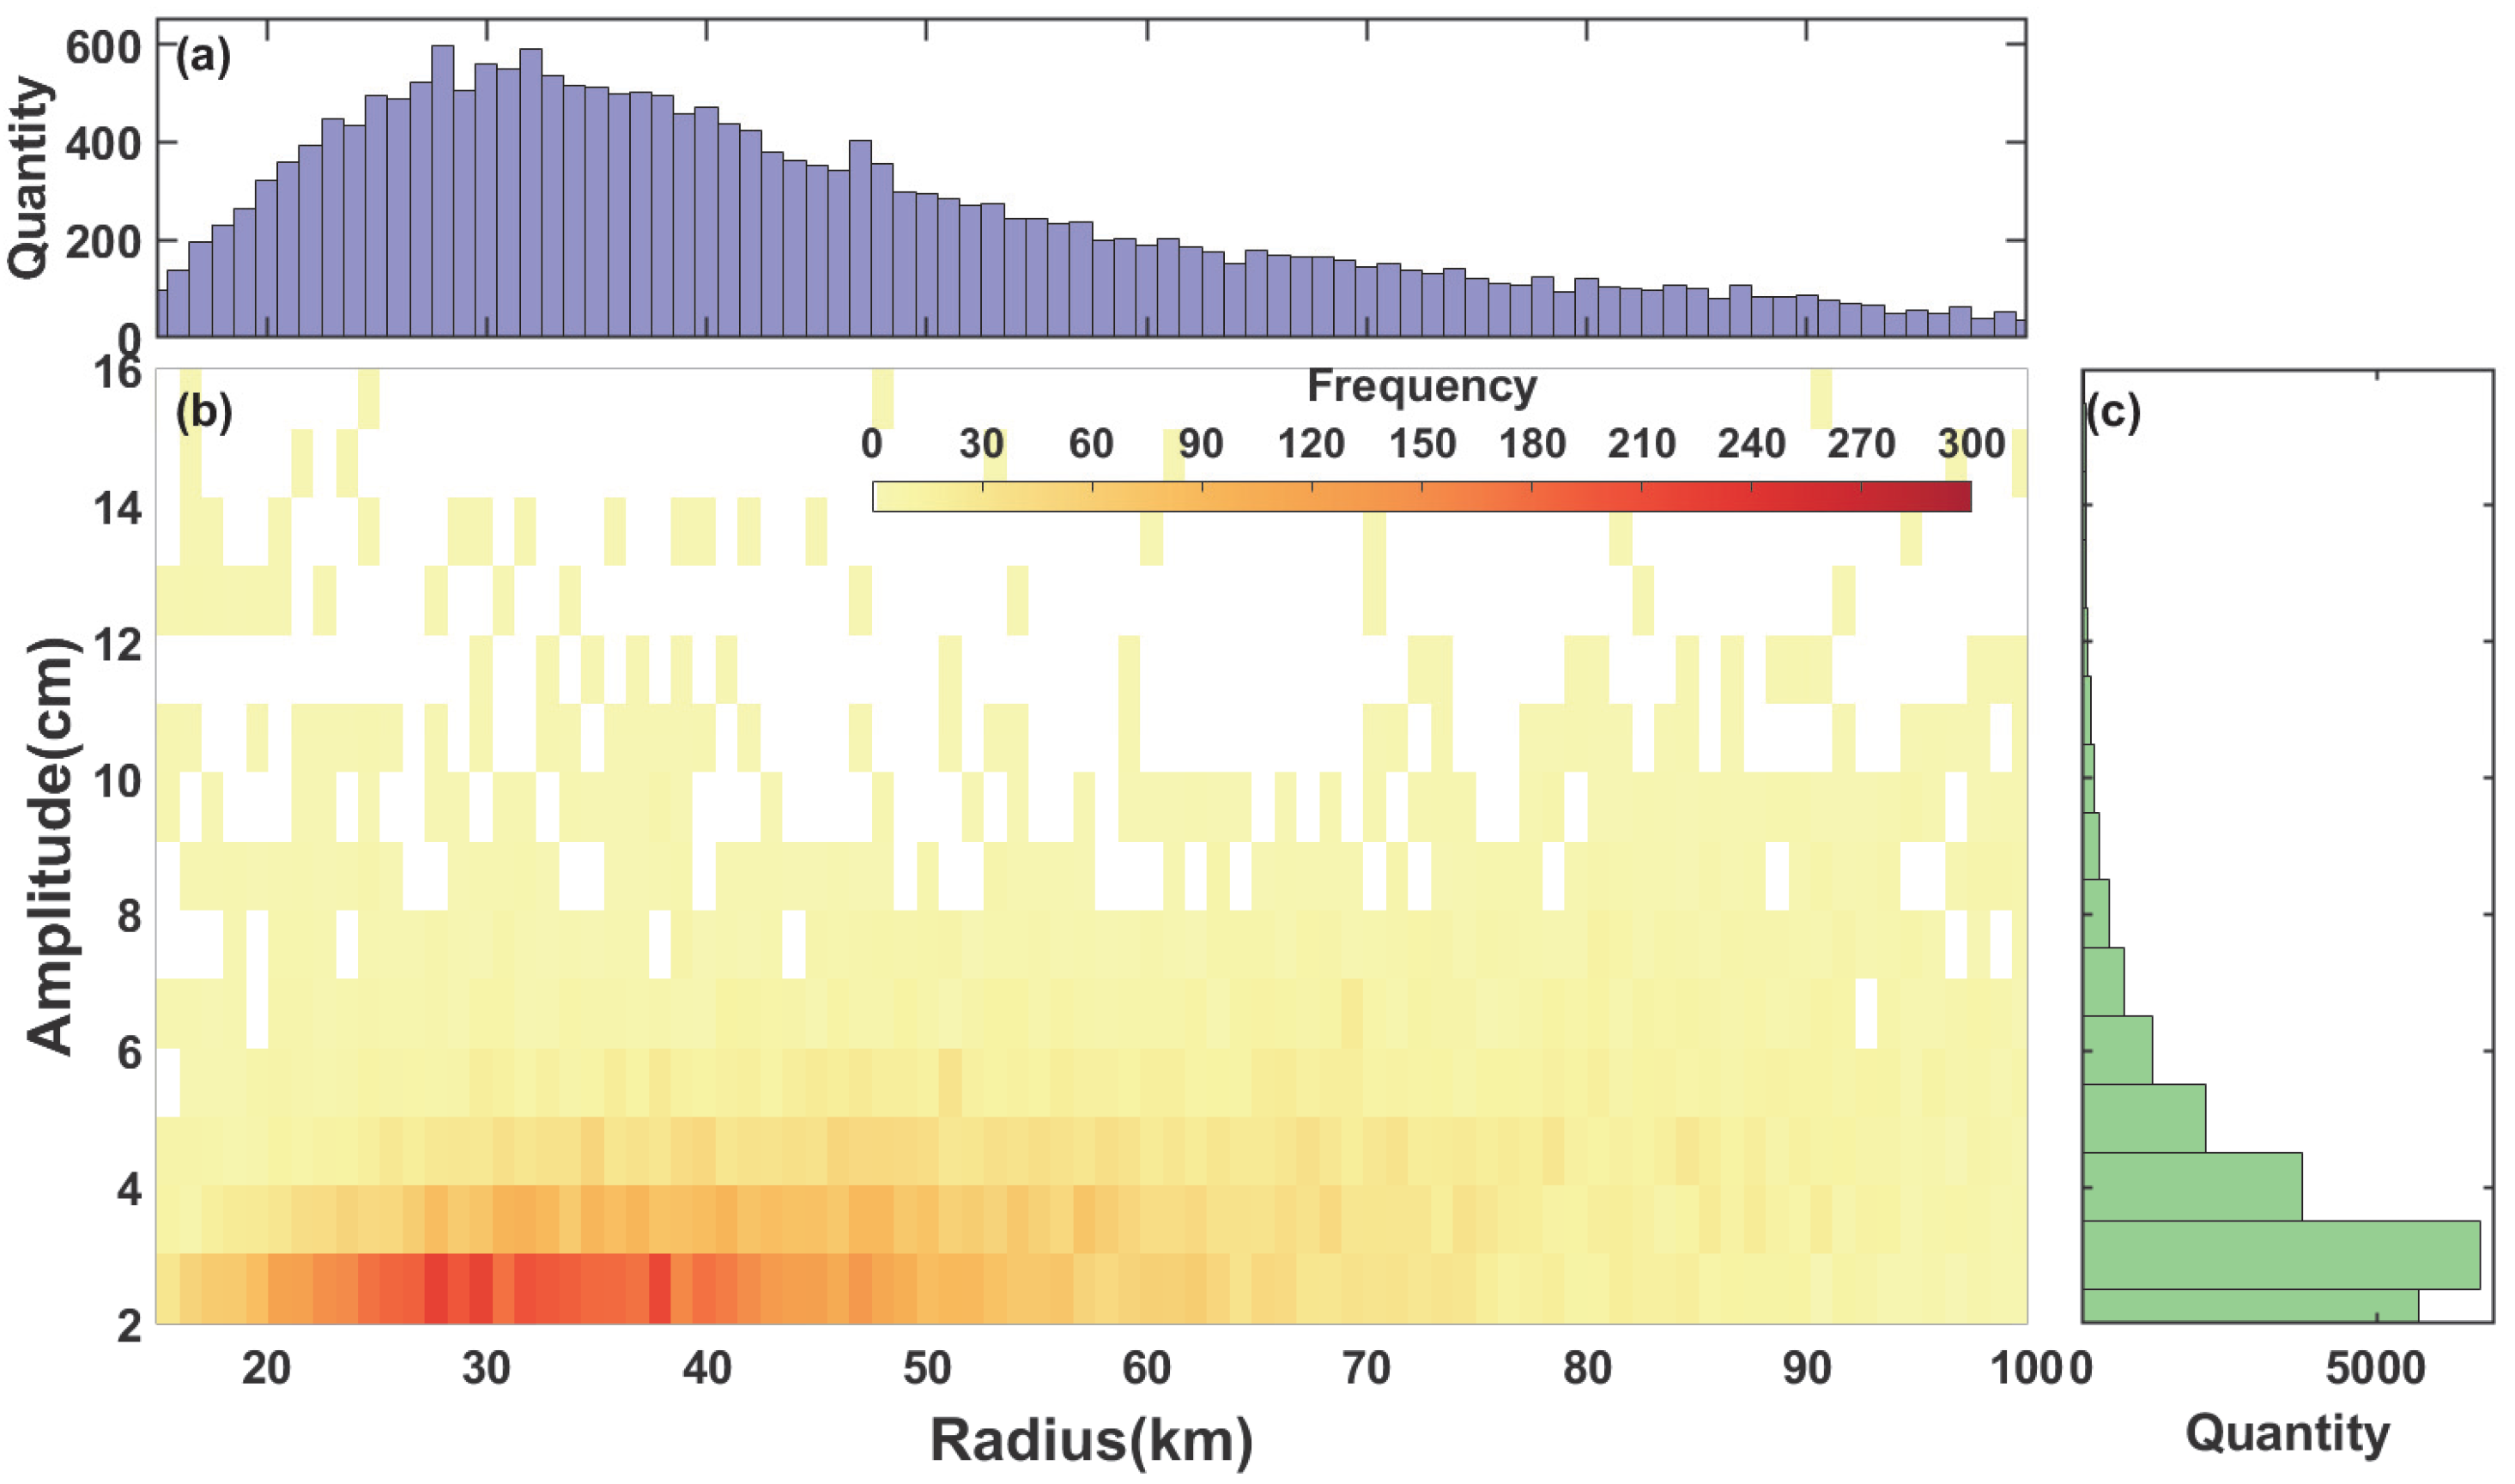
Following the identification of SMEs in the western tropical Pacific region, we further analyze statistical characteristics of eddy parameters, including radius and amplitude. As shown in Figure 8, the overall trends of eddies identified using SWOT satellite data align with those in Figure 5 but exhibit notable differences: Eddy radii derived from SWOT are predominantly smaller (20 km to 50 km), whereas DUACS-based statistics show a continuous increase in eddy counts with larger radii. This discrepancy is attributed to SWOT’s order-of-magnitude higher resolution, enabling detection of smaller SMEs unresolved by conventional altimetry; Eddy amplitudes for ME features, however, display high consistency between both datasets (2 cm to 8 cm; Figure 5 and Figure 8), underscoring complementary capabilities in amplitude characterization despite divergent size distributions.
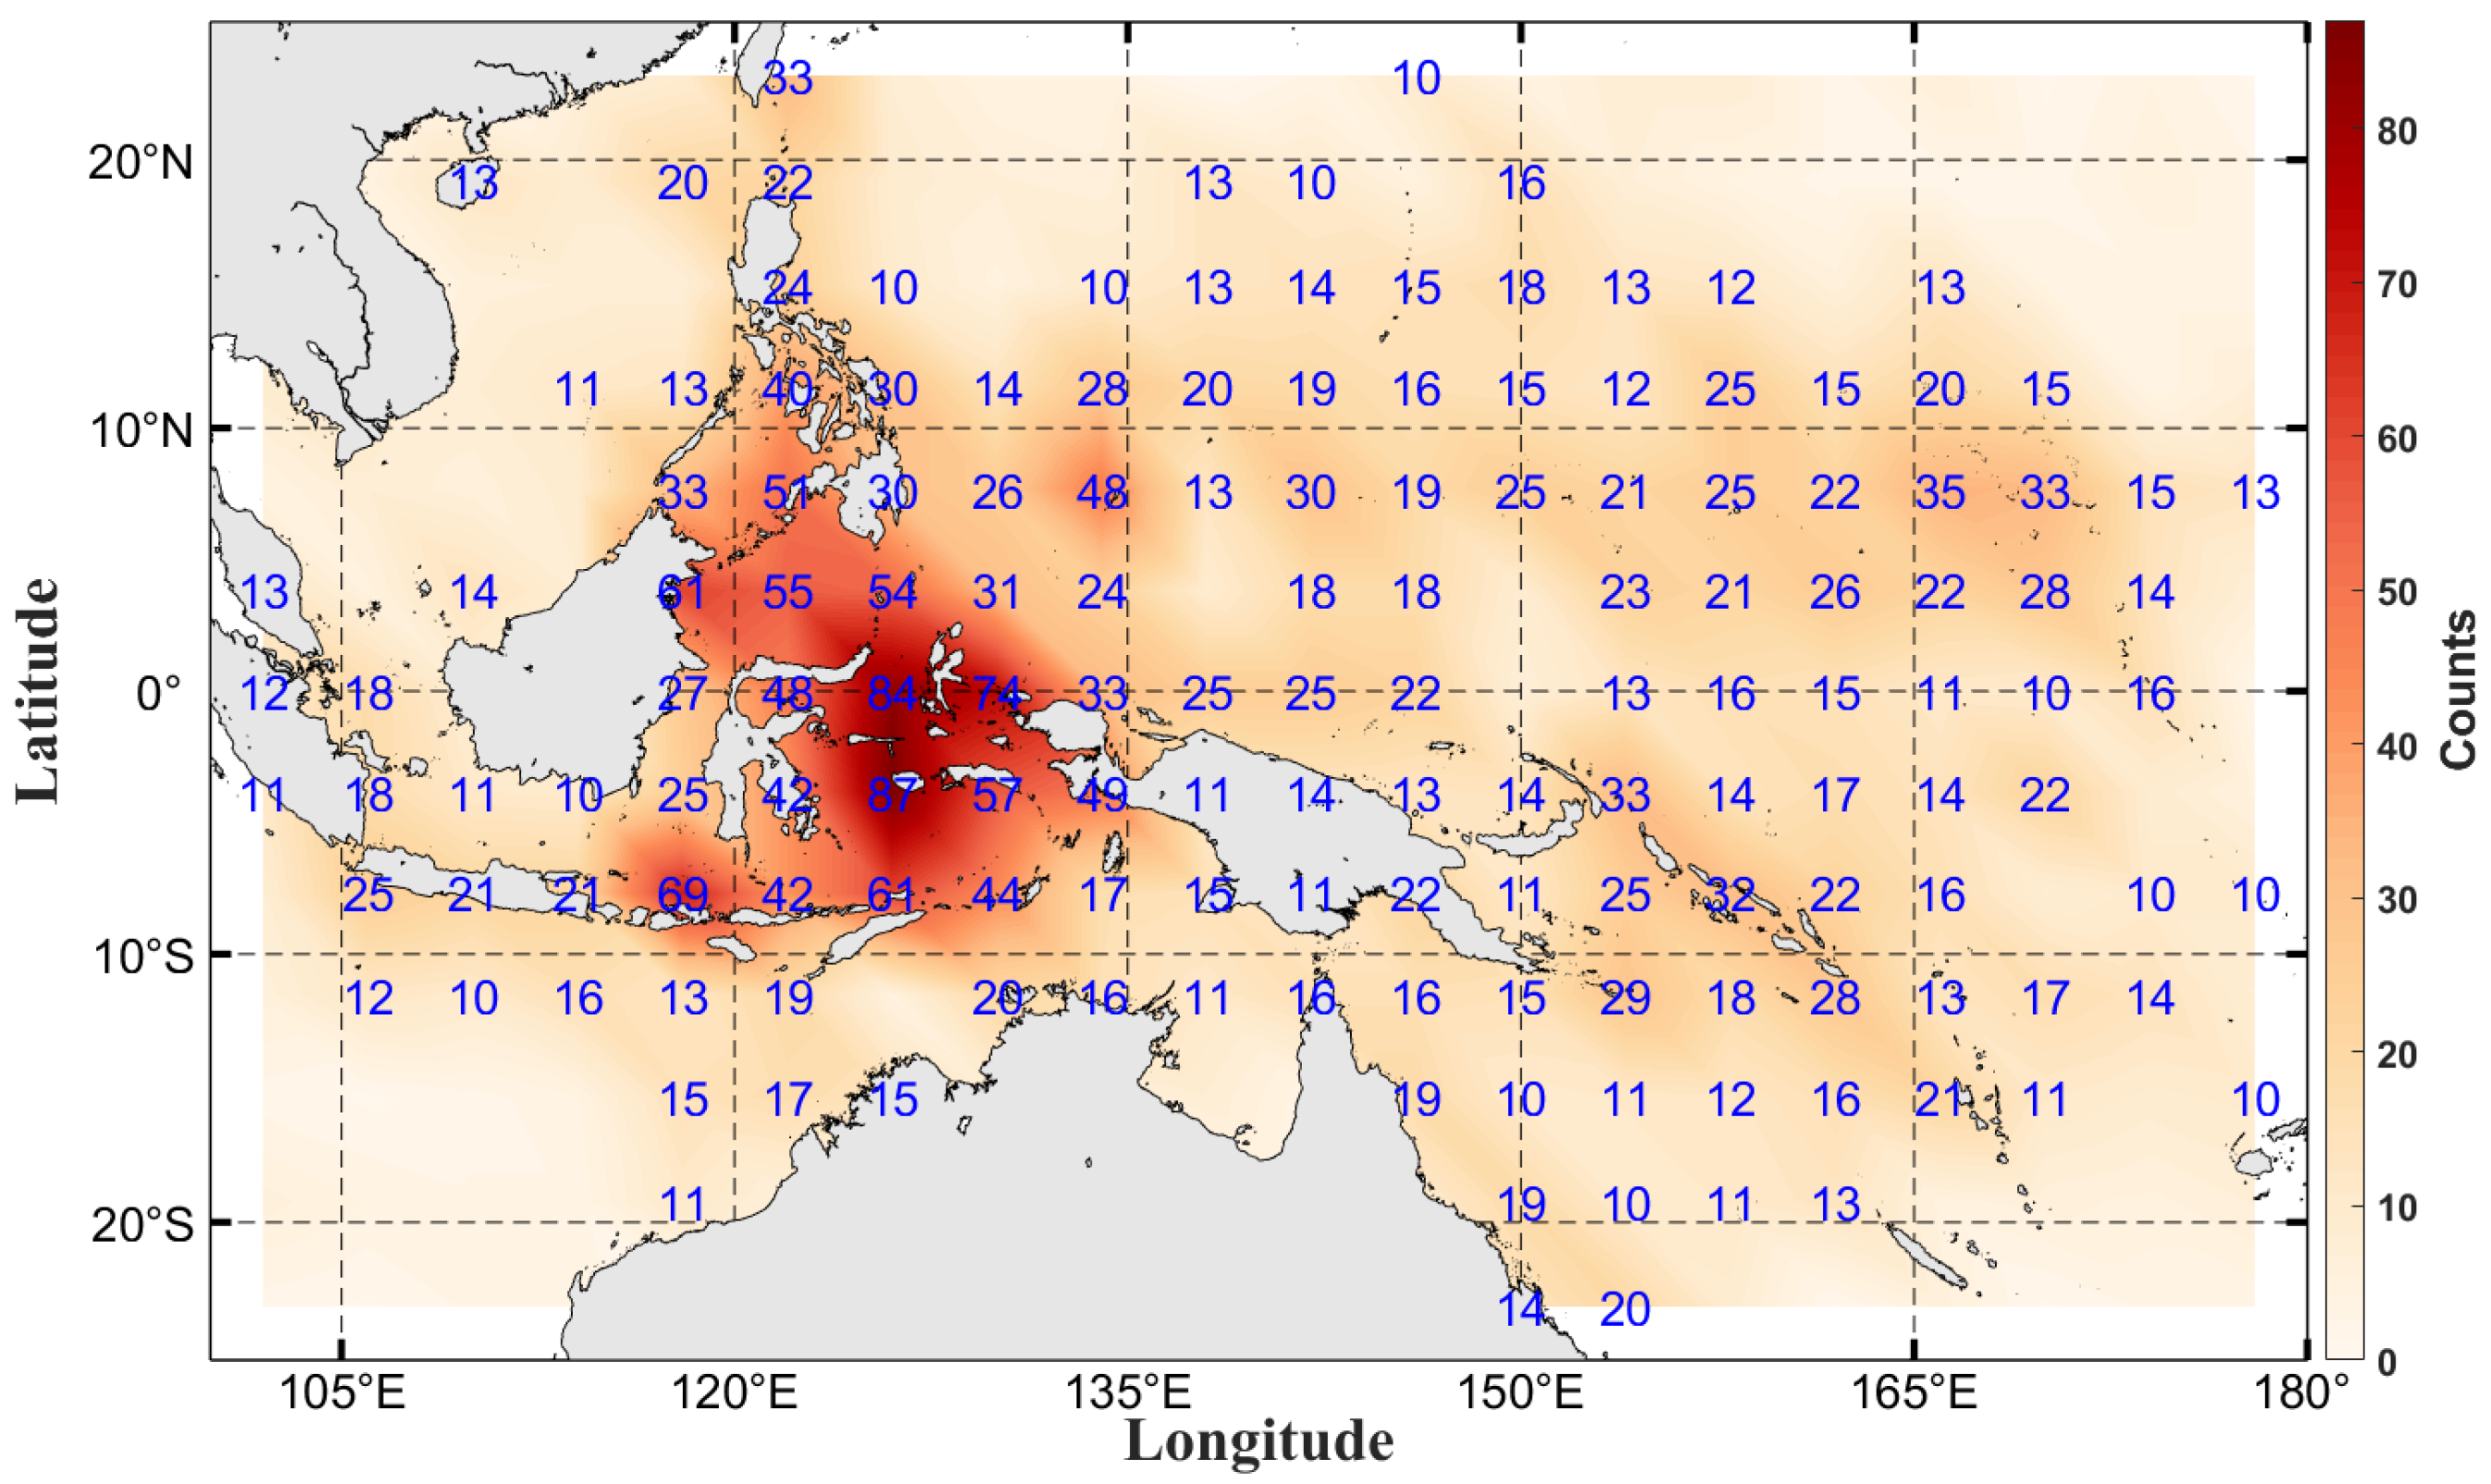
Eddy identification is re-conducted using science-phase SWOT orbital data, with 138 tracks traversing the study area. Each track is independently processed to detect SMEs. Aggregated results (Figure 9) display eddy core counts via numerical labels within rectangular subregions. The Indonesian Seas exhibit significantly higher eddy density due to anomalously intense internal tidal wave activity, which elevates submesoscale SLA variability [22].
In addition, in the equatorial region, tropical instability waves form pronounced temperature–salinity fronts and trains of vortices on both sides of the equator. The frontogenesis process generates numerous submesoscale structures near eddy peripheries and frontal zones [41], thereby promoting the formation of submesoscale eddies in tropical regions [40].

4. Comparative Analysis of SWOT and DUACS in Eddies Detection

The horizontal resolution of DUACS data is 0.25° (approximately 27.75 km). According to the thresholds of 60 km, 45 km, 35 km, and 30 km for distinguishing ME and SME based on the Rossby deformation radius, traditional satellites also have a certain capability to identify SME under this classification standard. On the other hand, the horizontal resolution of SWOT data is 2 km, which can identify both SME and ME. This chapter compares and analyzes the capabilities of the two different satellite data in identifying SME and ME.

4.1. Spatial Distribution

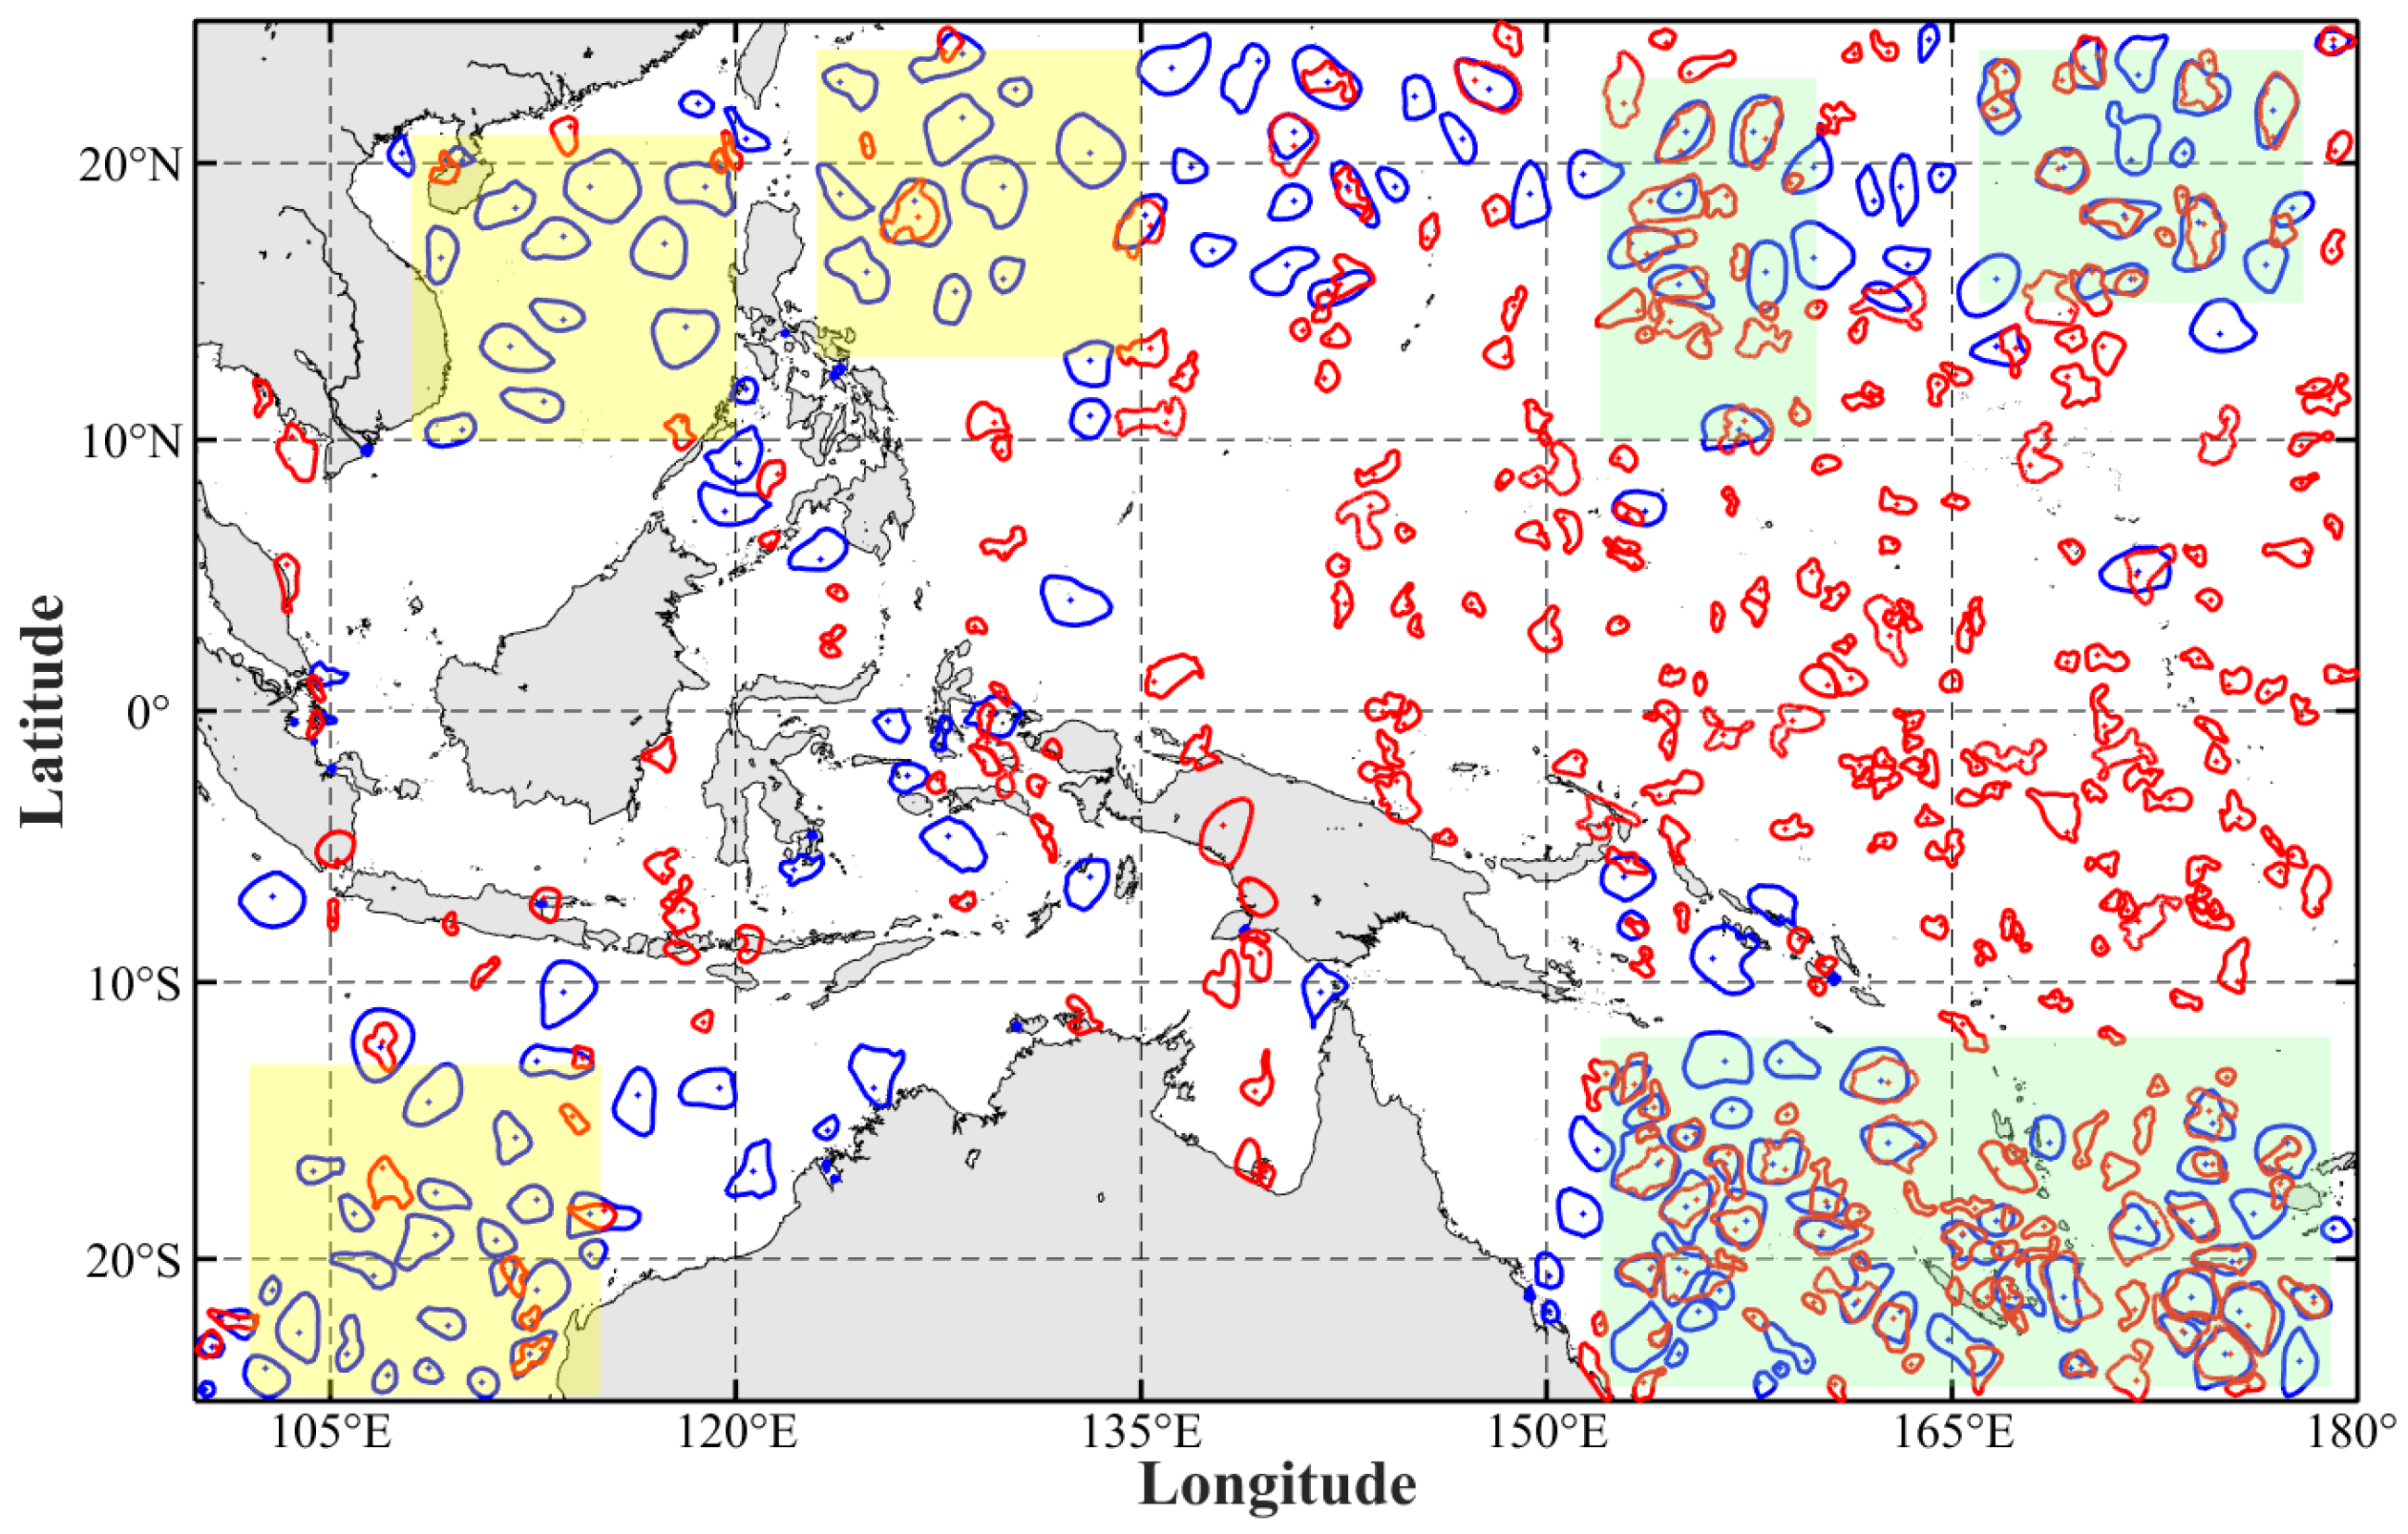
As shown in Figure 10, MEs detected by DUACS on 29 September 2024, are compared with those identified by SWOT between 21 September and 1 October 2024. The results show partial overlap alongside significant discrepancies between the two datasets, primarily stemming from differences in data acquisition formats and processing methodologies.
Due to the mismatch in sampling frequency, DUACS updates its gridded data daily while SWOT produces a complete map every 21 days (or roughly 10.5 days per sub-cycle)—direct comparisons are challenging. Moreover, SWOT’s spatial resolution is about an order of magnitude higher, allowing it to capture finer vortical details that DUACS, which employs smoothing filters, often misses. In low-latitude regions where signals are subtle, SWOT’s 1–2 cm precision reveals variations that remain largely undetected by DUACS.
Additionally, some eddies exhibit high consistency or minor deviations between datasets (marked by green boxes in Figure 10), while others show significant discrepancies (highlighted by yellow boxes in Figure 10). These differences are largely attributable to SWOT’s lower temporal resolution: Eddies in regions directly covered by SWOT tracks during overflights align well between datasets. Eddies observed 2–3 days before or after September 29 may be in formative or dissipative stages due to temporal window mismatches, leading to detection inconsistencies.

4.2. Comparison of Statistical Characteristics

Table 2 presents eddy characteristics identified using region-specific partitioning thresholds that correspond to the respective Rossby deformation radii in different latitudinal zones. In terms of eddy counts, in the equatorial region (0–10°N/S), the number of MEs and SMEs detected by SWOT far exceeds that from conventional satellite data, with average counts of 39 versus 14 (approximately 3 times higher for MEs) and 182 versus 7 (approximately 27 times higher for SMEs). With increasing latitude, the number of MEs detected in the DUACS dataset gradually increases, while the number of SMEs decreases, a trend closely related to the changes in the detection thresholds applied to different regions. Notably, in the 15°N/S–20°N/S region, the number of MEs detected by SWOT reaches a maximum of 54 and is quite comparable to that obtained with conventional satellites, although SWOT consistently shows a marked advantage in capturing SMEs. The standard deviations of eddy counts across all regions are relatively small, indicating that both ME and SME occurrences exhibit minimal temporal variability within the study area.
Regarding eddy radii, the average radius of MEs identified in the DUACS dataset is generally larger than that obtained from SWOT (with a DUACS/SWOT ratio greater than 1.2). For SMEs, the differences in average radii between the two datasets are relatively minor, with ratios ranging from 0.72 to 0.88. Because the radius varies so widely, its standard deviation is also large, yet it stays within a defined range—ME: 18%, 22%, 25%, 32%; SME: 45%, 26%, 14%, 12%.
In terms of eddy amplitude, despite some numerical fluctuations across the regions, the amplitudes of both MEs and SMEs are relatively similar between the DUACS and SWOT datasets. For example, in the 0–10°N/S region, the amplitude of MEs recorded by SWOT is significantly higher than that from DUACS. However, in the 15°N/S–20°N/S and 20°N/S–25°N/S regions, the amplitude values are essentially consistent; overall, within the 0–25°N/S domain, there is only a marginal difference in the amplitude of MEs, and the standard deviations of amplitude are all very small. This suggests that the dynamic intensity of eddies is primarily governed by oceanic physical processes, and that the impact of the different regional partitioning thresholds on amplitude measurements is relatively minor, ensuring a high degree of consistency between the datasets.

5. Discussion

Based on the Rossby deformation radius, the thresholds for distinguishing MEs and SMEs partition the entire study area into four subregions with thresholds of 60 km, 45 km, 35 km, and 30 km, respectively. In this study, a single threshold radius is used to summarize the eddy characteristics of the western Pacific region—applying the four criteria of 60 km, 45 km, 35 km, and 30 km—and the results are then compared with those obtained using variable thresholds.
As a pivotal step in sensitivity analysis, this study transcends the limitations of conventional single-threshold approaches by systematically expanding the parameter space to incorporate a multi-threshold regime (30 km, 35 km, 45 km, 60 km) for cross-validation. Table 3 quantitatively demonstrates the gradient response patterns of western Pacific eddy population characteristics (including eddy count, radius, intensity) under different dynamic-scale demarcation criteria corresponding to the threshold series, elucidating the critical regulatory role of threshold selection on eddy energy spectrum distribution.
Based on the statistical results obtained from Table 3, several conclusions can be drawn:
1. Eddy Counts: For MEs, at smaller radius thresholds (30 km, 35 km, and 45 km), the DUACS dataset detects fewer events compared to the SWOT observations. Although the number of MEs detected by DUACS decreases with increasing radius (from 165 at 30 km to 132 at 60 km), the decline is far more pronounced in the SWOT dataset (from 333 at 30 km to 102 at 60 km). Consequently, the ratio of DUACS to SWOT increases with the radius, ultimately leading to a situation at 60 km where the DUACS dataset records more MEs than SWOT.
In contrast, for SMEs, the behavior is reversed. The number of SMEs detected by DUACS shows a modest increase (from 9 to 42), whereas the number observed by SWOT rises sharply (from 116 to 346). This difference indicates that while the DUACS dataset is more stable in detecting larger MEs, the higher resolution of SWOT makes it more adept at identifying smaller-scale eddies.
The standard deviation of SWOT is generally greater than that of DUACS for both MEs and SMEs, indicating that the number of SMEs observed by SWOT varies more significantly across different times and regions.
2. Eddy Radii: Regarding eddy radii, the DUACS dataset consistently yields larger radii for MEs compared to SWOT. However, the ratio of DUACS to SWOT radii decreases with an increasing threshold (1.53 at 30 km, 1.43 at 35 km, 1.27 at 45 km, and 1.14 at 60 km), illustrating that the disparity between the two systems is more significant at smaller radii. For SMEs, DUACS reports smaller radii than SWOT at the smaller thresholds (30 km and 35 km); at 45 km the radii are similar, and at 60 km the DUACS values slightly exceed those of SWOT (with ratios of 0.80, 0.82, 0.93, and 1.17 for 30 km, 35 km, 45 km, and 60 km, respectively). This further suggests that SWOT is more suitable for detecting smaller eddies.
For MEs, the radius standard deviation in DUACS is slightly larger than in SWOT. In contrast, for SMEs, SWOT consistently shows greater radius variability than DUACS, indicating that the sizes of SMEs observed by SWOT are more widely distributed.
3. Eddy Amplitude: In terms of amplitude, both for MEs and SMEs, the average amplitudes measured by DUACS are slightly lower than those detected by SWOT (with ME ratios of 0.94, 0.91, 0.83, and 0.77 and SME ratios of 0.95, 0.92, 0.85, and 0.78 for the increasing radius thresholds). Although the difference in amplitude estimates between the two systems are relatively minor, SWOT consistently shows slightly higher amplitude values. This is likely due to SWOT’s superior vertical resolution—up to 1 cm—which traditional satellites cannot achieve. Moreover, the DUACS dataset applies a smoothing process during the integration of data from multiple satellites to maintain consistency; this process tends to eliminate some extreme values, resulting in generally lower detected amplitudes compared to SWOT.
The standard deviation of eddy amplitudes detected by SWOT is consistently higher than that of DUACS, although both remain at relatively low values. This indicates that amplitude measurements are generally stable for both datasets, with SWOT being more sensitive to variations in amplitude.
Comparison between the results obtained using a variable threshold based on the Rossby deformation radius and those obtained using a globally unified identification criterion, for the DUACS dataset, the statistical results obtained using the variable threshold closely match those derived from applying a 35-km radius threshold. This indicates that an adaptive threshold method in the DUACS data can better reflect the true scale distribution of eddies. In contrast, the statistical outcomes from the SWOT dataset align more closely with results obtained using a 45-km radius threshold, suggesting that its higher spatial resolution favors a slightly larger optimal scale boundary.
In contrast, when using a globally unified radius threshold, there are significant differences in the number of MEs identified by the two datasets: when the threshold is set at 30 km, the ratio between them is only 0.49; at 35 km, the ratio is only 0.58; and when the threshold is increased to 60 km, the ratio rises to 1.29. This clearly demonstrates that, for the western Pacific region, employing a single fixed radius threshold to distinguish between MEs and SMEs is not appropriate.
Given that the DUACS and SWOT datasets inherently exhibit different resolution characteristics, adopting a single, fixed radius threshold for eddy identification in the western Pacific region is likely to introduce misclassification errors in both datasets. A fixed threshold does not adequately account for the differences in scale sensitivity and detail capture between the two systems, thereby compromising the accuracy and physical interpretability of the results.
Therefore, employing a variable threshold based on the Rossby deformation radius not only allows for flexibility in adapting to the resolution and regional physical variability of the datasets but also enables a more precise delineation of eddy scales. This approach is more effective in reducing misclassification, thereby enhancing the consistency and reliability of the statistical results and providing stronger support for subsequent ocean dynamic studies.

6. Conclusions

This study systematically compares eddies detected by SWOT and DUACS in the western tropical Pacific, revealing dataset similarities, differences, and respective advantages in capturing multi-scale oceanic dynamics through quantitative morphology and distribution analyses.
Due to its unprecedented spatial resolution and precise sea level anomaly measurements, the SWOT dataset excels at detecting oceanic eddies, outperforming the conventional DUACS product across key metrics. Using a latitude-dependent radius threshold, SWOT identifies 176 MEs versus 162 in DUACS, and 273 SMEs compared to just 13 in DUACS. Moreover, while DUACS’s spatial smoothing and temporal sampling limitations inflate the average ME radius to 82.36 km, SWOT reveals a finer scale of 64.91 km. For SMEs, SWOT also captures slightly larger features (32.84 km vs. 24.17 km), highlighting its heightened sensitivity to weaker signals. Superior vertical resolution further allows SWOT to preserve extreme anomalies, yielding slightly stronger eddy amplitudes—6.13 cm vs. 5.22 cm for MEs, and 4.49 cm vs. 3.67 cm for SMEs.
A multi-threshold analysis in the western tropical Pacific (divided into 10°S–10°N, 10–15°, 15–20°, and 20–25° bands) reveals distinct spatial patterns. DUACS MEs cluster toward higher latitudes (14, 25, 56, and 66 eddies, respectively), whereas SWOT delivers a more uniform distribution (39, 36, 54, and 48). DUACS’s SME detections remain sparse, but SWOT uncovers a pronounced equatorial aggregation (10°S–10°N) that declines sharply with latitude, demonstrating its ability to capture fine-scale variability.
When applying uniform radius thresholds (30, 35, 45, and 60 km), DUACS’s ME count only decreases modestly (165 → 132), suggesting a bias toward larger eddies. In contrast, SWOT’s eddy count plummets from 333 to 102, exposing a near-normal distribution of radii and underscoring the pitfalls of a globally uniform threshold in the western Pacific. Adopting latitude-dependent thresholds markedly reduces misclassification and better matches the true scale distribution.
SWOT’s high-resolution capability provides opportunities for resolving fine-scale and submesoscale ocean processes. However, its long revisit period prevents it from capturing the evolving features of submesoscale phenomena. In contrast, the DUACS dataset, benefiting from its high temporal resolution, retains value for broad-area, daily mesoscale monitoring. Future work could consider employing advanced data fusion methods (such as assimilation techniques) to integrate multi-source observational data (e.g., altimeters, radiometers), merging SWOT satellite data with DUACS data to produce a dataset with both high spatial and high temporal resolution. In this regard, the AVISO processing workflow for DUACS data could serve as a useful reference. If feasible, increasing the number of SWOT satellites could also greatly reduce the temporal resolution gap and spatial gaps between observations. Successfully addressing these challenges will significantly advance our quantitative understanding of ocean energy transfer, material fluxes (such as heat and carbon), and the small-scale dynamic processes that are critical for climate models.

Author Contributions

Conceptualization, L.C. and Y.Z.; methodology, L.C.; validation, Y.Z., C.Q. and Y.W. (Yongliang Wei); formal analysis, L.C.; resources, Y.Z.; writing—original draft preparation, L.C.; writing—review and editing, Y.Z., C.Q., M.H., X.X., Y.W. (Yang Wang) and Y.W. (Yongliang Wei); supervision, Y.Z. All authors have read and agreed to the published version of the manuscript.

Funding

This research received no external funding.

Data Availability Statement

All data used in this study are publicly accessible. The SWOT Level-3 KaRIn SSH data can be found in https://doi.org/10.24400/527896/A01-2023.017 (AVISO/DUACS, 2024). The gridded altimetry data are available from https://doi.org/10.48670/moi-00145 (E.U. Copernicus Marine Service Information).

Conflicts of Interest

The authors declare no conflicts of interest.

References

  1. Taylor, J.R.; Thompson, A.F. Submesoscale dynamics in the upper ocean. Annu. Rev. Fluid Mech. 2023, 55, 103–127. [Google Scholar] [CrossRef]
  2. Capet, X.; McWilliams, J.C.; Molemaker, M.J.; Shchepetkin, A.F. Mesoscale to submesoscale transition in the California Current System. Part III: Energy balance and flux. J. Phys. Oceanogr. 2008, 38, 2256–2269. [Google Scholar] [CrossRef]
  3. Su, Z.; Wang, J.; Klein, P.; Thompson, A.F.; Menemenlis, D. Ocean submesoscales as a key component of the global heat budget. Nat. Commun. 2018, 9, 775. [Google Scholar] [CrossRef]
  4. Yu, X.; Naveira Garabato, A.C.; Martin, A.P.; Buckingham, C.E.; Brannigan, L.; Su, Z. An annual cycle of submesoscale vertical flow and restratification in the upper ocean. J. Phys. Oceanogr. 2019, 49, 1439–1461. [Google Scholar] [CrossRef]
  5. Zhang, Z.; Zhang, X.; Qiu, B.; Zhao, W.; Zhou, C.; Huang, X.; Tian, J. Submesoscale currents in the subtropical upper ocean observed by long-term high-resolution mooring arrays. J. Phys. Oceanogr. 2021, 51, 187–206. [Google Scholar] [CrossRef]
  6. Qiu, B.; Nakano, T.; Chen, S.; Klein, P. Bi-directional energy cascades in the Pacific Ocean from equator to subarctic gyre. Geophys. Res. Lett. 2022, 49, e2022GL097713. [Google Scholar] [CrossRef]
  7. Zhang, Z.; Qiu, B. Evolution of submesoscale ageostrophic motions through the life cycle of oceanic mesoscale eddies. Geophys. Res. Lett. 2018, 45, 11,847–11,855. [Google Scholar] [CrossRef]
  8. Capet, X.; Mcwilliams, J.C.; Molemaker, M.J.; Shchepetkin, A.F. Mesoscale to submesoscale transition in the California Current System. Part I: Flow structure, eddy flux, and observational tests. J. Phys. Oceanogr. 2008, 38, 29–43. [Google Scholar] [CrossRef]
  9. Chelton, D.B.; DeSzoeke, R.A.; Schlax, M.G.; El Naggar, K.; Siwertz, N. Geographical variability of the first baroclinic Rossby radius of deformation. J. Phys. Oceanogr. 1998, 28, 433–460. [Google Scholar] [CrossRef]
  10. Zhang, Y.; Hu, C.; Liu, Y.; Weisberg, R.H.; Kourafalou, V.H. Submesoscale and mesoscale eddies in the Florida Straits: Observations from satellite ocean color measurements. Geophys. Res. Lett. 2019, 46, 13262–13270. [Google Scholar] [CrossRef]
  11. Klein, P.; Lapeyre, G. The oceanic vertical pump induced by mesoscale and submesoscale turbulence. Annu. Rev. Mar. Sci. 2009, 1, 351–375. [Google Scholar] [CrossRef]
  12. McWilliams, J.C. Submesoscale currents in the ocean. Proc. R. Soc. A Math. Phys. Eng. Sci. 2016, 472, 20160117. [Google Scholar] [CrossRef]
  13. Fox-Kemper, B.; Danabasoglu, G.; Ferrari, R.; Griffies, S.; Hallberg, R.; Holland, M.; Maltrud, M.; Peacock, S.; Samuels, B. Parameterization of mixed layer eddies. III: Implementation and impact in global ocean climate simulations. Ocean Model. 2011, 39, 61–78. [Google Scholar] [CrossRef]
  14. Mensa, J.A.; Garraffo, Z.; Griffa, A.; Özgökmen, T.M.; Haza, A.; Veneziani, M. Seasonality of the submesoscale dynamics in the Gulf Stream region. Ocean Dyn. 2013, 63, 923–941. [Google Scholar] [CrossRef]
  15. Piggott, M.; Gorman, G.; Pain, C.; Allison, P.; Candy, A.; Martin, B.; Wells, M. A new computational framework for multi-scale ocean modelling based on adapting unstructured meshes. Int. J. Numer. Methods Fluids 2008, 56, 1003–1015. [Google Scholar] [CrossRef]
  16. Torres, H.S.; Rodriguez, E.; Wineteer, A.; Klein, P.; Thompson, A.F.; Callies, J.; D’Asaro, E.; Perkovic-Martin, D.; Farrar, J.T.; Polverari, F. Airborne observations of fast-evolving ocean submesoscale turbulence. Commun. Earth Environ. 2024, 5, 771. [Google Scholar] [CrossRef]
  17. Fu, L.-L.; Ubelmann, C. On the transition from profile altimeter to swath altimeter for observing global ocean surface topography. J. Atmos. Ocean. Technol. 2014, 31, 560–568. [Google Scholar] [CrossRef]
  18. Beron-Vera, F.J.; Hadjighasem, A.; Xia, Q.; Olascoaga, M.J.; Haller, G. Coherent Lagrangian swirls among submesoscale motions. Proc. Natl. Acad. Sci. USA 2019, 116, 18251–18256. [Google Scholar] [CrossRef] [PubMed]
  19. Fu, L.L.; Pavelsky, T.; Cretaux, J.F.; Morrow, R.; Farrar, J.T.; Vaze, P.; Sengenes, P.; Vinogradova-Shiffer, N.; Sylvestre-Baron, A.; Picot, N. The surface water and ocean topography mission: A breakthrough in radar remote sensing of the ocean and land surface water. Geophys. Res. Lett. 2024, 51, e2023GL107652. [Google Scholar] [CrossRef]
  20. Dibarboure, G.; Ubelmann, C.; Flamant, B.; Briol, F.; Peral, E.; Bracher, G.; Vergara, O.; Faugère, Y.; Soulat, F.; Picot, N. Data-driven calibration algorithm and pre-launch performance simulations for the SWOT mission. Remote Sens. 2022, 14, 6070. [Google Scholar] [CrossRef]
  21. Biancamaria, S.; Lettenmaier, D.P.; Pavelsky, T.M. The SWOT Mission and Its Capabilities for Land Hydrology. In Remote Sensing and Water Resources; Space Sciences Series of ISSI; Springer: Berlin/Heidelberg, Germany, 2016; pp. 117–147. [Google Scholar]
  22. Archer, M.; Wang, J.; Klein, P.; Dibarboure, G.; Fu, L.-L. Wide-swath satellite altimetry unveils global submesoscale ocean dynamics. Nature 2025, 640, 691–696. [Google Scholar] [CrossRef]
  23. Zhang, Z.; Miao, M.; Qiu, B.; Tian, J.; Jing, Z.; Chen, G.; Chen, Z.; Zhao, W. Submesoscale eddies detected by SWOT and moored observations in the Northwestern Pacific. Geophys. Res. Lett. 2024, 51, e2024GL110000. [Google Scholar] [CrossRef]
  24. Morrow, R.; Fu, L.-L.; Ardhuin, F.; Benkiran, M.; Chapron, B.; Cosme, E.; d’Ovidio, F.; Farrar, J.T.; Gille, S.T.; Lapeyre, G. Global observations of fine-scale ocean surface topography with the surface water and ocean topography (SWOT) mission. Front. Mar. Sci. 2019, 6, 232. [Google Scholar] [CrossRef]
  25. Chaudhary, A.; Agarwal, N.; Sharma, R.; Ojha, S.P.; Kumar, R. Nadir altimetry Vis-à-Vis swath altimetry: A study in the context of SWOT mission for the Bay of Bengal. Remote Sens. Environ. 2021, 252, 112120. [Google Scholar] [CrossRef]
  26. Morrow, R.; Blurmstein, D.; Dibarboure, G. Fine-scale altimetry and the future SWOT mission. In New Frontiers in Operational Oceanography; GODAE OceanView: London, UK, 2018; pp. 191–226. [Google Scholar] [CrossRef]
  27. Pujol, M.I.; Faugère, Y.; Taburet, G.; Dupuy, S.; Pelloquin, C.; Ablain, M.; Picot, N. DUACS DT2014: The new multi-mission altimeter data set reprocessed over 20 years. Ocean Sci. 2016, 12, 1067–1090. [Google Scholar] [CrossRef]
  28. Pujol, M.-I.; Dupuy, S.; Vergara, O.; Sánchez-Román, A.; Faugere, Y.; Prandi, P.; Dabat, M.-L.; Dagneaux, Q.; Lievin, M.; Cadier, E. Refining the resolution of DUACS along track (level 3) altimeter Sea Level products. Earth Syst. Sci. Data Discuss. 2022, 2022, 1–40. [Google Scholar] [CrossRef]
  29. Tranchant, Y.-T.; Legresy, B.; Foppert, A.; Pena-Molino, B.; Phillips, H.E. SWOT reveals fine-scale balanced motions and dispersion properties in the Antarctic Circumpolar Current. Earth Space Sci. 2025, 12, e2025EA004248. [Google Scholar] [CrossRef]
  30. Yadidya, B.; Arbic, B.K.; Shriver, J.F.; Zaron, E.D.; Buijsman, M.C.; Carrère, L.; Tchilibou, M.; Uchida, T. Predicting internal tides with a global ocean forecast system: Insights from SWOT CalVal orbit. Geophys. Res. Lett. 2025, 51, e2023GL107232. [Google Scholar] [CrossRef]
  31. Wang, J.; Fu, L.-L.; Haines, B.; Lankhorst, M.; Lucas, A.J.; Farrar, J.T.; Send, U.; Meinig, C.; Schofield, O.; Ray, R. On the development of SWOT in situ calibration/validation for short-wavelength ocean topography. J. Atmos. Ocean. Technol. 2022, 39, 595–617. [Google Scholar] [CrossRef]
  32. Du, T.; Jing, Z. Fine-scale eddies detected by SWOT in the kuroshio extension. Remote Sens. 2024, 16, 3488. [Google Scholar] [CrossRef]
  33. Qiu, B.; Chen, S.; Klein, P.; Ubelmann, C.; Fu, L.-L.; Sasaki, H. Reconstructability of three-dimensional upper-ocean circulation from SWOT sea surface height measurements. J. Phys. Oceanogr. 2016, 46, 947–963. [Google Scholar] [CrossRef]
  34. Chelton, D.B.; Schlax, M.G.; Samelson, R.M. Global observations of nonlinear mesoscale eddies. Prog. Oceanogr. 2011, 91, 167–216. [Google Scholar] [CrossRef]
  35. Robinson, S. Coherent motions in the turbulent boundary layer. Annu. Rev. Fluid Mech. 1991, 23, 601–639. [Google Scholar] [CrossRef]
  36. Nencioli, F.; Dong, C.; Dickey, T.; Washburn, L.; McWilliams, J.C. A vector geometry–based eddy detection algorithm and its application to a high-resolution numerical model product and high-frequency radar surface velocities in the Southern California Bight. J. Atmos. Ocean. Technol. 2010, 27, 564–579. [Google Scholar] [CrossRef]
  37. Yongchui, Z.; Ning, W.; Lin, Z.; Kefeng, L.; Haodi, W. The surface and three-dimensional characteristics of mesoscale eddies: A review. Adv. Earth Sci. 2020, 35, 568–580. [Google Scholar] [CrossRef]
  38. Yiwen, J.; Wenlong, J.; Ji, Y.; Sijing, S.; Yong, L.; Yingbin, D. Comparative Analysis of Ocean Eddy Detection Algorithms Based on Deep Learning in SAR Images. Adv. Mar. Sci. 2024, 42, 137–148. [Google Scholar] [CrossRef]
  39. Wang, J.; Fu, L.-L.; Torres, H.S.; Chen, S.; Qiu, B.; Menemenlis, D. On the spatial scales to be resolved by the surface water and ocean topography Ka-band radar interferometer. J. Atmos. Ocean. Technol. 2019, 36, 87–99. [Google Scholar] [CrossRef]
  40. Capet, X.; McWilliams, J.C.; Molemaker, M.J.; Shchepetkin, A.F. Mesoscale to submesoscale transition in the California Current System. Part II: Frontal processes. J. Phys. Oceanogr. 2008, 38, 44–64. [Google Scholar] [CrossRef]
  41. Chelton, D.B.; Wentz, F.J.; Gentemann, C.L.; de Szoeke, R.A.; Schlax, M.G. Satellite microwave SST observations of transequatorial tropical instability waves. Geophys. Res. Lett. 2000, 27, 1239–1242. [Google Scholar] [CrossRef]
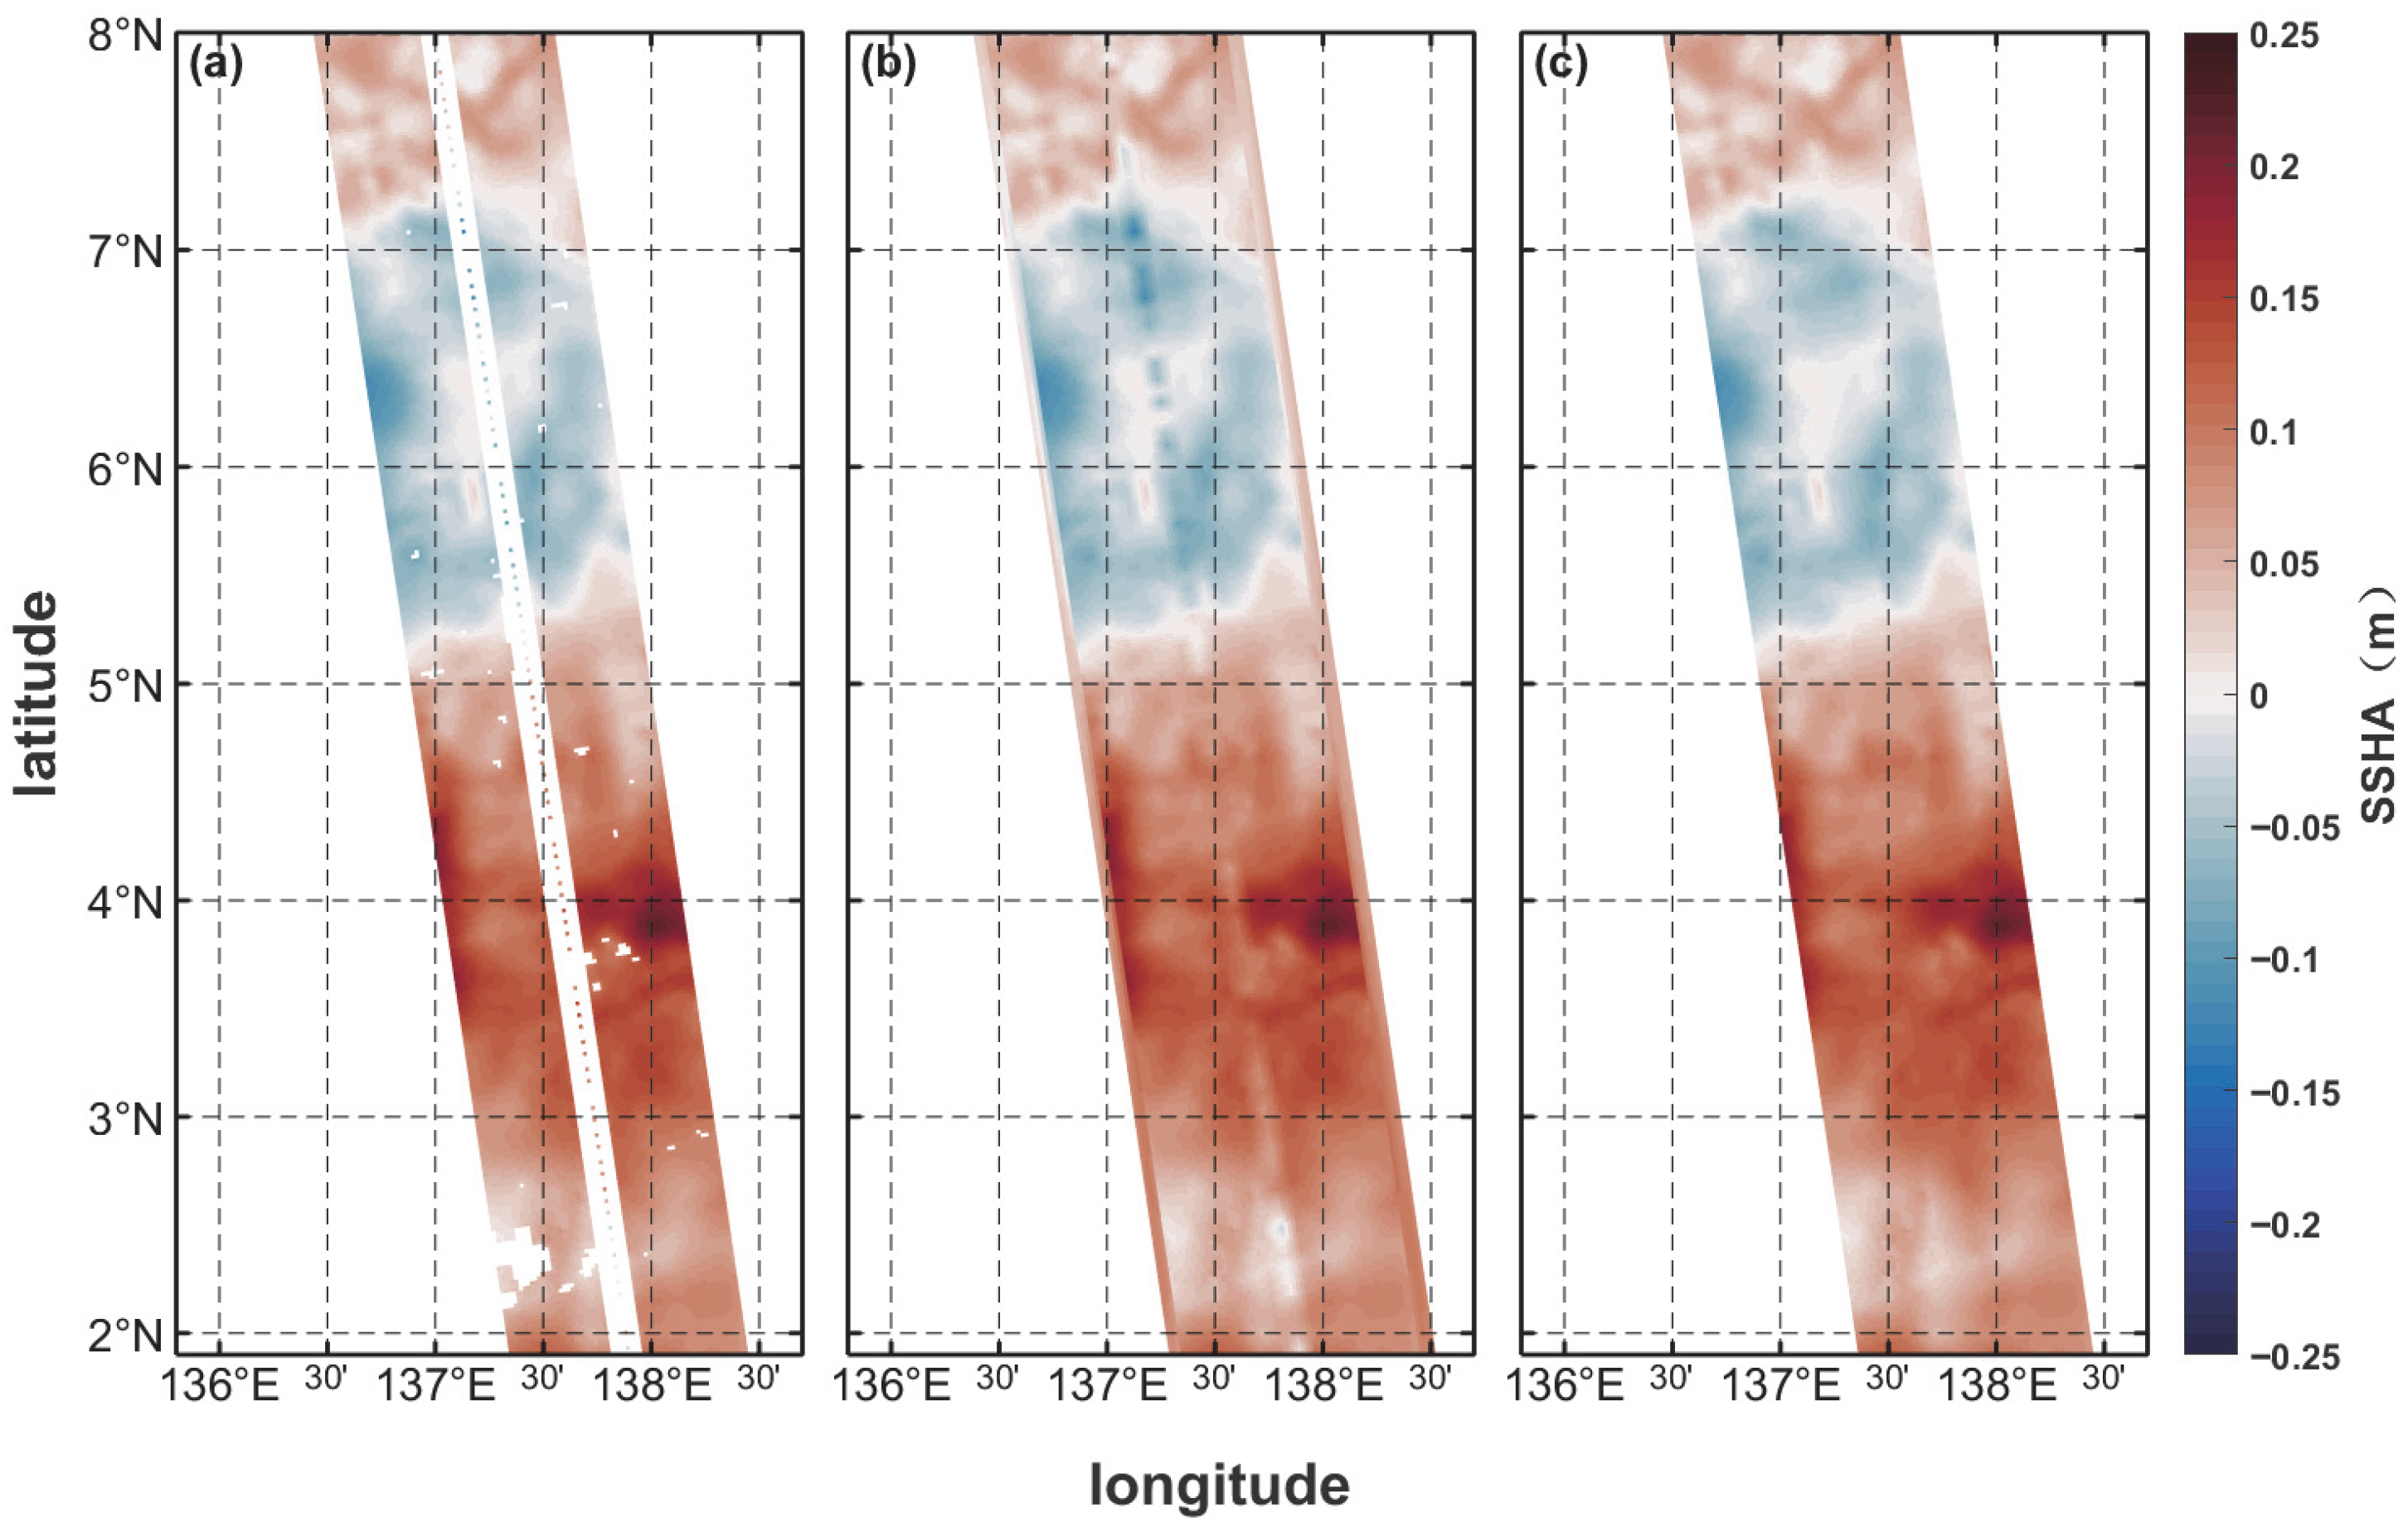
Figure 1. SLA Map for Orbit 006 on 7 July 2023. (a) The SLA observed by the SWOT comprises Nadir altimeter data (uniformly distributed points in the central swath) and KaRIn instrument data (color-coded regions flanking the satellite track). (b) Interpolation results incorporating Nadir and KaRIn data using natural neighbor Interpolation. (c) Natural neighbor interpolation results after Nadir data removal.
Remotesensing 17 03242 g001
Figure 2. Comparison of the full-cycle and the single sub-cycle conversion process from orbital swath data to gridded maps for the SWOT satellite over the tropical western Pacific region. (a) Full-cycle orbit of the SWOT satellite. (b) Full-cycle gridded map. (c) Sub-cycle orbit of the SWOT satellite. (d) Sub-cycle gridded map.
Remotesensing 17 03242 g002
Figure 3. Cyclonic (black)/Anticyclonic (blue) eddies detected by DUACS on 18 September 2023.
Remotesensing 17 03242 g003
Figure 4. (a) ME counts from DUACS data: Total (red line), cyclonic (black line), and anticyclonic (blue line) eddies. (b) SME counts from DUACS data: Total (red line), cyclonic (black line), and anticyclonic (blue line) eddies.
Remotesensing 17 03242 g004
Figure 5. Eddy properties derived from DUACS satellite data: (a) Count versus radius distribution. (b) Intensity versus radius distribution. (c) Count versus intensity distribution.
Remotesensing 17 03242 g005
Figure 6. Eddy Detection Results from SWOT Orbit 008 During the Cal/Val Phase. (a) 17 June 2023. (b) 18 June 2023. (c) 19 June 2023. (d) 20 June 2023. (c) The red circle marks the submesoscale eddy at the same location that was not detected because its contour extends beyond the orbital swath. The blue contours indicate anticyclonic eddies, while the black contours indicate cyclonic eddies.
Remotesensing 17 03242 g006
Figure 7. Number of Eddies Identified by the SWOT Satellite Data. Green bar chart: Total number of MEs; Red-colored elements: Total number of SMEs; Black line: Number of cyclonic eddies; Blue line: Number of anticyclonic eddies.
Remotesensing 17 03242 g007
Figure 8. Same as Figure 5, Eddy properties derived from conventional SWOT satellite data: (a) Count versus radius distribution. (b) Intensity versus radius distribution. (c) Count versus intensity distribution.
Remotesensing 17 03242 g008
Figure 9. Eddy Detection Statistics from SWOT Full-Cycle Orbital Tracks. Numbers indicate eddy core counts within the region.
Remotesensing 17 03242 g009
Figure 10. Comparison of Eddy Detections Between SWOT Satellite and DUACS Data. The blue contours correspond to eddies identified by DUACS, while the red contours represent those detected by SWOT. (Green boxes: regions of high consistency; Yellow boxes: regions with significant discrepancies).
Remotesensing 17 03242 g010
Table 1. Rossby Deformation Radius in Different Latitude Regions.
RegionMin (km)Max (km)Mean (km)R (km)
5°S–5°N23925224860
5°S–10°S, 5°N–10°N11820515560
10°S–15°S, 10°N–15°N811109545
15°S–20°S, 15°N–20°N59817035
20°S–25°S, 20°N–25°N45635530
Table 2. Comparison of eddy identification between DUACS data and SWOT satellite data.
RegionSatelliteAverage Number of MEs (units)Average Number of SMEs (units)Average Radius of MEs (km)Average Radius of SMEs (km)Average Amplitude of MEs (cm)Average Amplitude of SMEs (cm)
10°S–10°N (60 km)DUACS14 ± 3.697 ± 3.2194.75 ± 17.2125.20 ± 11.233.41 ± 0.193.60 ± 0.55
SWOT39 ± 7.93182 ± 22.7476.18 ± 14.0835.01 ± 18.218.77 ± 0.24.80 ± 0.75
DUACS/SWOT0.360.041.240.720.390.75
10°N/S–15°N/S (45 km)DUACS25 ± 4.923 ± 1.7390.04 ± 19.6324.66 ± 6.334.37 ± 0.223.29 ± 0.37
SWOT36 ± 5.2353 ± 11.4463.56 ± 16.0130.99 ± 15.025.18 ± 0.194.26 ± 0.73
DUACS/SWOT0.700.051.420.800.840.77
15°N/S–20°N/S (35 km)DUACS56 ± 7.162 ± 1.4384.03 ± 20.8422.99 ± 3.164.99 ± 0.234.04 ± 0.26
SWOT54 ± 6.7924 ± 7.3261.92 ± 20.6526.07 ± 10.755.16 ± 0.23.27 ± 0.65
DUACS/SWOT1.040.081.360.880.981.24
20°N/S–25°N/S (30 km)DUACS66 ± 5.971 ± 075.49 ± 23.8919.61 ± 2.396.10 ± 0.234.30 ± 0.29
SWOT48 ± 7.3314 ± 3.4860.05 ± 23.4623.27 ± 8.735.77 ± 0.23.44 ± 0.62
DUACS/SWOT1.380.071.260.841.061.25
0–25°N/SDUACS1621382.3624.175.223.67
SWOT17627364.9132.846.134.49
DUACS/SWOT0.920.081.270.740.850.82
Table 3. Characteristics of MEs and SMEs under different radius thresholds.
RadiusSatelliteAverage Number of MEs (units)Average Number of SMEs (units)Average Radius of MEs (km)Average Radius of SMEs (km)Average Amplitude of MEs (cm)Average Amplitude of SMEs (cm)
30 kmDUACS165 ± 13.799 ± 3.9381.60 ± 23.1918.38 ± 3.685.18 ± 0.233.83 ± 0.33
SWOT333 ± 34.94116 ± 18.9453.19 ± 20.0323.05 ± 8.985.52 ± 0.24.02 ± 0.6
DUACS/SWOT0.500.081.530.800.940.95
35 kmDUACS162 ± 13.2712 ± 4.782.33 ± 22.5521.18 ± 4.945.20 ± 0.233.83 ± 0.36
SWOT278 ± 24.96171 ± 21.7757.40 ± 19.3125.92 ± 11.315.73 ± 0.24.15 ± 0.67
DUACS/SWOT0.580.071.430.820.910.92
45 kmDUACS155 ± 12.5119 ± 5.984.30 ± 21.1428.46 ± 8.585.29 ± 0.233.60 ± 0.44
SWOT187 ± 21.07262 ± 31.8466.23 ± 17.6130.53 ± 14.726.4 ± 0.24.23 ± 0.73
DUACS/SWOT0.830.071.270.930.830.85
60 kmDUACS132 ± 10.942 ± 7.9289.92 ± 17.6741.71 ± 17.175.62 ± 0.233.49 ± 0.58
SWOT102 ± 12.54346 ± 37.5478.69 ± 14.6735.57 ± 18.387.28 ± 0.194.5 ± 0.75
DUACS/SWOT1.290.121.141.170.770.78
Disclaimer/Publisher’s Note: The statements, opinions and data contained in all publications are solely those of the individual author(s) and contributor(s) and not of MDPI and/or the editor(s). MDPI and/or the editor(s) disclaim responsibility for any injury to people or property resulting from any ideas, methods, instructions or products referred to in the content.