Article

Improved Multi-View Graph Clustering with Global Graph Refinement

National University of Defense Technology, Changsha 410073, China
*
Author to whom correspondence should be addressed.
These authors contributed equally to this work.
Remote Sens. 2025, 17(18), 3217; https://doi.org/10.3390/rs17183217
Submission received: 24 July 2025 / Revised: 2 September 2025 / Accepted: 12 September 2025 / Published: 17 September 2025

Abstract

Highlights

What are the main findings?
  • This study proposes a view-specific fusion network (VSFN) that extracts and integrates node attribute and structural information into view-specific representation through a global self-attention mechanism and self-supervised clustering strategy.
  • A learnable attention-driven aggregation strategy and cross-view fusion module are adopted to merge view-specific representations for consensus clustering.
What is the implication of the main finding?
  • The IMGCGGR method significantly outperforms existing state-of-the-art multi-view graph clustering techniques across various benchmark datasets.
  • This approach effectively addresses the issue of insufficient structural extraction in multi-view data while capturing both local and global graph properties, making it suitable for multi-source graph-structured data, multi-sensor fusion and geographic information systems data.

Abstract

The goal of multi-view graph clustering (MVGC) for remote sensing data is to obtain a consistent partitioning by capturing complementary and consensus information across multiple views. However, numerous ambiguous background samples in multi-view remote sensing data increase structural heterogeneity while simultaneously hindering effective information extraction and fusion. Existing MVGC methods cannot selectively integrate and fully refine both graph structure and node attribute information for consensus representation learning. Furthermore, current methods tend to overlook distant nodes, thus failing to capture the global graph structure. To solve these issues, we propose a novel method called Improved Multi-View Graph Clustering with Global Graph Refinement (IMGCGGR). Specifically, we first design a view-specific fusion network (VSFN) to extract and integrate node attribute and structural information into view-specific representation for each view. VSFN not only utilizes a global self-attention mechanism to enhance the global properties of structural information but also constructs a clustering loss through a self-supervised strategy to guide the view-specific clustering distribution assignment. Moreover, to enhance the capability of view-specific representation, a learnable attention-driven aggregation strategy is introduced to flexibly fuse the attribute and structural feature. Then, we adopt a cross-view fusion module to adaptively merge multiple view-specific representations for generating the final consensus representation. Comprehensive experiments show that IMGCGGR achieves significant clustering performance improvements over baseline methods across various benchmark datasets.

Graphical Abstract

1. Introduction

The advancement in multimedia data collection capabilities has significantly enhanced the availability of multi-view remote sensing data [1,2], which has been demonstrated to improve performance by comprehensively utilizing complementary knowledge from different data perspectives [3,4,5,6]. Take land remote sensing as an example: land data could be broken down into high-resolution optical images, SAR data, and night-time light data. High-resolution optical images can provide spectral information of the surface, the SAR data capture the structure and texture features of the surface, and the night-time light data can reflect the intensity of human activities. Regarding each modality as a data view, multi-view clustering [7,8] has recently attracted significant attention as crucial multimedia technology. By optimally fusing complementary and consensus information, it effectively reveals underlying data patterns. There exist complex relationships between different views of multi-view data. On the one hand, each view provides unique view-specific information. On the other hand, all views share the same semantic information. Effectively and fully integrating information from different views is an extremely challenging task in multi-view scenarios [9].
Although numerous studies have confirmed the power of multi-view clustering [10,11], traditional approaches often rely on shallow models with limited representation learning capabilities. These methods struggle to effectively address non-Euclidean structured data and comprehensively integrate graph topological information. Unlike common multi-view data, graph-structured multi-view data contain more abundant information, comprising both node attributes across multiple views and topological relationships. For instance, in the land use scenario, different areas on the surface are regarded as nodes in the diagram, and the spatial adjacency, functional correlation or similarity between the nodes constitute the connection relationships of the edges. Adjacent areas often have similar land types, while areas with functional connections (such as commercial areas and residential areas) may be spatially separated but functionally closely linked. These structural patterns, emerging from intrinsic data properties and neighborhood interactions, explicitly encode inter-sample dependencies. It is not only crucial for data representation learning but also essential for improving partitioning [12]. For clustering tasks in particular, fully leveraging the topological structure can greatly enhance clustering performance.
The emergence of the graph neural network (GNN) [13], as a powerful tool for analyzing non-Euclidean graph-structured data, has provided significant assistance in addressing a variety of graph analytical tasks across different domains, such as recommendation systems [14], information retrieval [15], and bioinformatics [16]. Inspired by the powerful representation extraction ability of GNNs, deep multi-view graph clustering (DMVGC) [17,18] algorithms are proposed to mine the graph-structured multi-view data. DMVGC methods typically integrate the graph structure into node attribute for multi-view representation learning. For example, Fan et al. [19] train a graph convolutional autoencoder to learn the shared representation of multi-view graph data by focusing on minimizing the reconstruction error of the graph view. Cheng et al. [20] design dual encoders that reconstruct the two sources embeddings in an attention mechanism with shared parameters.
Although the previous efforts have achieved significant performance improvements for graph-structured multi-view data, several limitations still exist. Existing deep multi-view graph clustering algorithms cannot flexibly integrate and fully refine both graph structure and node attribute information for multi-view representation learning. Information from attributes and structures is simply aligned or utilized with shared parameters, resulting in inadequate information interaction and merging. Moreover, these methods tend to leverage short-range adjacency connections, thus ignoring the global properties of structural information. In graph-structured data, nodes may exhibit implicit associations through multi-hop paths (e.g., functional similarity between distant proteins in interaction networks). Neglecting global structural information can lead to erroneous similarity assessments.
Motivated by the above observations, in this paper, we put forward a novel deep multi-view graph clustering framework for graph-structured multi-view data, which is called improved multi-view graph clustering with global graph refinement (IMGCGGR). IMGCGGR consists of two core modules: the view-specific fusion network (VSFN) module and the cross-view fusion module. The VSFN module is designed to fully extract and flexibly integrate view-specific node attributes and structural features by a graph autoencoder and self-supervised strategy. Specifically, the graph autoencoder not only enables a more comprehensive refinement of structural information through the global self-attention mechanism but also facilitates flexible integration with attribute features via a learnable attention-driven strategy. The self-supervised strategy is introduced to construct clustering loss for guiding the view-specific clustering distribution assignment. For the cross-view fusion module, it adaptively combines multiple view-specific representations to produce the final consensus representation. Our proposed method is suitable for processing and analyzing multi-source graph-structured and remote sensing data, including but not limited to multi-attribute graph data, multi-sensor data fusion, and geographic information system data with complex spatial relationships. To summarize, our major contributions are listed as follows:
  • We propose a novel method called improved multi-view graph clustering with global self-attention (IMGCGGR). In the IMGCGGR, through the view-specific fusion network and cross-view fusion module, the node attribute and structural feature in graph-structured multi-view data can be thoroughly extracted and flexibly integrated. It greatly improves the clustering performance of graph-structured multi-view data.
  • We introduce a global self-attention mechanism in the view-specific fusion network to enhance the global properties of structural information. Moreover, to enhance the reliability and capability of view-specific representation, a self-supervised strategy is designed to guide the view-specific clustering distribution assignment. By constructing these modules, the representation learning capability of IMGCGGR can be further improved.
  • Extensive experiments on widely used benchmark graph-structured multi-view datasets demonstrate that our proposed IMGCGGR achieves significant improvements against existing state-of-the-art methods.

2. Related Work

In this section, we first present the basic principles of multi-view clustering and then introduce several classical multi-view clustering methods based on traditional machine learning. Furthermore, various recent studies in the literature for deep multi-view graph clustering are also discussed.

2.1. Basic Principles of Multi-View Clustering

In the multi-view scenario, the effectiveness of clustering is mainly ensured by two basic principles: complementary and consensus [7]. Of course, these two fundamental principles also serve as key guidelines for modeling multi-view clustering. The essence of the complementary principle lies in the idea that to provide a more comprehensive description of multi-view data objects, multiple views should be utilized more accurately. By leveraging complementary information contained in different views, a more thorough analysis of multi-view data can be achieved. The goal of the consensus principle is to maximize the shared consistency information among different views in order to reduce the probability of inconsistencies and errors. In conclusion, after years of investigation by scholars, it has been confirmed that the complementary and consensus principles have a crucial impact on the performance of multi-view clustering.

2.2. Traditional Multi-View Clustering

Traditional multi-view clustering (MvC) methods [21,22,23,24,25] enhance clustering performance by fusing features from multiple views through strategies such as subspace learning, graph fusion, or matrix factorization. We briefly introduce some classic methods in recent years. As one of the early pioneering works, Zhang et al. [26] propose a latent multi-view subspace clustering method, which reconstructs latent representations by leveraging complementary information in views, leading to more accurate and robust clustering results compared to single view. Luo et al. [27] design a multi-view subspace clustering (CSMSC) method that simultaneously utilizes both consistency and specificity for subspace representation learning. In CSMSC, consistency models the shared properties among all views, while specificity captures the intrinsic differences within each view. Wang et al. [28] take into account the issue of weights for different views and propose a general multi-view graph clustering algorithm. It derives a unified graph matrix by automatically weighting each view’s graph matrix and directly provides the final clustering results. To address the issue of noise and redundant information in the similarity graph learned from original multi-view features, Li et al. [29] propose a multi-view clustering method based on consensus graph learning (CGL). CGL constructs a similarity graph in the spectral embedding space and unifies spectral embedding with low-rank tensor learning into an overall optimization framework. Liu et al. [30] introduce a multi-view subspace clustering method that addresses the issue of redundant information in original views. By leveraging eigendecomposition to obtain low redundancy robust data, it lays the foundation for subsequent clustering. Inspired by the efficiency of anchor-based methods, Wen et al. [31] devise a novel anchor-based multi-view graph clustering framework to achieve global and local structure preservation. Considering the data-unpaired problem in the multi-view field, Wen et al. [32] propose a novel parameter-free unpaired multi-view graph clustering algorithm with cross-view structure matching (UPMGC). UPMGC adopts a unified framework to handle fully and partially unpaired multi-view data, effectively utilizing the structural information from each view to refine cross-view correspondences. Furthermore, to address the lack of flexibility and efficiency when constructing affinity matrices through tensors, Cai et al. [33] present an algorithm called tensorized scaled simplex representation (TSSR) for multi-view clustering. TSSR leverages a low-rank tensor constraint to capture consensus and complementary information among views while preserving the intrinsic relationships of the data. Owing to performing poorly on linearly non-separable data by a multi-view k-means algorithm, Lu et al. [34] propose an efficient multi-view k-means and use the Butterworth filters function to transform the adjacency matrix into a distance matrix. Considering the heterogeneity, high dimensionality, and label scarcity of remote sensing data, Cai et al. [35] propose an anchor-based multi-view kernel subspace clustering framework. This approach randomly samples anchors to construct sparse similarity matrices for computational efficiency and employs multi-kernel learning to automatically determine optimal kernel functions for different data modalities.
Although traditional methods have achieved certain effectiveness in multi-view data partitioning tasks [36,37,38], they share a common limitation: their tendency to capture shallow representations of multi-view data with restricted representation learning capacity. This is because most traditional methods employ shallow representation learning models (such as matrix factorization), and their consensus representations generated in the cross-view strategy cannot participate in the iterative optimization process of the algorithm. For graph-structured multi-view data in particular, even graph-based MvC algorithms cannot directly and sufficiently extract graph structural features. To address these limitations of traditional methods, in our proposed IMGCGGR, we adopt a global self-attention graph autoencoder for deep representation learning to fully extract the graph structure features. Meanwhile, a flexible cross-view fusion module is designed to generate the final trainable consensus representation to participate in iterative optimization process.

2.3. Deep Multi-View Graph Clustering

Deep multi-view graph clustering is an emerging research field, which automatically learns the nonlinear feature representation and graph structure through a graph neural network. Considering that shallow models’ ability to handle complex relationships in multi-view graphs can severely limit the modeling capacity of multi-view graph information, Fan et al. [19] are the first to attempt applying deep learning techniques to attributed multi-view graph clustering, which learns node embeddings and shared feature representations by utilizing single-view attribute feature and multiple graph structure views. Xia et al. [17] enhance node attributes by constructing a new Euler transform view while imposing a block diagonal representation constraint on the self-expression coefficient matrix measured by the l 1 , 2 -norm. To address the issue of multi-view graph clustering being susceptible to low-quality graphs, Ling et al. [18] proposed a dual label-guided graph refinement method for multi-view graph clustering. They extract high-level view-common information to refine each view’s graph and reduce the influence of non-homophilous edges.
The aforementioned deep multi-view graph clustering methods mainly focus on multiple graphs, thereby ignoring the node attribute multi-view scenarios. To achieve the clustering of multiple attribute views, Cheng et al. [20] propose a novel multi-view attribute graph convolution (MAGCN) network and utilize two-pathway encoders to map graph embedding features. The first pathway reduces noise and redundancy using multi-view attribute graph attention networks, and the second pathway employs consistent embedding encoders to model geometric relationships. Xia et al. [39] propose a self-supervised graph convolutional network for multi-view clustering (SGCMC) to optimize node content reconstruction and graph structure reconstruction with weighting sharing. It jointly optimizes latent representations and coefficient matrices using clustering labels, enabling an iterative refinement of node clustering. Wang et al. [40] introduce a consistent multiple graph embedding clustering framework (CMGEC) and devise a mutual information maximization module to guide the common representation. To flexibly encode the complementary information of multi-view data, it uses a multi-graph attention fusion encoder. Xiao et al. [41] propose an efficient model called the dual fusion-propagation graph neural network to capture multiple pieces of information among different views. This module’s view-specific propagation effectively learns discriminative view representations while preserving complementarity.
Despite significant progress, existing deep multi-view graph clustering methods still face challenges in effectively combining node and graph representations. Most existing methods use standard graph convolutional networks for representation learning. They extract local features by aggregating neighbor node information, which leads to insufficient structural information capture. During the fusion mechanism, when integrating to common representation or a similarity graph, these methods typically employ a simplistic weighted-sum technique for construction. It may fail to fully explore the implicit inter-view relationships. In addition, most existing models employ the local attention mechanism and emphasize local structural information while neglecting global properties, which impacts their subsequent fusion capability. To overcome the aforementioned shortcomings, our proposed IMGCGGR introduces a global self-attention mechanism for comprehensive graph representation learning. By jointly training it with weighted local graph learning, we achieve more sufficient structural information extraction. Meanwhile, when integrating the structural information and attribute representations, unlike the simplistic weighted-sum techniques used in existing deep multi-view graph clustering methods, our approach fuses structural and attribute information through an attention-driven weighting strategy during joint training.

3. Methods

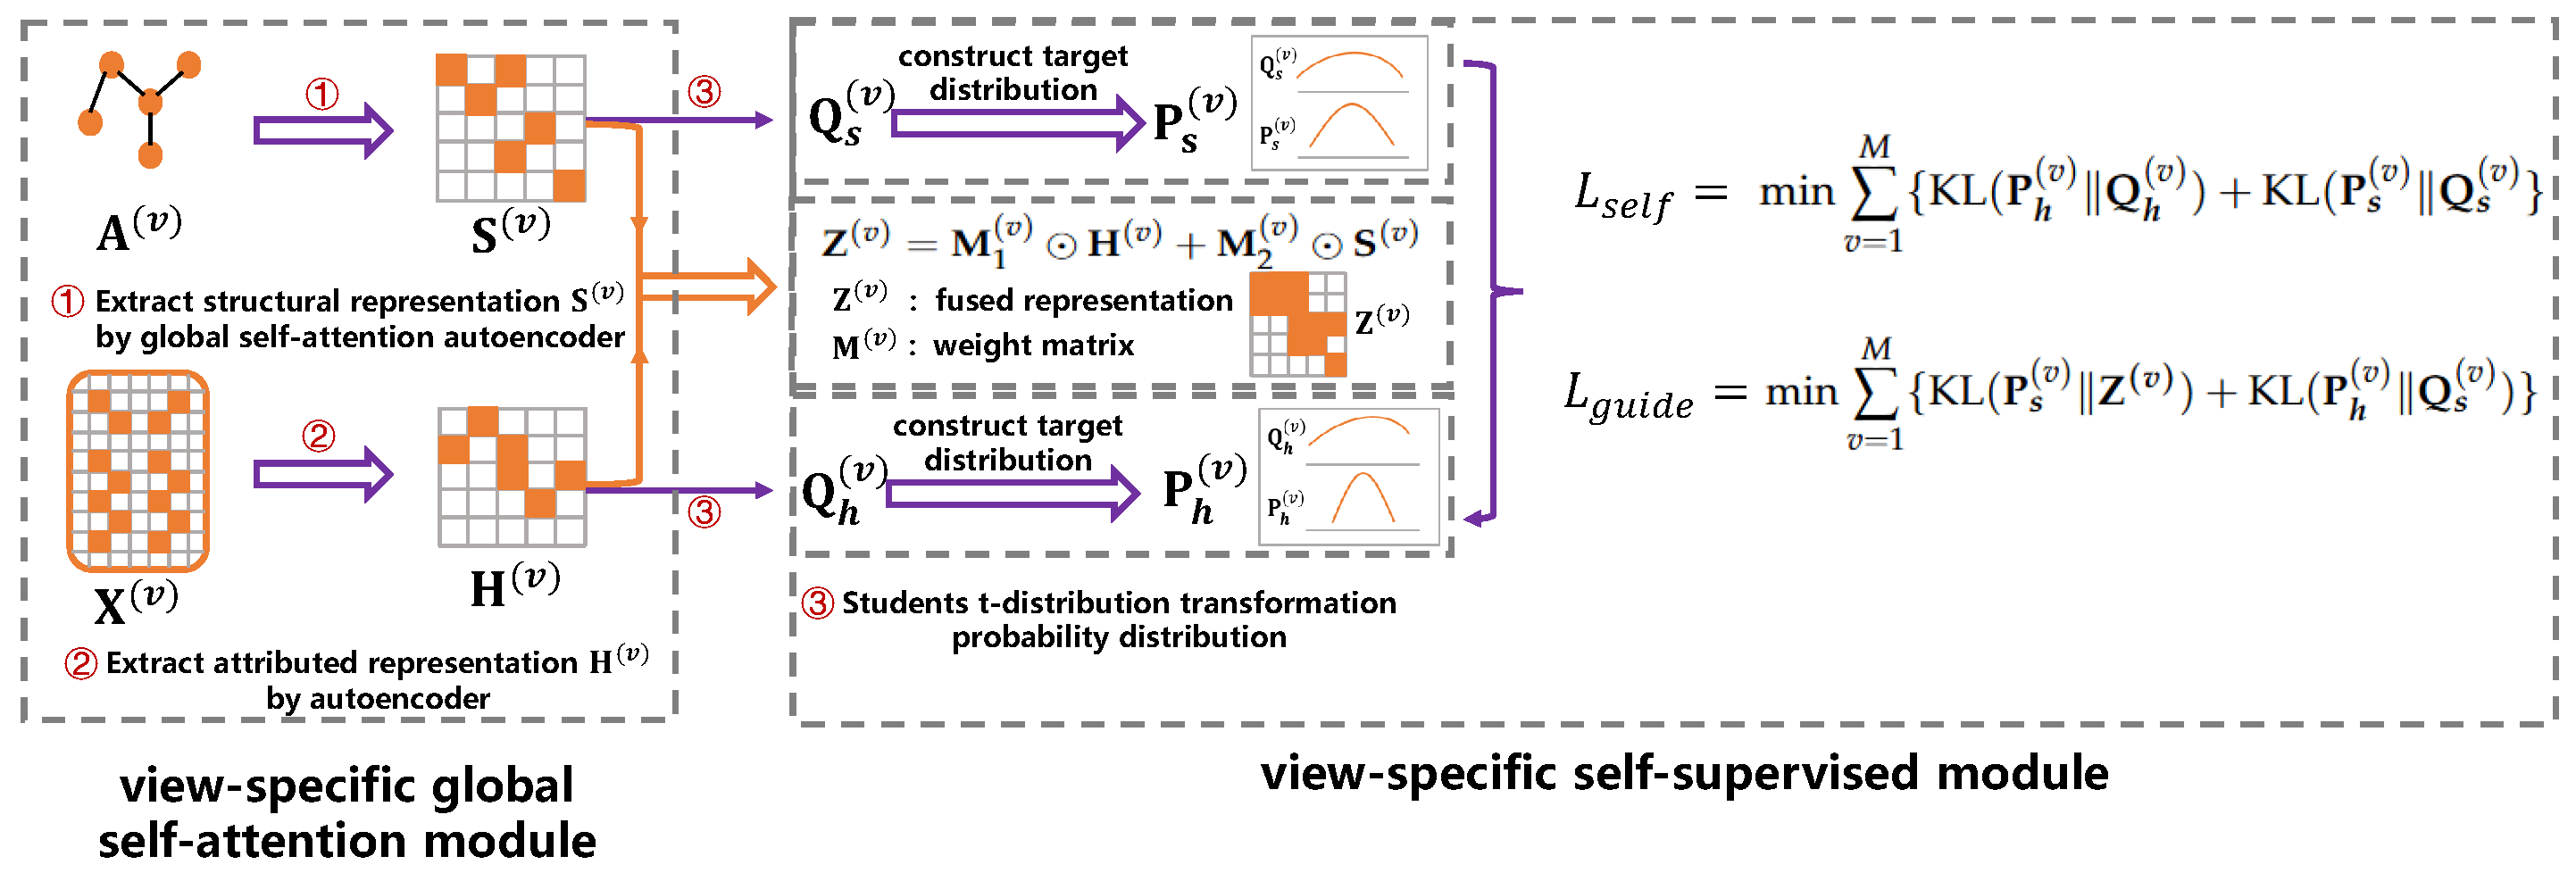
In this section, we comprehensively elaborate the proposed IMGCGGR method. IMGCGGR contains two fundamental modules: the view-specific fusion network (VSFN) module and the cross-view fusion module. The overall framework illustration is shown in Figure 1. The VSFN first extracts structural representation S ( v ) and attributed representation H ( v ) through a view-specific global attention module, and then it transforms both into probability distributions using Student’s t-distribution. After combining structural and attribute representation into the fused representation Z ( v ) , the training of the clustering distribution is guided by a view-specific self-supervised module. The cross-view fusion module learns to weight and combine view-specific fused representations through a trainable framework, yielding an improved consensus representation. Table 1 presents the main notations used in this paper. In the following, we will provide detailed implementation descriptions of each module.

3.1. Notations and Problem Definition

Let there be a multi-view undirected graph G = { V , E } with K clusters, where V = { v 1 , , v N } and E represent the node set and the edge set, respectively. The graph G is typically characterized by attribute matrix X = { X ( 1 ) , X ( 2 ) , , X ( v ) , } and undirected original adjacency matrix A = { A ( 1 ) , A ( 2 ) , , A ( v ) , } . X ( v ) R d v × N represents the node attribute view, and A ( v ) R N × N represents the structural view. To mitigate the issue of gradient vanishing/exploding, we employ a renormalization trick:
A ˜ ( v ) = D ˜ ( v ) 1 2 ( A ( v ) + I N ) D ˜ ( v ) 1 2 ,
where D ˜ i i ( v ) = j ( A ( v ) + I N ) i j is the degree matrix, and I N denotes the identity matrix. N is the number of nodes. When performing calculations using the graph structure later on, it is assumed that the preprocessed A ˜ = { A ˜ ( 1 ) , A ˜ ( 2 ) , , A ˜ ( v ) , } is used for the computations by default.

3.2. View-Specific Fusion Network

In order to fully extract the node attributes and structural information representations from graph-structured multi-view data, and to flexibly integrate both of them into the specific representations for each view, we introduce a view-specific fusion network. The flowchart of the view-specific fusion network is shown in Figure 2. The view-specific fusion network module consists of two submodules: a view-specific global self-attention module and a view-specific self-supervised module. In general, the view-specific global self-attention module is designed to refine the view-specific structural representation S ( v ) . Then, the learned structural representation S ( v ) is fused with the attributed representation H ( v ) by a learnable attention-driven strategy to generate the fused view-specific representation Z ( v ) . Here, the attributed representation H ( v ) is generated by mapping the attribute matrix X ( v ) into low-dimensional embedding through an autoencoder network. Finally, the fused view-specific representation Z ( v ) is trained by a self-supervised module to achieve more reliable and clustering-friendly embedding.

3.2.1. View-Specific Global Self-Attention Module

Most existing deep multi-view graph clustering methods typically utilize a multi-layer graph convolution network (GCN) for graph representation learning. However, the standard GCN can only capture the local structure and cannot extract global structural information. Thus, we construct a view-specific global self-attention (VSGSA) module to address this limitation.
In the VSGSA module, we first transform the l-th hidden embedding U ( v , l ) R d ( v , l ) × N ( U ( v , 0 ) = X ( v ) ) into two feature spaces f , g . The computation of the attention for U ( v , l ) is formulated as follows:
s i j ( v , l ) = f ( U i ( v , l ) ) T g ( U j ( v , l ) ) , β i , j ( v , l ) = exp ( s i j ( v , l ) ) i = 1 N exp ( s i j ( v , l ) ) , f ( U ( v , l ) ) = W f ( v , l ) U ( v , l ) , g ( U ( v , l ) ) = W g ( v , l ) U ( v , l ) ,
W f ( v , l ) , W g ( v , l ) are the trainable weight matrices. β i , j ( v , l ) denotes the attention influence of node j on node i. d ( v , l ) is the dimension of the l-th layer network for the v-th view, and N is the number of samples. Thus, the output o ( v , l ) = o 1 , o 2 , , o j , , o N R d ( v , l ) × N of the global self-attention network is formally calculated as
o j = v ( i = 1 N β i , j ( v , l ) h ( U i ( v , l ) ) ) h ( U i ( v , l ) ) = W h ( v , l ) U i ( v , l ) , v ( U i ( v , l ) ) = W v ( v , l ) U i ( v , l )
Here, W h ( v , l ) and W v ( v , l ) are the learned weight matrices. Then, we further integrate the global self-attention network with a standard GCN through linear weighting, aiming to simultaneously leverage both the global and local structure. The final learned view-specific structural representation S ( v ) of the VSGSA module is formulated as follows:
S ( v ) = α GCN ( X ( v ) , A ˜ ( v ) ; Θ ( v ) ) + β o ( v ) ,
where Θ ( v ) represents the set of learning parameter matrices of the GCN network. α and β are the learnable scalar, and α is initialized as 1, while β is initialized as 0. The reason for this initialization is that the learning of the local structure representation is relatively easy and efficient, because the local structure only needs to focus on the interaction operations with local neighbors. In contrast, the learning of global structure representation is relatively difficult, as it requires calculating the correlation with global nodes. Specifically, introducing a learnable scalar allows the network to initially rely on cues from local neighborhoods and then gradually learn to allocate more weight to global evidence.
To enhance representation learning, we integrate the structural representation S ( v ) with the attributed representation H ( v ) through an attention-driven aggregation strategy to generate the fused view-specific representation Z ( v ) . Specifically, we first concatenate the H ( v ) and S ( v ) to form a new concatenated representation S ˜ ( v ) :
S ˜ ( v ) = [ H ( v ) | | S ( v ) ] ,
Then, we apply a LeakyReLU activation function (negative input slope is set as 0.2) to the product of S ˜ ( v ) and the trainable parameter matrix W ˜ ( v ) . Furthermore, through softmax and L 2 regularization, we can compute the weight matrix M ( v ) as
M ( v ) = L 2 ( softmax ( σ ( S ˜ ( v ) W ˜ ( v ) ) ) ) ,
where σ indicates the activation function and L 2 denotes the l 2 -norm regularization. Here, softmax first performs global scaling, normalizing it into a probability distribution. The subsequent L 2 regularization quantifies the concentration degree of the distribution. The advantage of this design lies in that it not only ensures that the output weights are probabilities but also enables monitoring whether the attention in the representation learning has deteriorated (such as all zeros or a single peak). Thus, the fused view-specific representation Z ( v ) is given by
Z ( v ) = M 1 ( v ) H ( v ) + M 2 ( v ) S ( v ) ,
where M i ( v ) represents an expanded matrix of the i-th dimension of M ( v ) . To train the VSGSA module, we need to simultaneously minimize the reconstruction loss of both the attribute representation and the structural representation:
L r e = v = 1 M ( X ( v ) X ^ ( v ) F 2 + C E L o s s ( A ˜ ( v ) , A ^ ( v ) ) ) , C E L o s s ( A ˜ ( v ) , A ^ ( v ) ) = 1 N 2 i = 1 N i = j N [ a ˜ i j ( v ) log ( a ^ i j ( v ) ) + ( 1 a ˜ i j ( v ) ) log ( 1 a ^ i j ( v ) ) ] ,
where a ˜ i j ( v ) and a ^ i j ( v ) are, respectively, the elements of A ˜ ( v ) and A ^ ( v ) . X ^ ( v ) is the reconstruction attributed view, which is generated by an autoencoder network. A ^ ( v ) is the reconstruction graph topological structure, which is implemented by A ^ ( v ) = sigmoid ( S ( v ) ( S ( v ) ) T ) . M represents the number of views.
Consider the theory of deep clustering, namely that the representations trained solely with reconstruction loss is not necessarily suitable for clustering tasks [42]. Furthermore, most existing multi-view clustering algorithms typically first learn a common representation and then apply k-means to obtain the final clustering assignment. This two-stage learning approach fails to leverage the clustering process to improve the generated representation. Therefore, we introduce a view-specific self-supervised module to guide the clustering distribution assignment.

3.2.2. View-Specific Self-Supervised Module

The proposed view-specific self-supervised module is constructed to guide a clustering-friendly fused representation. To achieve this goal, we introduce two clustering layers and devise the corresponding clustering loss in a self-supervised manner. Specifically, Student’s t-distribution is firstly adopted to respectively generate the soft assignments Q h ( v ) (from H ( v ) ) and Q s ( v ) (from S ( v ) ):
q h i j ( v ) = 1 + H i ( v ) μ j ( v ) 2 / γ γ + 1 2 j 1 + H i ( v ) μ j ( v ) 2 / γ γ + 1 2 , q s i j ( v ) = 1 + S i ( v ) υ j ( v ) 2 / γ γ + 1 2 j 1 + S i ( v ) υ j ( v ) 2 / γ γ + 1 2 ,
where γ indicates the freedom degree of Student’s t-distribution. Here, the default value of the degree of freedom γ is set to 1. This is because cross-validation cannot be performed in an unsupervised environment, and this parameter learning is unnecessary [43]. μ j ( v ) , υ j ( v ) are the cluster centroids initialized in the pre-training stage and updated during the fine-tuning stage. q h i j ( v ) and q s i j ( v ) denote the probability of assigning node i to cluster j.
Then, we respectively construct the target distributions P h ( v ) and P s ( v ) as follows:
p h i j ( v ) = ( q h i j ( v ) ) 2 / i q h i j ( v ) j ( q h i j ( v ) ) 2 / i q h i j ( v ) , p s i j ( v ) = ( q s i j ( v ) ) 2 / i q s i j ( v ) j ( q s i j ( v ) ) 2 / i q s i j ( v ) ,
The target distributions P h ( v ) and P s ( v ) are introduced to refine the soft assignments through squared normalization, transforming the initially unreliable soft clustering distribution into a stable and highly discriminative target distribution. Subsequently, these two clustering layers can be used to guide the fused representation Z ( v ) . In particular, we first utilize the target distributions to guide their respective soft assignment distributions as follows:
L s e l f = v = 1 M { KL ( P h ( v ) Q h ( v ) ) + KL ( P s ( v ) Q s ( v ) ) } = v = 1 M ( i = 1 N j = 1 K p h i j ( v ) log p h i j ( v ) q h i j ( v ) + i = 1 N j = 1 K p s i j ( v ) log p s i j ( v ) q s i j ( v ) ) ,
where K indicates the number of clusters.
Next, we exploit the target distributions P s ( v ) to guide the fused view-specific representation Z ( v ) and establish the connectivity between H ( v ) and S ( v ) through the KL divergence:
L g u i d e = v = 1 M { KL ( P s ( v ) Z ( v ) ) + KL ( P h ( v ) Q s ( v ) ) } ,
To simultaneously learn the fused view-specific representations and cluster assignments in a unified process, we can jointly train the reconstruction loss and clustering loss by minimizing the overall objective function:
L = L r e + λ 1 L s e l f + λ 2 L g u i d e ,
where λ 1 , λ 2 > 0 are the trade-off parameters.

3.3. Cross-View Fusion Module

In order to fuse the view-specific representations learned from the view-specific fusion network module, we devise the cross-view fusion module. Unlike traditional methods where the consensus representation cannot participate in training, the cross-view fusion module is capable of adaptively integrating multiple view-specific representations and generating the final trainable consensus representation:
Z = v = 1 M w v Z ( v ) , w v = e w v i = 1 M e w i ,
Here, w v is a learnable variable that automatically adjusts the importance of the v-th preliminary representation and is updated through gradient descent optimization. Benefiting from a series of fusion mechanisms, the proposed method can flexibly integrate information from all input views. The final clustering probability distribution z is computed by the softmax function z = softmax ( Z ) . The detailed training process of IMGCGGR is shown in Algorithm 1.
Algorithm 1 Multi-View Graph Clustering with Global Self-Attention
  • Input: attribute feature { X ( v ) } v = 1 M ; adjacency matrix { A ( v ) } v = 1 M ; cluster number K; iteration number I max .
  • Output: Clustering result z
1:
Initialize the parameters of autoencoder and global self-attention module to obtain H ( v ) and S ( v ) ;
2:
Initialize the clustering centroids μ , υ ;
3:
while i t e r I max do
4:
     Update M ( v ) and Z ( v ) by Equations (6) and (7);
5:
     Calculate the soft assignment distribution Q h ( v ) and Q s ( v ) by Equation (9);
6:
     Compute the distribution P h ( v ) and P s ( v ) via Equation (10);
7:
     Calculate L r e , L s e l f , and L g u i d e by Equation (8), Equation (11), and Equation (12), respectively;
8:
     Update Z via Equation (14);
9:
     Update the whole network by minimizing Equation (13);
10:
    i t e r = i t e r + 1 ;
11:
end while
12:
Obtain clustering result z;
13:
return z

3.4. Complexity Analysis

The computational complexity of IMGCGGR consists of two parts: a view-specific fusion network (VSFN) and a cross-view fusion module. For a VSFN, updating the autoencoder costs O ( N v = 1 M i = 1 l d v d v , i ) , where N denotes the number of samples, M represents the number of views, d v is the dimension of the v-th attribute view, and d v , i is the number of dimensions for the i-th layer. Calculating the global self-attention module costs O ( ( | E | + N ) v = 1 M i = 1 l d v d v , i ) + M N 2 ) , as the operation can be computed efficiently using sparse matrix computation. | E | denotes the number of edges. Performing a self-supervised module needs O ( M N K + M N l o g N ) . K is the cluster number. For the cross-view fusion module, it costs O ( M N K ) .

4. Results

This section provides a detailed description of the experiments to verify the effectiveness of IMGCGGR, including the experimental setup, performance comparison, ablation studies, hyper-parameter analysis, running time, convergence analysis, and visualization analysis.

4.1. Experimental Setup

Datasets: To evaluate the effectiveness of IMGCGGR, we conduct experiments on six widely used benchmark datasets [44], including ACM, Amazon Photos (AMP), Citeseer, Cora, DBLP, and Pubmed. To enhance representation learning, we construct an additional attribute view through the Cartesian product according to [20].
ACM is a paper network from the ACM database, where edges connect the papers belonging to the same author. AMP is an co-purchase graph network from the Amazon database, where nodes represent goods, while edges indicate that two goods are frequently bought together. Citeseer, Cora, and Pubmed are a citation network dataset about scientific publications, where edges represent citations between publications. DBLP is an author network from the DBLP database, where edges represent the co-author pairs. The statistics of these datasets are summarized in Table 2.
Baseline Methods: For a comprehensive evaluation, we compare IMGCGGR with eleven representative state-of-the-art multi-view clustering methods, including GMC [28], CGL [29], CoMSC [30], EMVGC [31], UPGMC [32], UPCoMSC [32], TSSR [33], EMKIC [34], MAGCN [20], SGCMC [39], and GMGEC [40]. A brief introduction to these methods is provided below.
  • GMC [28]: It is a representative graph-based MvC algorithm, which derives a unified graph matrix by automatically weighting the graph matrices of each view.
  • CGL [29]: It constructs a similarity graph based on consensus graph learning in the spectral embedding space and unifies spectral embedding with low-rank tensor learning into an overall optimization framework.
  • CoMSC [30]: It is a representative subspace-based MvC approach, which leverages eigendecomposition to obtain low-redundancy robust data.
  • EMVGC [31]: It devises a novel anchor-based multi-view graph clustering framework to achieve global and local structure preservation.
  • UPGMC and UPCoMSC [32]: It adopts a unified framework to handle fully and partially unpaired multi-view data, effectively utilizing the structural information from each view to refine cross-view correspondences.
  • TSSR [33]: It leverages a low-rank tensor constraint to capture consensus and complementary information among views while preserving the intrinsic relationships of the data.
  • EMKIC [34]: It uses the Butterworth filters function to transform the adjacency matrix into a distance matrix.
  • MAGCN [20]: It is a representative deep multi-view graph clustering method designed to address the clustering of multi-view graph data, which utilizes two-pathway encoders to map graph embedding features and learn view-consistency information.
  • SGCMC [39]: It exploits a self-supervised multi-view graph attention autoencoder to optimize node content reconstruction loss and graph structure reconstruction loss with weighting sharing.
  • GMGEC [40]: It devises a graph autoencoder and introduces a multi-view mutual information maximization module to guide the learned common representation.
Implementation Details: In this paper, we employ four commonly used clustering metrics [39] to evaluate the clustering performance: accuracy (ACC), normalized mutual information (NMI), adjusted rand index (ARI), and macro F1 score (F1). For each compared baseline method, we compute the average and standard deviation results from ten independent runs under their recommended parameter configurations. For our proposed IMGCGGR, to obtain reliable clustering and avoid collapse, we first pre-train the autoencoder and view-specific global self-attention module, respectively, and then combine the self-supervised clustering loss to jointly train our model. The dimensions of each view-specific module encoder are set to 500–500–2000–20 for all benchmark datasets.

4.2. Performance Comparison

Table 3 and Table 4 present the clustering performance comparison results on all benchmark datasets. We have bolded the best results for each dataset. The numbers in the tables are the average evaluation metrics and the corresponding standard deviation. It can be observed that our proposed IMGCGGR achieves the best performance on all datasets. Specifically, taking the results on AMP for example, IMGCGGR significantly outperforms UPGMC and SGCMC by 26.11% and 8.20% ACC, respectively. These results demonstrate that IMGCGGR can effectively learn clustering-friendly graph representations compared to traditional graph clustering and deep graph clustering methods, thereby achieving superior clustering performance.
In addition, we observe that some traditional multi-view clustering methods encounter errors when running on multi-view graph data. The “evaluation error” indicates that although the GMC method obtained clustering results on the Citeseer dataset, these results assigned the majority of samples to a single class, and the total number of clusters exceeded the true number of categories. The “eigs error” refers to the fact that both the GMC and CGL methods encountered eigenvalue decomposition errors. The primary reason for these errors is that multi-view graph data are mostly sparse. Traditional multi-view clustering methods are more prone to errors when performing iterative optimization on sparse data. Moreover, compared to representative deep multi-view graph clustering methods, IMGCGGR also achieves the best performance. The main reason is that they are based on a standard graph convolution network, which fail to capture global graph structural information. Their representation fusion strategies lack flexibility and reliable guidance.

4.3. Ablation Studies

To thoroughly validate the effectiveness of each module, we compare IMGCGGR with its four variants on six datasets. Table 5 reports the ablation experiment results. Concretely, “noGSA” means a variant with the global self-attention module being removed. As reflected in Equation (4), this implies the absence of the term β o ( v ) . “noSelf” denotes the network trained without L s e l f loss. As reflected in Equation (13), this implies the absence of the term λ 1 L s e l f . “noGuide” indicates the network trained without L g u i d e loss. As reflected in Equation (13), this implies the absence of the term λ 2 L g u i d e . “noCrossView” represents that we replace the adaptive cross-view fusion module with a simple view accumulation.
Table 5 shows that all modules in IMGCGGR contribute to performance. The L s e l f loss is most critical, as removing it (“noSelf”) leads to very poor clustering due to missing soft assignment guidance from the auxiliary distribution. This is fatal for the training of the entire model. The global self-attention module significantly improves results by capturing global information via the self-attention mechanism. The L g u i d e loss is essential for aligning attribute and structural representations through the auxiliary distribution. The absence of this loss is bound to significantly impact the training of the network and the learning of the fused representation. Meanwhile, observing the comparison between (“noCrossView”) and IMGCGGR, it is evident that the weights of different views also influence the generation of the final consensus representation. If the importance of views is not considered and they are treated equally by direct summation, it will significantly degrade the model’s final performance.

4.4. Hyper-Parameter Sensitivity Analysis

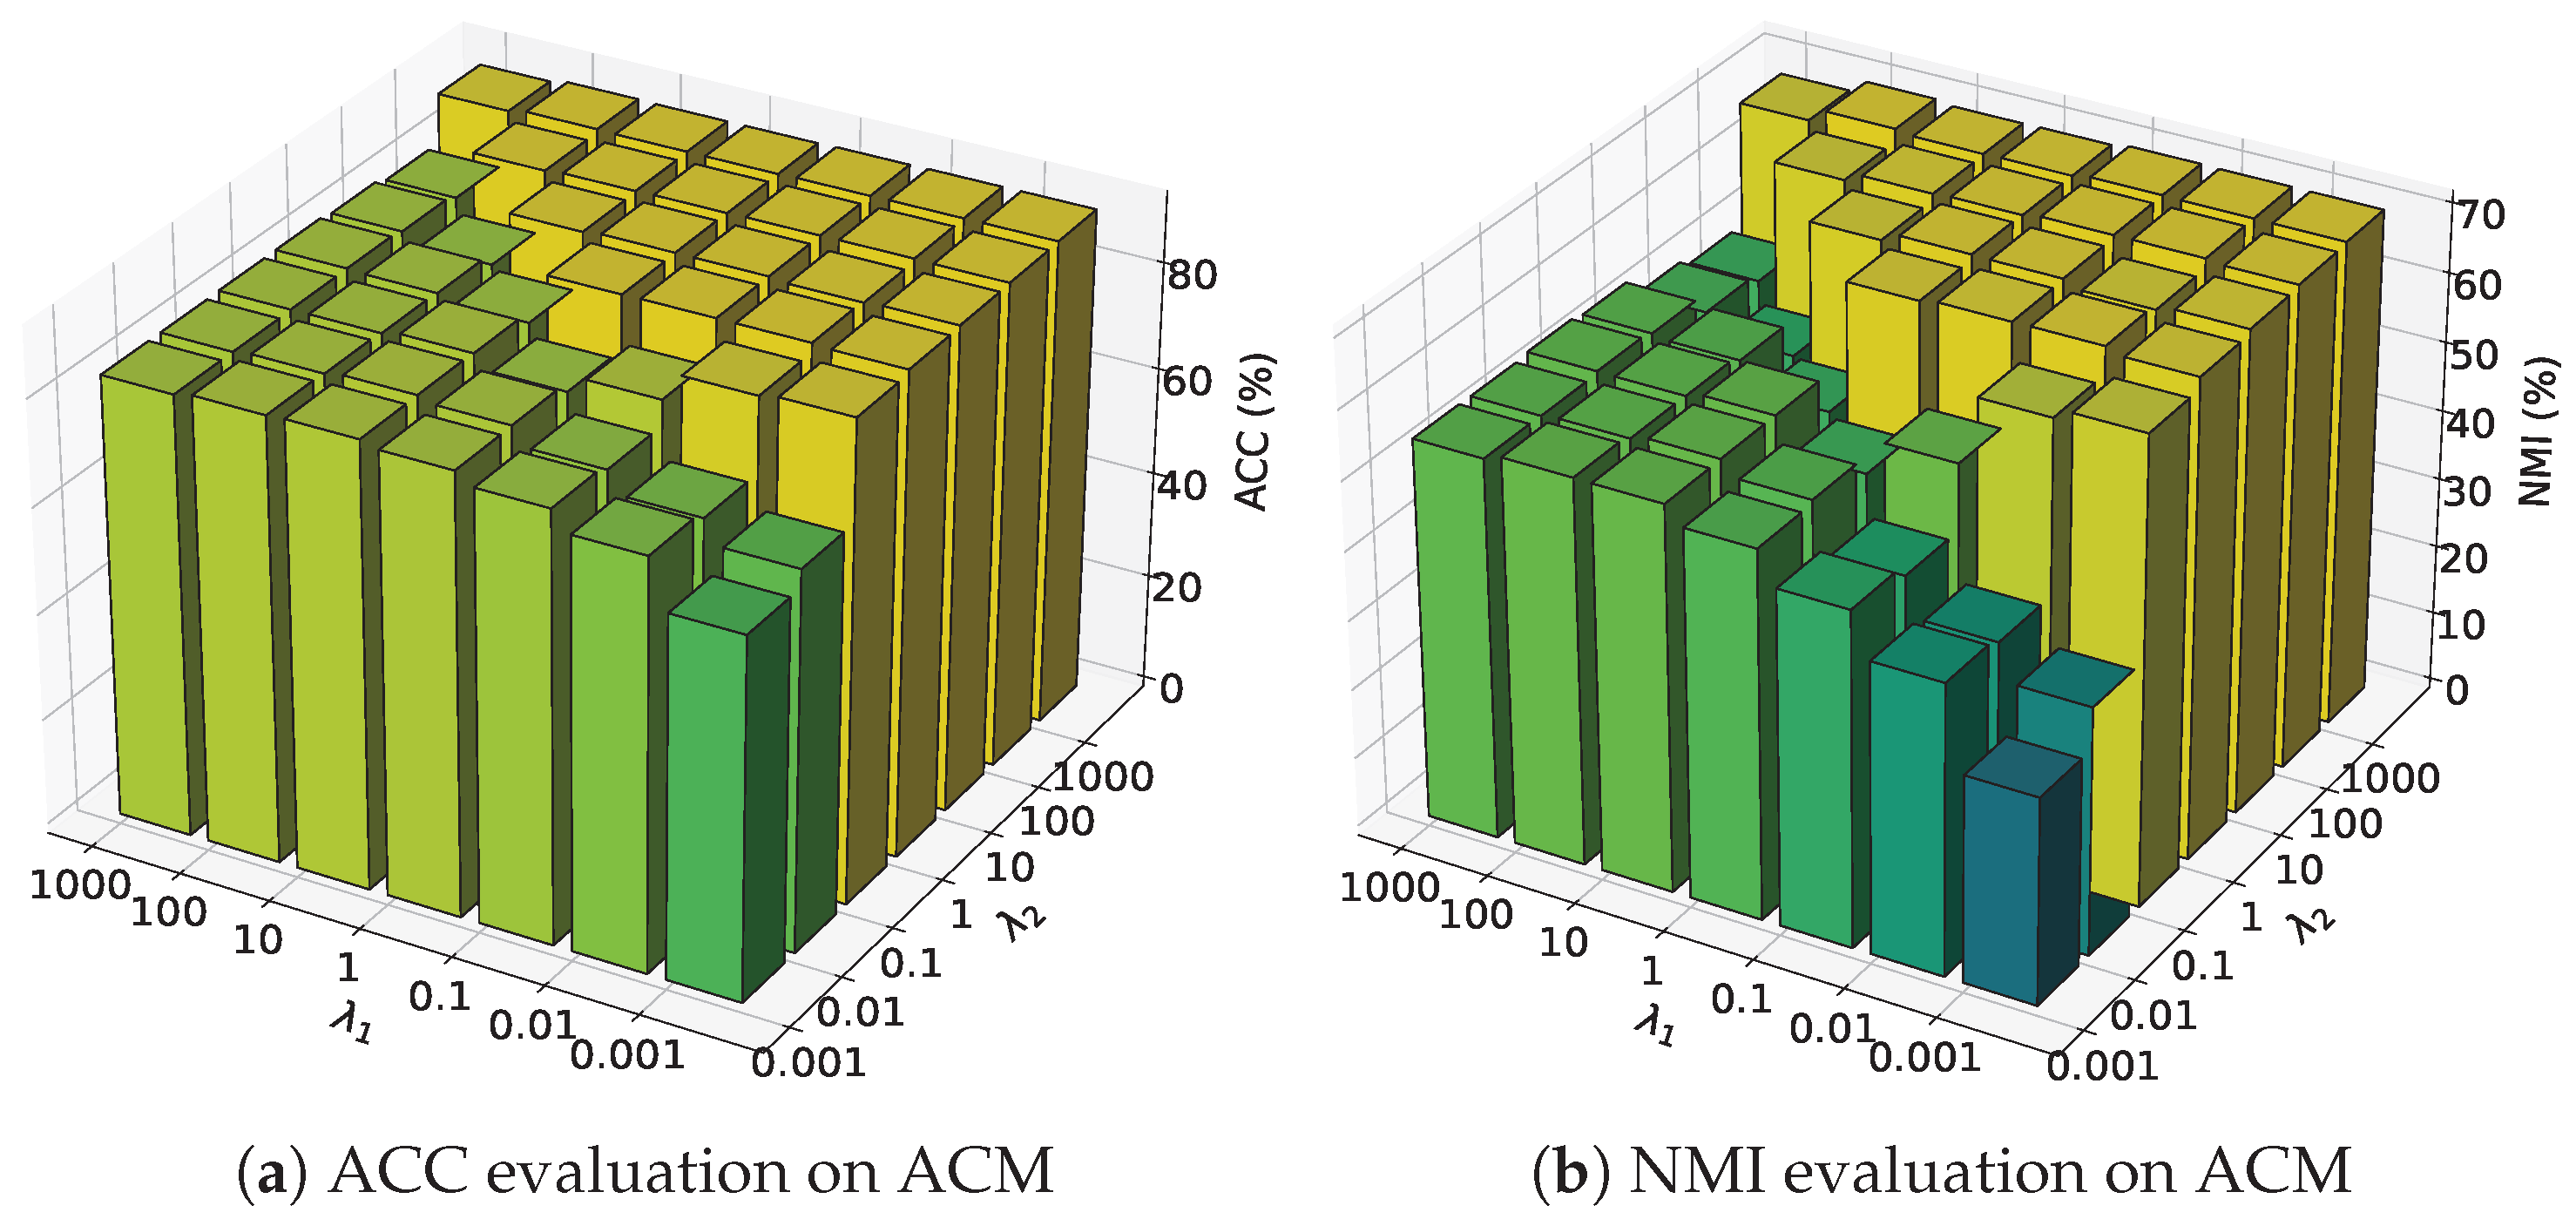
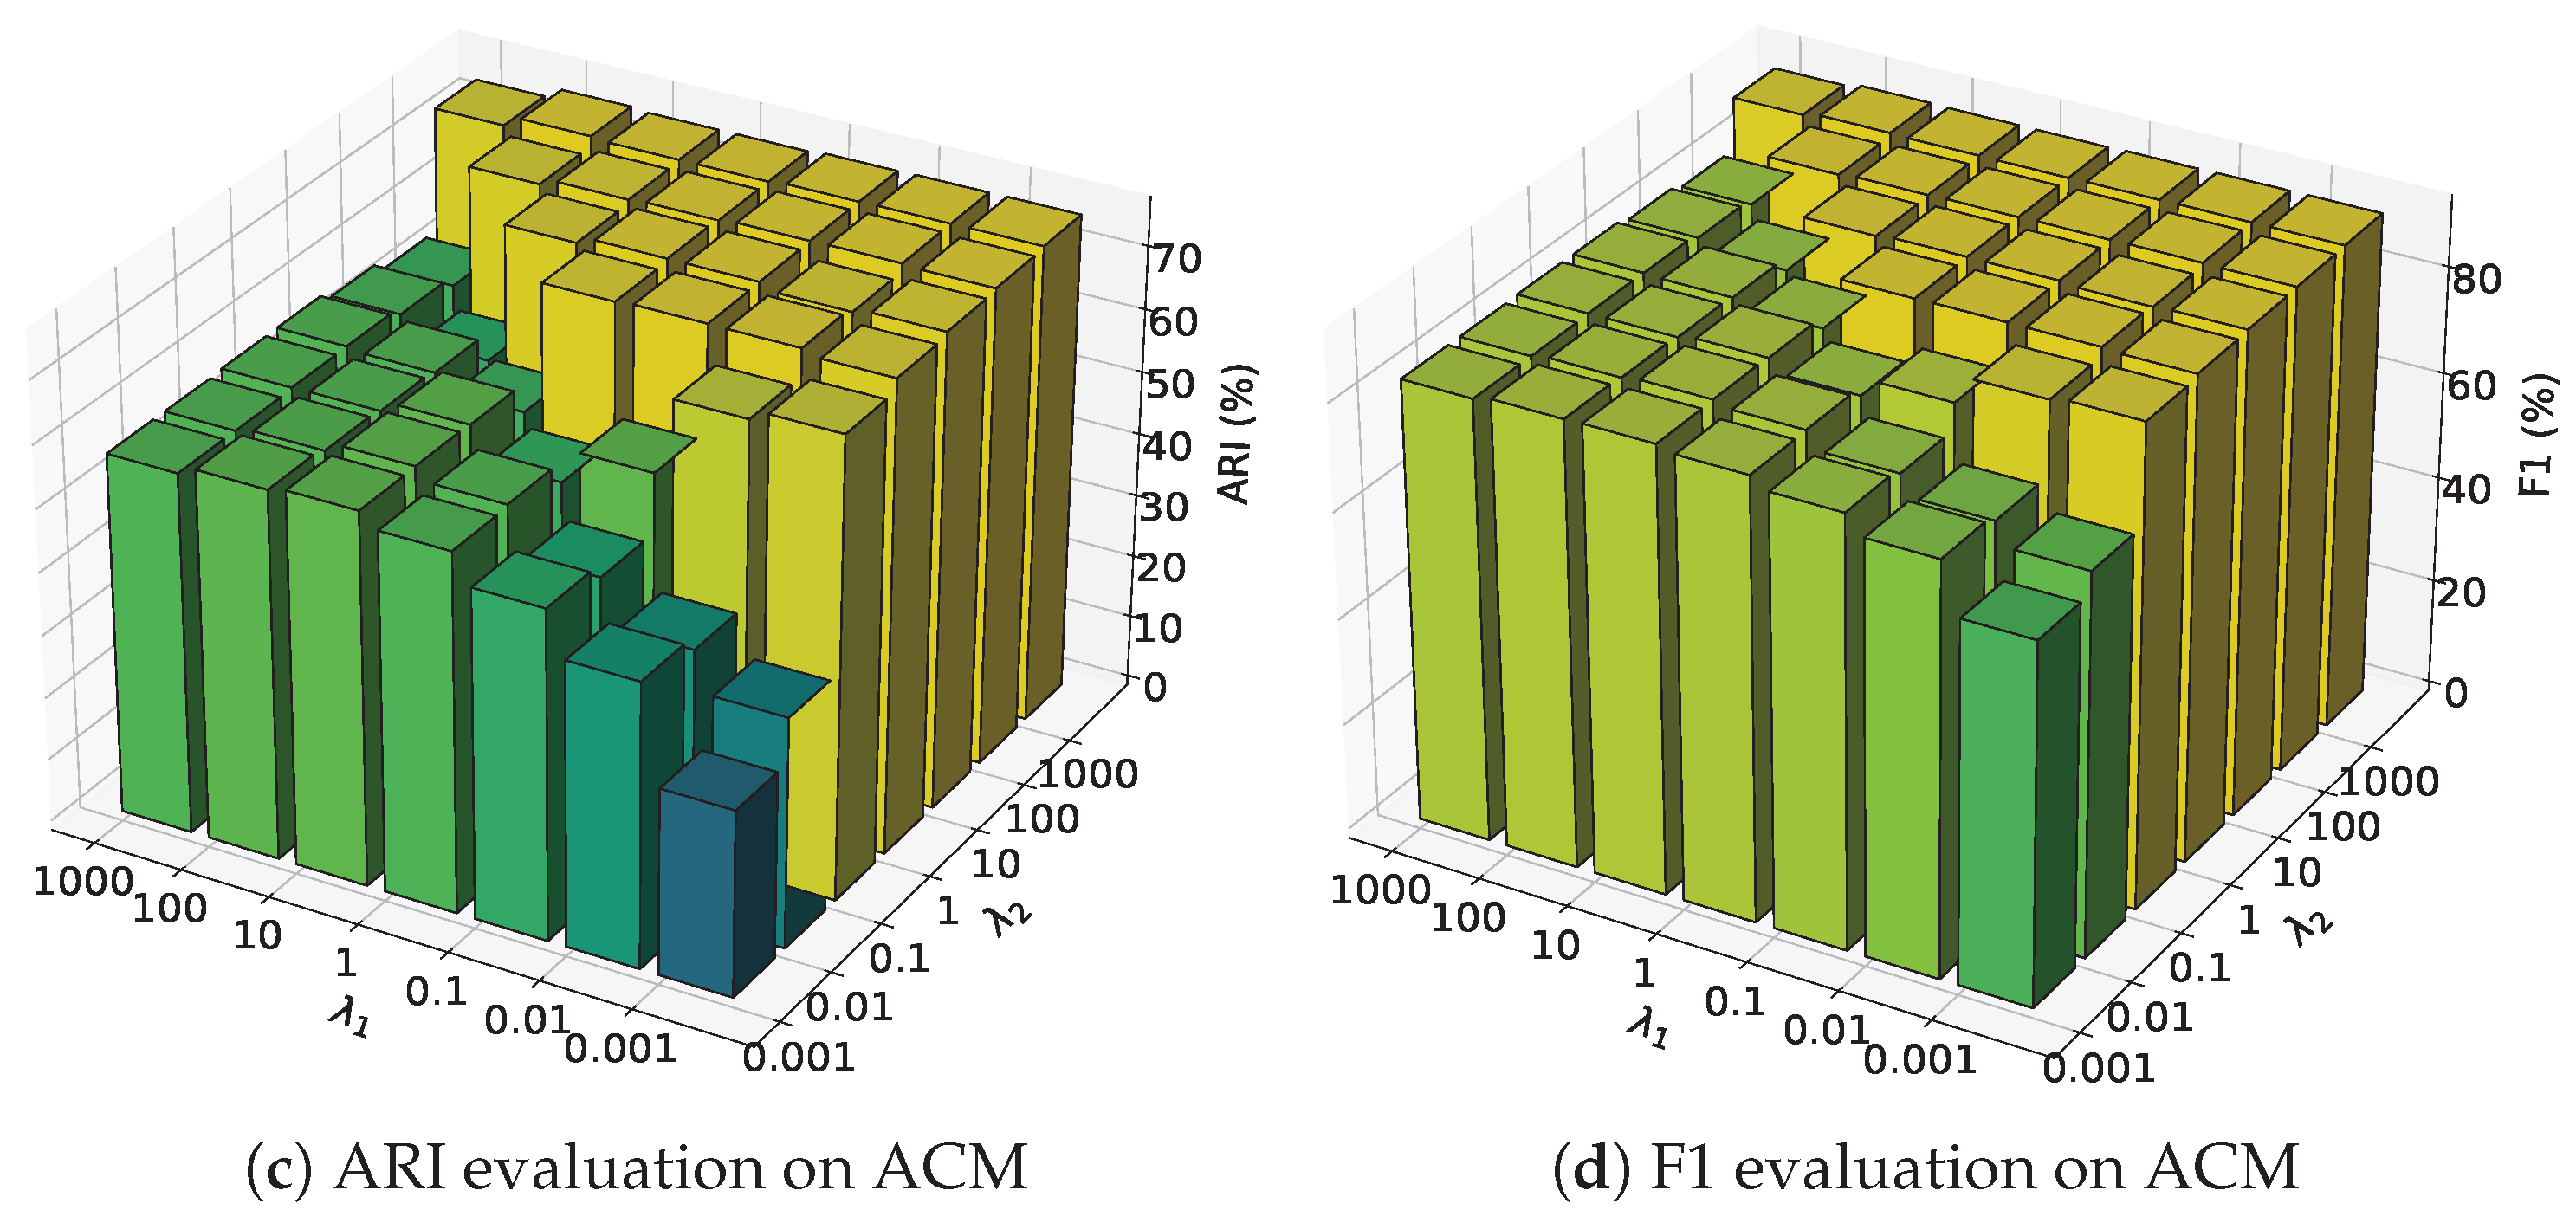
In our model, hyper-parameters λ 1 , λ 2 are the trade-off parameters for L s e l f and L g u i d e loss. To investigate the impact of hyper-parameters on model performance, we perform comprehensive sensitivity experiments. Specifically, we evaluate IMGCGGR by varying λ 1 and λ 2 from 10 3 to 10 3 . Figure 3 shows the hyper-parameter sensitivity results on ACM, and we can see that the model performance is optimized when λ 1 and λ 2 are set to 1 and 10. When λ 2 < 1 , the model performance degrades as λ 2 decreases. This demonstrates the crucial role of the guide clustering loss in representation learning. The L g u i d e term not only guides the training of view-specific representations Z ( v ) but also establishes a connection between the attribute distribution and structural distribution for joint optimization. For the remaining datasets, we also conducted similar experiments on the sensitivity of hyper-parameters. The detailed setting results of hyper-parameters λ 1 and λ 2 are shown in Table 6. When applying our IMGCGGR method to other datasets, typically, we recommend λ 1 = λ 2 = 1 for most datasets.

4.5. Running Time

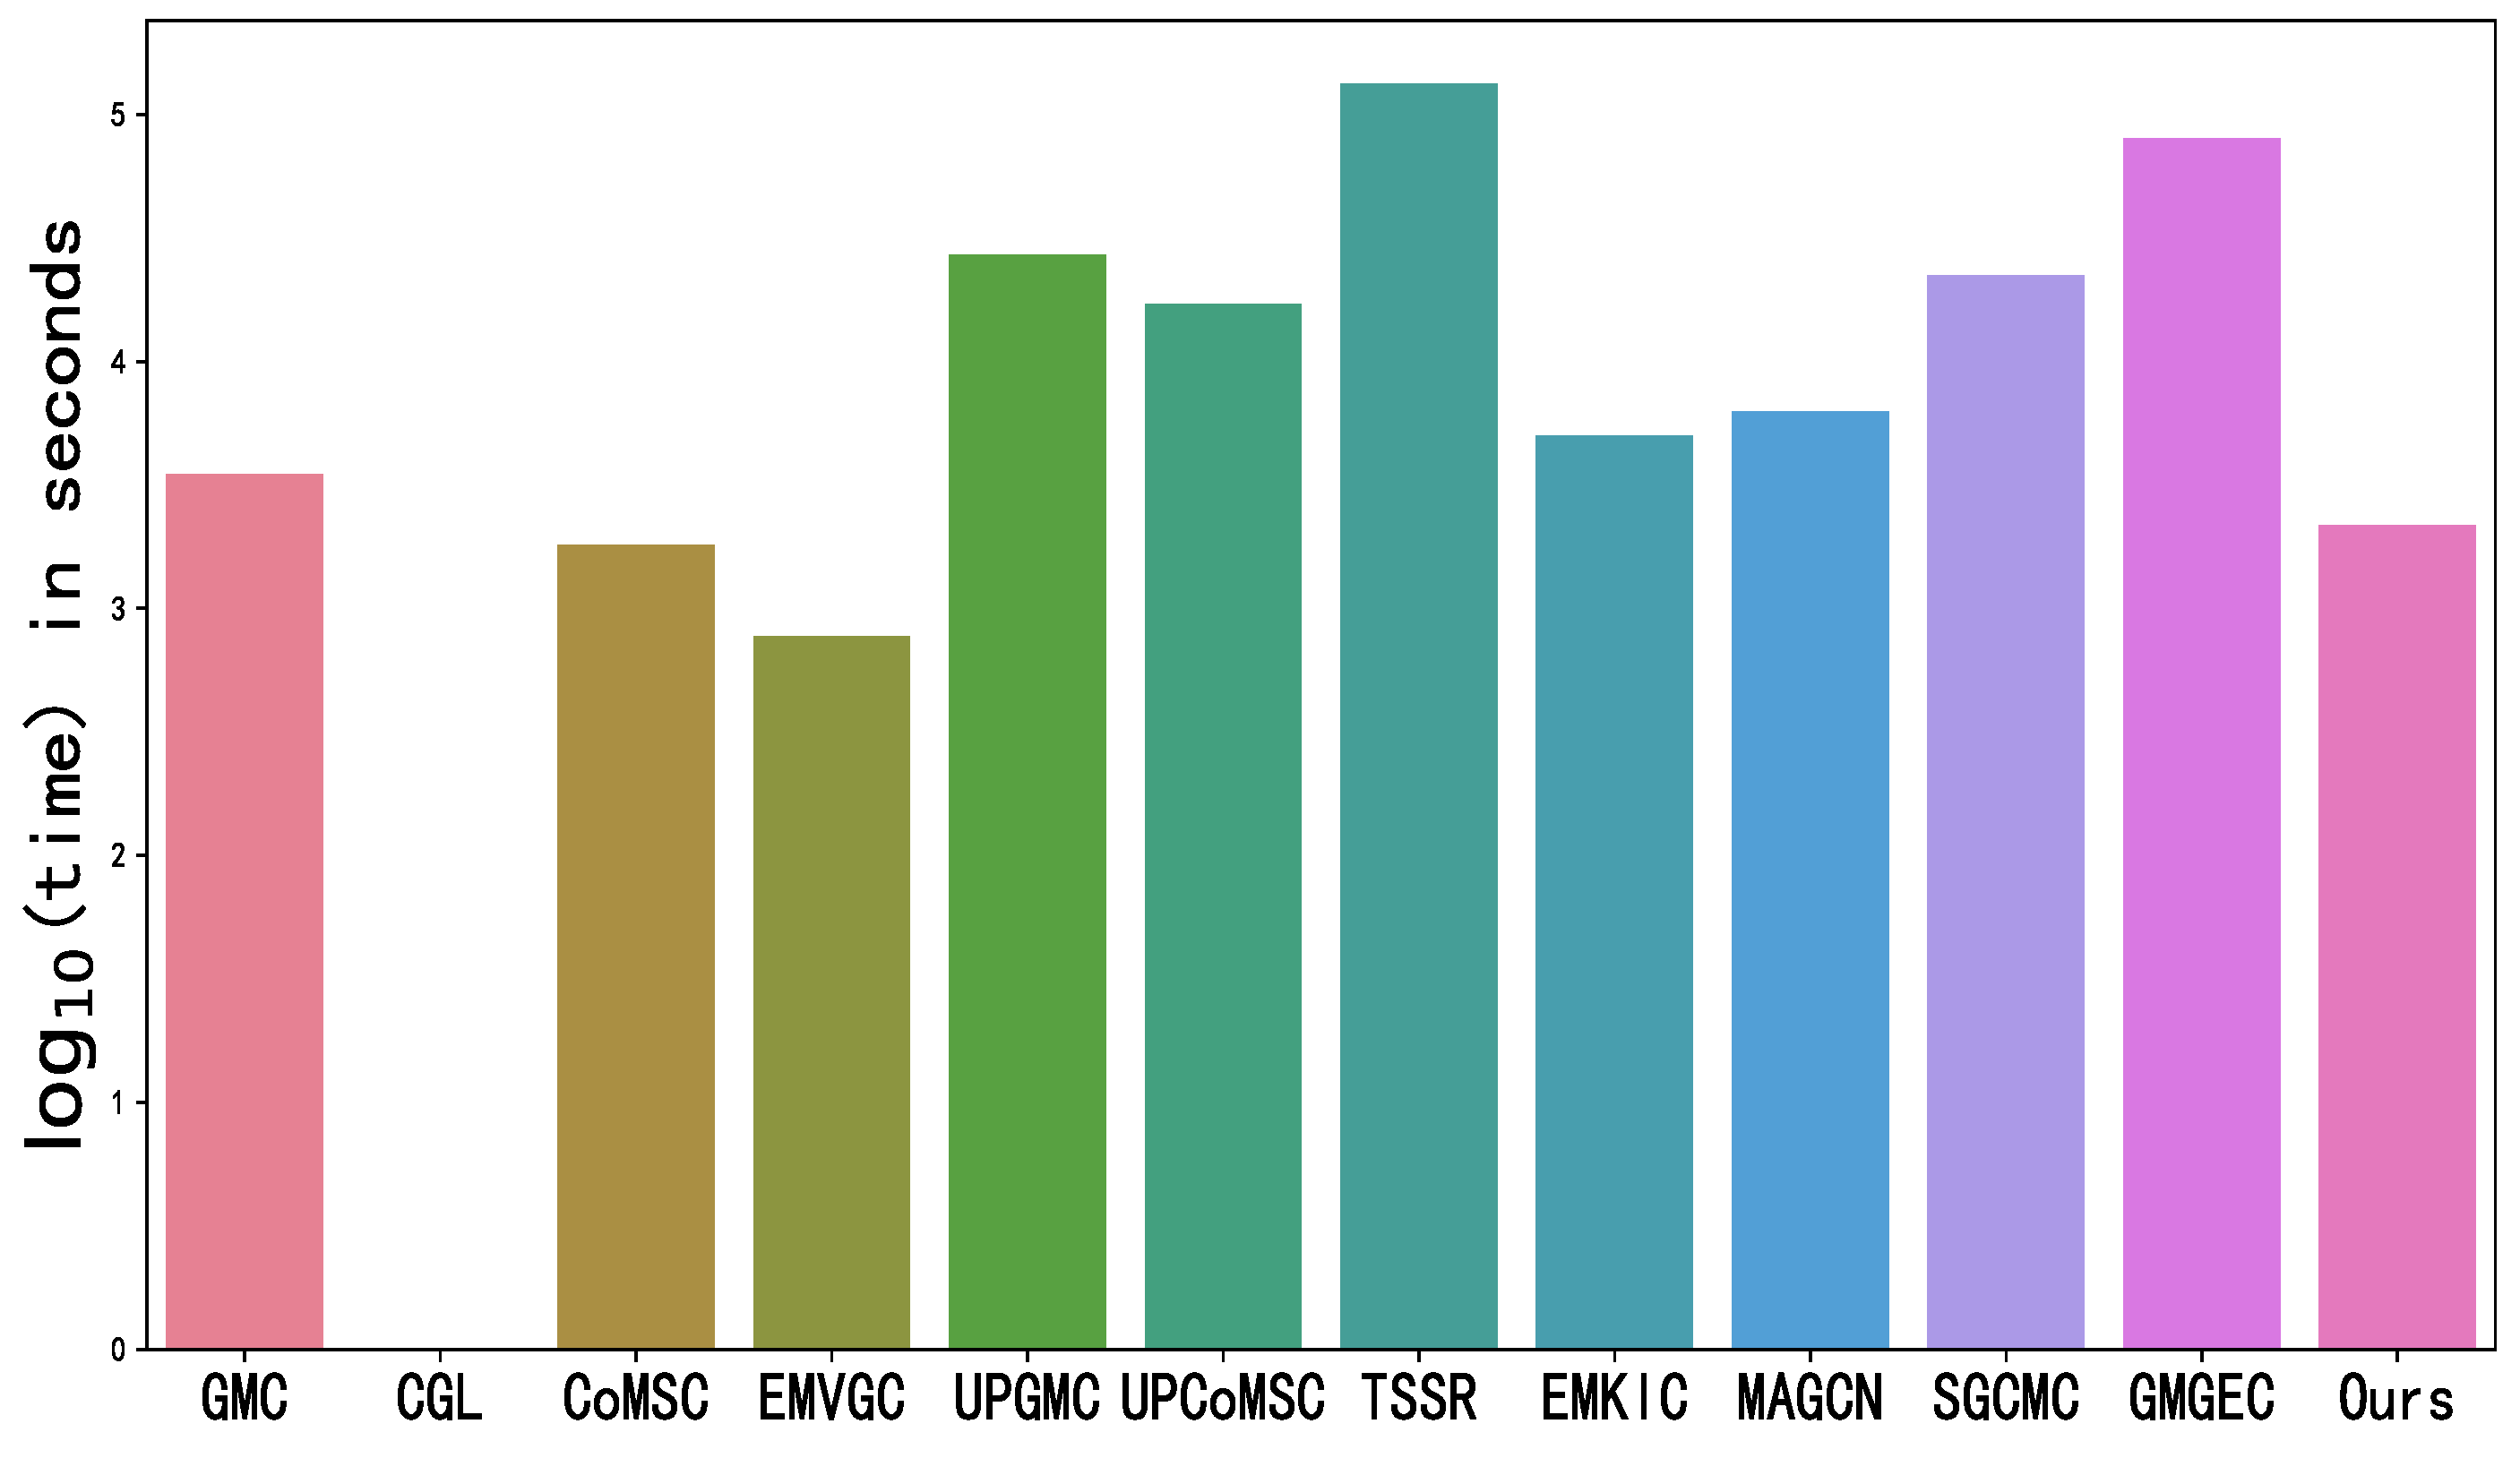
We present the runtime comparison on the largest Pubmed dataset in Figure 4 with the y-axis on a log 10 scale. Our method shows competitive efficiency on large datasets, outperforming most benchmarks. Although CoMSC and EMVGC exhibit faster runtimes, our approach consistently delivers superior performance with acceptable time. Additionally, the running time of CGL is missing because there was an error in calculating the eigs on the Pubmed data. The CGL algorithm failed to run properly and thus could not obtain the running time result.

4.6. Convergence Analysis

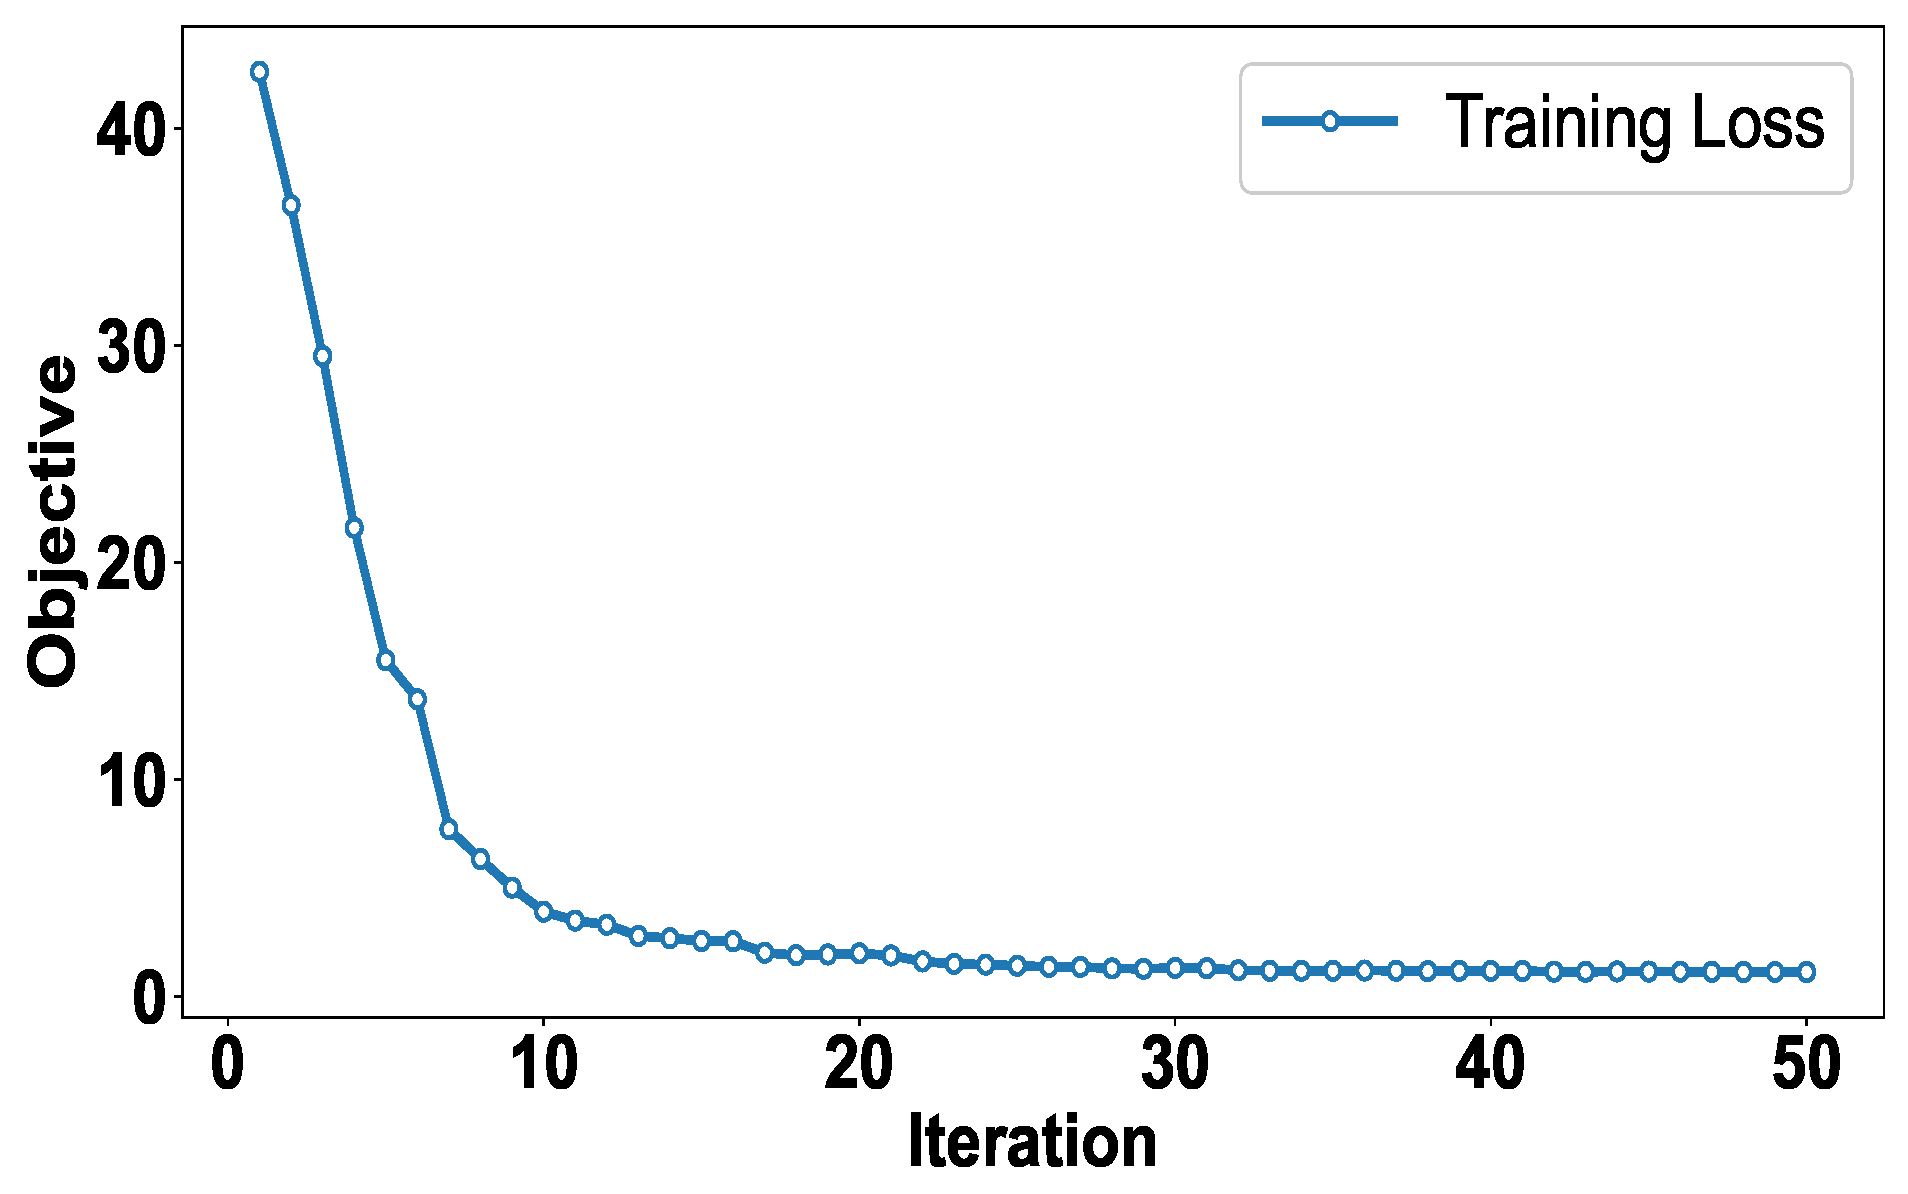
The convergence curve using ACM as an example in Figure 5 demonstrates a monotonically decreasing trend of the objective function value followed by stabilization, which confirms the convergence of the model.

4.7. Visualization Analysis

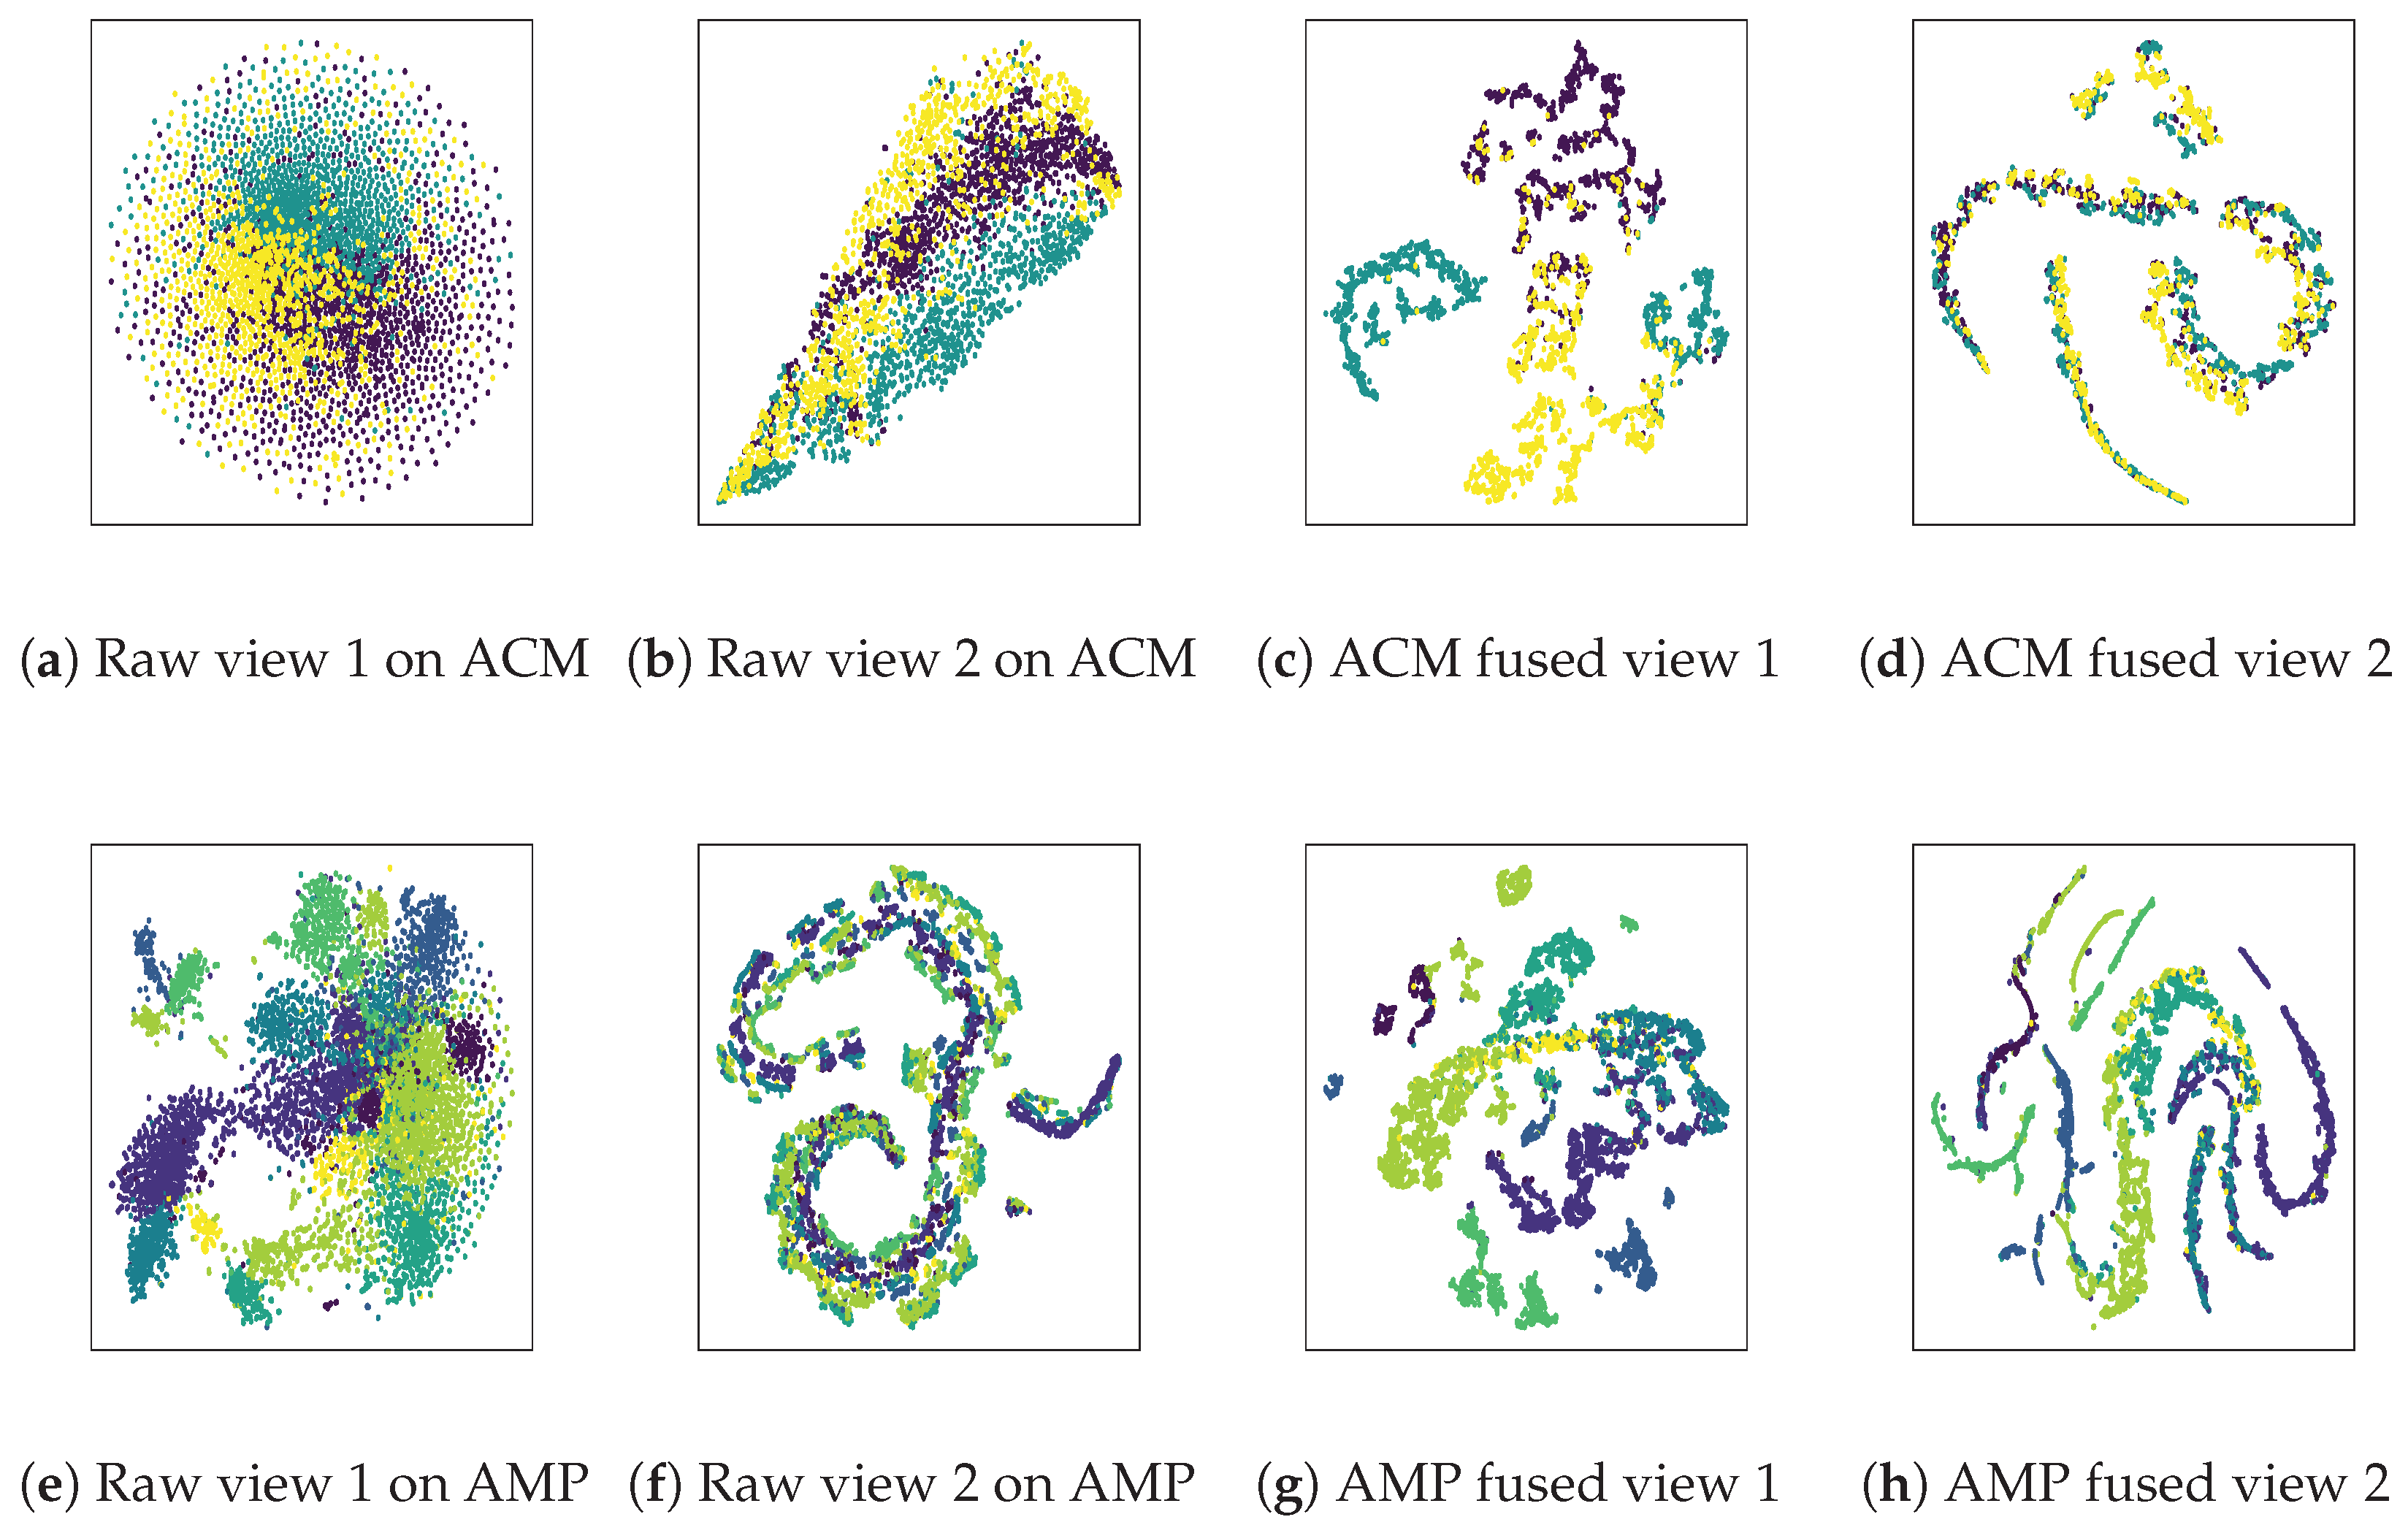
In order to show the superiority of our method, we utilize t-SNE to visualize the raw multi-view feature matrix and the fused view-specific representation on the ACM and AMP datasets. The visualization results are shown in Figure 6. By comparing the visualization results of the raw features with those of the fused representation, it is evident that the representation obtained through the view-specific fusion network achieves a more distinct separation of different clusters.
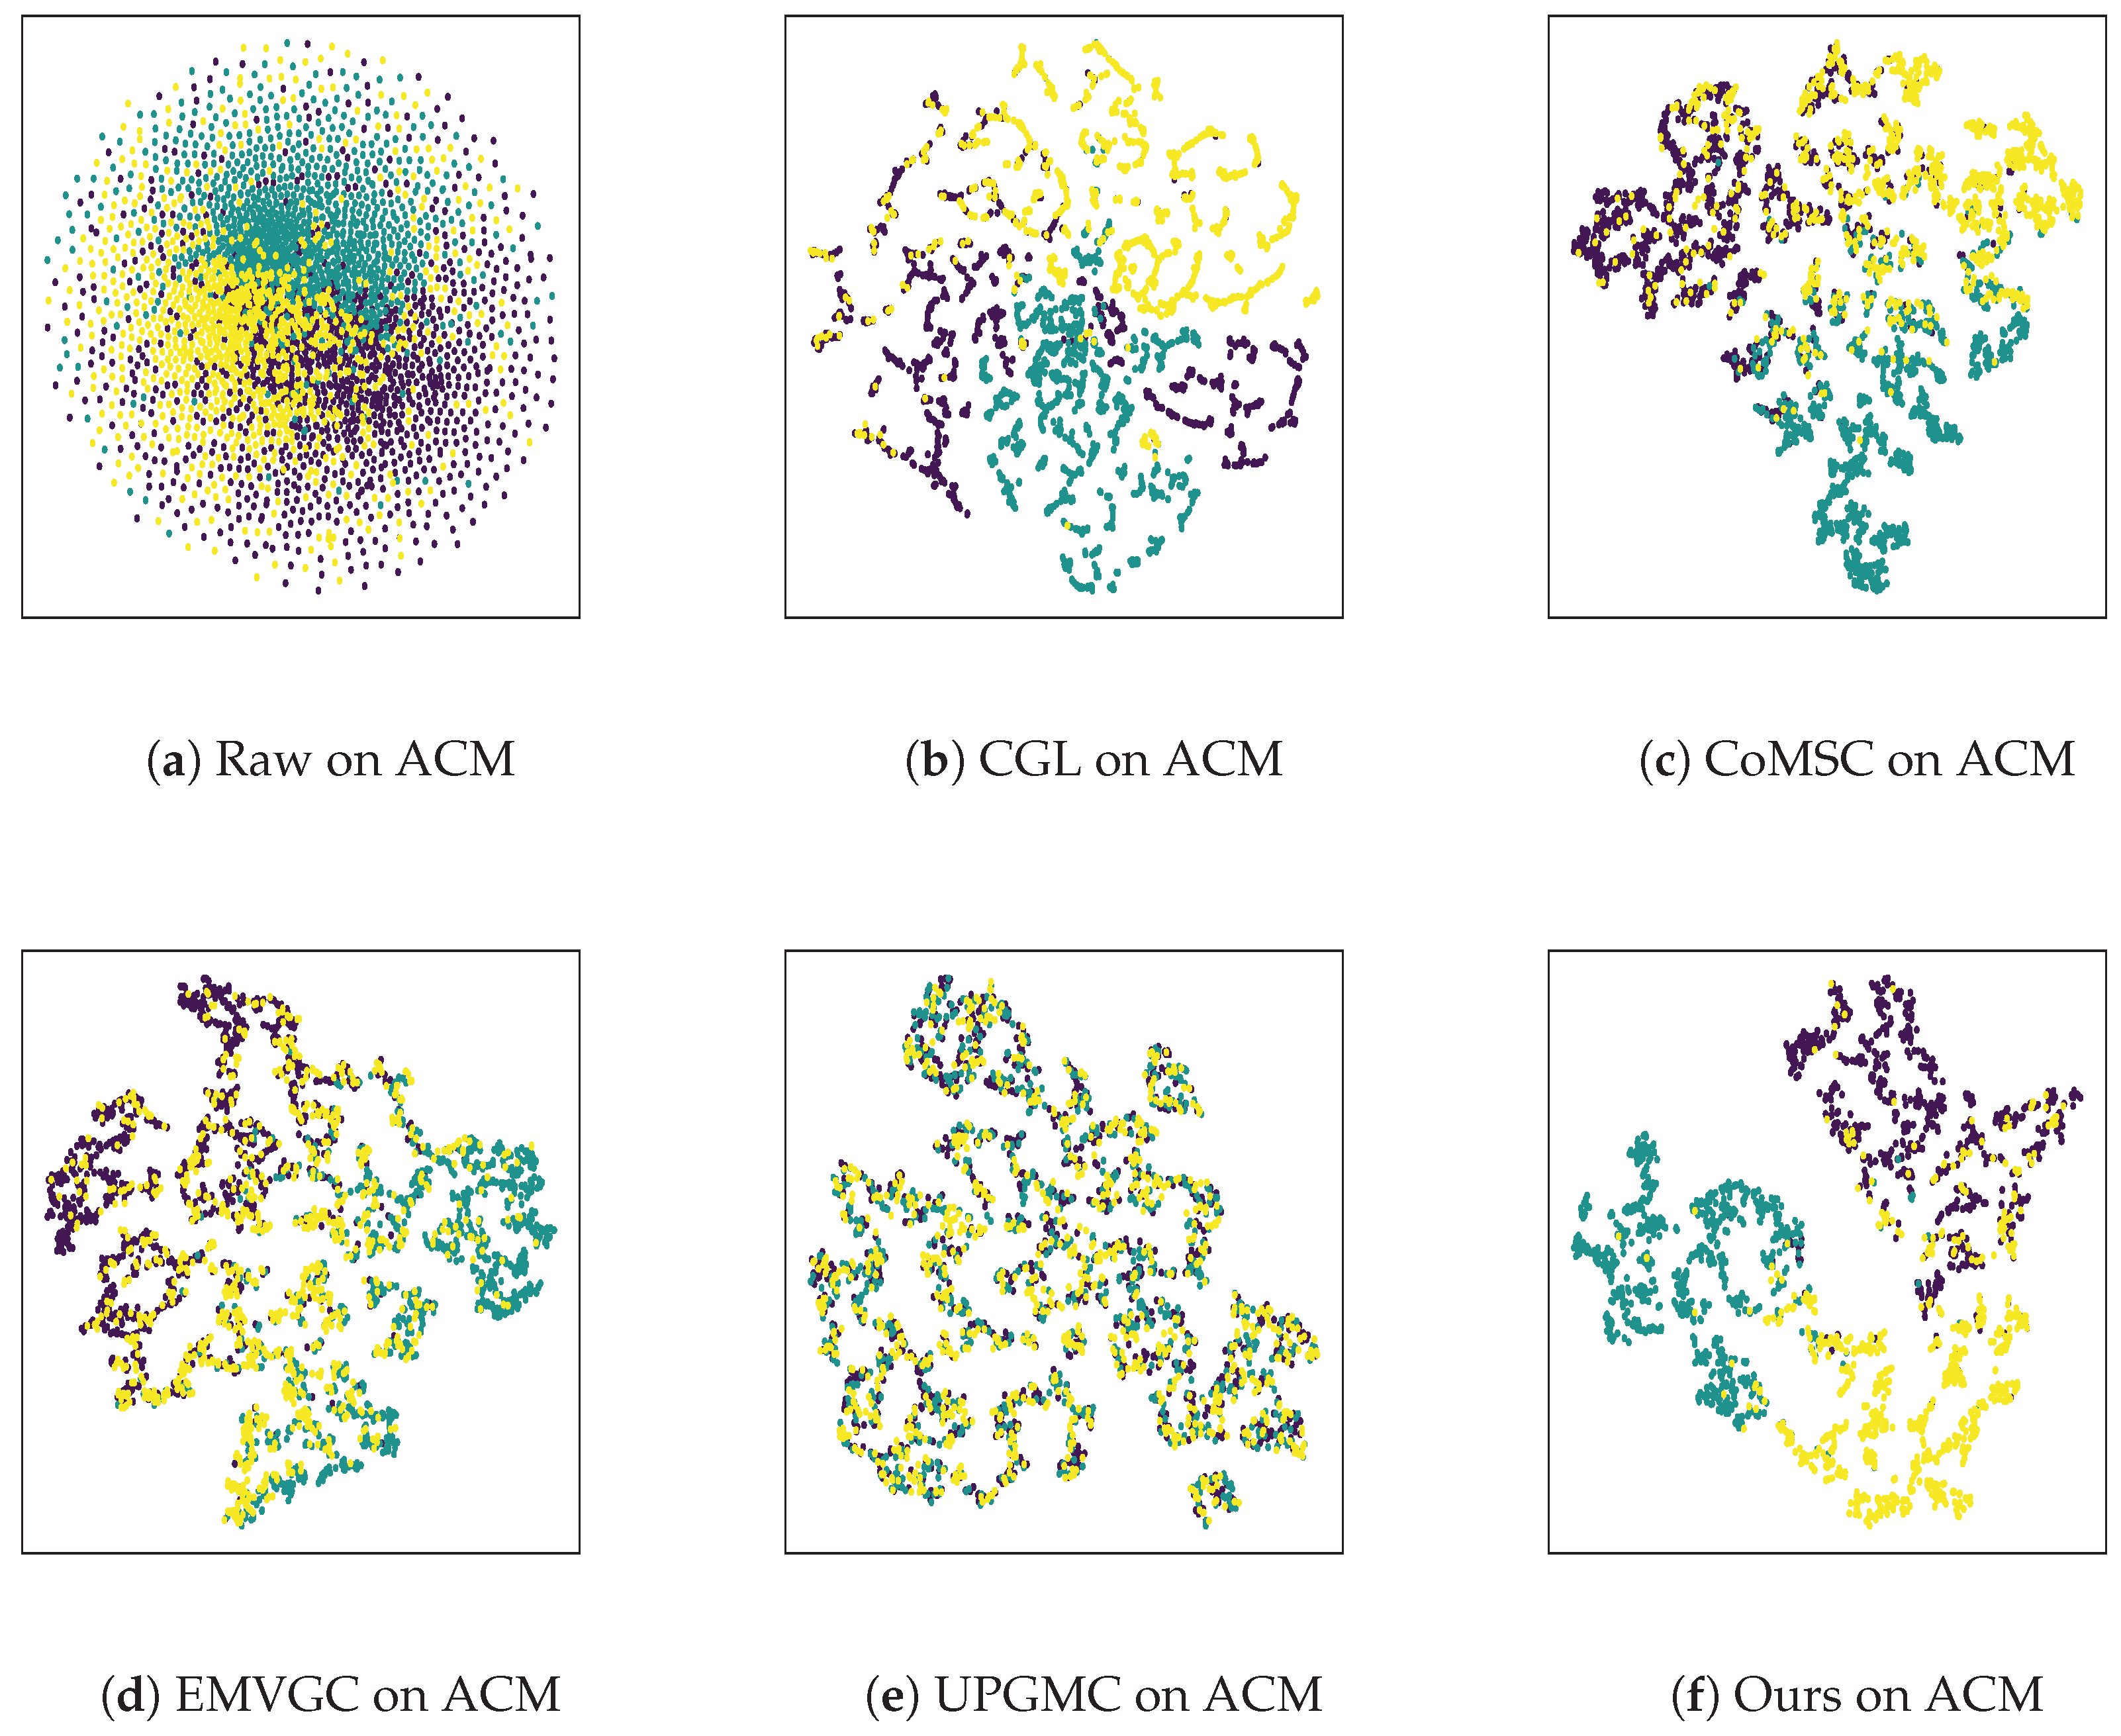
Furthermore, to demonstrate our model’s superior representation learning, we visualize the consensus representations learned by different competitive methods on ACM. We select four baseline methods (CGL, CoMSC, EMVGC, UPGMC) for a visual comparison in Figure 7. From the visualization results, it can be seen that compared with other methods, our method achieves clearer representation separation, denser clusters, and better clustering performance.

5. Conclusions

In this paper, we present a novel multi-view clustering algorithm called improved multi-view graph clustering with global self-attention (IMGCGGR) to address the multi-view graph-structured data clustering task. To fully capture and flexibly integrate the node attribute and structural information, we propose a view-specific fusion network. The view-specific fusion network not only utilizes the global self-attention mechanism to enhance the global properties of structural information but also employs a self-supervised strategy to guide the training of the clustering distribution assignment. Furthermore, taking into account the importance of different views, we exploit the cross-view fusion module to adaptively weight the fused view-specific representations, thereby generating a more effective final consensus representation. Although our model is surprisingly simple, extensive elaborate experimental results show its effectiveness. In particular, it surpasses or is comparable to the best methods recently proposed in standard benchmarks, demonstrating its effectiveness and competitive performance. The limitations and potential deficiencies of our algorithm lie in its inability to leverage performance advantages for multi-view data lacking structural information while also being inapplicable to datasets with incomplete attribute view. In future works, we will try to extend the proposed method to a more complex scenario, such as incomplete multi-view clustering and incomplete graph clustering tasks.

Author Contributions

Conceptualization, L.Z., S.Y. and Y.Q.; methodology, L.Z., S.Y. and Y.Q.; software, S.Y. and Y.H.; validation, S.Y., Y.H. and Y.C.; formal analysis, L.Z. and S.Y.; investigation, S.Y. and Y.Q.; resources, Y.H. and Y.C.; data curation, L.Z., S.Y. and Y.C.; writing—original draft preparation, L.Z. and S.Y.; writing—review and editing, L.Z., S.Y., Y.H., Y.C. and Y.Q.; visualization, Y.H. and Y.C. All authors have read and agreed to the published version of the manuscript.

Funding

This research received no external funding.

Data Availability Statement

Publicly available datasets were analyzed in this study. Cora data can be found at https://github.com/ki-ljl/PyG-GCN (accessed on 6 September 2023). The raw view feature of ACM, AMP, Citeseer, DBLP, and Pubmed data can be found at https://github.com/yueliu1999/Awesome-Deep-Graph-Clustering/tree/main/dataset (accessed on 8 September 2024). The construction of an additional view can be found at https://github.com/IMKBLE/MAGCN (accessed on 8 September 2024).

Conflicts of Interest

The authors declare no conflicts of interest.

References

  1. Zhou, W.; Shi, Y.; Huang, X. Multi-View Scene Classification Based on Feature Integration and Evidence Decision Fusion. Remote Sens. 2024, 16, 738. [Google Scholar] [CrossRef]
  2. Yang, S.; Peng, T.; Liu, H.; Yang, C.; Feng, Z.; Wang, M. Radar Emitter Identification with Multi-View Adaptive Fusion Network (MAFN). Remote Sens. 2023, 15, 1762. [Google Scholar] [CrossRef]
  3. Yang, X.; Liu, W.; Liu, W. Tensor Canonical Correlation Analysis Networks for Multi-View Remote Sensing Scene Recognition. IEEE Trans. Knowl. Data Eng. 2022, 34, 2948–2961. [Google Scholar] [CrossRef]
  4. Guan, R.; Li, Z.; Tu, W.; Wang, J.; Liu, Y.; Li, X.; Tang, C.; Feng, R. Contrastive Multiview Subspace Clustering of Hyperspectral Images Based on Graph Convolutional Networks. IEEE Trans. Geosci. Remote Sens. 2024, 62, 5510514. [Google Scholar] [CrossRef]
  5. Zhao, M.; Meng, Q.; Wang, L.; Zhang, L.; Hu, X.; Shi, W. Towards robust classification of multi-view remote sensing images with partial data availability. Remote Sens. Environ. 2024, 306, 114112. [Google Scholar] [CrossRef]
  6. Liu, Q.; Huan, W.; Deng, M. A Method with Adaptive Graphs to Constrain Multi-View Subspace Clustering of Geospatial Big Data from Multiple Sources. Remote Sens. 2022, 14, 4394. [Google Scholar] [CrossRef]
  7. Yang, Y.; Wang, H. Multi-view clustering: A survey. Big Data Min. Anal. 2018, 1, 83–107. [Google Scholar] [CrossRef]
  8. Su, P.; Liu, Y.; Li, S.; Huang, S.; Lv, J. Robust Contrastive Multi-view Kernel Clustering. In Proceedings of the Thirty-Third International Joint Conference on Artificial Intelligence, Jeju, Republic of Korea, 3–9 August 2024; pp. 4938–4945. [Google Scholar] [CrossRef]
  9. Liu, J.; Cheng, S.; Du, A. Multi-View Feature Fusion and Rich Information Refinement Network for Semantic Segmentation of Remote Sensing Images. Remote Sens. 2024, 16, 3184. [Google Scholar] [CrossRef]
  10. Fang, U.; Li, M.; Li, J.; Gao, L.; Jia, T.; Zhang, Y. A Comprehensive Survey on Multi-View Clustering. IEEE Trans. Knowl. Data Eng. 2023, 35, 12350–12368. [Google Scholar] [CrossRef]
  11. Liu, J.; Liu, X.; Yang, Y.; Liao, Q.; Xia, Y. Contrastive Multi-View Kernel Learning. IEEE Trans. Pattern Anal. Mach. Intell. 2023, 45, 9552–9566. [Google Scholar] [CrossRef]
  12. Liu, Y.; Zheng, Y.; Zhang, D.; Chen, H.; Peng, H.; Pan, S. Towards Unsupervised Deep Graph Structure Learning. In Proceedings of the ACM Web Conference, 2022, WWW ’22, Lyon, France, 25–29 April 2022; pp. 1392–1403. [Google Scholar] [CrossRef]
  13. Wu, L.; Cui, P.; Pei, J.; Zhao, L.; Guo, X. Graph Neural Networks: Foundation, Frontiers and Applications. In Proceedings of the 28th ACM SIGKDD Conference on Knowledge Discovery and Data Mining, 2022, KDD ’22, Washington, DC, USA, 14–18 August 2022; pp. 4840–4841. [Google Scholar] [CrossRef]
  14. Wu, S.; Sun, F.; Zhang, W.; Xie, X.; Cui, B. Graph Neural Networks in Recommender Systems: A Survey. ACM Comput. Surv. 2022, 55, 97. [Google Scholar] [CrossRef]
  15. Cui, H.; Lu, J.; Ge, Y.; Yang, C. How Can Graph Neural Networks Help Document Retrieval: A Case Study on CORD19 with Concept Map Generation. In Advances in Information Retrieval, Proceedings of the 44th European Conference on IR Research, ECIR 2022, Stavanger, Norway, 10–14 April 2022; Springer: Berlin/Heidelberg, Germany, 2022; pp. 75–83. [Google Scholar] [CrossRef]
  16. Zhang, X.M.; Liang, L.; Liu, L.; Tang, M.J. Graph neural networks and their current applications in bioinformatics. Front. Genet. 2021, 12, 690049. [Google Scholar] [CrossRef]
  17. Xia, W.; Wang, S.; Yang, M.; Gao, Q.; Han, J.; Gao, X. Multi-view graph embedding clustering network: Joint self-supervision and block diagonal representation. Neural Netw. 2022, 145, 1–9. [Google Scholar] [CrossRef]
  18. Ling, Y.; Chen, J.; Ren, Y.; Pu, X.; Xu, J.; Zhu, X.; He, L. Dual label-guided graph refinement for multi-view graph clustering. In Proceedings of the AAAI Conference on Artificial Intelligence, Washington, DC, USA, 7–14 February 2023; Volume 37, pp. 8791–8798. [Google Scholar] [CrossRef]
  19. Fan, S.; Wang, X.; Shi, C.; Lu, E.; Lin, K.; Wang, B. One2Multi Graph Autoencoder for Multi-view Graph Clustering. In Proceedings of the Web Conference, 2020, WWW ’20, Taipei, Taiwan, 20–24 April 2020; pp. 3070–3076. [Google Scholar] [CrossRef]
  20. Cheng, J.; Wang, Q.; Tao, Z.; Xie, D.; Gao, Q. Multi-view attribute graph convolution networks for clustering. In Proceedings of the Twenty-Ninth International Conference on International Joint Conferences on Artificial Intelligence, Yokohama, Japan, 7–15 January 2021; pp. 2973–2979. [Google Scholar] [CrossRef]
  21. Liu, S.; Liao, Q.; Wang, S.; Liu, X.; Zhu, E. Robust and Consistent Anchor Graph Learning for Multi-View Clustering. IEEE Trans. Knowl. Data Eng. 2024, 36, 4207–4219. [Google Scholar] [CrossRef]
  22. Ma, H.; Wang, S.; Yu, S.; Liu, S.; Huang, J.J.; Wu, H.; Liu, X.; Zhu, E. Automatic and Aligned Anchor Learning Strategy for Multi-View Clustering. In Proceedings of the 32nd ACM International Conference on Multimedia, 2024, MM ’24, Melbourne, Australia, 28 October–1 November 2024; pp. 5045–5054. [Google Scholar] [CrossRef]
  23. Wang, F.; Jin, J.; Dong, Z.; Yang, X.; Feng, Y.; Liu, X.; Zhu, X.; Wang, S.; Liu, T.; Zhu, E. View Gap Matters: Cross-view Topology and Information Decoupling for Multi-view Clustering. In Proceedings of the 32nd ACM International Conference on Multimedia, 2024, MM ’24, Melbourne, Australia, 28 October–1 November 2024; pp. 8431–8440. [Google Scholar] [CrossRef]
  24. Yang, X.; Jiaqi, J.; Wang, S.; Liang, K.; Liu, Y.; Wen, Y.; Liu, S.; Zhou, S.; Liu, X.; Zhu, E. DealMVC: Dual Contrastive Calibration for Multi-view Clustering. In Proceedings of the 31st ACM International Conference on Multimedia, 2023, MM ’23, Ottawa, ON, Canada, 29 October–3 November 2023; pp. 337–346. [Google Scholar] [CrossRef]
  25. Haris, M.; Yusoff, Y.; Mohd Zain, A.; Khattak, A.S.; Hussain, S.F. Breaking down multi-view clustering: A comprehensive review of multi-view approaches for complex data structures. Eng. Appl. Artif. Intell. 2024, 132, 107857. [Google Scholar] [CrossRef]
  26. Zhang, C.; Hu, Q.; Fu, H.; Zhu, P.; Cao, X. Latent Multi-view Subspace Clustering. In Proceedings of the IEEE Conference on Computer Vision and Pattern Recognition, Honolulu, HI, USA, 21–26 July 2017; pp. 4333–4341. [Google Scholar] [CrossRef]
  27. Luo, S.; Zhang, C.; Zhang, W.; Cao, X. Consistent and specific multi-view subspace clustering. In Proceedings of the AAAI Conference on Artificial Intelligence, New Orleans, LA, USA, 2–7 February 2018; Volume 32. [Google Scholar] [CrossRef]
  28. Wang, H.; Yang, Y.; Liu, B. GMC: Graph-Based Multi-View Clustering. IEEE Trans. Knowl. Data Eng. 2020, 32, 1116–1129. [Google Scholar] [CrossRef]
  29. Li, Z.; Tang, C.; Liu, X.; Zheng, X.; Zhang, W.; Zhu, E. Consensus Graph Learning for Multi-View Clustering. IEEE Trans. Multimed. 2022, 24, 2461–2472. [Google Scholar] [CrossRef]
  30. Liu, J.; Liu, X.; Yang, Y.; Guo, X.; Kloft, M.; He, L. Multiview Subspace Clustering via Co-Training Robust Data Representation. IEEE Trans. Neural Netw. Learn. Syst. 2022, 33, 5177–5189. [Google Scholar] [CrossRef]
  31. Wen, Y.; Liu, S.; Wan, X.; Wang, S.; Liang, K.; Liu, X.; Yang, X.; Zhang, P. Efficient Multi-View Graph Clustering with Local and Global Structure Preservation. In Proceedings of the 31st ACM International Conference on Multimedia, 2023, MM ’23, Ottawa, ON, Canada, 29 October–3 November 2023; pp. 3021–3030. [Google Scholar] [CrossRef]
  32. Wen, Y.; Wang, S.; Liao, Q.; Liang, W.; Liang, K.; Wan, X.; Liu, X. Unpaired Multi-View Graph Clustering with Cross-View Structure Matching. IEEE Trans. Neural Netw. Learn. Syst. 2024, 35, 16049–16063. [Google Scholar] [CrossRef]
  33. Cai, B.; Lu, G.F.; Li, H.; Song, W. Tensorized Scaled Simplex Representation for Multi-View Clustering. IEEE Trans. Multimed. 2024, 26, 6621–6631. [Google Scholar] [CrossRef]
  34. Lu, H.; Xu, H.; Wang, Q.; Gao, Q.; Yang, M.; Gao, X. Efficient Multi-View K-Means for Image Clustering. IEEE Trans. Image Process. 2024, 33, 273–284. [Google Scholar] [CrossRef]
  35. Cai, Y.; Zhang, Z.; Liu, X.; Ding, Y.; Li, F.; Tan, J. Learning Unified Anchor Graph for Joint Clustering of Hyperspectral and LiDAR Data. IEEE Trans. Neural Netw. Learn. Syst. 2025, 36, 6341–6354. [Google Scholar] [CrossRef]
  36. Zhao, Z.; Wang, T.; Xin, H.; Wang, R.; Nie, F. Multi-view clustering via high-order bipartite graph fusion. Inf. Fusion 2025, 113, 102630. [Google Scholar] [CrossRef]
  37. Qin, Y.; Qin, C.; Zhang, X.; Feng, G. Dual Consensus Anchor Learning for Fast Multi-View Clustering. IEEE Trans. Image Process. 2024, 33, 5298–5311. [Google Scholar] [CrossRef] [PubMed]
  38. Guo, W.; Che, H.; Leung, M.F. Tensor-Based Adaptive Consensus Graph Learning for Multi-View Clustering. IEEE Trans. Consum. Electron. 2024, 70, 4767–4784. [Google Scholar] [CrossRef]
  39. Xia, W.; Wang, Q.; Gao, Q.; Zhang, X.; Gao, X. Self-Supervised Graph Convolutional Network for Multi-View Clustering. IEEE Trans. Multimed. 2022, 24, 3182–3192. [Google Scholar] [CrossRef]
  40. Wang, Y.; Chang, D.; Fu, Z.; Zhao, Y. Consistent Multiple Graph Embedding for Multi-View Clustering. IEEE Trans. Multimed. 2023, 25, 1008–1018. [Google Scholar] [CrossRef]
  41. Xiao, S.; Du, S.; Chen, Z.; Zhang, Y.; Wang, S. Dual Fusion-Propagation Graph Neural Network for Multi-View Clustering. IEEE Trans. Multimed. 2023, 25, 9203–9215. [Google Scholar] [CrossRef]
  42. Guo, X.; Gao, L.; Liu, X.; Yin, J. Improved deep embedded clustering with local structure preservation. In Proceedings of the 26th International Joint Conference on Artificial Intelligence, 2017, IJCAI’17, Melbourne, Australia, 19–25 August 2017; pp. 1753–1759. [Google Scholar]
  43. Xie, J.; Girshick, R.; Farhadi, A. Unsupervised Deep Embedding for Clustering Analysis. In Proceedings of the 33rd International Conference on Machine Learning, New York, NY, USA, 20–22 June 2016; Volume 48, pp. 478–487. [Google Scholar]
  44. Liu, Y.; Zhou, S.; Wang, S.; Guo, X.; Yang, X.; Tu, W.; Liu, X. A survey of deep graph clustering: Taxonomy, challenge, and application. arXiv 2022, arXiv:2211.12875. [Google Scholar]
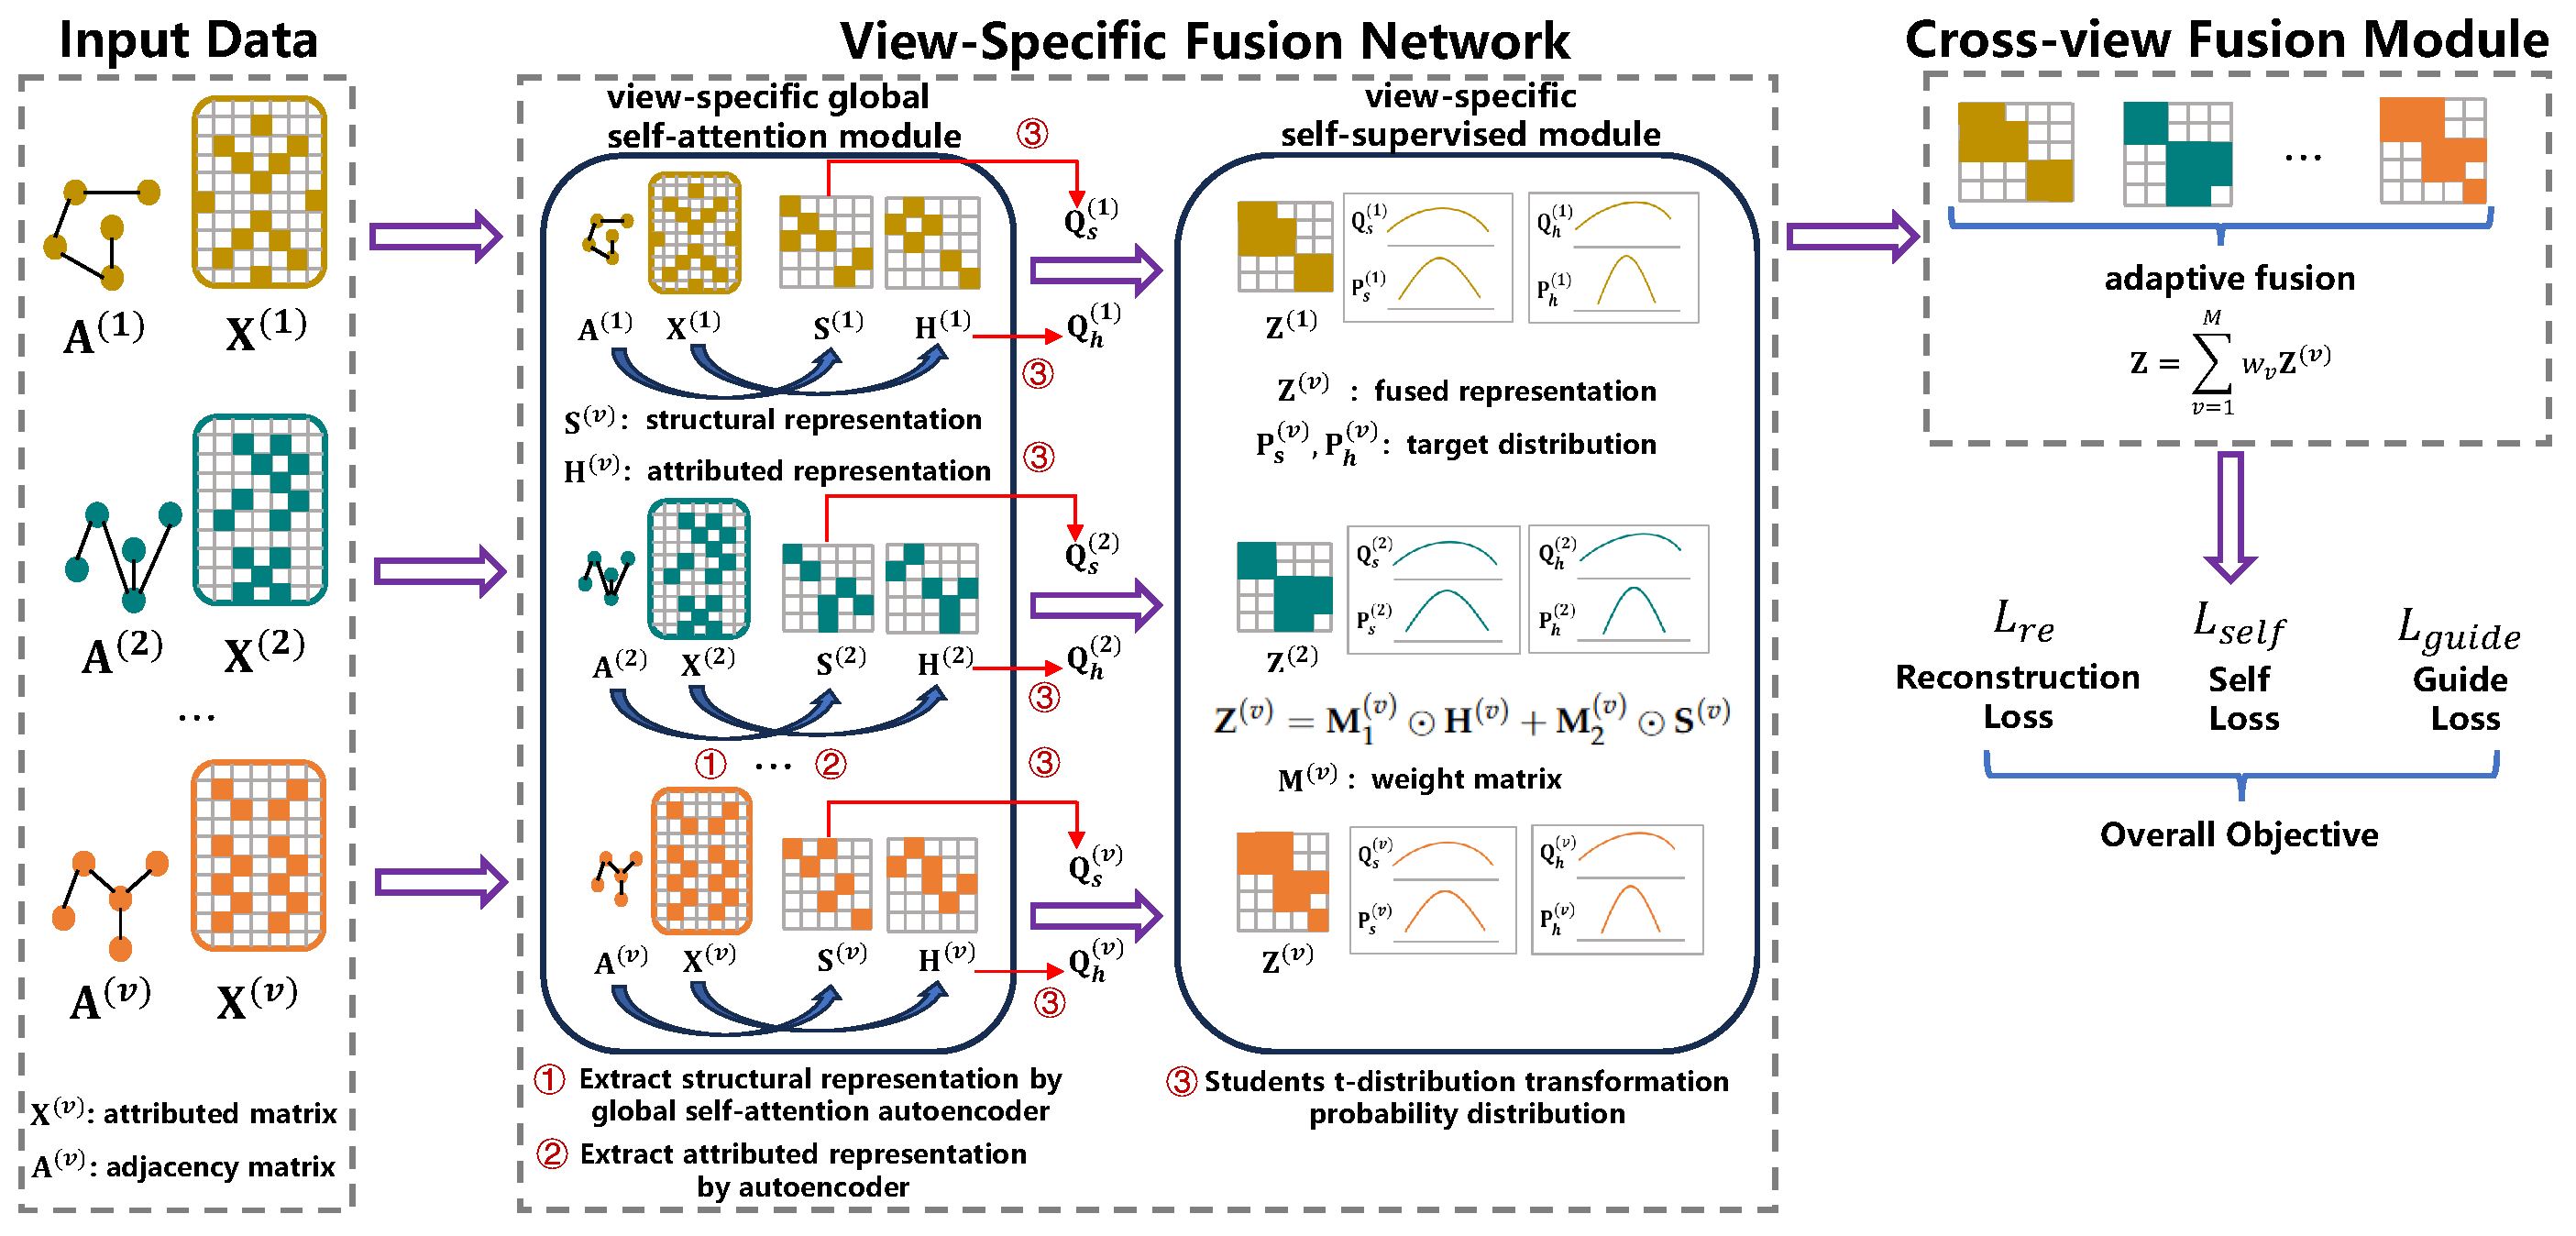
Figure 1. The framework of IMGCGGR. This model contains two fundamental modules: the view-specific fusion network (VSFN) and the cross-view fusion module. The VSFN designs a view-specific global self-attention module for refining structural information and a view-specific self-supervised module for guiding the clustering assignment distribution. The cross-view fusion module is utilized to combine fused view-specific representations to produce the final consensus representation.
Remotesensing 17 03217 g001
Figure 2. The flowchart of a view-specific fusion network. This module contains two submodules: the view-specific global self-attention module and the view-specific self-supervised module. The view-specific global self-attention module is devised to extract the node attributes and structural representations from the attributed matrix and adjacency matrix. The view-specific self-supervised module is utilized to guide the training of the clustering assignment distribution.
Remotesensing 17 03217 g002
Figure 3. The parameters sensitivity results on ACM.
Remotesensing 17 03217 g003aRemotesensing 17 03217 g003b
Figure 4. Runtime on Pubmed dataset.
Remotesensing 17 03217 g004
Figure 5. Convergence curve on ACM dataset.
Remotesensing 17 03217 g005
Figure 6. The representation visualization of IMGCGGR on ACM and AMP.
Remotesensing 17 03217 g006
Figure 7. The comparison visualization on ACM.
Remotesensing 17 03217 g007
Table 1. The main notations and descriptions.
NotationDescription
X ( v ) R d v × N attribute matrix
A ( v ) R N × N undirected original adjacency matrix
A ˜ ( v ) R N × N renormalized adjacency matrix
X ^ ( v ) R d v × N reconstructed attribute matrix
A ^ ( v ) R N × N reconstructed adjacency matrix
H ( v ) R d ( v , l ) × N view-specific attributed feature
S ( v ) R d ( v , l ) × N view-specific structural feature
Z ( v ) R d ( v , l ) × N fused view-specific representation
Q h ( v ) R K × N soft assignment distribution of H ( v )
Q s ( v ) R K × N soft assignment distribution of S ( v )
Z R K × N final consensus representation
Table 2. Statistics of the datasets.
DatasetsNodesDimensionsClassesEdges
ACM302518703025313,128
AMP748774574878119,043
Citeseer33273703332764614
Cora27081433270875278
DBLP4057334405743528
Pubmed19,71750019,717344,326
Table 3. The clustering performance comparison with traditional multi-view clustering baseline methods on six benchmark datasets (mean% ± std%). The best results are highlighted in bold.
DatasetsMetricGMC
TKDE20
CGL
TMM22
CoMSC
TNNLS22
EMVGC
MM23
UPGMC
TNNLS24
UPCoMSC
TNNLS24
TSSR
TMM24
EMKIC
TIP24
IMGCGGR
Ours
ACMACC35.17 ± 1.1283.42 ± 2.9178.81 ± 2.4446.35 ± 8.9472.03 ± 0.3150.82 ± 20.9340.05 ± 6.6351.78 ± 15.0291.37 ± 0.05
NMI0.33 ± 0.0252.32 ± 6.2444.32 ± 3.427.78 ± 8.7936.62 ± 0.1116.01 ± 22.114.44 ± 6.9721.97 ± 21.0370.12 ± 0.04
ARI0.04 ± 0.0157.65 ± 6.4948.40 ± 4.377.84 ± 8.9938.17 ± 0.0817.72 ± 24.793.97 ± 5.9619.33 ± 19.4076.14 ± 0.09
F117.53 ± 0.6883.42 ± 2.9378.79 ± 2.5145.51 ± 9.0571.96 ± 0.2350.70 ± 21.0232.79 ± 13.7048.69 ± 17.7591.38 ± 0.05
AMPACC27.22 ± 2.10 57.60 ± 7.3027.31 ± 11.8661.09 ± 1.5250.62 ± 16.8416.66 ± 4.1224.74 ± 4.5677.04 ± 0.64
NMI4.06 ± 0.03eigs46.20 ± 7.1911.06 ± 14.6249.42 ± 0.5237.01 ± 18.290.27 ± 0.285.01 ± 6.8066.05 ± 1.24
ARI−0.40 ± 0.01error33.59 ± 8.697.65 ± 10.6039.12 ± 1.0228.92 ± 14.84-0.06 ± 0.132.08 ± 2.7557.12 ± 0.35
F17.81 ± 0.34 55.51 ± 7.0823.86 ± 12.8860.49 ± 1.6347.95 ± 16.9312.06 ± 2.0715.61 ± 8.8769.05 ± 3.55
CiteseerACC 29.71 ± 5.0242.39 ± 7.2538.67 ± 10.8447.06 ± 0.4743.67 ± 3.3521.20 ± 0.6226.61 ± 7.5266.71 ± 1.81
NMIevaluation7.52 ± 4.3320.39 ± 6.4015.83 ± 8.8721.68 ± 0.1420.10 ± 3.740.99 ± 0.545.39 ± 6.4139.45 ± 1.34
ARIerror5.69 ± 3.3717.27 ± 5.9113.36 ± 8.9920.53 ± 0.0917.48 ± 3.510.11 ± 0.104.29 ± 5.3140.40 ± 2.07
F1 24.44 ± 5.2238.47 ± 10.3434.29 ± 15.3244.33 ± 0.5641.07 ± 2.7810.86 ± 3.2620.00 ± 12.2259.22 ± 0.19
CoraACC36.52 ± 2.0341.73 ± 3.3342.81 ± 7.3729.49 ± 4.2841.11 ± 0.2338.27 ± 6.8624.55 ± 5.3030.24 ± 0.0168.54 ± 0.17
NMI13.49 ± 0.8924.31 ± 2.1919.89 ± 8.4111.76 ± 4.3718.89 ± 0.2717.33 ± 5.560.73 ± 0.320.40 ± 0.0150.46 ± 0.60
ARI2.88 ± 0.0117.84 ± 3.0715.34 ± 6.886.16 ± 3.0714.70 ± 0.5513.66 ± 5.20−0.08 ± 0.38−0.02 ± 0.0144.84 ± 0.25
F120.67 ± 1.0437.80 ± 4.6436.72 ± 11.5226.68 ± 4.5637.64 ± 1.0735.09 ± 6.0711.99 ± 3.766.84 ± 0.0160.49 ± 0.22
DBLPACC 31.73 ± 2.4248.49 ± 12.4037.86 ± 4.1258.49 ± 0.3840.79 ± 10.9026.80 ± 1.1728.06 ± 0.0174.00 ± 1.18
NMIeigs2.31 ± 1.4217.51 ± 11.168.43 ± 4.0925.05 ± 0.3311.83 ± 10.200.19 ± 0.260.18 ± 0.0140.43 ± 1.53
ARIerror1.94 ± 1.2915.81 ± 10.535.95 ± 2.9022.12 ± 0.2810.08 ± 8.870.09 ± 0.210.23 ± 0.1643.44 ± 1.96
F1 30.50 ± 2.5443.23 ± 20.2436.76 ± 4.7358.18 ± 0.3639.74 ± 11.8626.46 ± 1.2823.86 ± 2.9773.82 ± 1.19
PubmedACC39.99 ± 0.55 58.16 ± 4.3048.78 ± 3.9559.55 ± 0.0449.81 ± 9.7938.96 ± 6.1240.26 ± 4.0563.97 ± 2.41
NMI3.37 ± 0.69eigs21.24 ± 4.8611.04 ± 3.8322.61 ± 0.0410.35 ± 8.712.11 ± 2.851.49 ± 2.7524.09 ± 2.37
ARI−1.67 ± 0.34error19.62 ± 3.838.84 ± 3.2721.05 ± 0.059.96 ± 8.512.35 ± 3.291.29 ± 2.5323.94 ± 2.49
F124.87 ± 0.27 57.79 ± 4.6449.34 ± 4.7560.19 ± 0.0546.79 ± 11.8337.07 ± 4.7831.73 ± 10.2763.78 ± 2.92
Table 4. The clustering performance comparison with deep multi-view graph clustering baseline methods on six benchmark datasets (mean% ± std%). The best results are highlighted in bold.
DatasetsMetricMAGCN
IJCAI21
SGCMC
TMM22
GMGEC
TMM23
IMGCGGR
Ours
ACMACC73.02 ± 16.2369.50 ± 11.0540.24 ± 4.9091.37 ± 0.05
NMI49.54 ± 21.1237.11 ± 9.764.10 ± 4.8670.12 ± 0.04
ARI49.24 ± 26.3234.20 ± 14.332.53 ± 2.8476.14 ± 0.09
F168.83 ± 19.6668.77 ± 13.0733.56 ± 10.3991.38 ± 0.05
AMPACC31.50 ± 12.0871.20 ± 4.4529.36 ± 3.0077.04 ± 0.64
NMI12.09 ± 21.9361.43 ± 1.9518.35 ± 6.4666.05 ± 1.24
ARI7.08 ± 14.5554.32 ± 3.3510.17 ± 3.8957.12 ± 0.35
F114.67 ± 17.7161.51 ± 5.9921.58 ± 5.7969.05 ± 3.55
CiteseerACC58.01 ± 5.9243.99 ± 5.5231.80 ± 3.2066.71 ± 1.81
NMI36.59 ± 3.3228.83 ± 2.6710.26 ± 2.1639.45 ± 1.34
ARI35.54 ± 4.8814.20 ± 4.706.35 ± 1.5340.40 ± 2.07
F148.49 ± 7.2839.21 ± 5.9127.25 ± 3.1059.22 ± 0.19
CoraACC64.20 ± 3.2866.67 ± 3.0243.67 ± 5.4168.54 ± 0.17
NMI48.65 ± 2.9949.50 ± 1.6328.30 ± 4.9450.46 ± 0.60
ARI43.27 ± 3.1141.63 ± 4.7620.21 ± 5.1044.84 ± 0.25
F151.93 ± 5.3154.80 ± 4.9933.35 ± 6.9160.49 ± 0.22
DBLPACC40.76 ± 2.6661.23 ± 5.6039.83 ± 4.5874.00 ± 1.18
NMI10.06 ± 3.6232.87 ± 3.118.28 ± 3.3240.43 ± 1.53
ARI4.83 ± 0.9626.02 ± 5.236.89 ± 2.4643.44 ± 1.96
F129.53 ± 5.3957.92 ± 7.7332.49 ± 6.8373.82 ± 1.19
PubmedACC56.59 ± 4.2652.78 ± 9.1038.24 ± 1.4363.97 ± 2.41
NMI20.90 ± 4.9717.25 ± 8.882.10 ± 1.1324.09 ± 2.37
ARI21.19 ± 4.1213.43 ± 11.081.06 ± 0.9823.94 ± 2.49
F143.30 ± 8.8246.64 ± 14.0233.84 ± 3.7463.78 ± 2.92
Table 5. The ablation studies results (mean% ± std%). The best results are highlighted in bold.
DatasetMetricsnoGSAnoSelfnoGuidenoCrossViewIMGCGGR
ACMACC89.52 ± 0.4141.12 ± 8.8081.73 ± 0.7588.60 ± 0.3391.37 ± 0.05
NMI68.30 ± 0.736.29 ± 8.8452.47 ± 0.5262.78 ± 0.9070.12 ± 0.04
ARI71.96 ± 0.965.03 ± 9.0255.46 ± 1.5369.04 ± 0.8376.14 ± 0.09
F189.35 ± 0.4226.62 ± 11.9181.74 ± 0.7088.65 ± 0.3391.38 ± 0.05
AMPACC66.58 ± 5.6426.13 ± 0.0368.23 ± 9.1462.36 ± 1.8077.04 ± 0.64
NMI54.23 ± 4.390.67 ± 0.0158.98 ± 8.7948.70 ± 1.4366.05 ± 1.24
ARI45.84 ± 5.26−0.11 ± 0.0249.73 ± 10.8239.81 ± 1.0457.12 ± 0.35
F156.09 ± 9.146.13 ± 0.0157.08 ± 10.6949.28 ± 5.2569.05 ± 3.55
CiteseerACC62.45 ± 3.7641.44 ± 5.3553.60 ± 2.2360.77 ± 5.6166.71 ± 1.81
NMI37.94 ± 2.5120.95 ± 3.0525.36 ± 2.1636.13 ± 4.5839.45 ± 1.34
ARI36.70 ± 3.5816.97 ± 3.1524.88 ± 2.2834.46 ± 6.4140.40 ± 2.07
F158.23 ± 3.2928.25 ± 7.6150.13 ± 1.4856.67 ± 6.2559.22 ± 0.19
CoraACC64.02 ± 2.3840.37 ± 3.0961.99 ± 3.0858.81 ± 8.8368.54 ± 0.17
NMI46.05 ± 3.3720.81 ± 2.7244.12 ± 3.2739.29 ± 8.7050.46 ± 0.60
ARI38.56 ± 3.5215.27 ± 2.9740.77 ± 4.1834.58 ± 7.3344.84 ± 0.25
F153.26 ± 5.9225.69 ± 4.7553.39 ± 4.3648.63 ± 10.8260.49 ± 0.22
DBLPACC70.82 ± 2.2240.39 ± 2.1652.72 ± 2.1069.93 ± 2.9474.00 ± 1.18
NMI36.77 ± 2.9210.14 ± 2.6020.21 ± 1.5636.16 ± 3.6940.43 ± 1.53
ARI38.27 ± 3.809.11 ± 2.8318.61 ± 1.5537.57 ± 3.7243.44 ± 1.96
F170.81 ± 2.1732.34 ± 2.9350.02 ± 2.0069.51 ± 3.3273.82 ± 1.19
PubmedACC57.58 ± 4.6439.95 ± 0.0158.96 ± 3.2260.09 ± 3.9063.97 ± 2.41
NMI21.64 ± 2.040.02 ± 0.0118.12 ± 2.8721.64 ± 2.0324.09 ± 2.37
ARI21.35 ± 1.370.01 ± 0.0115.80 ± 2.7921.35 ± 1.3723.94 ± 2.49
F156.83 ± 8.2019.04 ± 0.0159.04 ± 3.4056.83 ± 8.2063.78 ± 2.92
Table 6. The hyper-parameters setting for all datasets.
Dataset λ 1 λ 2
ACM11
AMP11
Citeseer11
Cora110
DBLP11
Pubmed11
Disclaimer/Publisher’s Note: The statements, opinions and data contained in all publications are solely those of the individual author(s) and contributor(s) and not of MDPI and/or the editor(s). MDPI and/or the editor(s) disclaim responsibility for any injury to people or property resulting from any ideas, methods, instructions or products referred to in the content.