Article

A Multi-Feature Fusion Performance Evaluation Method for SAR Deception Jamming

1
National Key Laboratory of Microwave Imaging, Aerospace Information Research Institute, Chinese Academy of Sciences, Beijing 100094, China
2
School of Electronic, Electrical and Communication Engineering, University of Chinese Academy of Sciences, Beijing 100049, China
*
Author to whom correspondence should be addressed.
Remote Sens. 2025, 17(18), 3195; https://doi.org/10.3390/rs17183195
Submission received: 25 July 2025 / Revised: 11 September 2025 / Accepted: 14 September 2025 / Published: 16 September 2025

Abstract

Highlights

What are the main findings?
  • An evaluation framework considering brightness variation, edge information, and texture structure was implemented and validated across multiple large-scale deception scenarios.
  • Combining three metrics, the framework achieves strong evaluation capability with higher robustness than conventional single-metric methods.
What is the main implication of the main finding?
  • The study addresses inconsistencies between evaluation results and expert subjective judgment caused by minor distortions.
  • The study provides a practical and explainable tool for consistent evaluation of SAR deception jamming imagery.

Abstract

Due to inaccurate reconnaissance parameters of the jammer and the decline in equipment performance over long-term usage, the false targets generated by the jammer usually have problems such as defocusing, abnormal brightness, and distortion, which fail to reach the ideal state. Therefore, experts or specialized assessment methods are needed to evaluate the interference effect. However, the human eye is not sensitive to minor changes. In such cases, the results obtained by some evaluation methods may be inconsistent with expert judgments. Therefore, this paper proposes an evaluation method that integrates three features of image edge information, brightness variation, and texture structure. This method mainly achieves two purposes: (1) Maintain a high evaluation effect when the image error does not change significantly, and be consistent with the expert’s judgment. (2) When the image error changes significantly, it can conduct effective effect evaluation like other methods, and has stronger universality and robustness. Furthermore, its robustness is reflected in the ability to reliably evaluate even in the presence of severe image distortion, without relying on geometric correction. Simulation experiments are conducted under three error conditions, and result comparisons verify the advantages and robustness of the proposed method. Finally, the effectiveness of proposed method is verified using real jamming data.

1. Introduction

Synthetic aperture radar has become an indispensable reconnaissance tool in remote sensing due to its all-time, all-weather, and long-range imaging capabilities. Conversely, in order to protect sensitive areas from exposure, electronic countermeasure technology against SAR has emerged, which is collectively known as synthetic aperture radar jamming technology [1,2,3].
SAR jamming technology can be classified into suppression jamming and deception jamming in terms of jamming effect. Judging from the current development trend of electronic countermeasures, deception jamming, with its low power consumption, precise control, and strong misleading ability, has obvious advantages in countering modern high-resolution SAR imaging and recognition systems [4]. Compared with suppressing interference, it is more suitable for countering intelligent radar systems and enhancing combat concealment in modern warfare, and is becoming a key development direction of SAR interference technology [5,6]. However, parameter errors throughout the entire process will lead to an unsatisfactory jamming effect. It is challenging to ascertain the precise parameters of adversarial SAR systems directly [7]. Consequently, a standardized evaluation metric for assessing jamming performance is essential. Utilizing this evaluation methodology, we can systematically assess the jamming effects and provide feedback on the results along with accurate SAR parameters to the jammer for optimizing its next reconnaissance. This process ultimately establishes a closed-loop optimization system [8].
The traditional performance evaluation methods evaluate the jamming effect by comparing some characteristic changes of SAR images before and after jamming [9]. Among them, information entropy and equivalent number of looks (ENL) evaluate the jamming quality by comparing the overall image statistics changes of SAR images before and after jamming, while structural similarity(SSIM) is based on both statistics and pixels of images [10,11,12]. The peak sidelobe ratio (PSLR) and integral sidelobe ratio (ISLR) based on energy are used to evaluate the rationality of imaging by comparing the power of interference signal and the echo power of environmental reflection [13]. However, the aforementioned methods exhibit limitations when evaluating SAR images with false targets. Specifically, evaluation methods based on statistics frequently lose their capacity as they are unable to assess the structural characteristics of the image. Pixel-based evaluation methods may yield results inconsistent with human visual perception, primarily due to issues such as image distortion and inaccurate registration. The PSLR and ISLR can only evaluate point targets, exhibiting significant limitations in assessing distributed targets or complex scenes.
Therefore, many scholars have improved some traditional methods and proposed new performance evaluation methods. Han et al. [14] corrected the SSIM based on the feature that the gradient mode matches the multi-channel characteristics of the human visual system. Jiao et al. [15] introduced the gray-level co-occurrence matrix (GLCM) into the SSIM, enabling the calculation to assess the jamming effect more accurately in different regions such as complex texture. Bu et al. [16] integrated the Analytic Hierarchy Process (AHP) with the entropy weight method, conducting a quantitative analysis of jamming effectiveness through comprehensive evaluation metrics. Shi et al. [17] investigated the cross entropy and presented the concept of symmetry cross entropy (SCE) to compensate for its shortage. Zhu et al. [18] defined and fused the moment feature and shape feature of SAR images, and obtained the similarity degree of the two images through the correlation calculation of the features.
Additionally, several target recognition-based evaluation methods have been proposed. The constant false alarm ratio (CFAR) based on efficiency is designed to find the dynamic balance of detection rate and speed under different clutter background by artificially setting threshold [19,20,21]. CFAR is primarily employed for suppressing interference and detecting targets with high jammer-to-signal ratios (JSR), but lacks direct evaluation capability. Quan et al. [22], based on jamming detection, assessed the quality of jamming effect by comparing the area of the detected interference area with that of the undetected area. Sun et al. [23] presents a DRFM deception jamming detection method using diagonal integral bispectrum features and a polynomial-kernel support vector machine (SVM) for robust performance under low SNR conditions.
With the development of deep learning, some researchers have proposed novel methods for specific jamming images. Tang et al. [24] introduced the concept of semantic accuracy by considering statistical discrepancies with background templates, thereby achieving effective deception evaluation. However, the targets under evaluation are relatively small in size and exhibit minimal distinctive features. Tian et al. [25] leveraged existing deception jamming evaluation indicators to propose a novel online assessment method based on a Convolutional Neural Network (CNN), while it is only possible to distinguish images with different errors and cannot directly conduct evaluations. Moreover, the imaging mechanism of SAR images is highly complex, and the imaging results of the same geographical area may not ensure pixel-level consistency. Consequently, the universality of deep learning-based evaluation methods is often limited.
Although the existing body of research is substantial, the aforementioned studies still exhibit two primary limitations. First, most current evaluation methods are primarily designed to assess suppression and noise interference, with a lack of specialized approaches for evaluating deception interference. Second, even when certain methods are applicable to deception jamming assessment, they fail to comprehensively account for image-related errors, particularly in scenarios involving irreparable minor distortions.
Therefore, to address the issue of one-sided evaluation results, we proposed three complementary feature approaches for comprehensive assessment. Moreover, the three feature extraction and comparison methods we put forward can, respectively, represent the similarity of images in terms of edge contour, brightness distribution, and texture details. Secondly, in response to the issue of strong subjectivity in evaluation, we do not subjectively divide the weights of the three features by weighted summation, but instead use multiplication to enable the three features to mutually restrict each other. Finally, in response to the inconsistency between traditional methods and expert judgment results, we analyzed the causes and proposed three features specifically based on this, all of which have a certain degree of robustness for slightly distorted images.
The remaining sections are as follows. Section 2 analyzes the causes of SAR image errors from three perspectives during the SAR imaging process. Section 3 introduces the main framework of this method and the improvement measures for the shortcomings. Section 4 presents the simulation-based validation of the theoretical error value, and comparison studies are applied to illustrate the effectiveness of the proposed method. Section 6 summarizes the paper.

2. Analysis of Deception Jamming Error

2.1. SAR Jamming Model

Consider a SAR platform imaging a specific area at a constant flight speed, with a flight altitude H and a side-looking beam at an incidence angle θ , which is depicted in Figure 1 [26].
Assume that the jammer is located at the imaging center, and the slant range from the radar to the jammer can be expressed as R 0 = H c o s θ . Let R J ( η ) represent the distance between the jammer and SAR platform at time η , and R F ( η ) denotes the distance between the false target and SAR platform at time η . In the three-dimensional coordinate system, the false target can be denoted as P ( x , y , z ) , while its corresponding projection in the slant range–azimuth coordinate system is represented as P 0 ( x 0 , y 0 ) . It is also assumed that the speed of SAR platform is denoted as V r , the pulse repetition frequency as PRF, the pulse duration as T r , the synthetic aperture time as T a , the range chirp rate as K r , the carrier frequency of the transmitted pulse as f 0 , the azimuth-direction time as η , and the range-direction time as τ . c represents the speed of light.
Based on the system in Figure 1, the baseband echo signal of point O received by the SAR platform can be represented as
s O ( τ , η ) = A rect η T a rect τ τ O T r exp j π K r ( τ τ O ) 2 j 2 π f 0 τ O
where A is the amplitude of signal and τ O = 2 R J ( τ ) / c represents the time delay between the transmission and reception of the signal. rect [ · ] is the rectangular function. Similarly, the echo signal of point P can also be obtained. Therefore, based on the echo signal difference between point O and point P, the system function of the jammer can be calculated as
h ( τ , η ) = A · δ τ 2 Δ R ( η ) c exp j 2 π f 0 2 Δ R ( η ) c
where A is the power setting, Δ R ( η ) = R F ( η ) R J ( η ) , and it can be expanded as
Δ R ( η ) = ( R 0 + y 0 ) 2 + ( x 0 V r η ) 2 R 0 2 + V r 2 η 2
Building upon the established model, we systematically analyzed the error sources in false target generation.

2.2. Defocusing

During the jamming process, the jammer needs to intercept the SAR signal in advance, and then generate specific jamming signals based on known and estimated parameters to achieve the purpose of highly realistic false target imaging. Under normal circumstances, the modulated signal of the jammer does not affect K r . However, due to systematic errors in actual operation and even the transmission loss of electromagnetic waves in different media, the K r of the echo signal received by the SAR may eventually change slightly. When the signal parameters (e.g., K r , V r ) estimated by the jammer have errors, it will directly lead to the mismatch of jamming signal during matching filtering, which is manifested in SAR images as the displacement and defocusing of the false target along the range or azimuth direction, as well as a certain degree of amplitude variation.

2.2.1. Range Defocusing

The pulse compression in the range direction is related to the range frequency modulation matches. According to the Principle of Stationary Phase (POSP), the frequency domain expression of the signal with range chirp rate error after range compression is given as
S r c , Δ K r ( f τ , η ) = 1 K r + Δ K r rect η T a rect f τ K r T r exp j 2 π ( f 0 + f r ) τ O + j π f τ 2 | Δ K r | K r ( K r + Δ K r )
where Δ K r is the error of range chirp rate. The time domain signal can be obtained by Inverse Fourier Transform (IFT), which can be expressed as
s r c , Δ K r ( τ , η ) = 1 2 π K r + Δ K r rect η T a rect ( Δ K r + K r ) ( τ τ O ) | Δ K r | T r ·   exp j 2 π f 0 τ O j π K r ( K r + Δ K r ) ( τ τ O ) 2 | Δ K r |
As can be seen from Equation (5), the range chirp rate error introduces an error term that varies quadratically with the range time. This error directly leads to a mismatch between the matched filter and the echo signal, which varies across different frequency bands. According to Equation (5), the specific range broadening is related to the range of rectangle function, which can be defined as
δ r g , 3 d b = | Δ K r | Δ K r + K r T r

2.2.2. Azimuth Defocusing

The azimuth chirp frequency of the SAR signal originates from the Doppler frequency generated by the relative motion between the SAR platform and the target. Consequently, it is essential to consider the factors influencing the Doppler frequency.
In low squint cases, when the synthetic aperture length is relatively short (satisfying R 0 V r η ), the instantaneous slant range can be approximated by retaining the first two terms of its Taylor expansion, as follows:
R J ( η ) = R 0 2 + V r 2 η 2 R 0 + V r 2 η 2 2 R 0
Combining Equations (1) and (7), the echo signal after range compression can be expressed as
s r c ( τ , η ) = A 0 p r ( τ 2 R J ( η ) c ) rect η T a exp j 4 π f 0 R 0 c j π 2 f 0 V r 2 c R 0 η 2
where the constant A 0 represents the amplitude and can be neglected in the imaging derivation process. p ( τ ) is a sinc function, expressed as sin ( π B τ ) / π B τ . Then the chirp rate of signal along the azimuth direction can be defined as
K a = 2 f 0 V r 2 c R 0
From Equation (9), it can be seen that the azimuth chirp frequency is related to the speed of SAR platform, carrier frequency, and nearest slant range. In fact, as indicated by Equation (1), it is evident that the aforementioned three parameter errors will introduce redundant phase terms. This, in turn, will cause the imaging point to shift upward along the range direction. Additionally, the impact of these errors on the Doppler frequency will result in defocusing of the imaging point in the azimuth direction. In this section, we specifically focus on the effect of the errors on the upward defocusing in the azimuth domain.
Before applying azimuth matched filtering, the echo signals require range cell migration correction (RCMC). The slant range envelope in the range-Doppler domain, obtained by jointly solving Equations (7) and (9), is expressed as
R r d ( f η ) = R 0 2 + V r 2 2 R 0 f η K a 2 = R 0 + c 2 R 0 f η 2 8 V r 2 f 0 2
It is evident that the value of RCMC is closely associated with the shortest slant range, the carrier frequency, and the speed of SAR platform. Therefore, it is necessary to consider the accuracy of range cell migration correction under different error conditions. In other words, for the RCMC, the difference between the echo with error and the echo without error must be less than a range-direction sampling cell to ensure accuracy, namely
Δ RCMC ( f η ) = R 1 , r d ( f η ) R 2 , r d ( f η ) < ρ r
where ρ r represents the range resolution, and R 1 , r d ( f η ) and R 2 , r d ( f η ) denote the instantaneous distances from the SAR platform to the jammer and to the false target, respectively. This article assumes that the aforementioned expression holds true under all circumstances; in other words, the correction can be considered accurate. Based on it, the time-domain expression of the echo signal with Δ f 0 error after range matched filtering is given by
s r c , Δ f 0 ( τ , η ) = A 0 ( K r T r | Δ f 0 | ) rect η T a · sinc ( K r T r | Δ f 0 | ) τ 2 R J ( η ) c + Δ f 0 K r · exp j 4 π R J ( η ) c ( f 0 + Δ f 0 2 ) + j π Δ f 0 τ
According to Equation (12), the error of carrier frequency can impact not only the azimuth chirp rate but also the range compression result. Combined with Equation (7), using the standing phase principle, the signal expression of the range-Doppler domain can be obtained as follows:
S r d , Δ f 0 τ , f η = A 0 K r T r | Δ f 0 | rect f η K a ( 1 + Δ f 0 2 f 0 ) T a · sinc K r T r | Δ f 0 | τ 2 R f η c + Δ f 0 K r · exp j 4 π R 0 c f 0 + Δ f 0 2 + j π Δ f 0 τ · exp j π K a 1 + Δ f 0 2 f 0 f η 2
From Equation (13), it can be seen that the influence of carrier frequency on K a is Δ K a = Δ f 0 K a / 2 f 0 . Based on this, the difference of range migration between the echo signal with carrier frequency error and the original signal can be calculated as
Δ RCMC ( η ) Δ f 0 = 1 + Δ f 0 2 f 0 2 1 c 2 R 0 f η 2 8 V r 2 f 0 2 Δ f 0 f 0 · c 2 R 0 f η 2 8 V r 2 f 0 2
Similarly, the range migration deviation caused by the SAR platform velocity error and the nearest slant error can be expressed as
Δ K a = 2 f 0 c R 0 ( 2 V r + Δ V r ) Δ V r , only Δ V r exists   2 f 0 V r 2 c Δ R 0 ( Δ R 0 + R 0 ) R 0 , only Δ R 0 exists
Actually, SAR image performance evaluation focuses primarily on image quality rather than the theoretical effects of errors on imaging. Therefore, we only need to focus on the azimuth defocusing caused by the Doppler modulation frequency changes:
δ a z , 3 d b = | Δ K a | Δ K a + K a T a

2.3. Amplitude Variation

The amplitude error of deception interference in SAR images is mainly manifested as abnormal bright spots of false targets, and its luminance characteristics are determined by the matching degree between the interference signal and the parameters of the SAR system. When the deception signal accurately simulates the scattering characteristics (including phase and amplitude) of the real target, the generated false target presents an amplitude response similar to that of the real target in the image. Modulation errors (such as delay or Doppler mismatch) can lead to defocus or amplitude distortion, manifested as uneven brightness or side lobe effects. Excessive interference power may cause amplitude saturation and form significant bright spots, while insufficient power is prone to being submerged by background noise. In addition, SAR imaging algorithms (such as matched filtering and Doppler focusing) will further amplify the mismatch error of the interfering signal, resulting in artifacts or side lobe enhancement.
Therefore, the amplitude error of deception jamming is essentially the combined effect of the design error of jamming signal, the processing characteristics of SAR system, and the electromagnetic scattering environment. To simplify the simulation, in this paper, the above three influences are combined into one amplitude modulation coefficient β .

2.4. Distortion

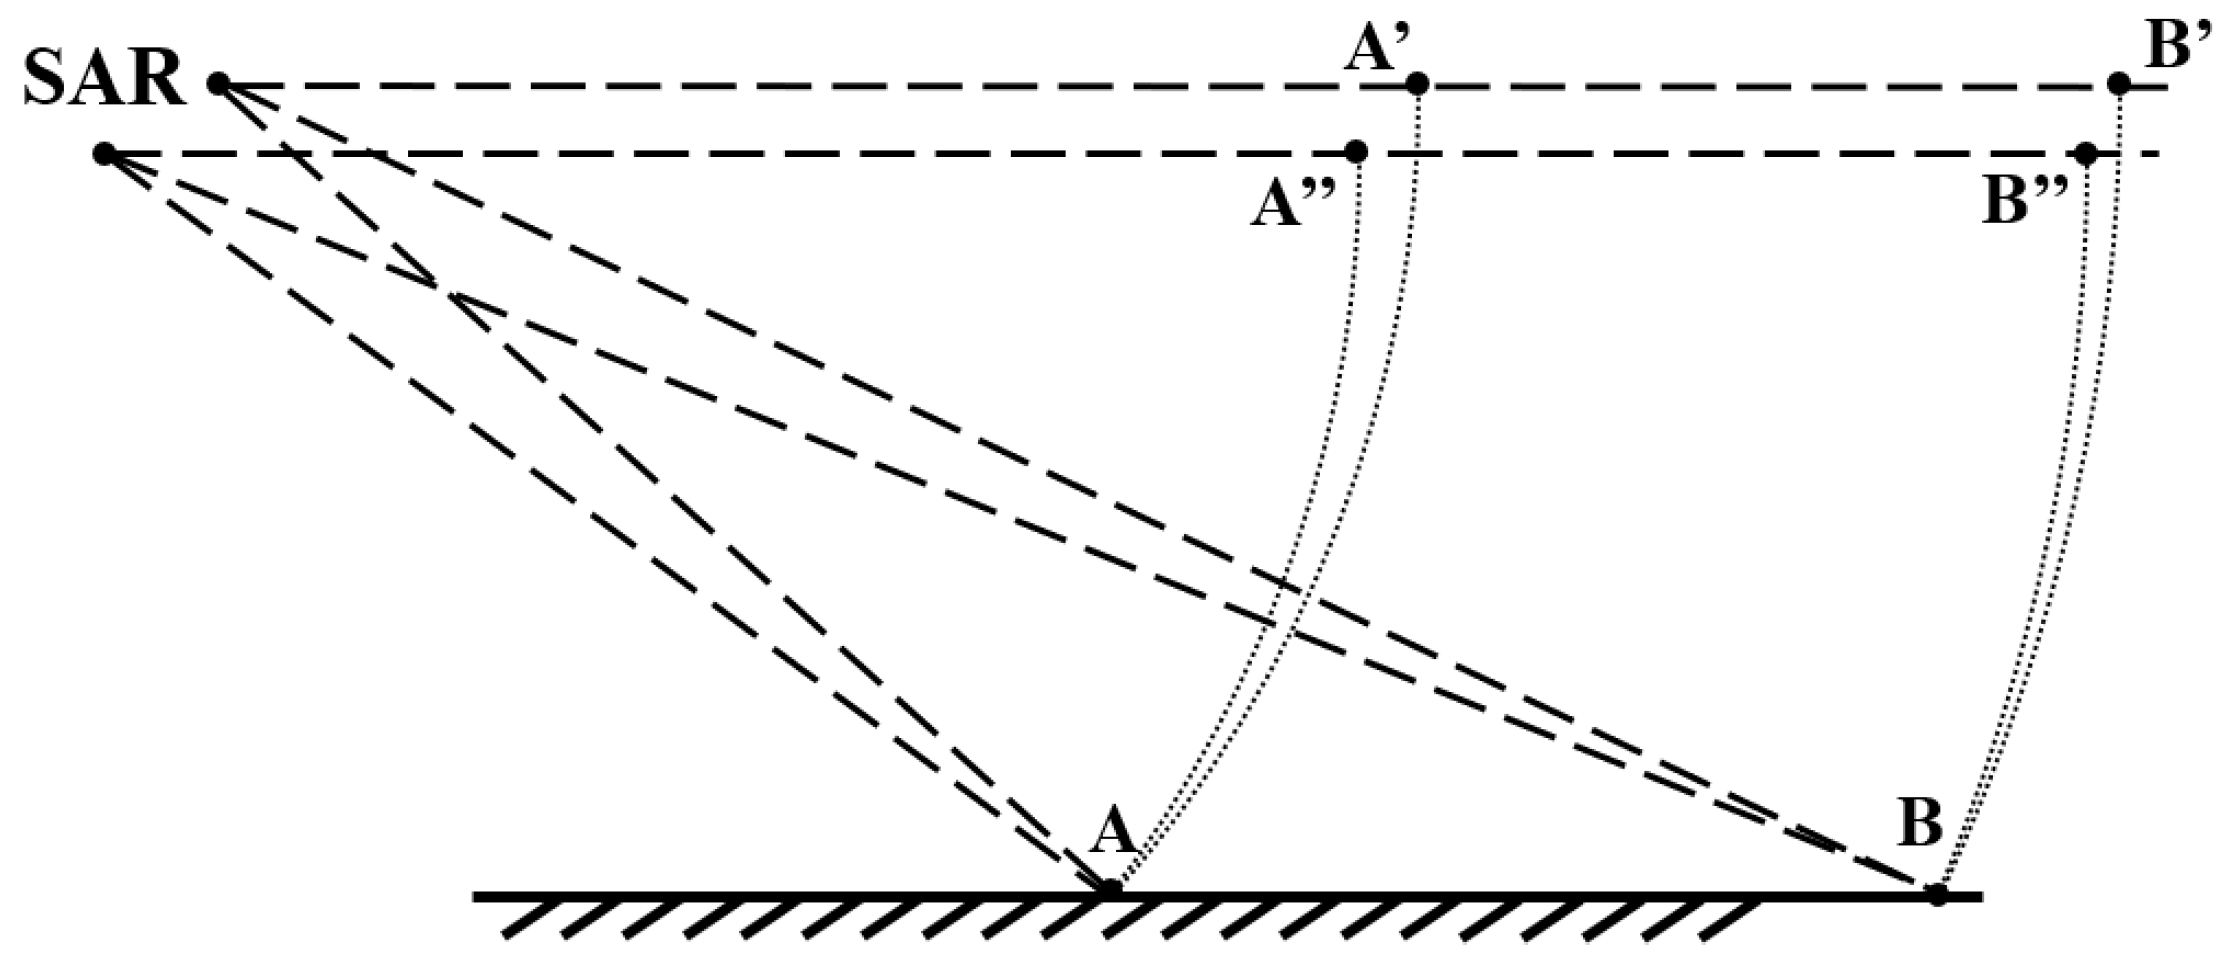
As shown in Figure 2, A and B denote the nearest and farthest ground points illuminated by the SAR. A and B represent their projected positions on the 2D image during the first flight, while A and B correspond to the projected positions during the second flight.
From the perspective of SAR flight platform, slight changes in the trajectory and squint angle of SAR can cause geometric distortion ( x 0 , y 0 ) during the imaging. Therefore, due to two different flight paths, after degrees of geometric correction, the false target and jamming template in SAR image may show different degrees of stretching, which will seriously affect the traditional pixel-based evaluation method [27].
In addition to the image distortion errors caused by variations in viewing angles and flight trajectories between two SAR imaging process, a single SAR can also exhibit geometric distortions due to the inherent operating principle of the jammer. Specifically, the viewing angle errors introduced during SAR imaging induce distortions in the actual image, which are further influenced by the relative location between the jammer and false target.
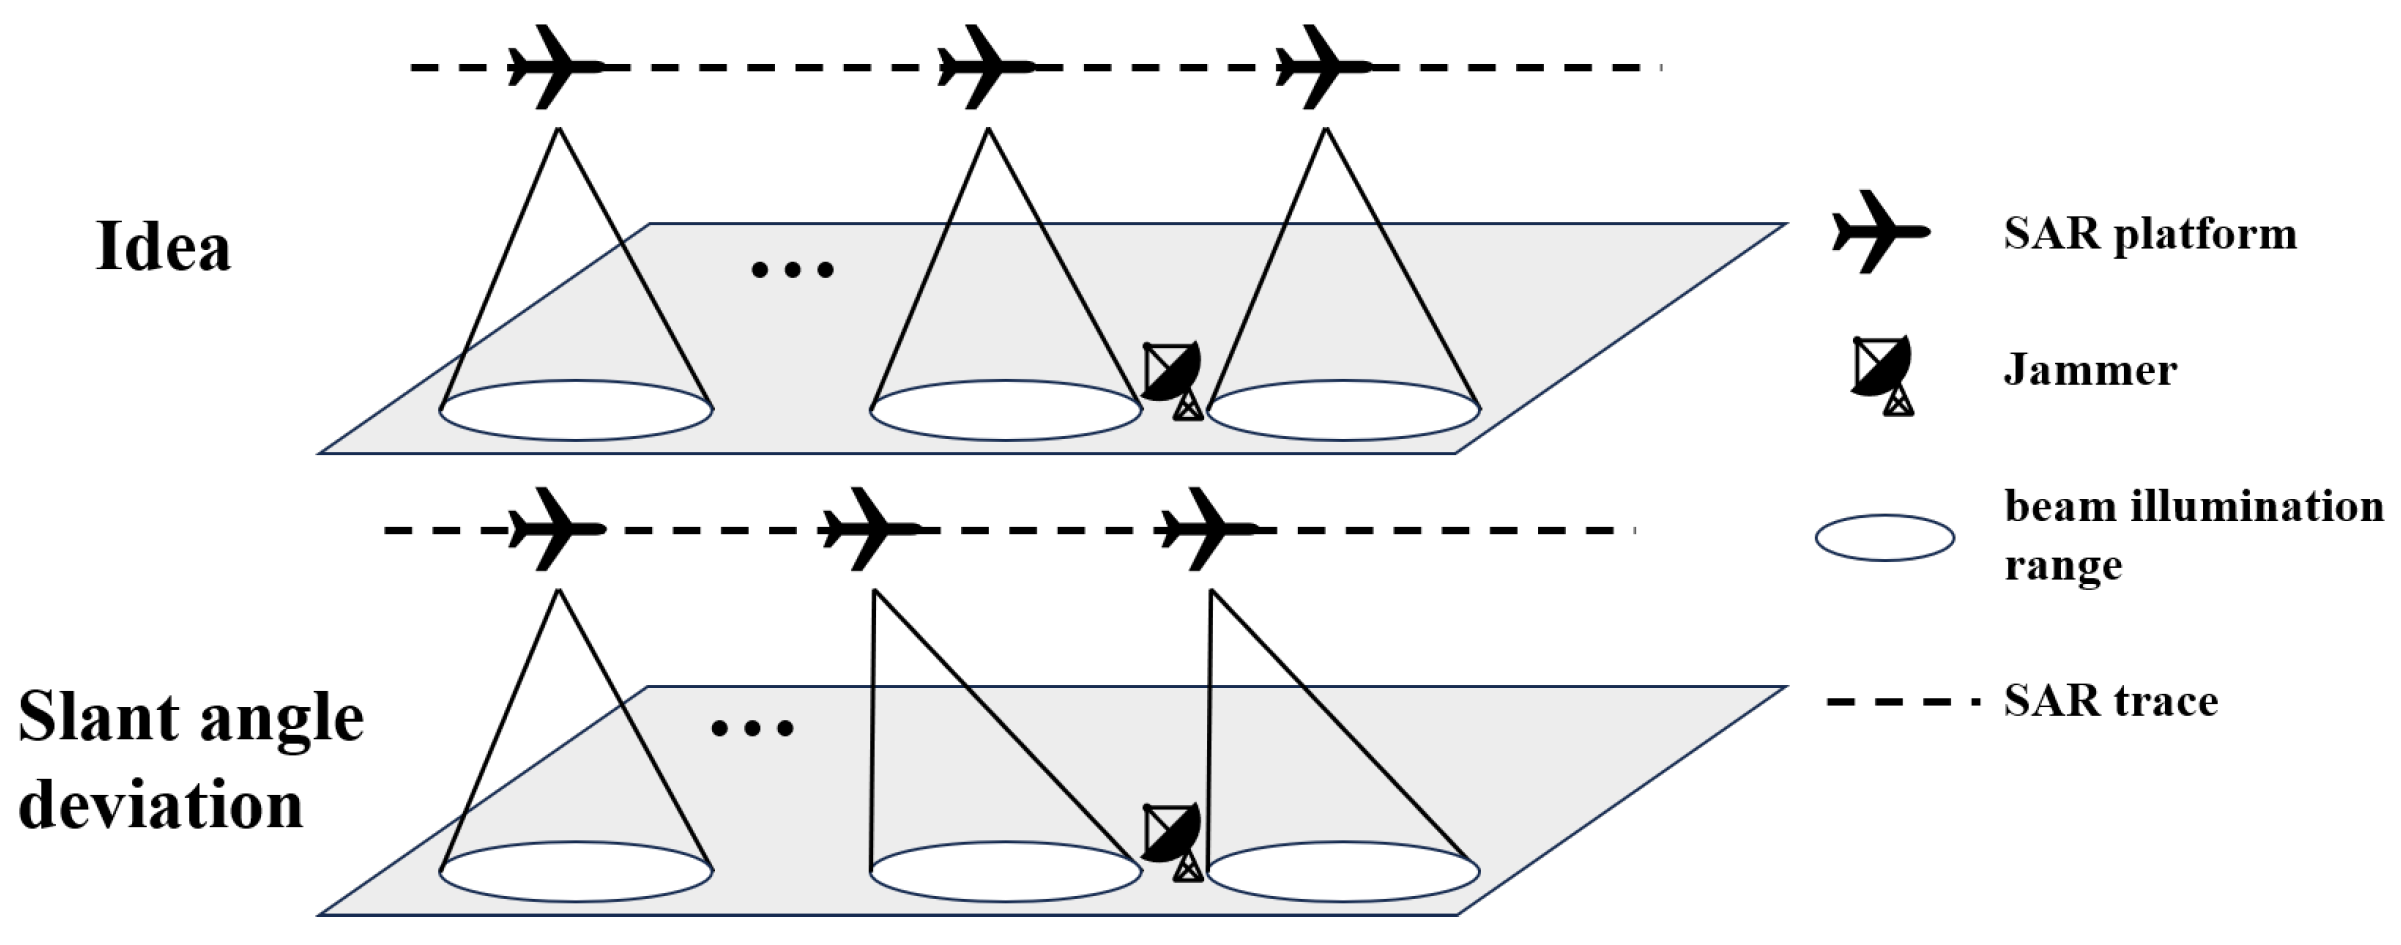
Consider the jamming process as follows: When the signal power received by the jammer is greater than a certain threshold, the jammer starts to work, interferes with the SAR according to the signal parameters and preset template of the reconnaissance, and completes the jamming when the signal power passes the threshold again. However, when the beam illumination range of SAR does not pass through the jammer coverage area, the beam oblique angle changes, making the beam illuminate the jammer coverage area in advance, resulting in the jammer working in advance. Due to the difference between the reference slant range of jammer and the actual slant range, the false targets in different positions will not only produce azimuth deviation and defocusing, but also produce different range deviation, which will seriously affect the traditional pixel-based efficiency evaluation method.
For the jamming process depicted in Figure 3, the instantaneous slant range difference between false target P and jammer O can be approximated using Taylor expansion as
Δ R ( η ) = R P ( η ) R J ( η ) = R 0 2 + V r 2 η 2 ( R 0 + y 0 ) 2 + ( x 0 V r η ) 2 y 0 + x 0 2 2 ( R 0 + y 0 ) x 0 V r η R 0 + y 0 V r 2 η 2 2 y 0 ( R 0 + y 0 ) R 0 y 0 + x 0 2 2 R 0 x 0 V r η R 0
Equation (17) is valid provided that R 0 x 0 , R 0 y 0 .
Assuming the implementation of a two-step method as the jamming approach employed by the jammer, it is evident that the system response function for generating false targets at P points can be expressed as follows:
H ( f τ , η ) = σ 0 exp j 2 π ( f 0 + f τ ) 2 Δ R ( η ) c = σ 0 exp j 2 π ( f 0 + f τ ) 2 y 0 c + x 0 2 c R 0 + j 4 π ( f 0 + f τ ) x 0 V r η c R 0
where σ 0 is the radar cross-section of false target.
When the radar irradiation angle deviates, the jammer works in advance. At this time, the azimuth deviation due to irradiation angle deviation Δ θ is Δ x = R 0 Δ θ . Formula (17) should be revised to
Δ R Δ x ( η ) y 0 + x 0 2 2 R 0 x 0 ( V r η Δ x ) R 0
Combined with Equations (17) and (19), the phase error of the system response function due to angle error is
Δ Φ Δ θ ( η ) = j 4 π f τ x 0 Δ θ c
From the results, it can be concluded that the squint angle error introduces a constant-phase error, ultimately leading to a range-direction displacement of the false target. Subsequently, point target simulation is conducted to validate this type of error.
In summary, based on visual assessment results, we categorize the errors of undesirable jamming targets into three types: defocusing, amplitude variation, and distortion.

3. Multi-Feature Fusion Framework

3.1. Contour Similarity Basic Framework

We propose a contour similarity(CSIM) assessment method based on image edge information. Assume that a reference SAR image P 1 without error and a SAR image P 2 to be evaluated are available.
The edge information of the reference image is denoted as E 1 = { ( x , y , g ( b ( x , y ) ) ) ( x , y ) P 1 } , while the edge information of the image to be evaluated is represented as E 2 = { ( x , y , g ( b ( x , y ) ) ) ( x , y ) P 2 } , where b ( x , y ) is the binary function, which is generally defined as
b ( x , y ) = 1 , if P ( x , y ) δ 0 , otherwise
where P ( x , y ) represents the pixel value of the image at ( x , y ) , δ is the threshold, and the mean value of the image is taken as the threshold in this paper. g ( · ) is the edge extraction function.
Then, as shown in Figure 4, the Euclidean distance between reference edge and false edge is calculated, and the minimum value of each calculation is grouped into the set Distance:
Distance = { d i d i = min E 1 ( x i , y i ) E 2 }
Finally, the similarity is evaluated by comparing the minimum Euclidean distance. If the minimum Euclidean distance is less than or equal to the predefined threshold, it indicates that the edge of the reference image at this element is similar to the edge of the target image. Otherwise, they are not considered similar. The ratio of the number of similar elements N v a l i d to the total number of elements N a l l in the false edge is used as the final metric to quantify CSIM between the two images. Furthermore, to enhance the rationality of CSIM in distance representation, this paper uses the dynamic threshold method to divide the distance weights. Then the modified contour similarity can be expressed as
CSIM = N v a l i d N a l l = f ( Distance ) N a l l
where f ( ) is the default weight function with the output range of [0, 1]. The input is the minimum Euclidean distance of adjacent edge elements, and the output is the weight corresponding to distance. The function adopted in this paper is defined as
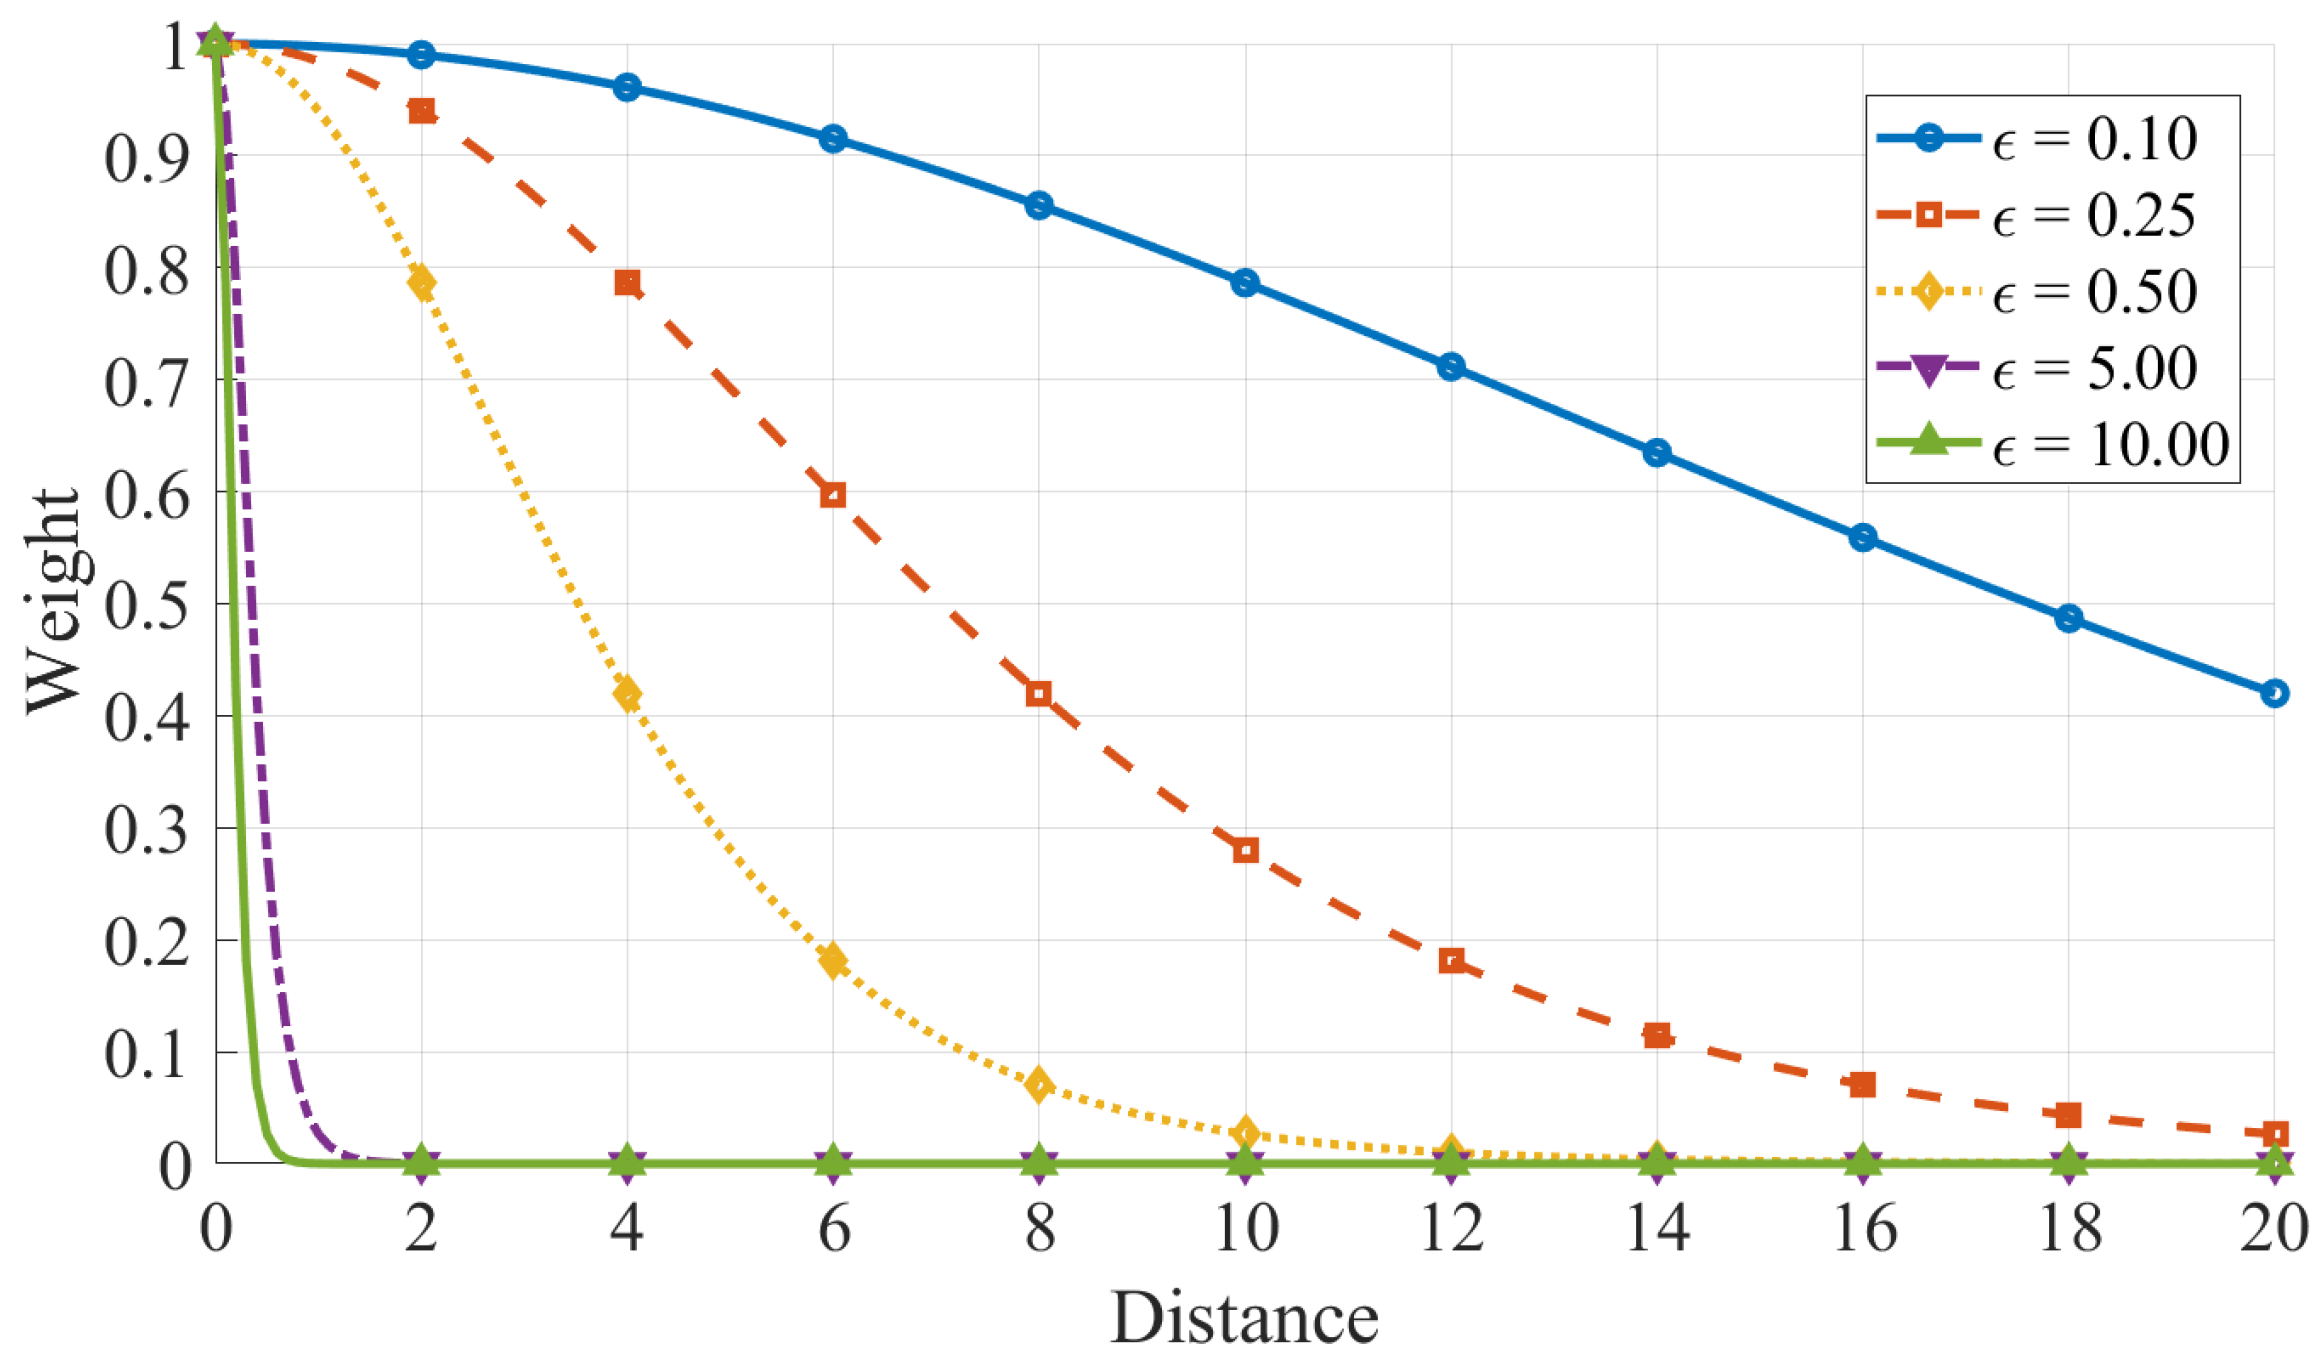
f ( x ) = 1 1 exp ( ϵ x ) 1 + exp ( ϵ x ) 2
The approximate curves of the aforementioned can be expressed as follows: When the distance values are relatively small, this function is capable of maintaining a consistently high weight. As the distance values increase, the distribution of weights exhibits clear differentiation. When the distance exceeds a specific threshold, the weight stabilizes at a relatively low level, and as the parameter settings become higher, the threshold becomes more obvious, which can be observed in Figure 5. By selecting an appropriate parameter, CSIM can mitigate the impact of distortions while preserving its pixel-based evaluation capability to the greatest extent. In this paper, the parameter is set as ϵ = 0.25 . The reasons for the parameter setting will be explained in the experimental simulation section.

3.2. Modified ENL Difference

Though the ENL is used to quantify the smoothness or homogeneity of a SAR image, it is important to note that the ENL is not sensitive to the overall amplitude and contrast change of the image [28]. Furthermore, for an image with a large mean and a small variance, even a slight change in its variance can cause a drastic change in ENL, which in turn leads to a very unsatisfactory evaluation result. Therefore, we propose the modified ENL as the image feature, which is defined as
mENL = ln e μ + e L μ e σ
where μ is the mean of homogeneous region. σ is the standard variance of the same region, L is the number of gray levels.
Without considering the mutual restriction of mean and variance, the value range of Δ mENL for an 8-bit image is about [0, 255). It is evident that the closer the difference value is to zero, the greater the similarity between the image under evaluation and the reference image. In order to make the results more intuitive and unified, a normalization operation is performed on the final Δ mENL :
Δ mENL = 1 mENL 1 mENL 2 L
where m E N L 1 represents the modified ENL calculation result of the reference image, and m E N L 2 represents the modified ENL calculation result of the image to be evaluated.
The modified ENL has a well-defined value range, making it more amenable to normalization and practical application. Moreover, as a statistical-based evaluation method, it is inherently robust to minor distortions and demonstrates enhanced sensitivity to variations in the overall amplitude and contrast of the image.

3.3. Gradient Co-Occurrence Matrix

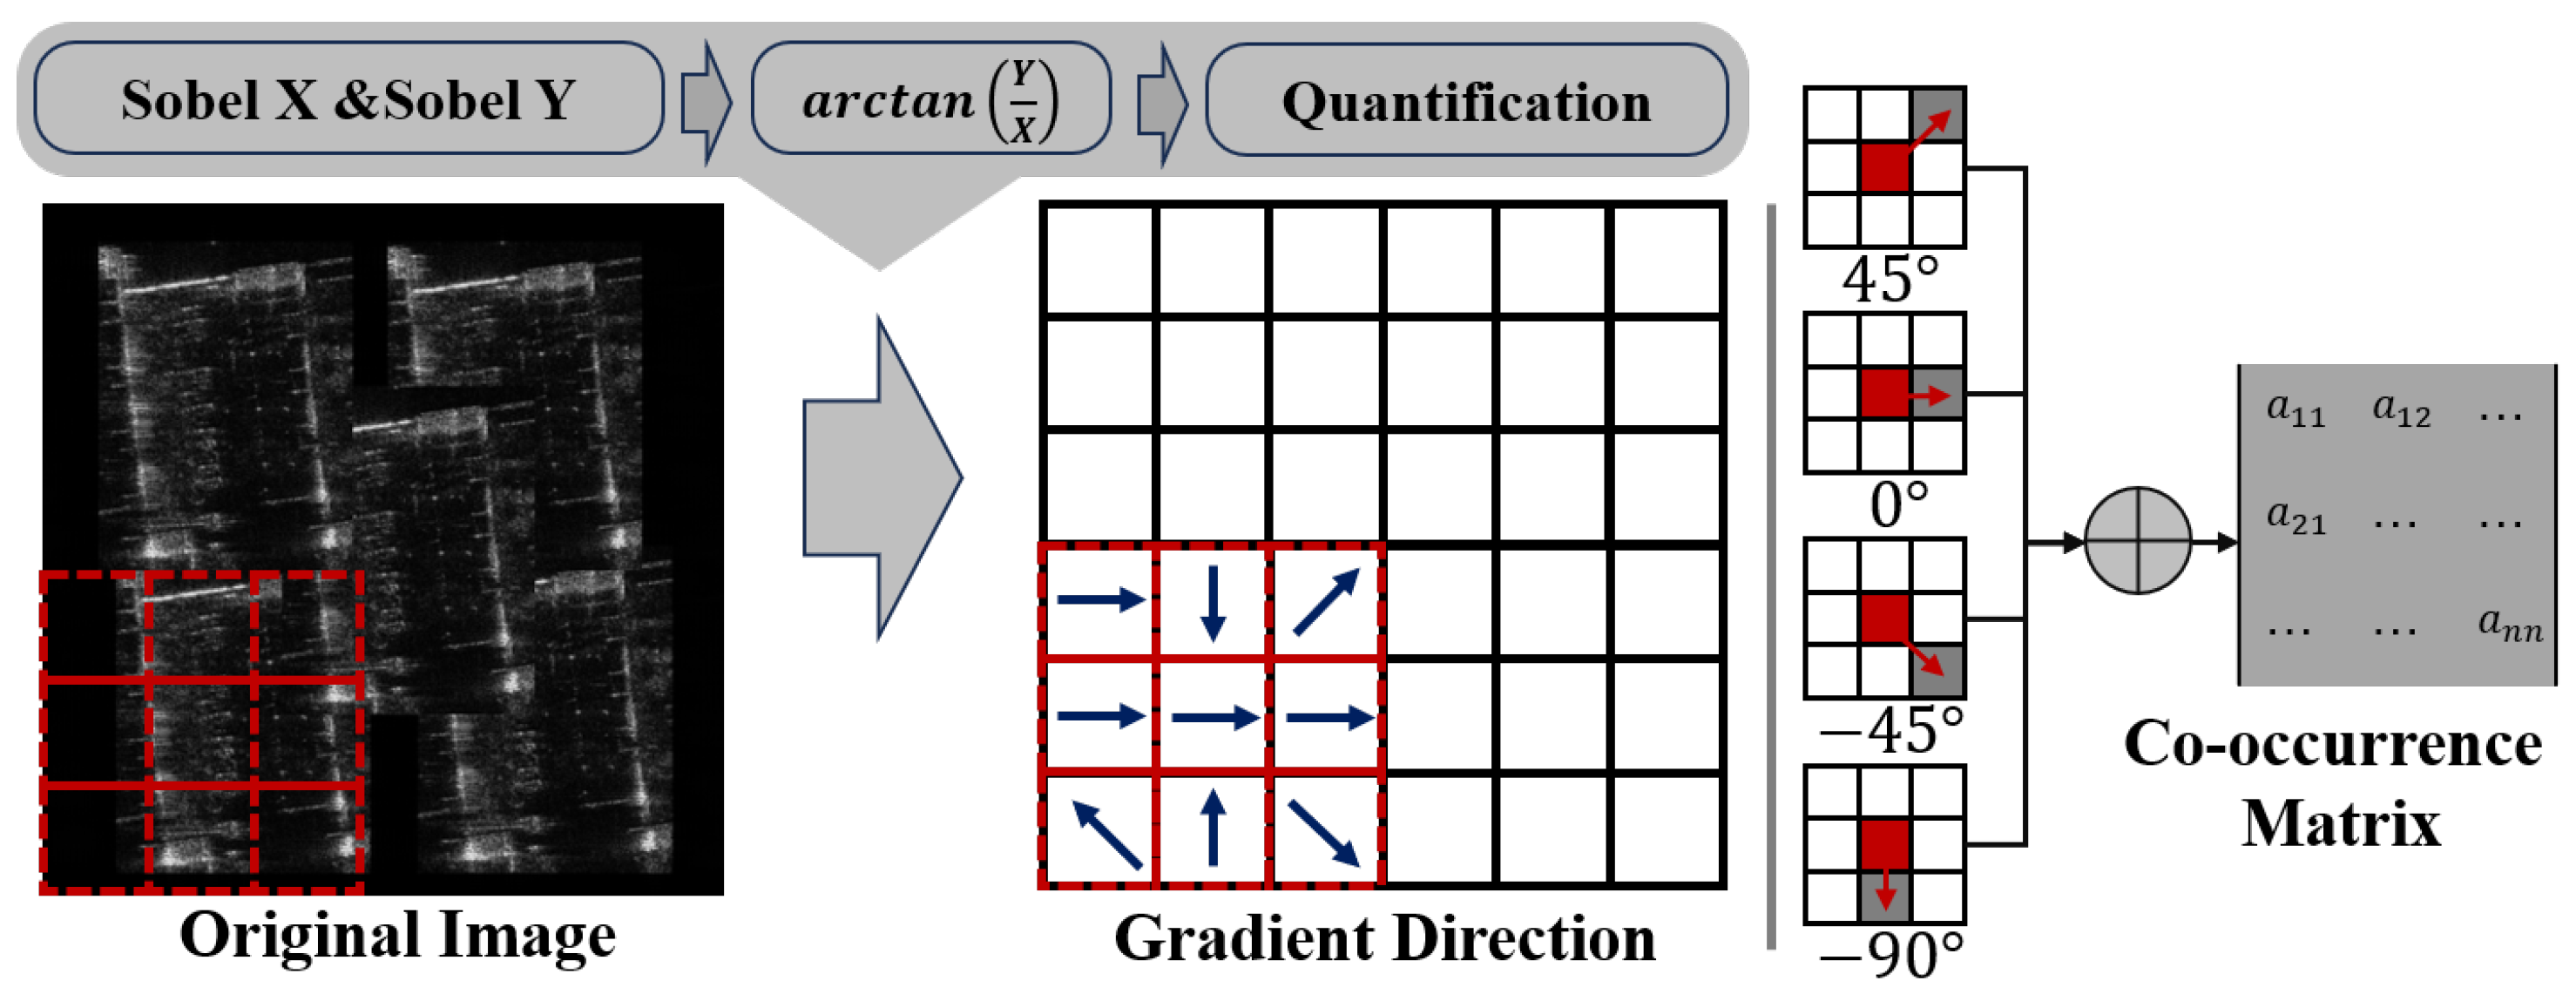
The texture features of an image refer to the patterns of pixel grayscale or color changes in local or global regions within the image, which are used to describe the visual characteristics of the image such as surface structure, repeatability, roughness, and directionality. This paper proposed a texture feature representation method based on gray level co-occurrence matrix(GLCM) to supplement texture features that cannot be evaluated by CSIM and Δ mENL. The detailed process is shown in the Figure 6.
We use the classical Sobel operator [29] to extract the gradient information of the image, and take the ratio of mutually orthogonal gradient information as the direction. After quantifying the gradient direction image, we calculate the four co-occurrence matrices with a step size of 1 in each direction, and take the average of co-occurrence matrices as the final texture feature. Furthermore, within a certain range, the specific quantization criteria are related to the size of the image. In this paper, the original image pixel points adopted are 400 × 400, and the quantization level in the gradient direction is 256.
Since the representation form of texture feature is a matrix, this paper uses the normalized correlation coefficient (NCC) to determine the similarity of texture features:
NCC ( f , g ) = i = 1 n ( f i f ¯ ) ( g i g ¯ ) i = 1 n ( f i f ¯ ) 2 · i = 1 n ( g i g ¯ ) 2
where f and g represent the gradient co-occurrence matrices of the image to be evaluated and the reference image, and f ¯ and g ¯ are, respectively, the average values of the gradient direction changes; n denotes the total number of gradient direction changes; f i and g i indicate the frequency value of the gradient direction changes in the matrices.
As shown in Figure 7, we proposed a Gradient-Based Gray Level Co-occurrence Matrix (GGLCM) by analyzing the relationship between the GGLCM and the variation along the gradient direction. From a mathematical perspective, the change from π 4 to 7 π 4 appears significantly greater than that from π 4 to π . However, in geometric terms, the angle between π 4 and 7 π 4 is actually smaller than that between π 4 and π . Consequently, in the context of the GGLCM, the closer the difference is to π , the more drastic the variation in gradient direction. Specifically, its most significant peak of variation occurs around the midpoint of the quantized gray levels. Therefore, by comparing the correlation within the high-variation and low-variation regions of the GGLCM, the degree of texture similarity between two images can be further assessed. The specific expression can be formulated as
GradC = 1 NCC ( W f , W g ) NCC ( f W f , g W g )
where ⊙ represents Hadamard product, W is the weight matrix, defined as
W ( ϕ i , ϕ j ) = 1 2 π ( min | ϕ i ϕ j | 2 , ( 2 π | ϕ i ϕ j | ) 2
with ϕ i and ϕ j denoting the gradient directions before and after variation, respectively, each defined in the range of [ 0 , 2 π ] . The min ( · ) function ensures that the squared angular difference accounts for the periodicity of the gradient directions, selecting the smaller of the two possible differences to represent the shortest angular distance between ϕ i and ϕ j .

3.4. Feature Fusion

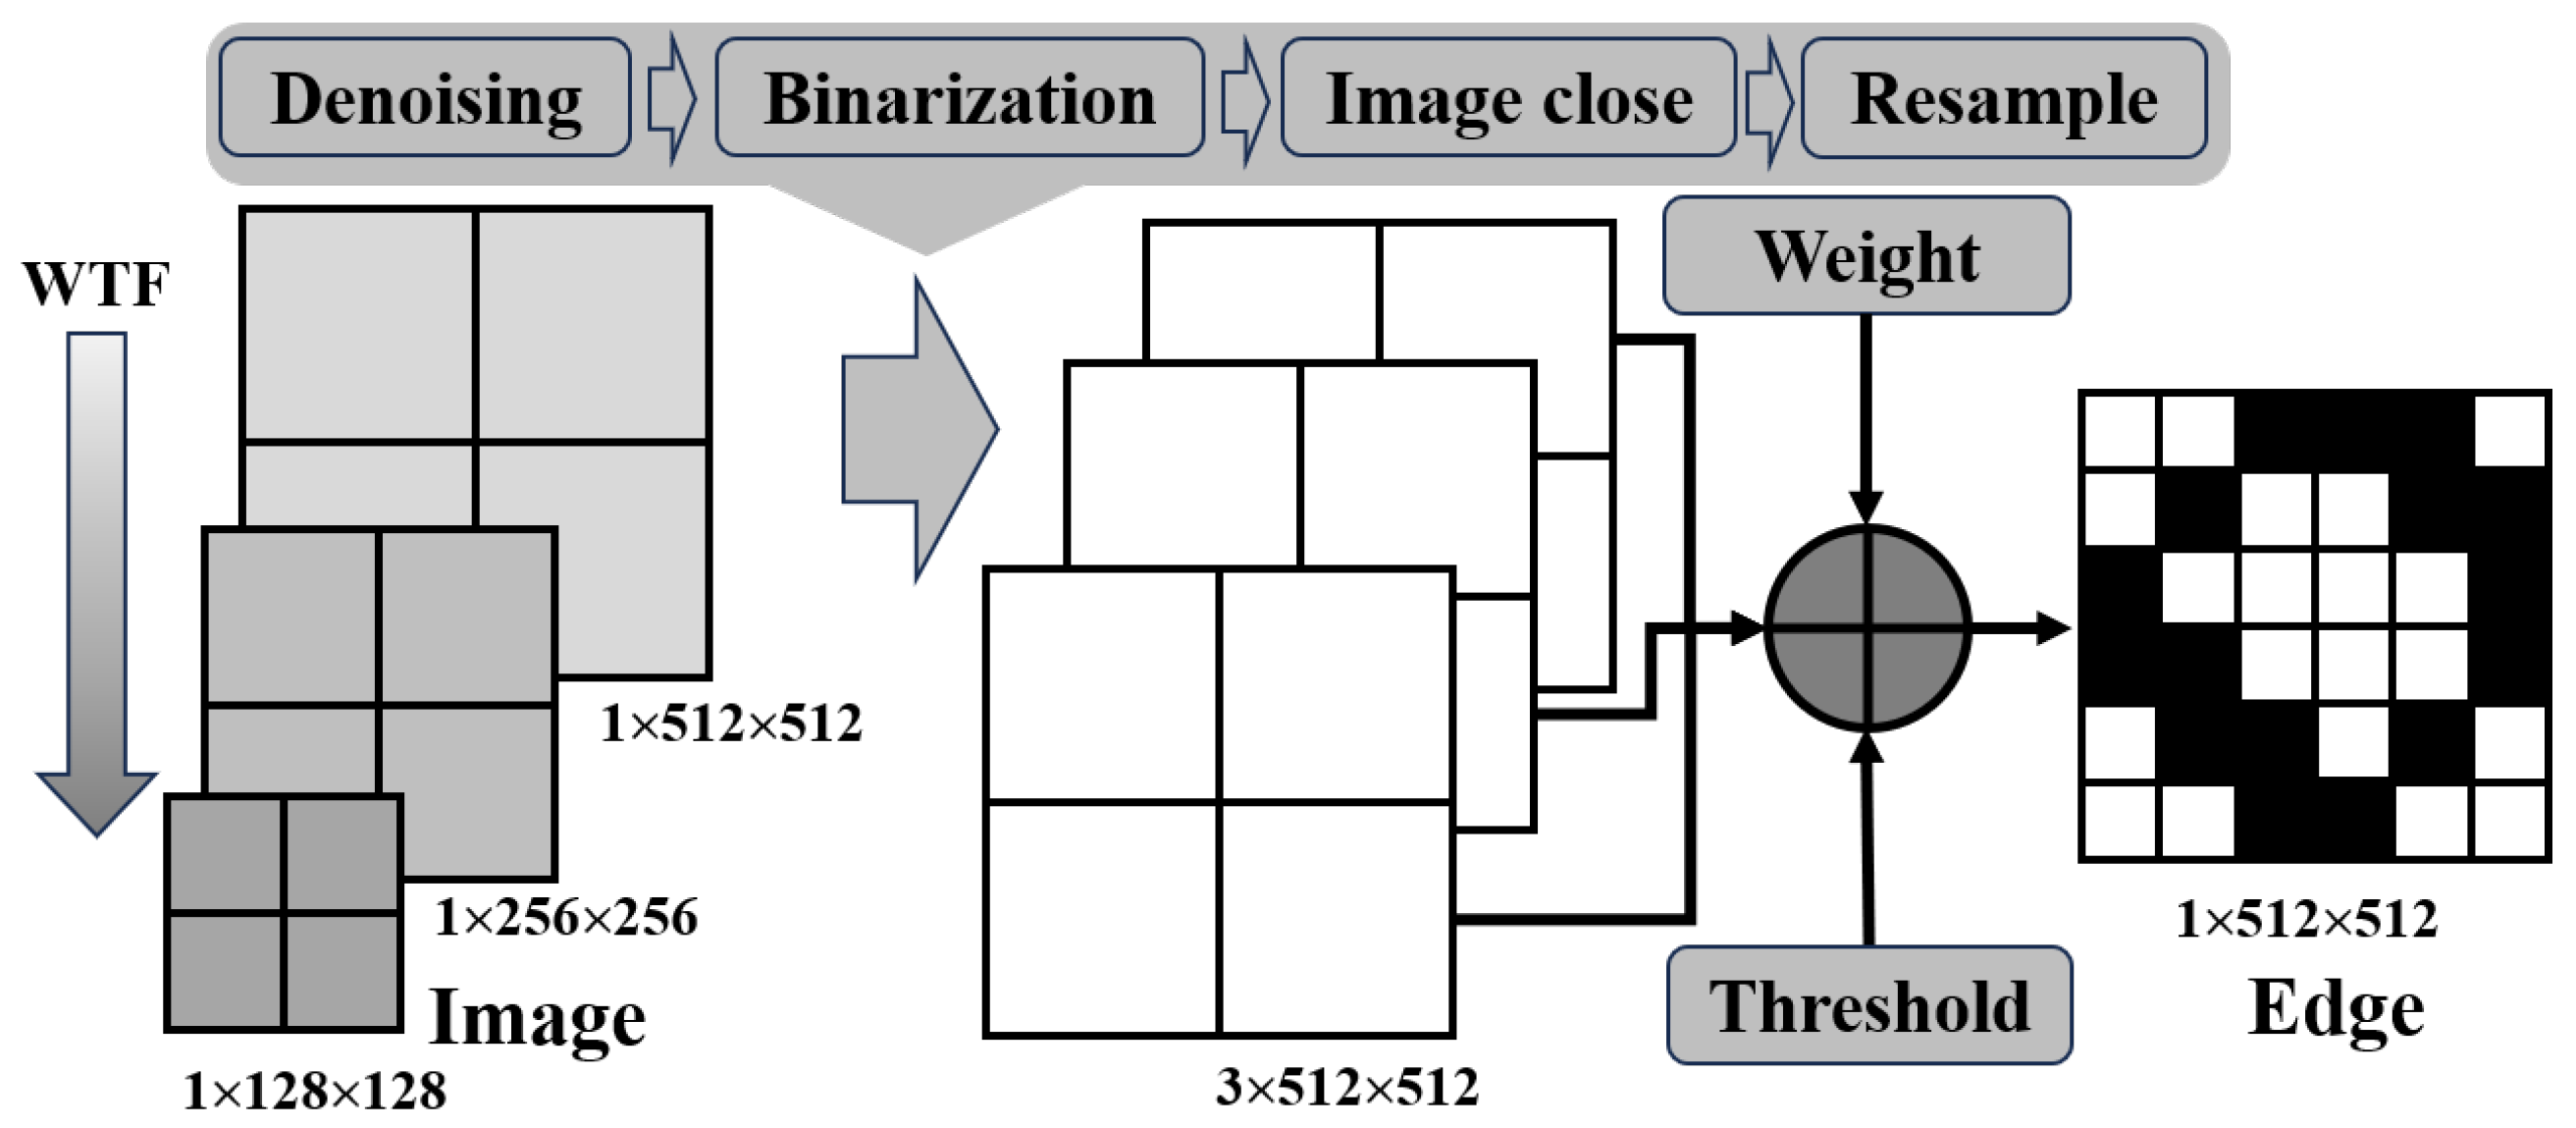
In order to better capture local features at different scales and further reduce the impact of noise on image edge extraction, this paper adopts a multi-scale feature extraction approach [30,31]. The specific details are illustrated in Figure 8.
Firstly, two additional wavelet transforms (WTF) are applied. The low-frequency signal maps obtained from these two WTF are further subjected to feature extraction. The features from the three scales are then fused to serve as the final image features for the comparison of the two images. Then, denoising, binarization, morphological processing, and resampling are carried out on the images of three scales to obtain three edges of the same scale, and the Canny operator [32] is employed for edge extraction of binary images. Finally, set weights for the edges of each image, and select the pixels at the same position among the three edges that are superimposed with a value greater than a certain threshold as the edge pixels of the final image. In this study, the weights are assigned a ratio of 1:1:1, and the threshold is set to 2.
The WTF has a negligible impact on the mean and variance of the image; therefore, multi-scale extraction is not required for modified ENL. Similarly, WTF retains the low-frequency information of the image and severely damages the high-frequency information. Therefore, GradC, which targets the texture details of the image, does not need to perform multi-scale feature extraction either.
Consequently, we propose a combination of these three metrics to derive the final evaluation result:
Proposed = CSIM · Δ mENL · GradC
In summary, CSIM can achieve a sensitivity level comparable to expert visual assessment by adjusting its threshold selection; Δ mENL and Grad are insensitive to minor distortions but remain responsive to brightness and defocusing variations. Therefore, the integration of all three metrics enables a comprehensive evaluation result that aligns closely with expert judgment.

4. Experimental Results

4.1. Error Analysis Experiment

Based on the parameters listed in Table 1, simulation experiments are conducted in this section.
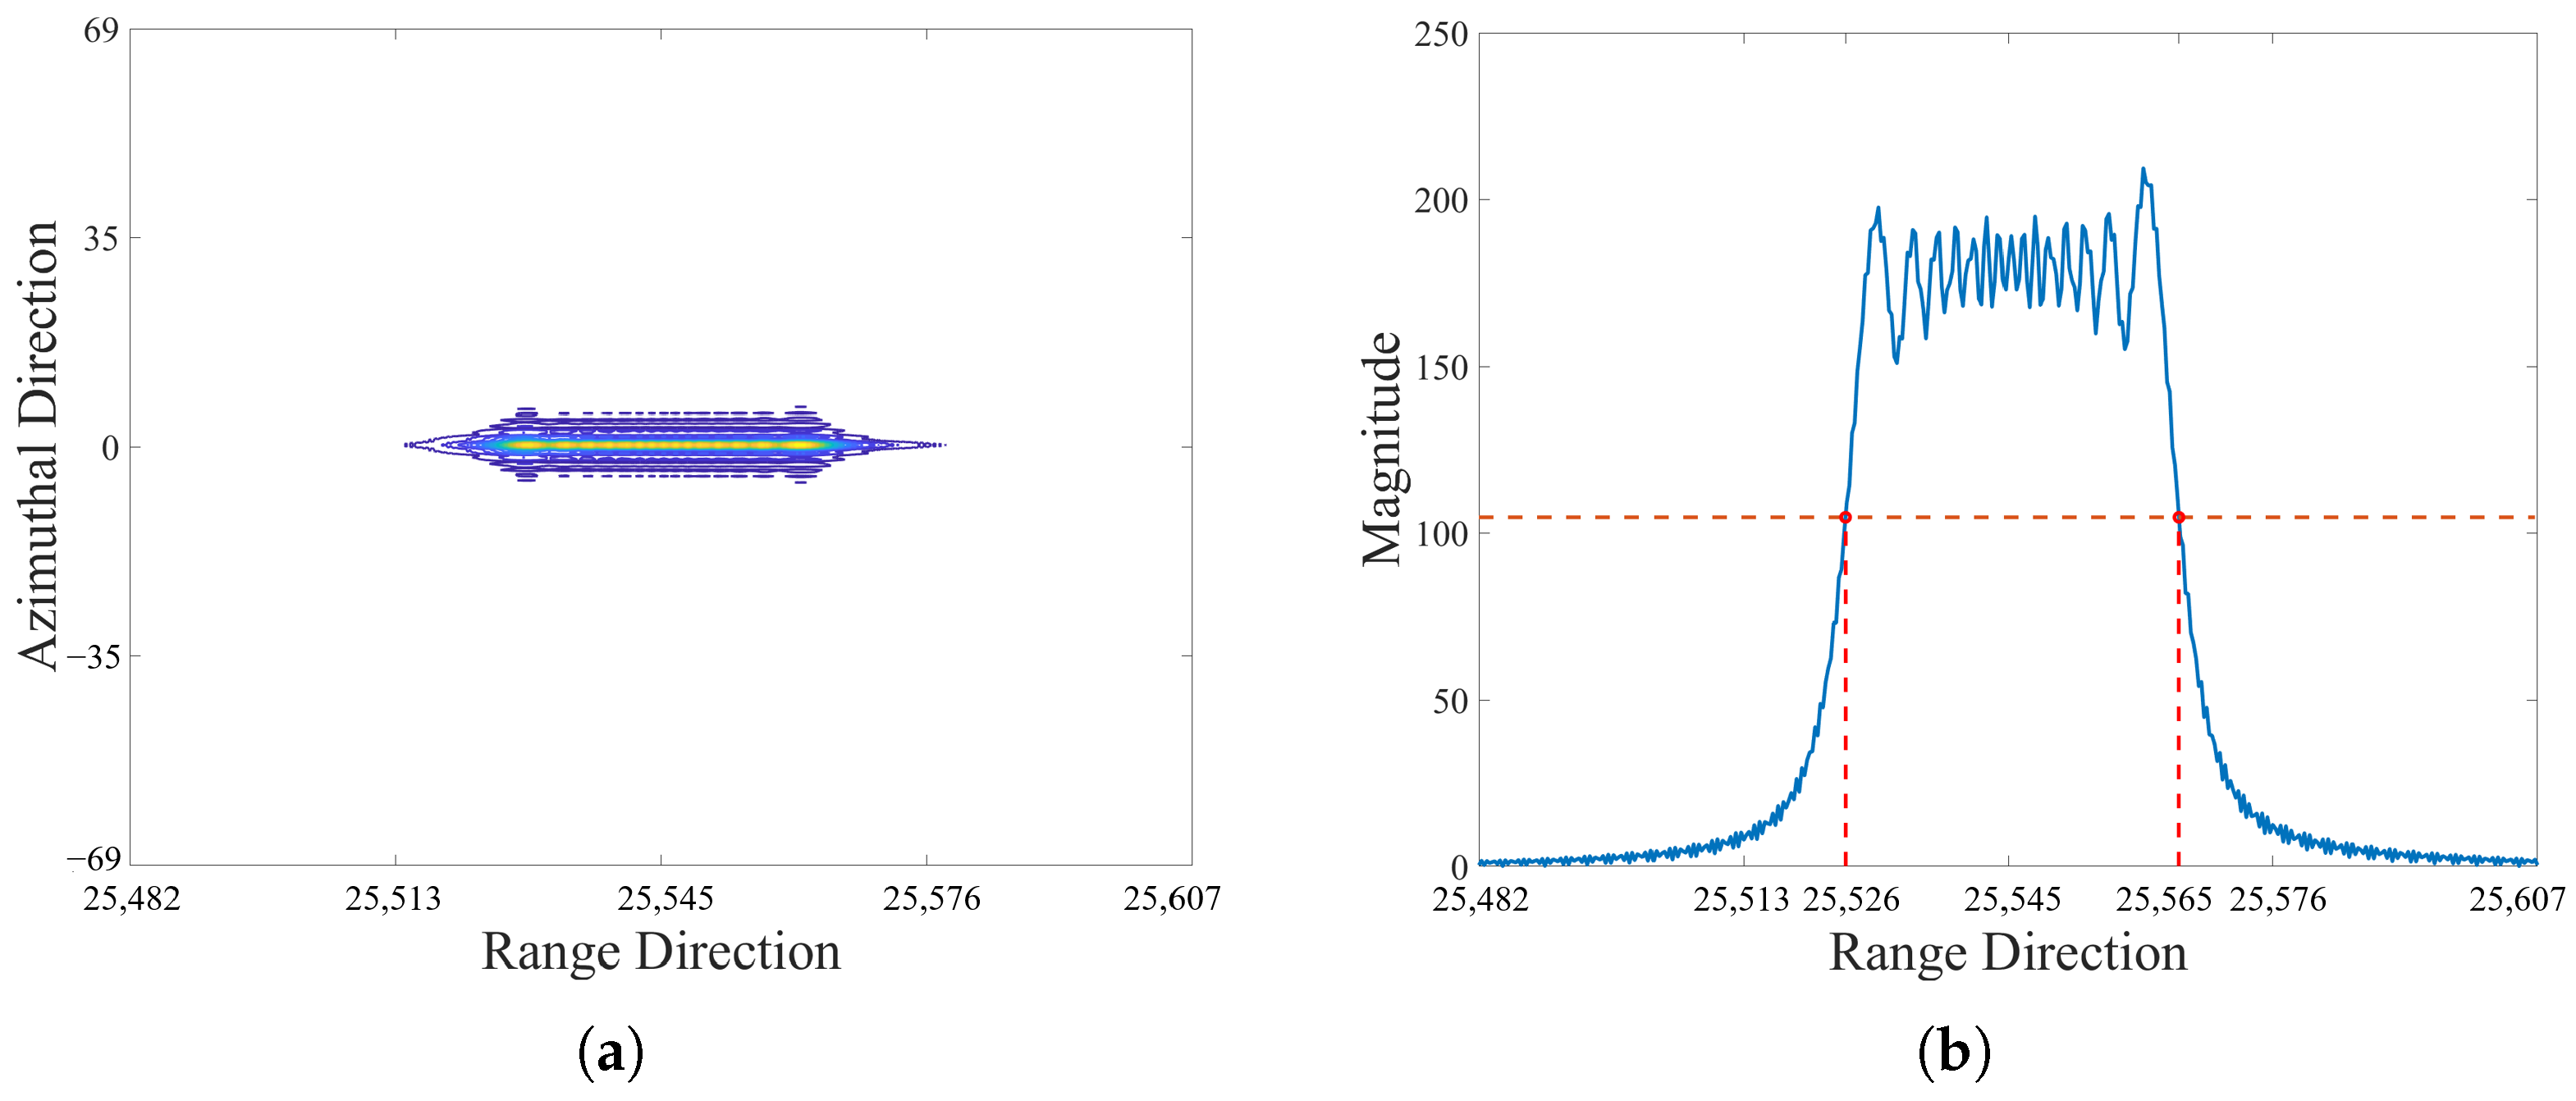
Firstly, we processed theoretical simulation verification on the defocusing error of the point target. Under the condition of a +5% error in K r , the theoretical value of δ r g , 3 d b is T r 0.05 / 1.05 = 1.1429 × 10 7 s . To validate the correctness of the theoretical derivation, a point target simulation with +5% K r error was conducted.
The simulation results of 2 × upsampling are illustrated in Figure 9. The horizontal coordinates of the intersections between the red dashed lines and the curves indicate the theoretical values in Figure 9b. The simulation demonstrates that the range chirp rate error results in range-direction defocusing of the point target, with a calculated 3-dB range-direction broadening of 1.1481 × 10 7 s , which is in close agreement with the theoretical value.
Consequently, taking a velocity error of +1% V r as an example, we calculated and compared the theoretical and simulated values of the azimuth-direction defocusing caused by the velocity error.
As can be seen from the results in Figure 10, the horizontal coordinates of the intersections between the red dashed lines and the curves indicate the theoretical values in Figure 10b, the theoretical value of azimuth defocusing is 0.1306 s , and the value obtained through simulation is 0.1290 s . The experimental simulation is consistent with the conclusion of theoretical derivation. On this basis, we can obtain more simulation pictures of complex scenes.
Finally, under the condition of a 0° squint angle, a +0.3° squint angle error was introduced to simulate five false point targets generated by the jammer. The results are shown in Figure 11. It can be observed that the error causes the false point targets to shift in the azimuth direction, which is attributed to the premature operation of the jammer. The theoretical azimuth deviation is consistent with the azimuth beam displacement length induced by the squint angle error. After theoretical derivation and the incorporation of a phase compensation term, the range error can be effectively corrected. The theoretical range deviation is related to the relative geometry between the false point targets and the jammer, as well as the squint angle error.

4.2. Simulation Experiment

To verify the theoretical validity of the method, we also utilize a total of 640 images with dimensions of 16 × 5 × 4 × 2 to evaluate the robustness of three metric criteria in detecting slight distortions that are not perceptible to human eyes. Figure 12 presents selected sample examples.
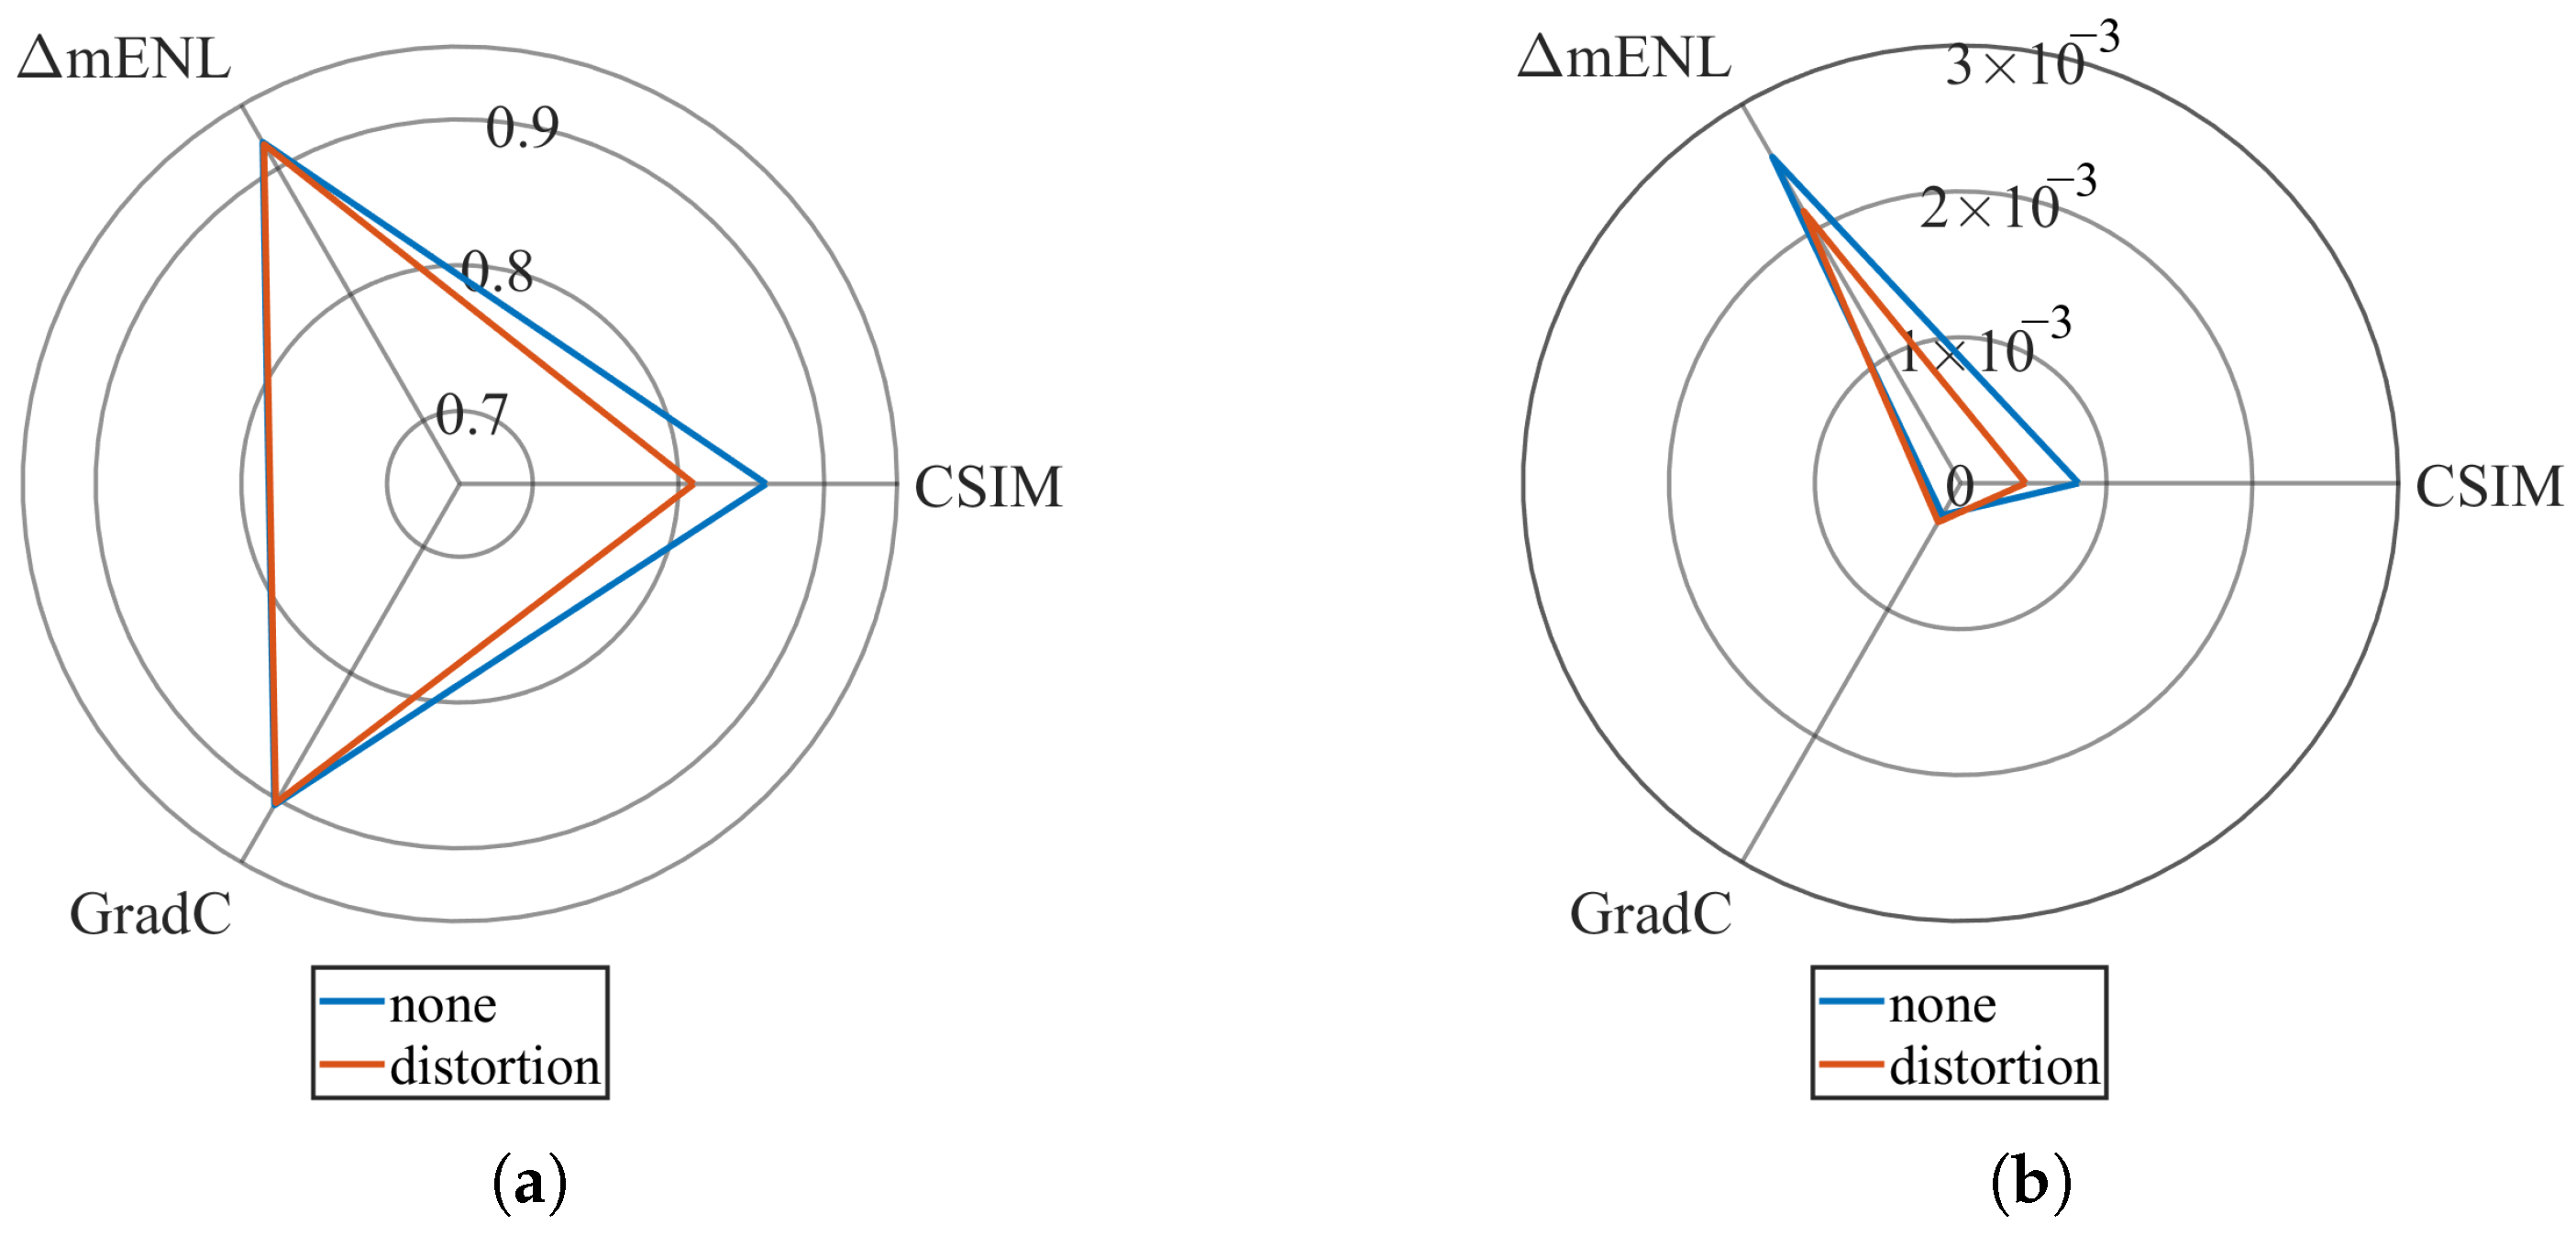
From a statistical perspective, if distortions significantly affect the measurement outcomes, we should observe substantial variations in the sample statistics. Therefore, we computed the means and variances of all three metrics extracted from images before and after distortion, with the results presented in Figure 13. The mean diagram characterizes the robustness of three metrics, while the variance plots reflect their discriminative capability under different error conditions. The blue line represents the image without distortion, while the red line corresponds to the image with slight distortion.
As shown in Figure 13a, the mean values of Δ mENL and GradC remain virtually unchanged after distortion. Although CSIM exhibits a decrease of approximately 0.4, it still maintains relatively high values overall, demonstrating considerable robustness. Figure 13b reveals that both Δ mENL and CSIM show reduced variance after distortion, indicating diminished discriminative ability.
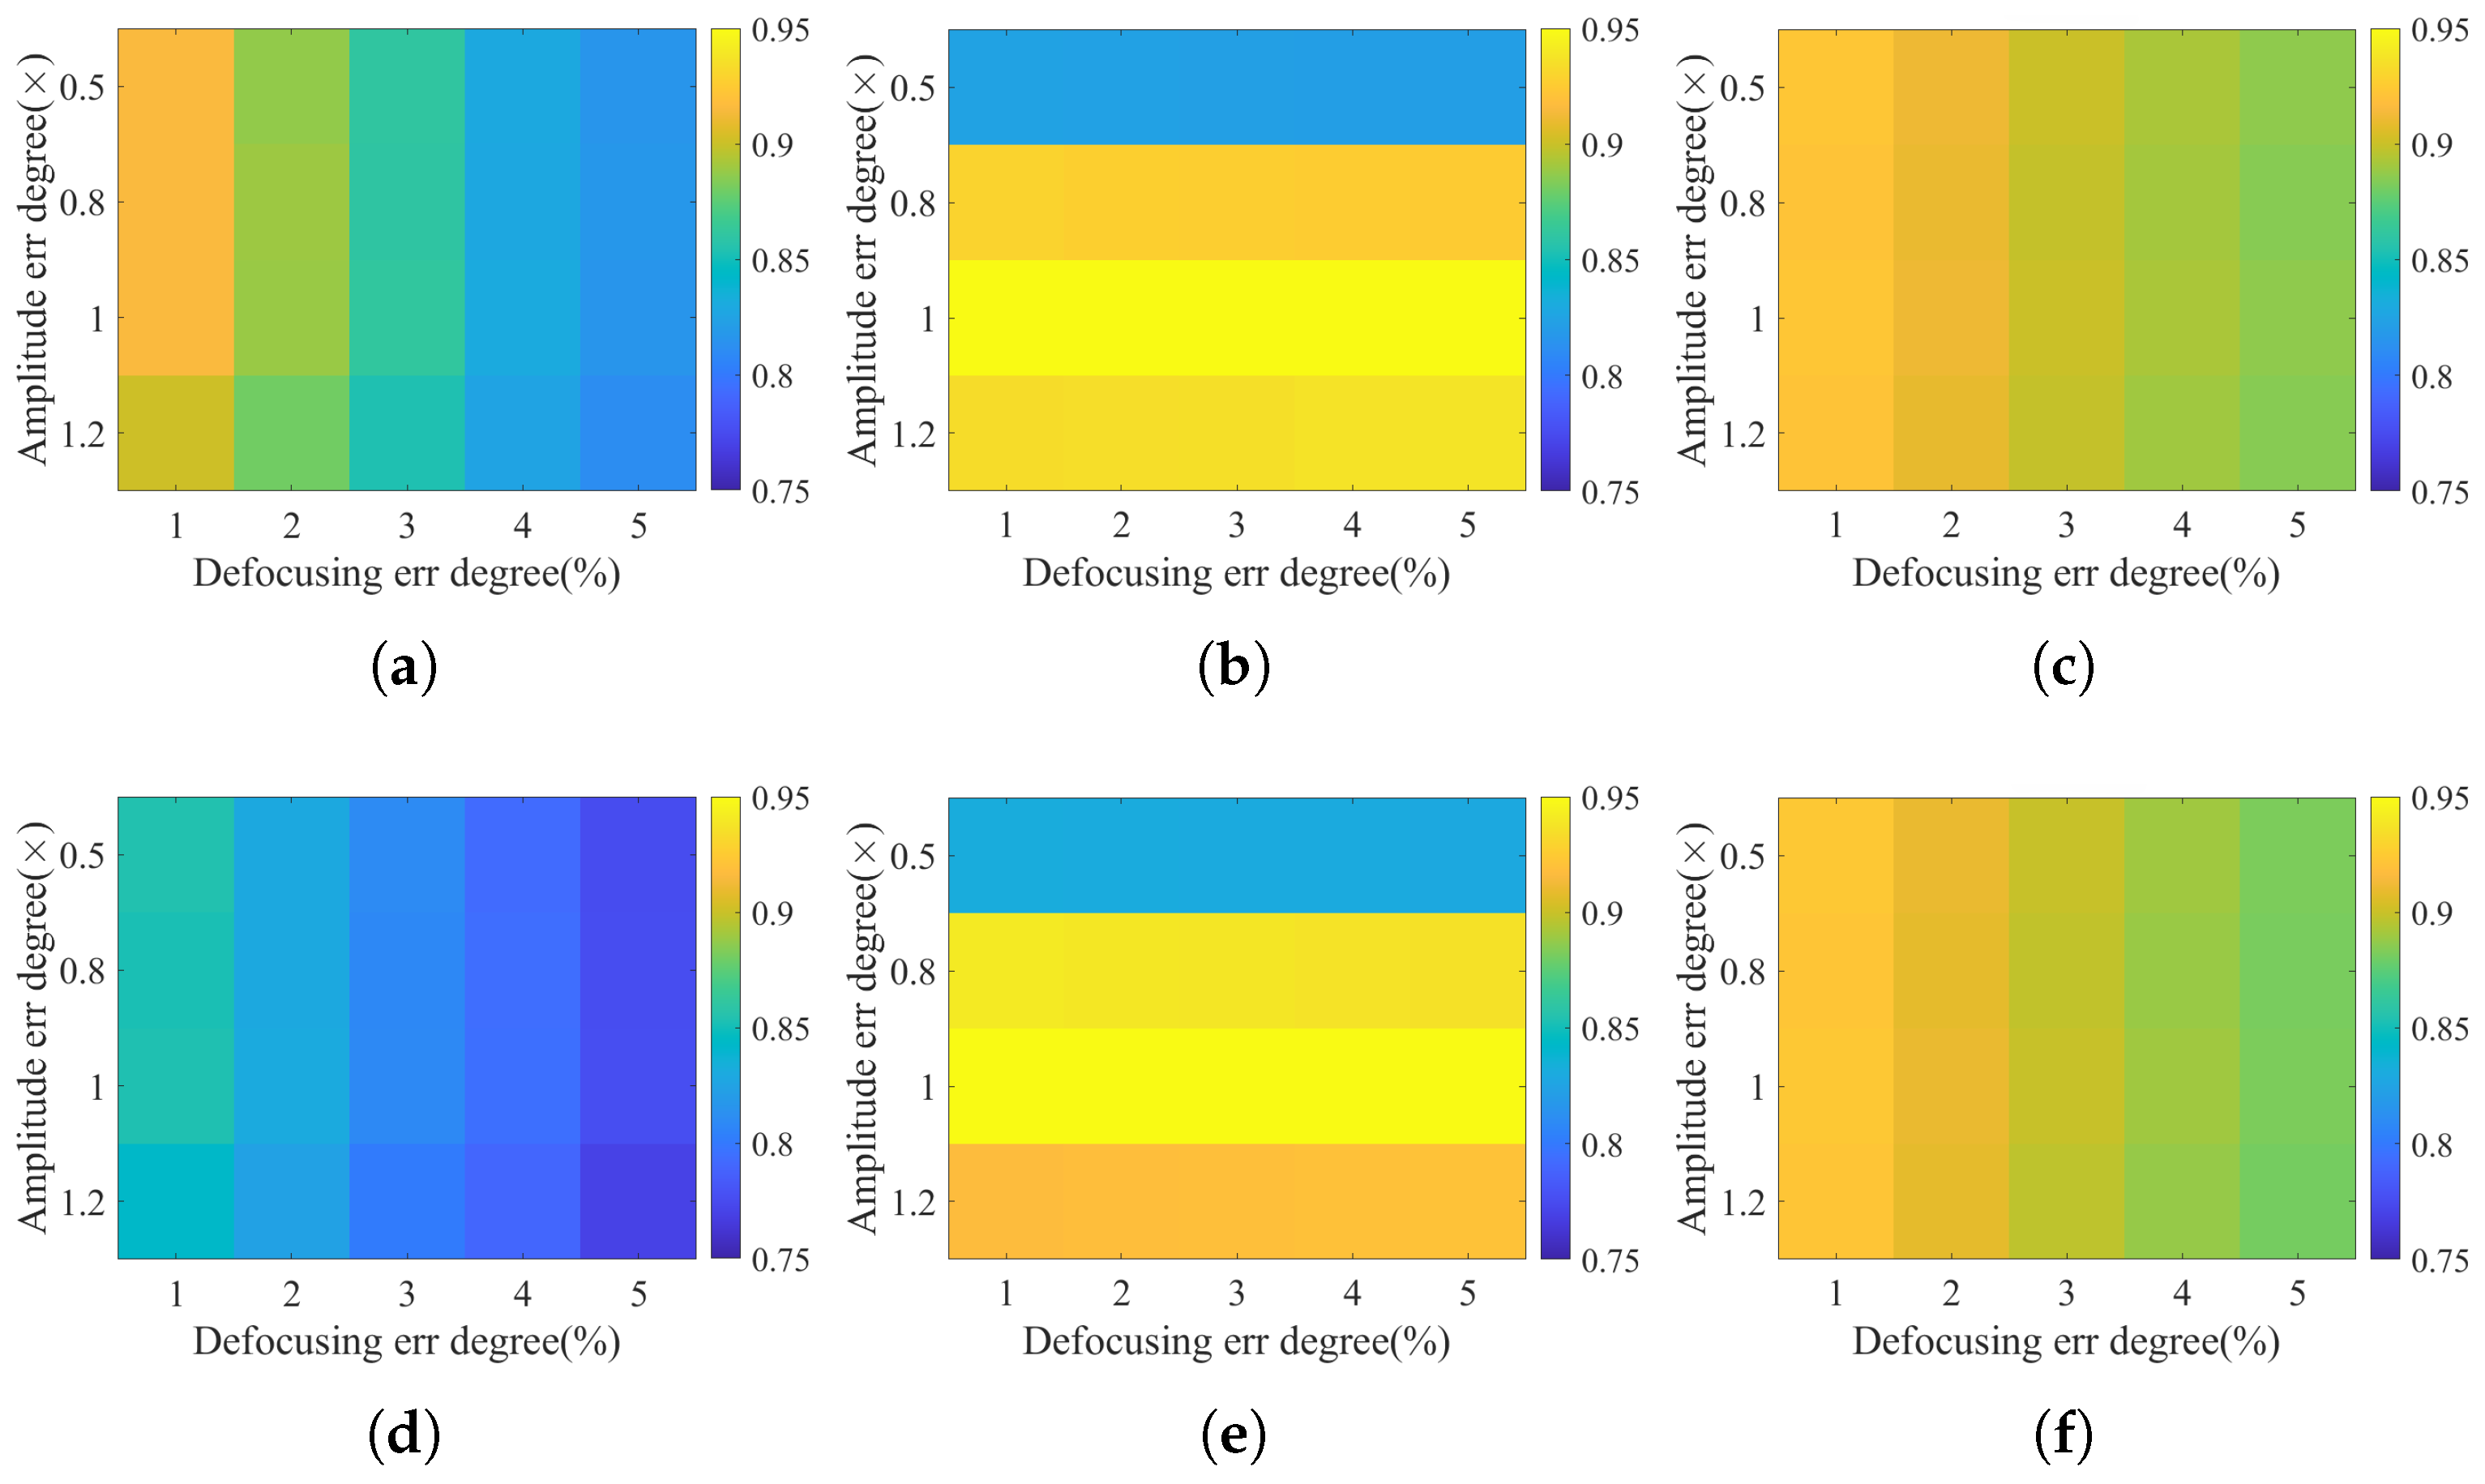
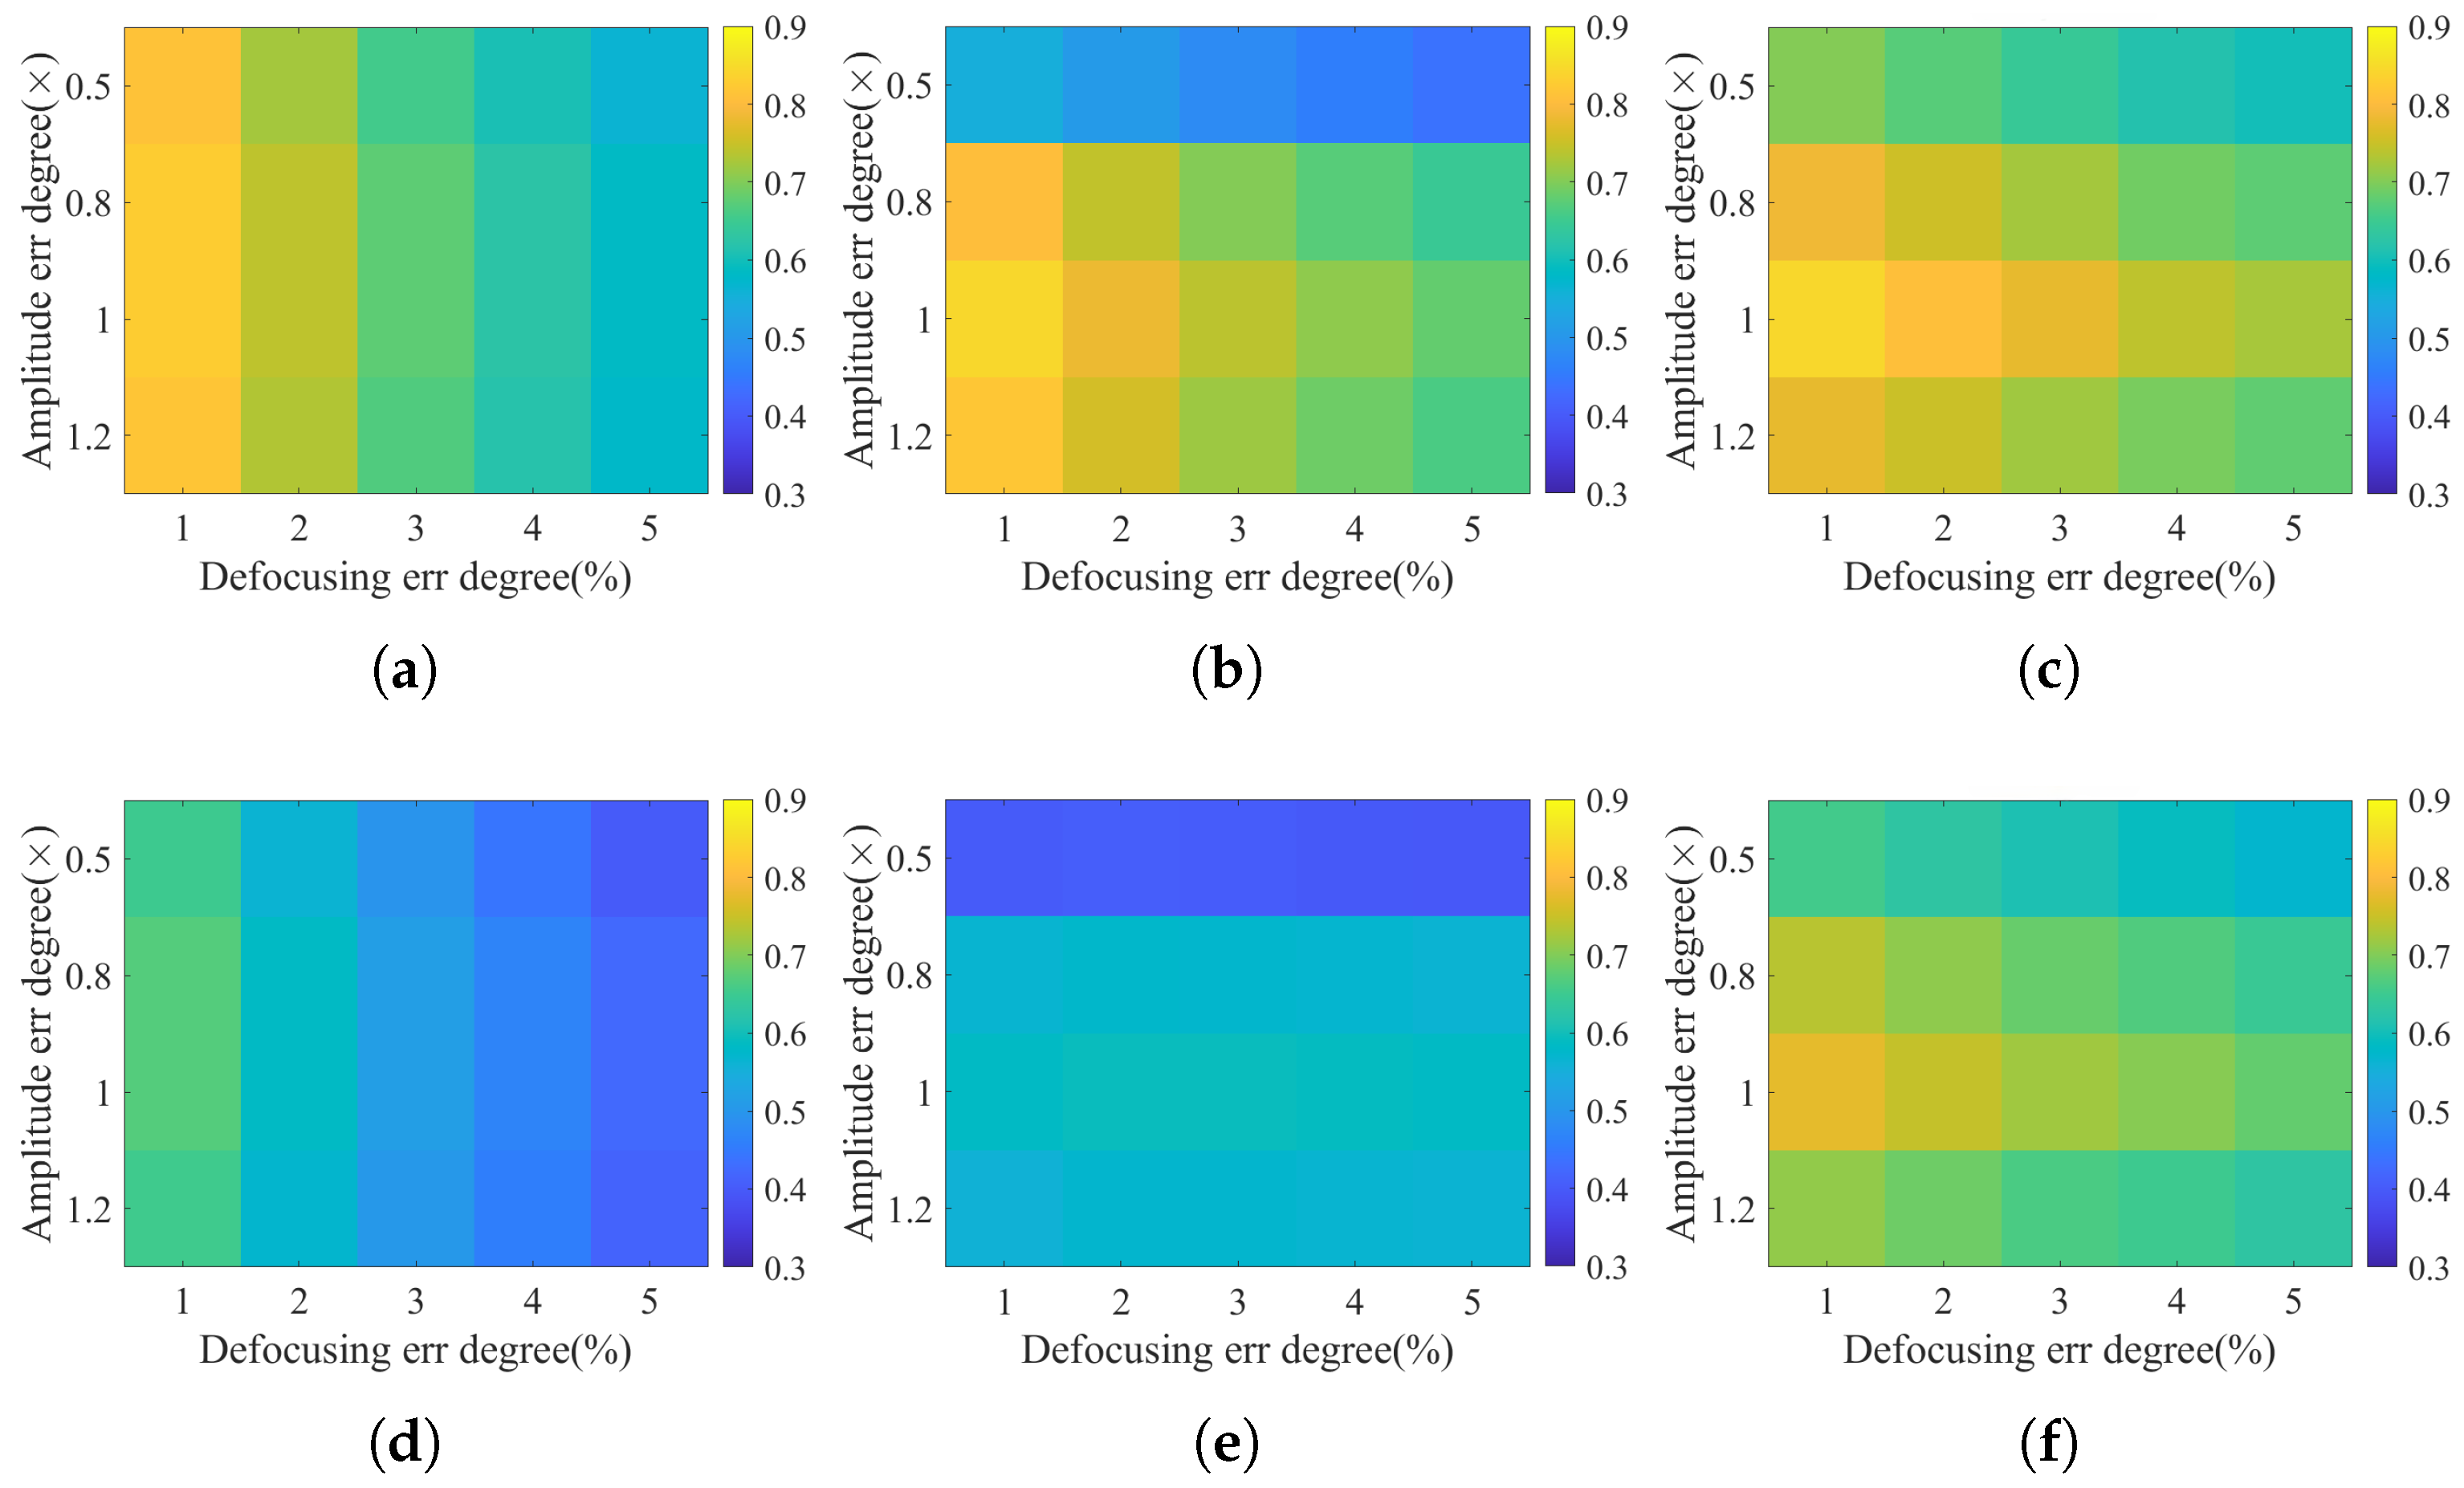
Therefore, to further investigate the degradation in the metrics’ discriminative ability, we generated more intuitive luminance maps of metric results under varying error conditions. As illustrated in Figure 14, the error ranges under investigation include
Luminance errors: [ 0.5 × , 0.8 × , 1 × , 1.2 × ] .
Range-chirp rate and velocity errors: [ 1 % , 2 % , 3 % , 4 % , 5 % ] .
Firstly, analysis of luminance variation patterns reveals that within the simulated parameter range, CSIM remains invariant along the vertical axis while exhibiting variations along the horizontal axis, indicating its insensitivity to overall image amplitude but high sensitivity to defocusing parameters. Conversely, Δ mENL demonstrates opposite characteristics—insensitivity to defocusing but pronounced sensitivity to amplitude. These two metrics exhibit complementary properties that align well with our design. As for GradC, similar to CSIM, it demonstrates overall sensitivity to defocus while remaining robust to variations in brightness. Theoretically, changes in brightness do not affect gradient directions, whereas defocus leads to alterations in gradient patterns, particularly in image details. This observation is consistent with the simulation results.
Secondly, it can be observed from the metric changes before and after distortion in Figure 14 that Δ mENL , GradC exhibit remarkable robustness against distortions, whereas CSIM suffers from feature degradation. The CSIM is computed by measuring the edge distance between two images. When distortion occurs, an increase in edge distance is inevitable, which aligns with our expected results. To enhance robustness against distortion, we can reduce parameter ϵ . However, this action would simultaneously decrease the method’s sensitivity to defocusing, which will inevitably lead to a degradation in discriminative capability.
To demonstrate that the proposed method possesses superior applicability and robustness while avoiding excessive tolerance for extremely poor-quality images, we conducted the following comparative experiments using SSIM and the specifically normalized Δ ENL as contrast methods. The specific simulation errors are shown in Table 2.
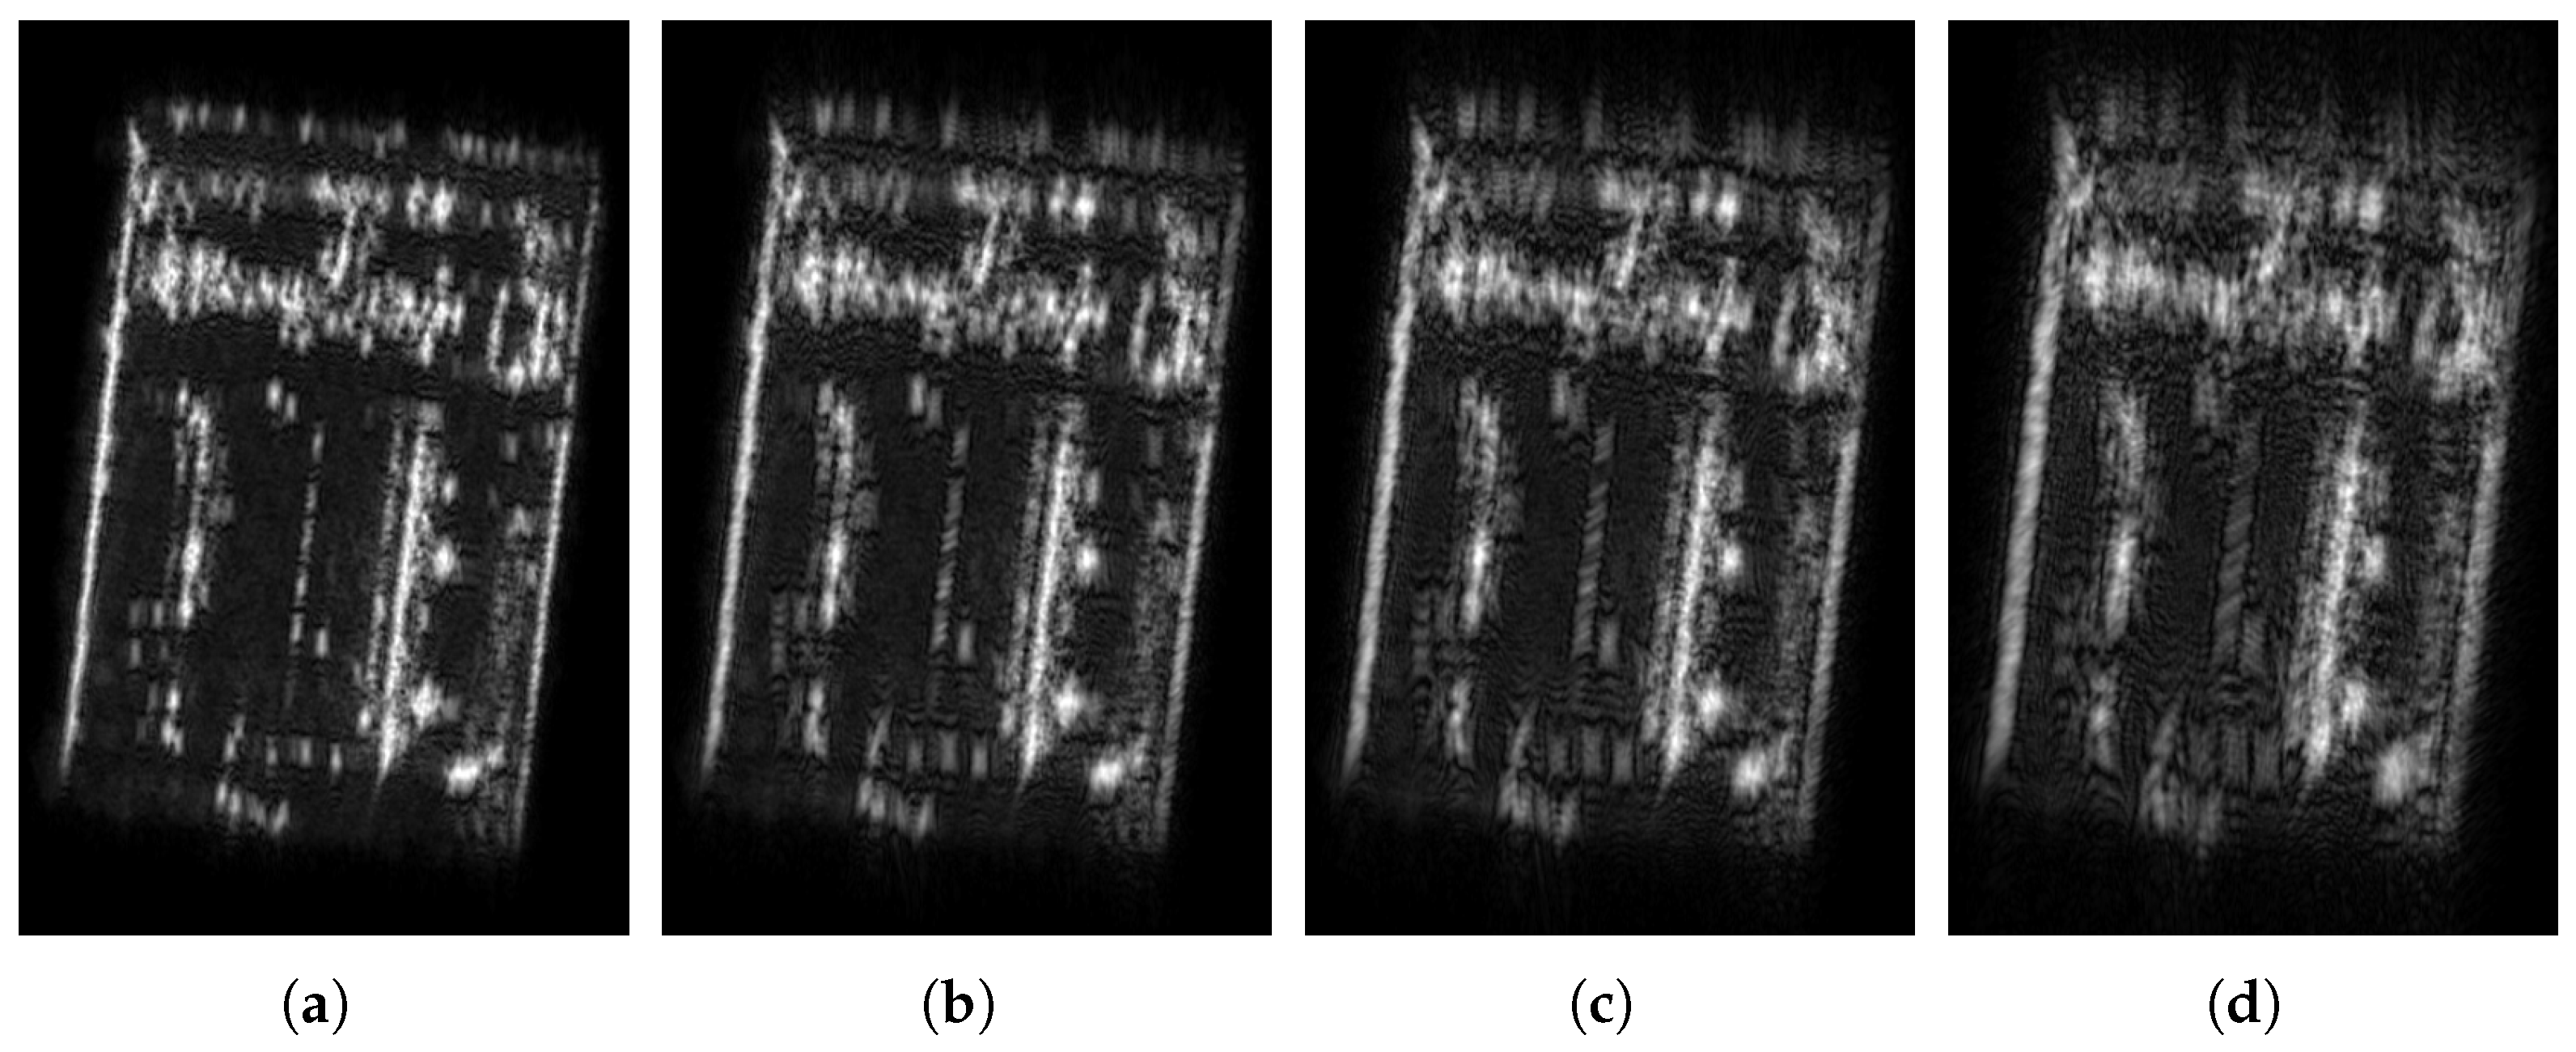
Firstly, this paper evaluates false targets with different velocity errors and range chirp rate errors. The sample image to be evaluated is shown in Figure 15. The following is a table showing the evaluation results under different defocusing errors.
It can be observed from Table 3 that the evaluation results of both the proposed method and the comparison methods decrease as the defocusing error increases. This suggests that the proposed method possesses an evaluation capability comparable to that of conventional methods. Furthermore, the proposed method exhibits results that are comparable to those of SSIM under varying degrees of defocusing. However, the evaluation results of Δ ENL demonstrate greater ability to distinguish false objects. Consequently, in cases of low defocusing error, the evaluation results of Δ ENL show minimal differences compared to other methods, whereas in cases of high defocusing error, the results align more closely with subjective judgment.
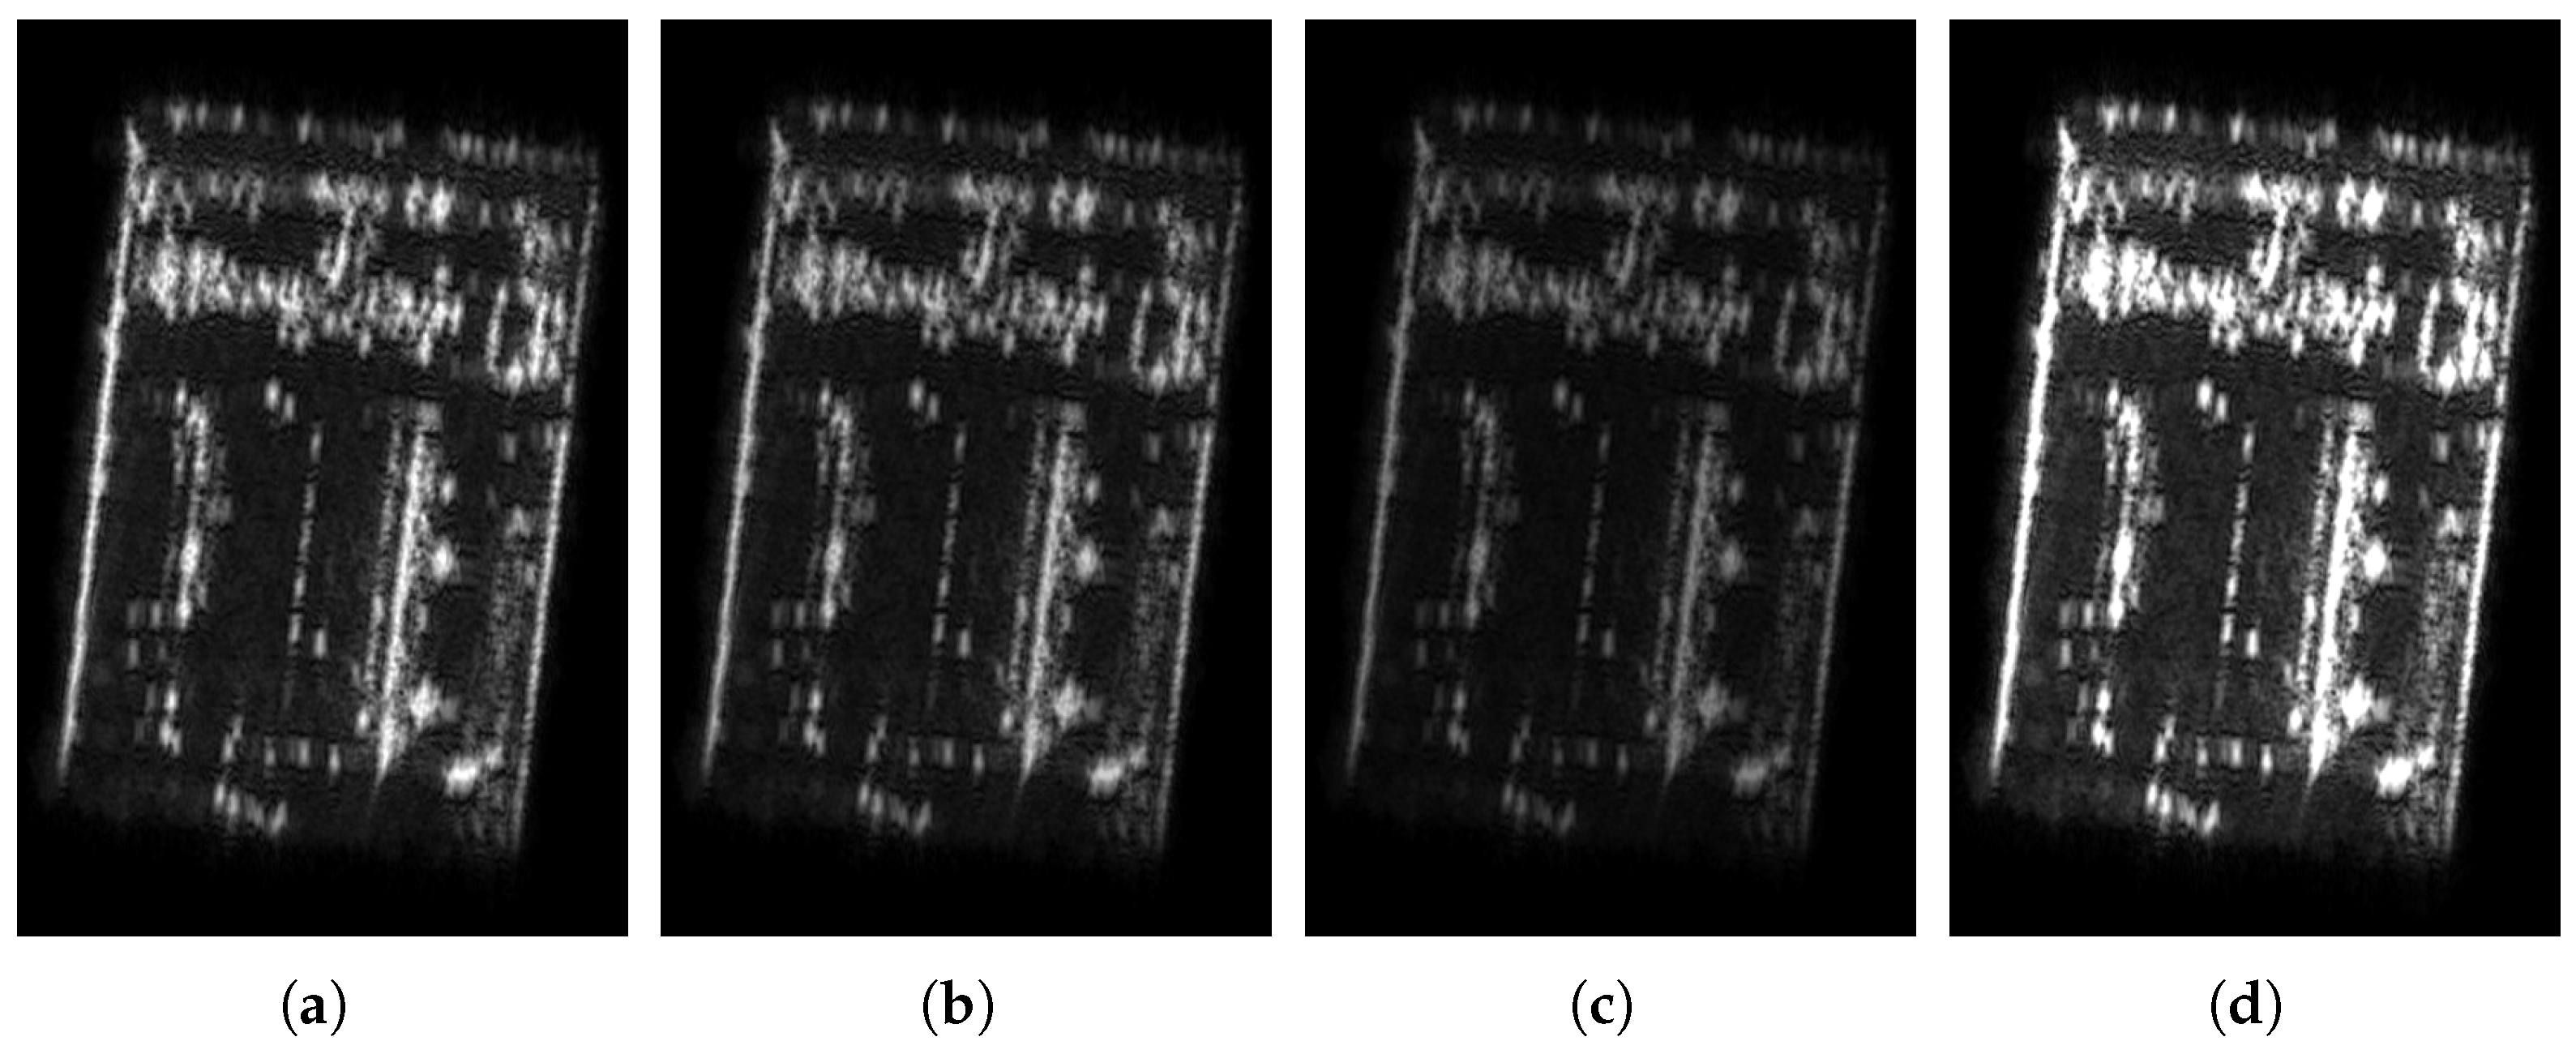
Secondly, we also evaluate SAR images with different magnitude errors, aiming to demonstrate that the proposed method can align with the characteristics of human visual perception effectively. Group 5 to Group 7 in Table 2 shows different amplitude error settings in simulation.
Taking the SAR image in Figure 16a as a reference, as can be seen from Figure 16b, the slight overall amplitude variation is still within the tolerance of human perception. However, excessively high amplitude changes can also affect subjective judgment, such as Figure 16c,d.
From a subjective perspective, Figure 16c exhibits lower similarity to the original image compared to the other groups because of higher amplitude error, and the evaluation results in Table 4 show that both SSIM and the proposed method can effectively evaluate amplitude error in SAR image, and their evaluation values in Group 6 are significantly smaller than other groups. On the contrary, Δ ENL has an obviously poor ability to evaluate amplitude changes.
In addition, when the brightness increases significantly, the relatively bright false target will create a greater sense of separation from the environment, resulting in a decrease in realism. It can be analyzed from Group 7 that the proposed method can be effectively evaluated, while the SSIM is insensitive to changes. It is worth mentioning that due to the limitation of maximum value at the pixel level, the statistical changes of images are inconsistent, which leads to significant changes in the evaluation results of Δ ENL .
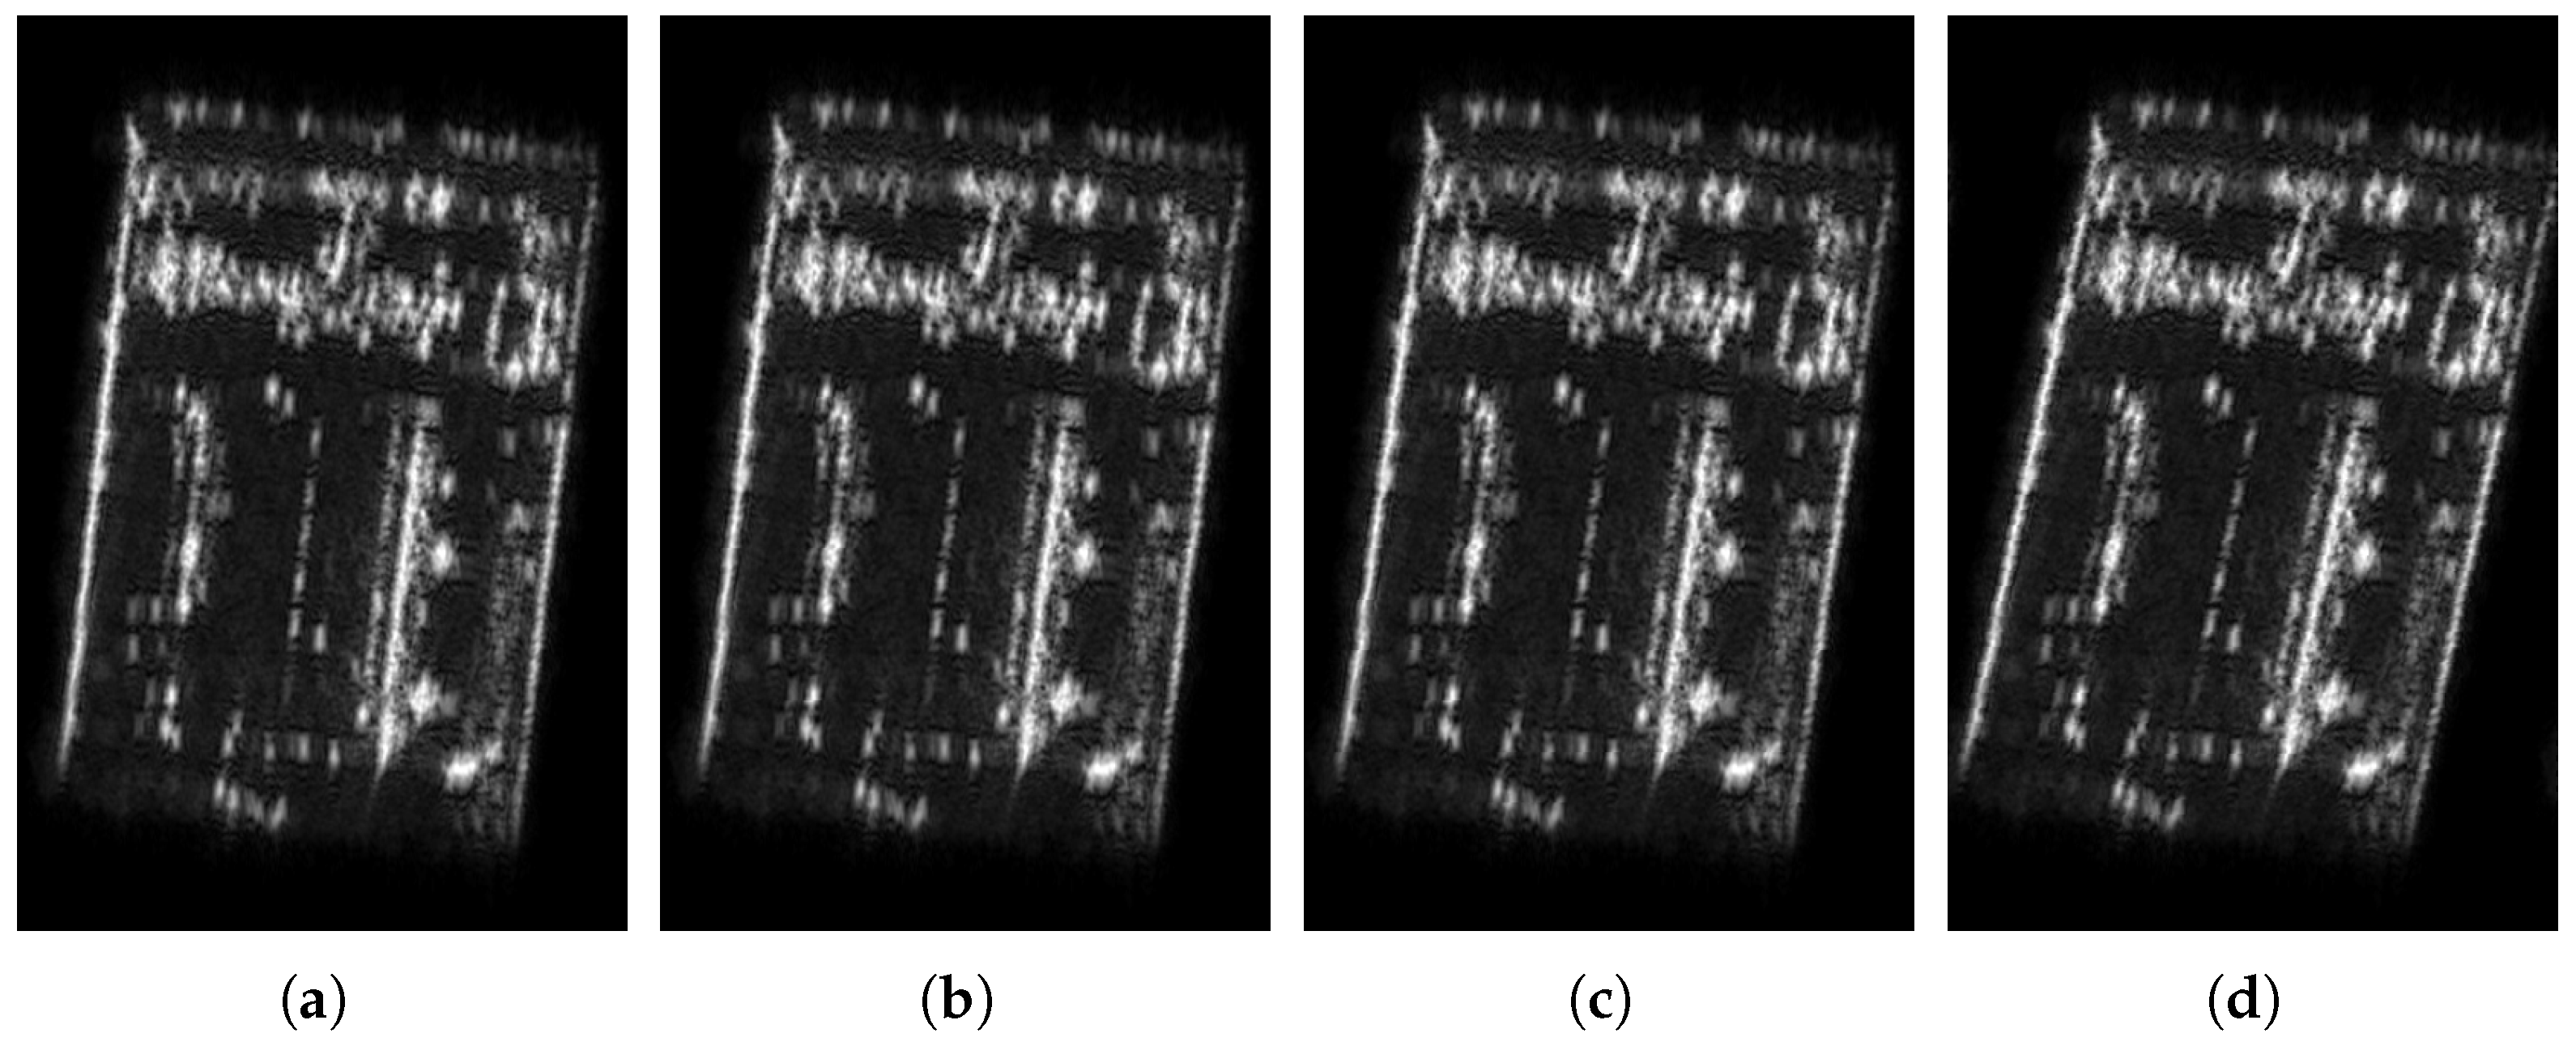
Thirdly, we verify the anti-distortion ability of proposed method. It can be seen from the sample image in Figure 17 that the contour differences between the images of Groups 8, 9, and the reference image are not obvious, whereas distortion can be observed in Figure 17d from the subjective perspective.
The evaluation results listed in Table 5 demonstrate that SSIM is highly sensitive to distortion and Δ ENL indicates obviously insensitive to distortion. This is because the SSIM involves pixel-level image comparison, whereas Δ ENL is solely associated with the mean and variance of the image. The method proposed in this paper is influenced by threshold ϵ regarding distortion. Under the condition of ϵ = 0.25 , the proposed method maintains stable evaluation outcomes in the presence of minor distortions, while exhibiting a clear reduction in scores under more severe distortions. This consistency with human visual perception highlights the method’s ability to align objective evaluation with subjective judgment.
Based on the above simulation results, we can draw a conclusion that when a particular error exhibits significant deviation, traditional evaluation methods diverge from human subjective judgment. For instance, drastic brightness changes render Δ ENL meaningless for evaluation, while minor distortions lead to poor SSIM evaluation results. In contrast, the method proposed in this paper effectively evaluates these extreme cases, demonstrating stronger robustness.
Ultimately, to prove the universality of proposed method, we conducted a comparative analysis between CSIM, Δ ENL , and our proposed method by generating luminance maps before and after slight distortion under varying error conditions, as depicted in Figure 18.
A comparison of the three evaluation results without distortion reveals that SSIM can distinctly differentiate between various types of errors. Δ ENL effectively distinguishes different defocusing errors but is nearly incapable of differentiating amplitude errors, as a 0.5× amplitude variation far exceeds the range of subtle brightness changes and severely compromises imaging quality. Consequently, our proposed method loses its discriminative ability in evaluation at 0.5× amplitude. In practice, the significantly degraded imaging results inherently obviate the need for further performance evaluation.
When distortion is introduced, it becomes evident that SSIM undergoes significant changes and loses its evaluation capability. Meanwhile, Δ ENL exhibits an overall decline in mean values while still suffering from amplitude insensitivity. In contrast, the proposed method remains capable of effectively assessing different errors within a certain range, demonstrating superior robustness compared to the aforementioned two approaches.
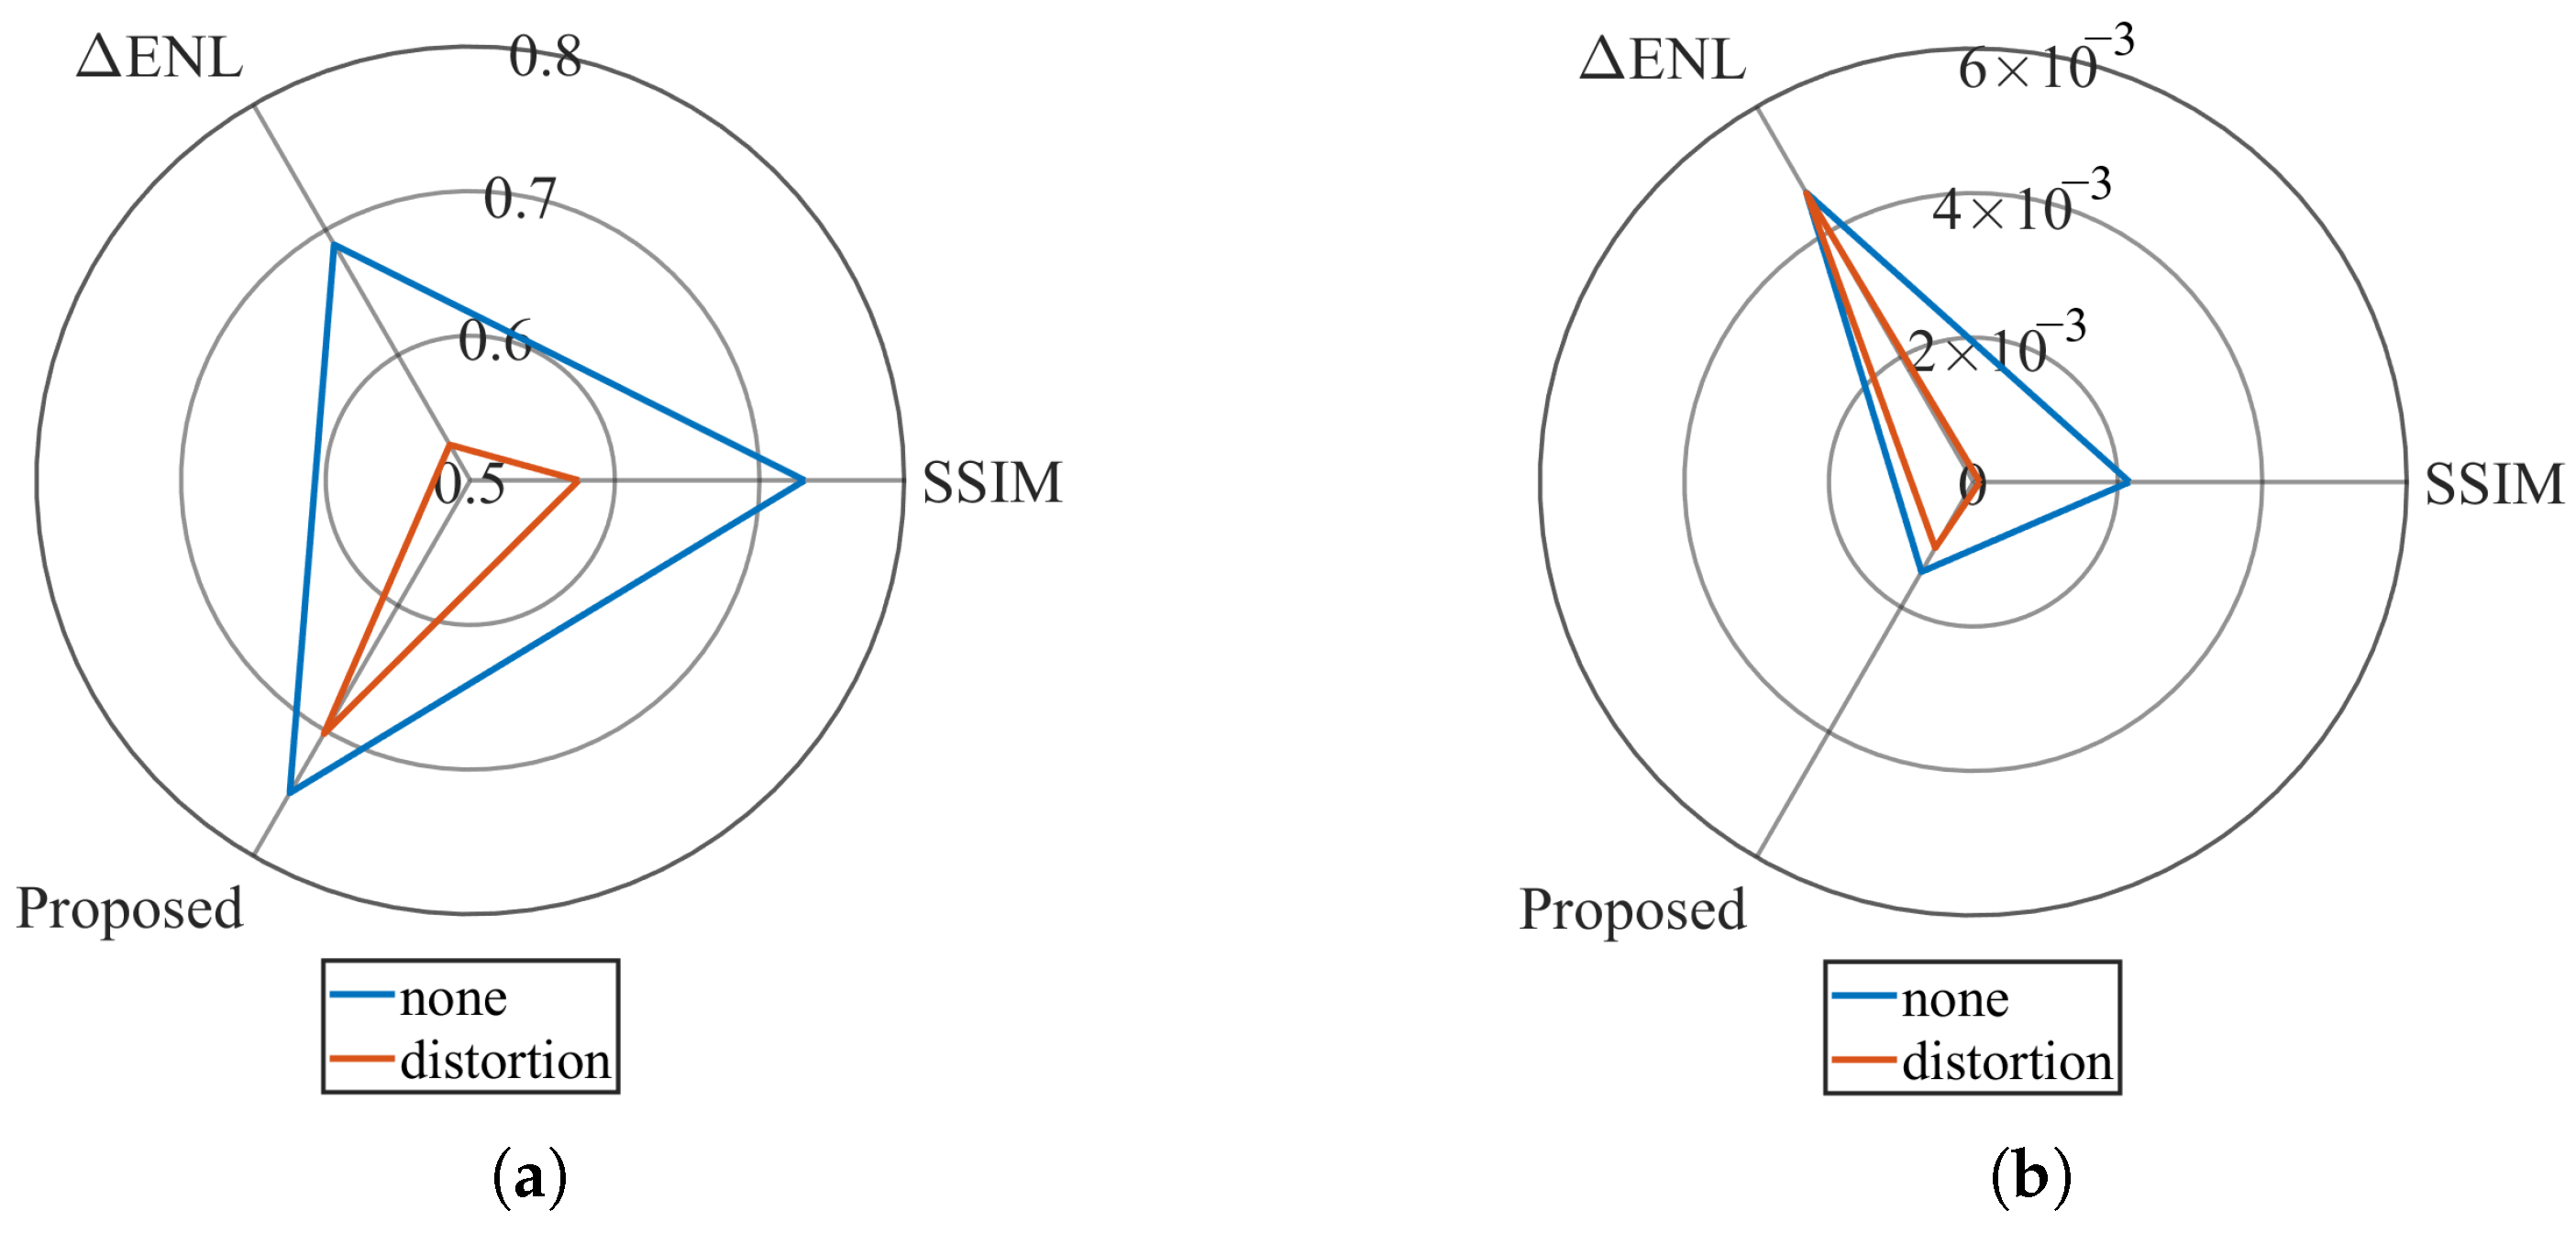
As shown in Figure 19, we also plotted the mean-variance polar coordinate diagrams for the three methods, which more intuitively demonstrates the superiority of the proposed method over SSIM and Δ ENL .
It is worth noting that ENL is solely determined by the ratio of the mean to the variance between two images. Theoretically, distortion should have negligible impact on the mean–variance ratio of an image. However, experimental validation revealed that the Δ ENL for distorted samples was significantly lower than that for original samples. This phenomenon can be attributed to the Δ ENL normalization method processed in this study, specifically defined as
Δ ENL = 1 1 2 μ 1 2 σ 1 2 μ 2 2 σ 2 2 ,
where μ 1 , μ 2 represents the mean value of the reference image and the image to be evaluated. σ 1 , σ 2 represents the standard variance of the reference image and the image to be evaluated.
From Equation (31), it can be observed that the normalization method employed in this paper only guarantees that the final result does not exceed 1, without imposing any lower bound constraint. Therefore, under the combined effects of Δ ENL ’s inherent sensitivity to low-variance images, non-standardized normalization, and subtle variance variations induced by distortion, the final Δ ENL ’s statistic exhibits significant fluctuations.

4.3. Real SAR Jamming Experiment

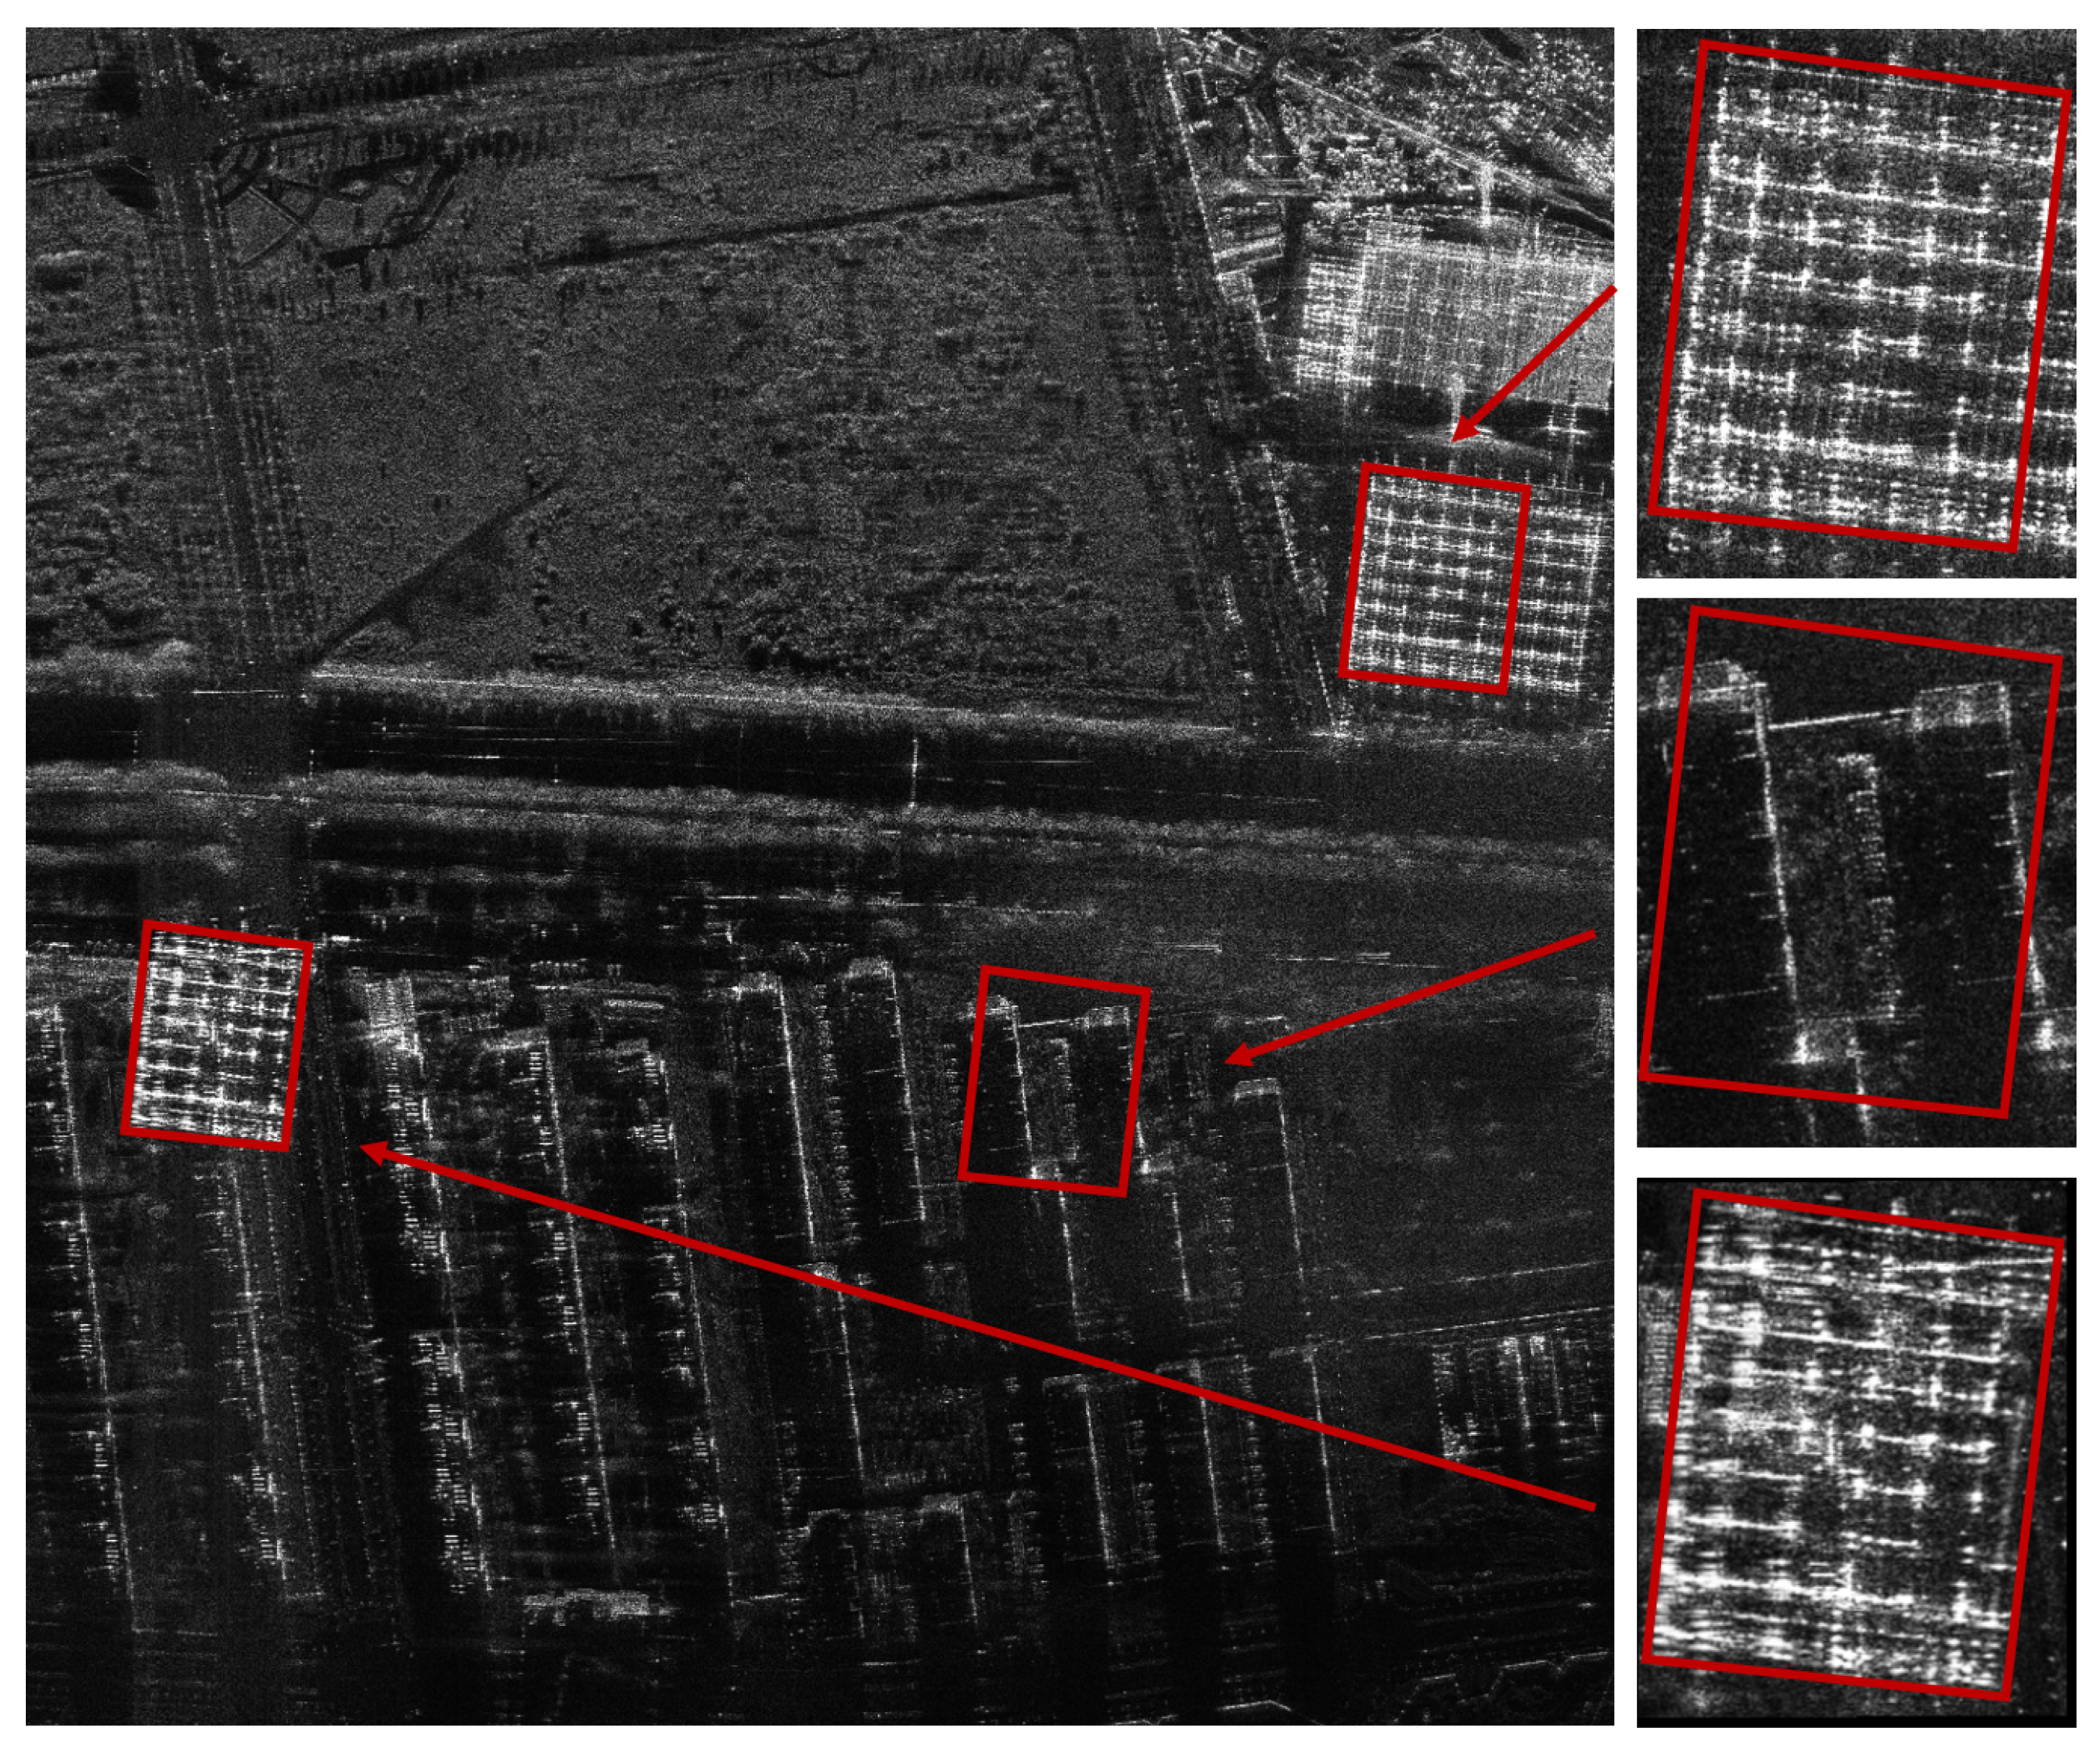
In this section, we evaluated the real SAR jamming result using the proposed method, SSIM, and Δ ENL . The SAR data collection was conducted in the Yanqing area of Beijing, China, during July 2024. This flight utilized X-band SAR with a bandwidth of 300 MHz, and the unmanned aerial vehicle operated at an altitude of 450 m. The initial flight successfully acquired SAR images without any jamming, as illustrated in Figure 20. Subsequently, the same SAR flight path was repeated, and a SAR jammer was deployed at the designated five-pointed star location. The jammer operated with a frequency range of 8–12 GHz. Through the parameter configuration of the jammer, it was determined that the measurement errors for the parameters f 0 , K r , V r , and R 0 were all below 1%. The resulting imaging is presented in Figure 21. The jammer’s template was generated based on the building structures identified in the original SAR images.
As illustrated in Figure 21, from top to bottom, the components are arranged sequentially as follows: the real template, the random area, and the false target. The subjective judgment indicates a relatively high similarity between the false target and the real template, and the evaluation results of the three assessment methods are presented in the Table 6. All experimental images were registered using the cross-correlation method to ensure alignment consistency prior to evaluation. We also selected a random area to verify the effectiveness of the proposed method.
To evaluate similarity, the jamming region was registered with the reference (template) region, and multiple methods were applied for comparison. The proposed method achieved a similarity score of 0.6478, indicating a moderate and balanced performance. In contrast, the Δ ENL yielded a higher score of 0.8173, while SSIM produced a lower value of 0.4603—both inconsistent with human visual perception. We further evaluated the unregistered (pre-registration) images. As expected, the SSIM score dropped significantly to 0.0163, and the Δ ENL fluctuated drastically to 0.9446 due to its simplistic evaluation principle, rendering both measures unreliable in this context. In comparison, the proposed method maintained a relatively high score of 0.6144, demonstrating greater robustness and consistency. Finally, similarity assessment was performed on randomly selected regions to verify that, like the other methods, the proposed approach correctly distinguishes unrelated regions by yielding low similarity scores, confirming its discriminative capability.
These results indicate that the proposed method not only possesses the fundamental discriminative capability required for SAR imagery, but also offers superior robustness compared to pixel-based methods and more stable evaluation performance than statistical-based methods. More importantly, its closer alignment with expert subjective judgment highlights its practical value for reliable and consistent assessment in real-world SAR deception jamming scenarios.

5. Discussion

5.1. The Selection of Parameter ϵ in CSIM

This study verifies the effectiveness of the proposed evaluation method through both simulation and real SAR jamming experiments. Using 640 test images with slight distortions, the results show that Δ mENL and GradC remain robust, while CSIM exhibits sensitivity to defocusing but reduced robustness against distortions. By analyzing luminance maps and statistical characteristics, we demonstrate the complementary nature of Δ mENL and CSIM, and the balanced performance of GradC. Furthermore, by examining the weight function, in theory, when the parameter ϵ approaches zero, the weights assigned to all distances converge to 1. In this case, CSIM loses its discriminative evaluation capability but exhibits extremely high robustness. Conversely, when the ϵ approaches infinity, only the weight corresponding to zero distance is equal to 1, while all others become zero. Under this condition, CSIM achieves very strong evaluation capability but with the weakest robustness.
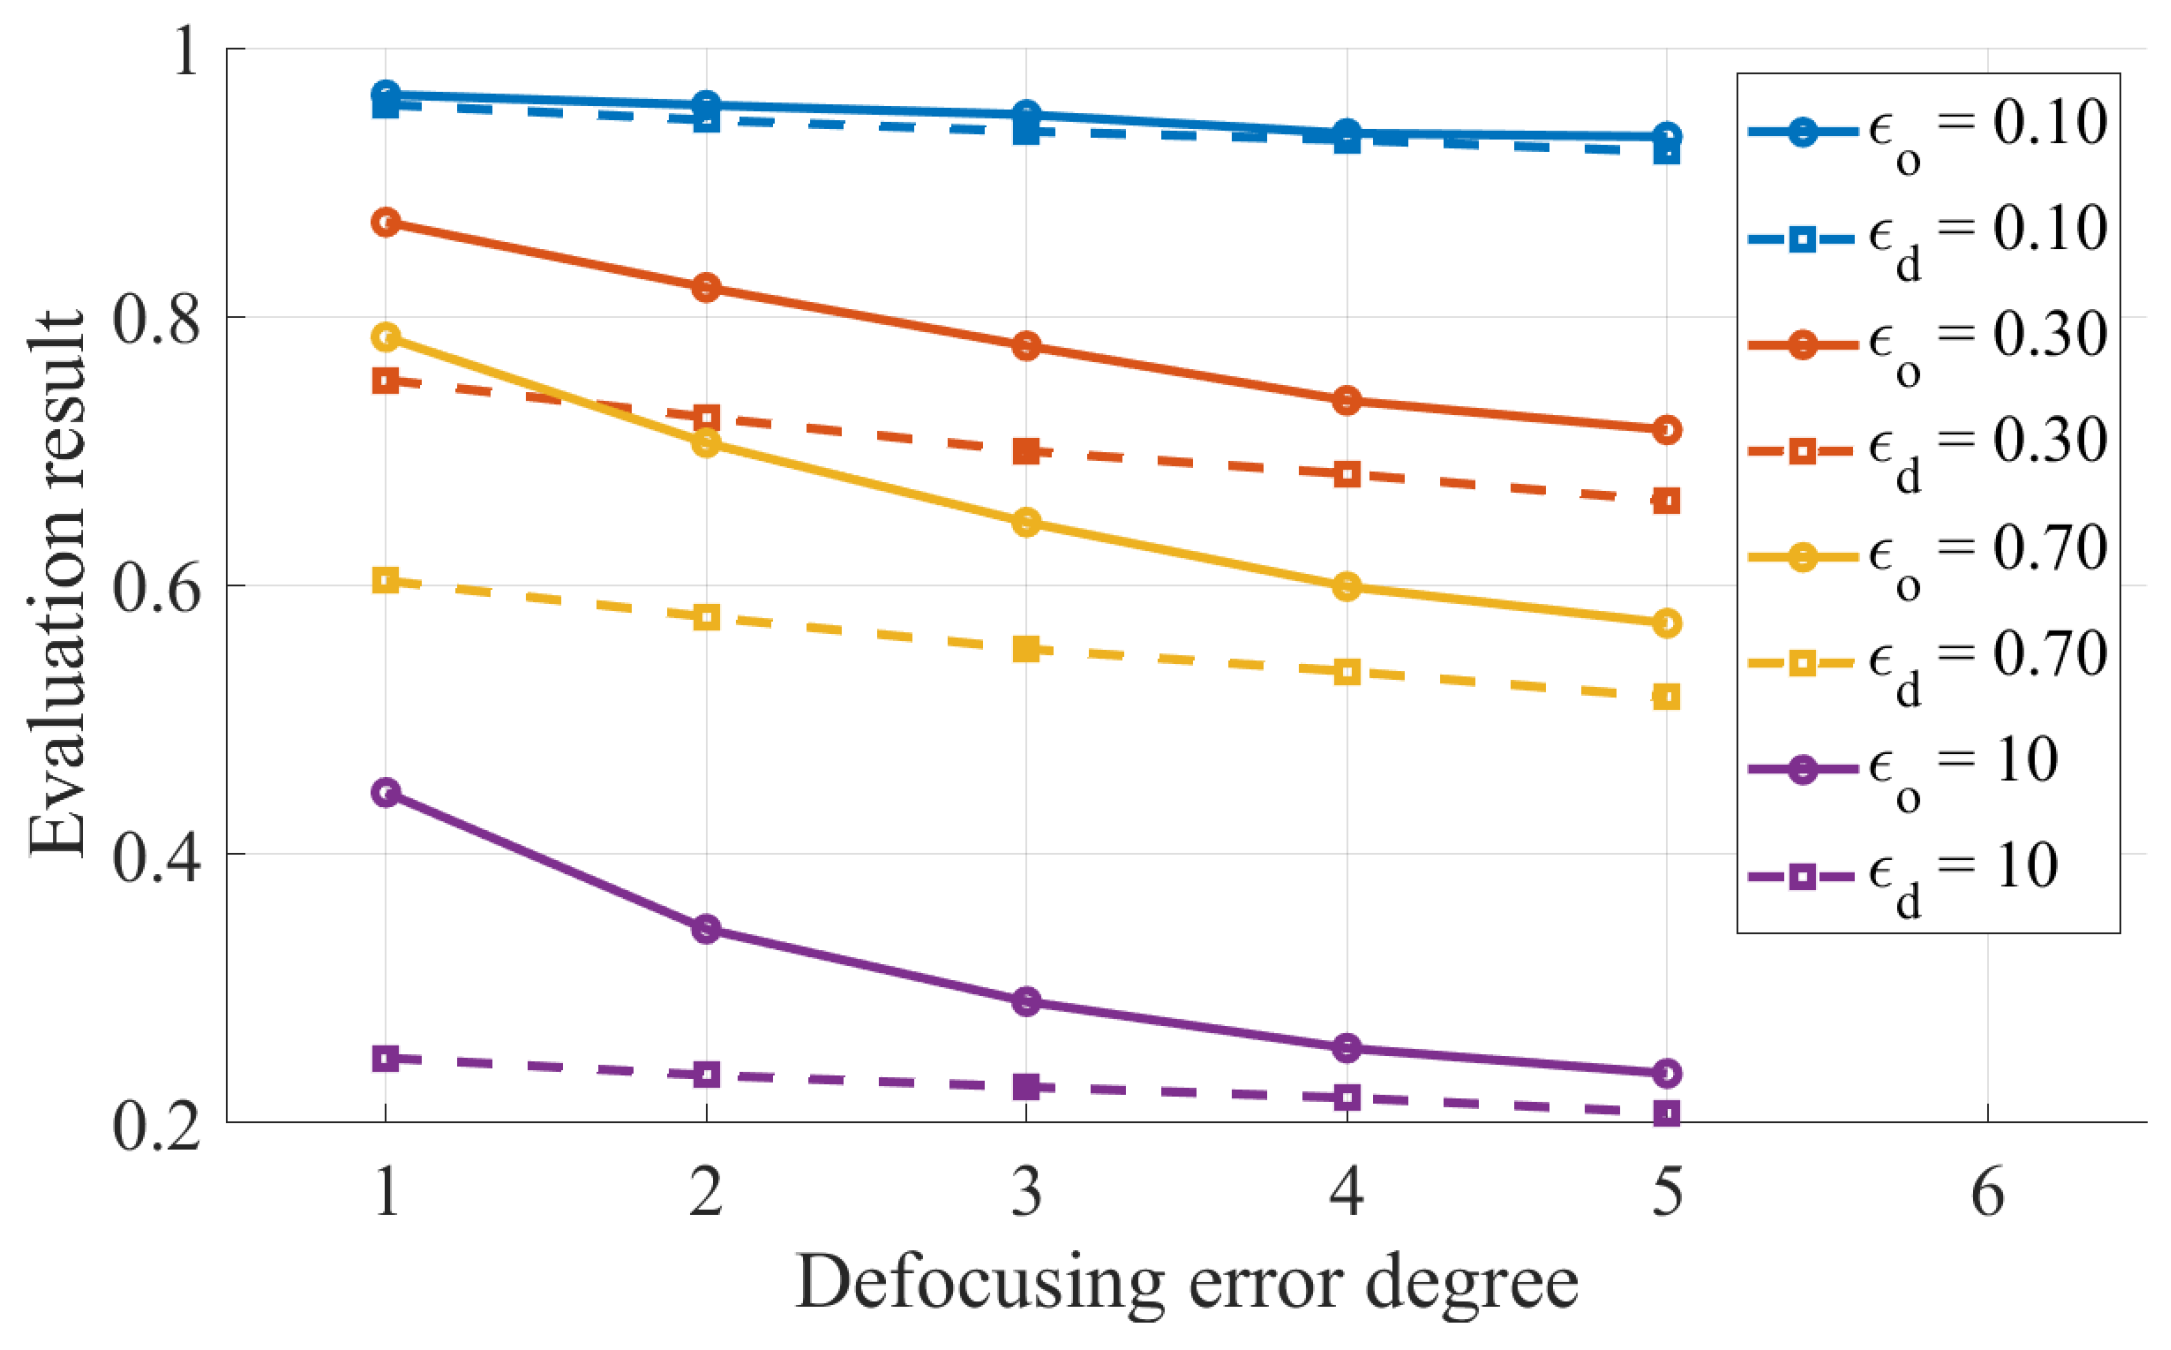
In addition, as shown in Figure 22, we plotted the CSIM evaluation results under different parameter settings, where ϵ o , ϵ d denote the parameter settings before and after distortion, respectively. The simulation curves under varying parameters reflect the aforementioned characteristics consistently. To determine an appropriate parameter value, we established equations to characterize the robustness and evaluation capability of CSIM as follows:
R = σ o σ d σ o , E c = σ o + σ d μ o + μ d , A b i l i t y = R 2 + 1 E c 2 ,
where σ o , σ d denote the standard deviations of the evaluation results before and after distortion, respectively, and μ o , μ d denote their corresponding mean values. These equations capture the two extreme cases of CSIM. A smaller R indicates stronger robustness, a larger E c indicates stronger evaluation capability, and a smaller A b i l i t y implies a better overall balance between the robustness and evaluation capability.
Based on the aforementioned formula, we plotted the scatter distribution of R versus 1 / E c for ϵ set to [ 0.1 , 0.15 , 0.25 , 0.3 , 0.4 , 0.55 , 0.7 , 5 , 10 ] . As shown in Figure 23, points closer to the origin correspond to stronger overall capability.
It should be noted that although ϵ = 0.1 and ϵ = 10 do not strictly correspond to the limits of ϵ 0 and ϵ , they can be regarded as practical approximations of the two extreme cases for images with finite size in this work. The results show that ϵ = 0.25 provides a balanced performance. Therefore, this paper comprehensively considers CSIM’s robustness to slight distortions and its sensitivity to defocusing, ultimately selecting ϵ = 0.25 as the final evaluation parameter.

5.2. Comparison with Traditional Methods

Compared with conventional measures such as SSIM and Δ ENL , the proposed method shows closer consistency with human visual perception. Specifically, SSIM is overly sensitive to minor distortions, while Δ ENL is insensitive to amplitude errors. In contrast, our method maintains stable evaluation across amplitude variations, defocusing errors, and distortions, effectively bridging the gap between pixel-based and statistical-based approaches. Importantly, in real SAR jamming experiments, it demonstrated superior robustness to registration errors and more reliable alignment with expert judgment, underscoring its practical applicability.

5.3. Limitations

Nevertheless, some limitations remain. The robustness analysis was conducted under a limited set of error conditions and image resolutions, and the parameter ϵ is only based on the entire image set, which may not generalize across all SAR imaging scenarios. Moreover, Strategies based on statistics may not be applicable to some images.

6. Conclusions

Current deception jamming evaluation methods lack research on subtle distortions imperceptible to the human eye. This paper proposes a performance evaluation method that comprehensively considers edge information, amplitude variations, and texture. The edge-based CSIM can tolerate minor distortions while effectively detecting significant ones, and the amplitude and texture measures ( Δ mENL and GradC) complement CSIM with strong robustness. Simulation experiments confirm that the proposed method maintains consistency with subjective judgment even under extreme error conditions, outperforming SSIM and Δ ENL . Practical experiments further validate the effectiveness of proposed method in engineering applications.
Future work will focus on extending the evaluation framework to more diverse SAR datasets and jamming scenarios for broader applicability. Adaptive parameter tuning for CSIM, systematic ablation studies, and subjective validation will also be pursued. In addition, computational efficiency and real-time feasibility should be investigated to support operational deployment.

Author Contributions

Methodology, H.X. and G.L. (Guangyuan Li); Validation, H.X. and G.L. (Guikun Liu); Investigation, H.X., L.L., Z.X., G.L. (Guikun Liu) and G.L. (Guangyuan Li); Data curation, L.L., G.L. (Guikun Liu) and G.L. (Guangyuan Li); Writing—original draft, H.X.; Writing—review & editing, H.X., L.L., Z.X., G.L. (Guikun Liu) and G.L. (Guangyuan Li). All authors have read and agreed to the published version of the manuscript.

Funding

This research received no external funding.

Data Availability Statement

The original contributions presented in this study are included in the article. Further inquiries can be directed to the corresponding author.

Conflicts of Interest

The authors declare no conflicts of interest.

References

  1. Moreira, A.; Prats-Iraola, P.; Younis, M.; Krieger, G.; Hajnsek, I.; Papathanassiou, K.P. A tutorial on synthetic aperture radar. IEEE Geosci. Remote Sens. Mag. 2013, 1, 6–43. [Google Scholar] [CrossRef]
  2. Chan, Y.K.; Koo, V. An introduction to synthetic aperture radar (SAR). Prog. Electromagn. Res. B 2008, 2, 27–60. [Google Scholar] [CrossRef]
  3. Li, N.-J.; Zhang, Y.-T. A survey of radar ECM and ECCM. IEEE Trans. Aerosp. Electron. Syst. 1995, 31, 1110–1120. [Google Scholar] [CrossRef]
  4. Liu, X.; Wu, Q.; Pan, X.; Wang, J.; Zhao, F. SAR Image Transform Based on Amplitude and Frequency Shifting Joint Modulation. IEEE Sens. J. 2025, 25, 7043–7052. [Google Scholar] [CrossRef]
  5. Yan, Z.; Guoqing, Z.; Yu, Z. Research on SAR Jamming Technique Based on Man-made Map. In Proceedings of the 2006 CIE International Conference on Radar, Shanghai, China, 16–19 October 2006; pp. 1–4. [Google Scholar] [CrossRef]
  6. Hanafy, M.; Hassan, H.E.; Abdel-Latif, M.; Elgamel, S. Performance evaluation of deceptive and noise jamming on SAR focused image. In Proceedings of the 11th International Conference on Electrical Engineering ICEENG 2018, Cairo, Egypt, 3–5 April 2018; Volume 11, pp. 1–11. [Google Scholar] [CrossRef]
  7. Ding, C.; Mu, H.; Shi, Y.; Wu, Z.; Fu, X.; Zhu, R.; Cai, T.; Meng, F.; Wang, J. Dual-polarized and Conformal Time-Modulated Metasurface Based Two-Dimensional Jamming Against SAR Imaging System. IEEE Trans. Antennas Propag. 2025. early access. [Google Scholar] [CrossRef]
  8. Li, K.; Jiu, B.; Liu, H. Game Theoretic Strategies Design for Monostatic Radar and Jammer Based on Mutual Information. IEEE Access 2019, 7, 72257–72266. [Google Scholar] [CrossRef]
  9. Wu, X.; Dai, D.; Wang, X.; Lu, H. Evaluation of SAR Jamming Performance. In Proceedings of the 2007 International Symposium on Microwave, Antenna, Propagation and EMC Technologies for Wireless Communications, Hangzhou, China, 16–17 August 2007; pp. 1476–1480. [Google Scholar] [CrossRef]
  10. Li, X.; Zhen, J. Information Theory-Based Amendments of SAR Jamming Effect Evaluation. In Proceedings of the 2012 Sixth International Conference on Internet Computing for Science and Engineering, Zhengzhou, China, 21–23 April 2012; pp. 159–162. [Google Scholar] [CrossRef]
  11. Quegan, S.; Yu, J.J. Filtering of multichannel SAR images. IEEE Trans. Geosci. Remote Sens. 2001, 39, 2373–2379. [Google Scholar] [CrossRef]
  12. Wang, Z.; Bovik, A.; Sheikh, H.; Simoncelli, E. Image quality assessment: From error visibility to structural similarity. IEEE Trans. Image Process. 2004, 13, 600–612. [Google Scholar] [CrossRef]
  13. Lee, Y.; Park, J.; Shin, W.; Lee, K.; Kang, H. A study on jamming performance evaluation of noise and deception jammer against SAR satellite. In Proceedings of the 2011 3rd International Asia-Pacific Conference on Synthetic Aperture Radar (APSAR), Seoul, Republic of Korea, 26–30 September 2011; IEEE: Piscataway, NJ, USA, 2011; pp. 1–3. [Google Scholar]
  14. Han, G.-Q.; Li, Y.-Z.; Wang, X.-S.; Xing, S.-Q.; Liu, Q.-F. Evaluation of Jamming Effect on SAR Based on Method of Modified Structural Similarity. J. Electron. Inf. Technol. 2011, 33, 711. [Google Scholar] [CrossRef]
  15. Jiao, S.; Dong, W. SAR Image Quality Assessment Based on SSIM Using Textural Feature. In Proceedings of the 2013 Seventh International Conference on Image and Graphics, Qingdao, China, 26–28 July 2013; pp. 281–286. [Google Scholar] [CrossRef]
  16. Bu, W. Multi-false-target Jamming Effectiveness Evaluation Based on Analytic Hierarchy Process and Entropy Weight Method. Electron. Inf. Warf. Technol. 2022, 37, 81–85. [Google Scholar]
  17. Shi, J.; Xue, L.; Zhu, B. Evaluation method of jamming effect on ISAR based on symmetry cross entropy. In Proceedings of the 2009 International Conference on Image Analysis and Signal Processing, Linhai, China, 11–12 April 2009; pp. 402–405. [Google Scholar] [CrossRef]
  18. Zhu, B.Y.; Xue, L.; Bi, D.P. Evaluation Method of Jamming Effect on ISAR Based on the Similarity of Features. In Proceedings of the 2010 6th International Conference on Wireless Communications Networking and Mobile Computing (WiCOM), Chengdu, China, 23–25 September 2010; pp. 1–4. [Google Scholar] [CrossRef]
  19. Xing, X.; Chen, Z.; Zou, H.; Zhou, S. A fast algorithm based on two-stage CFAR for detecting ships in SAR images. In Proceedings of the 2009 2nd Asian-Pacific Conference on Synthetic Aperture Radar, Xi’an, China, 26–30 October 2009; IEEE: Piscataway, NJ, USA, 2009; pp. 506–509. [Google Scholar]
  20. Ai, J.; Yang, X.; Song, J.; Dong, Z.; Jia, L.; Zhou, F. An adaptively truncated clutter-statistics-based two-parameter CFAR detector in SAR imagery. IEEE J. Ocean. Eng. 2017, 43, 267–279. [Google Scholar] [CrossRef]
  21. El-Darymli, K.; McGuire, P.; Power, D.; Moloney, C. Target detection in synthetic aperture radar imagery: A state-of-the-art survey. J. Appl. Remote Sens. 2013, 7, 071598. [Google Scholar] [CrossRef]
  22. Zhu, H.; Quan, S.; Xing, S.; Zhang, H.; Ren, Y. Detection-Oriented Evaluation of SAR Dexterous Barrage Jamming Effectiveness. Remote Sens. 2025, 17, 1101. [Google Scholar] [CrossRef]
  23. Sun, D.; Li, A.; Ding, H.; Wei, J. Detection of DRFM Deception Jamming Based on Diagonal Integral Bispectrum. Remote Sens. 2025, 17, 1957. [Google Scholar] [CrossRef]
  24. Tang, Z.; Yu, C.; Deng, Y.; Fang, T.; Zheng, H. Evaluation of deceptive jamming effect on SAR based on visual consistency. IEEE J. Sel. Top. Appl. Earth Obs. Remote Sens. 2021, 14, 12246–12262. [Google Scholar] [CrossRef]
  25. Tian, T.; Zhou, F.; Li, Y.; Sun, B.; Fan, W.; Gong, C.; Yang, S. Performance Evaluation of Deception Against Synthetic Aperture Radar Based on Multifeature Fusion. IEEE J. Sel. Top. Appl. Earth Obs. Remote Sens. 2021, 14, 103–115. [Google Scholar] [CrossRef]
  26. Zhou, F.; Zhao, B.; Tao, M.; Bai, X.; Chen, B.; Sun, G. A Large Scene Deceptive Jamming Method for Space-Borne SAR. IEEE Trans. Geosci. Remote Sens. 2013, 51, 4486–4495. [Google Scholar] [CrossRef]
  27. Manzoor, Z.; Ghasr, M.T.; Donnell, K.M. Image distortion characterization due to equivalent monostatic approximation in near field bistatic SAR imaging. In Proceedings of the 2017 IEEE International Instrumentation and Measurement Technology Conference (I2MTC), Turin, Italy, 22–25 May 2017; pp. 1–5. [Google Scholar] [CrossRef]
  28. Cui, R.; Xue, L.; Wang, B. Evaluation method of jamming effect on ISAR based on equivalent number of looks. Syst. Eng. Electron. 2008, 30, 887–888. [Google Scholar]
  29. Kanopoulos, N.; Vasanthavada, N.; Baker, R. Design of an image edge detection filter using the Sobel operator. IEEE J. Solid-State Circuits 1988, 23, 358–367. [Google Scholar] [CrossRef]
  30. Gong, M.; Zhou, Z.; Ma, J. Change Detection in Synthetic Aperture Radar Images based on Image Fusion and Fuzzy Clustering. IEEE Trans. Image Process. 2012, 21, 2141–2151. [Google Scholar] [CrossRef]
  31. Deng, C.X.; Bai, T.T.; Geng, Y. Image edge detection based on wavelet transform and Canny operator. In Proceedings of the 2009 International Conference on Wavelet Analysis and Pattern Recognition, Baoding, China, 12–15 July 2009; pp. 355–359. [Google Scholar] [CrossRef]
  32. Canny, J. A Computational Approach to Edge Detection. IEEE Trans. Pattern Anal. Mach. Intell. 1986, PAMI-8, 679–698. [Google Scholar] [CrossRef]
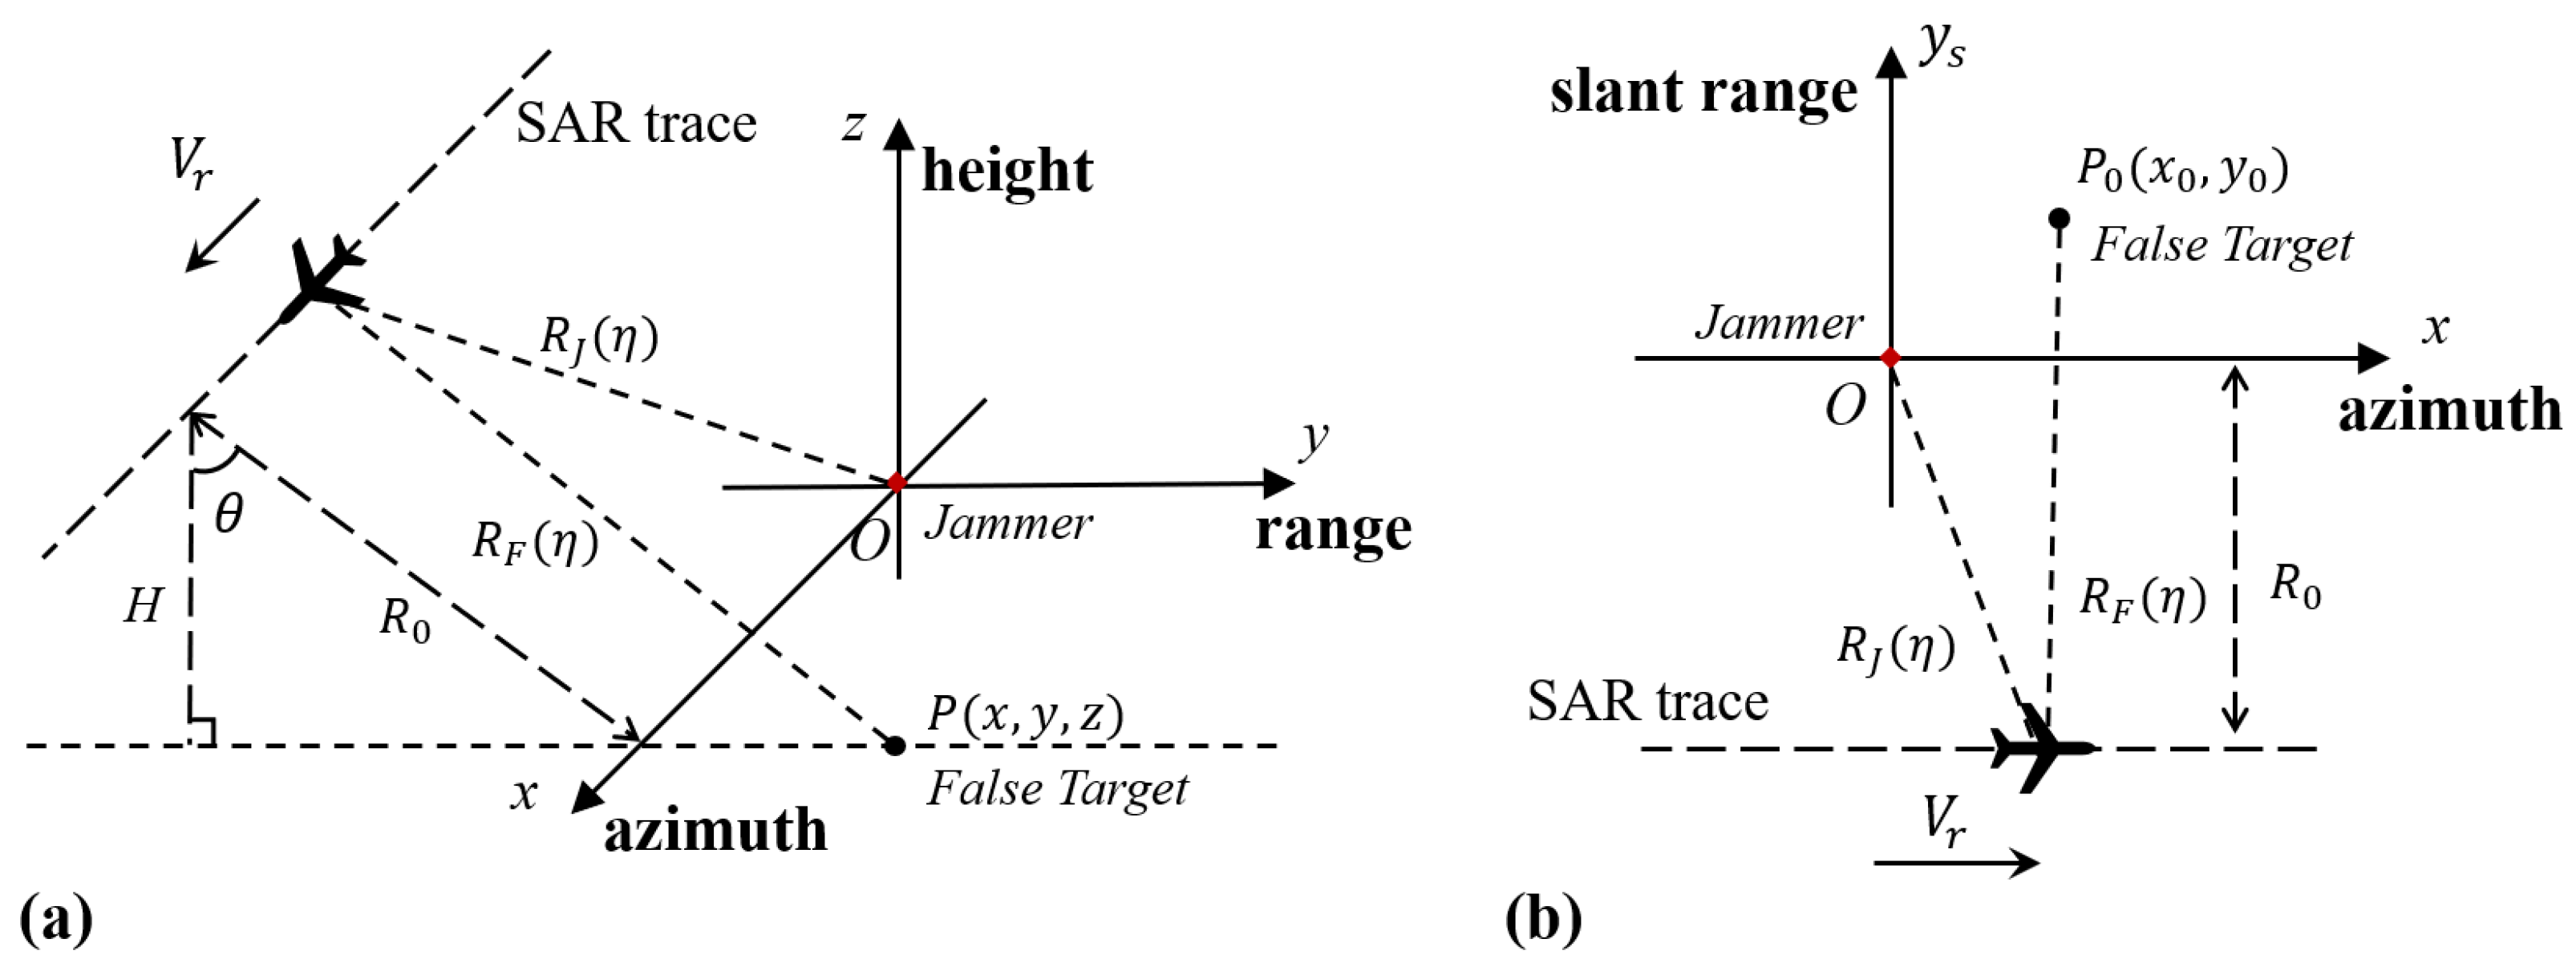
Figure 1. Geometry of SAR deception jamming. (a) 3D coordinate system. (b) 2D coordinate system.
Remotesensing 17 03195 g001
Figure 2. SAR cross-sectional imaging diagram.
Remotesensing 17 03195 g002
Figure 3. SAR imaging process.
Remotesensing 17 03195 g003
Figure 4. Concept of contour similarity.
Remotesensing 17 03195 g004
Figure 5. Weight function with ϵ = [ 0.1 , 0.25 , 0.5 , 5 , 10 ] .
Remotesensing 17 03195 g005
Figure 6. Texture extraction process.
Remotesensing 17 03195 g006
Figure 7. The variation intensity diagram of the gradient gray-level co-occurrence matrix.
Remotesensing 17 03195 g007
Figure 8. Multi-feature extraction process.
Remotesensing 17 03195 g008
Figure 9. Point target simulation with +5%Kr error. (a) Magnitude plot. (b) Cross-sectional plot.
Remotesensing 17 03195 g009
Figure 10. Point target simulation with +1%Kr error. (a) Magnitude plot. (b) Cross-sectional plot.
Remotesensing 17 03195 g010
Figure 11. False point target simulation. (a) No error. (b) 0 . 3 squint angle error. (c) 0 . 3 squint angle error after phase correction.
Remotesensing 17 03195 g011
Figure 12. Sample examples. (ah) Original. (ip) Distortion.
Remotesensing 17 03195 g012
Figure 13. Mean and variance polar diagrams of the three metrics before and after distortion. (a) Mean. (b) Variance.
Remotesensing 17 03195 g013
Figure 14. Comparison of metric luminance maps before and after distortion. (a) CSIM. (b) Δ mENL . (c) GradC. (d) CSIM with distortion. (e) Δ mENL with distortion. (f) GradC with distortion.
Remotesensing 17 03195 g014
Figure 15. Sample image in different groups. (a) Group 1. (b) Group 2. (c) Group 3. (d) Group 4.
Remotesensing 17 03195 g015
Figure 16. Sample image in different groups. (a) Group 1. (b) Group 5. (c) Group 6. (d) Group 7.
Remotesensing 17 03195 g016
Figure 17. Sample image in different groups. (a) Group 1. (b) Group 8. (c) Group 9. (d) Group 10.
Remotesensing 17 03195 g017
Figure 18. Comparison of method luminance maps before and after distortion. (a) Δ ENL . (b) SSIM. (c) Proposed. (d) Δ ENL with distortion. (e) SSIM with distortion. (f) Proposed with distortion.
Remotesensing 17 03195 g018
Figure 19. Mean and variance polar diagrams of the three methods before and after distortion. (a) Mean. (b) Variance.
Remotesensing 17 03195 g019
Figure 20. SAR imaging before jamming.
Remotesensing 17 03195 g020
Figure 21. SAR image with false target and real template region.
Remotesensing 17 03195 g021
Figure 22. CSIM evaluation results with increasing defocusing error under different parameter settings before and after distortion.
Remotesensing 17 03195 g022
Figure 23. Diagram of metric robustness and evaluation capability under different parameters.
Remotesensing 17 03195 g023
Table 1. SAR simulation parameters.
ParameterSymbolValue
Velocity( V r )154.2 m/s
Bandwidth(B)480 MHz
Pulse Width( T r )2.4 μs
Carrier Frequency( f 0 )9.6 GHz
SAR Height(H)10,000 m
Center Slant Range( R 0 )25,545 m
Squint Angle( θ )0
Table 2. Error setting of simulation experiment.
Error Type β γ Δ V r & Δ K r
ReferenceGroup 1001%
Group 2002%
DefocusingGroup 3003%
Group 4005%
Group 5−20%01%
Amplitude VariationGroup 6−50%01%
Group 7+50%01%
Group 800.011%
DistortionGroup 900.031%
Group 1000.11%
Table 3. Evaluation results under different defocusing errors.
MethodGroup 1Group 2Group 3Group 4
Proposed0.84530.82030.75010.6673
SSIM0.90020.83370.78120.6938
Δ ENL0.86820.76220.67320.5350
Table 4. Evaluation results under different amplitude errors.
MethodGroup 1Group 5Group 6Group 7
Proposed0.84530.77410.65380.6025
SSIM0.90010.85510.57870.7933
Δ ENL0.86810.86810.85560.7446
Table 5. Evaluation results under different distortion degree.
MethodGroup 1Group 8Group 9Group 10
Proposed0.84530.83730.81780.6596
SSIM0.90020.76830.67170.4205
Δ ENL0.86810.86520.86410.8480
Table 6. Evaluation results in actual SAR image.
RegionProposedSSIM Δ ENL
False Target with registration 0.64780.46030.8173
False Target without registration0.61440.01630.9446
Random0.17490.01880.2591
Disclaimer/Publisher’s Note: The statements, opinions and data contained in all publications are solely those of the individual author(s) and contributor(s) and not of MDPI and/or the editor(s). MDPI and/or the editor(s) disclaim responsibility for any injury to people or property resulting from any ideas, methods, instructions or products referred to in the content.