Estimating Rice SPAD Values via Multi-Sensor Data Fusion of Multispectral and RGB Cameras Using Machine Learning with a Phenotyping Robot
Abstract
1. Introduction
2. Materials and Methods
2.1. Experimental Setup
2.2. Data Collection
2.3. Data Processing and Feature Extraction
2.3.1. Extraction of Vegetation Index
2.3.2. Color Index Extraction
2.3.3. Extraction of Texture Features
2.4. Model Construction and Evaluation
3. Results
3.1. Statistical Analysis of SPAD
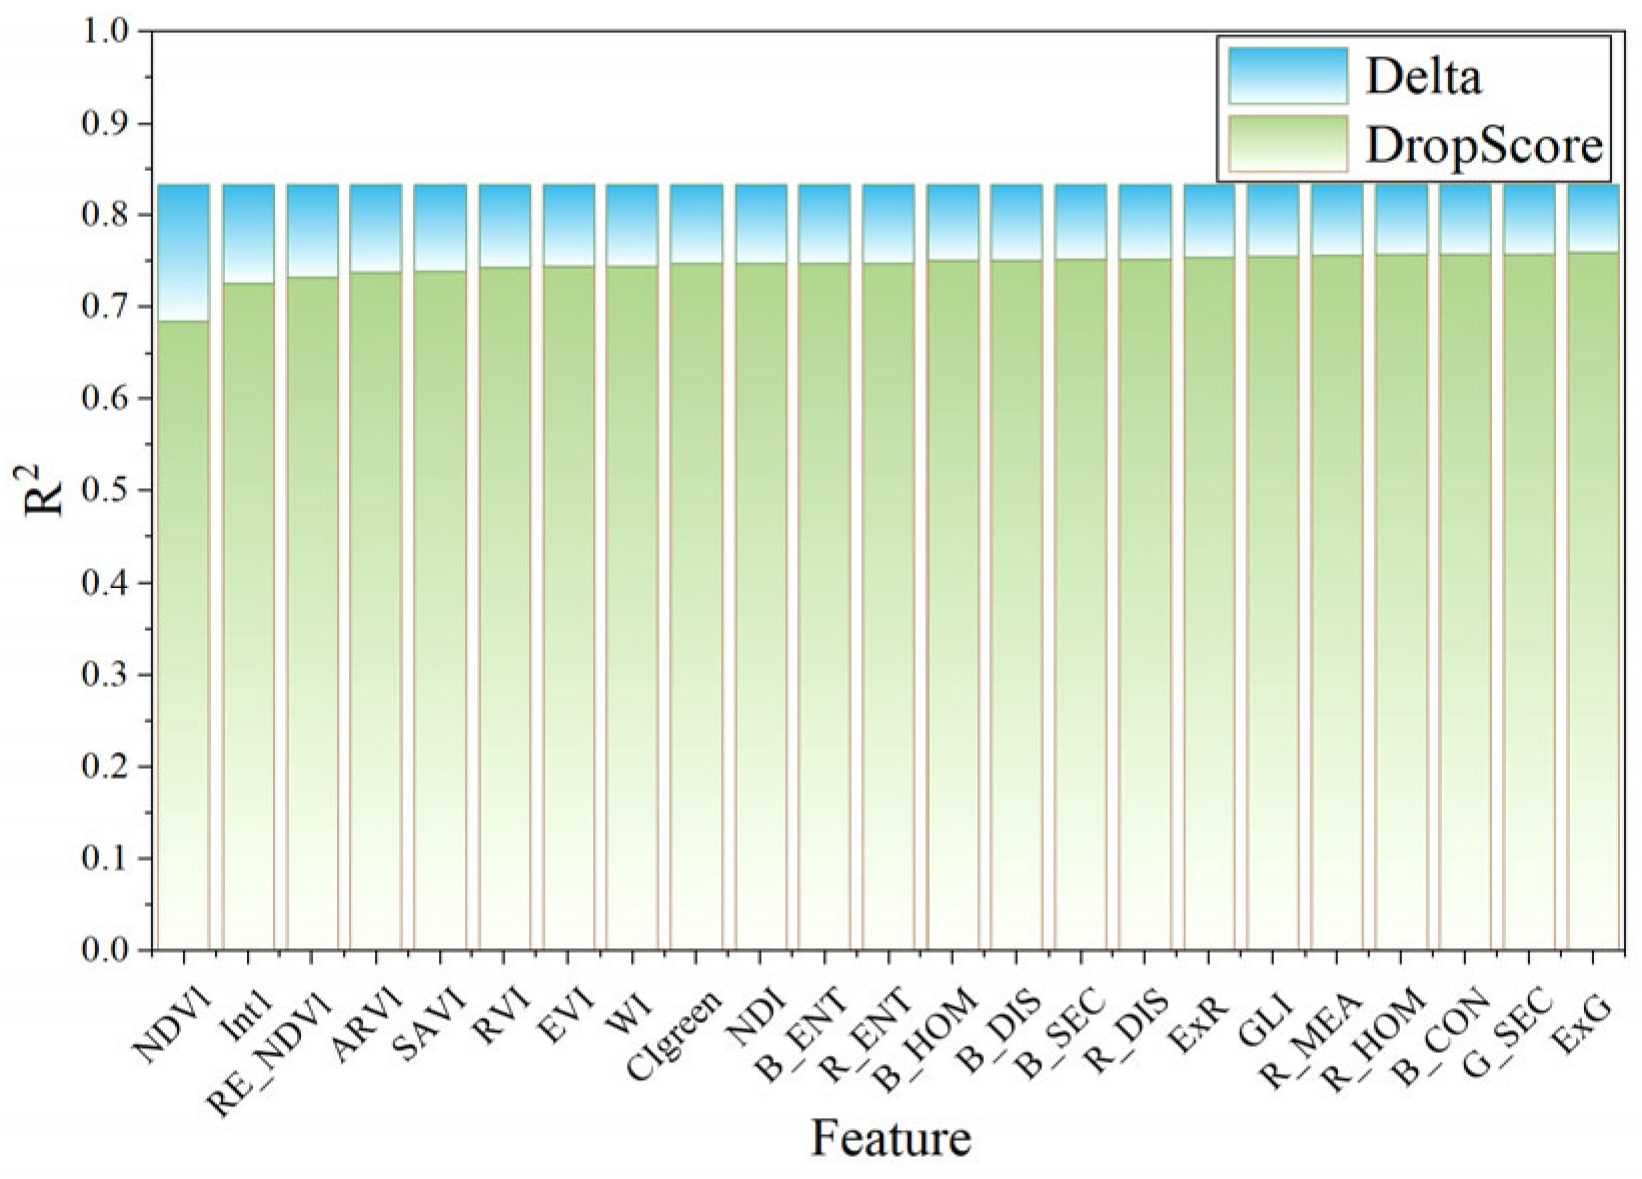
3.2. The Correlation of Characteristic Parameters to SPAD
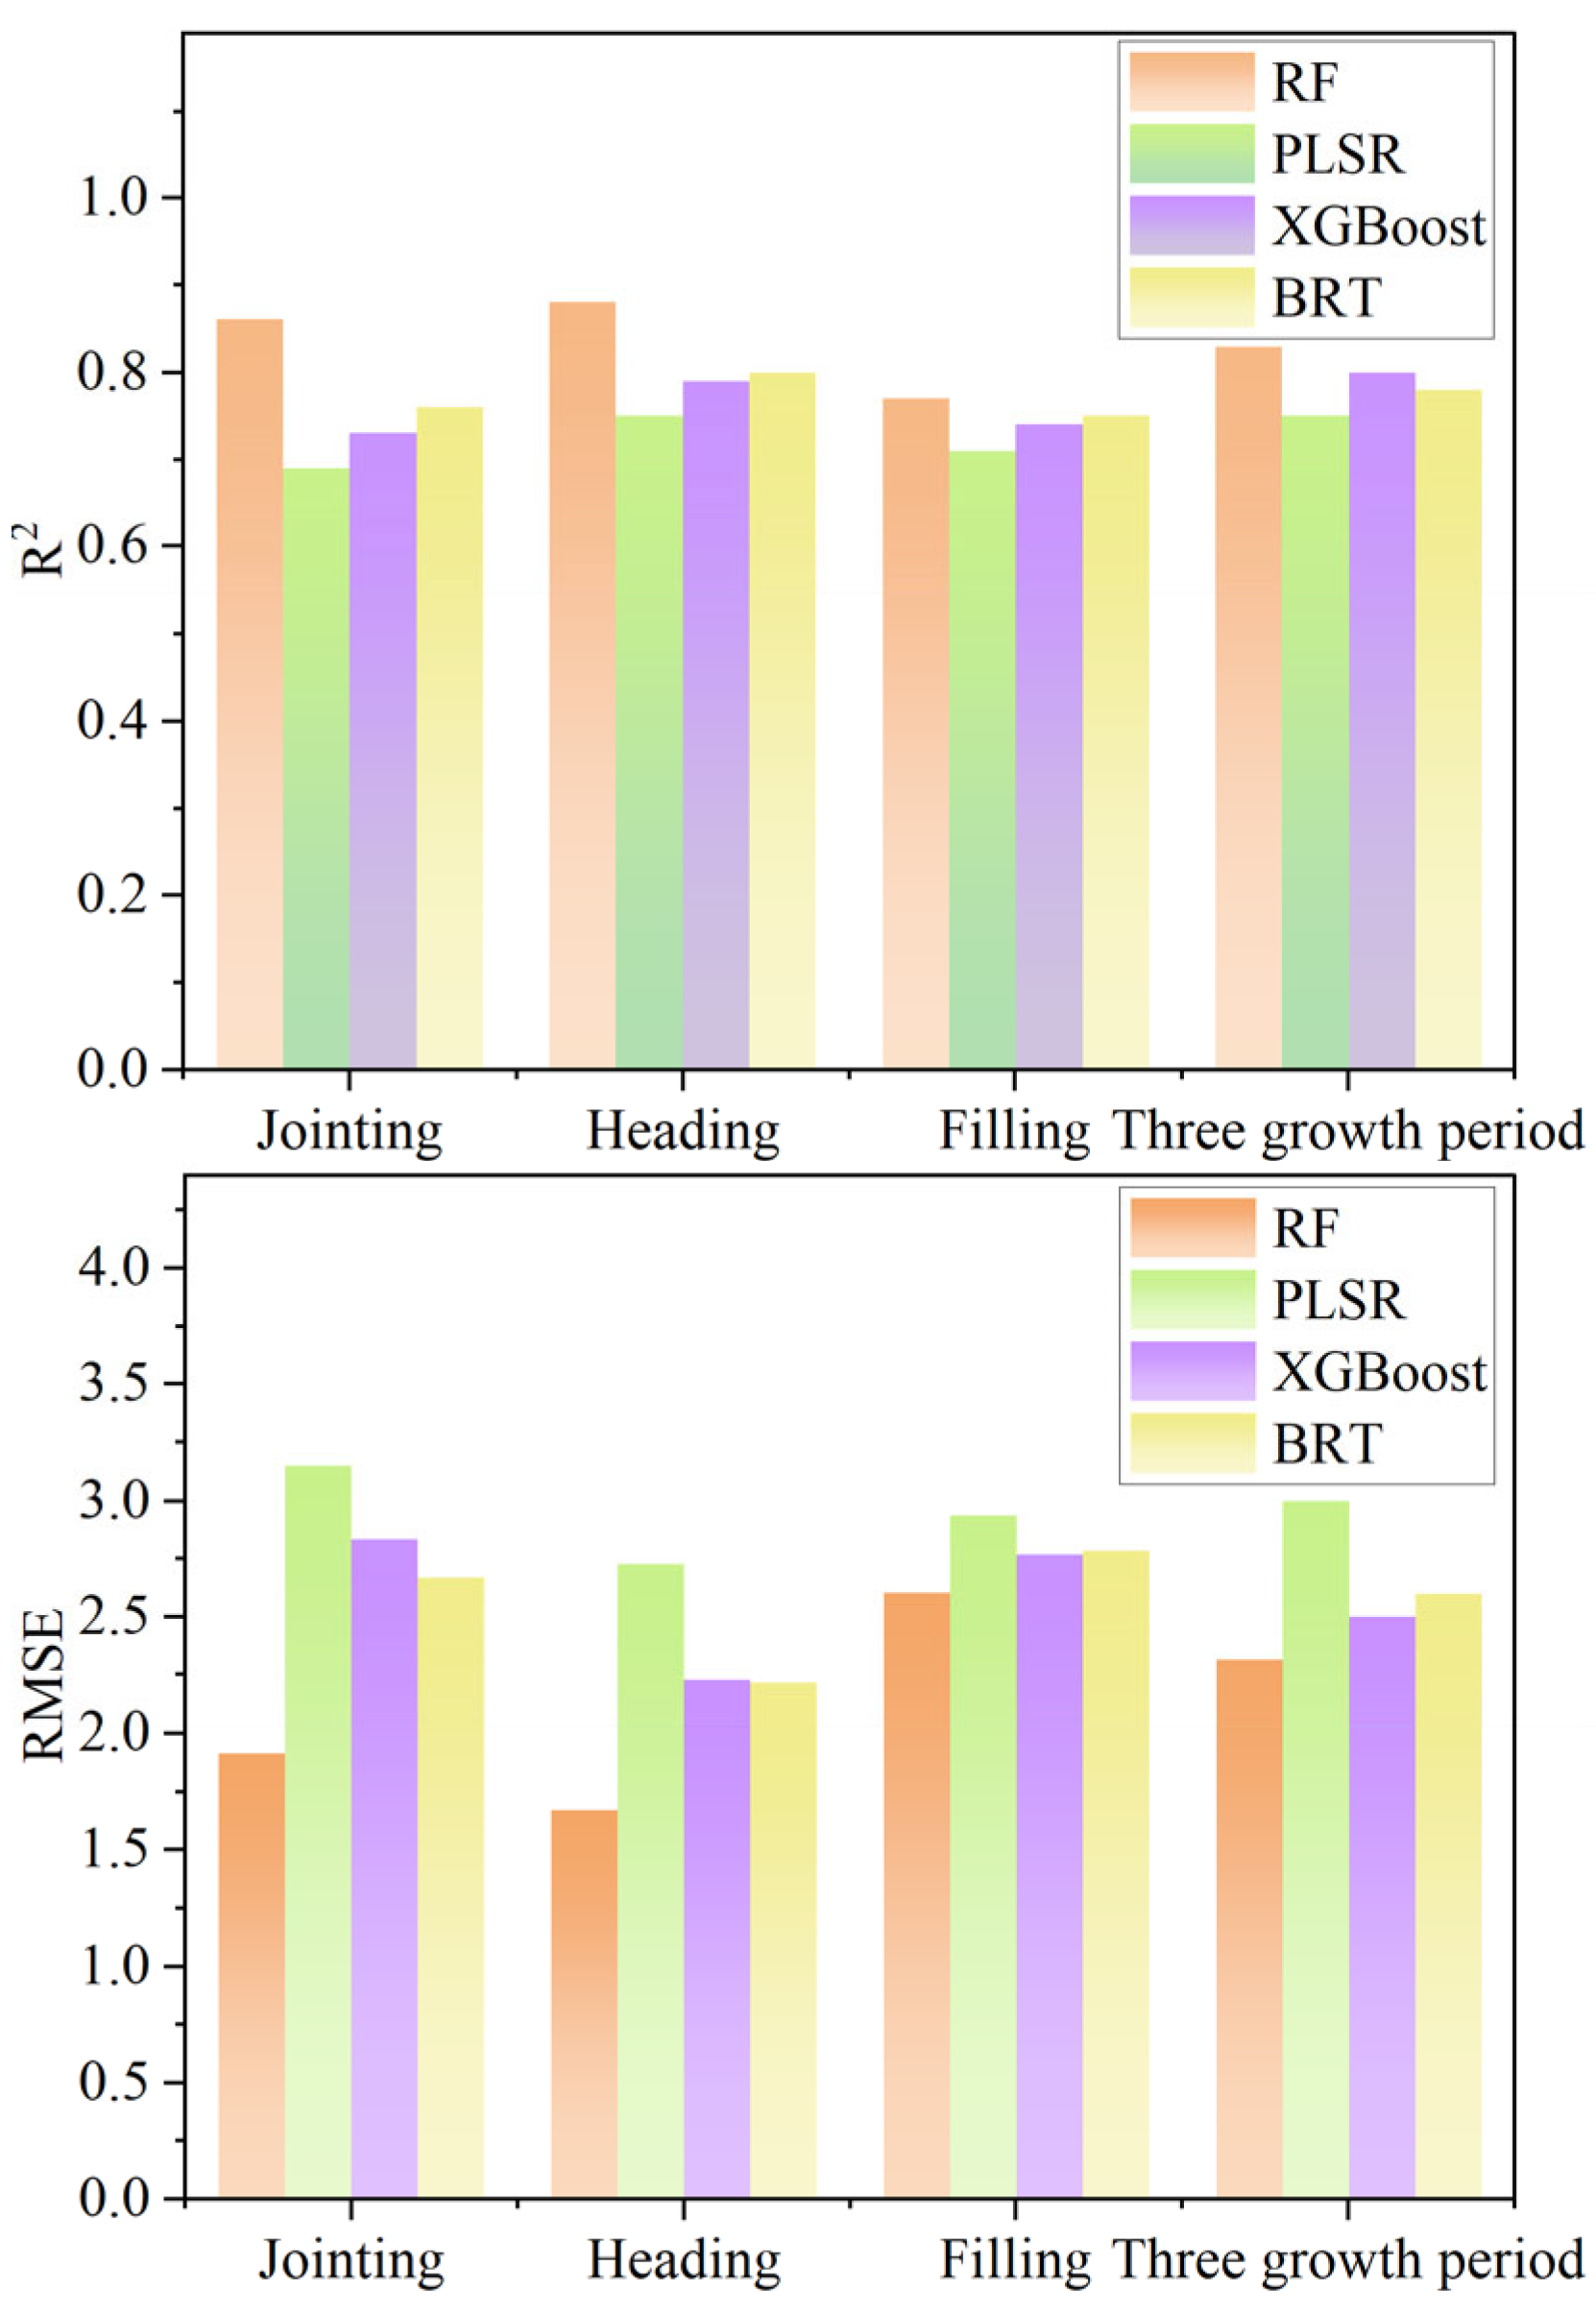
3.3. Evaluation of SPAD Monitoring Model Based on Machine Learning and Multi-Sensor Data
4. Discussion
5. Conclusions
Author Contributions
Funding
Data Availability Statement
Conflicts of Interest
References
- Huang, M.; Zou, Y.B. Integrating mechanization with agronomy and breeding to ensure food security in China. Field Crop. Res. 2018, 224, 22–27. [Google Scholar] [CrossRef]
- Zhang, L.Y.; Han, W.T.; Niu, Y.X.; Chávez, J.L.; Shao, G.M.; Zhang, H.H. Evaluating the sensitivity of water stressed maize chlorophyll and structure based on UAV derived vegetation indices. Comput. Electron. Agric. 2021, 185, 106174. [Google Scholar] [CrossRef]
- Huang, Y.; Ma, Q.; Wu, X.; Li, H.; Xu, K.; Ji, G.; Qian, F.; Li, L.; Huang, Q.; Long, Y.; et al. Estimation of chlorophyll content in Brassica napus based on unmanned aerial vehicle images. Oil Crop. Sci. 2022, 7, 149–155. [Google Scholar] [CrossRef]
- Zhang, Y.; Liang, K.; Zhu, F.; Zhong, X.; Lu, Z.; Chen, Y.; Pan, J.; Lu, C.; Huang, J.; Ye, Q.; et al. Differential Study on Estimation Models for Indica Rice Leaf SPAD Value and Nitrogen Concentration Based on Hyperspectral Monitoring. Remote Sens. 2024, 16, 4604. [Google Scholar] [CrossRef]
- Li, S.; Jin, J.; Afrin, M.; Ge, X.; Fu, J.; Tian, Y.-C. Mobility-as-a-Resilience-Service in Internet of Robotic Things Through Robust Multi-Agent Deep Reinforcement Learning. IEEE Internet Things J. 2025, 1. [Google Scholar] [CrossRef]
- Yang, W.N.; Feng, H.; Zhang, X.H.; Zhang, J.; Doonan, J.H.; Batchelor, W.D.; Xiong, L.Z.; Yan, J.B. Crop Phenomics and High-Throughput Phenotyping: Past Decades, Current Challenges, and Future Perspectives. Mol. Plant 2020, 13, 187–214. [Google Scholar] [CrossRef]
- Xu, R.; Li, C. A Review of High-Throughput Field Phenotyping Systems: Focusing on Ground Robots. Plant Phenomics 2022, 2022, 9760269. [Google Scholar] [CrossRef]
- Fan, Z.; Sun, N.; Qiu, Q.; Li, T.; Feng, Q.; Zhao, C. In Situ Measuring Stem Diameters of Maize Crops with a High-Throughput Phenotyping Robot. Remote Sens. 2022, 14, 1030. [Google Scholar] [CrossRef]
- Pérez-Ruiz, M.; Prior, A.; Martinez-Guanter, J.; Apolo-Apolo, O.E.; Andrade-Sanchez, P.; Egea, G. Development and evaluation of a self-propelled electric platform for high-throughput field phenotyping in wheat breeding trials. Comput. Electron. Agric. 2020, 169, 105237. [Google Scholar] [CrossRef]
- Zhang, R.; Yang, P.; Liu, S.; Wang, C.; Liu, J. Evaluation of the Methods for Estimating Leaf Chlorophyll Content with SPAD Chlorophyll Meters. Remote Sens. 2022, 14, 5144. [Google Scholar] [CrossRef]
- Dong, T.; Shang, J.; Chen, J.M.; Liu, J.; Qian, B.; Ma, B.; Morrison, M.J.; Zhang, C.; Liu, Y.; Shi, Y.; et al. Assessment of Portable Chlorophyll Meters for Measuring Crop Leaf Chlorophyll Concentration. Remote Sens. 2019, 11, 2706. [Google Scholar] [CrossRef]
- Ma, W.T.; Han, W.T.; Zhang, H.H.; Cui, X.; Zhai, X.D.; Zhang, L.Y.; Shao, G.M.; Niu, Y.X.; Huang, S.J. UAV multispectral remote sensing for the estimation of SPAD values at various growth stages of maize under different irrigation levels. Comput. Electron. Agric. 2024, 227, 109566. [Google Scholar] [CrossRef]
- Xie, J.; Wang, J.; Chen, Y.; Gao, P.; Yin, H.; Chen, S.; Sun, D.; Wang, W.; Mo, H.; Shen, J.; et al. Estimating the SPAD of Litchi in the Growth Period and Autumn Shoot Period Based on UAV Multi-Spectrum. Remote Sens. 2023, 15, 5767. [Google Scholar] [CrossRef]
- Reyes, J.F.; Correa, C.; Zúñiga, J. Reliability of different color spaces to estimate nitrogen SPAD values in maize. Comput. Electron. Agric. 2017, 143, 14–22. [Google Scholar] [CrossRef]
- Liu, Y.; Hatou, K.; Aihara, T.; Kurose, S.; Akiyama, T.; Kohno, Y.; Lu, S.; Omasa, K. A Robust Vegetation Index Based on Different UAV RGB Images to Estimate SPAD Values of Naked Barley Leaves. Remote Sens. 2021, 13, 686. [Google Scholar] [CrossRef]
- Zheng, H.; Ma, J.; Zhou, M.; Li, D.; Yao, X.; Cao, W.; Zhu, Y.; Cheng, T. Enhancing the Nitrogen Signals of Rice Canopies across Critical Growth Stages through the Integration of Textural and Spectral Information from Unmanned Aerial Vehicle (UAV) Multispectral Imagery. Remote Sens. 2020, 12, 957. [Google Scholar] [CrossRef]
- Yin, Q.; Zhang, Y.; Li, W.; Wang, J.; Wang, W.; Ahmad, I.; Zhou, G.; Huo, Z. Better Inversion of Wheat Canopy SPAD Values before Heading Stage Using Spectral and Texture Indices Based on UAV Multispectral Imagery. Remote Sens. 2023, 15, 4935. [Google Scholar] [CrossRef]
- Zhang, C.; Chen, Z.; Yang, G.; Xu, B.; Feng, H.; Chen, R.; Qi, N.; Zhang, W.; Zhao, D.; Cheng, J.; et al. Removal of canopy shadows improved retrieval accuracy of individual apple tree crowns LAI and chlorophyll content using UAV multispectral imagery and PROSAIL model. Comput. Electron. Agric. 2024, 221, 108959. [Google Scholar] [CrossRef]
- Cheng, J.; Yang, H.; Qi, J.; Sun, Z.; Han, S.; Feng, H.; Jiang, J.; Xu, W.; Li, Z.; Yang, G.; et al. Estimating canopy-scale chlorophyll content in apple orchards using a 3D radiative transfer model and UAV multispectral imagery. Comput. Electron. Agric. 2022, 202, 107401. [Google Scholar] [CrossRef]
- Wang, F.; Yang, M.; Ma, L.; Zhang, T.; Qin, W.; Li, W.; Zhang, Y.; Sun, Z.; Wang, Z.; Li, F.; et al. Estimation of Above-Ground Biomass of Winter Wheat Based on Consumer-Grade Multi-Spectral UAV. Remote Sens. 2022, 14, 1251. [Google Scholar] [CrossRef]
- Guo, Y.; Wang, H.; Wu, Z.; Wang, S.; Sun, H.; Senthilnath, J.; Wang, J.; Robin Bryant, C.; Fu, Y. Modified Red Blue Vegetation Index for Chlorophyll Estimation and Yield Prediction of Maize from Visible Images Captured by UAV. Sensors 2020, 20, 5055. [Google Scholar] [CrossRef] [PubMed]
- Xiao, Q.L.; Tang, W.T.; Zhang, C.; Zhou, L.; Feng, L.; Shen, J.X.; Yan, T.Y.; Gao, P.; He, Y.; Wu, N. Spectral Preprocessing Combined with Deep Transfer Learning to Evaluate Chlorophyll Content in Cotton Leaves. Plant Phenomics 2022, 2022. [Google Scholar] [CrossRef] [PubMed]
- Su, M.; Zhou, D.; Yun, Y.Z.; Ding, B.; Xia, P.; Yao, X.; Ni, J.; Zhu, Y.; Cao, W.X. Design and implementation of a high-throughput field phenotyping robot for acquiring multisensor data in wheat. Plant Phenomics 2025, 7, 100014. [Google Scholar] [CrossRef]
- Narmilan, A.; Gonzalez, F.; Salgadoe, A.S.A.; Kumarasiri, U.W.L.M.; Weerasinghe, H.A.S.; Kulasekara, B.R. Predicting Canopy Chlorophyll Content in Sugarcane Crops Using Machine Learning Algorithms and Spectral Vegetation Indices Derived from UAV Multispectral Imagery. Remote Sens. 2022, 14, 1140. [Google Scholar] [CrossRef]
- Gitelson, A.A.; Viña, A.; Ciganda, V.; Rundquist, D.C.; Arkebauer, T.J. Remote estimation of canopy chlorophyll content in crops. Geophys. Res. Lett. 2005, 32, L08403. [Google Scholar] [CrossRef]
- Cao, Q.; Miao, Y.X.; Feng, G.H.; Gao, X.W.; Li, F.; Liu, B.; Yue, S.C.; Cheng, S.S.; Ustin, S.L.; Khosla, R. Active canopy sensing of winter wheat nitrogen status: An evaluation of two sensor systems. Comput. Electron. Agric. 2015, 112, 54–67. [Google Scholar] [CrossRef]
- Bandyopadhyay, D.; Bhavsar, D.; Pandey, K.; Gupta, S.; Roy, A. Red Edge Index as an Indicator of Vegetation Growth and Vigor Using Hyperspectral Remote Sensing Data. Proc. Natl. Acad. Sci. India Sect. A Phys. Sci. 2017, 87, 879–888. [Google Scholar] [CrossRef]
- Riihimäki, H.; Luoto, M.; Heiskanen, J. Estimating fractional cover of tundra vegetation at multiple scales using unmanned aerial systems and optical satellite data. Remote Sens. Environ. 2019, 224, 119–132. [Google Scholar] [CrossRef]
- Gitelson, A.A.; Kaufman, Y.J.; Merzlyak, M.N. Use of a green channel in remote sensing of global vegetation from EOS-MODIS. Remote Sens. Environ. 1996, 58, 289–298. [Google Scholar] [CrossRef]
- Shao, G.M.; Wang, Y.J.; Han, W.T. Estimation Method of Leaf Area Index for Summer Maize Using UAV-Based Multispectral Remote Sensing. Smart Agric. 2020, 2, 118–128. [Google Scholar]
- Woebbecke, D.M.; Meyer, G.E.; Vonbargen, K.; Mortensen, D.A. Color Indexes for Weed Identification under Various Soil, Residue, and Lighting Conditions. Trans. ASAE 1995, 38, 259–269. [Google Scholar] [CrossRef]
- Meyer, G.E.; Neto, J.C. Verification of color vegetation indices for automated crop imaging applications. Comput. Electron. Agric. 2008, 63, 282–293. [Google Scholar] [CrossRef]
- Gitelson, A.A.; Kaufman, Y.J.; Stark, R.; Rundquist, D. Novel algorithms for remote estimation of vegetation fraction. Remote Sens. Environ. 2002, 80, 76–87. [Google Scholar] [CrossRef]
- Louhaichi, M.; Borman, M.M.; Johnson, D.E. Spatially located platform and aerial photography for documentation of grazing impacts on wheat. Geocarto Int. 2001, 16, 65–70. [Google Scholar] [CrossRef]
- Haralick, R.M.; Shanmugam, K.; Dinstein, I.H. Textural Features for Image Classification. IEEE Trans. Syst. Man Cybern. 1973, SMC-3, 610–621. [Google Scholar] [CrossRef]
- Wang, Z.L.; Tan, X.M.; Ma, Y.M.; Liu, T.; He, L.M.; Yang, F.; Shu, C.H.; Li, L.L.; Fu, H.; Li, B.; et al. Combining canopy spectral reflectance and RGB images to estimate leaf chlorophyll content and grain yield in rice. Comput. Electron. Agric. 2024, 221, 108975. [Google Scholar] [CrossRef]
- Xu, X.Q.; Lu, J.S.; Zhang, N.; Yang, T.C.; He, J.Y.; Yao, X.; Cheng, T.; Zhu, Y.; Cao, W.X.; Tian, Y.C. Inversion of rice canopy chlorophyll content and leaf area index based on coupling of radiative transfer and Bayesian network models. ISPRS J. Photogramm. Remote Sens. 2019, 150, 185–196. [Google Scholar] [CrossRef]
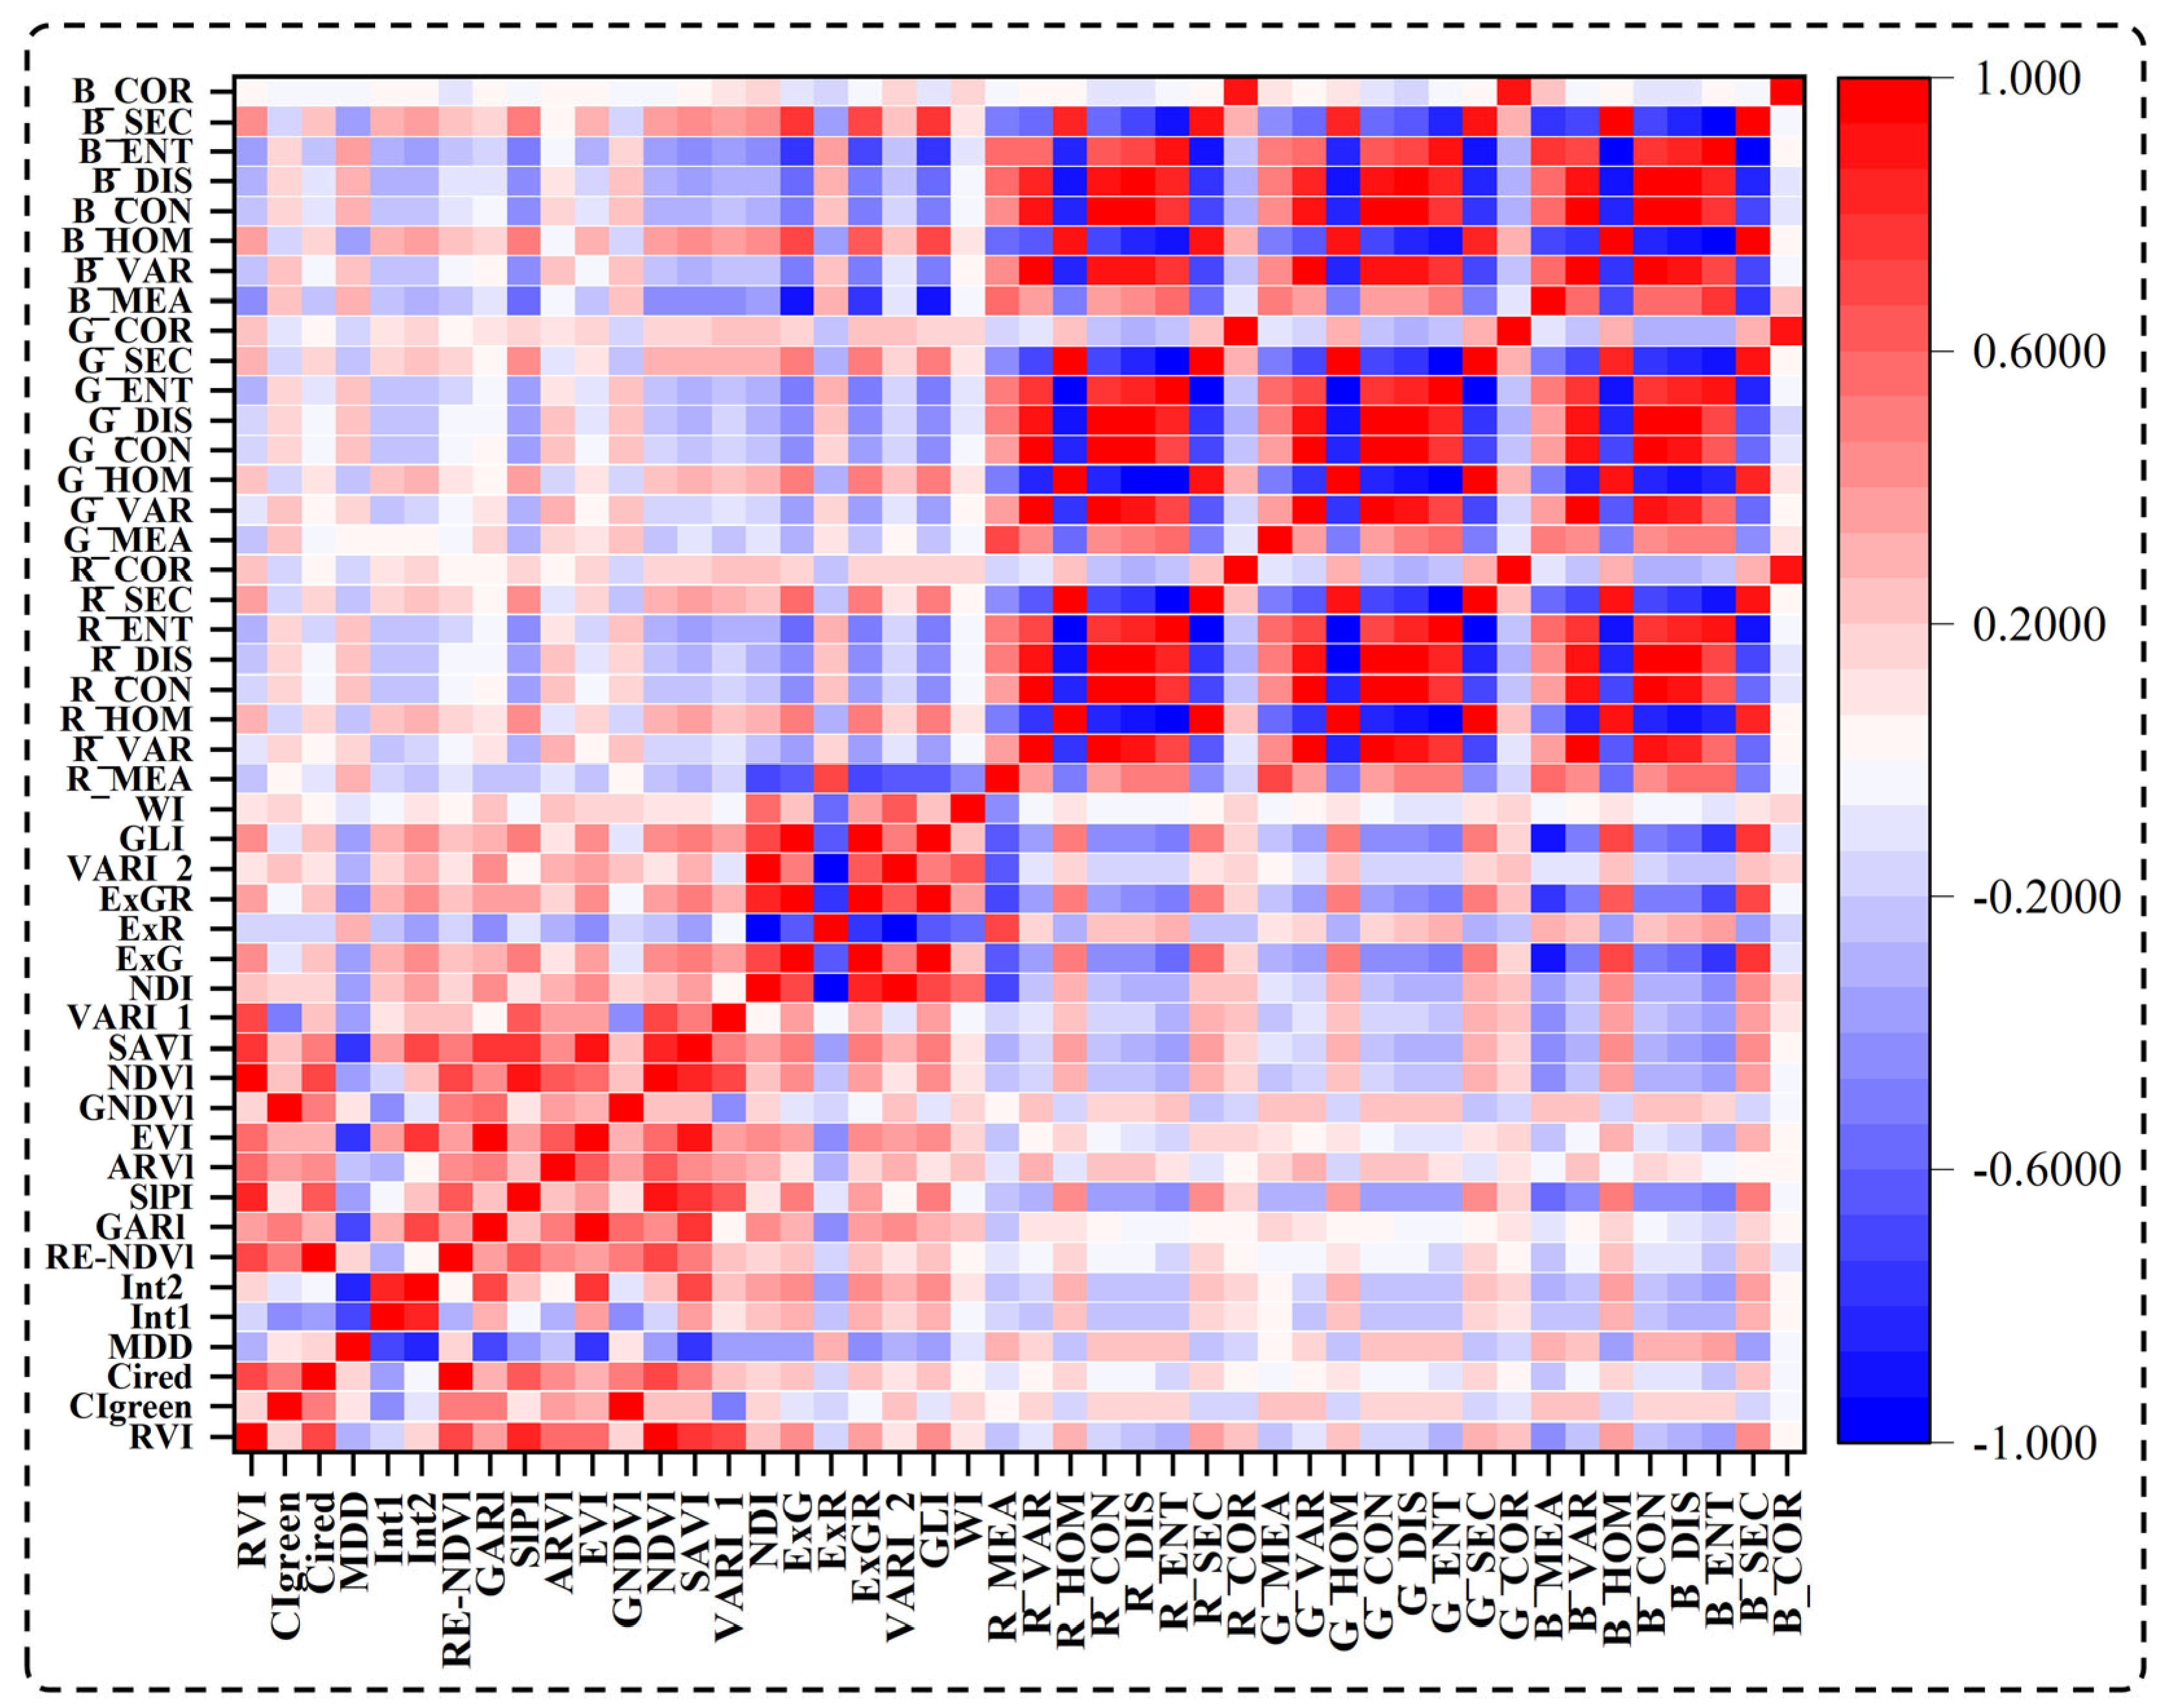
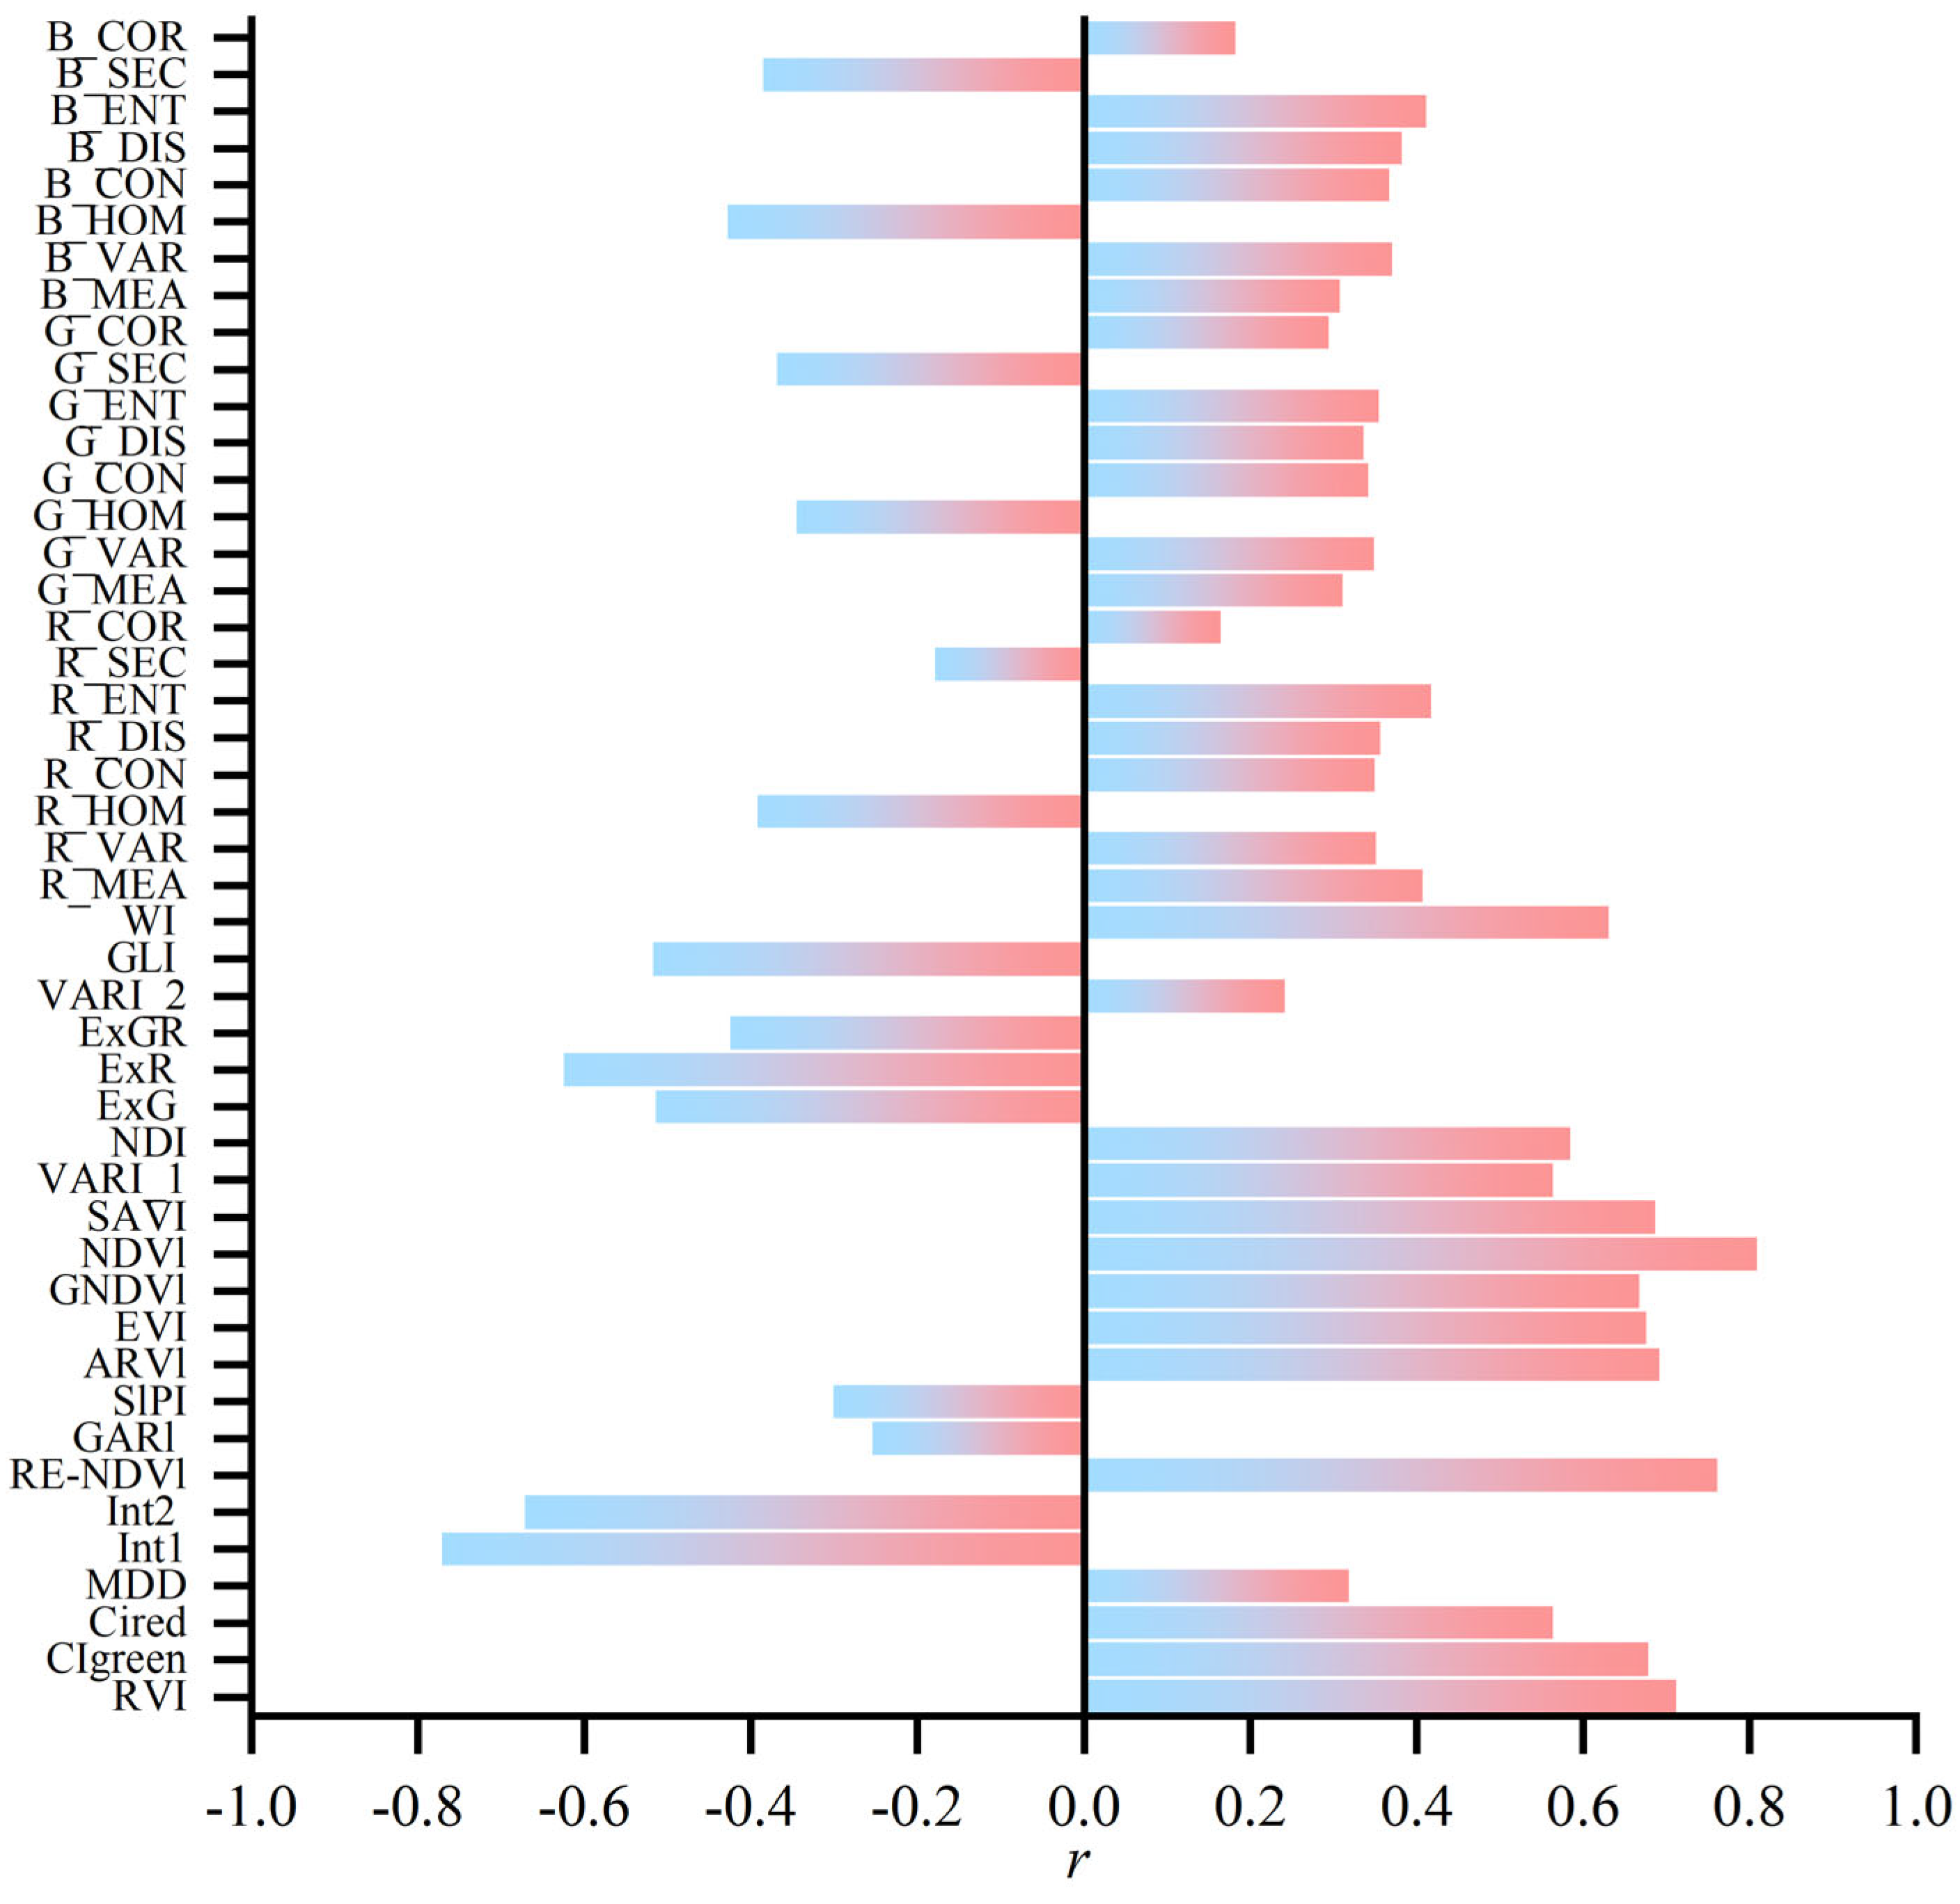

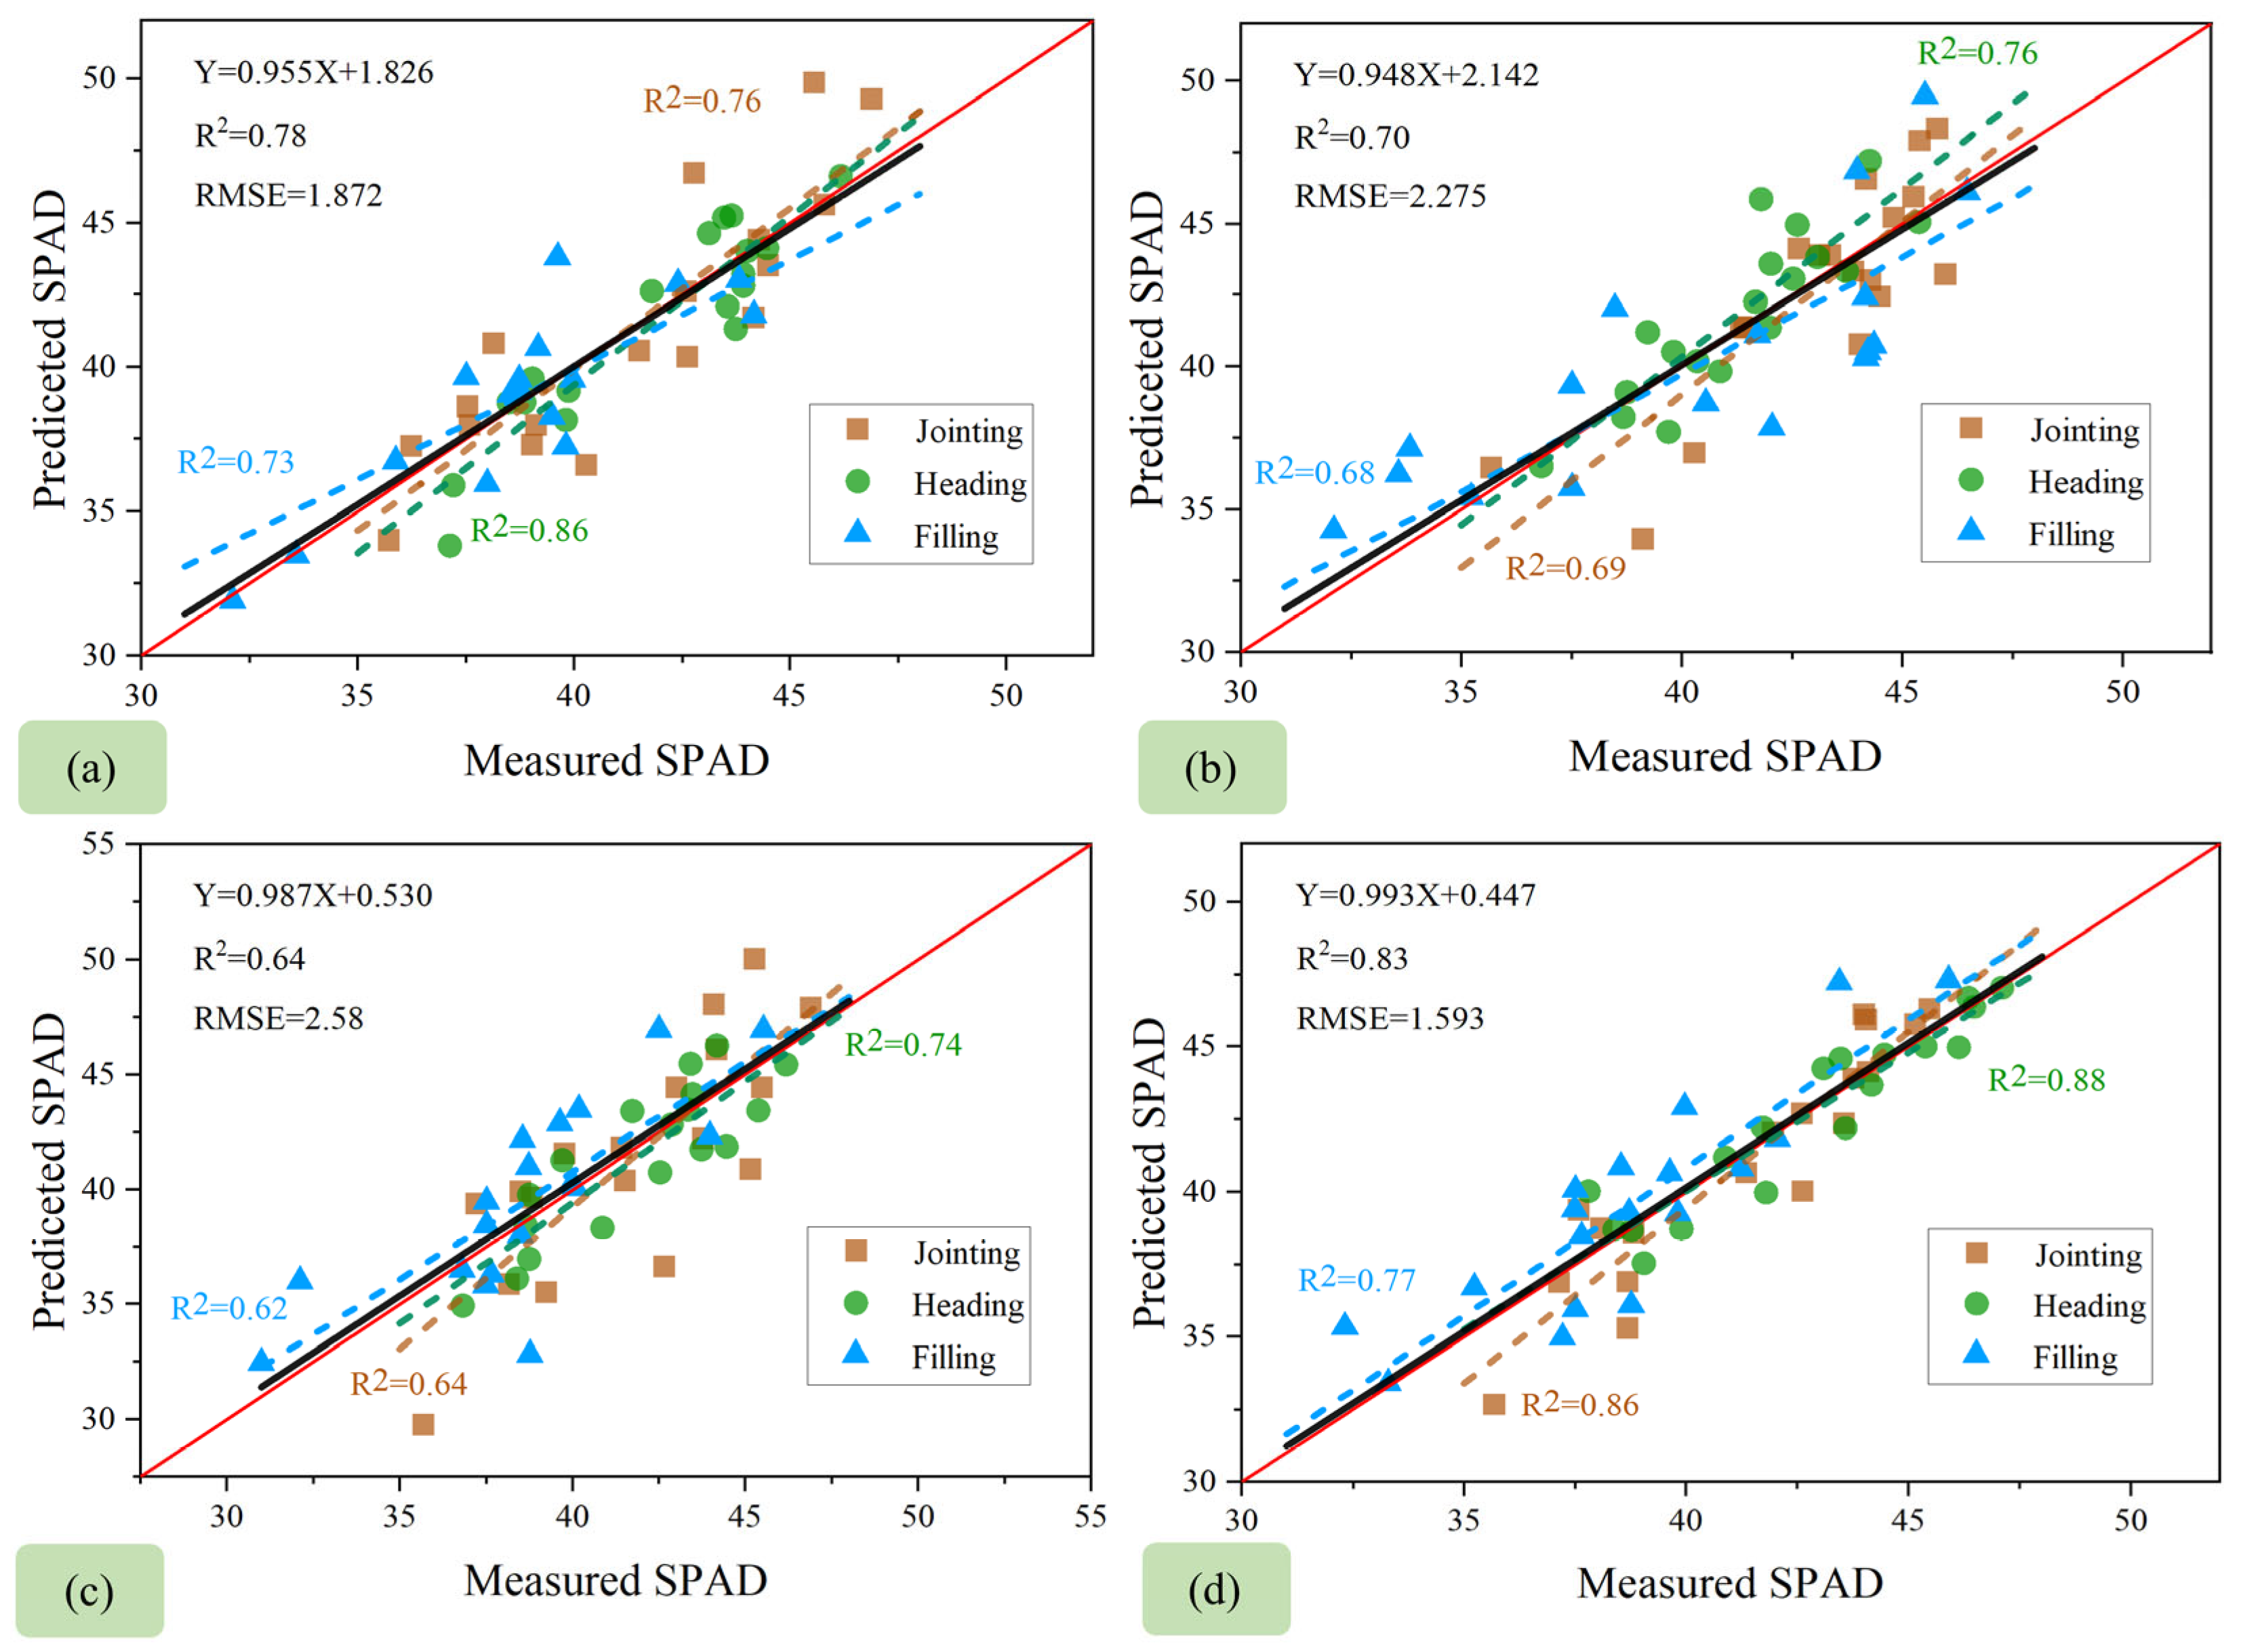
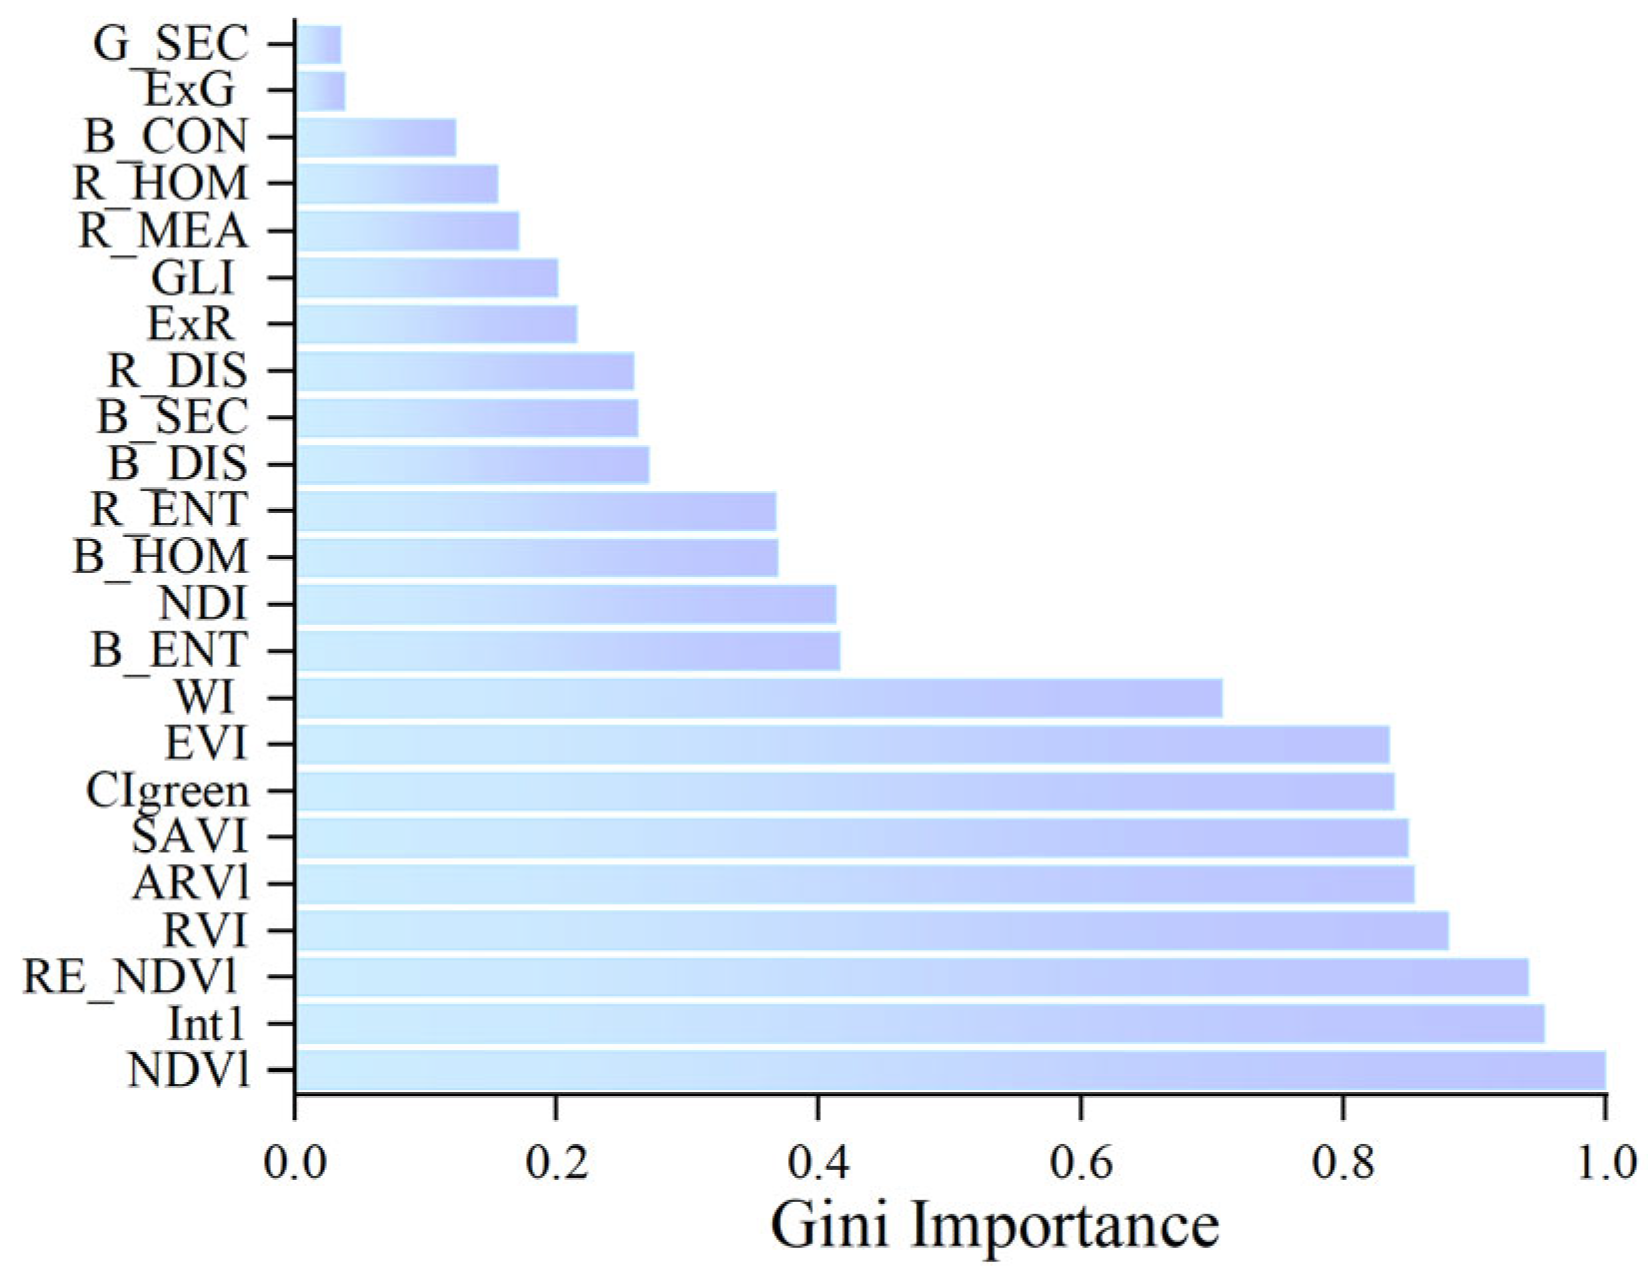
| Experiment | Sowing Date | Sampling/Testing Date | Growth Period |
|---|---|---|---|
| 2024 in Rugao | 14 June | ||
| 4 August | Jointing Stage | ||
| 1 September | Heading Stage | ||
| 30 September | Filling Stage | ||
| 2024 in Taixing | 30 June | ||
| 7 August | Jointing Stage | ||
| 2 September | Heading Stage | ||
| 3 October | Filling Stage |
| Spectral Indices | Formulations | Reference |
|---|---|---|
| RVI (Ratio Vegetation Index) | NIR/R | [24] |
| CIgreen (Green Chlorophyll Index) | NIR/G − 1 | [25] |
| Clrededge (Red-Edge Chlorophyll Index) | NIR/RE − 1 | [25] |
| MDD (Modified Double Difference Index) | (NIR − RE) − (NIR − R) | [26] |
| Int1 (Intensity Index 1 red-edge 1) | (G + R)/2 | [27] |
| Int2 (Intensity index 1 Red-Edge 2) | (G + NIR + R)/2 | [27] |
| Red-Edge NDVI (Red-Edge versions of SR and NDVI) | (NIR − RE)/(NIR + RE) | [28] |
| GARI (Green Atmospherically Resistant Vegetation Index) | NIR − [G − (B − R)] | [29] |
| SIPI (Structure Insensitive Pigment Index) | (NIR − B)/(NIR + R) | [24] |
| ARVI (Atmospherically Resistant Vegetation Index) | [NIR − (R − 2(B − R))]/[NIR + (R − 2(B − R))] | [24] |
| EVI (Enhanced Vegetation Index) | 2.5(NIR − R)/(NIR + 6R − 7.5B + 1) | [30] |
| GNDVl (Green Normalized Difference Vegetation Index) | (NIR − G)/(NIR + G) | [30] |
| NDVI (Normalized Difference Vegetation Index) | (NIR − R)/(NIR + R) | [30] |
| SAVI (Soil-Adjusted Vegetation Index) | 1.5(NIR − R)/(NIR + R + 0.5) | [30] |
| VARI (Visualization Atmospheric Resistance Index) | (G − R)/(G + R − B) | [30] |
| Spectral Indices | Formulations | Reference |
|---|---|---|
| NDI (Normalized Difference Index) | (g − r)/(g + r) | [31] |
| ExG (Excess Green Index) | 2g − r − b | [32] |
| ExR (Excess Red Index) | 1.4r − g | [32] |
| ExGR (Excess Green Minus Excess Red) | ExG − ExR | [32] |
| VARI (Visible Atmospherically Resistant Index) | (g − r)/(g + r − b) | [33] |
| GLI (Green Leaf Index) | (2g − r − b)/(2g + r + b) | [34] |
| WI (Woebbecke Index) | (g − b)/(r − g) | [31] |
| Sample Size | Maximum | Minimum | Mean | Standard Deviation | Variance | CV | |
|---|---|---|---|---|---|---|---|
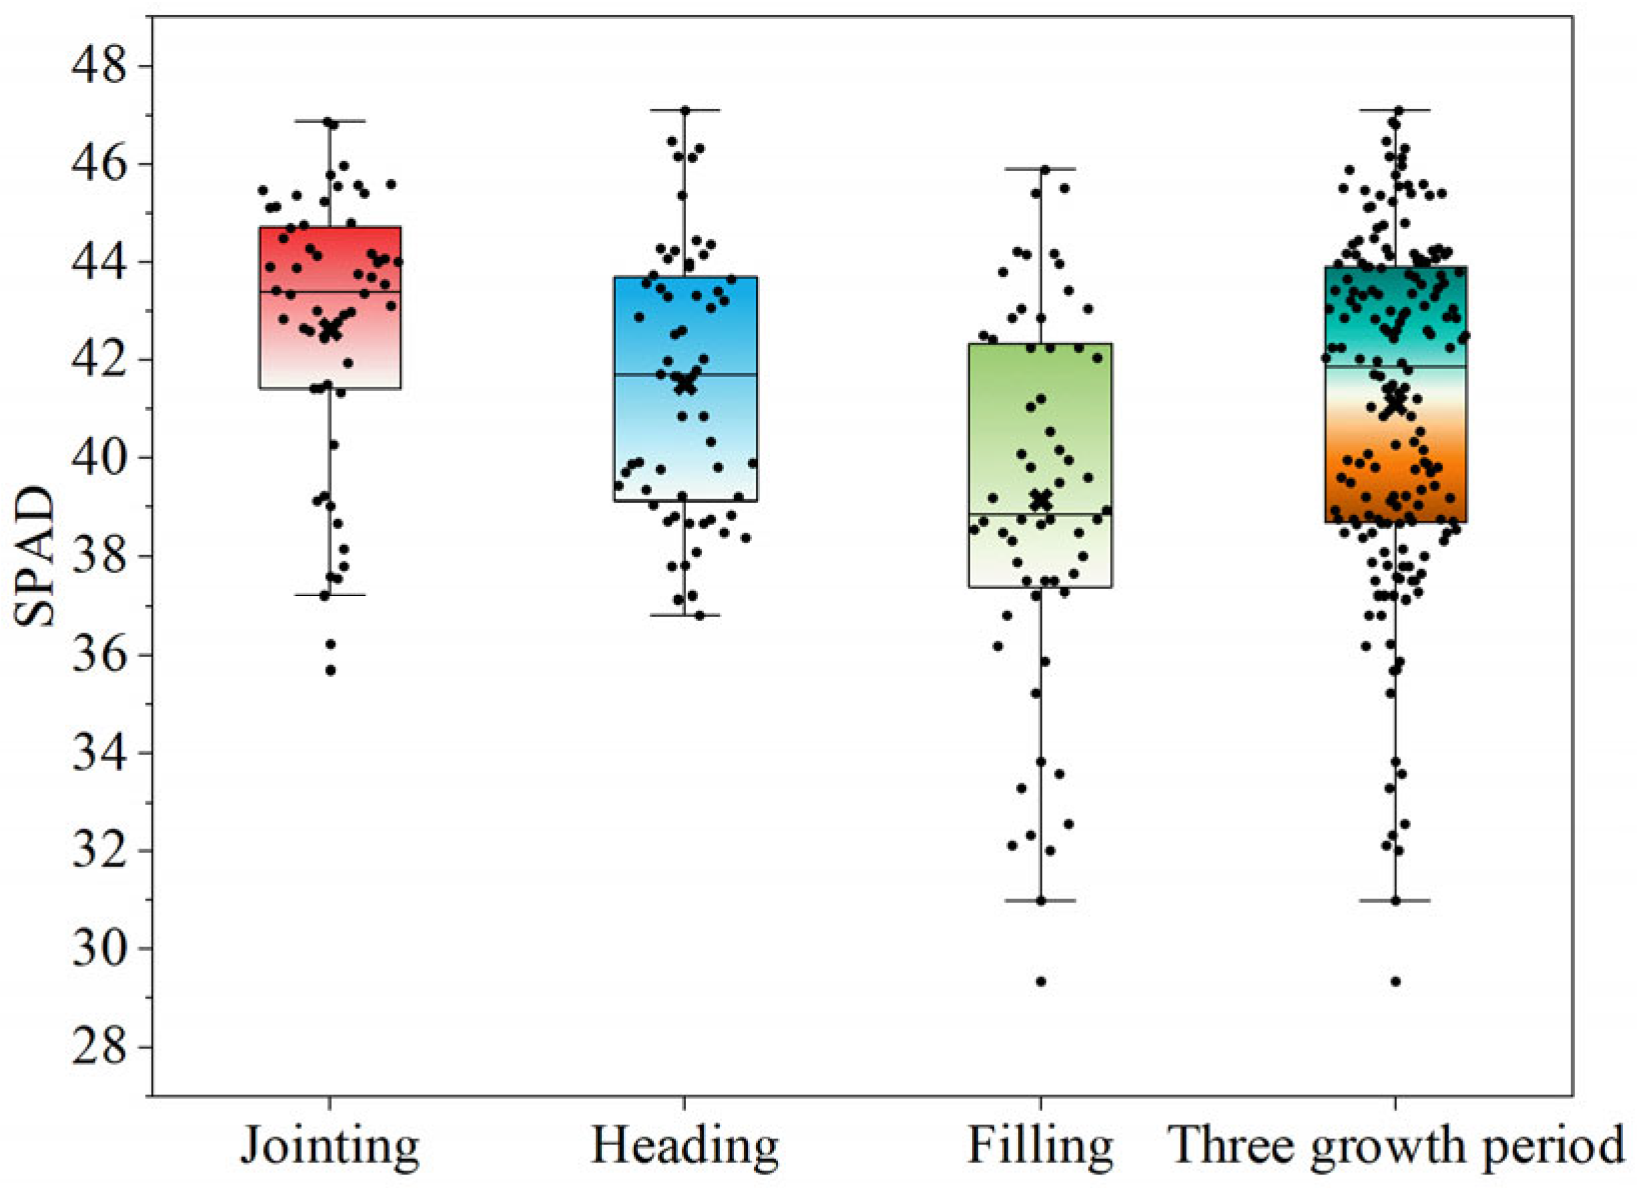
| Three growth period | 180 | 47.10 | 29.34 | 41.10 | 3.52 | 12.42 | 0.085 |
| Jointing | 60 | 46.87 | 35.67 | 42.63 | 2.88 | 8.34 | 0.067 |
| Heading | 60 | 47.1 | 36.81 | 41.53 | 2.73 | 7.47 | 0.065 |
| Filling | 60 | 45.9 | 29.34 | 39.13 | 3.92 | 15.36 | 0.101 |
| Feature | Method | Validation Set | Training Set | ||
|---|---|---|---|---|---|
| R2 | RMSE | R2 | RMSE | ||
| Vegetation Index | Random Forest Regression | 0.78 | 1.872 | 0.92 | 1.247 |
| Partial Least Squares Regression | 0.67 | 3.080 | 0.83 | 2.107 | |
| Extreme Gradient Boosting Regression | 0.75 | 2.302 | 1 | 0.238 | |
| Boosted Regression Tree | 0.76 | 2.236 | 0.88 | 2.098 | |
| Color Index | Random Forest Regression | 0.70 | 2.275 | 0.89 | 1.421 |
| Partial Least Squares Regression | 0.61 | 3.020 | 0.72 | 2.662 | |
| Extreme Gradient Boosting Regression | 0.67 | 2.762 | 1 | 0.001 | |
| Boosted Regression Tree | 0.65 | 2.691 | 0.83 | 1.960 | |
| Texture features | Random Forest Regression | 0.64 | 2.58 | 0.91 | 1.111 |
| Partial Least Squares Regression | 0.55 | 2.992 | 0.69 | 2.331 | |
| Extreme Gradient Boosting Regression | 0.58 | 2.870 | 1 | 0.003 | |
| Boosted Regression Tree | 0.61 | 2.632 | 0.92 | 0.636 | |
| Integration of three features | Random Forest Regression | 0.83 | 1.593 | 0.92 | 1.013 |
| Partial Least Squares Regression | 0.75 | 2.399 | 0.79 | 2.230 | |
| Extreme Gradient Boosting Regression | 0.80 | 1.997 | 1 | 0.000 | |
| Boosted Regression Tree | 0.78 | 2.197 | 0.88 | 1.391 | |
Disclaimer/Publisher’s Note: The statements, opinions and data contained in all publications are solely those of the individual author(s) and contributor(s) and not of MDPI and/or the editor(s). MDPI and/or the editor(s) disclaim responsibility for any injury to people or property resulting from any ideas, methods, instructions or products referred to in the content. |
© 2025 by the authors. Licensee MDPI, Basel, Switzerland. This article is an open access article distributed under the terms and conditions of the Creative Commons Attribution (CC BY) license (https://creativecommons.org/licenses/by/4.0/).
Share and Cite
Su, M.; Cao, W.; Luo, S.; Yun, Y.; Zhang, G.; Zhu, Y.; Yao, X.; Zhou, D. Estimating Rice SPAD Values via Multi-Sensor Data Fusion of Multispectral and RGB Cameras Using Machine Learning with a Phenotyping Robot. Remote Sens. 2025, 17, 3069. https://doi.org/10.3390/rs17173069
Su M, Cao W, Luo S, Yun Y, Zhang G, Zhu Y, Yao X, Zhou D. Estimating Rice SPAD Values via Multi-Sensor Data Fusion of Multispectral and RGB Cameras Using Machine Learning with a Phenotyping Robot. Remote Sensing. 2025; 17(17):3069. https://doi.org/10.3390/rs17173069
Chicago/Turabian StyleSu, Miao, Weixing Cao, Shaoyang Luo, Yaze Yun, Guangzheng Zhang, Yan Zhu, Xia Yao, and Dong Zhou. 2025. "Estimating Rice SPAD Values via Multi-Sensor Data Fusion of Multispectral and RGB Cameras Using Machine Learning with a Phenotyping Robot" Remote Sensing 17, no. 17: 3069. https://doi.org/10.3390/rs17173069
APA StyleSu, M., Cao, W., Luo, S., Yun, Y., Zhang, G., Zhu, Y., Yao, X., & Zhou, D. (2025). Estimating Rice SPAD Values via Multi-Sensor Data Fusion of Multispectral and RGB Cameras Using Machine Learning with a Phenotyping Robot. Remote Sensing, 17(17), 3069. https://doi.org/10.3390/rs17173069


