Article

Geometry and Topology Preservable Line Structure Construction for Indoor Point Cloud Based on the Encoding and Extracting Framework

1
Department of Geographic Information Science, School of Internet of Things, Nanjing University of Posts and Telecommunications, Nanjing 210023, China
2
Smart Health Big Data Analysis and Location Services Engineering Lab of Jiangsu Province, Nanjing University of Posts and Telecommunications, Nanjing 210023, China
*
Author to whom correspondence should be addressed.
Remote Sens. 2025, 17(17), 3033; https://doi.org/10.3390/rs17173033
Submission received: 19 July 2025 / Revised: 21 August 2025 / Accepted: 29 August 2025 / Published: 1 September 2025
(This article belongs to the Special Issue Point Cloud Data Analysis and Applications)

Abstract

The line structure is an efficient form of representation and modeling for LiDAR point clouds, while the Line Structure Construction (LSC) method aims to extract complete and coherent line structures from complex 3D point clouds, thereby providing a foundation for geometric modeling, scene understanding, and downstream applications. However, traditional LSC methods often fall short in preserving both the geometric integrity and topological connectivity of line structures derived from such datasets. To address this issue, we propose the Geometry and Topology Preservable Line Structure Construction (GTP-LSC) method, based on the Encoding and Extracting Framework (EEF). First, in the encoding phase, point cloud features related to line structures are mapped into a high-dimensional feature space. A 3D U-Net is then employed to compute Subsets with Structure feature of Line (SSL) from the dense, unstructured, and noisy indoor LiDAR point cloud data. Next, in the extraction phase, the SSL is transformed into a 3D field enriched with line features. Initially extracted line structures are then constructed based on Morse theory, effectively preserving the topological relationships. In the final step, these line structures are optimized using RANdom SAmple Consensus (RANSAC) and Constructive Solid Geometry (CSG) to ensure geometric completeness. This step also facilitates the generation of complex entities, enabling an accurate and comprehensive representation of both geometric and topological aspects of the line structures. Experiments were conducted using the Indoor Laser Scanning Dataset, focusing on the parking garage (D1), the corridor (D2), and the multi-room structure (D3). The results demonstrated that the proposed GTP-LSC method outperformed existing approaches in terms of both geometric integrity and topological connectivity. To evaluate the performance of different LSC methods, the IoU Buffer Ratio (IBR) was used to measure the overlap between the actual and constructed line structures. The proposed method achieved IBR scores of 92.5% (D1), 94.2% (D2), and 90.8% (D3) for these scenes. Additionally, Precision, Recall, and F-Score were calculated to further assess the LSC results. The F-Score of the proposed method was 0.89 (D1), 0.92 (D2), and 0.89 (D3), demonstrating superior performance in both visual analysis and quantitative results compared to other methods.

Graphical Abstract

1. Introduction

The Light Detection and Ranging (LiDAR) provides an efficient way of acquiring high-precision 3D spatial information. By recording the emission and return of laser pulses, it obtains accurate 3D coordinates of target surfaces and generates dense point-based representations of real-world geometric structures and their spatial configurations. These capabilities have led to its widespread application in layout estimation, scene understanding, object recognition, and related domains [1]. Although point cloud data provide abundant 3D spatial information, they inherently lack explicit semantic content and are characterized by massive data volumes, which make processing and analysis particularly challenging [2]. Consequently, extracting meaningful information and developing concise representations of 3D models have become key research focuses in point cloud processing. Particularly, in practical applications such as Building Information Modeling (BIM), floor plan drawing, indoor mapping, robotics navigation, and digital twin construction, LSC plays a critical role by providing essential data for applications in these fields.
As a geometric representation form for point cloud data, the line structure uses lines and vertices as basic elements to effectively capture key geometric features such as edges, corners, and contours within point cloud data, significantly simplifying the complexity of point cloud representation [3,4]. Among existing methods, the Line Structure Construction (LSC) based on surface segmentation intuitively takes the boundaries of locally fitted planes within point clouds as the foundation for constructing line structures, which can effectively simplify large-scale point cloud datasets. However, such approaches are highly sensitive to factors such as noise and non-uniform sampling, often leading to over-segmentation or under-segmentation of planar patches. As a result, the extracted geometric structures frequently exhibit fractures and redundancies and struggle to preserve the geometric integrity and topological connectivity of line structures [5,6]. Directly Line fitting methods, such as Hough-transform-based LSC methods, extract straight-line features by identifying highly consistent point sets in parameter space and represent the local structure of point clouds through a collection of line segments. Furthermore, in order to construct topological relationships among line segments, some studies have employed multi-dimensional projection techniques, projecting line segments from different directions onto neighboring planes and inferring connectivity through the detection of intersections and adjacency relationships, thereby forming the line structure. However, as these methods inherently assume ideal straight-line geometries, their capability to represent curved features or complex boundary variations is limited [7]. Consequently, the generated line structures often suffer from local geometric and topological incompleteness. Constructing complete line structure representation requires not only the extraction of isolated line segments but also the consideration of their geometric integrity and topological connectivity. In terms of point cloud feature representation, the tensor voting (TV) method leverages the relative positional relationships within a point’s neighborhood to vote on its tensor features. The resulting tensor matrix undergoes eigenvalue decomposition, enabling feature encoding and extracting of its different geometric dimensions. This approach, similar to Principal Component Analysis (PCA), differs fundamentally in its principles. Methods such as multi-scale TV and feature encoding based on PCA have been proposed to compute point cloud Subsets with Structure feature of Line (SSL), which form the basis for reconstructing more complete and hierarchically organized line structures [8,9]. With the development of deep learning techniques, neural network-based methods for point cloud feature extraction have gained increasing attention. Models such as PointNet and its variants directly process point coordinates to extract both local and global features, significantly improving the ability to recognize point cloud structures. However, due to issues such as sparse sampling, occlusion, noise, and data incompleteness, these methods often experience difficulties in producing geometrically complete and topologically coherent results. Feature extraction outcomes frequently suffer from detail loss or structural disconnections [10,11]. Hence, RANdom SAmple Consensus (RANSAC) is usually adopted. By identifying maximal consensus sets amidst noisy data, RANSAC can robustly fit basic geometric primitives such as lines and planes, and partially compensate for missing data. However, it focuses solely on minimizing geometric fitting errors and disregards the inherent topological relationships among points [12]. As a result, the extracted shapes are typically isolated and lack global structural continuity and hierarchy, thereby limiting their effectiveness in complete structure modeling. Thus, achieving the extraction of line structures preserving geometric integrity and topological connectivity within point cloud data still remains a significant challenge.
To address these challenges, the Encoding and Extracting Framework (EEF) is designed for the line structure features of point clouds, and the Geometry and Topology Preservable LSC (GTP-LSC) method is proposed. Firstly, in the Encoding phase, the line features of the point cloud are encoded in multiple dimensions and then fed into a 3D U-Net model. By leveraging the detail preservation capabilities of deep learning models, SSL are computed. Secondly, in the Extracting phase, spatial discretization is performed on the SSL, and based on the topological preservation properties of Morse theory, the topological line structure constrained by SSL is generated. Thirdly, the geometric integrity and topological connectivity of the line structure is further optimized. Based on Constructive Solid Geometry (CSG) modeling principles, incomplete line structures are structurally inferred, with the specific parameters optimized using RANSAC. Through these processes, the GTP line structure is ultimately constructed.
This paper aims to construct line structures from indoor point clouds while preserving both geometric and topological features. The 3D U-Net is employed to process multi-dimensional features and compute the SSL. Innovatively, Morse theory is applied to ensure topological connectivity. Geometric optimization is performed using CSG and RANSAC, ensuring the preservation of both topological connectivity and geometric integrity of the line structures. The main contributions are as follows: (1) The SSL is computed based on deep learning and multi-dimensional feature encoding, which effectively represents the high-dimensional information of line structures and improves the accuracy and efficiency of LSC. (2) The initially extracted line structure is generated using the Morse theory to preserve topological relationships, thereby addressing the lack of topological information in traditional methods. (3) The line structure is optimized based on CSG and RANSAC to address the incomplete geometric and topological features. (4) The evaluation metric specifically for line structures is designed, based on the intersection and union operations of the 3D buffer of the line structure to compute the IBR. Precision, Recall, and F-score are then calculated, providing quantitative metrics for the evaluation of LSC results. In addition, the proposed GTP-LSC is validated and compared with related methods across different datasets. The proposed method preserves the geometric and topological features of line structures, which provides a new approach for indoor point cloud processing.
The remainder of this article is organized as follows: Section 2 reviews existing works, providing a detailed analysis of their advantages, limitations, and applicable scenarios. Section 3 presents the proposed GTP-LSC based on the EEF. Section 4 analyzes the experimental process, evaluating the performance of the proposed method in comparison with different methods and datasets. Section 5 summarizes the research and discusses potential directions for future work.

2. Related Works

Line structures represent an important form of point cloud data, where the geometric integrity and topological connectivity significantly influence the usability of the extracted line structures. The computation and extraction of line structure from point clouds involve processes such as point cloud feature representation and geometric structure computation. Therefore, this section analyzes existing methods from the following two perspectives:

2.1. Point Cloud Feature Representation

Traditional point cloud feature representation methods are typically classified into three categories: intrinsic-attribute-based methods, PCA-based methods, and statistical feature-based methods. Intrinsic-attribute-based methods utilize inherent properties of point clouds, such as color and intensity, and are commonly applied in scene recognition and object detection. For instance, RGB and intensity values facilitate point cloud feature extraction and geometric interpretation, enhancing overall analysis capability [13]. Although effective in capturing such intrinsic attributes, these methods typically require high-quality data and may experience significant performance degradation under noisy or irregularly sampled conditions. The second category, PCA-based methods, leverages PCA to extract geometric features such as points, lines, and surfaces. PCA employs covariance matrices to capture local geometric characteristics effectively [9]. To deal with outliers or noise in surface segmentation, Nurunnabi et al. demonstrated that the robust diagnostic PCA (RDPCA) enhances segmentation accuracy for large-scale point clouds [14], showing strong robustness against noise and non-uniform sampling. Additional methods, including normal vector estimation, curvature analysis, and multi-scale TV are also widely adopted for feature representation. Normal vectors and curvature methods effectively capture surface and local geometry, while multi-scale TV provide richer geometric details through neighborhood consensus or multi-scale analysis. For example, multi-scale methods have successfully extracted geometric ridgelines from point clouds [15], and neighborhood feature aggregation approaches significantly improve segmentation performance [16]. Nevertheless, these PCA-based methods are still sensitive to data noise and quality variations. Statistical feature-based methods form the third category and primarily utilize neighborhood statistical descriptors or histogram-based representations. The Fast Point Feature Histogram (FPFH) method effectively encodes local geometric distributions into histograms, proving valuable for point cloud registration and object detection tasks [17]. Similarly, local surface descriptors using histogram-based analysis strengthen geometric representations and improve segmentation accuracy [18]. Despite their efficacy on high-quality datasets, statistical methods are particularly susceptible to fluctuations in sampling density and data quality. In general, traditional feature encoding methods provide straightforward and intuitive feature extraction but lack sufficient expressiveness when dealing with high-noise, irregularly sampled, or geometrically complex point cloud datasets.
Recently, deep learning techniques have achieved widespread success in point cloud feature representation. PointNet and PointNet++, as pioneering frameworks, first introduced end-to-end neural architectures directly operating on raw point clouds [19,20]. These methods independently map each point into a feature space, using symmetric functions such as max pooling to aggregate global features, thereby effectively handling the unordered nature of point clouds. This strategy ensures permutation invariance and robust global geometric information extraction. However, PointNet struggles to model local spatial relationships among points adequately. To overcome this limitation, PointNet++ introduced hierarchical feature learning, leveraging hierarchical sampling and local region grouping to extract multi-scale local geometric features, thereby significantly enhancing adaptability to uneven sampling and local structural variations. PointCNN adapts convolutional neural networks (CNNs) for point cloud processing. Due to the unordered and sparse nature of point cloud data, traditional CNN architectures designed for regular grids are not directly applicable. Hence, PointCNN proposes an X-Conv module, learning an X-transformation matrix to reorder and weight local point sets, transforming them into a suitable structure for convolutional operations [21]. Alternatively, VoxelNet employs a voxelization strategy, converting point clouds into structured 3D voxel grids compatible with 3D CNN architectures [22]. This approach partitions point clouds into fixed-size voxel units, extracts local geometric features within each voxel, and encodes these features into dense tensors for further processing. Building upon the voxelization framework, the U-Net architecture further enhances feature representation, particularly excelling in dense and complex scenarios [23]. U-Net utilizes a symmetric encoder–decoder structure that progressively extracts hierarchical spatial features during downsampling and recovers high-resolution details through skip connections integrating low-level spatial information with high-level semantic information during upsampling. In semantic or instance segmentation tasks, this significantly improves object delineation and complex boundary recognition, balancing computational efficiency and robustness, and providing a comprehensive feature extraction strategy for voxel-based point cloud processing. Moreover, other deep learning frameworks, such as Graph Convolutional Networks (GCNs), have been successfully applied to point cloud feature extraction [24]. Despite remarkable progress, deep learning approaches continue to face significant challenges, notably high computational complexity, demanding hardware requirements, and intricate feature encoding schemes. These factors currently limit computational efficiency, presenting a bottleneck for processing large-scale point cloud datasets.

2.2. Geometric Structure Computation

Geometric structure computation is a fundamental task in point cloud processing. Early methods primarily relied on traditional techniques, such as eigenvalue decomposition, curvature analysis, and statistical graph-based methods, to extract basic geometric structures, including points, lines, and planes. For instance, multi-scale TV techniques have been effectively employed to extract geometric primitives from unstructured point clouds [8]. With the advent of deep learning approaches, geometric structure extraction has significantly advanced, benefiting tasks involving the extraction of planar, linear, and point-based structures. Subsequent processing typically includes feature classification, segmentation, and shape recognition. For example, the FACETS plugin facilitates geological plane extraction from unstructured 3D point clouds, and CAD-based fusion methods extract line segments, offering innovative solutions for segmentation and practical modeling tasks [25]. For simpler geometric features, the Hough Transform is effective at extracting linear structures with high precision, providing robust geometric descriptions [7]. Tian et al. proposed a projection-based method to divide the input point cloud into vertical and horizontal planes, projecting adjacent point clouds onto the corresponding planes, extracting the boundary points of each plane, and converting these boundary points into line segments [5]. This approach is relatively simple but works well in both high-quality Terrestrial Laser Scanning (TLS) data and low-quality RGB-D point clouds, ensuring accurate and stable geometric feature extraction. Globfit employs global relationship discovery for geometric fitting, ensuring consistency among geometric elements within point clouds [26]. Lu et al. significantly enhanced traditional line detection algorithms to improve computational efficiency without compromising accuracy. Their improved method supports automated transformation of complex point clouds into structured CAD geometric models [27]. Yang et al. used photogrammetric meshes and 3D point clouds, then fused the data to extract line features of the building, constructing the building footprint and indoor floor plan [28]. Based on this, they inferred the wall structure of the building and constructed a 3D BIM wall with certain geometric and topological features. The study demonstrated that for buildings with regular geometric structures, constructing a 3D building model based on line features is a feasible method. Gao et al. segmented the indoor point cloud into wall and roof, and projected the wall points onto a horizontal plane to form line segments, which were then used to construct room polygons [29]. By combining the geometric shape of the roof point cloud, the 3D building model was ultimately generated. This method is straightforward, constructing and preserving certain geometric and topological features. For complex geometries, alternative approaches emphasize object-oriented segmentation, structural decomposition, CSG and hierarchical tree-based recognition methods. Fayolle introduced an evolutionary algorithm that extracts object-structure trees from 3D point clouds for effective shape decomposition and reconstruction. This method efficiently identifies complex structures and robustly reconstructs their hierarchical geometry [30]. In large-scale unorganized point cloud processing, Lin et al. proposed an optimized algorithm for line segment extraction, achieving superior accuracy and computational efficiency tailored specifically for massive datasets [3]. Wang et al. developed a semantic line-framework approach for indoor architectural modeling using backpack laser scanning data. By identifying linear features and establishing semantic line frameworks, their method accurately reconstructs indoor spatial layouts, significantly improving building model precision [31]. Nevertheless, these geometric extraction methods often encounter decreased accuracy due to the presence of noise, incomplete data, and varying sampling densities. Although deep learning techniques have markedly enhanced segmentation and geometric feature recognition performance, they remain challenged by noisy or incomplete datasets [2].
Following initial line extraction, further processing typically involves line segmentation, classification, boundary detection, and structural feature extraction. Layout extraction and structural inference are critical aspects of point cloud processing. Gao et al. introduced an iterative RANSAC-based method for detecting line segments, optimizing connections between fragmented segments to reconstruct coherent building floorplan topology. By iteratively enhancing geometric completeness and topological connectivity, their method robustly handles data noise and incompleteness [12]. Schnabel et al. presented an efficient RANSAC algorithm designed for automatic detection of geometric shapes in point clouds, employing localized sampling strategies and delayed cost evaluations to significantly improve computational efficiency and robustness, particularly beneficial for large-scale datasets [32]. Although these methods have shown substantial progress, they generally lack sufficient consideration of topological information, limiting their effectiveness in geometric shape fitting, segmentation, classification, and line extraction tasks. Persistent Homology has emerged as a valuable approach for extracting line structures by capturing persistent topological features within point clouds. Nonetheless, persistent homology techniques often encounter structural redundancy and incompleteness, especially in datasets with complicated geometric configurations. For example, Sousbie introduced the concept of the Persistent Cosmic Web, applying persistent homology from Topological Data Analysis (TDA) to model and extract filamentary structures from cosmic-scale datasets [33]. This method provides novel insights into hidden non-Euclidean structures in sparse or irregularly distributed scientific data. However, persistent homology frequently struggles to accurately capture complex shapes, rapidly changing densities, or highly nonlinear geometric features, highlighting its limitations for intricate geometries. To address these practical challenges in topological modeling, Tierny et al. developed the Topology Toolkit (TTK), an open-source software integrating diverse topological analysis algorithms [34]. Widely applied in scientific visualization and complex shape modeling, TTK significantly enhances analytical capabilities for unstructured datasets [35]. Nevertheless, noise and irregularities in real-world point clouds can generate redundant topological features, complicating subsequent analysis. Conversely, critical topological structures may become obscured in densely sampled or highly distorted regions, leading to missing essential features. These limitations indicate that current topological modeling methods require further optimization and integration with complementary geometric modeling techniques to effectively handle complex, high-dimensional geometric structures in point clouds. In addition, regarding the evaluation of line structure experimental results, the ISPRS indoor modeling benchmark was established to address the lack of unified evaluation standards and benchmark datasets in the automated reconstruction of indoor 3D models. It provides a comprehensive evaluation system for this purpose. Khoshelham et al. introduced a benchmark dataset for indoor modeling and proposed a framework for evaluating modeling results based on three aspects: Geometric, Semantics, and Spaces and Topological Relations [36]. This framework was further refined in subsequent work [37]. Later, they used the framework and metrics to conduct a detailed quantitative evaluation of indoor modeling methods on predefined datasets, assessing them from the perspectives of Completeness, Correctness, and Accuracy [38]. These studies primarily focus on evaluating 3D models for indoor modeling. However, since the LSC method focuses on extracting point cloud line structures and is insensitive to surface structures, it excludes fine surface variations during line structure reconstruction. Therefore, the evaluation methods designed for 3D entity models are not fully applicable to LSC methods.
To address the limitations of current methods and enhance the completeness of line structures, the paper proposes the GTP-LSC that integrates multi-dimensional feature encoding, Morse theory, and CSG modeling principles. First, the high-dimensional line feature is encoded by combining multi-dimensional feature, and the SSL are computed using the 3D U-Net to capture the related point subsets. Then, by the spatial discretize of the SSL, Morse theory is introduced, and topology-preserving line structures are initially generated, which maintains the continuity and consistency of topological structures during the extraction process. Finally, based on CSG modeling principles, the RANSAC algorithm is employed to optimize the result, thereby preserving both the geometric integrity and topological connectivity of the extracted line structures. In addition, the LSC result is assessed based on the designed IBR and related metrics.

3. Methods

3.1. The Encoding and Extracting Framework

To address the challenges of preserving geometric integrity and topological connectivity for complex indoor LiDAR point clouds, this section details the proposed GTP-LSC method. Based on the EEF, it aims to accurately extract line structures while maintaining both geometric integrity and topological connectivity. The method consists of three phases: Encoding, Extracting, and GTP. In the Encoding phase, geometric features relevant to line structures are encoded using PCA and curvature analysis. These features are then input into the 3D U-Net model to compute the SSL, generating a high-dimensional feature representation sensitive to line structures. In the Extracting phase, an initially extracted line structure is generated from the computed SSL, and Morse theory is applied to preserve topological connectivity during the initial extraction. Finally, the GTP phase refines the line structure by using the CSG principle to complete geometric features and RANSAC to optimize structural parameters. This process ensures that the final GTP line structure robustly preserves both geometric details and topological relationships. This paper proposes an innovative GTP-LSC method aimed at construction line structures from indoor point clouds. The method utilizes 3D U-Net for multi-dimensional feature processing to compute SSL, and innovatively applies Morse theory to the extracted feature fields to ensure topological connectivity. Finally, the GTP is performed on the construction results using CSG and RANSAC, ensuring both the topological connectivity and geometric integrity of the line structure. Additionally, to comprehensively evaluate the extraction results, a specialized evaluation metric tailored to line structure is designed, suitable for assessing the quality of the LSC result. The technical workflow of the proposed method is shown in Figure 1.

3.2. Encoding Phase

3.2.1. Line Feature Encoding

PCA is applied to extract the dominant geometric characteristics of point cloud data through linear transformation, which enables a more compact representation while retaining essential structural information. For a given point p in the point cloud P, a local neighborhood Ω p is constructed using a fixed search radius r , comprising all neighboring points within that radius [39]. For each local neighborhood, a covariance matrix is computed. Suppose the neighborhood contains n points, each denoted as a three-dimensional coordinate p i ( x i , y i , z i ) . The first step involves computing the centroid p ¯ of the neighborhood, defined as Equation (1):
p ¯ = 1 n i = 1 n p i
Next, the covariance matrix C of the neighborhood point cloud is computed. The covariance matrix is defined as Equation (2):
C =   1 n i = 1 n ( p i p ¯ ) ( p i p ¯ ) T
Subsequently, eigenvalue decomposition is performed on C , yielding three eigenvalues λ 1 ,   λ 2 ,   λ 3   and their corresponding eigenvectors v 1 ,   v 2 ,   v 3 , as expressed in Equation (3):
C v i = λ i v i   , i = 1,2 , 3
The eigenvalues are sorted in descending order ( λ 1 λ 2 λ 3   ), which quantify the variance along each eigenvector direction. The related eigenvectors indicate the corresponding geometric preference, as depicted in Figure 2. The dimensional features are encoded and visualized based on the related eigenvalues, which contributed the geometric feature of point, line, and planar, respectively.
In this article, the second and third principal components are utilized to represent the linear and planar features of the point cloud, with the related eigenvalues of λ 2 , λ 3   are selected as the line feature encoding results, i.e., f 1 , f 2 , as shown in Equation (4).
f 1 f 2 : λ 2 , l i n e   f e a t u r e               : λ 3 , s u r f a c e   f e a t u r e
While eigenvalues λ 2 and λ 3   individually capture the primary dimensional characteristics of the local line structure, the curvature provides a quantitative measure of how significantly the local surface deviates from a flat plane. Hence, it can be taken as the third encoded line feature, i.e.,   f 3 . This measure is essential for distinguishing between flat surfaces, sharp edges, and corners, thereby facilitating detailed structural analysis. Based on PCA-derived eigenvalues sorted in ascending order, the curvature is computed as an estimate of surface variation. This approach leverages the fact that the smallest eigenvalue, λ 1 , corresponds to variance along the direction of the surface normal. Consequently, a relatively small λ 1 indicates that neighboring points lie closely along an ideal planar surface. To achieve a normalized and robust curvature estimation, curvature is calculated as the ratio of the smallest eigenvalue to the sum of all three eigenvalues, as expressed in Equation (5):
f 3 = λ 1 λ 1 + λ 2 + λ 3  
To visualize different dimensional features, experiments were conducted using the line feature encoding method, with results presented in Figure 2. In Figure 2, (a) illustrates the PCA-encoded line feature f 1 , highlighting the primary geometric distribution of the point cloud along specific directions; (b) presents surface feature f 2 , emphasizing the flat characteristics of local regions, while partially reflecting linear structural attributes; and (c) displays curvature feature f 3 , capturing the local surface bending relative to a planar approximation. These encoded features enable effectively learning of detailed line structural characteristics from point clouds, thereby enhancing the EEF’s capability to understand and recognize complex scenarios.

3.2.2. SSL Computing

Following the preprocessing and feature calculation stages within the encoding phase, structural features of the point cloud data are further extracted using a deep learning framework. In this study, the 3D U-Net is selected as the baseline model for SSL computation for several reasons: firstly, although U-Net is a relatively basic neural network architecture, it excels at preserving edge features, which is particularly suitable for line feature extraction in this research. Secondly, the processing pipeline in this study involves converting the raw LiDAR point cloud into a voxel representation. The 3D U-Net naturally accepts voxelized input, whereas other advanced point cloud semantic segmentation models are primarily designed for raw, discrete point clouds and significantly differ from this voxel-based workflow, making them not directly applicable here. Furthermore, 3D U-Net is primarily used for the preliminary extraction of SSL. Even if its output exhibits some local fractures or discontinuities, this does not fundamentally affect the subsequent steps of line structure construction, as the method includes GTP phase to handle such issues. Additionally, extreme performance tuning of the U-Net during the SSL extraction phase is not essential. Based on these considerations and to ensure model efficiency, a more complex baseline model is not adopted. Therefore, the 3D U-Net architecture is adopted for this purpose. Derived from the conventional U-Net model, the 3D U-Net is specifically tailored for spatially structured three-dimensional data, such as voxelized point clouds. It employs a symmetric encoder–decoder architecture integrated through skip connections, enabling efficient extraction of hierarchical features and subsequent reconstruction of detailed spatial information.
The encoding stage of the 3D U-Net architecture progressively captures hierarchical geometric features through multiple layers of 3D convolution and pooling operations. In the encoder component, multiple convolutional and pooling layers progressively extract features from the input data. Convolutional layers at each stage capture local geometric patterns, while the deep hierarchical structure facilitates abstraction of global features. Pooling operations progressively reduce spatial resolution, enabling the network to effectively encode higher-level, abstract structural information. Let F i represent the feature map at the i -th convolutional layer. The convolutional operation is formulated as shown in Equation (6):
F i + 1 = σ w i * F i + b i
where w i denotes the convolution kernel, b i is the corresponding bias term, σ (·) is an activation function (e.g., ReLU), and * indicates the 3D convolution operation. Each convolutional layer extracts local geometric patterns, while deeper layers abstract global features by progressively reducing spatial resolution via pooling operations. Thus, the encoder converts the original data into an encoded, low-dimensional representation, as shown in Equation (7):
F e n c o d e d = ε ( F i n p u t )
where ε represents the encoder mapping.
The decoding stage aims to reconstruct the high-resolution spatial details from these encoded features through upsampling operations. Using upsampling layers, the decoder incrementally restores spatial resolution, converting abstracted low-level features into detailed, high-resolution outputs. Each decoding step is expressed as shown in Equation (8):
F i + 1 = U p S a m p l e F i
where UpSample(·) represents the spatial upsampling operation, commonly implemented via interpolation or transposed convolution. A key feature of the 3D U-Net is its use of skip connections, which bridge corresponding layers of the encoder and decoder. These connections integrate low-level, detailed information from encoder layers with high-level features from decoder layers. Formally, this concatenation is defined as shown in Equation (9):
F i d e c o d e = C o n c a t ( F i u p s a m p l e d ,   F i e n c o d e )
where F i u p s a m p l e d denotes the upsampled features from the decoder, and F i e n c o d e represents corresponding features from the encoder. This mechanism enables the network to restore detailed geometric structures by preserving fine-grained information lost during downsampling, thereby significantly improving the accuracy and completeness of the reconstruction.
The implemented 3D U-Net adopts a five-layer symmetric encoder–decoder structure, employing 3 × 3 × 3 convolutional kernels. Channel counts incrementally increase from 32 up to 256 within the encoder and symmetrically decrease back to 64 in the decoder, as shown in Figure 3. The voxelized point cloud data is input to the network in the form of grids sized 128 × 128 × 128. The input features to the 3D U-Net are multi-dimensional, specifically derived from PCA and curvature computation as shown in Equation (10):
F i n p u t = { x ,   y ,   z ,   f 1 ,   f 2 ,   f 3 }
These features represent spatial coordinates and geometric descriptors that capture both linear and planar characteristics of the input point cloud. Through the combined effect of successive convolutional and upsampling operations, the network outputs a high-quality structural representation of the point cloud, i.e., SSL. This process can be formally expressed as the decoder mapping, as shown in Equation (11):
F S S L = Ɗ   ( e n c o d e   { x ,   y ,   z ,   f 1 ,   f 2 ,   f 3 } )
The 3D U-Net is trained with binary labels assigned to each point. A label of 1 indicates that the point belongs to the SSL, defined as the buffer region around the ground truth line structure with the same size of the voxel grid. A label of 0 indicates that the point does not belong to the SSL. Consequently, the SSL can be obtained directly from the 3D U-Net output with the label of 1, and no further thresholding is required. Accordingly, the selected 6-dimensional vector output (without the label) by the network maintains the same structure as the input: the first three dimensions represent spatial coordinates, and the latter three correspond to enhanced geometric features. This design ensures consistent handling of spatial information and geometric attributes. This SSL extraction process effectively captures both global structural context and local geometric details while suppressing redundant information and noise. Due to the architectural robustness of the 3D U-Net, the extracted SSL demonstrates significant resistance to common data imperfections such as noise, sparsity, and incomplete structures. The resulting SSL not only accurately preserves the essential geometric patterns embedded in the original data but also establishes a reliable foundation for the subsequent topological structure extraction and geometric optimization stages. This 6-dimensional output vector is directly used as input data for subsequent processes, providing a reliable foundation for the later topological structure extraction and geometric optimization stages, thereby establishing a clear data flow.

3.3. Extracting Phase

3.3.1. Line Structure Representing

To extract line structures from point cloud data while preserving their topological consistency, this study employs Morse theory as a foundation for generating topologically coherent representations. The core idea of Morse theory is to detect topological changes within the point cloud by analyzing critical points in a scalar field. By constructing a gradient field and examining these critical points, significant topological features embedded in the data can be effectively identified and preserved, ensuring consistency in the structural representation. A fundamental aspect of Morse theory is the analysis of scalar fields through gradient flow. In this work, the scalar field T ( p i ) , derived from curvature, is used to construct a gradient field that describes the direction and magnitude of change at each point. For any point p i , the gradient of the scalar field is computed as Equation (12):
T p i = T x , T y , T z
Here, T ( p i ) denotes the gradient vector of point p i in the x , y , z directions, representing the rate of spatial change at that location. According to Morse theory, critical points are those where the gradient vanishes—i.e., T ( p i ) = 0—indicating the presence of topological transitions. These critical points typically correspond to important structural elements in the point cloud, such as local extrema, saddle points, boundaries, connection points, or inflection regions.
Mathematically, a critical point p c satisfies Equation (13):
T p i = 0
Once critical points are identified, Morse theory facilitates the extraction of the topological structure of the point cloud by analyzing the connectivity among them. This enables classification of the critical points and modeling of their interrelationships, which reveal topological characteristics such as connectivity paths and segmentation boundaries. These insights provide a foundation for subsequent structural analysis and geometric modeling. Morse theory offers a powerful tool not only for uncovering local topological features but also for interpreting the global structural properties of the point cloud. To quantify the topological structure associated with the scalar field, a weighted scalar field matrix W can be introduced, defined as Equation (14):
W = i = 1 n ω i · T p i
where ω i is a weight assigned to point p i , and T p i is the scalar field value derived from the curvature-based Morse field. Through the computation and interpretation of such aggregated measures, the underlying topological structure within the point cloud can be further characterized, providing essential mathematical support for maintaining topological connectivity in subsequent processing steps.

3.3.2. LSC with Topological Connectivity Preserving

Traditional LSC methods often rely on edge detection or purely geometric optimization techniques. In contrast, this study introduces an approach grounded in Morse theory, which incorporates topological information to improve the robustness and global consistency of the extraction process. The objective is to extract significant line structures from point cloud data that effectively capture the object’s essential geometric and topological features in a compact and coherent representation.
Based on the SSL obtained from the 3D U-Net, the point cloud data is voxelized, and Morse theory is applied to analyze the scalar field T ( p i ) . Simultaneously, a 1-stable manifold is constructed from the SSL to enforce spatial constraints and derive the initially extracted line structure. In computations related to persistent homology and Morse theory, the 1-stable manifold refers to the stable manifold of the scalar function   Ζ : M R in the neighborhood of a saddle point, which can be defined by Equation (15):
W s p = { x M   |   lim t + φ t ( x ) = p }
Here, p is an index-1 critical point of Ζ , φ t denotes the trajectory of the gradient flow, and W s p represents the set of all points that converge to p during the gradient descent process. This set is typically approximated on a discrete grid or complex by tracking gradient dual relationships, and is used as the skeletal curve connecting two minima during 1-stable manifold extraction. It is an important component in constructing the Morse–Sample complex and linear structures.
First, a suitable Morse function is selected based on the input data. Since the choice of Morse function directly affects the distribution of critical points and subsequently extracted features, curvature is selected as the scalar field in this work. Next, the Morse–Smale complex is constructed by analyzing the gradient flow of the scalar field. Critical points and their corresponding gradient paths are computed, and connectivity paths between these points within the complex are extracted as the initially extracted line structure. These paths generally align with key features in the data, such as geometric ridges. To optimize the quality of the extracted line structures, an energy function τ is defined as Equation (16):
τ = i = 1 n η i T ( p i ) + β j = 1 n R j
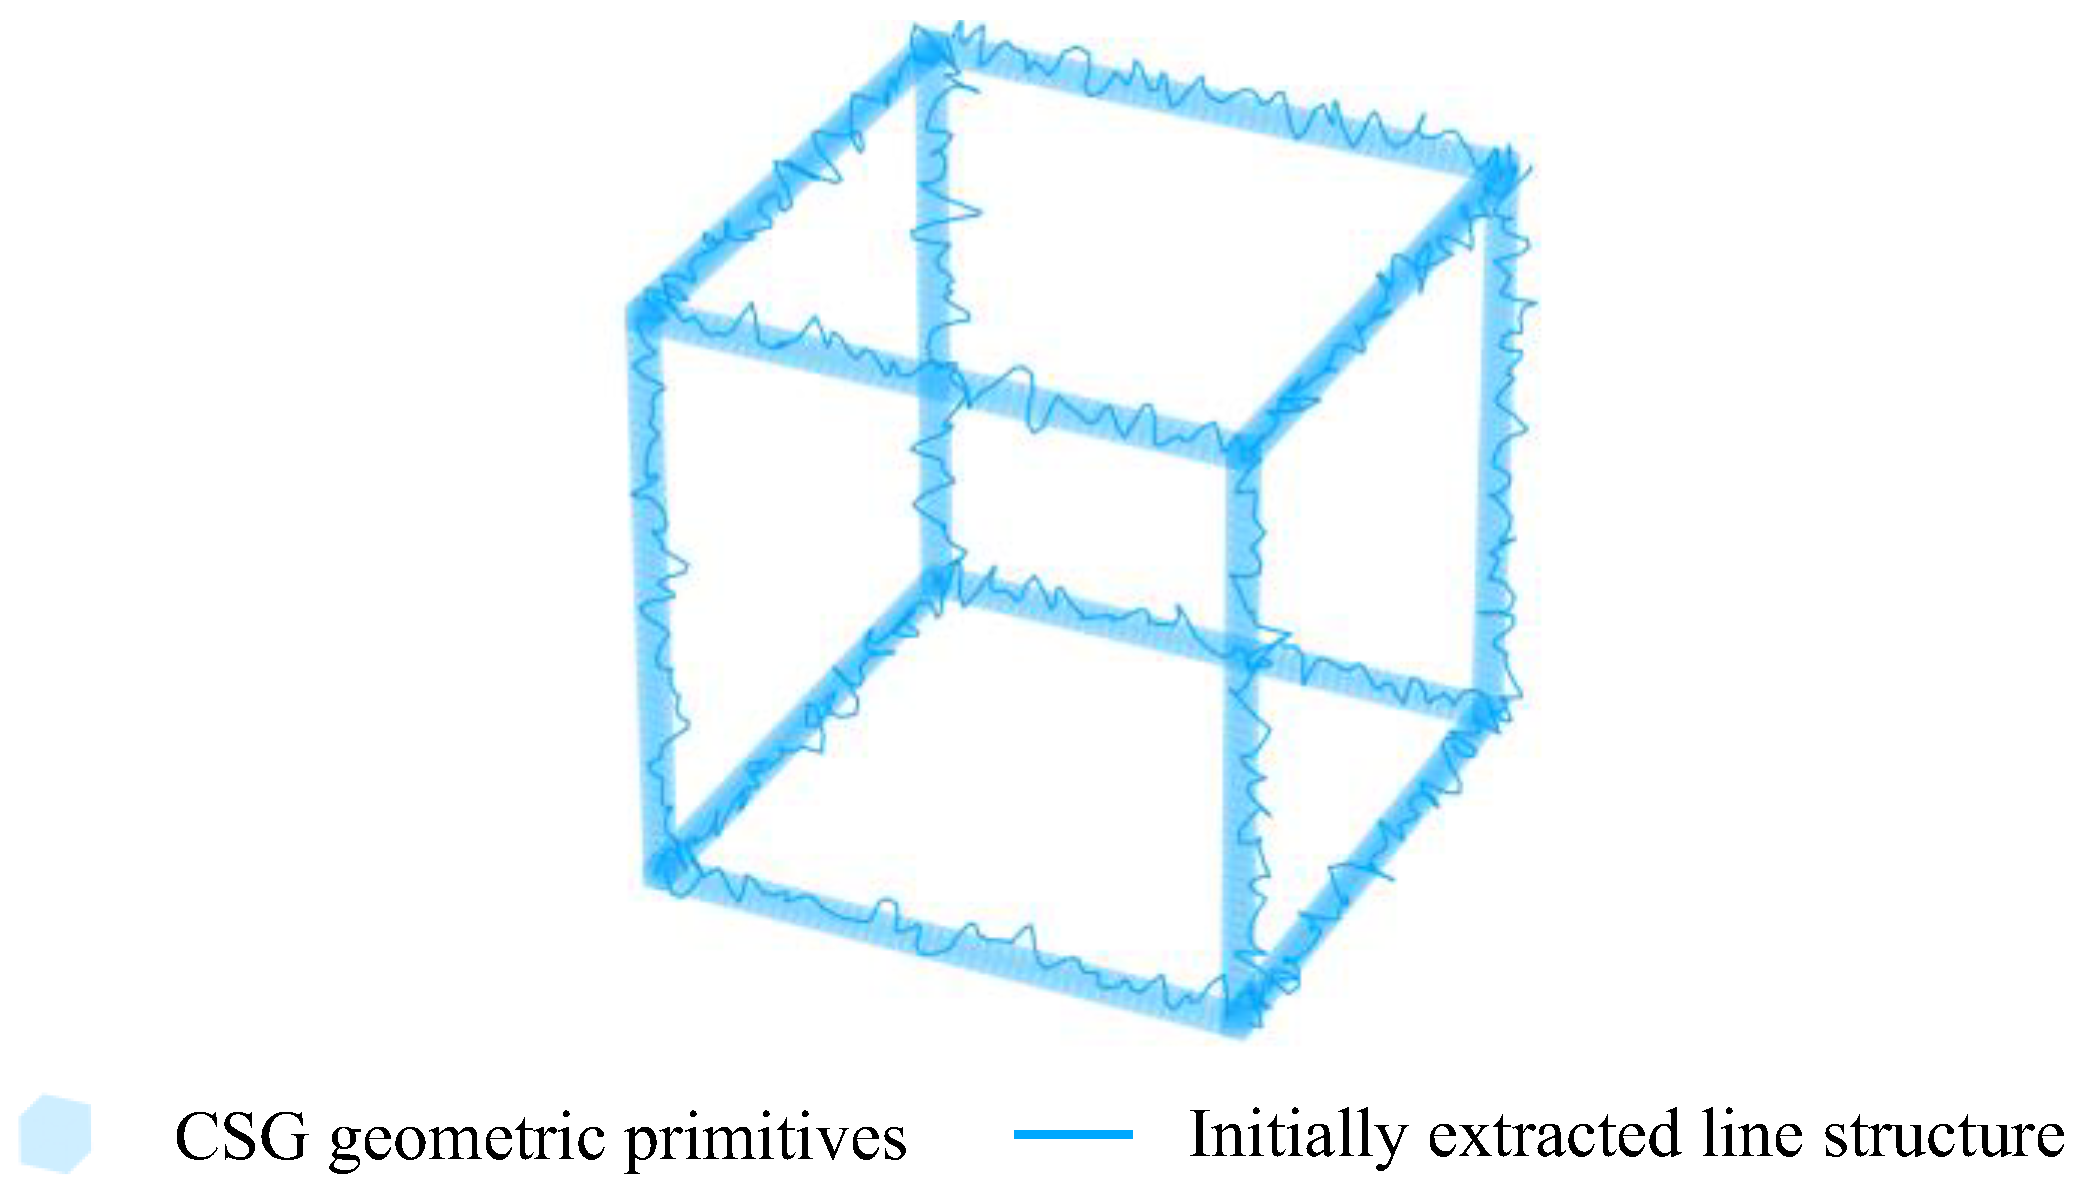
In Equation (16), T ( p i ) represents the gradient magnitude of the Morse function at point p i , reflecting the intensity of local variation. The coefficient η i is a weight determined based on local data properties. The term R j denotes regularization terms, which may include constraints on path length, curvature, or smoothness. The parameter β ( β 0 ) serves as a penalty factor that balances local geometric fidelity against global structural regularity. Here, η i typically takes values within (0,1] to reflect the proportion of local weighting, while β generally takes positive values in (0, +∞), serving as the coefficient that balances local and global regularization terms. In this experiment, 0.1 was used as the test step size for η i and 0.01 for β , and ultimately η i was chosen to be 0.5 and β to be 0.02. By minimizing this energy function, the extracted line structures maintain both geometric accuracy and topological consistency, benefiting from both gradient-based detail and global structural inference. This method’s advantage lies in its capacity to integrate local geometric variations with a global topological perspective via Morse theory, making it especially effective for complex or irregular 3D data. The principle of LSC based on the Morse theory is depicted in Figure 4.
As illustrated in Figure 4, the line structure is initially extracted based on Morse theory. Although the extracted lines exhibit a winding and intricate form in the 3D space, they remain spatially bounded due to the limited extent of the SSL. Moreover, the topological connectivity of the line structures is well preserved.

3.4. Geometry and Topology Preservation

3.4.1. Geometric Structure Decomposing

Constructive Solid Geometry (CSG) is a widely recognized modeling methodology extensively applied in computer graphics and computer-aided design. The fundamental principle of CSG involves the recursive construction of complex three-dimensional solids from basic geometric primitives—such as cubes, cylinders, and spheres—through Boolean operations, specifically union ( ), intersection ( ), and difference ( ). Mathematically, a complex geometric solid S can be expressed as shown in Equation (17):
S = P 1 P 2 · · · P n ,   w h e r e   P i G ,     { , , }
Here, P i represents basic geometric primitives selected from a predefined set of geometric primitives G , and denotes the Boolean operation.
A prominent advantage of the CSG approach lies in its capability to map irregularly structured line segments extracted from point clouds into boundary representations (B-rep) of solid models. This approach significantly simplifies structural representation and improves computational efficiency by minimizing the complexity inherent in Boolean expressions. The essential idea of CSG is to construct a solid model as a Boolean combination of a finite number of primitive elements, typically defined as half-spaces or regular sets.
In the context of the proposed method, CSG theory is leveraged to refine and optimize the initial line structures extracted via Morse theory, transforming them into geometrically regular forms suitable for downstream modeling applications. Initial line structures extracted via Morse theory provide a topologically consistent yet geometrically irregular representation. The Morse theory extraction inherently captures critical points and topological connectivity (1-stable manifold) within the original point cloud, as shown in Equation (18):
L i n i t i a l = { L i   |   L i   e x t r a c t e d   b y   M o r s e   t h e o r y }
Topological consistency in this context refers to the preservation of the topological characteristics inherent in the original point cloud data—such as connectivity and critical structural relationships—captured during the Morse-based extraction process. Unlike conventional LSC methods that often neglect global topological coherence, the proposed approach establishes initial topological connectivity during the extracting phase by analyzing critical points and the associated 1-stable manifold. This ensures that the resulting line structures possess intrinsic topological integrity.
However, while these initial line structures effectively capture the topological skeleton of the 3D geometry and reflect the topological skeleton of the scene, they may still suffer from geometric irregularities such as fragmentation, noise, and inconsistent curvature. Such geometric imperfections hinder their direct application in precise structural modeling and optimization tasks requiring precise solid modeling or structural optimization.
To mitigate these geometric irregularities, geometric decomposition and regularization based on the CSG framework are employed. Specifically, each irregular line segment L i is decomposed into a combination of standardized geometric primitives, as shown in Equation (19):
L i { P i , 1 , P i , 2 , . . . , P i , m } ,   P i , j G
Subsequently, Boolean operations are recursively applied to these primitives to generate a geometrically consistent and regularized representation, S i as shown in Equation (20):
S i = ( ( ( P i , 1 P i , 2 ) · · · ) P i , m ,   { , , }
The final optimized geometric structure, L C S G is thus the set of all regularized structures derived from the initial set, as shown in Equation (21):
L C S G = S i   |   S i   i s   t h e   r e g u l a r i z e d   l i n e   s t r u c t u r e   o f   L i
By recursively applying these Boolean combinations, the CSG-based process ensures that the resulting geometric representation, L C S G maintains the original topological features inherent to the Morse-based extraction. This preservation of connectivity can be expressed as shown in Equation (22):
𝜛 ( L C S G ) 𝜛 ( L i n i t i a l )
where 𝜛 ( ) denotes the topological mapping. Consequently, this combined approach rectifies geometric irregularities while preserving topological integrity, yielding line structures that are both geometrically precise and topologically consistent. The correspondence between the initially extracted topological line segments and their regularized geometric primitives through CSG optimization is illustrated in Figure 5.

3.4.2. Line Structure Optimizing

After the geometric structure decomposition, the resulting line structure still contains geometric irregularities and noise. To further enhance geometric integrity, RANSAC is applied to each CSG primitive for geometric regularization. RANSAC is a robust iterative optimization algorithm well-suited for extracting regular geometric objects from noisy or incomplete datasets. In this study, RANSAC is employed to fit rectangular geometric models to the line structures processed by the CSG framework, aiming to eliminate geometric anomalies while maintaining the geometric integrity of the line structure. At the same time, the inherent topological connectivity established through Morse theory and the CSG framework is preserved. The line structure optimization process via RANSAC can be formally described as follows:
(1) Randomly select a minimal subset of points p i i = 1 m from the vertices of the initially extracted line structure. Fit an axis-aligned rectangular model, parameterized by ϕ , to this point subset.
(2) For each point p j in the complete set of points p j j = 1 n , calculate the perpendicular distance d j ϕ to the hypothesized rectangular model.
(3) Define a distance threshold   ξ , typically within the range 0.01 ≤   ξ   ≤ 0.1. When the threshold is set too low ( ξ < 0.01), the overly strict fitting criterion causes a large proportion of valid points to be misclassified as outliers, thereby compromising the stability and completeness of the model. Conversely, when the threshold is too high ( ξ > 0.1), excessive noise points are accepted as inliers, diminishing the effectiveness of geometric regularity optimization. A range of 0.01 ≤ ξ ≤ 0.1 achieves a balance between geometric accuracy and tolerance, effectively filtering noise and outliers while retaining sufficient valid points to ensure reliable fitting of the rectangular model.
Classify points as inliers if their distance satisfies Equation (23):
γ = 1 , i f d i ϕ < ξ 0 , o t h e r w i s e
(4) Evaluate the support for each hypothetical rectangular model by counting its inliers, depicted as Equation (24):
ϕ ^ = arg m a x ϕ i = 1 n γ d i ϕ   ξ
Here, ϕ ^ denotes the optimal parameter set of the rectangular model to be estimated; ϕ represents the model parameters; d i ϕ is the perpendicular distance from point   p i to the model. By iteratively sampling and fitting hypothetical rectangular models, it evaluates the model support and selects the one with the highest inlier count as the final regularized line structure. The process ensures that the generated line structure exhibits improved geometric regularity while preserving the topological connectivity established during the CSG processing.

3.4.3. Geometric Feature Completing and GTP Validating

In the process of line structure optimization, the objective is twofold: enhancing geometric regularity and preserving topological consistency. However, the application of the RANSAC algorithm may result in isolated or disconnected rectangular components due to data noise, outliers, or local geometric misalignments. To address such topological disruptions, this study employs the 1-stable manifold, derived during the extracting phase, as a reference framework to reconstruct missing topological connections.
Specifically, consider two rectangular structures R a and R b exhibiting a topological disconnection within the optimized line structure. The optimal reconnection path can be determined by tracing the 1-stable manifold M, defined as in Equation (25):
Μ = p ( t )   |   p ( t ) R 3 ,   t 0,1 ,   T ( y ( t ) )   | |   p ( t ) ,   p ( 0 ) R a , p ( 1 ) R b
where p ( t ) is a continuous path along the gradient flow of the Morse function T , connecting rectangle R a to R b . When a topological disconnection is detected between two rectangles, the corresponding 1-stable manifold in the point cloud is traced to identify this optimal reconnection path. This ensures that the resulting structure forms a cohesive, topologically consistent network. By reconstructing these connections, the optimized structure retains essential topological properties originally captured via Morse theory while concurrently improving geometric regularity.
The method is particularly effective in scenes where the initial point cloud contains loops or enclosed spaces. In such cases, the approach extracts corresponding closed curves and reconfigures the line structure to form a topologically complete rectangular network after RANSAC fitting, ensuring that complex topological features are preserved throughout the optimization process.
To systematically evaluate the topological consistency of the optimized line structure, a graph-based topological representation is employed. The optimized line structure is formally represented as an undirected graph G ( V ,   E ) , where vertices V correspond to rectangle vertices, and edges E represent adjacency relationships or connections between rectangles or their sides. Since the line structures derived via Morse theory inherently encode topological connectivity, the connected components of G reflect the fundamental topological characteristics of the original point cloud.
The topological consistency of the optimized line structure can be quantitatively assessed using the Euler characteristic ψ G , defined as a topological invariant. The Euler characteristic is computed as shown in Equation (26):
ψ G = V E + F
where V , E , and F represent the number of vertices, edges, and closed faces in the graph G , respectively. The Euler characteristic derived from the initial Morse-based structure, denoted as ψ ( G M o r s e ) , serves as a baseline. The difference ψ between the Euler characteristic of the optimized graph, ψ ( G o p t i m i z e d ) , and the baseline quantitatively reflects the extent of topological alteration, as shown in Equation (27):
ψ = ψ ( G o p t i m i z e d ) ψ ( G M o r s e )
A significant deviation (large ψ ) indicates potential topological inconsistencies, such as missing or redundant connections introduced during RANSAC fitting. To mitigate these deviations, the RANSAC parameters (e.g., distance threshold ξ ) are iteratively refined, and connectivity relationships are recalibrated by referencing the 1-stable manifold until an acceptable ψ is achieved. This iterative optimization procedure maintains a balanced trade-off between geometric regularity and topological fidelity. In the experiments, high noise levels or severe sparsity in the point cloud data can lead to errors in identifying local connectivity. Despite these potential factors, the Euler characteristic, as a global topological invariant, remains an effective metric for evaluating topological changes and the integrity of the extracted line structures in most non-extreme cases. On the other hand, local spurs/gaps can perturb E or F , and hence the Euler characteristic. To mitigate this, the following strategies are employed:
(a) Graph pruning (remove spurs shorter than τ c ; merge near-collinear segments with angle < τ θ ); τ c is used to determine the spur length, and τ θ is for the angle to identify near-collinear segments;
(b) Persistence thresholding to discard low-stability faces;
(c) Assess ψ jointly with auxiliary topology metrics (component count, average shortest-path length).
To further enhance global geometric and topological coherence, boundary constraints derived from the Constructive Solid Geometry (CSG) representation are incorporated. The CSG model provides global reference boundaries B C S G defined via Boolean operations of geometric primitives. The optimized line structure is projected onto the boundary surfaces of the CSG model to verify and refine its spatial alignment. Formally, let each rectangular element R i be projected onto the CSG boundary, as shown in Equation (28):
R i = P r o j B C S G ( R i )
If a rectangle edge deviates significantly from the boundary surface defined by the CSG representation, positional adjustments are applied to align it with the CSG-defined boundaries, as shown in Equation (29):
R i * = a r g   min R i R i R i ,   R i B C S G
This boundary-constrained adjustment ensures geometric accuracy and topological coherence, aligning the optimized line structures precisely with the global geometric model represented by CSG.
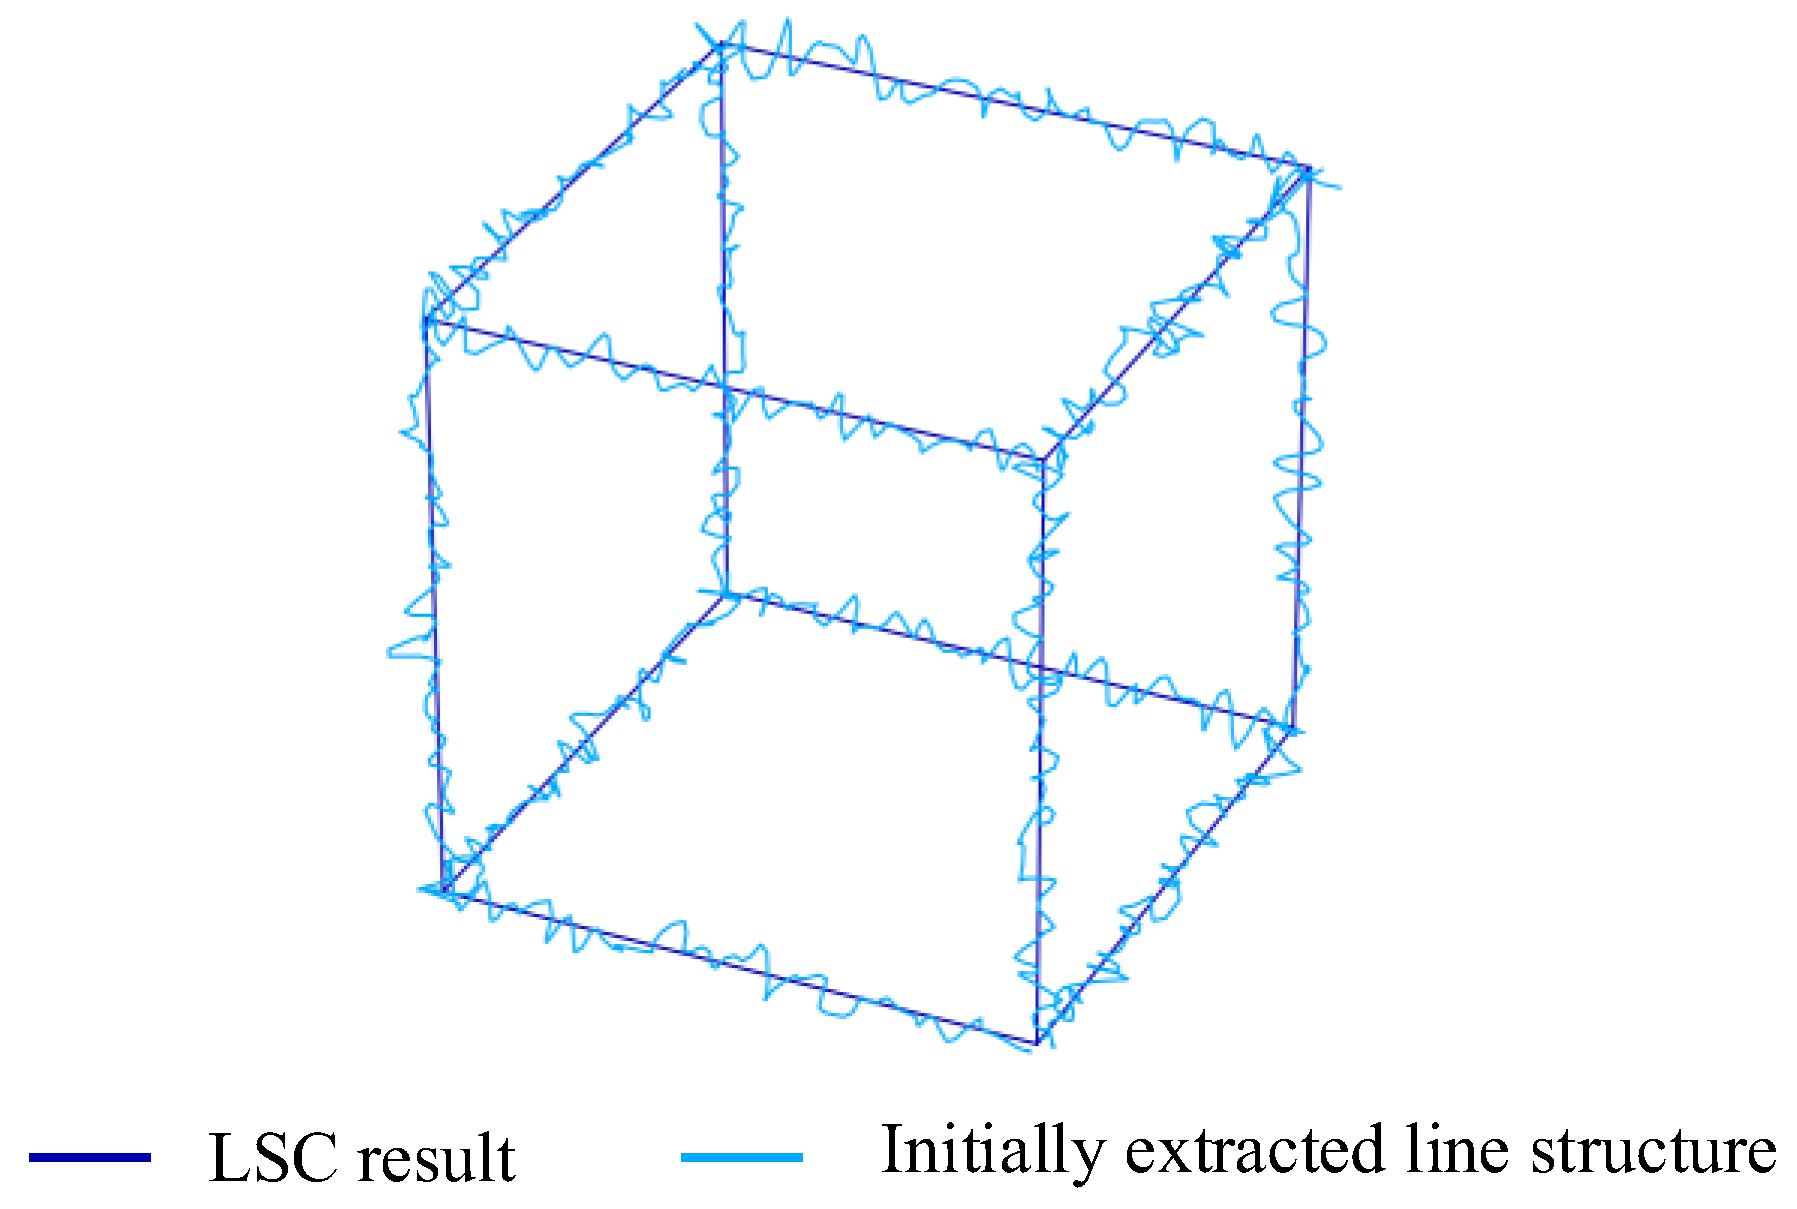
Furthermore, the 1-stable manifold Μ provides detailed, fine-grained connectivity relationships, supplementing the CSG- and RANSAC-based optimizations by recovering local topological connections potentially overlooked during previous steps. Through this combined approach—integrating Morse theory, CSG constraints, and RANSAC fitting—multi-scale topological and geometric consistency is systematically achieved. The final geometry- and topology-preserved (GTP) line structures produced by this methodology are visually demonstrated in Figure 6.
As shown in Figure 6, it presents the results of line structure construction using the proposed GTP-LSC method. The curved lines represent the initial topologically connected structures, while the cuboid wireframes illustrate the regularized line structures. The GTP-LSC approach is designed to generate line structures that maintain both geometric regularity and topological consistency.

3.5. The GTP-LSC Algorithm

The GTP-LSC algorithm based on the EEF is designed to process the input point cloud and output the line structure that preserves both geometric integrity and topological connectivity. The algorithm consists of feature encoding, line structure extraction, and the GTP, as outlined in Algorithm 1.
Algorithm 1 GTP-LSC based on EEF.
Input: Point Cloud P, searching distance r
Output: Line Structure LS
//Encoding Phase
FOREACH p in P // for each point in P
   Ωp = Neighborhood(p, r) // search neighborhood
   {f1, f2} = ComputePCA(Ωp) // compute PCA, based on Equations (1)–(4)
   {f3} = ComputeCurvature(Ωp) // compute curvature, based on Equation (5)
END
S = 3DU-Net(p, {f1, f2, f3}) // compute SSL using the U-Net, based on Equations (6)–(11)
//Extracting Phase
Cp = MorseAnalysis(S, f3) // compute critical points based on the Morse theory, based on Equations (12)–(14)
L = BuildLineStructure(Cp) // constructing initial line structure, based on Equations (15) and (16)
//GTP Phase
Lcsg = BuildCSGModel (L) // build CSG model, based on Equations (17)–(22)
LS = OptimizeLineStructure(Lcsg) // optimize line structure, based on Equations (23)–(29)
RETURN LS

4. Materials and Results

This section details the application of the EEF framework and evaluates the performance of the proposed GTP-LSC method through a series of experiments. Section 4.1 introduces the experimental dataset. Section 4.2 discusses line feature encoding and SSL computation. Section 4.3 describes the extraction and optimization of line structures, where CSG principles and the RANSAC method are employed to refine the structure, ensuring that the final line structure preserves both geometric integrity and topological connectivity. Section 4.4 presents the LSC results and comparisons with existing methods, while Section 4.5 further validates the GTP-LSC method by comparing results across different datasets to assess its applicability.

4.1. The Experimental Dataset

This study utilizes the “Indoor Laser Scanning Dataset” [31] as the experimental data (ranging from Scene 1 to Scene 4), available for download at www.mi3dmap.net/datatype1.jsp (accessed on 15 July 2025). The dataset includes various indoor scenes, such as a large indoor parking garage, corridors, and multi-room structures, with point counts ranging from 2.1 million to 8.62 million, representing different levels of geometric complexity and topological features. The dataset D1 represents a large parking garage (approximately 100 × 50 × 5 m3, 7.9 million points), characterized by a simple scene, moderate point cloud density, and low noise. The dataset D2 represents a corridor (approximately 50 × 5 × 3 m3, 2.1 million points), with simple geometric structure, complete coverage, moderate point density, and moderate noise. The dataset D3 represents a multi-room structure (20 × 20 × 3 m3, 8.62 million points), characterized by complex geometric structure, dense coverage, and moderate noise. Detailed descriptions can be found in Table 1.
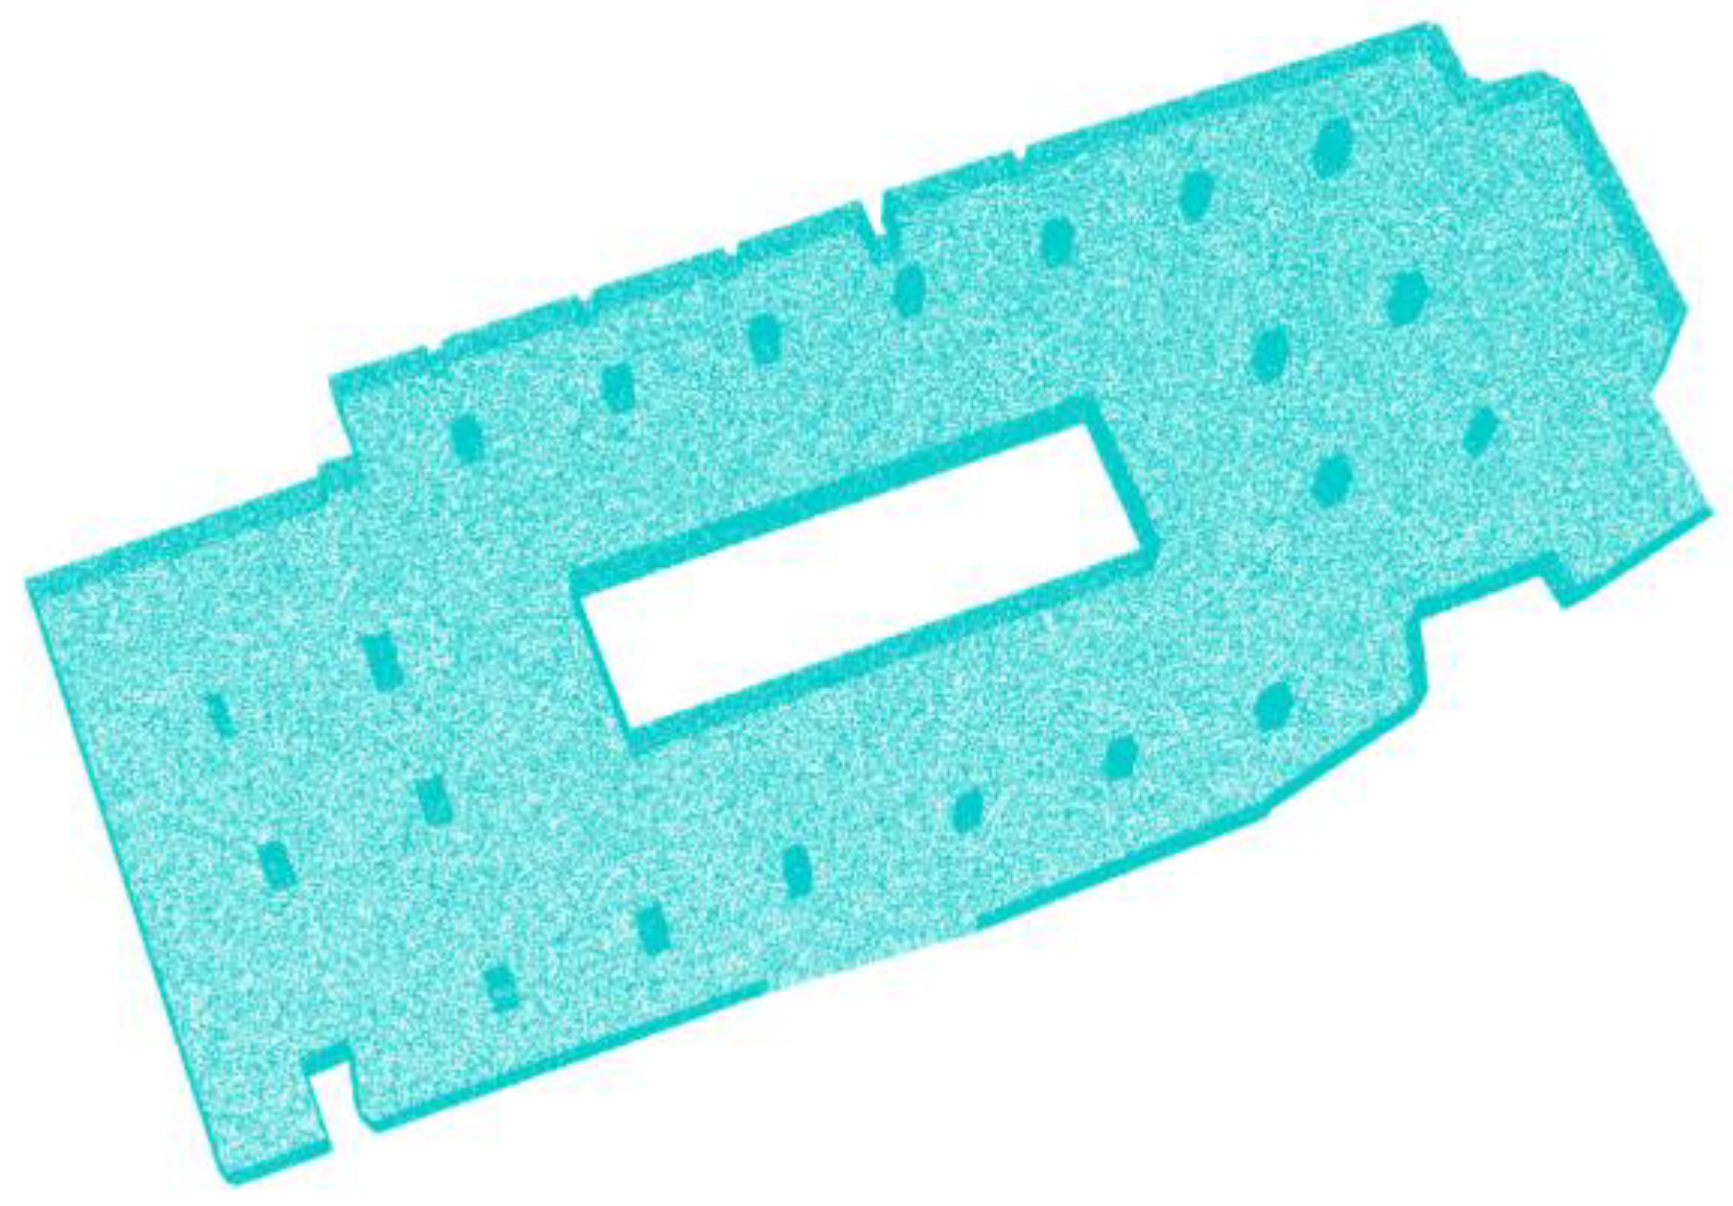
For the initial experiments, the dataset D1 is selected. To visually illustrate the characteristics of this dataset, the raw point cloud of D1 is presented in Figure 7, showing the spatial distribution of points within the parking garage environment.
As detailed in Table 1, dataset D1 features relatively simple geometry with numerous planar and regular structures, complete coverage, medium point density, and low noise levels, making it suitable for validating the feasibility of the proposed method.

4.2. Line Feature Encoding and SSL Computing

For dataset D1, line feature encoding and SSL computing were performed as described in Section 3. The raw point cloud was first voxelized into a 3D grid with a voxel size of 0.1 m3. A voxel size of 0.1 m3 effectively reduces the volume of the original point cloud data, significantly improving the efficiency of subsequent feature encoding and SSL computation, while still retaining the geometric details of key line frame structures in indoor scenes. Therefore, the voxel size is set to 0.1 m3. Features derived from PCA and curvature were combined with the original spatial coordinates, forming a 6-channel input. Statistical filtering was applied (neighborhood point count: 50, standard deviation threshold: 1.0) to remove outliers before feeding the data into the model. The 3D U-Net model is pre-trained using Scene 2 from the indoor laser scanning dataset, which contains 3.85 million points and has a size of approximately 100 × 80 × 5 m3. This scene is characterized by a relatively simple layout, moderate point cloud density, and low to moderate noise levels, with corresponding line data for the scene. The 3D U-Net model was trained for 50 epochs on an NVIDIA RTX 2080Ti * 10 GPU server manufactured by SITONHOLY at Tianjin, China, using the Adam optimizer (learning rate: 0.001, β1: 0.9, β2: 0.999) with a batch size of 4. Training utilized partial point clouds from other datasets, employing a combined cross-entropy and Dice loss function. The trained 3D U-Net model was then applied to the complete point cloud of dataset D1. The resulting output probability map was binarized with a threshold of 0.7, and the extracted high-relevance points were downsampled (sampling rate: 0.05) to generate the SSL.
Figure 8 shows the computed SSL for dataset D1. As depicted, the resulting point cloud (shown in blue) forms a regular line structure that outlines the boundaries and main support columns of the scene. This output exhibits high consistency with the reference spatial structure, validating the model’s effectiveness in localizing relevant line structure areas. The extracted SSL serves as high-quality input for the subsequent line structure extraction and optimization phase.

4.3. Line Structure Extracting and Optimizing

Based on the SSL computed for dataset D1 in the previous step, the line structure extraction phase is conducted. Morse theory was applied to the SSL, with the Morse function derived from point cloud curvature estimation (neighborhood radius set to 0.5 m, k = 30 for k-nearest neighbors). Critical points (maxima, minima, saddle points) were identified, and gradient flow paths were traced using numerical integration (step size: 0.01 m) to construct the initial line structure. Figure 9 shows the initially extracted line structure for dataset D1. This figure displays the line structure derived directly from the Morse theory applied to the SSL. As shown in Figure 9b, the initial line structure constructed with a persistence threshold of 0.01 retains most of the line structure while filtering out the majority of the noise, which is beneficial for subsequent structural optimization. In contrast, Figure 9c,d show the initial line frameworks extracted with persistence thresholds of 0.1 and 0.001, respectively. These result in excessive noise, which negatively impacts the subsequent optimization process. Therefore, after several iterations of fine-tuning the threshold, a persistence threshold of 0.01 is selected as the experimental parameter. It forms a network that covers the boundaries and support column areas of the scene, validating the initial extraction’s ability to capture the main topological layout, as depicted in Figure 9a.
In the GTP phase, to refine the initially extracted line structure and address potential irregularities while ensuring geometric integrity and topological connectivity, CSG principles and the RANSAC algorithm were used for optimization. The RANSAC threshold is determined by the trade-off of different threshold values. As shown in Figure 10b, the distance threshold ξ is set to 0.01 m, in Figure 10c it is set to 0.05 m, and in Figure 10d it is set to 0.1 m. From Figure 10b,d, it can be seen that both too small and too large distance thresholds disrupt topological continuity. Figure 10c largely preserves the topological continuity of the original structure. Therefore, after several iterations, RANSAC parameters were configured with a distance threshold ξ of 0.05 m, a minimum point count for plane/line fitting set to 100, and 1000 iterations. CSG Boolean operations were applied to merge adjacent line segments and improve geometric completeness. Figure 10a shows the optimized GTP line structure for dataset D1. Compared to the initial result in Figure 9, the optimized line structure exhibits enhanced geometric regularity and completeness. Lines are straightened, and connections are refined, while the topological connectivity established during the extraction phase is preserved. This output represents the GTP line structure achieved by the proposed method for dataset D1.

4.4. LSC Results

Dataset D1, representing a large-scale parking garage with planar and regular structures, serves as the validation dataset for evaluating performance in environments with regular geometric features. As detailed previously, the proposed GTP-LSC method extracts SSL using the 3D U-Net model, generates topologically consistent line structures through Morse theory, and optimizes them with RANSAC and CSG.
In comparison, the Facets Extracting (FE) method by Dewez et al. [25] segments the point cloud using a KD-tree and extracts line structures from facet boundaries. The method utilizes several key parameters: max angle (20°) defines the maximum angle threshold between normal vectors of adjacent points, used to determine if points belong to the same plane, with smaller angles requiring stricter plane fitting; max relative distance (1.00) controls the smoothness of small facets by setting a relative distance threshold from the point to the fitted plane; max distance (0.20) sets an absolute distance threshold for the point to the fitted plane, directly controlling the geometric precision of small facet extraction; min points per facet (12) specifies the minimum number of points required to form a valid facet, ensuring statistical reliability and filtering out noisy facets; max edge length (4.00) limits the maximum size of the facet to prevent excessive merging and loss of details. These parameter values represent the standard recommended settings for indoor LiDAR data processing in this method. The Plane Segmentation and Line Fitting-based (PSLF) method by Lu et al. [27] utilizes region growing for plane segmentation, followed by 2D projection and line segment extraction within each plane. Key parameters for this method include the angle threshold (15°), which controls the strictness of plane segmentation during region growing, with smaller angles resulting in finer segmentation; the orthogonal distance threshold (0.01), which sets the vertical distance threshold from the point to the seed plane, determining the geometric precision of the segmentation, where smaller values ensure plane smoothness; and the parallel distance threshold (0.50), which restricts the range of plane expansion to prevent erroneous merging of different planes, with larger values allowing for more extensive plane regions. These parameter settings follow the standard configuration guidelines from the relevant literature. To evaluate the performance of the proposed method, experiments were conducted on dataset D1, and results were compared with those of the FE and PSLF methods.
The experimental results are presented in Figure 11. Figure 11a shows the ground truth line structure of the scene, Figure 11b displays the extraction results of the proposed GTP-LSC method, Figure 11c presents the results of the FE method, and Figure 11d shows the PSLF method results. As seen from the figure, the proposed method produces a more complete and geometrically accurate line structure compared to the baseline methods. The GTP-LSC result shown in Figure 11b, compared to the ground truth line structure in Figure 11a, preserves the line framework relationship more clearly and completely. In contrast, the FE method result in Figure 11c and the PSLF method result in Figure 11d exhibit more chaotic topological features and noticeable line framework crossings. The GTP-LSC method optimizes and fits the line segments by introducing CSG and RANSAC geometric constraints. This approach not only filters out false line segments caused by noise but also optimizes the geometric integrity of the line segments while maintaining the topological connectivity of the model. As a result, it avoids the common chaotic topology and undesirable line framework crossings observed in the FE and PSLF methods.

4.5. LSC Results for Different Datasets

To further validate the robustness of the proposed GTP-LSC method, additional experiments were conducted on two scenes from the “Indoor Laser Scanning Dataset”: Scene 3 (Corridor, referred to as dataset D2) and Scene 4 (Multi-room structure, referred to as dataset D3). Following the same pipeline as in dataset D1, the GTP-LSC method was applied to extract SSL using the 3D U-Net model, generate topologically consistent line structures with Morse theory, and optimize them via RANSAC and CSG.
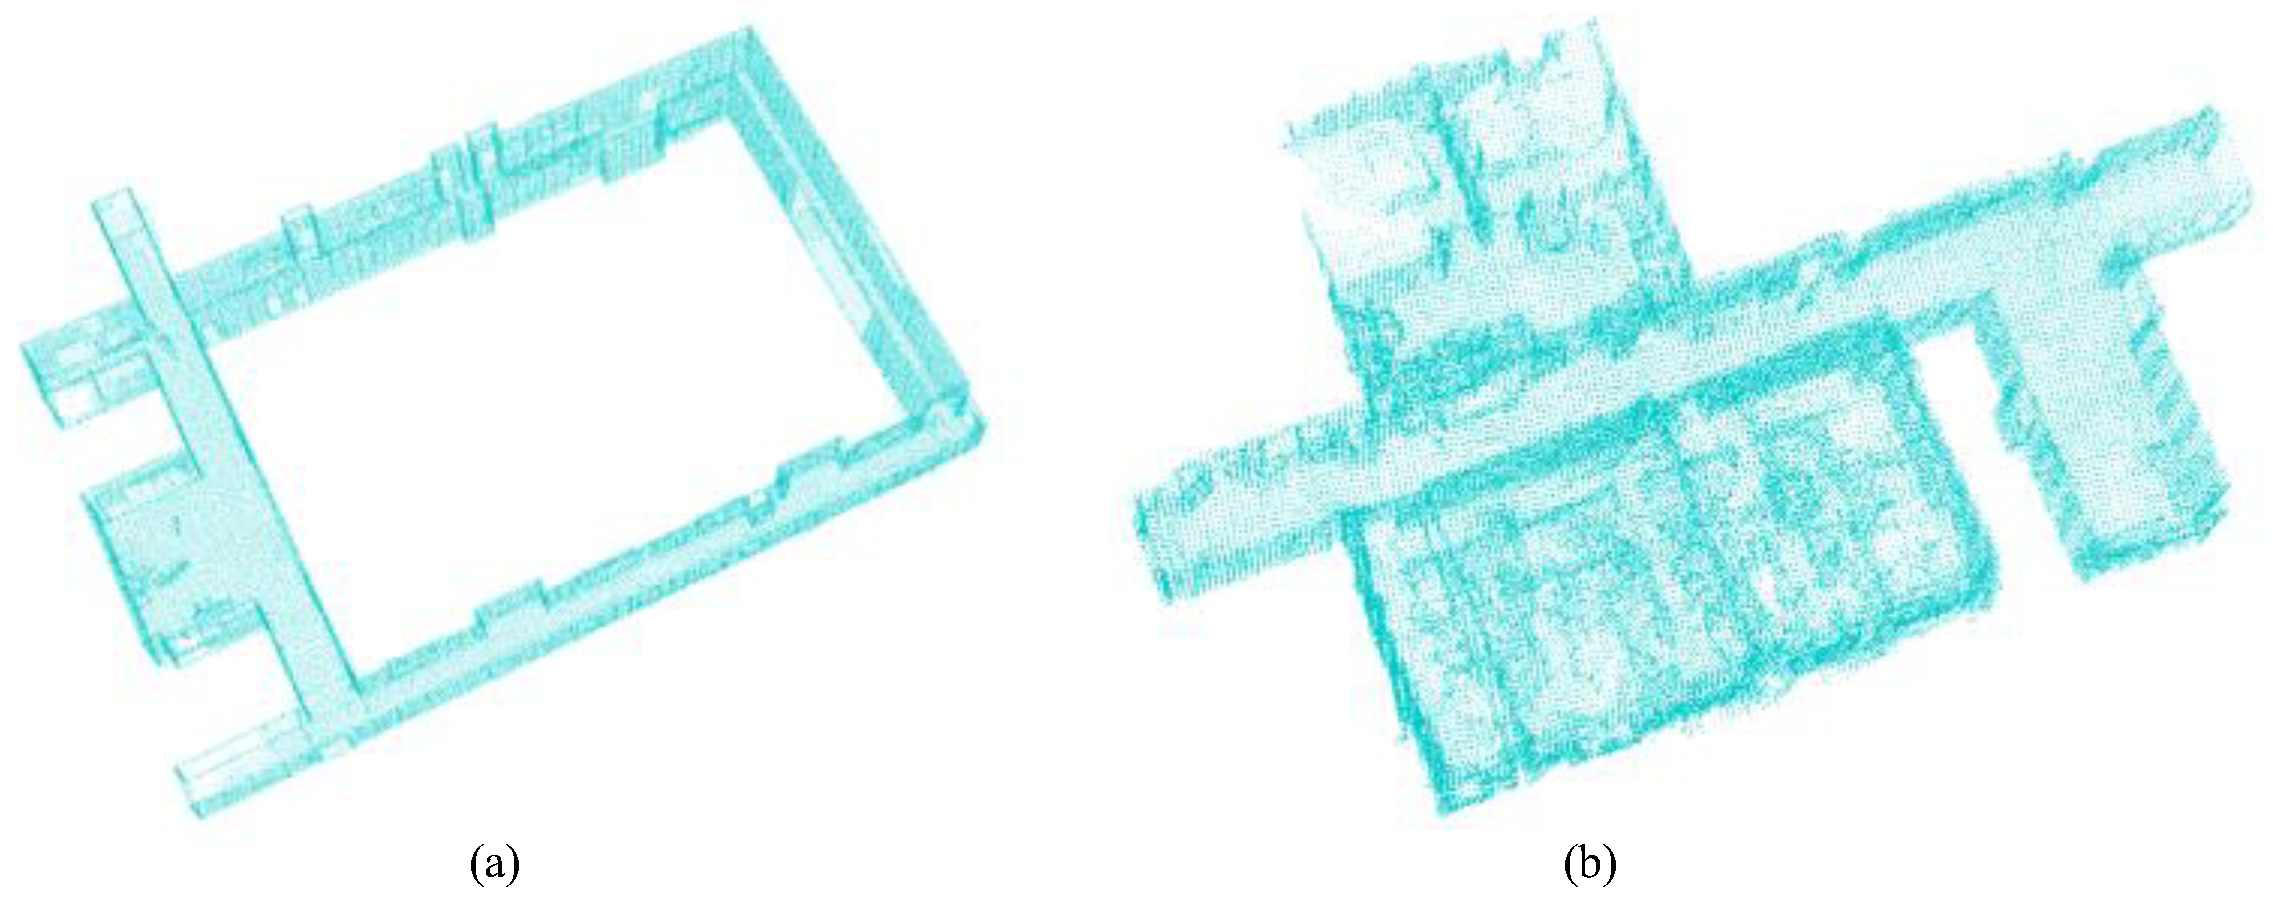
Figure 12 illustrates the raw point clouds and spatial distributions of D2 (Figure 12a) and D3 (Figure 12b). Dataset D2 represents a corridor environment. Dataset D3 represents a multi-room structure. These diverse scene types provide a solid foundation for assessing the method’s adaptability and robustness. Detailed statistics are summarized in Table 1. Both datasets were voxelized (voxel size: 0.1 m3) and filtered statistically (50 neighbors, standard deviation threshold: 1.0). The pre-trained 3D U-Net processed the 128 × 128 × 128 voxel grids, and output probability maps were binarized (threshold: 0.7) and downsampled (rate: 0.05) to generate the SSL. Initial line structures were extracted using Morse theory (curvature estimation: radius 0.5 m, k = 30; gradient flow step size: 0.01 m), followed by optimization with RANSAC (distance threshold: 0.05 m, min points: 100, 1000 iterations) and CSG. Experimental settings were consistent with those for D1.
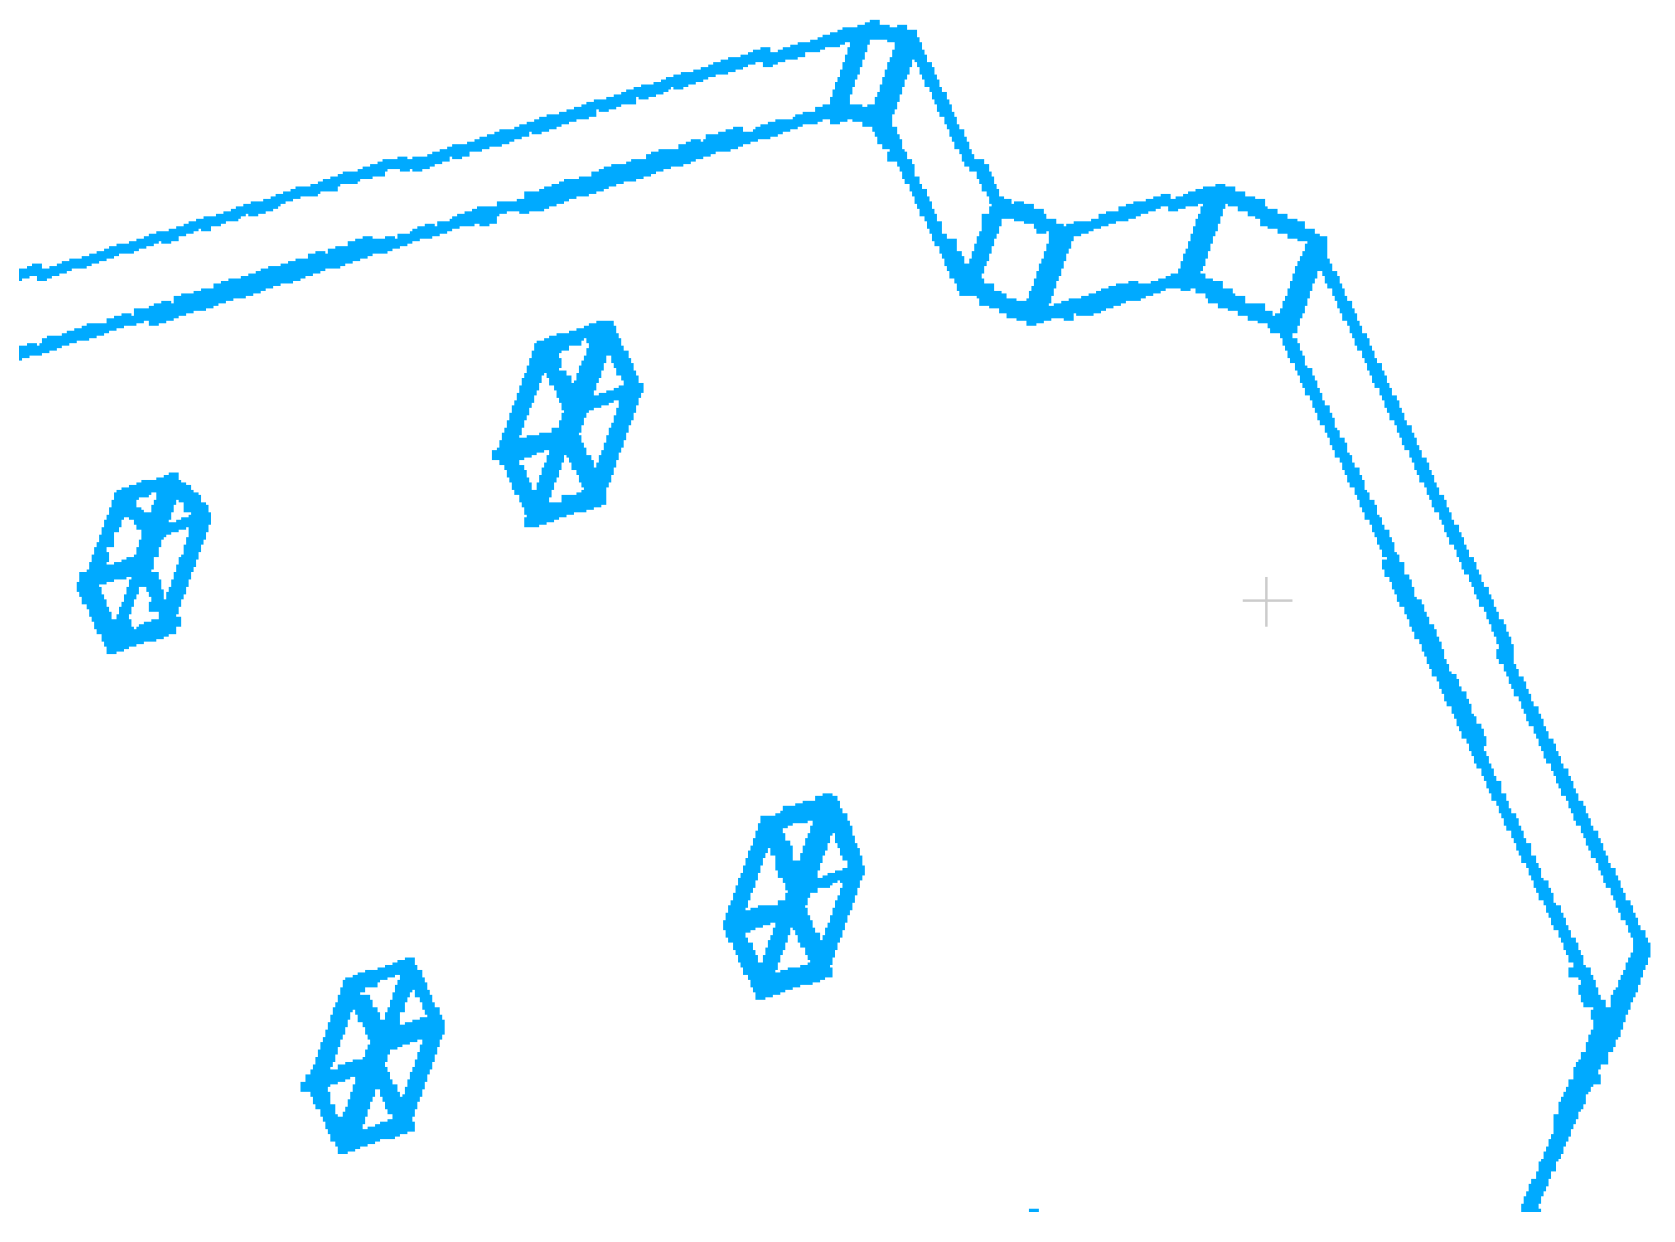
Figure 13 presents the computed SSL: Figure 13a shows D2 with feature points aligned along corridor walls and corners, forming continuous linear patterns consistent with the ground truth line structure. Figure 13b shows D3, capturing partition lines, doors, windows, and complex topology, forming dense and interconnected rectangular units.
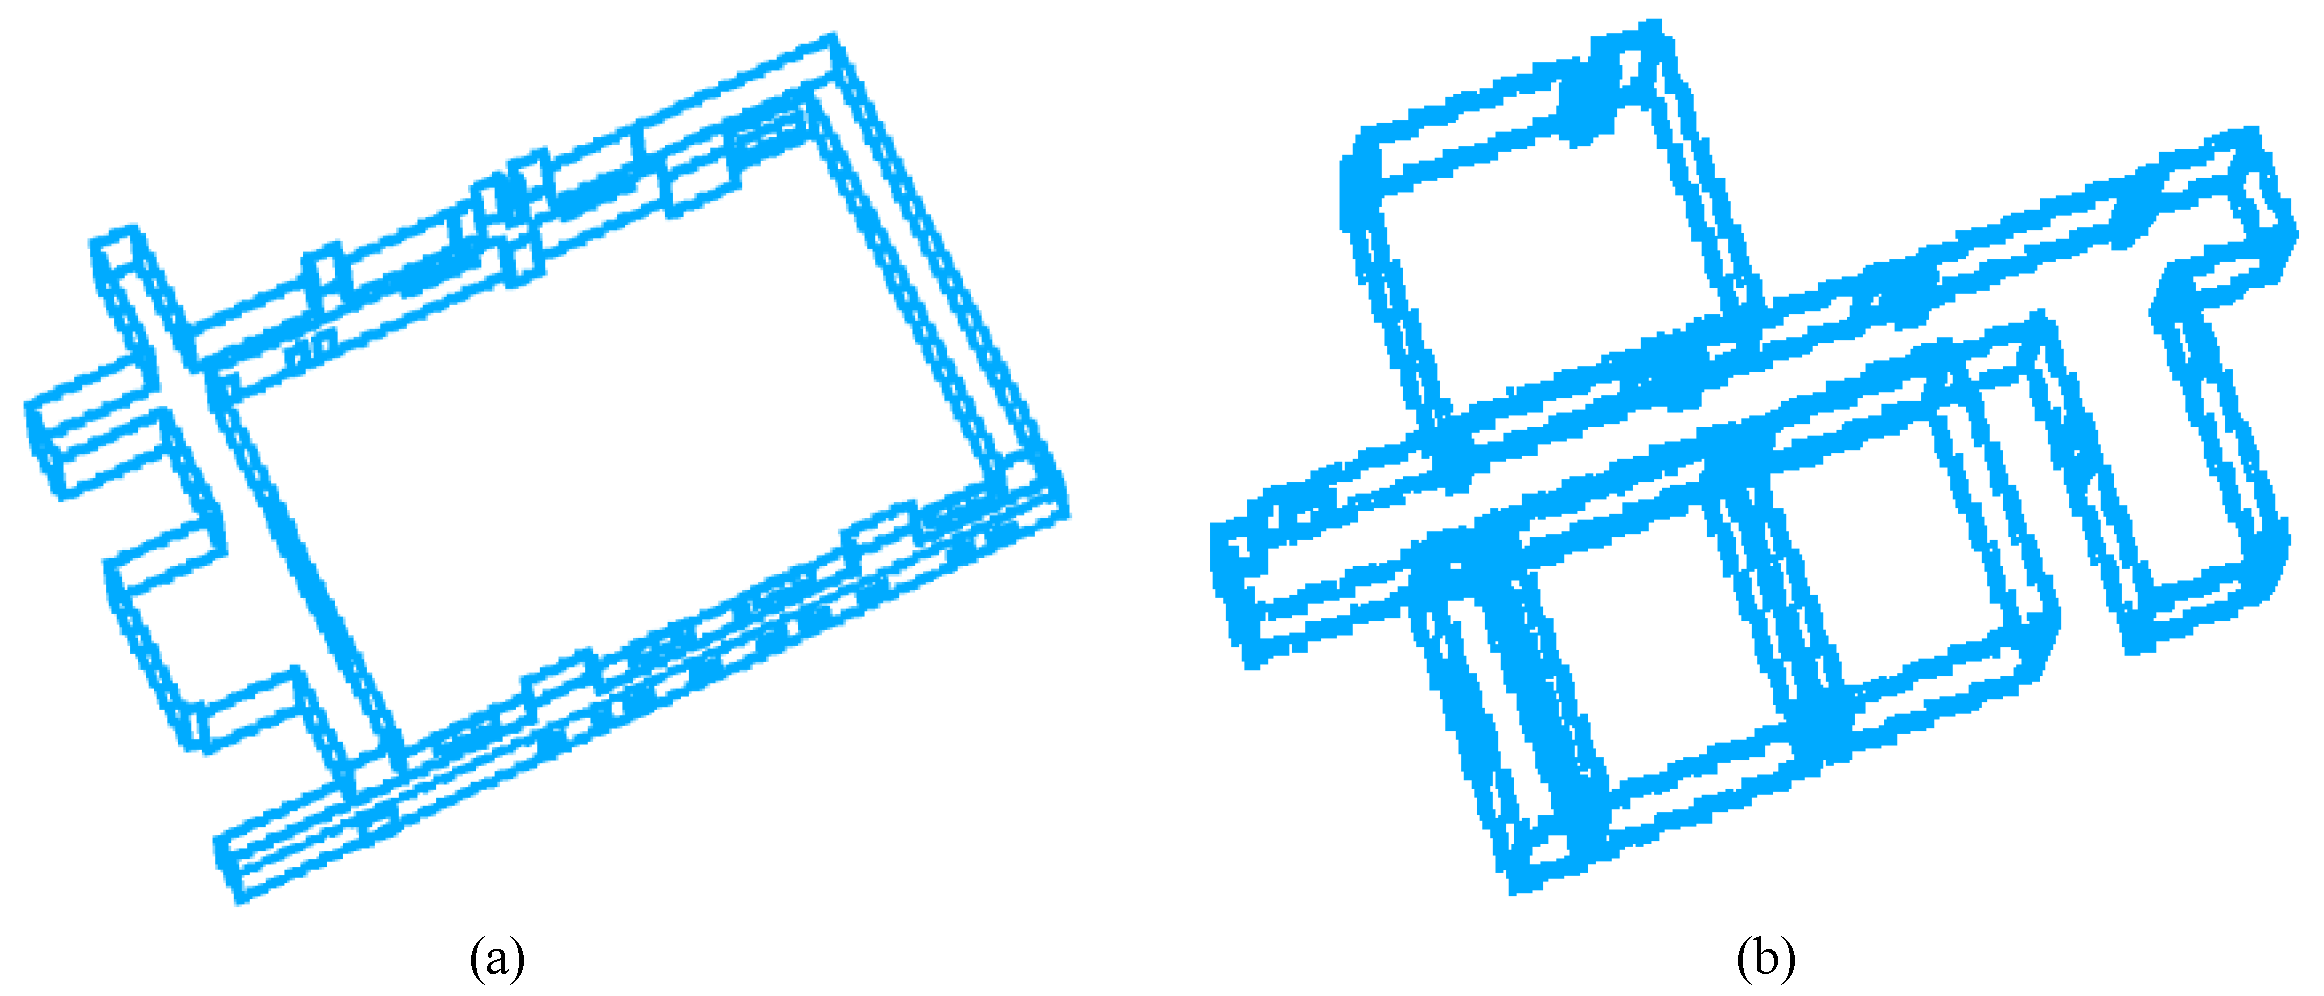
Following the SSL computation, the initial line structures were extracted using Morse theory for dataset D2 and dataset D3, respectively. Figure 14 shows the initially extracted line structure of dataset D2 and dataset D3. Figure 14a displays the extracted line structure for dataset D2, where the lines form a continuous linear network along the walls and corners of the corridor, reflecting the topological features of the narrow space. The regularity and connectivity of this initial structure align well with the spatial structure. Figure 14b shows the extracted line structure for dataset D3, which covers room partition lines, door and window edges, and complex topological structures, forming multiple interconnected rectangular units. The dense distribution and topological integrity are consistent with the ground truth line structure, highlighting the method’s robustness in complex multi-room scenarios at the initial extraction stage.
Figure 15 and Figure 16 illustrate LSC results and comparisons. In Figure 15 (dataset D2), (a) shows the ground truth, (b) the GTP-LSC result with continuous, well-aligned lines, (c) the FE result showing discontinuities and poor regularity, and (d) the PSLF result with better performance than FE but less precise in corner details. The GTP-LSC result in Figure 15b clearly preserves the complete topological features, while the FE result in Figure 15c exhibits noticeable connectivity interruptions. The PSLF result in Figure 15d also shows topological breaks. The GTP-LSC method does not isolate the detection of each line segment, but rather considers their potential for spatial connectivity and the trend of forming a complete structure. Even when the original data contains slight interruptions or noise in the line structure, GTP-LSC can infer and automatically bridge these gaps through GTP optimization, ensuring the geometric integrity and topological connectivity of the experimental results.
In Figure 16 (dataset D3), (a) shows the ground truth line structure, (b) the GTP-LSC result accurately depicting room partitions and complex topology, (c) the FE result with significant noise and fragmentation, and (d) the PSLF result with moderate quality but insufficient topological integrity. The GTP-LSC result in Figure 16b clearly preserves the topological features and integrity of the line structure, accurately reflecting the complex room layout. In contrast, the FE result in Figure 16c shows severe fragmentation and topological confusion, while the PSLF result in Figure 16d also fails to maintain topological integrity. In the face of complex room layouts, the GTP-LSC method effectively integrates edge information into a topologically coherent line structure based on Morse theory. Through GTP optimization, it achieves a line framework with geometric integrity, enabling the reconstruction of the entire room’s line structure. This approach avoids the severe fragmentation and topological confusion commonly observed in other methods, thus ensuring both geometric and topological integrity and connectivity in complex scenes.

5. Discussion

5.1. Performance Analysis

The Intersection over Union (IoU) is commonly used as a metric for evaluating point cloud segmentation performance. However, to capture the effective line structure in 3D space, the IoU Buffer Ratio (IBR) was calculated as denoted in Equation (30).
I B R = a r e a ( A B ) a r e a ( A B ) × 100 %
The choice of buffer radius is based on the practical characteristics of indoor LiDAR point clouds. Actual scenes in the real world often exhibit sampling noise and local gaps; a relatively larger buffer helps mitigate the impact of these imperfections—and of possible discrepancies between ground truth line structure and point cloud data—on spatial-overlap metrics. Conversely, an overly small buffer can produce deceptively low scores (e.g., IBR) even when visual alignment is satisfactory, and thus may under-represent performance on complex real data. In the evaluation, different buffer sizes ranging from 0.10 m to 1.00 m are verified. Very small buffer sizes (e.g., 0.1 m) depressed especially the F-score and failed to reflect modeling quality, whereas very large radii caused scores to saturate and reduced discriminative power. A radius of 0.5 m represents a practical trade-off. Therefore, a buffer radius of 0.5 m is applied, for both the reference ground truth line structure and the experimentally extracted line structure.
A higher IBR indicates better spatial overlap and alignment with the ground truth line structure. In addition, the performance of these methods was quantitatively evaluated using several metrics based on the IBR, including Precision, Recall, and F-score. Recall measures the completeness of extraction, quantifying the proportion of the total length of the reference ground truth line structure successfully reconstructed by the extracted line structure. A higher Recall value signifies that a larger portion of the ground truth geometry has been captured. Precision is defined as the proportion of the buffer zone of the extracted line structure that overlaps with the buffer zone of the ground truth line structure, relative to the total length of the extracted structure. Recall is computed as the proportion of the buffer zone of the ground truth line structure that is successfully covered by the buffer zone of the extracted structure, relative to the total length of the ground truth. The F-score provides a harmonic mean of Precision and Recall, offering a balanced evaluation of extraction accuracy, as formulated in Equation (31):
F s c o r e = 2 · P r e c i s i o n · R e c a l l P r e c i s i o n + R e c a l l
The statistics for the LSC results and comparisons for dataset D1 are shown in Table 2. Dataset D1 has an original data volume of approximately 1200.31 m3, calculated by applying a 0.5-m buffer around the ground truth line structure. The volumes of intersection between that of the extracted line structures and the buffered ground truth for the GTP-LSC, FE, and PSLF methods are 1110.29 m3, 998.66 m3, and 1028.67 m3, respectively. Hence, the proposed GTP-LSC method achieved the highest IBR score of 92.5%, indicating superior alignment with the reference structure. It also achieved the highest F-score of 0.89 and the highest Precision and Recall value of 88.5% and 89.5%, demonstrating its superior ability to recover the length and extent of the ground truth line structure, compared to the FE method (IBR: 83.2%, F-score: 0.77, Precision: 74.6%, Recall: 79.6%) and PSLF method (IBR: 85.7%, F-score: 0.82, Precision: 80.6%, Recall: 83.5%). These combined visual and quantitative results demonstrate the effectiveness of the proposed method in generating line structures that preserve geometric integrity and topological connectivity, which complements the visual results by presenting the quantitative metrics.
Table 2 presents a quantitative comparison. For dataset D2, the original volume is 796.99 m3 after applying a 0.5-m buffer around the ground truth line structure. The intersection volumes between the extracted structures and the ground truth are 750.77 m3 for GTP-LSC, 664.69 m3 for FE, and 694.18 m3 for PSLF. Similarly, for dataset D3, with an original buffered volume of 474.45 m3, the intersection volumes are 430.80 m3 for GTP-LSC, 371.97 m3 for FE, and 396.26 m3 for PSLF. Hence, for D2, the GTP-LSC method achieved the best performance: IBR of 94.2%, F-score of 0.92, Precision of 92.5%, and Recall of 91.5%. FE (Figure 15c) scored lower (IBR: 83.4%, F-score: 0.79, Precision: 77.9%, Recall: 80.1%) with fragmented results, while PSLF (Figure 15d) performed better (IBR: 87.1%, F-score: 0.85) but struggled with precision in corner areas. For D3, the GTP-LSC method again outperformed: IBR of 90.8%, F-score of 0.89, Precision of 90.0%, and Recall of 88.0%. FE (Figure 16c) showed high fragmentation and low scores (IBR: 78.4%, F-score: 0.77, Precision: 78.1%, Recall: 75.9%), while PSLF (Figure 16d) performed moderately (IBR: 83.5%, F-score: 0.81) but lacked topological continuity.
As shown in Table 2, the proposed method consistently achieved the highest IBR values across all three datasets: 92.5% (D1), 94.2% (D2), and 90.8% (D3), significantly outperforming FE (83.2%, 83.4%, 78.4%) and PSLF (85.7%, 87.1%, 83.5%). The GTP-LSC method delivers high-quality line structures preserving both geometric and topological features, making it well-suited for downstream tasks such as indoor modeling.
In conclusion, experiments across datasets D1, D2, and D3 confirm that the GTP-LSC method consistently outperforms FE and PSLF in terms of geometric completeness and topological consistency. Its superior performance, particularly in handling complex indoor scenes, arises from the integration of deep geometric feature extraction and robust topological preservation mechanisms.

5.2. Applicability and Limitation

The EEF for LSC preserves geometric integrity and topological connectivity through three coordinated stages: the encoding phase, extracting phase, and GTP phase. In the encoding phase, the point cloud is voxelized and processed by a 3D U-Net to compute SSL. This stage robustly localizes geometry indicative of potential line structures under noise and irregular sampling, providing high-quality cues for subsequent processing. In the extracting phase, Morse theory is applied to the SSL field to construct the 1-stable manifolds. This generates an initial line structure that is topologically coherent by construction, reducing fragmentation often seen in purely geometric methods. In the GTP phase, geometric optimization is performed on the initial line structure. CSG operations and RANSAC fitting regularize line geometry while respecting the pre-established connectivity, thus avoiding the topology breaks that can arise from unconstrained geometric fitting. The proposed GTP-LSC method is particularly well-suited for structured 3D scenes, especially indoor environments with Manhattan structures, where it performs excellently in efficiently and accurately constructing line structures. This is primarily due to the method’s effective capture of regular line features, precise maintenance of topological connectivity, and its strong geometric optimization capabilities, making it a reliable and efficient solution for LSC in these environments.
However, despite its excellent performance in indoor environment, the method faces some limitations in extreme cases. In dense and complex indoor scenes, voxelization may overlook finer details, especially when the voxel size is too large, leading to the loss of fine local structures like object edges or misidentification of noise. Smaller voxel sizes would increase the computational load and amplify noise effects, particularly in large-scale point cloud scenes, where the computational burden from voxelization and the Morse theory-based construction can slow down processing speeds. Furthermore, the method’s performance is directly influenced by the quality of the point cloud data. When the data has excessive noise or significant missing information—such as over 30% of the points along key structural edges being absent—the extracted multi-dimensional features may lead to erroneous SSL, thus affecting the accuracy of topological structure extraction and the final line structure’s detail. Additionally, while 3D U-Net and Morse theory are capable of extracting line features from various geometric structures, the CSG method assumes regular geometric primitives, making it less effective for irregular and complex geometries, especially curved surface structures. The RANSAC method also has limited fitting capabilities for irregular structures. As a result, the final line structure obtained by this method may have reduced optimization capability for nonlinear or irregular boundaries, particularly in environments with cluttered indoor scenes and numerous curved objects, where the geometric integrity and topological connectivity of the line structure could be compromised. Moreover, the persistence threshold used in the Morse phase and the distance threshold in RANSAC also affect the extraction quality, requiring a trade-off in selecting the optimal parameters.

6. Conclusions

Line structures can effectively simplify the complexity of point cloud data and serve as an efficient form for representing and modeling point clouds, playing an important role in layout estimation, scene understanding, object recognition, and related applications. To address the challenges posed by the large data volume, unstructured sampling, and noise interference in indoor LiDAR point clouds—which often lead to insufficient geometric integrity and topological connectivity in extracted line structures—the paper proposes the GTP-LSC. The proposed approach firstly constructs the high-dimensional representation for SSL based on the 3D U-Net and multi-dimensional feature encoding, enabling effective capture of line structure features and improving the geometric completeness of extracted results. Then, to tackle the lack of topological information in traditional methods, the topology-preserving line structure extraction is designed by incorporating Morse theory, ensuring topological connectivity within the constructed line structures. Finally, the LSC based on CSG modeling principles and RANSAC optimization is proposed, which not only enhances the geometric integrity of the reconstructed line structures but also ensures topological consistency. To verify the effectiveness, comparative experiments were conducted, evaluating the performance against traditional methods across three different real-world scenes. Additionally, given that existing general evaluation standards for 3D models, such as the ISPRS indoor modeling benchmark, are primarily focused on 3D solid models, and that traditional accuracy metrics based on the distance between discrete 3D model sampling points do not fully align with the evaluation objectives of this paper, they are not appliable to the line structure addressed in this study. Therefore, this paper introduces the IBR and F-score (which includes Precision and Recall) as quantitative evaluation metrics, providing a more accurate assessment of the geometric integrity and topological consistency of the extracted line framework. The results demonstrate that the line structures constructed by the proposed method accurately capture the line structures and detailed edges of the scenes, aligning closely with the corresponding ground truth models. Moreover, using the IBR as the evaluation metric, the proposed method achieved IBR values of 92.5%, 94.2%, and 90.8% across different datasets, outperforming other methods. The experimental results confirm the capability of the proposed approach to generate high-quality line structures and demonstrate its applicability across various scenarios. It preserves the geometric and topological features of line structures, offering a reliable and efficient solution for LSC in point cloud data and providing a new approach for indoor LiDAR point cloud processing.
Future research should optimize computational efficiency by developing a more lightweight framework for LSC, aiming to achieve end-to-end indoor point cloud LSC and enhance the method’s real-time applicability. In addition, adaptive strategy needs to be introduced to improve the robustness of the method in representing multiple scene details across different spatial scales.

Author Contributions

Conceptualization, methodology, writing—original draft preparation, H.L.; software, validation, visualization, writing—original draft preparation, H.X.; formal analysis, writing—review and editing, D.J.; software, data curation, H.Z. All authors have read and agreed to the published version of the manuscript.

Funding

This research was funded by the National Natural Science Foundation of China grant number 42101466.

Data Availability Statement

The dataset supporting the findings of this study is publicly available at http://www.mi3dmap.net/datatype1.jsp (accessed on 15 July 2025).

Conflicts of Interest

The authors declare no conflicts of interest.

References

  1. Zhang, W.; Zhang, W.; Gu, J. Edge-semantic learning strategy for layout estimation in indoor environment. IEEE Trans. Cybern. 2019, 50, 2730–2739. [Google Scholar] [CrossRef]
  2. Guo, Y.; Wang, H.; Hu, Q.; Liu, H.; Liu, L.; Bennamoun, M. Deep learning for 3D point clouds: A survey. IEEE Trans. Pattern Anal. Mach. Intell. 2020, 43, 4338–4364. [Google Scholar] [CrossRef]
  3. Lin, Y.; Wang, C.; Cheng, J.; Chen, B.; Jia, F.; Chen, Z.; Li, J. Line segment extraction for large scale unorganized point clouds. ISPRS J. Photogramm. Remote Sens. 2015, 102, 172–183. [Google Scholar] [CrossRef]
  4. Gross, H.; Thoennessen, U. Extraction of lines from laser point clouds. In Symposium of ISPRS Commission III: Photogrammetric Computer Vision PCV06; International Archives of Photogrammetry, Remote Sensing and Spatial Information Sciences: Ettlingen, Germany, 2006; Volume 36, Part 3; pp. 86–91. [Google Scholar]
  5. Tian, P.; Hua, X.; Tao, W.; Zhang, M. Robust extraction of 3D line segment features from unorganized building point clouds. Remote Sens. 2022, 14, 3279. [Google Scholar] [CrossRef]
  6. Langlois, P.A.; Boulch, A.; Marlet, R. Surface reconstruction from 3D line segments. In Proceedings of the 2019 International Conference on 3D Vision (3DV), Quebec City, QC, Canada, 16–19 September 2019; IEEE: New York, NY, USA, 2019; pp. 553–563. [Google Scholar]
  7. Song, J.; Lyu, M.R. A Hough transform based line recognition method utilizing both parameter space and image space. Pattern Recognit. 2005, 38, 539–552. [Google Scholar] [CrossRef]
  8. Park, M.K.; Lee, S.J.; Lee, K.H. Multi-scale tensor voting for feature extraction from unstructured point clouds. Graph. Models 2012, 74, 197–208. [Google Scholar] [CrossRef]
  9. Lin, C.H.; Chen, J.Y.; Su, P.L.; Chen, C.H. Eigen-feature analysis of weighted covariance matrices for LiDAR point cloud classification. ISPRS J. Photogramm. Remote Sens. 2014, 94, 70–79. [Google Scholar] [CrossRef]
  10. She, R.; Kang, Q.; Wang, S.; Tay, W.P.; Zhao, K.; Song, Y.; Geng, T.; Xu, Y.; Navarro, D.N.; Hartmannsgruber, A. PointDifformer: Robust point cloud registration with neural diffusion and transformer. IEEE Trans. Geosci. Remote Sens. 2024, 62, 1–15. [Google Scholar] [CrossRef]
  11. Deng, H.; Jing, K.; Cheng, S.; Liu, C.; Ru, J.; Bo, J.; Wang, L. Linnet: Linear network for efficient point cloud representation learning. Adv. Neural Inf. Process. Syst. 2024, 37, 43189–43209. [Google Scholar]
  12. Gao, X.; Yang, R.; Tan, J.; Liu, Y. Floor plan reconstruction from indoor 3D point clouds using iterative RANSAC line segmentation. J. Build. Eng. 2024, 89, 109238. [Google Scholar] [CrossRef]
  13. Zeng, A.; Song, S.; Nießner, M.; Fisher, M.; Xiao, J.; Funkhouser, T. 3DMatch: Learning local geometric descriptors from RGB-D reconstructions. In Proceedings of the IEEE Conference on Computer Vision and Pattern Recognition, Honolulu, HI, USA, 21–26 July 2017; IEEE: New York, NY, USA, 2017; pp. 1802–1811. [Google Scholar]
  14. Nurunnabi, A.; Belton, D.; West, G. Robust segmentation for large volumes of laser scanning three-dimensional point cloud data. IEEE Trans. Geosci. Remote Sens. 2016, 54, 4790–4805. [Google Scholar] [CrossRef]
  15. Pauly, M.; Keiser, R.; Gross, M. Multi-scale feature extraction on point-sampled surfaces. Comput. Graph. Forum 2003, 22, 281–289. [Google Scholar] [CrossRef]
  16. Li, D.; Shi, G.; Wu, Y.; Yang, Y.; Zhao, M. Multi-scale neighborhood feature extraction and aggregation for point cloud segmentation. IEEE Trans. Circuits Syst. Video Technol. 2020, 31, 2175–2191. [Google Scholar] [CrossRef]
  17. Rusu, R.B.; Blodow, N.; Beetz, M. Fast point feature histograms (FPFH) for 3D registration. In Proceedings of the 2009 IEEE International Conference on Robotics and Automation, Kobe, Japan, 12–17 May 2009; IEEE: New York, NY, USA, 2009; pp. 3212–3217. [Google Scholar]
  18. Tombari, F.; Salti, S.; Di Stefano, L. Unique signatures of histograms for local surface description. In Proceedings of the Computer Vision–ECCV 2010: 11th European Conference on Computer Vision, Heraklion, Crete, Greece, 5–11 September 2010; Proceedings, Part III. Springer: Berlin/Heidelberg, Germany, 2010; pp. 356–369. [Google Scholar]
  19. Qi, C.R.; Su, H.; Mo, K.; Guibas, L.J. PointNet: Deep learning on point sets for 3D classification and segmentation. In Proceedings of the IEEE Conference on Computer Vision and Pattern Recognition, Honolulu, HI, USA, 21–26 July 2017; IEEE: New York, NY, USA, 2017; pp. 652–660. [Google Scholar]
  20. Qi, C.R.; Yi, L.; Su, H.; Guibas, L.J. PointNet++: Deep hierarchical feature learning on point sets in a metric space. Adv. Neural Inf. Process. Syst. 2017, 30, 5105–5114. [Google Scholar] [CrossRef]
  21. Li, Y.; Bu, R.; Sun, M.; Wu, W.; Di, X.; Chen, B. PointCNN: Convolution on X-transformed points. Adv. Neural Inf. Process. Syst. 2018, 31, 828–838. [Google Scholar] [CrossRef]
  22. Zhou, Y.; Tuzel, O. VoxelNet: End-to-end learning for point cloud based 3D object detection. In Proceedings of the IEEE Conference on Computer Vision and Pattern Recognition, Salt Lake City, UT, USA, 18–23 June 2018; IEEE: New York, NY, USA, 2018; pp. 4490–4499. [Google Scholar]
  23. Ronneberger, O.; Fischer, P.; Brox, T. U-Net: Convolutional networks for biomedical image segmentation. In Proceedings of the Medical Image Computing and Computer-Assisted Intervention–MICCAI 2015: 18th International Conference, Munich, Germany, 5–9 October 2015; Proceedings, Part III. Springer: Cham, Switzerland, 2015; pp. 234–241. [Google Scholar]
  24. Li, G.; Muller, M.; Thabet, A.; Ghanem, B. DeepGCNs: Can GCNs go as deep as CNNs? In Proceedings of the IEEE/CVF International Conference on Computer Vision, Seoul, Republic of Korea, 27 October–2November 2019; IEEE: New York, NY, USA, 2019; pp. 9267–9276. [Google Scholar]
  25. Dewez, T.J.; Girardeau-Montaut, D.; Allanic, C.; Rohmer, J. FACETS: A CloudCompare plugin to extract geological planes from unstructured 3D point clouds. Int. Arch. Photogramm. Remote Sens. Spat. Inf. Sci. 2016, 41, 799–804. [Google Scholar] [CrossRef]
  26. Li, Y.; Wu, X.; Chrysathou, Y.; Sharf, A.; Cohen-Or, D.; Mitra, N.J. GlobFit: Consistently fitting primitives by discovering global relations. In ACM SIGGRAPH 2011 Papers; ACM: New York, NY, USA, 2011; pp. 1–12. [Google Scholar]
  27. Lu, X.; Liu, Y.; Li, K. Fast 3D line segment detection from unorganized point cloud. arXiv 2019, arXiv:1901.02532. [Google Scholar] [CrossRef]
  28. Yang, F.; Pan, Y.; Zhang, F.; Feng, F.; Liu, Z.; Zhang, J.; Liu, Y.; Li, L. Geometry and Topology Reconstruction of BIM Wall Objects from Photogrammetric Meshes and Laser Point Clouds. Remote Sens. 2023, 15, 2856. [Google Scholar] [CrossRef]
  29. Gao, X.; Yang, R.; Chen, X.; Tan, J.; Liu, Y.; Wang, Z.; Tan, J.; Liu, H. A New Framework for Generating Indoor 3D Digital Models from Point Clouds. Remote Sens. 2024, 16, 3462. [Google Scholar] [CrossRef]
  30. Fayolle, P.A.; Pasko, A. An evolutionary approach to the extraction of object construction trees from 3D point clouds. Comput. Aided Des. 2016, 74, 1–17. [Google Scholar] [CrossRef]
  31. Wang, C.; Hou, S.; Wen, C.; Gong, Z.; Li, Q.; Sun, X.; Li, J. Semantic line framework-based indoor building modeling using backpacked laser scanning point cloud. ISPRS J. Photogramm. Remote Sens. 2018, 143, 150–166. [Google Scholar] [CrossRef]
  32. Schnabel, R.; Wahl, R.; Klein, R. Efficient RANSAC for point-cloud shape detection. Comput. Graph. Forum 2007, 26, 214–226. [Google Scholar] [CrossRef]
  33. Sousbie, T. The persistent cosmic web and its filamentary structure–I. Theory and implementation. Mon. Not. R. Astron. Soc. 2011, 414, 350–383. [Google Scholar] [CrossRef]
  34. Tierny, J.; Favelier, G.; Levine, J.A.; Gueunet, C.; Michaux, M. The topology toolkit. IEEE Trans. Vis. Comput. Graph. 2017, 24, 832–842. [Google Scholar] [CrossRef] [PubMed]
  35. Chen, C.; Yang, B.; Song, S.; Peng, X.; Huang, R. Automatic clearance anomaly detection for transmission line corridors utilizing UAV-Borne LIDAR data. Remote Sens. 2018, 10, 613. [Google Scholar] [CrossRef]
  36. Khoshelham, K.; Díaz Vilariño, L.; Peter, M.; Kang, Z.; Acharya, D. The Isprs Benchmark on Indoor Modelling. Int. Arch. Photogramm. Remote Sens. Spat. Inf. Sci. 2017, 42, 367–372. [Google Scholar] [CrossRef]
  37. Khoshelham, K.; Tran, H.; Díaz-Vilariño, L.; Peter, M.; Kang, Z.; Acharya, D. An Evaluation Framework for Benchmarking Indoor Modelling Methods. Int. Arch. Photogramm. Remote Sens. Spat. Inf. Sci. 2018, 42, 297–302. [Google Scholar] [CrossRef]
  38. Khoshelham, K.; Tran, H.; Acharya, D.; Díaz Vilariño, L.; Kang, Z.; Dalyot, S. The Isprs Benchmark on Indoor Modelling—Preliminary Results. Int. Arch. Photogramm. Remote Sens. Spat. Inf. Sci. 2020, 43, 207–211. [Google Scholar] [CrossRef]
  39. Yang, B.; Dong, Z. A shape-based segmentation method for mobile laser scanning point clouds. ISPRS J. Photogramm. Remote Sens. 2013, 81, 19–30. [Google Scholar] [CrossRef]
Figure 1. The EEF of GTP-LSC.
Remotesensing 17 03033 g001
Figure 2. Different dimensional features encoded by PCA and curvature. (a) line feature f 1 . (b) surface feature f 2 . (c) curvature feature f 3 .
Remotesensing 17 03033 g002
Figure 3. The multi-dimensional 3D U-Net for SSL computing.
Remotesensing 17 03033 g003
Figure 4. The principle of LSC based on the Morse theory.
Remotesensing 17 03033 g004
Figure 5. The geometric structure decomposition.
Remotesensing 17 03033 g005
Figure 6. The LSC with GTP.
Remotesensing 17 03033 g006
Figure 7. The point cloud and its spatial distribution of dataset D1.
Remotesensing 17 03033 g007
Figure 8. The computed SSL of dataset D1.
Remotesensing 17 03033 g008
Figure 9. The initially extracted line structure of dataset D1. The red box marks the region selected for comparison across different threshold settings. (a) the initially extracted line structure of dataset D1 with a persistence threshold of 0.01. (b) with a persistence threshold of 0.01. (c) with a persistence threshold of 0.1. (d) with a persistence threshold of 0.001.
Remotesensing 17 03033 g009
Figure 10. The optimized Line Structure with GTP of dataset D1. The red box marks the region selected for comparison across different threshold settings. (a) the optimized Line Structure with GTP of dataset D1 with a distance threshold ξ of 0.05 m (b) with a distance threshold ξ of 0.01 m. (c) with a distance threshold ξ of 0.05 m. (d) with a distance threshold ξ of 0.1 m.
Remotesensing 17 03033 g010
Figure 11. LSC Results and Comparisons of dataset D1. (a) the ground truth line structure. (b) result of the proposed GTP-LSC. (c) result of the FE method. (d) result of the PSLF method.
Remotesensing 17 03033 g011
Figure 12. The point cloud and its spatial distribution of dataset D2 and dataset D3. (a) dataset D2. (b) dataset D3.
Remotesensing 17 03033 g012
Figure 13. The computed SSL of dataset D2 and dataset D3. (a) SSL of D2. (b) SSL of D3.
Remotesensing 17 03033 g013
Figure 14. The initially extracted line structure of dataset D2 and dataset D3. (a) initially extracted line structure of D2. (b) initially extracted line structure of D3.
Remotesensing 17 03033 g014
Figure 15. LSC Results and Comparisons of dataset D2. (a) the ground truth line structure. (b) result of the proposed GTP-LSC. (c) result of the FE method. (d) result of the PSLF method.
Remotesensing 17 03033 g015
Figure 16. LSC Results and Comparisons of dataset D3. (a) the ground truth line structure. (b) result of the proposed GTP-LSC. (c) result of the FE method. (d) result of the PSLF method.
Remotesensing 17 03033 g016
Table 1. Statistics of the dataset D1, the dataset D2 and dataset D3.
Dataset3D Range (m3)Point Num.Scene TypeScene Descriptions
D1100 × 50 × 57.9 millionparking garageSimple; Complete coverage; Medium point density; Low noise
D250 × 5 × 32.1 millionCorridorSimple; Complete coverage; Medium point density; Medium noise
D320 × 20 × 38.62 millionMulti-room
Structure
Complex; Complete coverage; Dense point density; Medium noise
Table 2. Statistics of LSC Results and Comparisons of dataset D1, dataset D2 and dataset D3.
DatasetMethodIBRPrecisionRecallF-Score
D1GTP-LSC92.5%88.5%89.5%0.89
FE83.2%74.6%79.6%0.77
PSLF85.7%80.6%83.5%0.82
D2GTP-LSC94.2%92.5%91.5%0.92
FE83.4%77.9%80.1%0.79
PSLF87.1%85.8%84.2%0.85
D3GTP-LSC90.8%90.0%88.0%0.89
FE78.4%78.1%75.9%0.77
PSLF83.5%79.5%82.6%0.81
Disclaimer/Publisher’s Note: The statements, opinions and data contained in all publications are solely those of the individual author(s) and contributor(s) and not of MDPI and/or the editor(s). MDPI and/or the editor(s) disclaim responsibility for any injury to people or property resulting from any ideas, methods, instructions or products referred to in the content.