Article

Satellite Remote Sensing Reveals Global Dam Impacts on Riparian Vegetation Dynamics Under Future Climate Scenarios

State Key Laboratory of Hydraulic Engineering Simulation and Safety, Tianjin University, Tianjin 300072, China
*
Author to whom correspondence should be addressed.
Remote Sens. 2025, 17(17), 3018; https://doi.org/10.3390/rs17173018
Submission received: 3 August 2025 / Revised: 25 August 2025 / Accepted: 28 August 2025 / Published: 30 August 2025

Abstract

The rapid global expansion of hydropower poses questions about the resilience and sustainability of riparian vegetation, especially in the context of ongoing climate change. Satellite remote sensing provides a valuable means for monitoring long-term and spatially continuous changes in vegetation, offering insights into how dams influence RV dynamics worldwide. Here, we integrated satellite-derived environmental indicators, including Normalized Difference Vegetation Index (NDVI), to quantify and compare riparian vegetation trends upstream and downstream of dams globally. By applying paired linear regression analyses to pre- and post-construction NDVI time series, we identified dams associated with significant RV degradation following impoundment. Furthermore, we employed Gradient Boosting Regression Models (GBRM), calibrated using current observational data and driven by CMIP6 climate projections, to forecast global riparian vegetation trends through the year 2100 under various climate scenarios. Our analysis reveals that, although widespread vegetation degradation was not evident up to 2017—and many regions showed slight improvements—future projections under higher-emission pathways (SSP3-7.0 and SSP5-8.5) indicate substantial RV declines after 2040, particularly in high-latitude forests, grasslands, and arid regions. Conversely, tropical and subtropical riparian forests are predicted to maintain stable or increasing NDVI under moderate emission scenarios (SSP1-2.6). These results highlight the potential for adaptive dam development strategies supported by continued satellite-based monitoring to help reduce climate-related risks to riparian vegetation in regions.

1. Introduction

Hydropower stands as a pivotal clean energy source, marking a significant stride in the global energy transition. The construction of approximately 2.8 million dams (with reservoir areas >103 m2) which has significantly contributed to this progress [1,2].
Despite the widespread acknowledgment of hydropower’s benefits, the ecological ramifications of dam construction have garnered increasing scrutiny [3,4,5]. Recent studies have highlighted significant shifts in riparian vegetation patterns, biodiversity, and ecosystem functions downstream of dams [6,7]. Further research in various river basins extends this narrative, revealing long-term transitions towards less stress-tolerant vegetative communities [8,9]. These findings underscore the urgency of integrating ecological considerations into hydropower development planning [10].
The riparian zone is a transitional interface between aquatic and terrestrial ecosystems; it includes areas that are periodically inundated or exposed as water levels fluctuate, as well as lands situated above the maximum waterline that remain subject to hydrological influence [11]. Riparian vegetation plays a crucial role in maintaining the health of riparian ecosystems by purifying water and degrading pollutants [12]. Through the regulation of water absorption and transpiration by roots, it balances the distribution of groundwater and surface water, thereby enhancing water resource utilization efficiency [13,14]. Additionally, riparian vegetation mitigates flood peaks and reduces the risk of flooding by absorbing rainwater [15,16]. The construction of dams significantly impacts these zones, directly reflected in the growth conditions of riparian vegetation [17,18,19].
Achieving better alignment between the development of clean energy and environmental protection is essential [20]. Consequently, understanding the future dynamics of riparian vegetation in dam-affected areas under global climate change is critically important. The construction and operation of dam often requiring significant land and water resources which can lead to the alteration of upstream and downstream riverbank landscapes through activities such as filling, excavation, and water storage regulation, which in turn affects the growth and development conditions of plant life [21,22]. Indirectly, dams influence the water and soil environments of riparian zones [23]. Increased water flow rates can cause soil erosion and sediment displacement, while the transport of nutrients from upstream alters the growth conditions for riparian vegetation [24,25]. Furthermore, the water storage regulation by hydropower stations affects regional microclimates, introducing variability and uncertainty in the impacts on riparian vegetation [26,27].
The challenges in monitoring and assessing the impacts of dam construction on riparian vegetation are manifold, constrained by logistical, topographical, and climatic variables. However, satellite remote sensing technology offers a promising avenue for overcoming these challenges, providing extensive, multi-temporal, and multi-spectral data that can effectively track changes in vegetation cover and density [4,28]. This approach, utilizing vegetation indices such as the Normalized Difference Vegetation Index (NDVI), quantifies riparian vegetation dynamics and offers insights into the broader ecological impacts of dams [29,30].
Since 2008, publicly accessible satellite data archives like Landsat have enabled cost-effective monitoring of global land cover changes over several decades [31,32]. Vegetation indices, derived from spectral bands, are crucial for indicating vegetation cover, biomass, and leaf area index. These indices facilitate the analysis of temporal changes and the assessment of spatial distribution and heterogeneity of riparian vegetation. The Normalized Difference Vegetation Index (NDVI) is particularly valuable in vegetation and phenology studies, providing insights into vegetation dynamics through remote sensing imagery [30,33,34]. It is also widely used in ecology and geomorphology to assess vegetation growth status and density distribution in riparian environments [35]. It effectively delineates vegetation distribution, productivity trends, and spatiotemporal changes, aiding in the monitoring of habitat degradation, fragmentation, and ecological impacts from climate extremes like droughts and fires. However, previous assessments often focused on localized individual or cascade dams, neglecting broader influences such as climate, soil, and dam construction parameters [36,37]. By the end of the 20th century, about 45,000 large dams (>15 m in height) and over 800,000 small dams had been built on rivers worldwide. However, there has yet to be a comprehensive assessment of the impact of dams on riparian vegetation from a global perspective.
In our study, we adopted a global perspective and integrating diverse environmental indicators within a sophisticated modeling framework. By delineating 1–10 km buffer zones upstream and downstream of global dams, we employed an approach, incorporating six dam-related factors, four climatic factors, 12 soil factors, two topographic factors, and one vegetation diversity index into a Gradient Boosting Regression Model (GBRM, hereafter abbreviated as GBRM) [38,39,40]. This modeling technique facilitated a thorough assessment of riparian vegetation dynamics before and after dam construction at a global scale, while accounting for the multifaceted influences of climate, soil, and dam parameters. We will also provide a list of dams worldwide where riparian vegetation has shown negative development post-construction, quantifying the extent of this degradation.
Furthermore, our study ventured into the realm of future climate change scenarios, projecting changes in riparian vegetation up to the year 2100. By extrapolating our findings to predict vegetation responses under different climate scenarios for the years 2040, 2070 and 2100, we provided valuable insights for long-term planning and management strategies. Our research transcends the limitations of prior assessments, which predominantly focused on localized impacts, by offering a holistic understanding of the dynamic changes in riparian vegetation on a global scale.
Through the integration of diverse environmental indicators and the application of the GBRM model, our study offers additional insights into riparian vegetation dynamics under future climate change scenarios (SSP126, SSP370, SSP585) across 14 globally distributed ecological districts. While not without limitations, this approach contributes to a more nuanced understanding of NDVI responses to dam influences, thereby informing adaptive management and conservation efforts. The findings should be viewed as a step toward refining global-scale assessments of riparian ecosystems, rather than a definitive solution, and may help guide future research and decision-making in the context of ongoing environmental transformations.

2. Materials and Methods

2.1. Data

This investigation adopts a rigorous methodology to evaluate the repercussions of worldwide dam construction on riparian ecosystems, capitalizing on expansive datasets and sophisticated statistical techniques. Data description and source are provided in Table S1.
We used the Version 5 NOAA Climate Data Record (CDR) of the AVHRR Normalised Difference Vegetation Index (NDVI), accessed via the Google Earth Engine Data Catalog, which supplies daily global NDVI from 24 June 1981 onwards. To ensure cross-product consistency, each daily NDVI image was resampled to a 1 km × 1 km grid (EPSG:4326) using GEE’s resample and reproject functions with the default nearest-neighbour kernel. This step places all pixels on a common geographic lattice and mitigates terrain-related sampling disparities. For each calendar year, we computed the arithmetic mean of all daily scenes, yielding 36 annual composites from 1981 to 2017. Year-scale averaging suppresses residual cloud, aerosol, and sensor noise present in individual acquisitions.
Based on previous studies, we selected six key factors that directly impact watershed ecosystems for analysis: height of dam (HGT), discharge at dam location (DIS), degree of regulation, area of reservoir (ARE), capacity of reservoir, and depth of reservoir (DEP). These parameters were meticulously sourced from the comprehensive Global Reservoir and Dam Database version 1.3 (GRanD v1.3) [41]. The distribution of global large dams is shown in Figure 1.
For climatic considerations, we extracted data on temperature (TAS), precipitation (PCP), Surface downwelling shortwave flux in air (RSDS), and humidity (HURS) from the high-resolution Climatologist at high resolution for the earth’s land surface areas (CHELSA) dataset, spanning the years 1981–2017 [42]. All climate variables were standardized to a spatial resolution of 1 km to ensure consistency.
Soil attributes were also integral to our analysis, including bulk density of the fine earth fraction (BDOD), cation exchange capacity of the soil (CEC), volumetric fraction of coarse fragments (FVOL), proportion of clay particles (CLAY), soil pH (PH), proportion of sand particles, proportion of silt particles (SILT), soil organic carbon content (SOC), total nitrogen (NIT), organic carbon density (OCD), organic carbon stocks (OCS), and soil moisture. Given the critical role of surface soils in supporting vegetation in riparian zones, we focused on soil variables within the 0–30 cm depth range. These soil variables were derived from the SoilGrids V1.0 database, which offers global gridded soil information, with a spatial resolution set at 1 km to align with our climate data [43].
The impact of terrain on NDVI cannot be overlooked, as factors such as slope and elevation (DEM) play a significant role in shaping vegetation distribution and density. Slope affects soil stability, moisture retention, and solar radiation exposure, all of which influence vegetation growth and, consequently, NDVI values. Similarly, elevation variations can create microclimates that alter temperature and humidity, impacting species composition and vegetation vigor across different altitudes. Another critical factor influencing NDVI is biodiversity. The diversity of plant species within a population structure directly affects the ecological balance and resilience of vegetation, which in turn shapes NDVI patterns. High biodiversity often correlates with increased vegetation cover and productivity due to niche complementarity, where varied species optimize resource utilization. Conversely, low biodiversity may limit the adaptability of vegetation to environmental changes, thereby affecting the overall NDVI. Incorporating these variables—slope, DEM, and biodiversity—provides a more comprehensive understanding of the environmental and ecological factors that drive NDVI variations, enabling more accurate assessments of vegetation health and productivity across different landscapes. The correlation heatmap of all factors included in the analysis is provided in Figure S1 in the Supplementary Materials.
For future climate change projections, we utilized data from the UK Earth System Model (UKESM1-0-LL), incorporating three distinct Shared Socioeconomic Pathway (SSP) scenarios: SSP126, SSP370, and SSP585. These scenarios represent a range of potential socio-economic trajectories and associated greenhouse gas emissions, enabling a comprehensive analysis of potential future climatic conditions. SSP126 represents a low-emission scenario with strong mitigation efforts, SSP370 reflects a medium-high emission pathway with regional rivalry and limited mitigation, and SSP585 illustrates a high-emission scenario with minimal mitigation measures. The inclusion of these scenarios provides a robust framework for evaluating the potential impacts of varying levels of climate change on the system under study.

2.2. Methods

2.2.1. Study Area

We used the GRNWRZ V2.0 global river database [44] to select rivers with a Level 5 confluence area exceeding 1000 km2. We then matched these rivers with the GRanD v1.3 global dam database (7320 dams) using a 500 m spatial tolerance, yielding 3323 dams that intercept rivers. Each intercepted river was subdivided at dam locations, and we generated buffer zones on both sides of each segment, resulting in 6115 buffers in total. Empirical studies have shown that dam-induced hydrological shifts can modify local microclimate and vegetation dynamics over distances of at least 4–6 km downstream or laterally from the impoundment [19,35]. To ensure that our analysis captures the full spatial extent of these impacts, we delineate a 10-km buffer around each dam as the operational boundary for assessing riparian vegetation change. The buffer was established around the river centerline, with the dam serving as the dividing point to separate the river into upstream and downstream sections.
The buffer creation process and results are illustrated in Figure S2 (Supplementary Materials). Upstream–downstream relationships were determined by comparing elevations (via DEM) within the buffered areas, with higher DEM values indicating upstream regions. In cases of cascade dams, where multiple dams affect a single river segment, we assigned influence based on the earliest dam construction date, given that this segment was initially impacted by that dam regardless of any subsequent dam developments. Meanwhile, we utilized the global eco-geographical zoning framework, conducting our study across the 846 global ecoregions defined in Ecoregions2017 [45], nested within 14 terrestrial biomes.

2.2.2. Time Series Analysis

To evaluate the impact of global dam construction on riparian vegetation cover, we conducted a comprehensive time series analysis spanning the pre- and post-dam construction periods. This analysis aimed to discern changes in average NDVI values within buffer zones located upstream and downstream of global dams.
We computed the difference in NDVI values before and after dam construction for each buffer zone at distances ranging from 1 km to 10 km. Specifically, the formula used to calculate the change in NDVI for the i-th buffer zone within distance D is expressed as:
ΔNDVI(D, i) = NDVIpost(D, i) − NDVIpre(D, i)
where:
  • ΔNDVI(D, i) represents the change in NDVI for the i-th buffer zone within distance D.
  • NDVIpost(D, i) represents the NDVI value of the i-th buffer zone after dam construction at distance D.
  • NDVIpre(D, i) represents the NDVI value of the i-th buffer zone before dam construction at distance D.
This calculation enabled the quantification of NDVI changes in each buffer zone, providing insights into the impact of dam construction on riparian vegetation across varying distances from the construction site. For 796 dams that were constructed after 1981, we conduct time series analysis to compare the differences.

2.2.3. Linear Regression

We employed linear regression analysis to establish relationships between 25 influencing factors within 1–10 km buffer zones of the dams and the rate of change in NDVI after dam construction. This approach aimed to elucidate the contributions of different factors to post-construction vegetation dynamics. The linear regression model was formulated as:
y = β0 + β1 × x1 + β2 × x2 + … + βn × xn
where, y represents the change rate (K-value) of average annual NDVI after dam construction and multiple annual mean NDVI after dam construction. x1, x2, …, xn represent the dam parameters, soil parameters, climate parameters, diversity, and terrain slope. β0, β1, β2, …, βn represent the coefficients of the linear regression model. This model aimed to capture the linear relationships between the target variable (NDVI change rate) and the predictor variables (influencing factors), facilitating an understanding of their respective impacts on riparian vegetation dynamics. We conduct linear regression analysis to compare the differences for all the 3323 dams.

2.2.4. Gradient Boosting Regression Model GBRM

Riparian NDVI responses to dam regulation are nonlinear and interactive. Gradient Boosting Regression Model (GBRM) builds a stage-wise additive model of shallow regression trees by fitting each tree to the negative gradient of the loss (squared error here), with complexity controlled by the learning rate, tree depth, and number of trees [46,47]. GBRM is therefore appropriate, offering robustness to heterogeneous scales and moderate collinearity, strong out-of-sample performance, and effect diagnostics. Relative to Random Forests it tends to reduce bias and sharpen predictive accuracy with smoother marginal effects; unlike GAMs it does not impose additivity and can uncover interactions and thresholds [48,49,50]. Accordingly, we pair a transparent OLS baseline with a GBRM main model. In all fits we use conservative settings (learning rate = 0.01, depth = 5, 500 trees), a 70/30 train–test split, and report MSE/R2.
For each of the ten buffer-distance datasets (1–10 km), we fitted gradient-boosting models with the gbm package’s built-in ten-fold cross-validation (folds = 10). Cleaned observations were randomly partitioned into ten folds; the model was trained on four folds and validated on the remaining fold, repeating until every fold had served once as the validation set. The gbm.perf() function tracked the fold-wise validation MSE and selected the optimal number of boosting iterations, thereby guarding against over-fitting. The tuned model was finally evaluated on an independent 30% hold-out sample, and R2, RMSE and MSE were recorded as measures of out-of-sample performance.
The model used the multi-year mean as the dependent variables (Y values). A total of 25 factors were included as independent variables (X values): six dam-related factors, four climatic factors, 12 soil factors, two topographic factors, and one vegetation diversity index, as detailed in Section 2.1 (Data). We derived the mean values of each factor within predefined buffer zones around the dam sites, integrating information on temperature (TAS), precipitation (PCP), air humidity (HURS), solar radiation intensity (RSDS), and NDVI, spanning the time series from 1981 to 2017.

2.2.5. Counterfactual Evaluation of Dam Impacts on Riparian NDVI (ATT, DiD)

To address inter- and intra-annual NDVI variability and attribution concerns, we provide three supplementary counterfactual checks in Appendix A. First, we compute a distance profile of the Average Treatment effect on the Treated: for each lateral band b (1–10 km), we take the post–pre NDVI change for that band and subtract the same-dam far-ring (8–10 km) mean change, then aggregate across dams to obtain band-wise ATTb. Second, we estimate a Difference-in-Differences (DiD) model with Two-Way Fixed Effects (TWFE), treating the near rings (1–3 km) as the treated group and the far rings (8–10 km) as controls and reporting dam-clustered robust standard errors. Third we conduct a slope-based treatment effect (ATTrate) analysis: using post-impoundment years only, we regress NDVI on years-since-construction to obtain an annual rate (NDVI/year) for each dam × band, and subtract the far-ring mean slope to form ATTrate. Results are summarized by four groups. The time window is three pre-dam years and three post-dam years (event year excluded); NDVI is rescaled to 0–1 when necessary; Uncertainty is presented via 95% Confidence Intervals (CI) and cluster-robust standard errors.
To quantify spatial patterns of dam impacts, we computed band-specific average treatment effects. For each dam d and ring band b, we defined the pre/post NDVI difference as:
Δ d , b = N D V I ¯ d , b p o s t N D V I ¯ d , b p r e
Δ d , f a r = 1 3 f 8 , 9 , 10 Δ d , f
For each band b, we compute the average treatment effect on the treated as
A T T b = 1 D d = 1 D ( Δ d , b Δ d , f a r )
and report cross-dam means, sample sizes, and 95% CI. To show heterogeneity, dams are first classified as increase or decrease using the near-ring pre/post mean difference N D V I ¯ d , b p o s t N D V I ¯ d , b p r e .
Defining near bands (1–3 km) as the treatment group and far bands (8–10 km) as the control group, excluding the dam year. With dam × group (near/far) as the panel unit i, the annual regression was specified as:
y i , t = α i + γ t + β ( T r e a t i × P o s t d , t ) + ε i , t
where yit denotes the NDVI of unit i in year t; αi denotes unit (dam × group) fixed effects, γt year fixed effects. Treati is an indicator equal to 1 for near bands (1–3 km) and 0 for far bands (8–10 km). Postd,t is an indicator equal to 1 if year t is after the dam construction year of dam d. The coefficient β identifies the average causal effect of dam construction on NDVI in the treated (near-band) areas, net of common temporal shocks and time-invariant spatial heterogeneity. Robust standard errors were clustered at the dam level. To capture heterogeneity, dams were classified into increase and decrease categories based on post- vs. pre-dam NDVI changes, same as Band-wise ATT calculation, and the model was estimated separately for each group.
To complement the ATT and DiD analyses, we further examined post-impoundment NDVI trends using a slope-based measure. For each dam d and buffer ring b, we restricted the sample to post-dam years (t > dam_yeard) and estimated the following panel regression:
N D V I d , b , t = α d , b + ϕ d , b ( t d a m _ y e a r d ) + u d , b , t , t > d a m _ y e a r d
where αd,b is the intercept, and ϕd,b captures the linear post-dam trend in NDVI (measured in NDVI units per year). The slope parameter ϕd,b thus represents the rate of vegetation recovery or decline following impoundment. We then defined the slope-based treatment effect for each dam d and ring b as:
A T T d , b r a t e = ϕ d , b 1 3 f 8 , 9 , 10 ϕ d , f
that is, the near-ring slope relative to the average slope of the far rings (8–10 km). This quantity measures whether vegetation in the impact zone (near rings) recovers or declines faster than the counterfactual represented by distant rings. To account for heterogeneity, we aggregated slope-based effects by band and reported summary statistics for four groups: ALL (all dams), POS (ϕd,b > 0, positive dams), NEG (ϕd,b < 0, negative dams), SIG (slope significant at p < 0.05). For each group, we report the mean effect, sample size, and 95% confidence interval (cluster-robust at the dam level).

3. Results

The ecoregion with the highest number of dams, as shown in Figure 1, contains 210 such structures and the accompanying histogram elucidates their longitudinal and latitudinal frequencies. These large dams are widely distributed globally, with significant concentrations in North America, Europe, East Asia, southern Africa, the Indian subcontinent, and Australia. Their presence has a substantial impact on the natural riverine states and riparian vegetation within their respective basins over both temporal and spatial scales.
The dataset also reveals a pronounced aggregation of dams within temperate and tropical/subtropical regions, which collectively harbor 75% of the world’s large dams, highlighting their central role in the development of global hydroelectric infrastructure. The establishment of large dams will disrupt riverine flow as well as microclimate, leading to substantial alterations in water and sediment transport dynamics. This, in turn, affects the structural, compositional, and functional diversity of riparian vegetation, as evidenced by the NDVI variations analyzed across the ecological regions shown in Figure 1. We conducted a systematic investigation of riparian vegetation dynamics within dam-affected river buffer zones across 14 ecological districts, analyzing both temporal and spatial scales. This includes assessing post-dam NDVI change rates and the difference in multi-year mean NDVI values between pre- and post-dam periods. Particular attention was given to regions with high dam densities and robust vegetation growth, such as the Tropical & Subtropical Moist Broadleaf Forests (TSMF), Tropical & Subtropical Dry Broadleaf Forests (TSDBF), and Tropical & Subtropical Coniferous Forests (TSCF), to evaluate vegetation responses to dam-induced disturbances. In contrast, areas characterized by high-latitude or high-altitude environments, such as the Tundra (TUN), where vegetation recovery tends to be slower following disturbance, warrant heightened attention regarding the ecological impacts of dam construction on riparian vegetation.
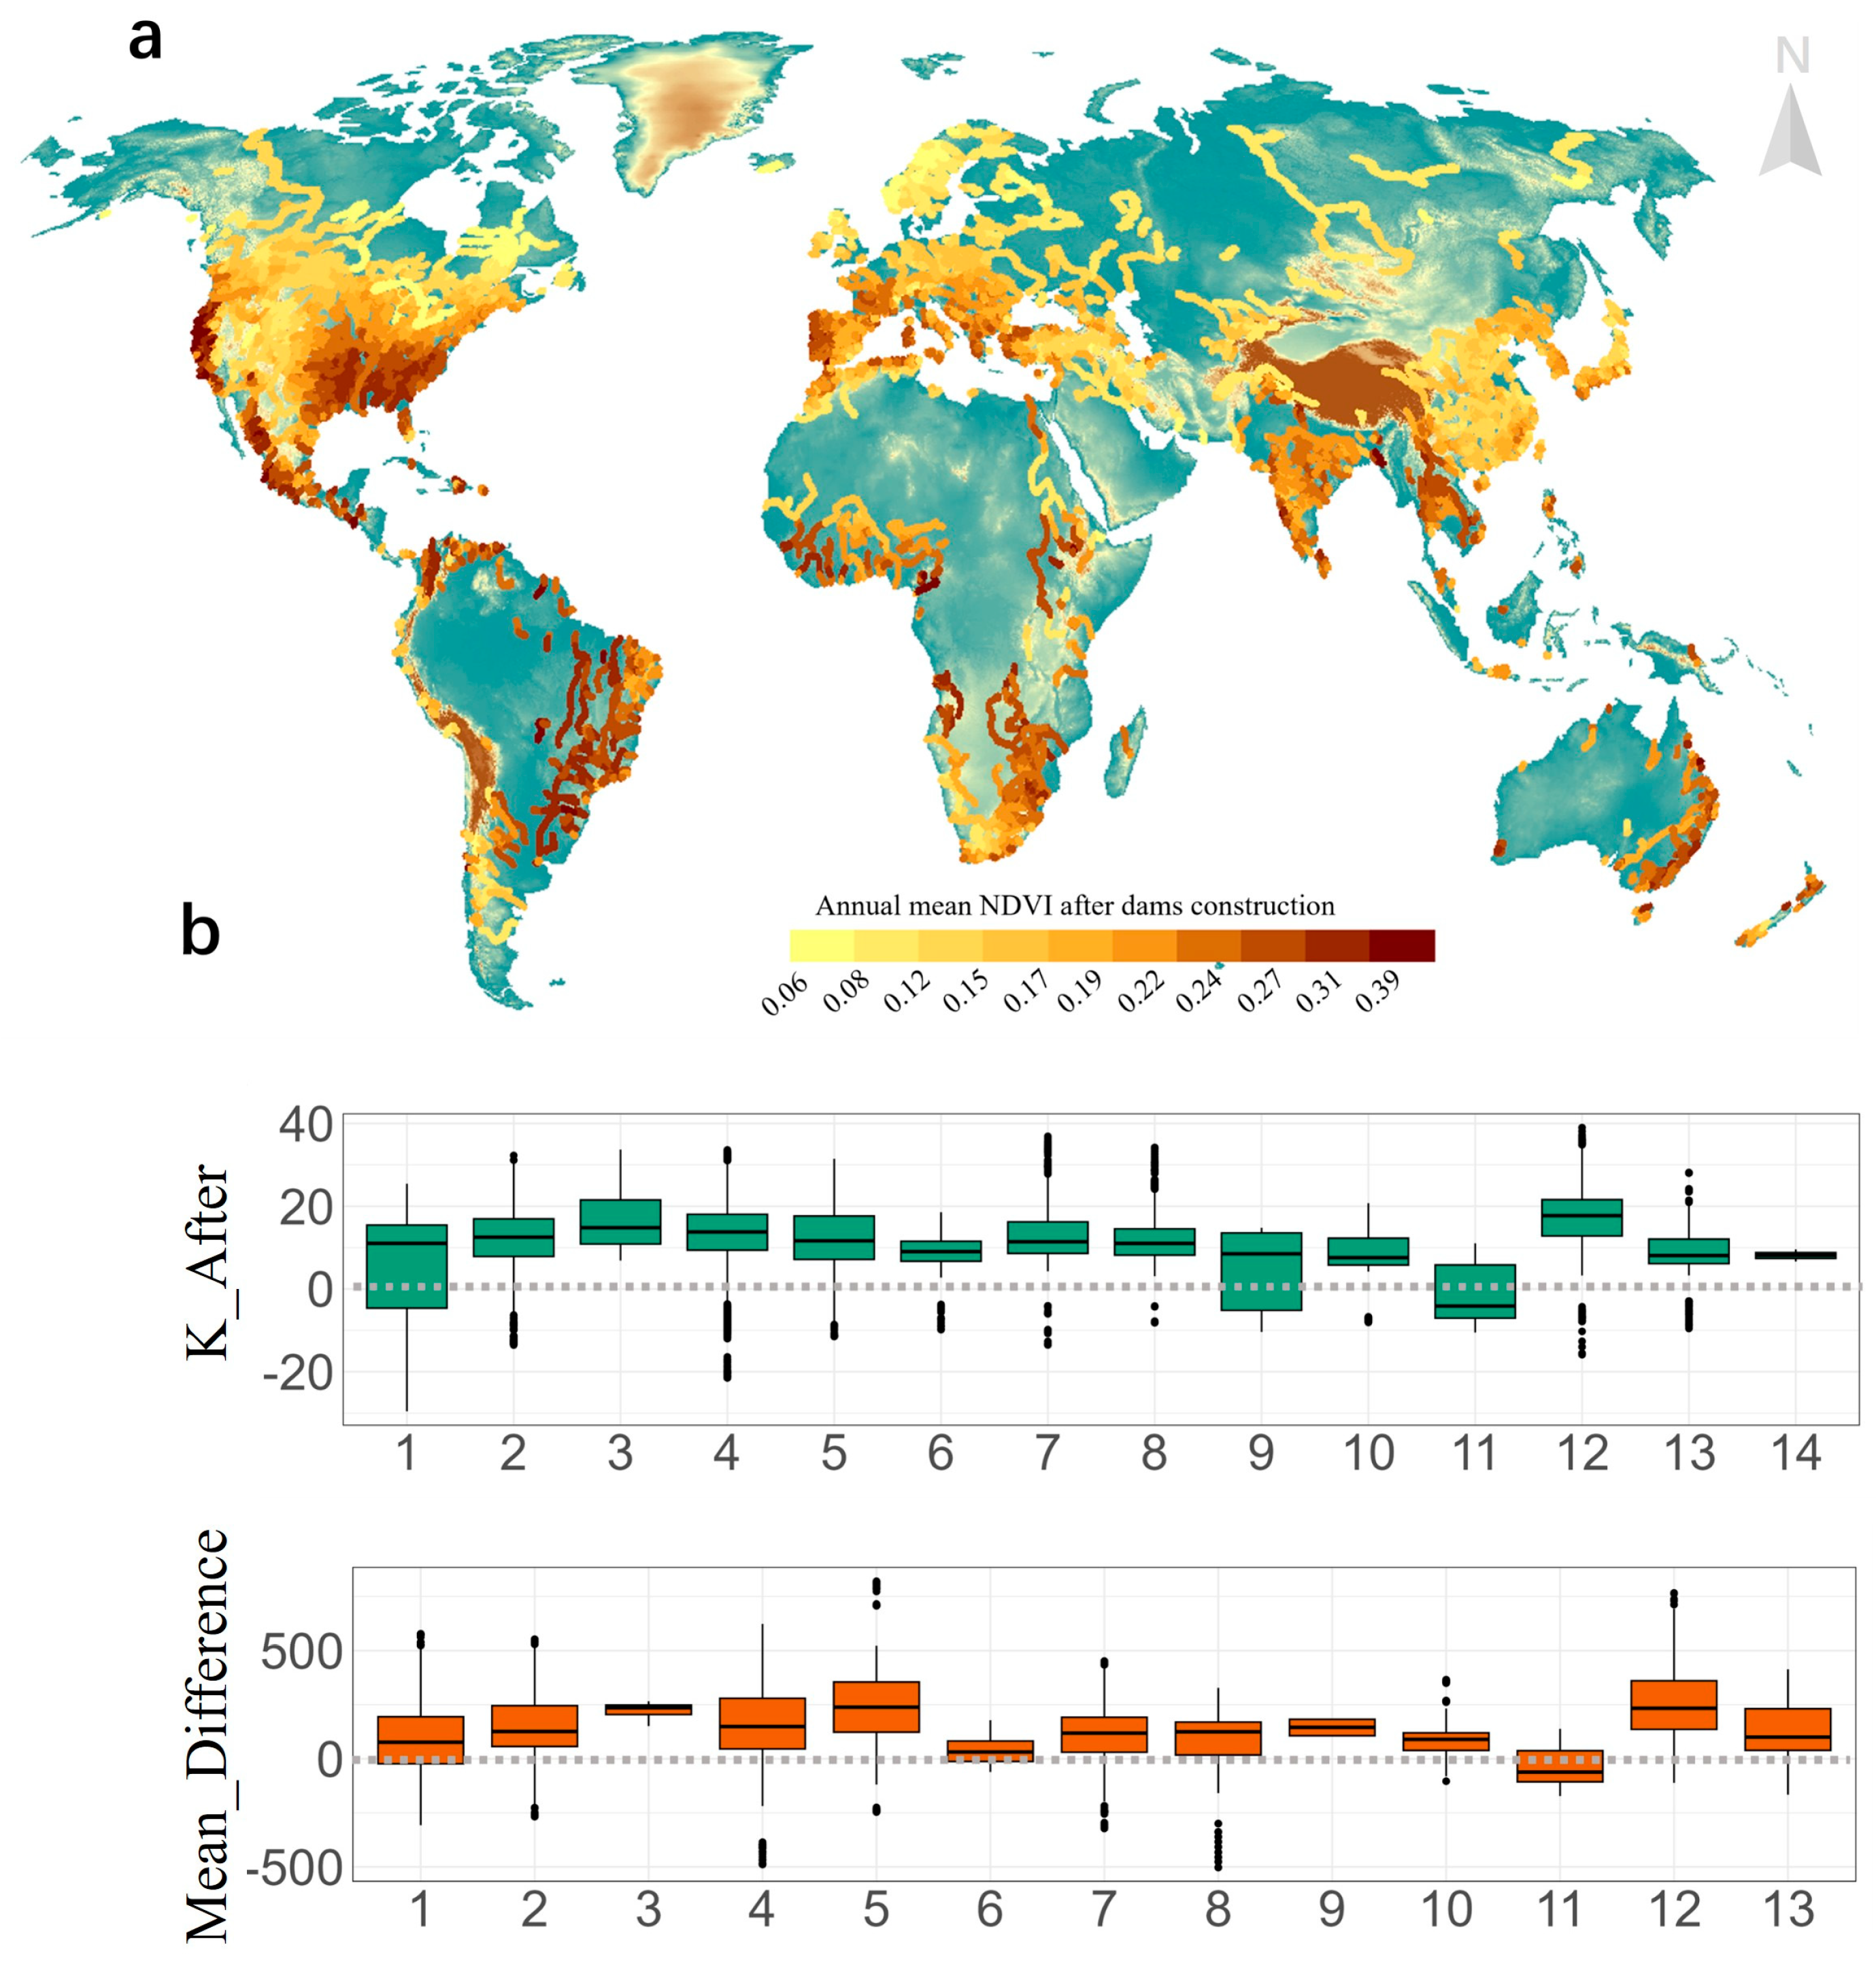
Figure 2 summarizes the pre–post multi-year mean NDVI differences and the post-dam NDVI change rates across the 1–10 km buffers. As shown in Figure 2, panels (a,b) depict the multi-year mean differences and the slope-based change rates. Detailed results at 1-km increments between 1 and 10 km are presented in Figure S3.
The post-dam NDVI change rate (K_After) varied significantly across ecological zones. Ecoregion 3 showed the highest mean rate of NDVI change (17.07), with an upper quartile value of 21.51 and a lower quartile of 10.87, indicating relatively high and consistent increases in NDVI post-dam within this zone. Similarly, Ecoregions 12 exhibited a substantial positive change rate, with a mean of 17.31, upper quartile of 21.58, and lower quartile of 12.81. On the contrary, Ecoregions 11 had a negative mean change rate (−1.34), with a wide range spanning from 5.81 (upper quartile) to −7.05 (lower quartile), indicating areas within this ecological zone where NDVI decreases were more pronounced post-dam. Ecoregion 9 and Ecoregion 1 showed the lowest positive mean NDVI change rates (6.53 and 7.46, respectively), with Ecoregion 9 having a lower quartile value of −5.17, suggesting significant variability in responses across this zone.
In terms of the multi-year mean NDVI (Mean) post-dam, the results indicate large variability among ecological zones. Ecoregions 5 exhibited the highest mean NDVI value (243.17), with an upper quartile of 355.05 and a lower quartile of 123.29, suggesting high NDVI levels across most of this zone but also notable variation. Ecoregions 3 followed closely, with a mean NDVI of 221.40 and a relatively narrower interquartile range (204.64 to 248.17), reflecting more consistent vegetation conditions. Ecoregion 12 also displayed high NDVI values, with a mean of 247.18 and upper and lower quartiles of 360.62 and 136.12, respectively. In contrast, Ecoregions 11 showed the lowest NDVI values overall, with a negative mean value (−37.25) and an interquartile range extending from −106.50 to 37.27, highlighting a significant reduction in vegetation density in this zone post-dam.
Comparing the K_After and multi-year NDVI averages reveals that ecological zones with high NDVI change rates do not necessarily exhibit the highest overall NDVI values. For example, Ecoregion 3 and Ecoregion 12 demonstrated both high change rates and high mean NDVI values, while Ecoregion 11 exhibited negative change rates and the lowest NDVI averages. These findings suggest that the ecological response to dam construction varies substantially among zones, reflecting differences in baseline vegetation conditions, climatic factors, and potential anthropogenic influences.
We developed two linear regression models—the Post-Dam NDVI Change-Rate Model and the Multi-Year Mean NDVI Model—whose results are presented in Figure S4. While the linear regression approach offers a preliminary understanding of how dams, climate, soil, and topography collectively influence riparian vegetation, it has inherent limitations that require cautious interpretation. Specifically, the inclusion or exclusion of explanatory variables can result in shifts in coefficient signs or magnitudes, reflecting the sensitivity of the models to input data and the complex, interdependent nature of these factors. Consequently, although regression analyses provide partial insights into the relative importance of individual drivers, they fail to capture the full complexity of interactions governing NDVI responses under dam-regulated conditions. For this reason, the results of the linear regression models are presented in the supplementary materials for reference and are not discussed in the main text.
Table 1 shows that all listed dams experienced statistically significant (p < 0.05) declines in NDVI both upstream and downstream after dam construction, with decreases ranging from −5.22 (upstream of Shuifumiao in China) to −29.23 (upstream of Pichi Picun Leufu in Argentina). Several dams exhibited particularly pronounced declines, such as Bansagar in India (−28.77 upstream, −20.88 downstream) and Tchimbele in Gabon (−23.34 upstream, −26.92 downstream). While the magnitude of change varied widely among regions, the consistent pattern of negative NDVI shifts suggests that dam operations and associated land-use alterations may exert a broadly detrimental effect on riparian vegetation.
A closer comparison of the upstream and downstream segments further emphasizes the variability in dam-induced impacts. For example, the Shibi Dam in China recorded a substantial difference in NDVI decline between upstream (−13.54) and downstream (−26.78), whereas other sites, such as Shuifumiao, showed more comparable values (−5.22 upstream, −8.34 downstream). Such differences could reflect local hydrological regimes or management practices that influence sediment flow, water availability, and habitat conditions differently upstream and downstream of each dam.
Despite variability in magnitude, these declines remain consistent across multiple climatic zones and geographic settings, suggesting that regulation of river flow, reservoir impoundment, and associated land cover changes may collectively contribute to reductions in riparian vegetation productivity. These findings underscore the need for further site-specific investigations to identify the primary drivers, whether related to hydrological alteration, sediment trapping, or changes in climate change pressure, behind the observed NDVI decreases in both upstream and downstream corridors. Information on dams where only the upstream or downstream riparian zone exhibited a declining NDVI trend is provided in Table S3 in the Supplementary Materials.
To overcome these constraints and achieve a more nuanced projection of riparian vegetation changes in a warming climate, we adopted a GBRM model, which accommodates non-linear relationships among multiple covariates. Using this machine learning framework, we further quantified potential RV outcomes through the year 2100 across three Shared Socioeconomic Pathways (SSP126, SSP370, and SSP585), providing a more robust and holistic perspective on dam-induced vegetation dynamics in riverine landscapes.
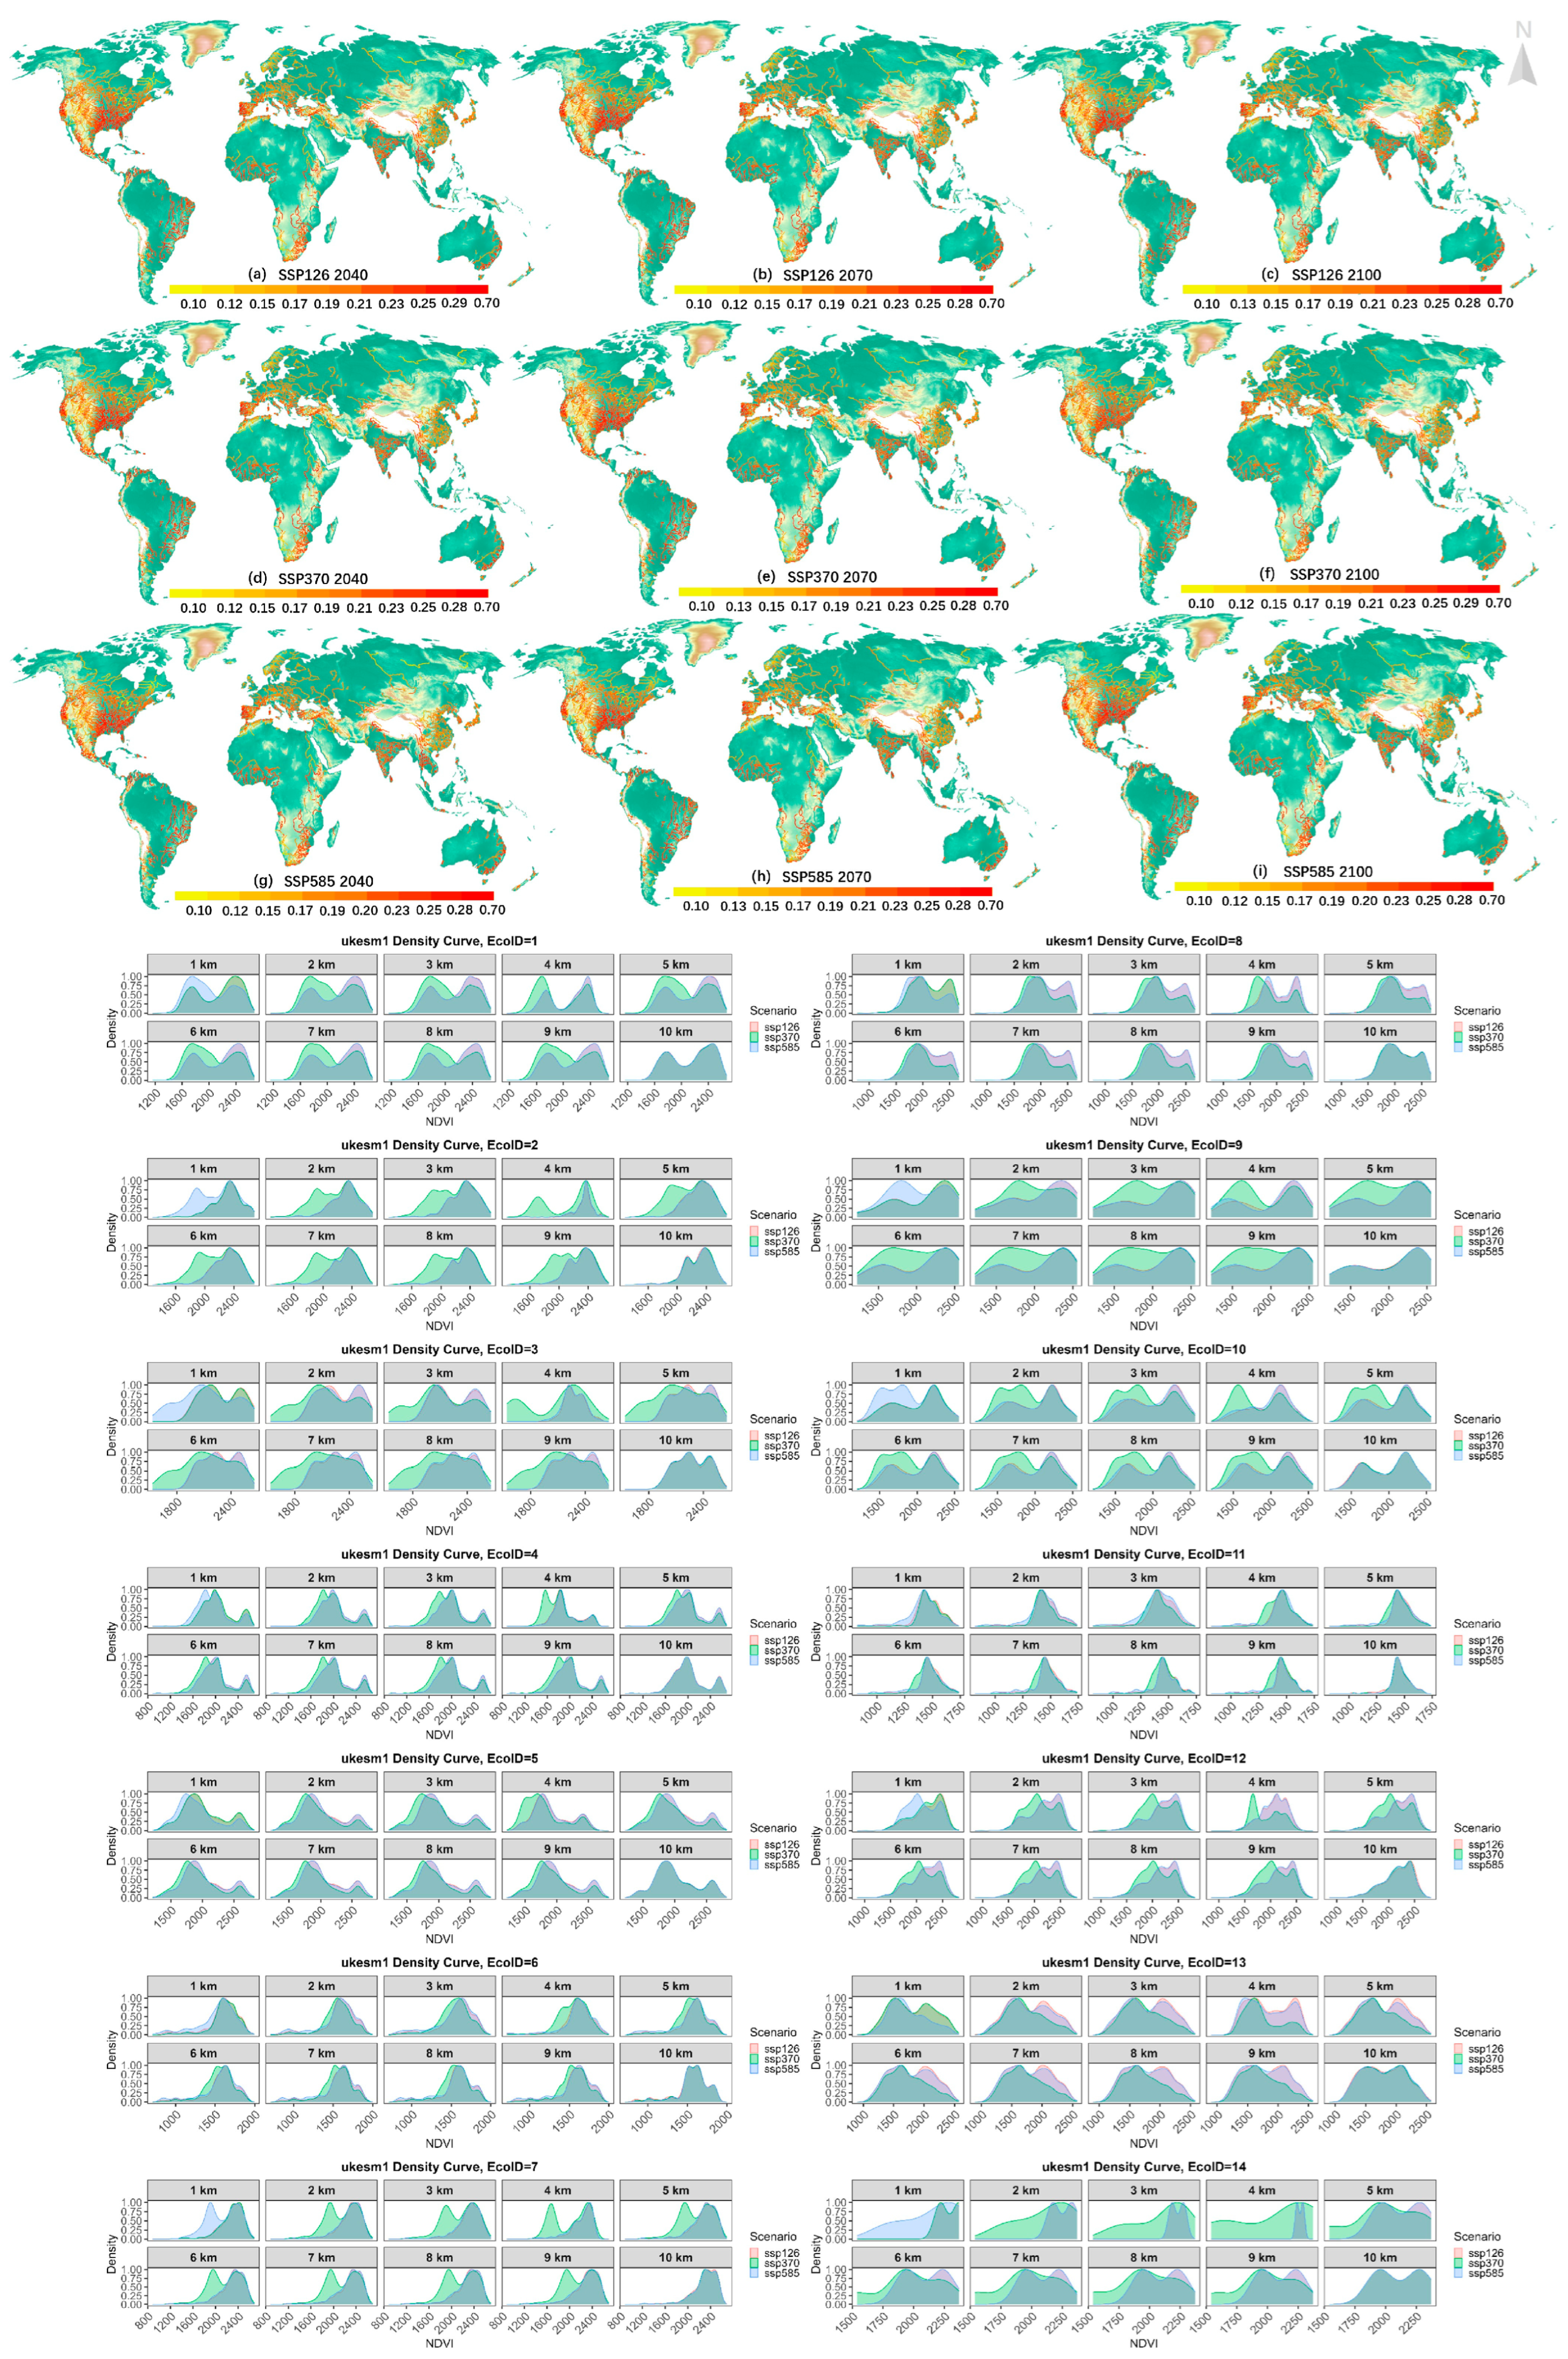
Figure 3 presents the corresponding results, and the main patterns are discussed below. Some ecoregions, such as Tropical and Subtropical Moist Broadleaf Forests (Ecoregion 1) and Tropical and Subtropical Dry Broadleaf Forests (Ecoregion 2), already show relatively high or stable NDVI levels upstream and downstream of dams during the near-future period (2011–2040) under SSP126 and SSP370, with mean NDVI often exceeding 2100. However, significant NDVI reductions are evident downstream of dams in certain ecoregions under higher-emission scenarios (SSP585) in the late 21st century (2071–2100). For instance, Ecoregion 1 and Ecoregion 3 experience average NDVI values around 1863.78 and 1905.33, respectively, under SSP370 or SSP585, indicating notable declines linked to altered hydrological regimes and reduced sediment transport downstream of dams.
Cross-ecoregion comparisons reveal varying impacts between forest ecosystems (Ecoregions 1–6) and grassland/shrubland ecosystems (Ecoregions 7–10, partially 11–13). Tropical and subtropical forests (Ecoregions 1–3) typically maintain higher NDVI levels downstream of dams under moderate emission scenarios (SSP126 and SSP370), suggesting that these regions may benefit from stabilized water availability due to dam operations. Conversely, temperate conifer forests (Ecoregion 5) and boreal forests/taiga (Ecoregion 6) exhibit significant fluctuations and marked downstream NDVI reductions in high-emission scenarios (SSP370 and SSP585), highlighting that dam-induced hydrological alterations combined with warming-induced changes in local climate conditions may negatively impact vegetation stability in these higher latitude areas.
Examining grassland, shrubland, and tundra ecosystems (Ecoregions 7–11) reveals pronounced declines in downstream NDVI under high-emission scenarios by the late 21st century. Notably, Temperate Grasslands, Savannas & Shrublands (Ecoregion 8) and Montane Grasslands & Shrublands (Ecoregion 10) exhibit significant decreases in both average and minimum NDVI under SSP370 and SSP585 scenarios by 2071–2100. Such changes likely result from dam-driven reductions in downstream soil moisture availability, compounded by increased frequency of local climate extremes such as drought and heatwaves. The Tundra (Ecoregion 11) similarly experiences a considerable decrease in minimum NDVI under SSP585, indicating that altered downstream hydrological regimes due to dams, together with thawing permafrost under warming conditions, could compromise vegetation stability in high-latitude riparian zones.
In Mediterranean Forests, Woodlands and Scrub (Ecoregion 12) and Deserts and Xeric Shrublands (Ecoregion 13), NDVI dynamics downstream of dams vary significantly across scenarios. Under SSP126, Ecoregion 12 generally maintains higher NDVI levels (~2100), whereas under high-emission scenarios (SSP370 or SSP585), there is a marked decline in late-century minimum NDVI, likely driven by intensified downstream water deficits induced by reservoir management practices and increased evaporation under warming conditions. Deserts and Xeric Shrublands (Ecoregion 13) undergo significant downstream NDVI reductions (~1656.14 under SSP370 by 2071–2100), emphasizing that reduced downstream water flow and extreme drought conditions associated with dam regulation may severely restrict plant growth and ecosystem recovery.
Overall, while riparian vegetation along dam-affected rivers displayed no significant degradation and even some improvements up to 2017, certain regions are projected to experience marked vegetation declines downstream of dams in the long term (2040–2100), driven by combined dam-related hydrological impacts and climate change. Large dams alter natural flow regimes, sediment transport, and flooding cycles critical for sustaining downstream riparian and floodplain vegetation. The resulting changes in sediment deposition, soil fertility, and flood dynamics downstream can negatively affect plant community composition and long-term ecosystem resilience.
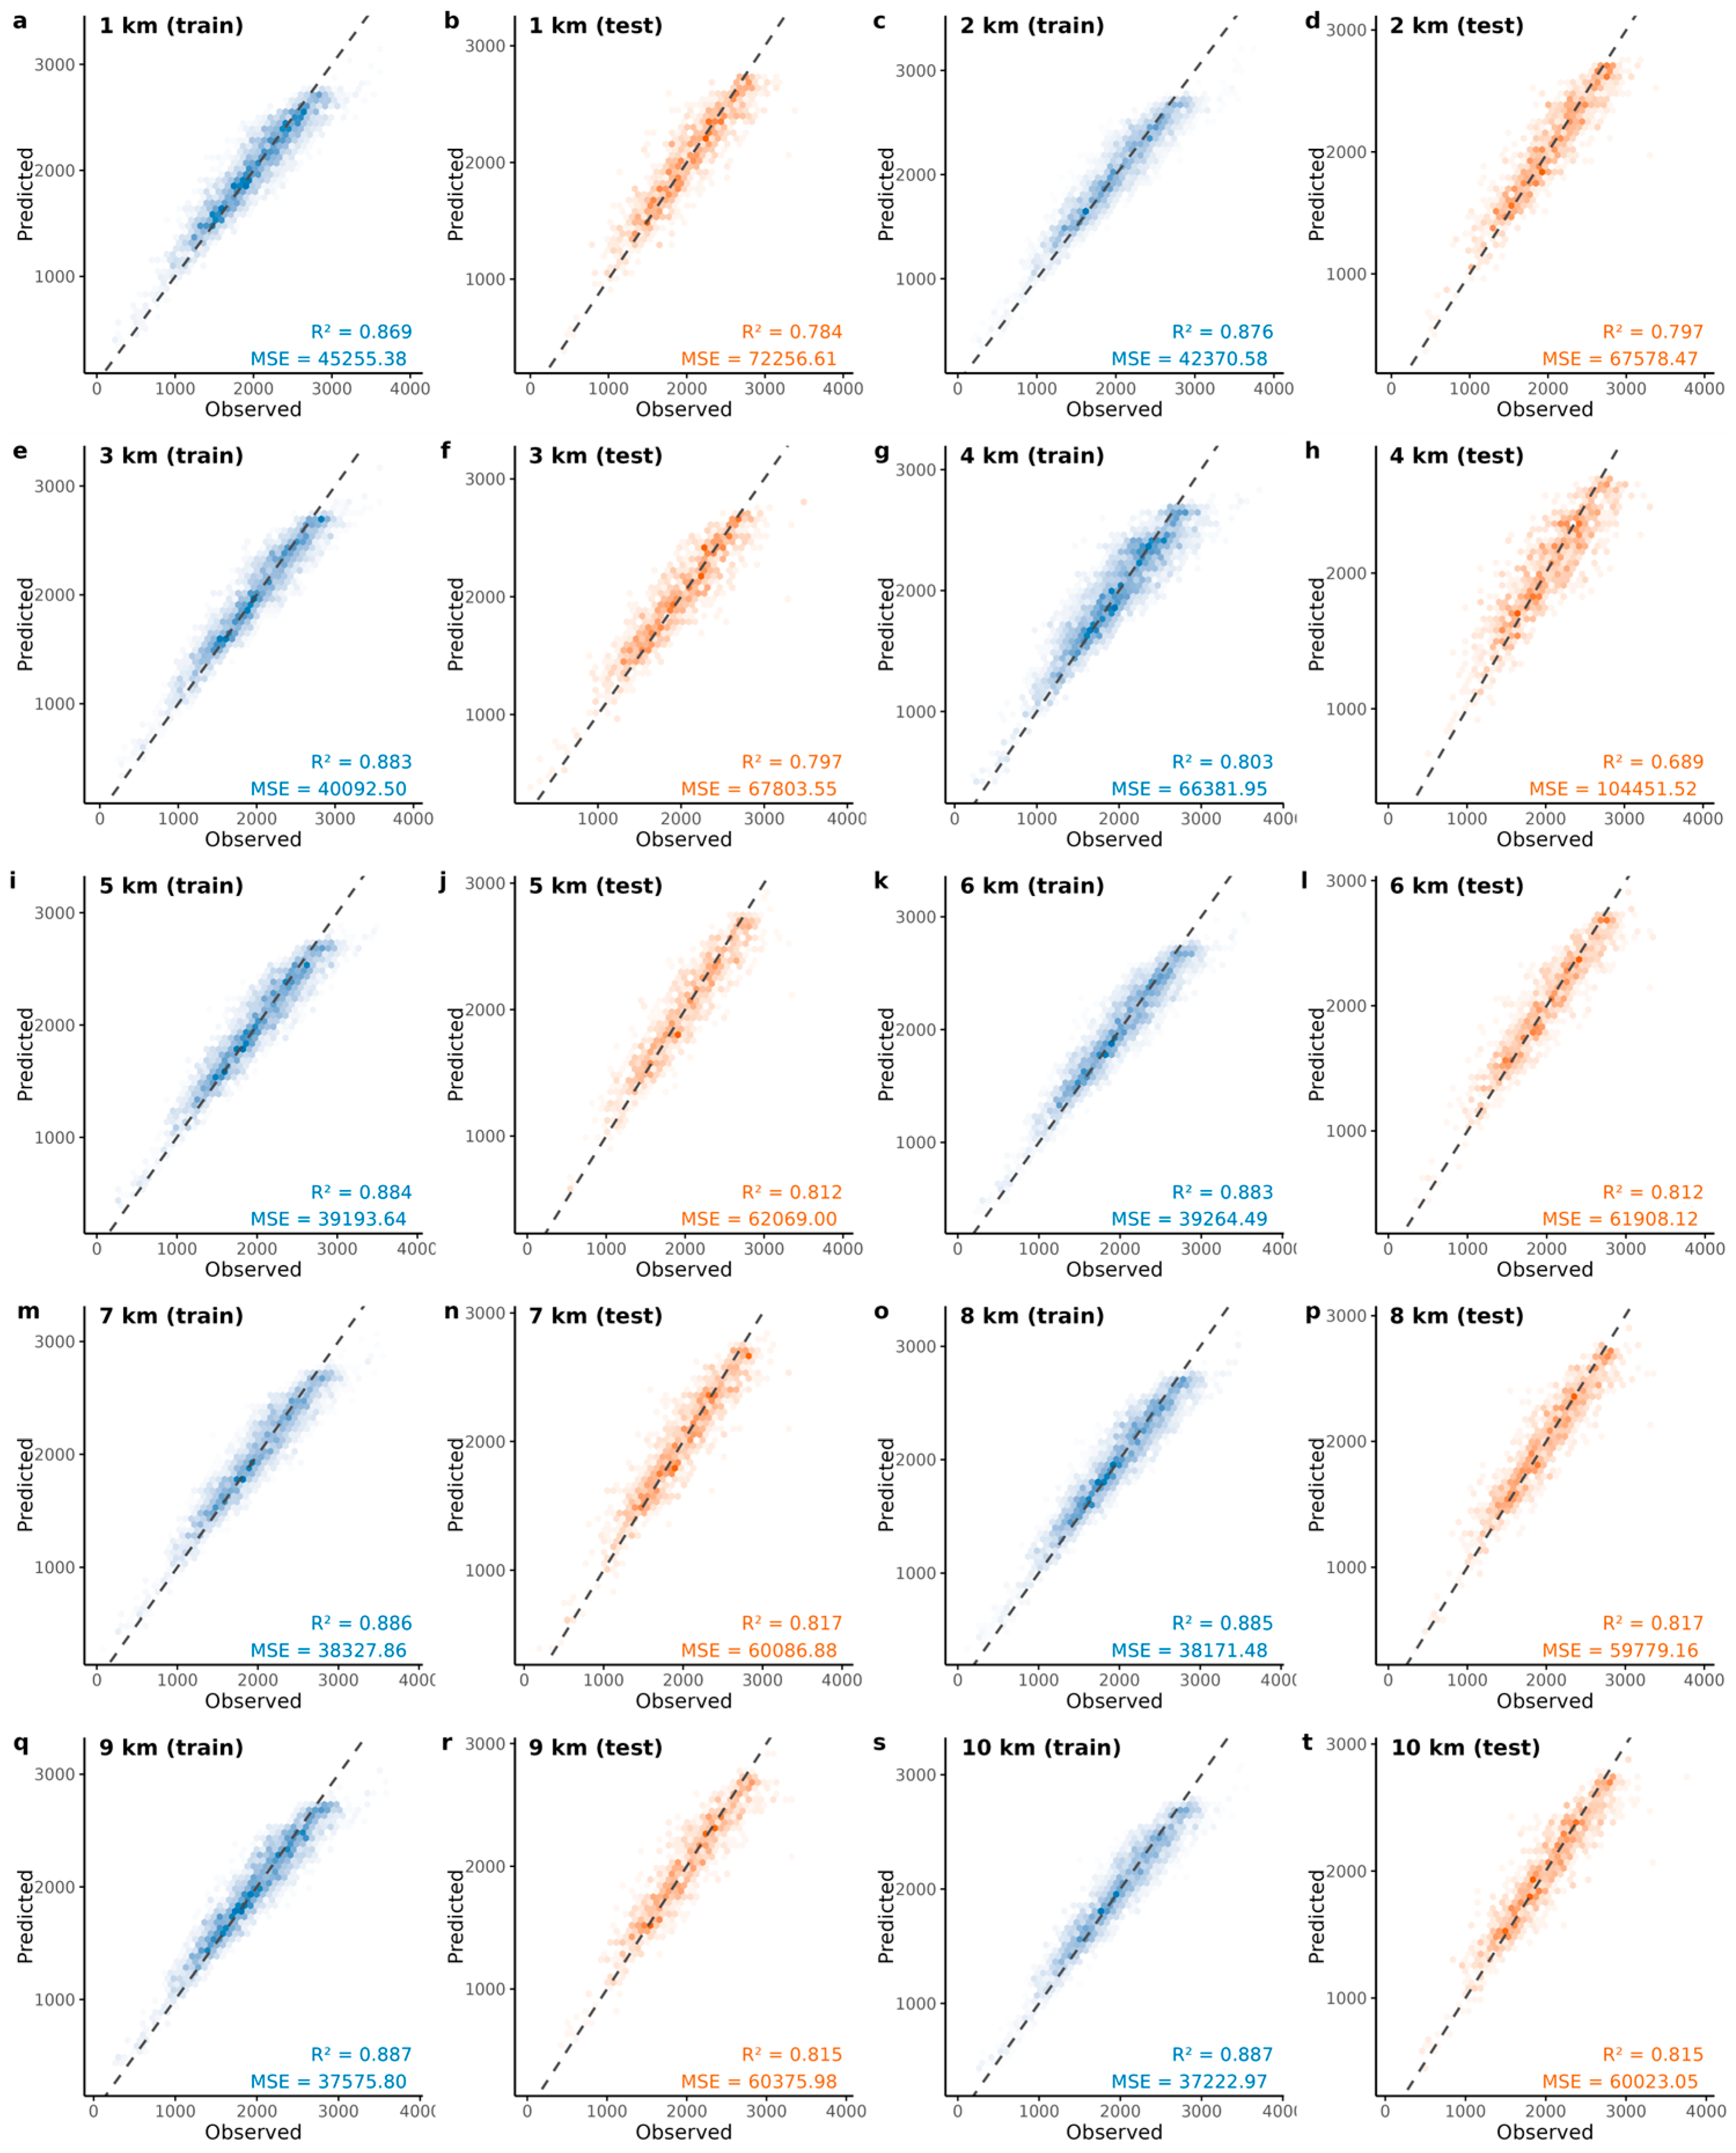
Figure 4 presents the predictive performance of the Gradient Boosting Regression Model (GBRM) across 1–10 km riparian buffers, expressed as the coefficient of determination (R2). Test-set R2 values remain between 0.78 and 0.82 for all buffers except 4 km, where performance drops to 0.689. The 1 km buffer yields an R2 of 0.784, followed by a mild increase with distance, reaching 0.812–0.817 in the 5–10 km range; the 10 km buffer performs best (R2 ≈ 0.815). Training-set R2 values are consistently higher (0.803–0.887), with the largest train–test gap also occurring at 4 km, suggesting heightened ecological heterogeneity and some risk of over-fitting at this intermediate scale. Overall, GBRM delivers stable performance across spatial scales, and the superior accuracy at broader buffers indicates that wider windows better integrate hydrological and environmental signals, capturing the compound effects of dam operations on NDVI.

4. Discussion

By integrating an array of environmental indicators within Linear Regression and Gradient Boosting Regression Model (GBRM) model, we illuminate the global spatiotemporal dynamics of riparian ecosystems adjacent to dams. The significant variability in NDVI changes post-dam construction across different ecological zones highlights the sensitivity of these ecosystems to hydrological modifications. The pronounced vegetation growth in Tropical and Subtropical Coniferous Forests and the adverse effects observed in Tundra regions exemplify the ecological specificity of dam impacts.
The emergence of climate and dam characteristics as primary determinants of vegetation dynamics aligns with prevailing ecological theories and emphasizes the need for integrating these considerations into dam planning and management strategies. The GBRM model analysis reinforces the critical role of climate factors and highlights the substantial impact of dam characteristics on riparian vegetation. This points to the potential for using dam design and operation as tools for mitigating adverse ecological impacts, particularly in light of the predictive insights into future vegetation changes.
The predictive modeling of NDVI values for the years 2040, 2070, and 2100 underscores the challenges posed by climate change and highlights the urgency for adaptive management strategies [41,51,52]. Despite these broad temporal and scenario-based patterns, the magnitude of NDVI also differs among Ecoregions. For instance, ecoregions 2 and 3 tend to maintain comparatively higher NDVI levels, whereas ecoregions 6 and 11 exhibit lower averages. Moreover, buffer distance effects are modest yet discernible: NDVI values at 1 km and 10 km buffers differ by less than 10% on average, suggesting that vegetation response near the riparian corridor is not drastically different from that at the broader landscape scale, although certain ecoregions (e.g., 5, 12) show more pronounced variation with increasing distance. Additionally, the most substantial NDVI maxima occur in specific ecoregions under particular time-scenario combinations (e.g., SSP126 or SSP585 in the mid to late 21st century), reflecting local ecological or climatic advantages. Conversely, NDVI minima frequently appear under SSP370, especially during the 2071–2100 interval, underscoring the potential combined impacts of elevated warming and more limited mitigation efforts.
These results point to a spatially and temporally heterogeneous NDVI trajectory across the region, with scenario-specific differences becoming more evident in the second half of the century. Ecoregions vary in their response intensity, and the buffer-scale analysis reveals nuanced gradients of vegetation change emanating outward from the riparian zone. Future research may benefit from incorporating finer-scale land-use data and improved climate projections, enabling a more precise understanding of how dam operations, ecological context, and socioeconomic pathways jointly shape long-term riparian vegetation dynamics. The anticipated shifts in riparian vegetation patterns necessitate a forward-looking approach to conservation planning, emphasizing the importance of long-term ecological monitoring and resilience-building measures. The variability in vegetation responses across different ecological zones calls for tailored conservation strategies that account for the unique characteristics and vulnerabilities of each zone. Such strategies may include enhancing connectivity between fragmented habitats, restoring natural flow regimes, and implementing climate-adaptation measures to buffer riparian ecosystems against future climatic extremes.
The framework of our research provides operationally relevant evidence for dam planning and environmental governance. By parameterizing dam construction–intensity factors (capacity, reservoir area, dam height, degree of regulation) under local basin conditions, agencies can project NDVI responses in currently undeveloped catchments, pre-emptively delineate high-risk buffers, and schedule conservation zoning or targeted restoration prior to construction. The resulting risk layers and forecasts can be embedded into environmental impact assessment with uncertainty communicated via confidence intervals and cluster robust errors where applicable. Model diagnostics highlight key drivers of riparian vegetation response, thereby informing design envelopes and monitoring priorities, and enabling a transparent balance between hydropower development and riparian ecosystem integrity.
Although this study employs both traditional linear regression and the GBRM model, several limitations persist. While the GBRM approach mitigates some shortcomings inherent in linear assumptions, it does not fundamentally advance our mechanistic understanding and remains somewhat of a “black box”, relying on data-driven relationships to project future changes. Nevertheless, its performance lies within an acceptable range, with average R2 values across the ten models (1–10 km buffers) reaching 0.87 for the training set and 0.80 for the testing set.
While predictive models provide insights into potential future changes, they are inherently subject to uncertainties related to model assumptions, input data, and external factors. Riparian habitats and their biodiversity are likely to face complex challenges under future climatic and hydrological scenarios. Therefore, further research should focus on refining hydrological models and integrating analyses of land-use disturbances to better understand the interconnected effects of dams, climate variability, and human activities. Such efforts could contribute to the development of adaptive management frameworks that balance human needs with ecosystem sustainability, fostering a more comprehensive understanding of the long-term implications of dam construction and operation on riparian systems.

Supplementary Materials

The following supporting information can be downloaded at: https://www.mdpi.com/article/10.3390/rs17173018/s1, Figure S1: Linear Correlation Heatmap of Factors from 1 to 10 km; Figure S2: Study areas and buffer example; Figure S3: Boxplot of the Partitioned Statistics of NDVI Change Rate (K_After) after Dam Construction and Mean Difference of NDVI (Mean_diff) before and after Dam Construction of different ecoregions; Figure S4: The linear regression parameters for buffers; Table S1: Data description and source; Table S2: The names and abbreviations of the 14 ecoregions based on the global eco-geographical classification; Table S3: The dam exhibits a decreasing trend in NDVI post-construction. Refs. [41,42,43,45,53,54,55] are cited in the supplementary materials.

Author Contributions

Conceptualization, Y.L. (Yunlong Liu) and L.H.; methodology, Y.L. (Yunlong Liu); software, Y.L. (Yunlong Liu); validation, Y.L. (Yunlong Liu), M.H. and Z.Z.; formal analysis, Y.L. (Yunlong Liu); investigation, Y.L. (Yunlong Liu); resources, L.H.; data cu-ration, Y.L. (Yunlong Liu); writing—original draft preparation, Y.L. (Yunlong Liu); writing—review and editing, Y.L. (Yunlong Liu), T.S. and Y.L. (Yanyi Li); visualization, Y.L. (Yunlong Liu); supervision, L.H.; project administration, L.H.; funding acquisition, L.H. All authors have read and agreed to the published version of the manuscript.

Funding

This research was funded by the National Natural Science Foundation of China (Grant No. 42425105, 72394403), the CAS Interdisciplinary Innovation Team [Grant No: JCTD-2019-04] and the Strategic Priority Research Program of Chinese Academy of Sciences (XDA20040302).

Data Availability Statement

Data will be made available on request.

Conflicts of Interest

The authors declare no conflicts of interest.

Appendix A

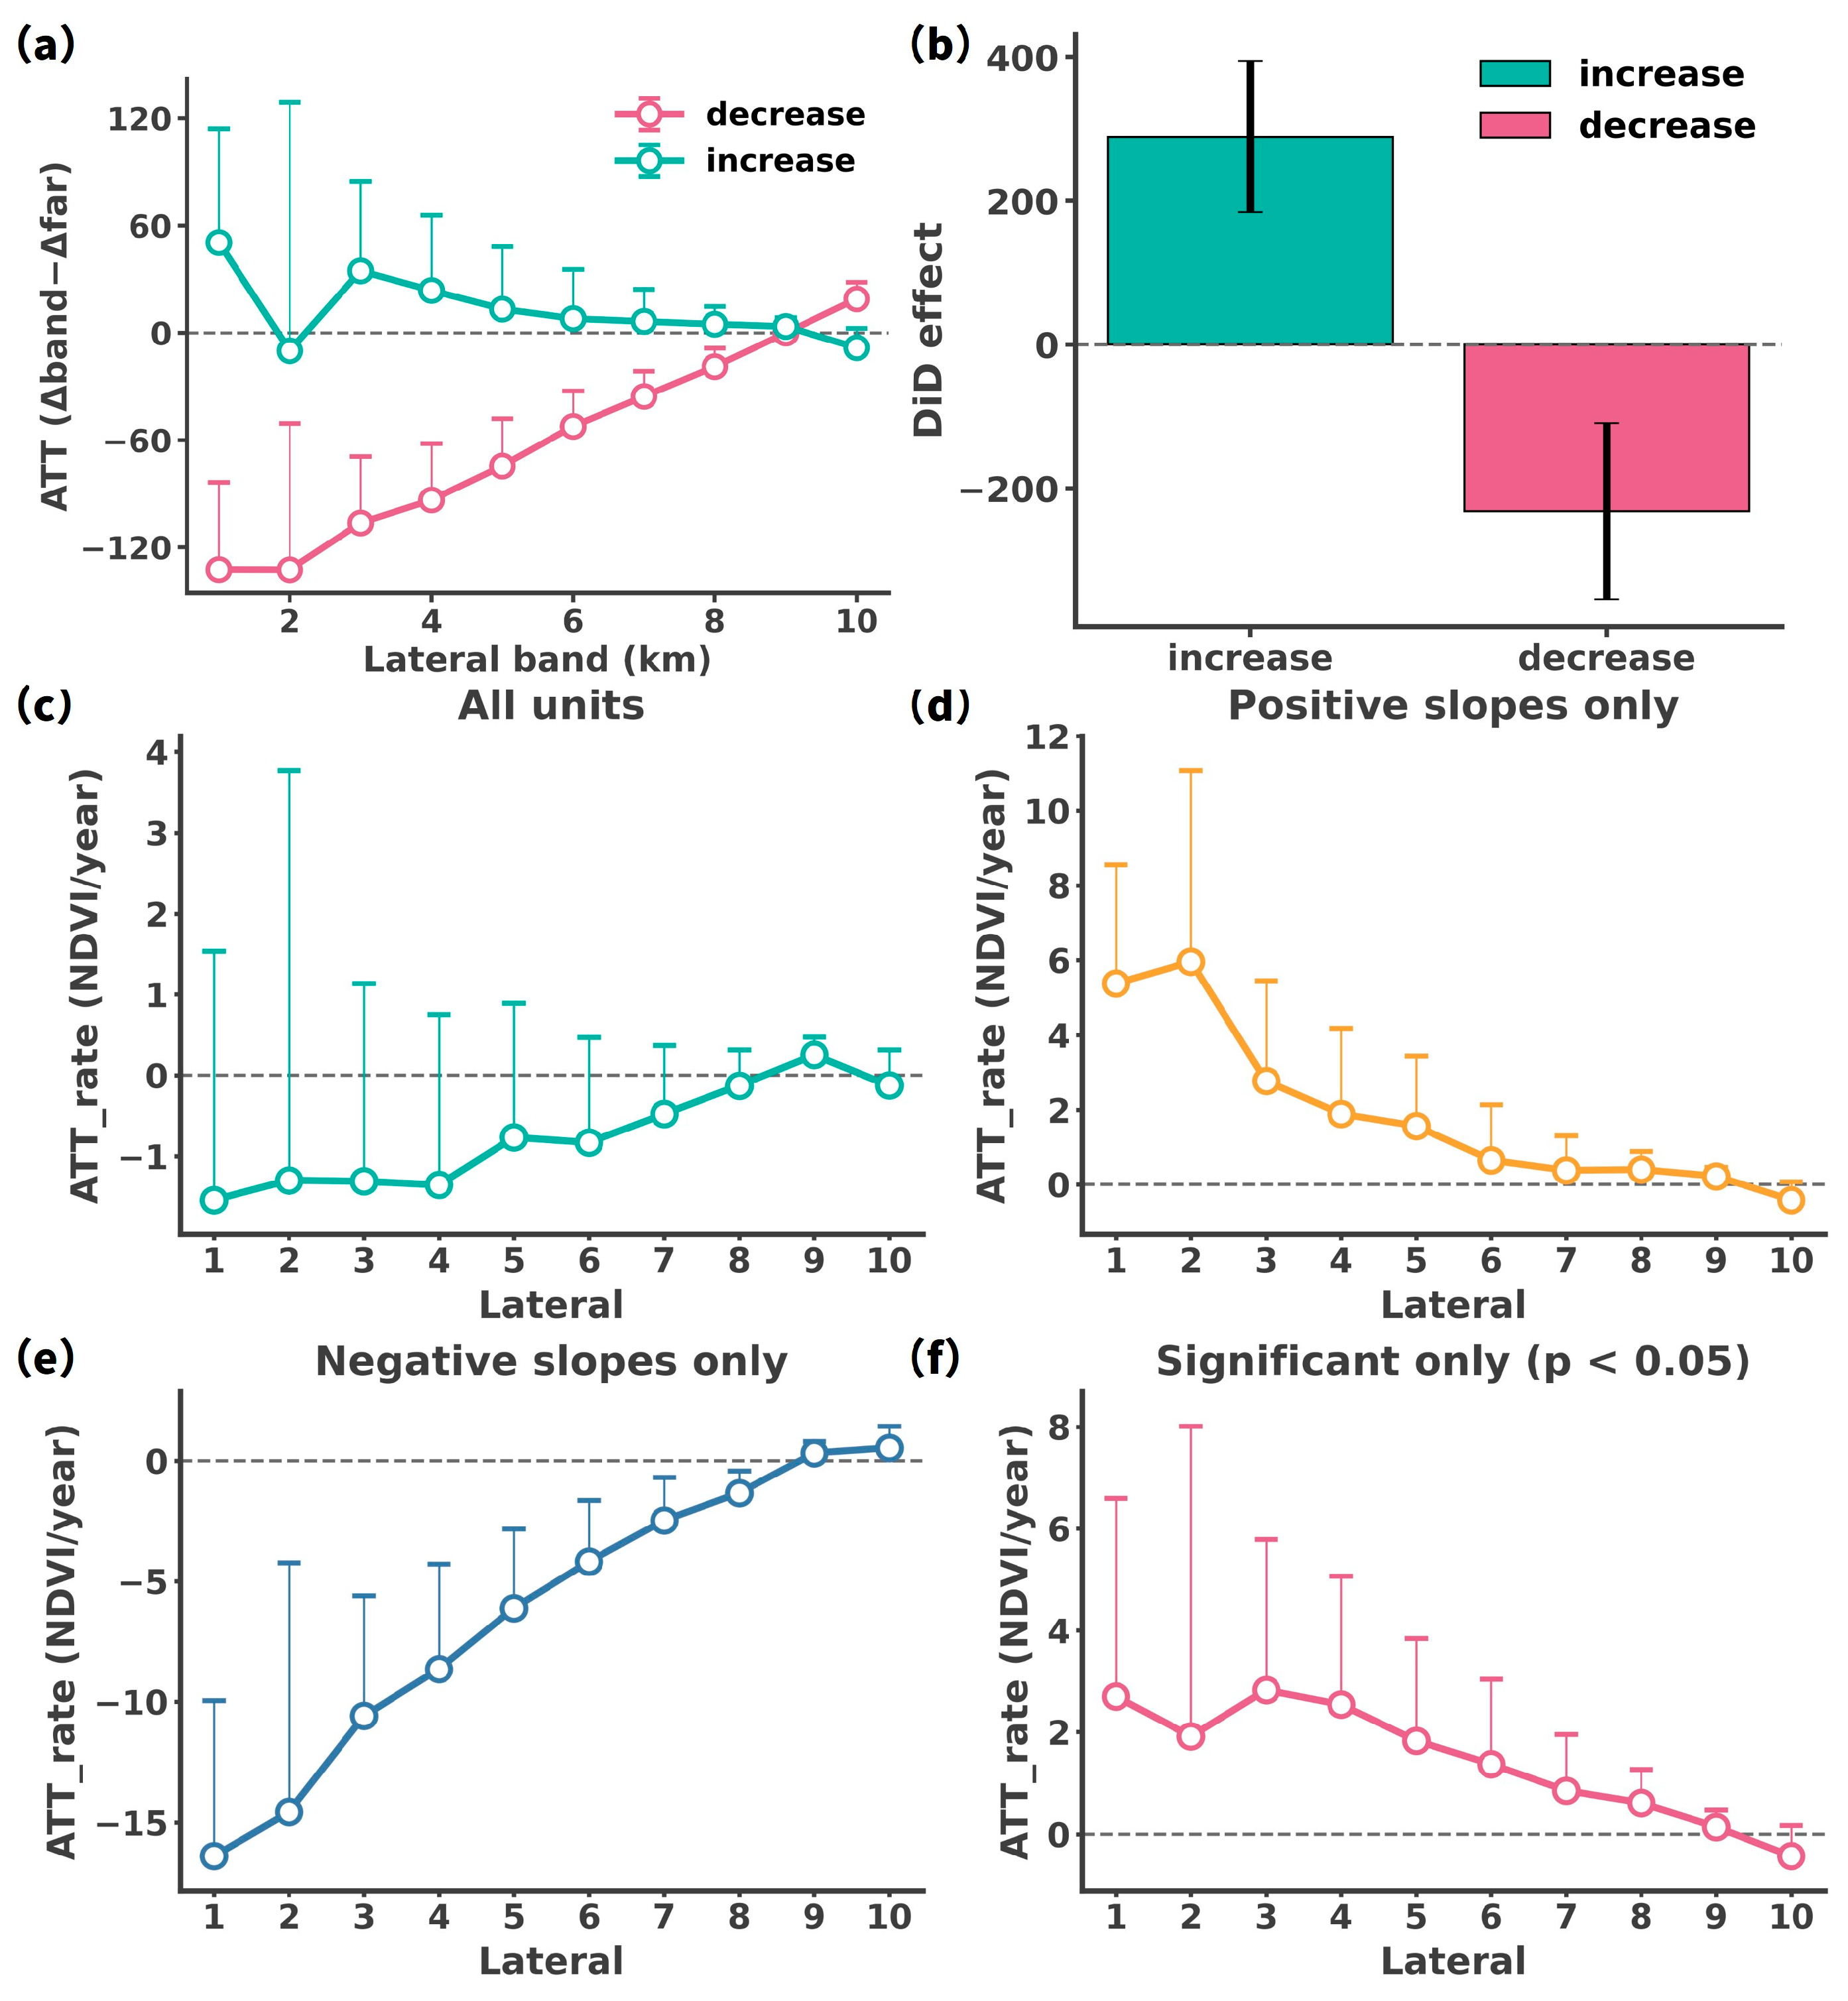
Using rings 8–10 km as the counterfactual (Figure A1a), the increase set shows a mean ATT of +3.62 × 10⁻⁴ (± 3.93 × 10⁻⁴) at 1–3 km, while the far zone is ≈0 (±5.20 × 10⁻⁵). The peak occurs at 1 km (+5.05 × 10⁻⁴), followed by a monotonic decline with a linear gradient of −5.25 × 10⁻⁵ km−1. The decrease set shows a mean ATT of −1.212 × 10⁻³ (±2.87 × 10⁻⁴) at 1–3 km, with the far zone ≈0 (±5.00 × 10⁻⁵); the strongest negative effect is at 2 km (−1.325 × 10⁻³), converging toward zero with distance (gradient +1.744 × 10⁻⁴ km−1). These patterns indicate that the net NDVI change around dams is highly localized—strong near the dam and rapidly diminishing to no detectable difference at larger distances.
Figure A1. Heterogeneous dam impacts on riparian NDVI based on DiD and slope-based ATT estimates. (a) Band-wise ATT (Δband − Δfar) profiles, reported separately for dams classified as NDVI increase/decrease based on near-ring three-year pre-/post-means. (b) DiD (TWFE) estimates, shown separately for dams classified as NDVI increase/decrease. (cf) Slope-based ATTrate (NDVI/year) estimates using post-dam years only. (c) All dams pooled. (d) Dams with positive post-dam NDVI slopes only. (e) Dams with negative slopes only. (f) Dams with statistically significant slopes only (p < 0.05). Notes: treated = near rings (1–3 km), control = far rings (8–10 km), event year excluded. Error bars represent 95% cluster-robust confidence intervals at the dam level. All ATT values are scaled by 105 for display.
Remotesensing 17 03018 g0a1
The DiD regression (Figure A1b) corroborates Figure A1a in both sign and significance. In a two-way fixed-effects specification, the near × post coefficient is +2.893 × 10⁻³ (SE = 5.36 × 10⁻⁴, t = 5.39, p = 6.9 × 10⁻⁸) for the increase set and −2.320 × 10⁻³ (SE = 6.26 × 10⁻⁴, t = −3.70, p = 2.1 × 10⁻⁴) for the decrease set. The signs mirror the ATT curves, providing model-based support for a post-dam divergence between near and far zones.
Trend differences further reveal a near-field rate-of-change effect (Figure A1c–f). For ALL dams, the mean ATTrate at 1–3 km is −1.41 × 10⁻⁵ yr−1 (±1.83 × 10⁻⁵ yr−1), the far zone is ≈0 yr−1 (±2.20 × 10⁻⁶ yr−1), and effects with distance is about gradient +1.99 × 10⁻⁶ yr−1 km−1. In the POS subset (positive slopes), ATTrate at 1–3 km is +4.32 × 10⁻⁵ yr−1 (±1.93 × 10⁻⁵ yr−1), the far zone is +6.8 × 10⁻⁷ yr−1 (±2.44 × 10⁻⁶ yr−1), and the effect decays with distance (gradient −6.02 × 10⁻⁶ yr−1 km−1). In the NEG subset (negative slopes), ATTrate at 1–3 km is −1.372 × 10⁻⁴ yr−1 (±3.83 × 10⁻⁵ yr−1), the far zone is −1.58 × 10⁻⁶ yr−1 (±4.64 × 10⁻⁶ yr−1), and the effect rebounds toward zero with distance (gradient +1.92 × 10⁻⁵ yr−1 km−1). Restricting to SIG units (p < 0.05) preserves the same distance-decay shape: +2.63 × 10⁻⁵ yr−1 (±2.27 × 10⁻⁵ yr−1) at 1–3 km, +1.03 × 10⁻⁶ yr−1 (±3.19 × 10⁻⁶ yr−1) for the far zone, and a gradient of −3.69 × 10⁻⁶ yr−1 km−1.
Overall, whether we consider level changes (Δband − Δfar) or difference of change rates, the strongest impacts occur within 1–3 km of the dam and dissipate by ~8–10 km. The increase and decrease groups are approximate spatial mirror images—opposite in sign yet both exhibiting pronounced near-field effects, indicating a clearly localized dam influence on vegetation NDVI. Moreover, the long-term trend results (annual slopes) corroborate the level-change findings, reinforcing the overall inference.

References

  1. Zarfl, C.; Lumsdon, A.E.; Berlekamp, J.; Tydecks, L.; Tockner, K. A global boom in hydropower dam construction. Aquat. Sci. 2015, 77, 161–170. [Google Scholar] [CrossRef]
  2. Chen, W.; Olden, J.D. Designing flows to resolve human and environmental water needs in a dam-regulated river. Nat. Commun. 2017, 8, 2158. [Google Scholar] [CrossRef] [PubMed]
  3. Tealdi, S.; Camporeale, C.; Ridolfi, L. Modeling the impact of river damming on riparian vegetation. J. Hydrol. 2011, 396, 302–312. [Google Scholar] [CrossRef]
  4. Kellogg, C.H.; Zhou, X. Impact of the construction of a large dam on riparian vegetation cover at different elevation zones as observed from remotely sensed data. Int. J. Appl. Earth Obs. Geoinf. 2014, 32, 19–34. [Google Scholar] [CrossRef]
  5. Botelho, A.; Ferreira, P.; Lima, F.; Pinto, L.M.C.; Sousa, S. Assessment of the environmental impacts associated with hydropower. Renew. Sustain. Energy Rev. 2017, 70, 896–904. [Google Scholar] [CrossRef]
  6. Al-Munqedhi, B.M.; El-Sheikh, M.A.; Alfarhan, A.H.; Alkahtani, A.M.; Arif, I.A.; Rajagopal, R.; Alharthi, S.T. Climate change and hydrological regime in arid lands: Impacts of dams on the plant diversity, vegetation structure and soil in Saudi Arabia. Saudi J. Biol. Sci. 2022, 29, 3194–3206. [Google Scholar] [CrossRef]
  7. Timpe, K.; Kaplan, D. The changing hydrology of a dammed Amazon. Sci. Adv. 2017, 3, e1700611. [Google Scholar] [CrossRef] [PubMed]
  8. Grill, G.; Lehner, B.; Thieme, M.; Geenen, B.; Tickner, D.; Antonelli, F.; Babu, S.; Borrelli, P.; Cheng, L.; Crochetiere, H.; et al. Mapping the world’s free-flowing rivers. Nature 2019, 569, 215–221. [Google Scholar] [CrossRef]
  9. Richter, B.D.; Lamsal, G.; Marston, L.; Dhakal, S.; Sangha, L.S.; Rushforth, R.R.; Wei, D.; Ruddell, B.L.; Davis, K.F.; Hernandez-Cruz, A.; et al. New water accounting reveals why the Colorado River no longer reaches the sea. Commun. Earth Environ. 2024, 5, 134. [Google Scholar] [CrossRef]
  10. Ezcurra, E.; Barrios, E.; Ezcurra, P.; Ezcurra, A.; Vanderplank, S.; Vidal, O.; Villanueva-Almanza, L.; Aburto-Oropeza, O. A natural experiment reveals the impact of hydroelectric dams on the estuaries of tropical rivers. Sci. Adv. 2019, 5, eaau9875. [Google Scholar] [CrossRef]
  11. Yi, Y.J.; Zhou, Y.; Song, J.; Zhang, S.; Cai, Y.; Yang, W.; Yang, Z. The effects of cascade dam construction and operation on riparian vegetation. Adv. Water Resour. 2019, 131, 10326. [Google Scholar] [CrossRef]
  12. Gonçalves-Souza, D.; Vilela, B.; Phalan, B.; Dobrovolski, R. The role of protected areas in maintaining natural vegetation in Brazil. Sci. Adv. 2021, 7, eabh2932. [Google Scholar] [CrossRef]
  13. Sankey, J.B.; Ralston, B.E.; Grams, P.E.; Schmidt, J.C.; Cagney, L.E. Riparian vegetation, Colorado River, and climate: Five decades of spatiotemporal dynamics in the Grand Canyon with river regulation. J. Geophys. Res. Biogeosciences 2015, 120, 1532–1547. [Google Scholar] [CrossRef]
  14. Isbell, F.; Craven, D.; Connolly, J.; Loreau, M.; Schmid, B.; Beierkuhnlein, C.; Bezemer, T.M.; Bonin, C.; Bruelheide, H.; de Luca, E.; et al. Biodiversity increases the resistance of ecosystem productivity to climate extremes. Nature 2015, 526, 574–577. [Google Scholar] [CrossRef]
  15. Fischer, S.; Greet, J.; Walsh, C.J.; Catford, J.A. Flood disturbance affects morphology and reproduction of woody riparian plants. Sci. Rep. 2021, 11, 16477. [Google Scholar] [CrossRef] [PubMed]
  16. Yu, S.-Y.; Li, W.-J.; Zhou, L.; Yu, X.; Zhang, Q.; Shen, Z. Human disturbances dominated the unprecedentedly high frequency of Yellow River flood over the last millennium. Sci. Adv. 2023, 9, eadf8576. [Google Scholar] [CrossRef] [PubMed]
  17. Hossain, F. Empirical Relationship between Large Dams and the Alteration in Extreme Precipitation. Nat. Hazards Rev. 2010, 11, 97–101. [Google Scholar] [CrossRef]
  18. Stahly, S.; Franca, M.J.; Robinson, C.T.; Schleiss, A.J. Sediment replenishment combined with an artificial flood improves river habitats downstream of a dam. Sci. Rep. 2019, 9, 5176. [Google Scholar] [CrossRef] [PubMed]
  19. Liu, Y.; Lu, H.; Tian, P.; Qiu, L. Evaluating the effects of dams and meteorological variables on riparian vegetation NDVI in the Tibetan Plateau. Sci. Total Environ. 2022, 831, 154933. [Google Scholar] [CrossRef]
  20. He, L.; Liu, Y.-L.; Tang, Z.-J.; Sun, T.; Yan, Y.-M.; Xia, Y.-F.; Feng, H.-S.; Ye, W. Intensified excessive wastage of key raw metals with expansion of global wind and solar photovoltaic energy development. Resour. Conserv. Recycl. 2025, 215, 108127. [Google Scholar] [CrossRef]
  21. Aguiar, F.C.; Martins, M.J.; Silva, P.C.; Fernandes, M.R. Riverscapes downstream of hydropower dams: Effects of altered flows and historical land-use change. Landsc. Urban. Plan. 2016, 153, 83–98. [Google Scholar] [CrossRef]
  22. Ouyang, W.; Skidmore, A.K.; Hao, F.H.; Toxopeus, A.G.; Abkar, A. Accumulated effects on landscape pattern by hydroelectric cascade exploitation in the Yellow River basin from 1977 to 2006. Landsc. Urban Plan 2009, 93, 163–171. [Google Scholar] [CrossRef]
  23. Wang, S.; Li, H.; Wei, X.; Zhu, N.; Sun, P.; Xia, L.; Tang, C.; Han, Q.; Zhang, G.; Liu, C.; et al. Dam Construction as an Important Anthropogenic Activity Disturbing Soil Organic Carbon in Affected Watersheds. Environ. Sci. Technol. 2020, 54, 7932–7941. [Google Scholar] [CrossRef]
  24. Luan, J.; Zhang, Y.; Li, X.; Ma, N.; Naeem, S.; Xu, Z.; Miao, P.; Wang, R. Disentangling streamflow impacts of check dams from vegetation changes. J. Hydrol. 2024, 638, 131477. [Google Scholar] [CrossRef]
  25. Tonkin, J.D.; Merritt, D.M.; Olden, J.D.; Reynolds, L.V.; Lytle, D.A. Flow regime alteration degrades ecological networks in riparian ecosystems. Nat. Ecol. Evol. 2018, 2, 86–93. [Google Scholar] [CrossRef] [PubMed]
  26. Gumiero, B.; Rinaldi, M.; Belletti, B.; Lenzi, D.; Puppi, G. Riparian vegetation as indicator of channel adjustments and environmental conditions: The case of the Panaro River (Northern Italy). Aquat. Sci. 2015, 77, 563–582. [Google Scholar] [CrossRef]
  27. Cuo, L.; Lettenmaier, D.P.; Alberti, M.; Richey, J.E. Effects of a century of land cover and climate change on the hydrology of the Puget Sound basin. Hydrol. Process 2009, 23, 907–933. [Google Scholar] [CrossRef]
  28. Pettorelli, N.; Vik, J.O.; Mysterud, A.; Gaillard, J.-M.; Tucker, C.J.; Stenseth, N.C. Using the satellite-derived NDVI to assess ecological responses to environmental change. Trends Ecol. Evol. 2005, 20, 503–510. [Google Scholar] [CrossRef]
  29. Zhang, Y.; Wang, X.; Li, C.; Cai, Y.; Yang, Z.; Yi, Y. NDVI dynamics under changing meteorological factors in a shallow lake in future metropolitan, semiarid area in North China. Sci. Rep. 2018, 8, 15971. [Google Scholar] [CrossRef]
  30. Wen, Z.; Wu, S.; Chen, J.; Lü, M. NDVI indicated long-term interannual changes in vegetation activities and their responses to climatic and anthropogenic factors in the Three Gorges Reservoir Region, China. Sci. Total Environ. 2017, 574, 947–959. [Google Scholar] [CrossRef]
  31. Evans, J.E.; Huxley, J.M.; Vincent, R.K. Upstream channel changes following dam construction and removal using a GIS/remote sensing approach. J. Am. Water Resour. Assoc. 2007, 43, 683–697. [Google Scholar] [CrossRef]
  32. Fu, B.; Li, Y.; Wang, Y.; Campbell, A.; Zhang, B.; Yin, S.; Zhu, H.; Xing, Z.; Jin, X. Evaluation of riparian condition of Songhua River by integration of remote sensing and field measurements. Sci. Rep. 2017, 7, 2565. [Google Scholar] [CrossRef] [PubMed]
  33. Maselli, F. Monitoring forest conditions in a protected Mediterranean coastal area by the analysis of multiyear NDVI data. Remote Sens. Environ. 2004, 89, 423–433. [Google Scholar] [CrossRef]
  34. Shen, B.; Fang, S.; Gang, L. Vegetation Coverage Changes and Their Response to Meteorological Variables from 2000 to 2009 in Naqu, Tibet, China. Can. J. Remote Sens. 2014, 40, 67–74. [Google Scholar] [CrossRef]
  35. Ouyang, W.; Hao, F.H.; Zhao, C.; Lin, C. Vegetation response to 30 years hydropower cascade exploitation in upper stream of Yellow River. Commun. Nonlinear Sci. Numer. Simul. 2010, 15, 1928–1941. [Google Scholar] [CrossRef]
  36. Degu, A.M.; Hossain, F.; Niyogi, D.; Pielke, R.; Shepherd, J.M.; Voisin, N.; Chronis, T. The influence of large dams on surrounding climate and precipitation patterns. Geophys. Res. Lett. 2011, 38, L04405. [Google Scholar] [CrossRef]
  37. Maavara, T.; Lauerwald, R.; Regnier, P.; Van Cappellen, P. Global perturbation of organic carbon cycling by river damming. Nat. Commun. 2017, 8, 15347. [Google Scholar] [CrossRef]
  38. Yang, P.B.; Chan, Y.J.; Yazdi, S.K.; Lim, J.W. Optimisation and economic analysis of industrial-scale anaerobic co-digestion (ACoD) of palm oil mill effluent (POME) and decanter cake (DC) using machine learning models: A comparative study of Gradient Boosting Machines, K-nearest neighbours (KNN), and random forest. J. Water Process Eng. 2024, 58, 104752. [Google Scholar] [CrossRef]
  39. Wang, X.; Shan, K.; Huang, P.; Ma, M.; Wu, S. Response of soil aggregate stability to plant diversity loss along an inundation stress gradient in a reservoir riparian zone. Catena 2023, 233, 107472. [Google Scholar] [CrossRef]
  40. Naghibi, S.A.; Hashemi, H.; Berndtsson, R.; Lee, S. Application of extreme gradient boosting and parallel random forest algorithms for assessing groundwater spring potential using DEM-derived factors. J. Hydrol. 2020, 589, 125197. [Google Scholar] [CrossRef]
  41. Lehner, B.; Liermann, C.R.; Revenga, C.; Vörösmarty, C.; Fekete, B.; Crouzet, P.; Döll, P.; Endejan, M.; Frenken, K.; Magome, J.; et al. High-resolution mapping of the world’s reservoirs and dams for sustainable river-flow management. Front. Ecol. Environ. 2011, 9, 494–502. [Google Scholar] [CrossRef]
  42. Karger, D.N.; Conrad, O.; Bohner, J.; Kawohl, T.; Kreft, H.; Soria-Auza, R.W.; Zimmermann, N.E.; Linder, H.P.; Kessler, M. Climatologies at high resolution for the earth’s land surface areas. Sci. Data 2017, 4, 170122. [Google Scholar] [CrossRef]
  43. Hengl, T.; Mendes de Jesus, J.; Heuvelink, G.B.; Ruiperez Gonzalez, M.; Kilibarda, M.; Blagotic, A.; Shangguan, W.; Wright, M.N.; Geng, X.; Bauer-Marschallinger, B.; et al. SoilGrids250m: Global gridded soil information based on machine learning. PLoS ONE 2017, 12, e0169748. [Google Scholar] [CrossRef]
  44. Yan, D.; Li, C.; Zhang, X.; Wang, J.; Feng, J.; Dong, B.; Fan, J.; Wang, K.; Zhang, C.; Wang, H. A data set of global river networks and corresponding water resources zones divisions v2. Sci. Data 2022, 9, 770. [Google Scholar] [CrossRef] [PubMed]
  45. Dinerstein, E.; Olson, D.; Joshi, A.; Vynne, C.; Burgess, N.D.; Wikramanayake, E.; Hahn, N.; Palminteri, S.; Hedao, P.; Noss, R. An ecoregion-based approach to protecting half the terrestrial realm. BioScience 2017, 67, 534–545. [Google Scholar] [CrossRef]
  46. Pedregosa, F.; Varoquaux, G.; Gramfort, A.; Michel, V.; Thirion, B.; Grisel, O.; Blondel, M.; Prettenhofer, P.; Weiss, R.; Dubourg, V. Scikit-learn: Machine learning in Python. J. Mach. Learn. Res. 2011, 12, 2825–2830. [Google Scholar]
  47. Otchere, D.A.; Ganat, T.O.A.; Ojero, J.O.; Tackie-Otoo, B.N.; Taki, M.Y. Application of gradient boosting regression model for the evaluation of feature selection techniques in improving reservoir characterisation predictions. J. Pet. Sci. Eng. 2022, 208, 109244. [Google Scholar] [CrossRef]
  48. Rao, H.; Shi, X.; Rodrigue, A.K.; Feng, J.; Xia, Y.; Elhoseny, M.; Yuan, X.; Gu, L. Feature selection based on artificial bee colony and gradient boosting decision tree. Appl. Soft Comput. 2019, 74, 634–642. [Google Scholar] [CrossRef]
  49. Li, X.; Yuan, W.; Dong, W. A machine learning method for predicting vegetation indices in China. Remote Sens. 2021, 13, 1147. [Google Scholar] [CrossRef]
  50. Friedman, J.H. Greedy function approximation: A gradient boosting machine. Ann. Stat. 2001, 29, 1189–1232. [Google Scholar] [CrossRef]
  51. Mallik, A.U.; Richardson, J.S. Riparian vegetation change in upstream and downstream reaches of three temperate rivers dammed for hydroelectric generation in British Columbia, Canada. Ecol. Eng. 2008, 35, 810–819. [Google Scholar] [CrossRef]
  52. Zaniolo, M.; Giuliani, M.; Sinclair, S.; Burlando, P.; Castelletti, A. When timing matters-misdesigned dam filling impacts hydropower sustainability. Nat. Commun. 2021, 12, 3056. [Google Scholar] [CrossRef]
  53. Zhang, Y.; Schaap, M.G.; Zha, Y. A High-Resolution Global Map of Soil Hydraulic Properties Produced by a Hierarchical Parameterization of a Physically Based Water Retention Model. Water Resour. Res. 2018, 54, 9774–9790. [Google Scholar] [CrossRef]
  54. Farr, T.G.; Rosen, P.A.; Caro, E.; Crippen, R.; Duren, R.; Hensley, S.; Kobrick, M.; Paller, M.; Rodriguez, E.; Roth, L.; et al. The Shuttle Radar Topography Mission. Rev. Geophys. 2007, 45. [Google Scholar] [CrossRef]
  55. Sabatini, F.M.; Jiménez-Alfaro, B.; Jandt, U.; Chytrý, M.; Field, R.; Kessler, M.; Lenoir, J.; Schrodt, F.; Wiser, S.K.; Arfin Khan, M.A.S.; et al. Global patterns of vascular plant alpha diversity. Nat. Commun. 2022, 13, 4683. [Google Scholar] [CrossRef] [PubMed]
Figure 1. The distribution of global large dams. The figure employs a color gradient to represent the variation in Normalized Difference Vegetation Index (NDVI) values in 2017. The size of the circles represents the number of dams in 846 different ecological subregions. These subregions are grouped into 14 larger ecological regions, each outlined in different colors. The legend provides abbreviations for the 14 major ecological regions, with a corresponding table of abbreviations and names available in Supplementary Table S2.
Remotesensing 17 03018 g001
Figure 2. (a) The multi-year average NDVI of riparian zones after dam construction, with a buffer width of 10 km on one side. (b) illustrates the linear change rate (K_After, p < 0.05) of NDVI after dam construction within 14 major ecological areas globally, along with the mean difference in NDVI before and after dam construction. All NDVI values in this subsection were multiplied by 10,000, Unless otherwise stated, all reported results and figures refer to the scaled values.
Remotesensing 17 03018 g002
Figure 3. The predicted NDVI values and density curve of riparian vegetation during the years 2011–2040, 2040–2070, and 2070–2100 using the GBRM model in SSP126, SSP370, SSP585.
Remotesensing 17 03018 g003
Figure 4. Model performance of the Gradient Boosting Regression Model (GBRM) across 1–10 km buffer zones based on raw data classification. The model was trained using 10-fold cross-validation, with 70% of the data used for training and 30% for testing. NDVI values were uniformly scaled by a factor of 10,000 for consistency.
Remotesensing 17 03018 g004
Table 1. The dam exhibits a decreasing trend in NDVI post-construction (both upstream and downstream area), with significance (p < 0.05). (The value in the table is the NDVI value multiplied by 10,000).
DamCountryYearK_After UpstreamK_After Downstream
AlweroEthiopia1995−17.33−15.37
Amir KabirIran1963−5.85−7.35
Bansagar DamIndia2006−28.77−20.88
CalimaColombia1965−8.44−13.5
DaxiaChina1997−8.91−8.9
GerusoppaIndia2000−21.56−15.33
GodbotsvatnNorway1957−6.46−7.8
Green LakeUS1982−5.77−5.2
HuangbizhuangChina1968−6.05−5.75
JebraNigeria1984−8.4−8.4
JianxinChina1974−6.94−8.57
KenneyCanada1952−11.26−11.26
KodasalliIndia1999−26.71−23.3
Mansour EddahbiMorocco1972−5.82−6.18
MayoCanada1952−8.99−9.72
Mejenin 4Libya1972−7.37−6.72
Midtbotnvatn HoveddamNorway1958−8.56−8.71
MohaleLesotho2002−19.17−18.89
Petit SautFrench Guiana1994−11.99−10.49
Pichi Picun LeufuArgentina2000−29.23−21.9
Poza HondaEcuador1971−8.38−12.75
Rembesdalsvatnet HoveddamNorway1980−8.66−9.01
SghirMorocco1991−14.27−25.12
ShibiChina1958−13.54−26.78
ShuifumiaoChina1960−5.22−8.34
SigaldaIceland1977−7.23−7.56
StyggevatnNorway1990−14.39−15.87
TchimbeleGabon1980−23.34−26.92
Upper PeirceSingapore1975−13.95−16.76
WananChina1990−8.01−8.01
YuracmayoPeru1995−13.92−17.36
ZakariasvatnNorway1969−8.09−7.21
Disclaimer/Publisher’s Note: The statements, opinions and data contained in all publications are solely those of the individual author(s) and contributor(s) and not of MDPI and/or the editor(s). MDPI and/or the editor(s) disclaim responsibility for any injury to people or property resulting from any ideas, methods, instructions or products referred to in the content.