Article

Evaluating Forest Aboveground Biomass Products by Incorporating Spatial Representativeness Analysis

by
Yin Wang
1,2,3,
Xiaohui Wang
1,2,4,*,
Ping Ji
1,2,4,
Haikui Li
1,2,4,
Shengrong Wei
1,2,4 and
Daoli Peng
3
1
Institute of Forest Resource Information Techniques, Chinese Academy of Forestry, Beijing 100091, China
2
Key Laboratory of Forestry Remote Sensing and Information System, National Forestry and Grassland Administration, Beijing 100091, China
3
State Key Laboratory of Efficient Production of Forest Resources, Beijing Forestry University, Beijing 100083, China
4
National Forestry and Grassland Science Data Center, Beijing 100091, China
*
Author to whom correspondence should be addressed.
Remote Sens. 2025, 17(16), 2898; https://doi.org/10.3390/rs17162898
Submission received: 16 June 2025 / Revised: 29 July 2025 / Accepted: 19 August 2025 / Published: 20 August 2025
(This article belongs to the Section Forest Remote Sensing)

Abstract

Forest aboveground biomass (AGB) products serve as essential references for research on carbon cycle and climate change. However, significant uncertainties exist regarding forest AGB products and their evaluation methods. This study aims to evaluate AGB products in the context of discrepancies in plot size and product scales, while also investigate the applicability of large-scale AGB products at a regional level. The National Aeronautics and Space Administration (NASA)’s Global Ecosystem Dynamics Investigation (GEDI) and the European Space Agency (ESA)’s Climate Change Initiative (CCI) biomass data were evaluated using sample plots from the National Forest Inventory (NFI). The study was conducted in Jilin Province, located in Northeast China, which is predominantly covered by natural forests. Spatial representativeness evaluation indicators for sample plots were established, followed by a comprehensive representativeness assessment and the selection of sample plots based on the criteria importance through the intercriteria correlation (CRITIC) method. Additionally, the study conducted an overall evaluation of the products, as well as evaluations across different biomass ranges and various forest types. The results indicate that the accuracy metrics demonstrated improved performance when using representative plots compared to all plots, with the R2 increasing by 15.38%. Both products demonstrated optimal accuracy and stability in the 50–150 Mg/ha range. GEDI and CCI biomass data indicated an overall underestimation, with biases of −25.68 Mg/ha and −83.95 Mg/ha, respectively. Specifically, a slight overestimation occurred in the <50 Mg/ha range, while a gradually increasing underestimation was observed in the ≥50 Mg/ha range. This study highlights the advantages of spatial representativeness analysis in mitigating evaluation uncertainties arising from scale mismatches and enhancing the reliability of product evaluation. The accuracy trends of AGB products offer significant insights that could facilitate improvements and enhance their application.

1. Introduction

Forests, recognized as significant global carbon sinks, play a crucial role in regulating climate and maintaining ecological balance [1,2,3]. Forest aboveground biomass (AGB) serves as a vital indicator for assessing their carbon storage capacity [4,5]. With the increasing attention to climate change, the accurate estimation of forest AGB and its dynamic fluctuations has become a prominent area of research. Scientists have generated numerous AGB products with varying spatial resolutions, typically ranging from 100 m to 1 km [6,7,8,9]. In certain regions, high-resolution AGB maps have also been produced at a 30 m scale [10,11]. Simultaneously, AGB estimation methods have evolved significantly, transitioning from early calculations based on forestry survey data and allometric equations to regression models [12]. This progression has further advanced to sophisticated data-processing techniques, such as machine learning algorithms [13,14,15,16]. Additionally, studies have demonstrated that AGB estimation is more accurate when utilizing multi-source remote sensing data compared to single-source data. Various data sources, including airborne laser scanning, spaceborne LiDAR, optical satellite imagery, and synthetic aperture radar (SAR), contribute to this enhanced accuracy [17,18,19,20].
To promote the utility of these AGB products for estimating carbon stocks at global or regional scales, it is essential to evaluate and discuss the accuracy and applicability of various products, as this remains a primary concern. The direct validation method is the most commonly used evaluation approach. It utilizes sample plot data that meets quality control requirements to obtain relative true values at the pixel scale, which are then used to evaluate AGB products. The direct validation method provides a more objective and accurate evaluation of AGB products and is preferred whenever conditions allow. When it is impossible to obtain pixel-scale relative true values from sample plot data, indirect validation methods can be used to evaluate AGB products based on other validated products. Indirect validation methods include cross-validation based on other AGB products and multi-scale hierarchical validation based on ground measurements and higher-resolution remote sensing data. Hunka et al. [21] conducted an inter-comparison for the most recently released AGB products from the National Aeronautics and Space Administration (NASA)’s Global Ecosystem Dynamics Investigation (GEDI) [22] and the European Space Agency (ESA)’s Climate Change Initiative (CCI) [23]. Their study identified strong correlations between products and the national forest inventory (NFI) estimates in four countries; however, they emphasized the need for evaluation using independent reference data. Other non-product manufacturers evaluated AGB products based on their reference data, which exhibited considerable discrepancies when compared to the accuracy provided by product manufacturers [24,25]. Avitabile et al. [24] evaluated four biomass maps across 26 European countries, revealing that an overall negative bias of −43 to −23 Mg/ha exists at the national level. The relative errors of these maps varied from 29% to 40% at the national level and increased at higher resolutions, reaching 58–67% at the pixel level. These differences can be attributed to several factors, including variations in sample plot size and spatial representativeness, inconsistencies in biomass models and parameters, differences in spatiotemporal consistency, methods of scale conversion between sample plots and products, and uncertainties related to sample plot measurements and geographical locations [26].
When the spatial scales of the sample plot and the pixel are the same or similar, the AGB of the sample plot can represent the pixel value at the corresponding position of the AGB product and can be directly used to evaluate the product. When the scale of the sample plot differs significantly from the pixel scale of the AGB product and the pixel area to be tested is a heterogeneous surface, it is necessary to consider the scale disparity. A multi-scale stepwise validation method based on sample plots and high-resolution remote sensing data can be adopted, using airborne LiDAR data or high-resolution remote sensing data as an intermediate transitional scale to generate high-resolution forest AGB products. Then, the evaluated high-resolution AGB products are upscaled to the same spatial scale as the medium- and low-resolution products to be tested, and AGB products are further evaluated.
However, for large-area and medium- and low-resolution AGB products, acquiring the corresponding large sample plot data may not be straightforward. Moreover, the availability of intermediate high-resolution AGB map from airborne LiDAR or optical imagery is not guaranteed. More commonly available are forest sample plots at scales smaller than those of AGB products. In such cases, due to the disparity between the spatial scale of pixels and plots, directly utilizing these sample plots to evaluate AGB products may be inappropriate and unreliable [27,28,29]. For example, in China’s NFI, the majority of sample plots cover only hundreds of square meters, while many AGB products, especially those that encompass extensive areas, have resolutions ranging from one hundred meters to one kilometer [7,30]. In cases of spatial mismatch, surface spatial heterogeneity may exist within the image pixel that contains sample plots. This implies that the surface features within the pixel are not homogeneous, thus preventing the sample plot from accurately representing the average characteristics of the pixel and introducing evaluation errors [31]. When faced with inconsistencies in plot size and pixel scale, to what extent can a sample plot accurately represent the corresponding pixel of an AGB product? Furthermore, how to select appropriate sample plots is a critical step prior to the evaluation of AGB products.
Spatial representativeness refers to the degree to which data obtained from an observation point or area can reflect the corresponding characteristics or processes across a broader range [32]. Currently, several methods exist for evaluating spatial representativeness, primarily focusing on point-to-pixel consistency and spatial heterogeneity [33,34,35]. Point-to-pixel consistency assesses the degree to which ground measurements accurately represent surface features, compared with regional statistical characteristics [34]. Meanwhile, spatial heterogeneity indicators analyze the variations surrounding ground observations within the pixel, thereby elucidating the spatial variability of the surface [36]. The evaluation of spatial representativeness has primarily been applied in flux observations, particularly in comparison to ecosystem-scale flux measurements [37]. Furthermore, it has gained increasing significance in the evaluation of remote sensing products, due to the discrepancies in scale between ground observations and the pixel resolution of these products [38]. Geostatistical attributes extracted from Enhanced Thematic Mapper Plus (ETM+) retrievals of surface albedo are employed to assess the extent to which a specific tower-based albedo measurement can capture the variability present within the broader footprint of MODIS observations [39]. The triple collocation (TC) technique effectively evaluates the spatial representativeness of point-scale snow depth measurements in relation to satellite grid-scale data across hundreds of meteorological stations [40]. Additionally, satellite observations are utilized to determine the representativeness of statistics derived from samples collected during water quality surveys for lake-wide values, revealing strong linear relationships between the mean values calculated from the samples and the corresponding averages based on subsets of the full satellite images [41].
Several studies on the evaluation of AGB products involves the spatial representativeness of sample plots, which are selected based on low tree cover variability, or the absence of disturbance within the pixel [24]. However, there is a relative scarcity of studies employing systematic and quantitative indicators, as well as composite methods to assess the spatial representativeness of sample plots for AGB products. This gap leads to increased uncertainty in AGB product evaluations. Therefore, it is imperative to adopt more specialized methods to assess spatial representativeness of sample plots, thereby enhancing the reliability of product evaluations.
The study explores how to evaluate AGB products in the context of discrepancies in plot size and AGB product scales, and what is the accuracy and applicability of large-scale AGB products in the forest region of Northeast China. The study primarily consists of the following components: firstly, an assessment approach utilizing spatial representativeness indicators is employed to select sample plots. Subsequently, AGB products are evaluated using these representative sample plots, facilitating both overall and sub-interval evaluations. Finally, the findings from spatial representativeness analysis and product evaluation provide a basis for improving the reliability of AGB product evaluation, thereby enhancing product quality and the rational utilization of AGB products.

2. Materials and Methods

2.1. Study Area and Sample Plots

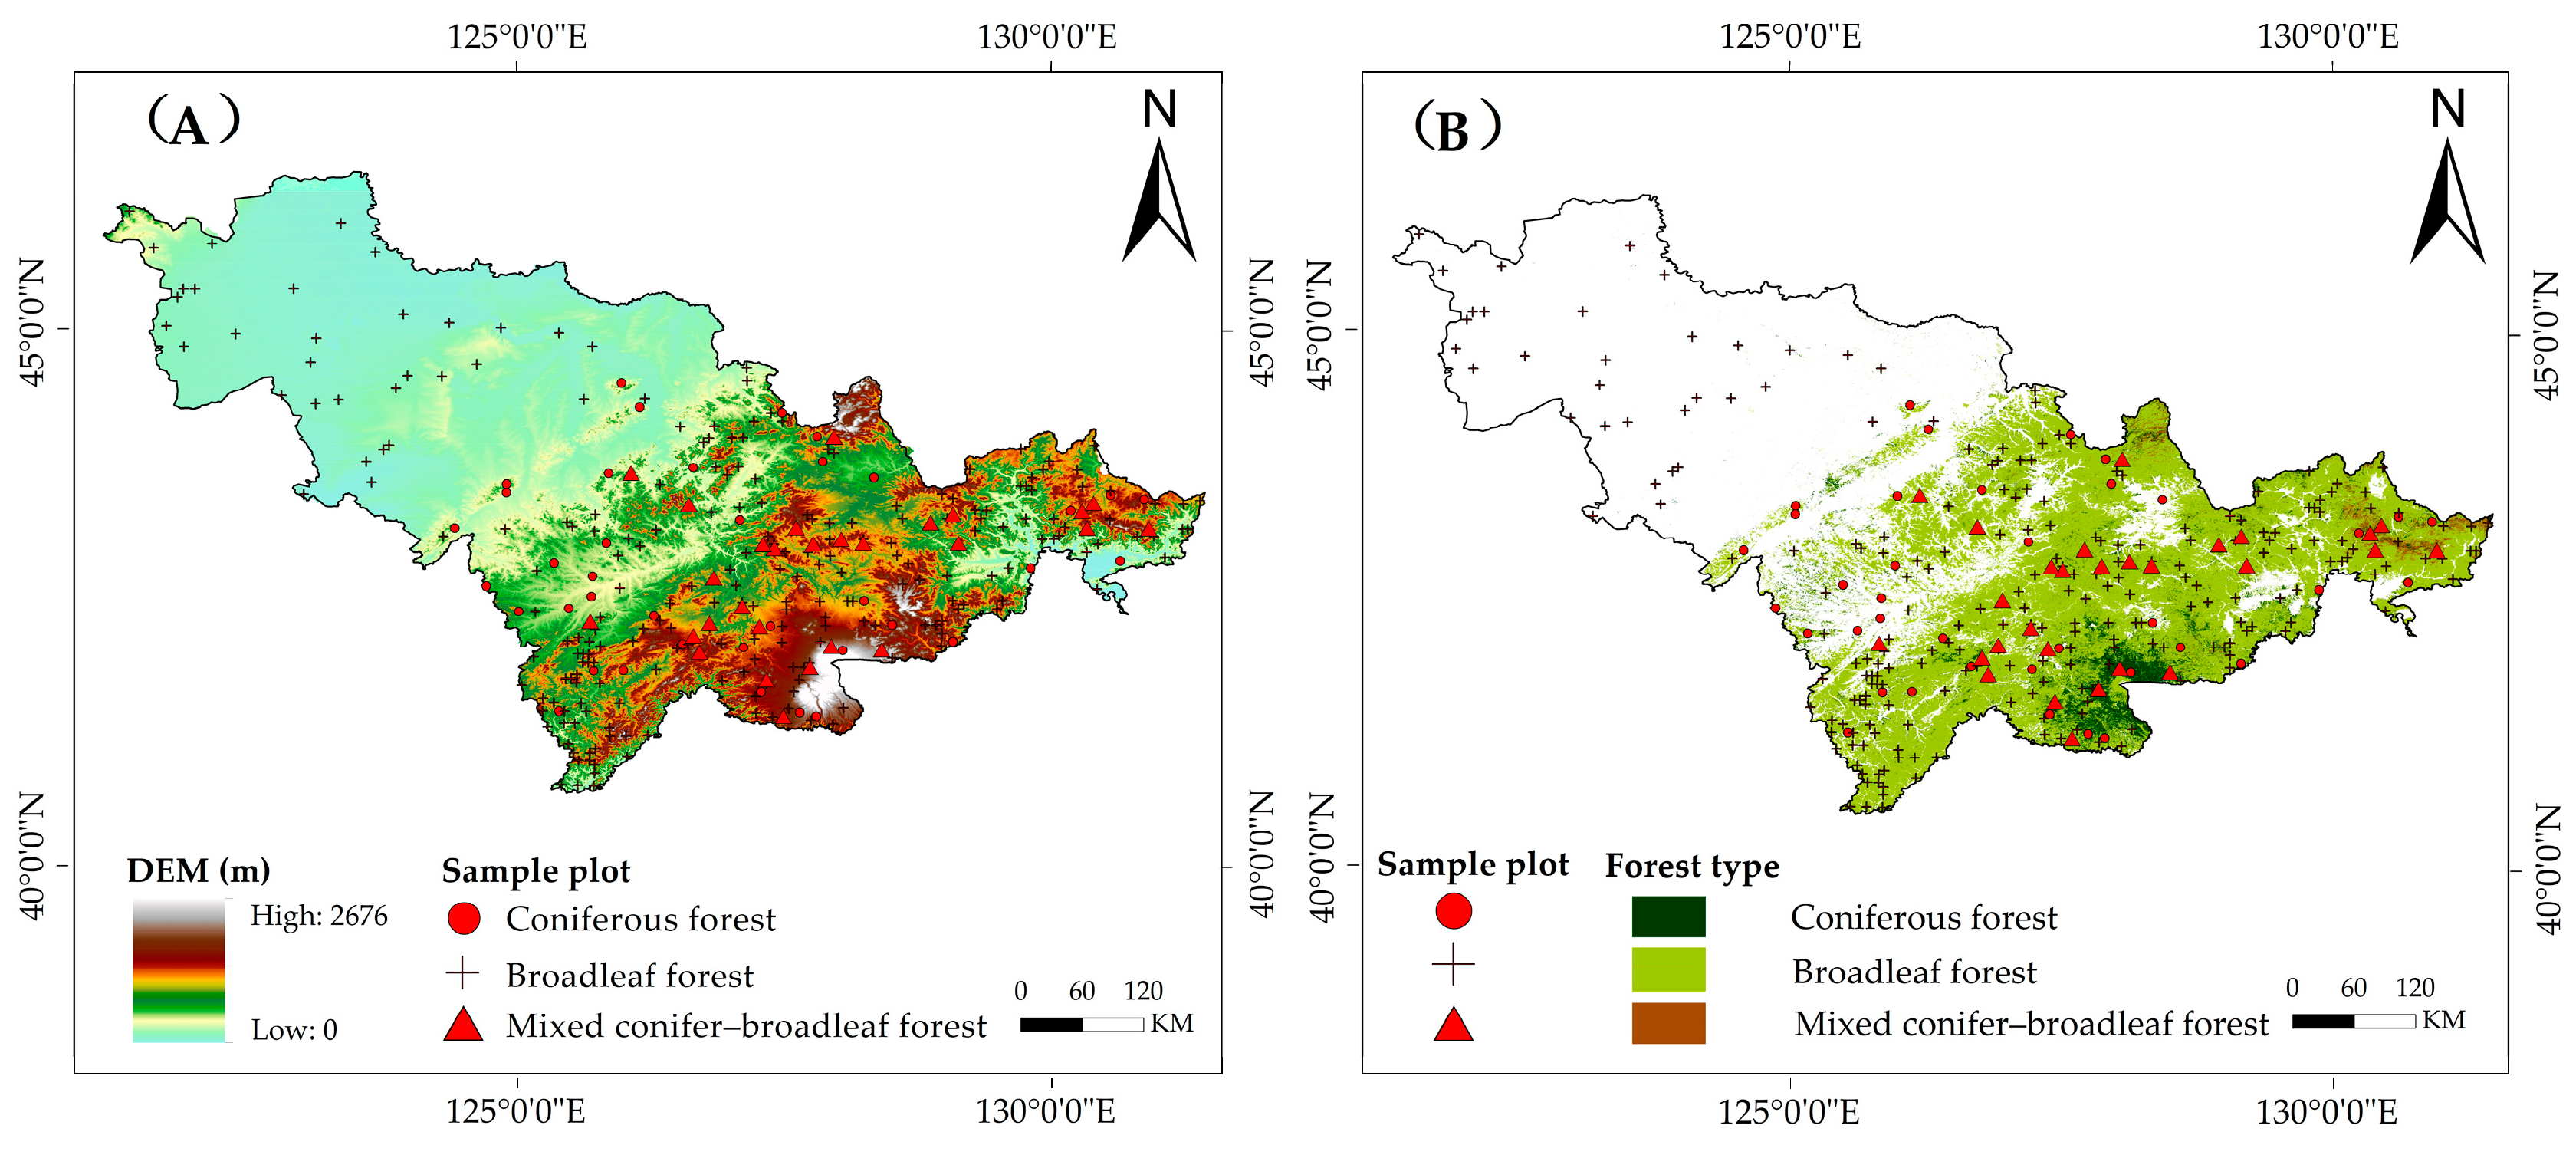
The study area, Jilin Province is located in the central part of Northeast China (Figure 1), with geographical coordinates ranging from 40°52′ to 46°18′ north latitude and 121°38′ to 131°19′ east longitude [42]. It borders Russia and North Korea and covers a total area of 187,400 square kilometers. The climate is classified as a temperate continental monsoon climate, characterized by an average annual temperature ranging from 2 to 6 °C. Annual precipitation varies between 400 and 900 mm, revealing a distinct pattern of humid, semi-humid, and semi-arid climates from east to west. The overall terrain is higher in the southeast and lower in the northwest. The province can be divided into three ecological zones from east to west: mountainous regions, plateaus, and plains. The forests are predominantly natural, with a relatively small proportion of artificial forests in terms of both area and volume. These forests, including coniferous, broadleaf, and mixed types, are primarily concentrated in Changbai Mountains and Zhangguangcai Range.
The study utilized 298 sample plots from the NFI collected in 2014, with each square plot measuring 24.5 m × 24.5 m. Using data from two consecutive measurement periods, the annual growth rate of diameter at breast height (DBH) was estimated. The DBH data from 2014 were extrapolated to 2020 based on the annual growth rate, aligning with the year of the AGB products [43]. Additionally, tree height–DBH models were applied to estimate the heights of sample trees in 2020 [44,45]. Subsequently, individual tree biomass estimation models were utilized to estimate the AGB of each sample tree, which was then aggregated to obtain the total AGB of each sample plot in 2020 [46].
Figure 1. The study area of Jilin Province in China and the distribution of sample plots across (A) different altitudes from ref. [47] and (B) various forest types from ref. [48].
Remotesensing 17 02898 g001

2.2. AGB Products

AGB products were selected based on the following criteria: (1) global scope, (2) open access, (3) availability of an uncertainty map, and (4) origin from an influential organization. We focused on two AGB products from around the year 2020: (1) NASA’s GEDI L4B Gridded Aboveground Biomass Density (AGBD), Version 2.1 (abbreviated as GEDI biomass data), and (2) ESA’s CCI Global AGB in the Forests dataset (abbreviated as CCI biomass data).
GEDI biomass data encompasses observations collected between 18 April 2019 and 16 March 2023, covering latitudes from 51.6° N to 51.6° S. It is derived from NASA’s GEDI mission, developed in collaboration with the University of Maryland (https://doi.org/10.3334/ORNLDAAC/2299) (accessed on 22 July 2025) [7]. This mission employs LiDAR technology on the GEDI instrument aboard the International Space Station (ISS) to measure and monitor the structure and biomass of global forests. This 1 km resolution dataset utilizes a hybrid inference approach, where mean biomass is derived from an incomplete sample of modeled biomass values available through the GEDI L4A product.
CCI biomass data produced by the ESA CCI project, utilizes satellite remote sensing technology to measure and monitor AGB of global forests, supporting climate change research and carbon cycle analysis (https://climate.esa.int/en/data (accessed on 1 July 2024)) [49]. This 100 m resolution dataset covers the years 2010, 2017, 2018, 2019, and 2020, integrating various earth observation data sources, including Copernicus Sentinel-1, Envisat’s ASAR, and Japan’s ALOS-1 and ALOS-2 satellites, as well as optical satellite data. An integrated algorithm is utilized to ensure data consistency from different years, reduce data bias and improve data accuracy in reflecting interannual biomass changes.

2.3. Auxiliary Datasets

The 30 m resolution Normalized Vegetation Index (NDVI) data is sourced from the Resources and Environmental Science Data Platform (https://cstr.cn/15732.11.nesdc.ecodb.rs.2021.012 (accessed on 22 July 2025)) [50]. This dataset is derived from the annual maximum NDVI values calculated and processed using Google Earth Engine (GEE) cloud computing platform [51]. The NDVI data from 2020 was utilized to evaluate spatial heterogeneity within product pixels in the study.
The 30 m resolution China Land Cover Dataset (CLCD) was generated by processing 335,709 Landsat images on the GEE platform, integrating time-series spectral features with an optimized random forest classifier (https://zenodo.org/records/12779975 (accessed on 18 August 2025)) [52]. The dataset categorizes land cover into nine classes. The 2020 CLCD product was employed to quantify spatial heterogeneity resulting from land cover types in the study.
Global 30 m land-cover dynamic monitoring product (GLC_FCS30D, https://zenodo.org/records/8239305 (accessed on 18 August 2025)) [48] utilizes a refined classification system, containing 35 land-cover classes and covers the time span from 1985 to 2022. This detailed land cover data from 2020 was utilized for illustrating the distribution of forest types in the study.
Global 30 m resolution DEM data is obtained from NASA’s digital elevation model (NASADEM, https://earthdata.nasa.gov/esds/competitive-programs/measures/nasadem (accessed on 18 July 2025)), published on 18 February 2020 [47]. This dataset was utilized to analyze the distribution of forest types with elevation in the study.

2.4. Methodological Framework

After data preprocessing, spatial representativeness of each sample plot was evaluated (Figure 2). Subsequently, the study examined the effectiveness of spatial representativeness analysis and evaluated the overall accuracy of the AGB products, as well as their variations across different biomass ranges and forest types.

2.5. Spatial Representativeness Analysis of Sample Plots

2.5.1. Extracting Spatial Representativeness Indicators

The sample plot size in this study measures 24.5 m × 24.5 m, while the spatial resolutions of the two AGB products are relatively low, at 1 km and 100 m, respectively. To address scale discrepancies, three indicators, namely relative mean absolute deviation (RMAD), relative spatial sampling error (RSSE), and plot vegetation type proportion (PVTP), were established to evaluate spatial representativeness of sample plots. High-resolution NDVI and CLCD data were applied to capture the spatial distribution characteristics of surface features within low-resolution AGB product pixels, thereby facilitating the acquisition of the corresponding spatial representativeness indicator values for the sample plots. Specifically, RMAD is applied to assess the variability of land surface within an AGB product pixel based on high-resolution NDVI pixels. RSSE quantifies the deviation between a sample plot and the product pixel at the same location [53]. PVTP represents the area proportion of the vegetation type of a sample plot relative to the corresponding AGB product pixel. The values of these three indicators for each sample plot were estimated using the following formula:
RMAD = 1 g i = 1 g x i x ¯ x ¯ × 100 %
where x i represents the value of the i -th NDVI image pixel within an AGB product pixel, x ¯   represents the average value of all NDVI image pixels within the same AGB product pixel, and g represents the number of NDVI image pixels within that AGB product pixel.
RSSE = x j x ¯ x j × 100 %
where x j represents the value of the NDVI image pixel corresponding to the location of the j -th sample plot, and x ¯ represents the average value of all NDVI image pixels within an AGB product pixel that corresponds to the same location of the j -th sample plot.
PVTP = b v b
where b v represents the area of the CLCD pixels that correspond to the vegetation type of a sample plot within the respective AGB product pixel, and b represents the area of the AGB product pixel.

2.5.2. Comprehensive Evaluation of Spatial Representativeness

The criteria importance through intercriteria correlation (CRITIC) method was adopted to objectively assign weights to three indicators based on the contrast intensity and conflict of evaluation indicators [54]. Specifically, contrast intensity is quantified using standard deviation, while the conflict between indicators is represented by the correlation coefficient. By combining the standard deviation of each indicator with its correlation coefficient, the information quantity was determined. Weights were assigned to each indicator based on their information quantity, with those indicators possessing higher weights exerting a more significant influence on the comprehensive representativeness evaluation.
In this analysis, all three indicators were normalized to address issues related to dimensional differences. The spatial representativeness score for each sample plot was computed using the weighted sum method. The threshold for categorizing representativeness grades was established based on the scores and their data distribution. Consequently, the sample plots were classified into two categories: representative and non-representative.

2.6. AGB Product Evaluation

Seven accuracy metrics were utilized in this study: the coefficient of determination (R2), root mean square error (RMSE), relative root mean square error (rRMSE), mean absolute error (MAE), mean absolute percentage error (MAPE), bias, and standard deviation (SD). The product evaluation was performed using representative sample plots, and a comparison was made with the evaluation based on all sample plots. The accuracy of the AGB products was analyzed across various biomass ranges and vegetation types. Furthermore, the evaluation results of the two AGB products were compared.

3. Results

3.1. Sample Plot Selection

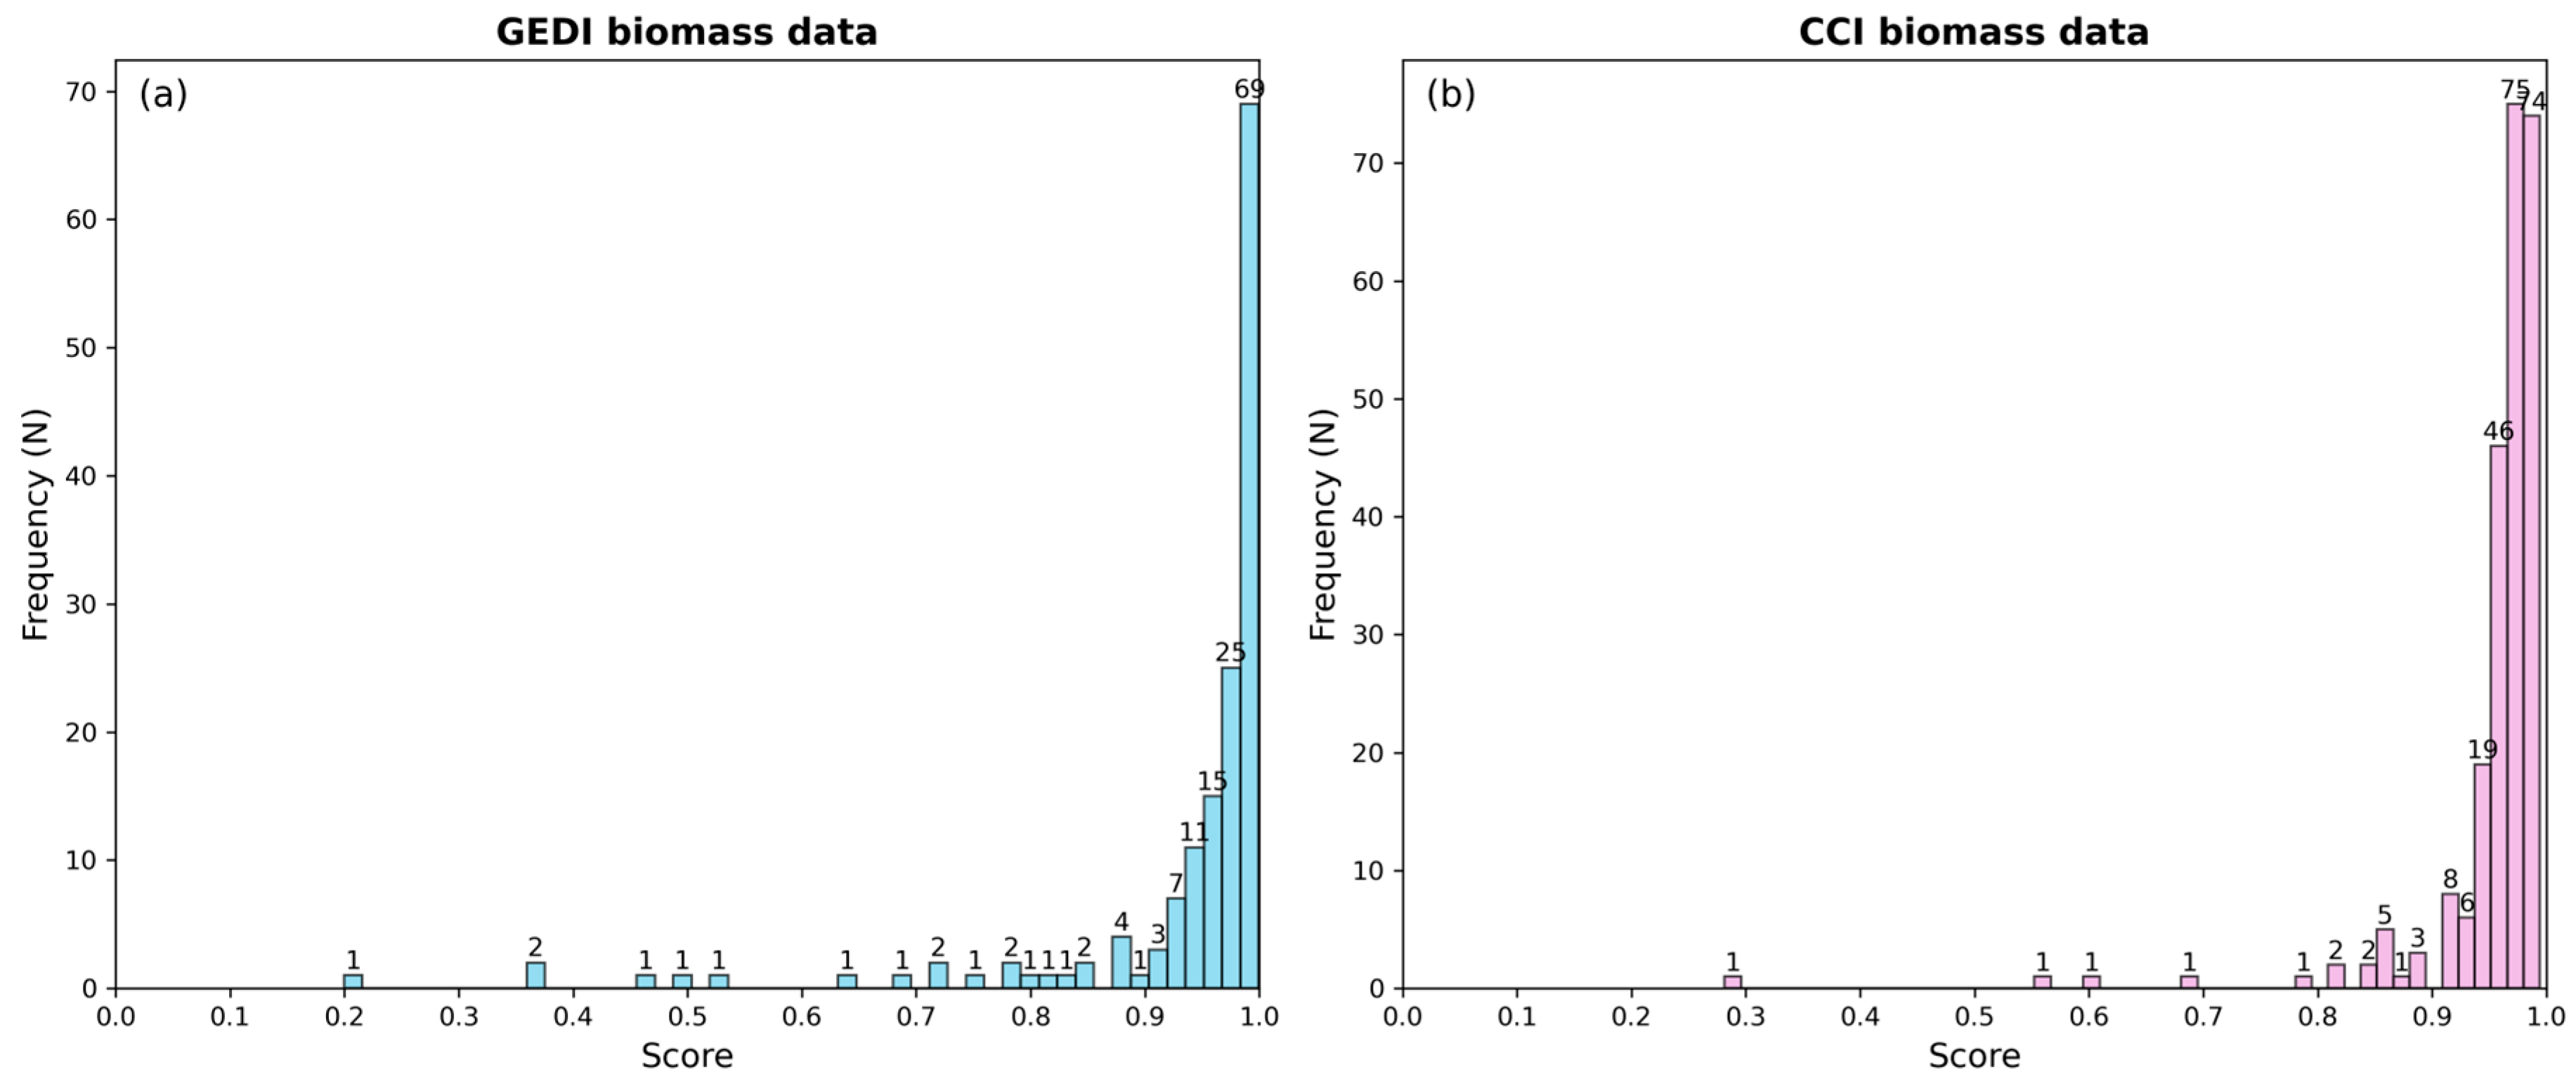
The weights of each spatial representativeness indicator for the two AGB products were derived (Table 1). The comprehensive scores for each sample plot were estimated on a scale from 0 to 1. The frequency distribution of the sample representativeness scores exhibits a pronounced left-skewed distribution (Figure 3). Based on the natural breakpoints observed in the concentrated and discrete distributions, the threshold for representative classification of the sample plots was determined (Table 2). This threshold aligns substantially with a medium grade above 70% in the percentage system. A representative sample plot indicates that it can adequately or optimally represent the characteristics of the AGB product pixel. Conversely, a sample plot classified as non-representative indicates that land-cover types, vegetation types, or vegetation density vary significantly within the AGB product pixel, rendering it unable to accurately represent the pixel of the AGB product. After excluding null and zero points from the corresponding products, as well as non-representative sample plots, the total number of sample plots for GEDI and CCI biomass data is 142 and 242, respectively. These selected representative sample plots were utilized for subsequent product evaluation.

3.2. Overall Accuracy of AGB Product Evaluation

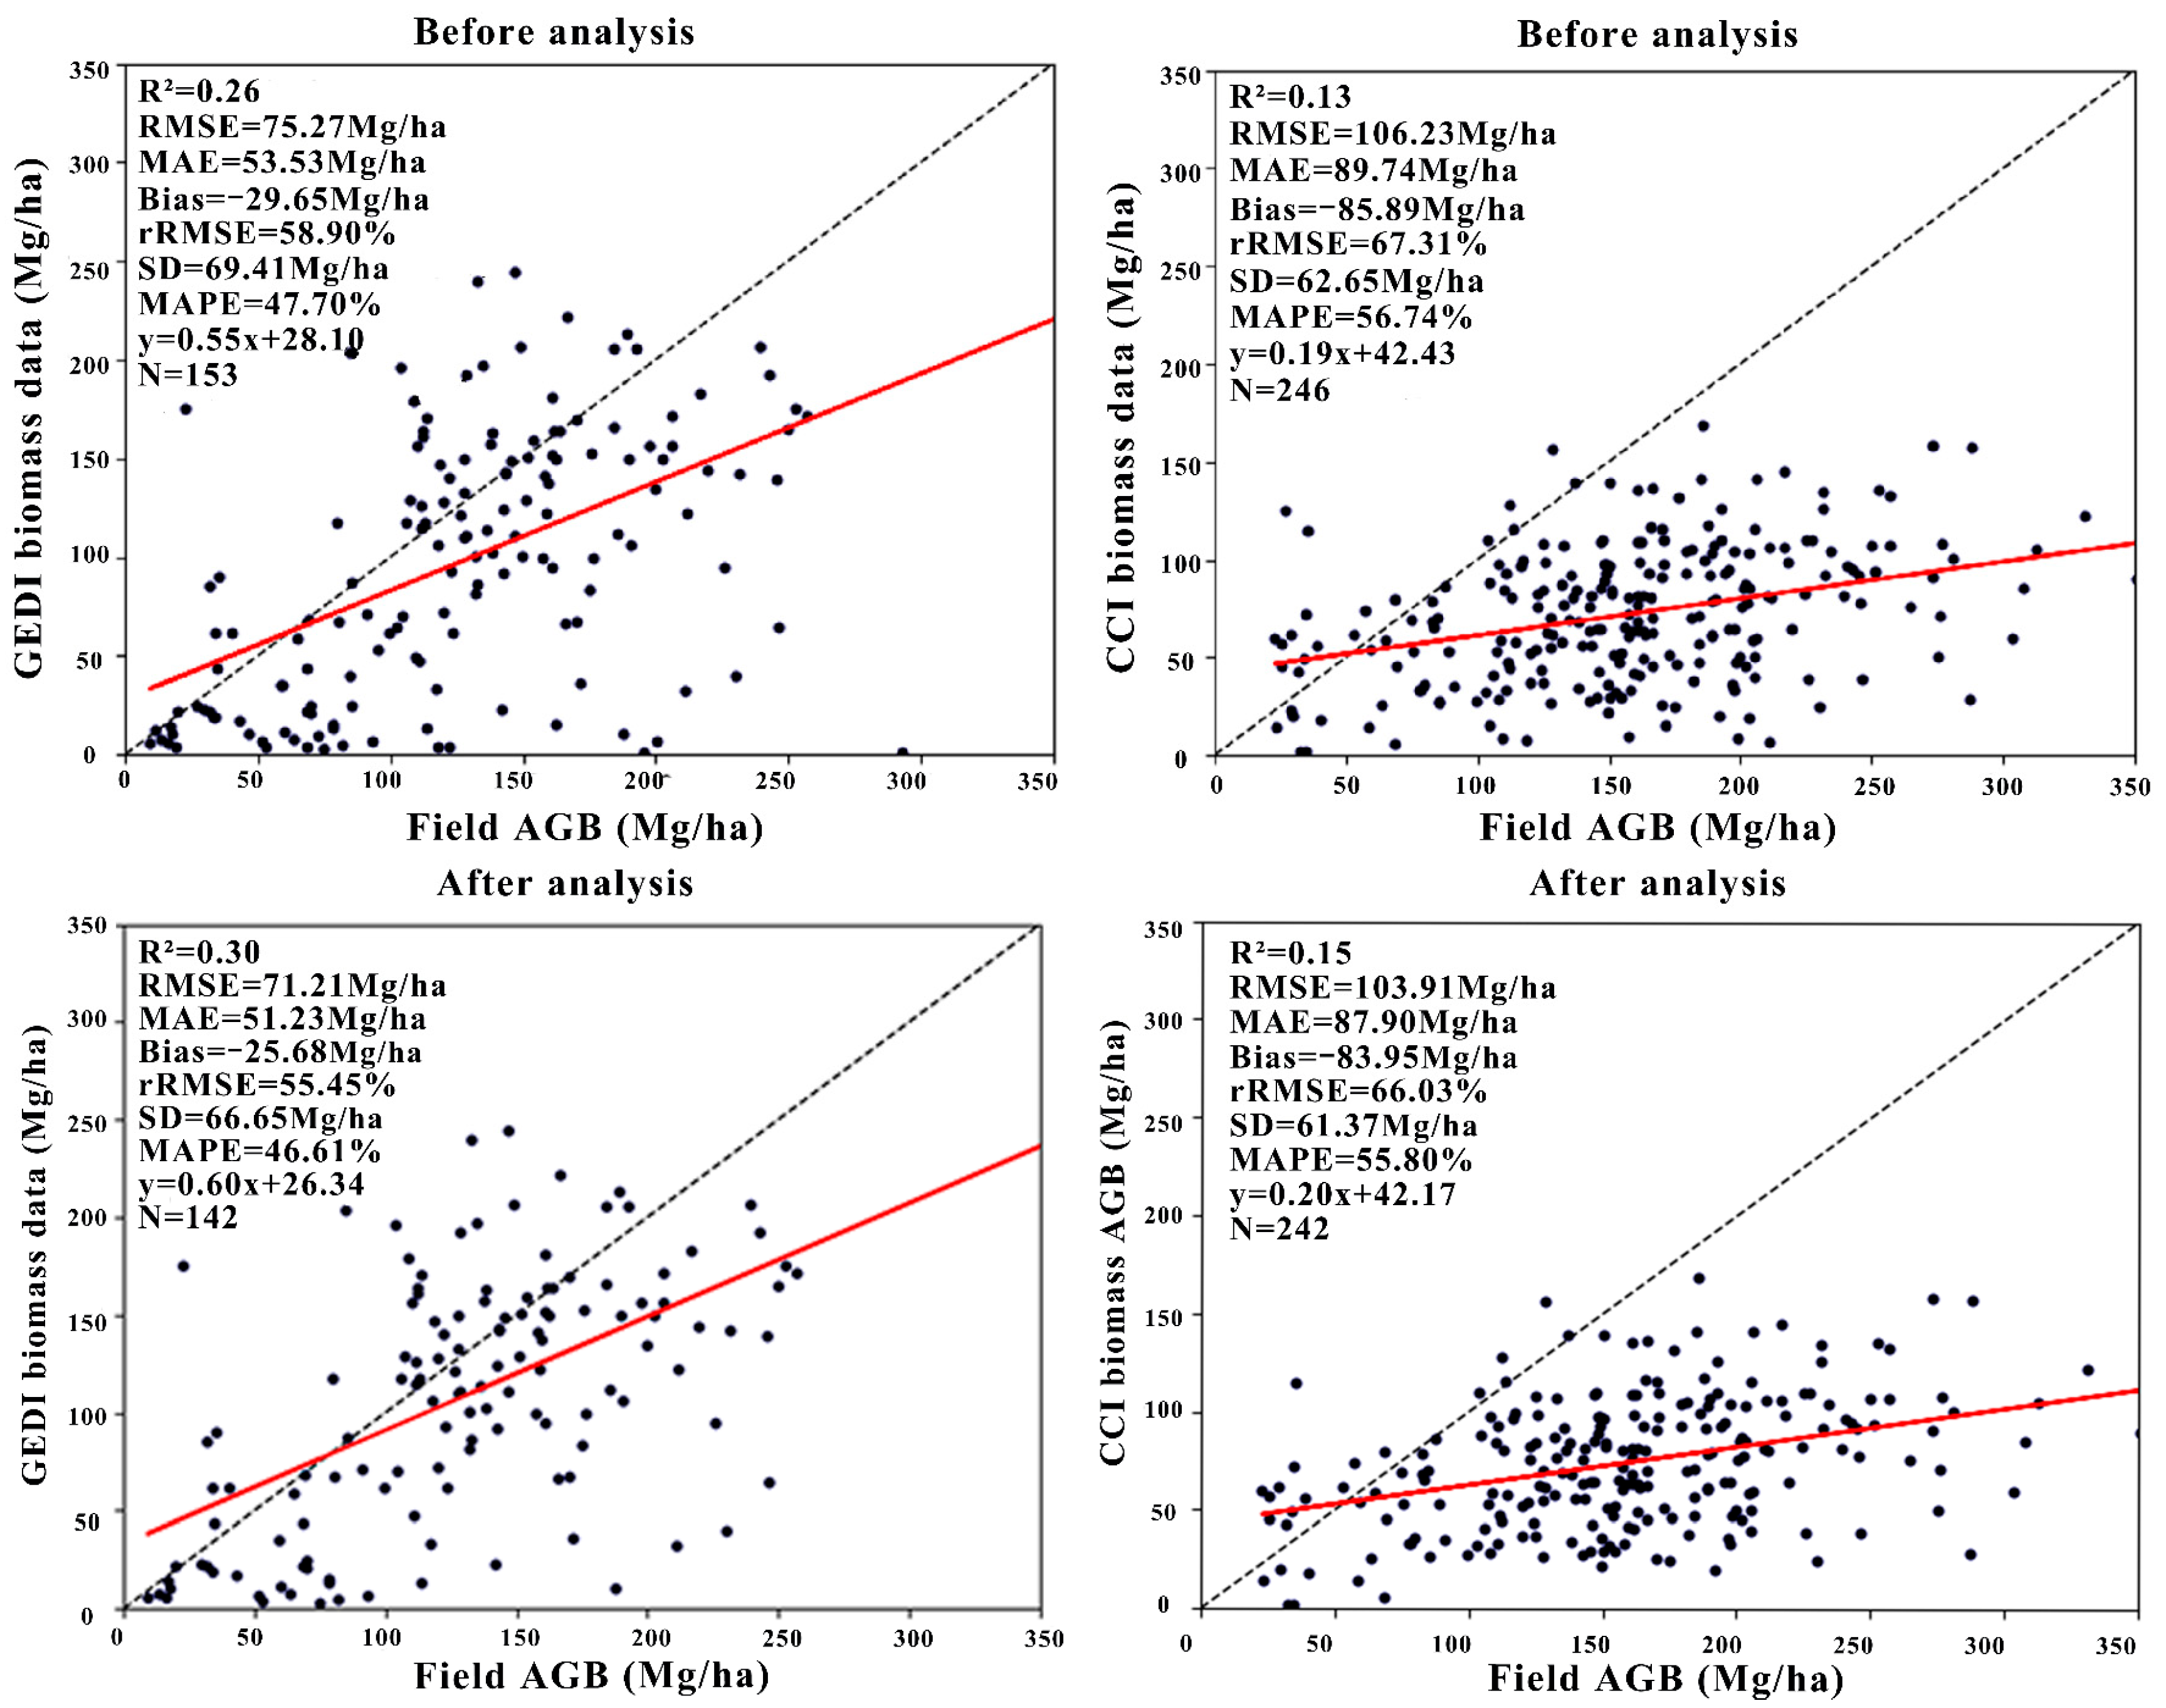
The accuracy metric values of the AGB products, following spatial representativeness analysis, differ from those obtained prior to this analysis (Figure 4). Among these metrics, R2 represents the correlation between product values and field measurements, with a value closer to 1 indicating a better fit. RMSE and MAE quantify the absolute errors between product values and field measurements; smaller values of these metrics signify higher accuracy and model robustness, resulting in reduced errors. RRMSE measures the relative error between product values and field measurements, with smaller values signifying higher accuracy. Bias reflects the deviation between product values and actual measurements: a positive bias indicates overestimation, while a negative bias indicates underestimation. As bias approaches zero, product values align more closely with field measurements. Additionally, SD reflects the dispersion of the data; thus, a larger SD suggests greater variability among product values, indicating increased instability.
The R2 of GEDI biomass data following spatial representativeness analysis is higher by 15.38%, indicating a closer alignment with the sample plot data. Additionally, the RMSE, MAE, and rRMSE of GEDI biomass data demonstrate reductions of 5.39%, 4.30%, and 6.78%, respectively. Meanwhile, the bias of GEDI biomass data decreased by 13.34%, reflecting a significant reduction in the average discrepancy from the sample plot data. Furthermore, the SD of GEDI biomass data is lower by 3.98%, demonstrating a reduction in data dispersion and contributing to more stable evaluation results. Moreover, the slope of the regression equation for GEDI biomass data increased by 9.09%, indicating that the dataset responds more accurately to the measured AGB values, with the regression relationship approaching the ideal slope of 1.
On the other hand, the R2 of CCI biomass data following spatial representativeness analysis increased by 15.38%, while the RMSE, MAE, and rRMSE decreased by 2.18%, 2.05%, and 1.49%, respectively. Additionally, the bias and SD decreased by 2.26% and 2.09%, respectively, while the slope of the regression equation improved by 5.26%. The results of spatial representativeness analysis reveal that the changes in these metrics for CCI biomass data, similar to those observed in GEDI biomass data, indicate an improvement in evaluation reliability, although the performance is inferior to that of GEDI biomass data.
The various accuracy metrics demonstrate better performance following the implementation of spatial representativeness analysis. Overall, this analysis reduces the evaluation errors that arise from scale mismatches.

3.3. AGB Product Evaluation Grouped by Biomass Ranges

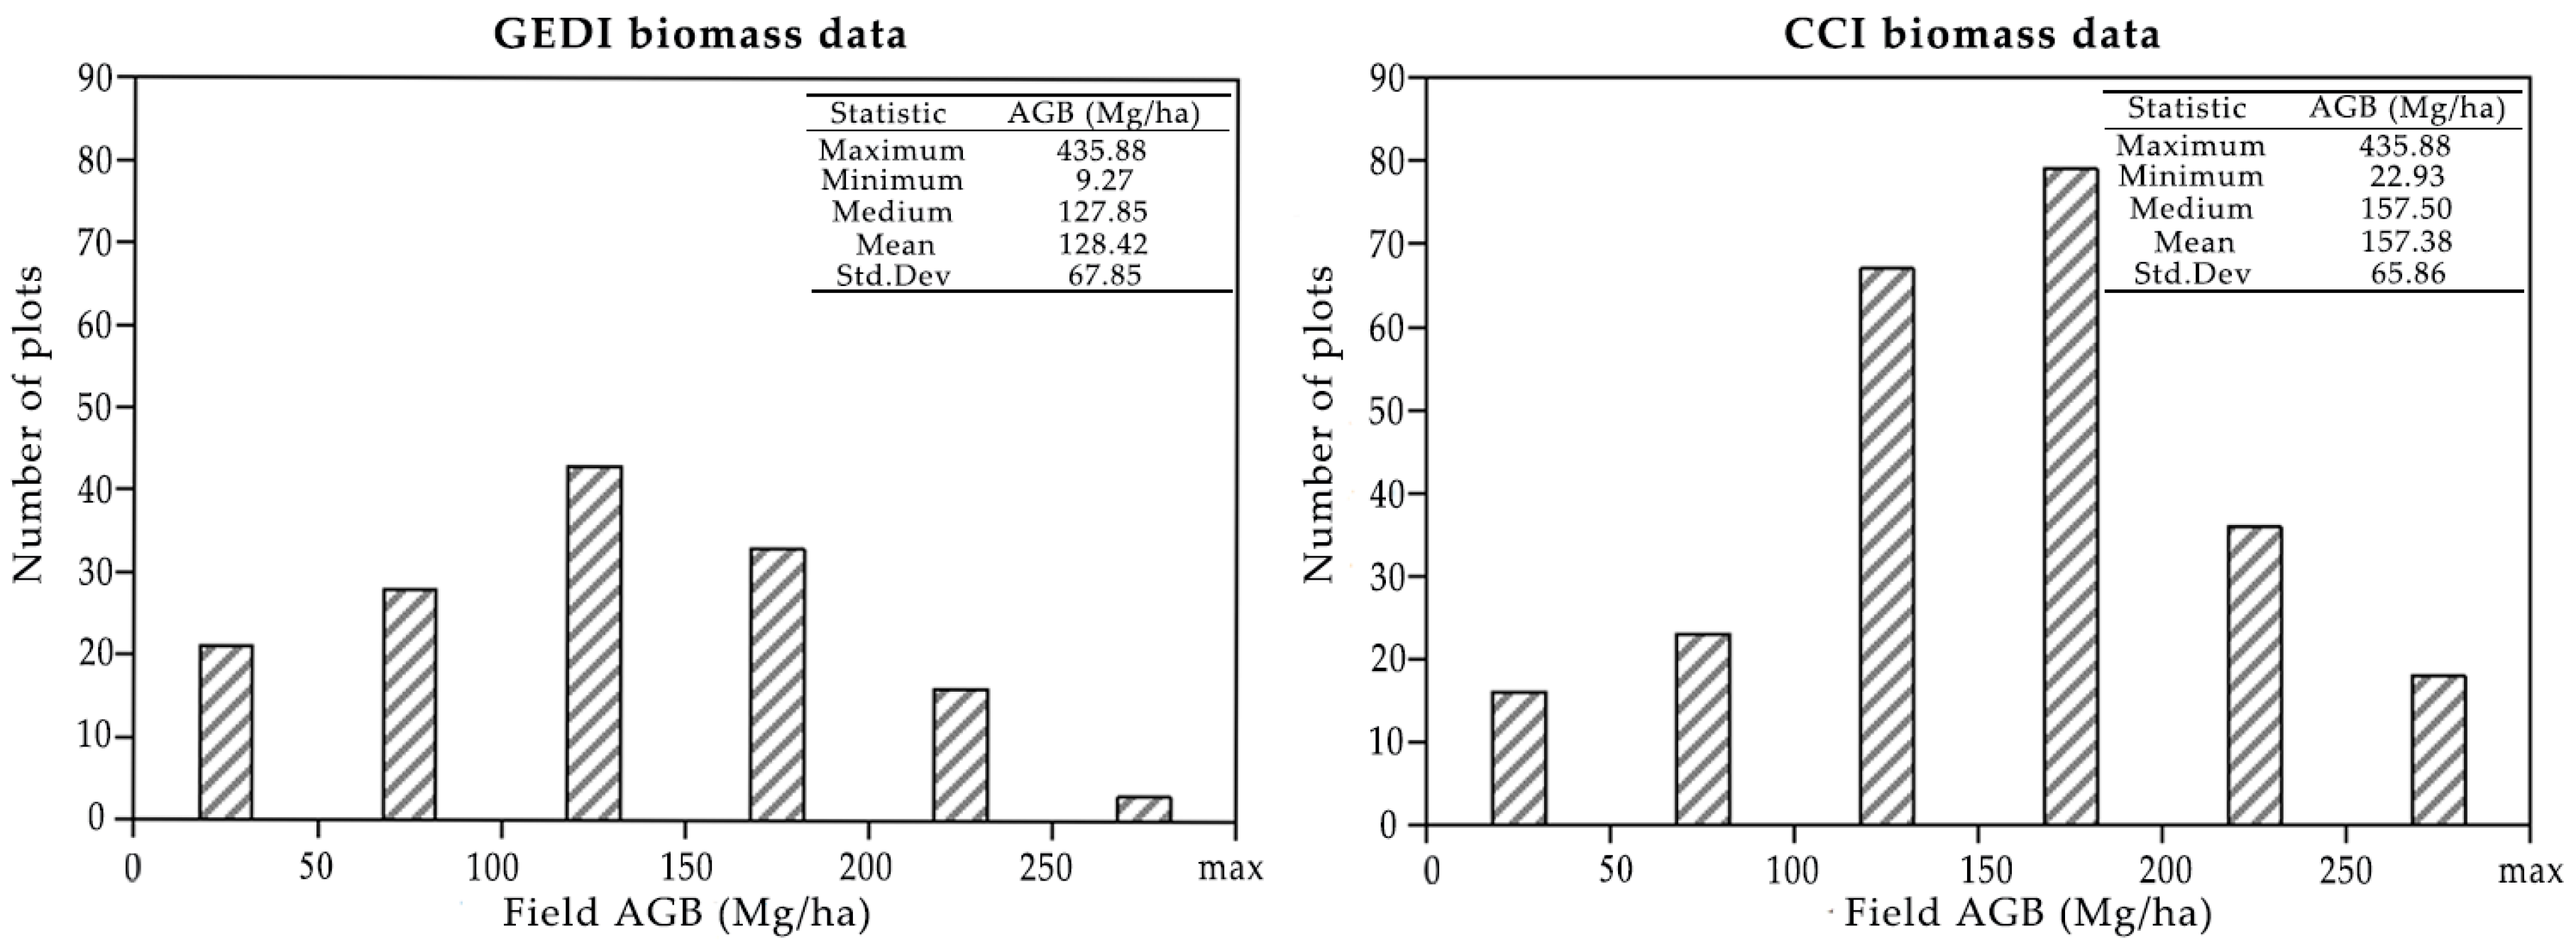
The AGB values of the representative sample plots were statistically categorized into 50 Mg/ha partitions (Figure 5). The dataset was divided into three biomass levels: a low-biomass range of <100 Mg/ha, a medium-biomass range of 100–200 Mg/ha, and a high-biomass range of ≥200 Mg/ha. The data predominantly concentrate in the medium-biomass range, with fewer observations in the low- and high-biomass ranges. This distribution indicates a favorable arrangement of the sample plots.
The accuracy metrics for various biomass ranges demonstrate a discernible trend of variation (Figure 6). After partitioning, the sample size within each range is limited. The R2 value in most ranges is low, indicating the poor stability, generalization ability, and interpretability of the model. Additionally, the MAPE’s sensitivity to outliers increases, leading to an amplified error difference between sample plot values and product values. As a result, the MAPE value fluctuates significantly without clear patterns. These two metrics are not analyzed within each range, as R2 and MAPE are significantly influenced by sample sizes.
The RMSE of both products generally exhibits an increasing trend from low- to high-biomass range. GEDI biomass data demonstrates the lowest RMSE of 39.91 Mg/ha in the range of <50 Mg/ha, followed by a second lowest RMSE of 53.57 Mg/ha in the 50–100 Mg/ha range. In contrast, CCI biomass data has its lowest RMSE of 35.23 Mg/ha in the 50–100 Mg/ha range. The average RMSE of GEDI biomass data is 71.21 Mg/ha, which is significantly lower than that of CCI biomass data, recorded at 103.91 Mg/ha.
The trend of the MAE is similar to that of the RMSE, with the MAE generally increasing as biomass increases. GEDI biomass data has the lowest MAE of 22.72 Mg/ha in the range of <50 Mg/ha, whereas CCI biomass data has the lowest MAE of 28.30 Mg/ha in the 50–100 Mg/ha range. The average MAE of GEDI biomass data is 51.23 Mg/ha, which remains superior to the CCI biomass data’s MAE of 87.90 Mg/ha.
Both GEDI and CCI biomass data exhibit the highest rRMSE in the range of <50 Mg/ha, with values of 147.76% and 127.11%, respectively. This indicates that although the absolute error is minimal in this range, the relative error is substantial, suggesting that the accuracy is not optimal. In the 50–100 Mg/ha range, both GEDI and CCI biomass data demonstrate the lowest rRMSE, with values of 33.11% and 46.74%, respectively. This is accompanied by the second lowest and lowest RMSE for GEDI and CCI biomass data, respectively, indicating a relatively high level of estimation accuracy. The rRMSE shows a gradually increasing trend starting from 50 Mg/ha. The average rRMSE of GEDI biomass data is 55.45%, which is significantly lower than the CCI biomass data’s 66.03%.
Both products exhibit a slightly positive bias in the range of <50 Mg/ha, suggesting a minor overestimation. However, in the range of ≥50 Mg/ha, the negative bias gradually increases, indicating an underestimation, with a significant underestimation observed in the ≥200 Mg/ha range. The minimum bias for both GEDI and CCI biomass data occurs in the range of <50 Mg/ha, at 8.03 Mg/ha and 16.86 Mg/ha, respectively. The bias for GEDI biomass data ranges from −130.06 Mg/ha to 8.03 Mg/ha, while for CCI biomass data, it ranges from −191.47 Mg/ha to 16.86 Mg/ha. The average bias for CCI biomass data is −83.95 Mg/ha, which reflects a more significant underestimation compared to GEDI biomass data’s −25.68 Mg/ha (Figure 4). Overall, both products exhibit negative bias, indicating an underestimation.
The SD exhibits a slight overall fluctuation trend. The total SD for CCI biomass data is 61.37 Mg/ha, which is lower than GEDI biomass data’s 66.65 Mg/ha. This finding indicates that CCI biomass data reflect a smaller degree of dispersion.
Overall, both products exhibited optimal accuracy and stability in the 50–100 Mg/ha range and an overall underestimation. The accuracy characteristics of AGB products across different biomass ranges provides a foundation for enhancing the quality of AGB products.

3.4. AGB Product Evaluation Grouped by Forest Types

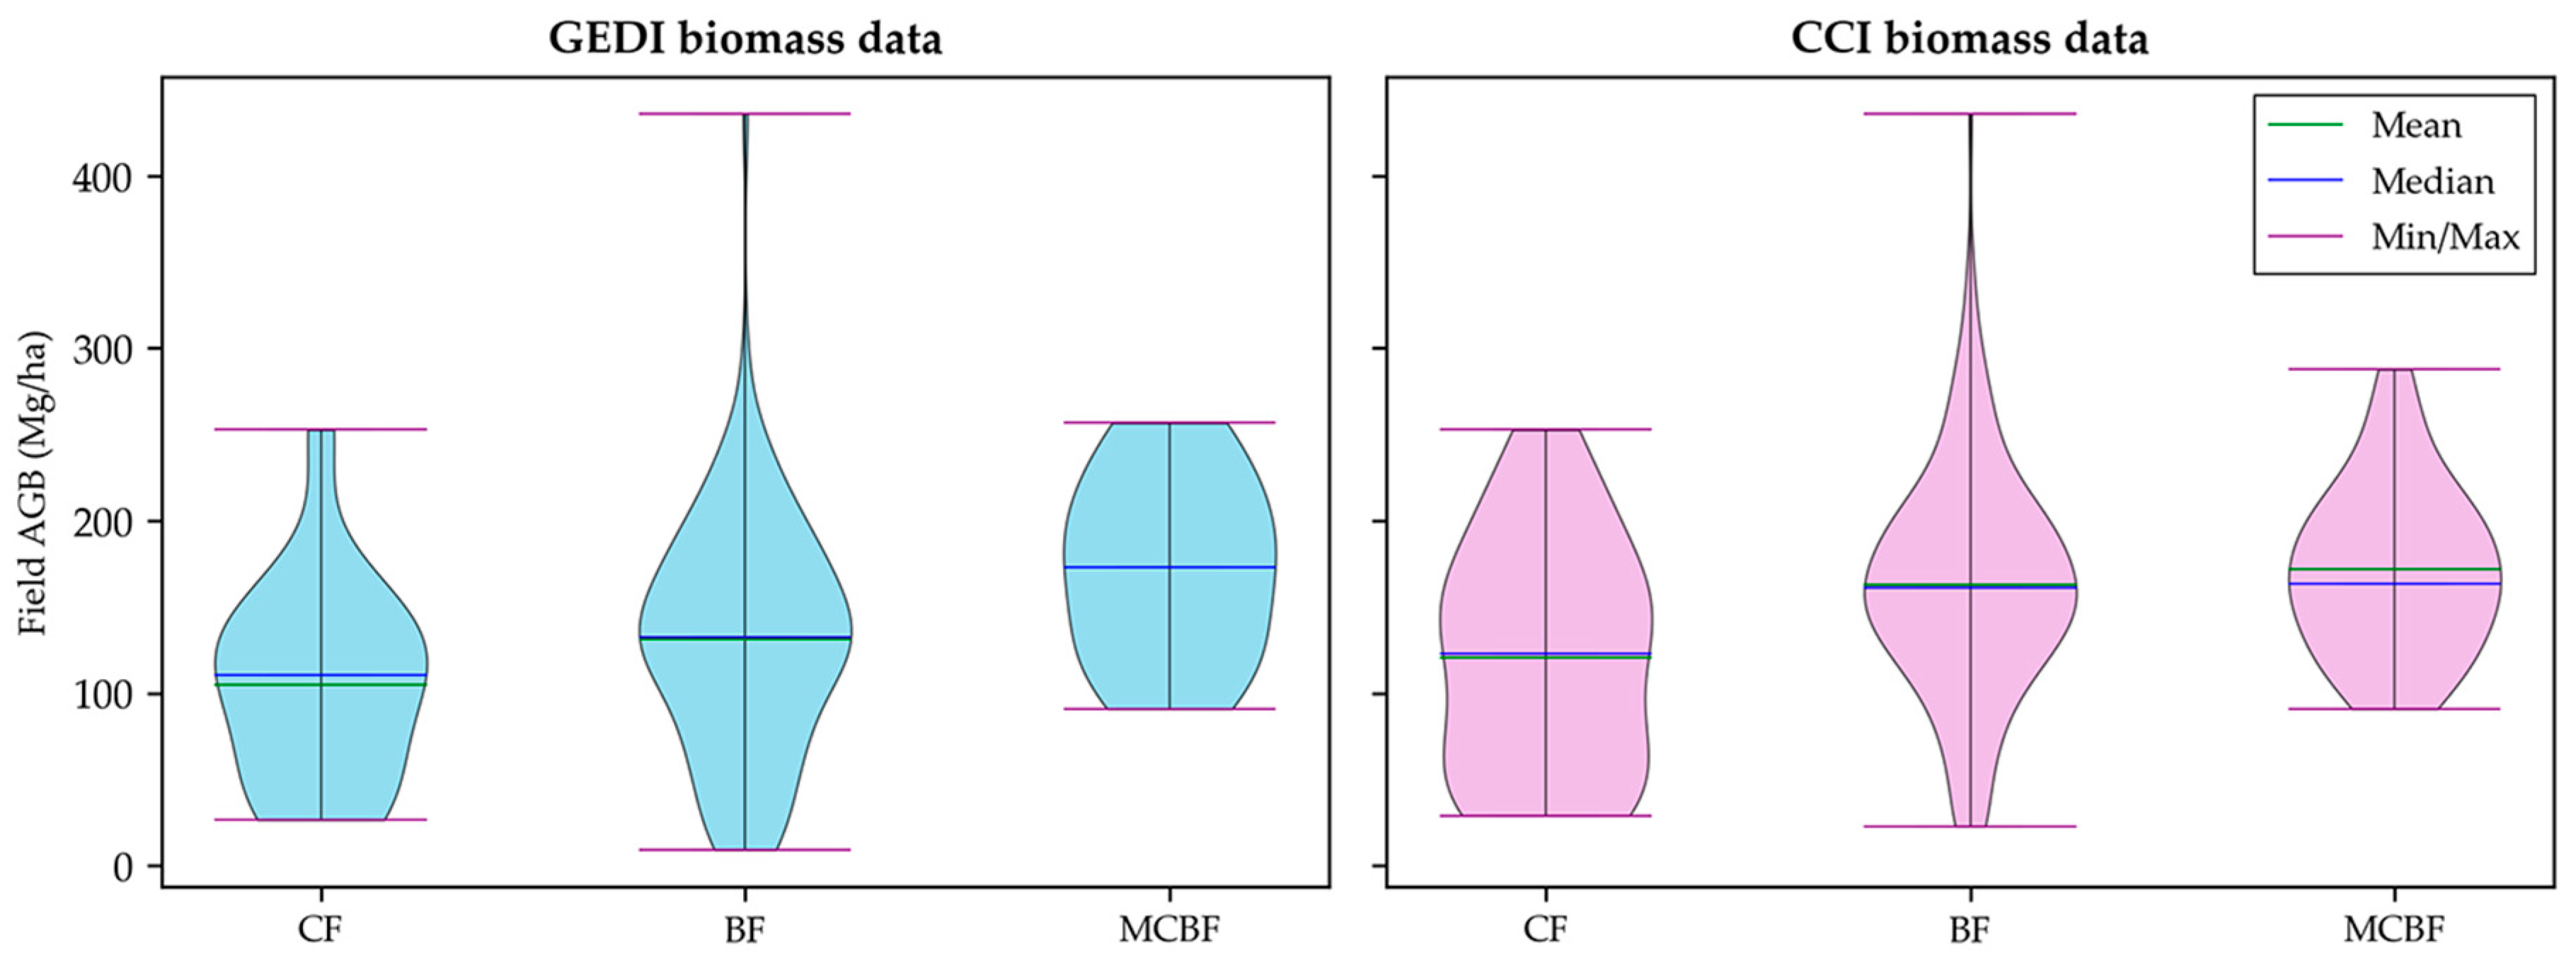
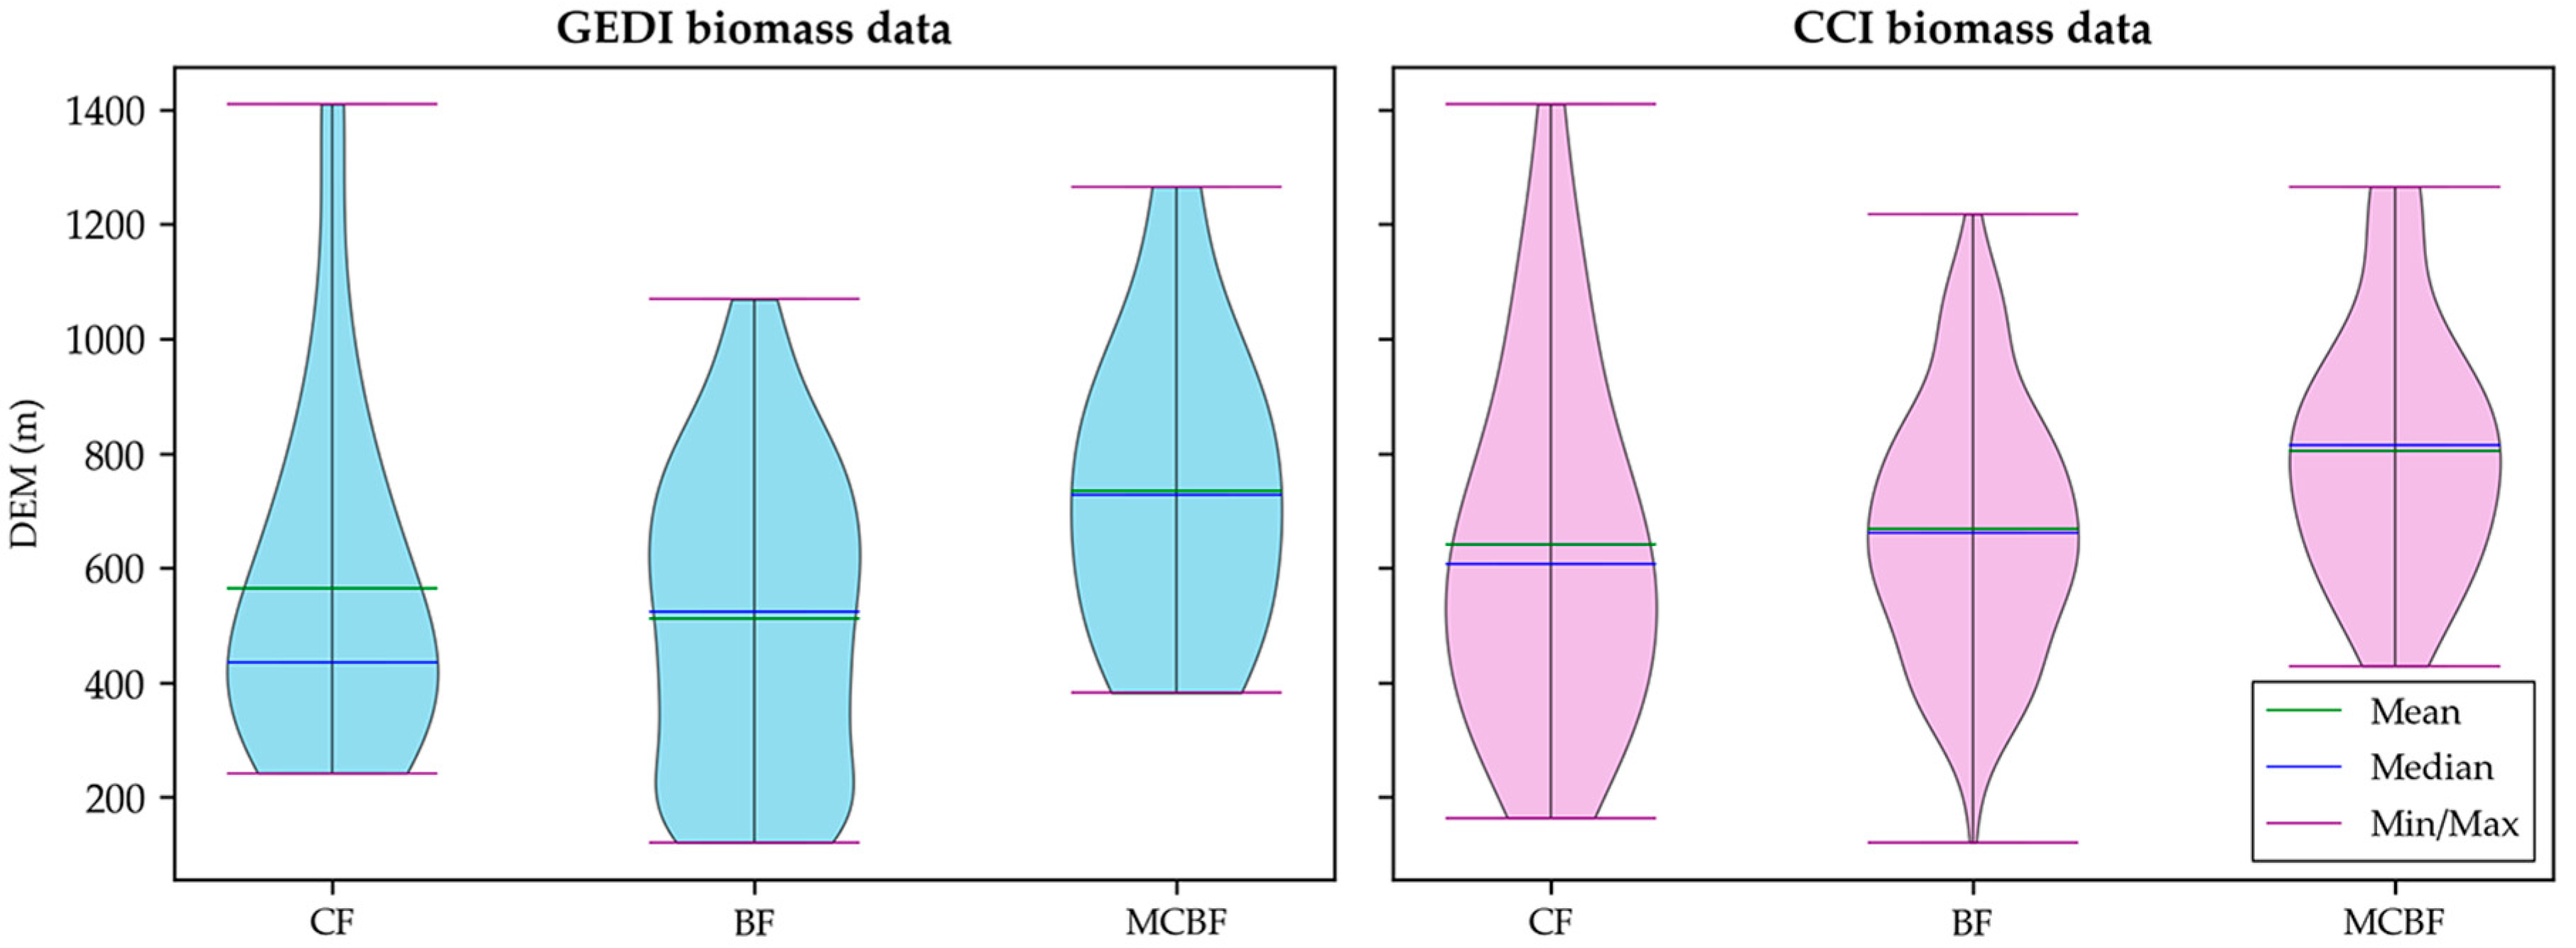
The forests comprise three types: coniferous forest (CF), broadleaf forest (BF), and mixed conifer–broadleaf forest (MCBF). CF and MCBF are predominantly distributed in the eastern mountainous regions, while BF is widely distributed throughout the entire area (Figure 1). The average biomass of CF, BF, and MCBF increases sequentially, with MCBF’s average biomass reaching approximately 172 Mg/ha (Figure 7). The biomass ranges of these three vegetation types exhibit some degree of overlap. In CF and BF, biomass predominantly falls within the low to medium range, with BF exhibiting a slightly higher biomass range compared to CF. The biomass distribution of MCBF is notably more concentrated, with the majority of biomass situated within the medium to high range. This distribution of MCBF represents the highest overall biomass levels among the three types. Additionally, the biomass values for CF and BF in CCI biomass data slightly exceed those in GEDI biomass data.
The three vegetation types are mainly distributed below an altitude of 1000 m, and also exhibit a certain degree of overlap (Figure 8). Among these types, MCBF occupies the highest altitude range. The altitude values corresponding to CF are the most dispersed, indicating the widest range of altitude distribution.
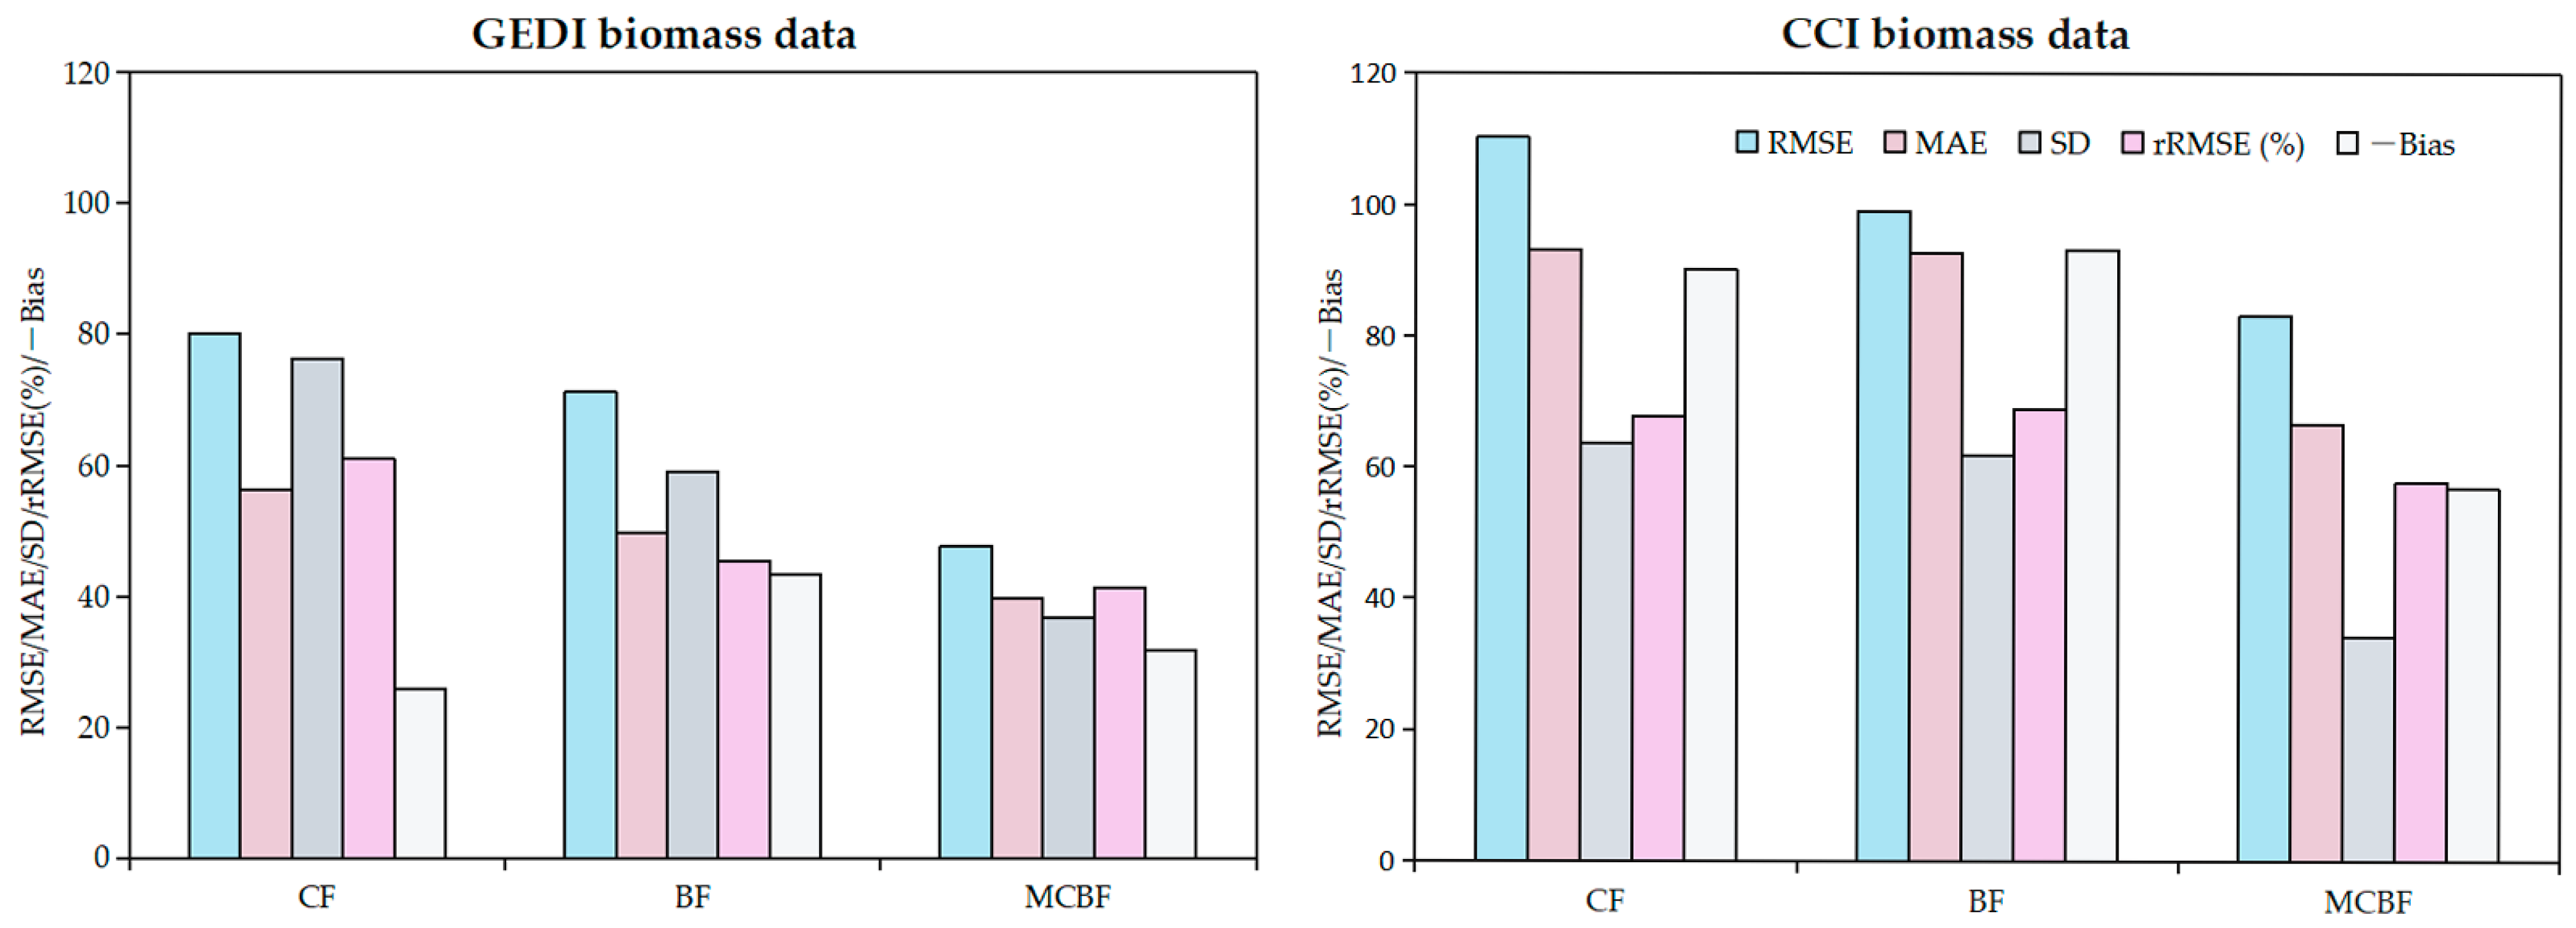
The accuracy metrics demonstrate a consistent pattern across various forest types (Figure 9). According to the RMSE, MAE, SD, and rRMSE, both products exhibit superior performance in MCBF, followed by BF, with CF showing the lowest accuracy. Notably, the rRMSE for BF in CCI biomass data is marginally higher than that for CF. In terms of the bias, both products reveal a negative bias across all three vegetation types, indicating a tendency for underestimation. The trend of underestimation for CF and BF in CCI biomass data is particularly pronounced. Generally, GEDI biomass data outperforms CCI biomass data in evaluating the three vegetation types. The range and accuracy of the products vary with forest types and altitudes, providing a basis for product improvement.

4. Discussion

4.1. Effects of Field Data on Evaluation and Production of AGB Products

Whether for product evaluation or production, the process relies on high-quality field data, including characteristics such as area size, number, investigation date, and accessibility. This study indicates that the evaluation errors introduced by the scale mismatch of sample plots and product pixels are reduced following the removal of sample plots with non-representative. Comparing the accuracy and uncertainty of global AGB product with different sizes of sample plots, Araza et al. [26] found that as the area of sample plots increased, measurement errors decreased significantly. Spatial representativeness analysis of leaf area index (LAI) site observations demonstrated that utilizing all ground station data for evaluation results in lower accuracy compared to ground station data with high spatial representativeness [55]. These findings underscore the necessity of conducting spatial representativeness analysis and selecting appropriate sample plots prior to product evaluation. In comparison to earlier studies, the study proposed composite and quantitative evaluation methods to select representative sample plots, thereby enhancing the reliability of product evaluation.
Regarding the sufficiency of the sample plots in the study, the margin of error (MOE) with Cochran’s [56] standard formula for proportion estimation under simple random sampling was estimated, assuming p = 0.5 (worst-case variance) and a 95% confidence level. The MOE is well below the ±10% threshold recommended by Global Forest Resources Assessment (FRA) 2020 [57] and China’s Technical Guidelines for the Ninth NFI [58], confirming that our sampling design is statistically sound and representative.
This study conducted extrapolation to address temporal inconsistency between sample plots and products. Uncertainties can be introduced, arising from model estimations and forest disturbances. Sample plots that have experienced significant changes due to natural and anthropogenic disturbances, as identified through the application of time series methods such as Landsat-based Detection of Trends in Disturbance and Recovery (LandTrendr) and Vegetation Change Tracker (VCT) [59,60], should not be utilized for product evaluation. The study area is predominantly covered by natural forests, where forest-related natural disasters are minimal. Since the implementation of the Natural Forest Protection Project in 1998, human interference with forests has been limited. Consequently, this study did not identify any disturbances in the sample plots, and adopted a standardized extrapolation method based on natural forest growth [43,61]. Nevertheless, temporal extrapolation may introduce uncertainty resulting from model simplification, inter-individual tree variability, or unreported disturbances. More temporally consistent field data, as well as the consideration of environmental factors and forest disturbance, would help minimize the uncertainty arising from temporal extrapolation of sample plots.
The estimation model of CCI biomass data utilizes NFI reports as ground reference data, without directly incorporating sample plot data [62]. This aggregated statistical data provides a certain degree of sampling accuracy at the national or regional level. However, at a smaller pixel scale, regional statistical data fails to adequately represent the characteristics of specific individuals, leading to limitations in pixel-scale accuracy. Additionally, the estimation of CCI biomass data relies on satellite LiDAR data, while GEDI biomass data utilizes ground sample plots and airborne LiDAR data [63]. Sample plot data provides higher accuracy at the pixel scale compared to statistical data, while airborne LiDAR offers higher accuracy than satellite LiDAR. Consequently, GEDI biomass data has an advantage over CCI biomass data regarding input data, which influences product accuracy at the pixel scale. Furthermore, the limited availability of field data for modeling GEDI and CCI biomass data in China adversely affects the accuracy of these products across the country.

4.2. Bias of AGB Products

AGB products deviate from actual conditions, which affects the data usage and the technical support they provide to users. The study indicates that both AGB products tend to be overestimated in the range of <50 Mg/ha, and underestimated in the range of ≥50 Mg/ha. Particularly in high-biomass areas where AGB values exceed 200 Mg/ha, these products exhibit the largest negative bias and a more pronounced underestimation. Avitabile et al. [24] revealed that product values were overestimated in the low-biomass range, while being underestimated in the mid- to high-biomass range. Additionally, Jia et al. [64] observed that the GEDI L4A product generally underestimated biomass at 12 of the 19 National Ecological Observatory Network sites. These discrepancies may arise from overestimation in sparse forest areas, where satellite images fail to accurately represent the discontinuities in actual forest cover [65]. Furthermore, trees in these areas typically have smaller diameters and heights, leading to a mismatch between the signal strength detected by satellite sensors and the actual biomass density. Conversely, the underestimation may be attributed to signal saturation in optical and shortwave radar sensors within high-biomass dense forests, as well as the conservative estimation principles employed by the algorithms, which are unable to accurately reflect the true conditions in these high-biomass regions [62].
Data fusion techniques that integrate multiple remote sensing sources, including SAR, LiDAR, hyperspectral, and optical imagery can exploit complementary information to address sensor-specific limitations in AGB inversion [66,67,68]. The implementation of new observation techniques will further enhance the estimation accuracy of key biomass factors. For example, the BIOMASS satellite launched by ESA in 2025 is the world’s first earth observation satellite equipped with P-band synthetic aperture radar (SAR). The penetration ability of P-band radar is significantly better than C-band and L-band, enabling it to observe trunks and branches deep within the tree canopy [69]. The advanced edge computing module, laser radar and high-definition video sensors carried by the undergrowth autonomous obstacle avoidance UAV can accurately capture information about vegetation in and beneath forest canopy [70,71,72,73]. To address the saturation issue commonly encountered in biomass estimation in high-biomass regions, several approaches beyond the aforementioned observation methods can be considered. Red-edge spectral bands, which are sensitive to canopy structure and chlorophyll variation [74], can significantly improve biomass estimation accuracy. In addition, texture features extracted from high-resolution optical imagery are effective in capturing canopy structural heterogeneity [75]. Specific vegetation indices, such as the Saturation Mitigated NDVI (NDVIsm), Modified Triangular Vegetation Index 1 (MTVI1), and Modified Non-Linear Vegetation Index (MNLI) have demonstrated strong performance in detecting subtle variations in dense and healthy vegetation [76,77]. Integrating these key factors can help mitigate saturation effects in high-biomass environments.

4.3. Adaption of Innovation and Applicability

This study draws on flux footprint and single-point observations to investigate spatial representativeness at the pixel scale [34,35,36,37,38,39]. When employing these observations to evaluate remote sensing products, a scale mismatch arises between site observations and remote sensing estimations, as demonstrated in this study. Following adaptive adjustments, the study applies these insights to evaluate the spatial representativeness of sample plots for AGB product pixels. To assess vegetation heterogeneity and diversity, this study established three indicators, utilizing high-resolution NDVI and CLCD as intermediaries, effectively reflecting the spatial heterogeneity of biomass within pixels. Additionally, the CRITIC method was utilized to grade plot representativeness, ultimately achieving objective and accurate assessment results. Notably, this study did not utilize texture and terrain indicators, nor did it employ the conventional entropy weight method. The reason lies in the fact that the three statistical indicators possess clear physical meanings, facilitating the understanding of spatial variations. In contrast, geostatistical and texture feature parameters exhibit ambiguous physical meanings and lack direct correspondence with geographical phenomena. Additionally, topography influences vegetation distribution characteristics; thus, changes in vegetation features are already reflected through variations in the three indicators. Compared to the entropy weighting method, the CRITIC method overcomes significant limitations, such as its exclusive reliance on data dispersion, neglect of inter-indicator correlations, and high sensitivity to outliers [54].
This study was conducted in Jilin Province. However, the proposed spatial representativeness analysis system and AGB product evaluation framework are methodologically universal. The indicators are derived from high-resolution NDVI and land cover data, which are widely available globally, thereby enhancing the universality of the method concerning fundamental data. Nonetheless, some adjustments are necessary when applying this framework to other ecological regions. For example, (1) in tropical rainforests, characterized by higher species diversity and more complex forest structures, it is necessary to increase sample density when applying this framework to better capture spatial heterogeneity. Due to the multilayered vertical structure of such ecosystems, spatial representativeness indicators should be derived not only from NDVI, but also from datasets that reflect three-dimensional vegetation structures, such as high-resolution canopy height maps or vertical plant area index (PAI) profile products, to enhance the applicability. (2) In arid forest ecosystems, especially plantations with sparse or patchy vegetation, these indicators should be adapted to include vegetation indices that are more suitable for dryland conditions, improving the sensitivity and discriminative power of the assessment. For instance, the Modified Soil Adjusted Vegetation Index (MSAVI) introduces a soil brightness correction factor to reduce bare soil interference, while the Red-Edge NDVI (RENDVI783) takes advantage of Sentinel-2 red-edge bands to improve monitoring of vegetation physiological conditions. It should still be noted that the specific conclusions regarding the evaluation of GEDI and CCI biomass data are influenced by regional characteristics such as specific forest structures, topography, and climatic conditions. Consequently, while the evaluation methods are transferable, it is essential to conduct corresponding evaluations for different ecological regions in order to derive appropriate conclusions.

5. Conclusions

This study evaluates the accuracy of AGB products, specifically GEDI and CCI biomass data in the context of discrepancies related to plot size and product scales. Additionally, it investigates the applicability of these products in Jilin Province, Northeast China. A spatial representativeness analysis and a comprehensive assessment of sample plots were developed. The selected representative sample plots were designed to accurately reflect the true values at the corresponding pixel scale to the greatest extent possible. The accuracy metrics demonstrated better performance when using representative plots compared to all plots, indicating that spatial representativeness analysis enhances the reliability of evaluation results by addressing the issue of insufficient reference data corresponding to product pixels. Furthermore, estimation errors, systematic biases, and uncertainties were identified to evaluate the applicability of AGB products under various conditions, providing a reference basis for understanding product characteristics and enhancing product quality. The sample optimization method employed in this study is applicable not only to product evaluation, but also to product production, offering technical support for the development of higher quality and more reliable AGB products. The recently launched satellites for detecting forest ecosystem structural parameters, such as ESA’s BIOMASS and China’s Terrestrial Ecosystem Carbon Inventory Satellite (TECIS), will facilitate more diversified biomass estimation and the development of upcoming AGB products. Therefore, conducting this research in this context holds significant reference value for the near-future production of AGB products, thereby providing a solid foundation for global climate change research.

Author Contributions

Conceptualization, X.W. and P.J.; methodology, X.W.; software, Y.W.; validation, Y.W. and X.W.; formal analysis, Y.W. and X.W.; investigation, S.W. and D.P.; data curation, H.L.; writing—original draft preparation, Y.W.; writing—review and editing, X.W., P.J. and H.L.; visualization, Y.W.; supervision, X.W.; project administration, X.W.; funding acquisition, X.W. All authors have read and agreed to the published version of the manuscript.

Funding

This research was funded by the National Key R&D Program of China, grant number 2022YFF0711602 and National Key R&D Program of China, grant number 2023YFF1303905.

Data Availability Statement

GEDI biomass data are available through https://doi.org/10.3334/ORNLDAAC/2299 (accessed on 22 July 2025). CCI biomass data are available through https://climate.esa.int/en/data (accessed on 1 July 2024). NDVI datasets are available through https://cstr.cn/15732.11.nesdc.ecodb.rs.2021.012 (accessed on 22 July 2025). CLCD dataset are available through https://zenodo.org/records/12779975 (accessed on 18 August 2025). GLC_FCS30D dataset are available through https://zenodo.org/records/8239305 (accessed on 18 August 2025). NASADEM dataset are available through https://earthdata.nasa.gov/esds/competitive-programs/measures/nasadem (accessed on 18 July 2025). Sample plot data presented in this study are available on request from the corresponding author upon reasonable request and with permission of China National Forestry and Grassland Administration; the data are not publicly available due to the confidentiality of the dataset. The datasets used and/or analyzed during the current study are available from the corresponding author on reasonable request.

Conflicts of Interest

The authors declare no conflicts of interest.

References

  1. Pan, Y.; Birdsey, R.A.; Fang, J.; Houghton, R.; Kauppi, P.E.; Kurz, W.A.; Phillips, O.L.; Shvidenko, A.; Lewis, S.L.; Canadell, J.G.; et al. A large and persistent carbon sink in the world’s forests. Science 2011, 333, 988–993. [Google Scholar] [CrossRef]
  2. Aili, A.; Zhang, Y.; Lin, T.; Xu, H.; Bakayisire, F.; Waheed, A.; Zhang, Q. Ecological benefits of artificial vegetation restoration on local climate condition in abandoned mining area. Ecol. Indic. 2024, 169, 112964. [Google Scholar] [CrossRef]
  3. Schwärzel, K.; Zhang, L.; Montanarella, L.; Wang, Y.; Sun, G. How afforestation affects the water cycle in drylands: A process-based comparative analysis. Global Change Biol. 2019, 26, 944–959. [Google Scholar] [CrossRef]
  4. Obata, A.; Yoshida, T.; Hiura, T. Estimation of stand biomass and species-specific biomass in Japanese northern mixed forests in 1920–1930s: Understanding environmental factors affecting carbon sequestration before recent climate change. Ecol. Indic. 2023, 154, 110495. [Google Scholar] [CrossRef]
  5. Zheng, D.; Rademacher, J.; Chen, J.; Crow, T.; Bresee, M.; Le Moine, J.; Ryu, S.-R. Estimating aboveground biomass using Landsat 7 ETM+ data across a managed landscape in northern Wisconsin, USA. Remote Sens. Environ. 2004, 93, 402–411. [Google Scholar] [CrossRef]
  6. Avitabile, V.; Herold, M.; Heuvelink, G.B.M.; Lewis, S.L.; Phillips, O.L.; Asner, G.P.; Armston, J.; Ashton, P.S.; Banin, L.; Bayol, N.; et al. An integrated pan-tropical biomass map using multiple reference datasets. Global Change Biol. 2016, 22, 1406–1420. [Google Scholar] [CrossRef] [PubMed]
  7. Dubayah, R.O.; Armston, J.; Healey, S.P.; Yang, Z.; Patterson, P.L.; Saarela, S.; Stahl, G.; Duncanson, L.; Kellner, J.R. GEDI L4B Gridded Aboveground Biomass Density; Version 2.1; ORNL DAAC: Oak Ridge, TN, USA, 2023. Available online: https://www.earthdata.nasa.gov/data/catalog/ornl-cloud-gedi-l4b-gridded-biomass-v2-1-2299-2.1 (accessed on 22 July 2025).
  8. Kellndorfer, J.; Kirsch, K.; Fiske, G.; Bishop, J.; LaPoint, L.; Hoppus, M.; Westfall, J. NACP Aboveground Biomass and Carbon Baseline Data; V.2 (NBCD 2000); ORNL DAAC: Oak Ridge, TN, USA, 2000. Available online: https://www.earthdata.nasa.gov/data/catalog/ornl-cloud-nbcd2000-v2-1161-2 (accessed on 22 July 2025).
  9. Su, Y.; Guo, Q.; Xue, B.; Hu, T.; Alvarez, O.; Tao, S.; Fang, J. Spatial distribution of forest aboveground biomass in China: Estimation through combination of spaceborne lidar, optical imagery, and forest inventory data. Remote Sens. Environ. 2016, 173, 187–199. [Google Scholar] [CrossRef]
  10. Chen, C.; He, Y.; Zhang, J.; Xu, D.; Han, D.; Liao, Y.; Luo, L.; Teng, C.; Yin, T. Estimation of aboveground biomass for Pinus densata using multi-source time series in Shangri-La considering seasonal effects. Forests 2023, 14, 1747. [Google Scholar] [CrossRef]
  11. Huang, T.; Ou, G.; Wu, Y.; Zhang, X.; Liu, Z.; Xu, H.; Xu, X.; Wang, Z.; Xu, C. Estimating the aboveground biomass of various forest types with high heterogeneity at the provincial scale based on multi-source data. Remote Sens. 2023, 15, 3550. [Google Scholar] [CrossRef]
  12. Luo, Y.; Wang, X.; Ouyang, Z.; Lu, F.; Feng, L.; Tao, J. A review of biomass equations for China’s tree species. Earth Syst. Sci. Data 2020, 12, 21–40. [Google Scholar] [CrossRef]
  13. Schwartz, M.; Ciais, P.; De Truchis, A.; Chave, J.; Ottlé, C.; Vega, C.; Wigneron, J.-P.; Nicolas, M.; Jouaber, S.; Liu, S.; et al. FORMS: Forest Multiple Source height, wood volume, and biomass maps in France at 10 to 30 m resolution based on Sentinel-1, Sentinel-2, and Global Ecosystem Dynamics Investigation (GEDI) data with a deep learning approach. Earth Syst. Sci. Data 2023, 15, 4927–4945. [Google Scholar] [CrossRef]
  14. Silva, C.A.; Duncanson, L.; Hancock, S.; Neuenschwander, A.; Thomas, N.; Hofton, M.; Fatoyinbo, L.; Simard, M.; Marshak, C.Z.; Armston, J.; et al. Fusing simulated GEDI, ICESat-2 and NISAR data for regional aboveground biomass mapping. Remote Sens. Environ. 2021, 253, 112234. [Google Scholar] [CrossRef]
  15. Zhang, Y.; Liang, S. Fusion of multiple gridded biomass datasets for generating a global forest aboveground biomass map. Remote Sens. 2020, 12, 2559. [Google Scholar] [CrossRef]
  16. Li, Y.; Li, M.; Li, C.; Liu, Z. Forest aboveground biomass estimation using Landsat 8 and Sentinel-1A data with machine learning algorithms. Sci. Rep. 2020, 10, 9952. [Google Scholar] [CrossRef] [PubMed]
  17. Huang, H.; Liu, C.; Wang, X.; Zhou, X.; Gong, P. Integration of multi-resource remotely sensed data and allometric models for forest aboveground biomass estimation in China. Remote Sens. Environ. 2019, 221, 225–234. [Google Scholar] [CrossRef]
  18. Nandy, S.; Srinet, R.; Padalia, H. Mapping Forest Height and Aboveground Biomass by Integrating ICESat-2, Sentinel-1 and Sentinel-2 Data Using Random Forest Algorithm in Northwest Himalayan Foothills of India. Geophys. Res. Lett. 2021, 48, e2021GL093799. [Google Scholar] [CrossRef]
  19. Guerra-Hernández, J.; Narine, L.L.; Pascual, A.; Gonzalez-Ferreiro, E.; Botequim, B.; Malambo, L.; Neuenschwander, A.; Popescu, S.C.; Godinho, S. Aboveground biomass mapping by integrating ICESat-2, SENTINEL-1, SENTINEL-2, ALOS2/PALSAR2, and topographic information in Mediterranean forests. Gisci. Remote Sens. 2022, 59, 1509–1533. [Google Scholar] [CrossRef]
  20. Shendryk, Y. Fusing GEDI with earth observation data for large area aboveground biomass mapping. Int. J. Appl. Earth Obs. 2022, 115, 103108. [Google Scholar] [CrossRef]
  21. Hunka, N.; Santoro, M.; Armston, J.; Dubayah, R.; McRoberts, R.E.; Næsset, E.; Quegan, S.; Urbazaev, M.; Pascual, A.; May, P.B. On the NASA GEDI and ESA CCI biomass maps: Aligning for uptake in the UNFCCC global stocktake. Environ. Res. Lett. 2023, 18, 124042. [Google Scholar] [CrossRef]
  22. Healey, S.P.; Patterson, P.L.; Armston, J. Algorithm Theoretical Basis Document (ATBD) for GEDI Level-4B (L4B) Gridded Aboveground Biomass Density, Version 1.0. ORNL Distributed Active Archive Center. Available online: https://daac.ornl.gov/daacdata/gedi/GEDI_L4B_Gridded_Biomass/comp/GEDI_L4B_ATBD_v1.0.pdf (accessed on 12 March 2024).
  23. Santoro, M.; Cartus, O. Algorithm Theoretical Basis Document (ATBD), Year 4, Version 4.0. European Space Agency. Available online: https://climate.esa.int/media/documents/D2_2_Algorithm_Theoretical_Basis_Document_ATBD_V4.0_20230317.pdf (accessed on 20 April 2023).
  24. Avitabile, V.; Camia, A. An assessment of forest biomass maps in Europe using harmonized national statistics and inventory plots. Forest Ecol. Manag. 2018, 409, 489–498. [Google Scholar] [CrossRef]
  25. Zhang, Y.; Liang, S.; Yang, L. A review of regional and global gridded forest biomass datasets. Remote Sens. 2019, 11, 2744. [Google Scholar] [CrossRef]
  26. Araza, A.; De Bruin, S.; Herold, M.; Quegan, S.; Labriere, N.; Rodriguez-Veiga, P.; Avitabile, V.; Santoro, M.; Mitchard, E.T.A.; Ryan, C.M.; et al. A comprehensive framework for assessing the accuracy and uncertainty of global above-ground biomass maps. Remote Sens. Environ. 2022, 272, 112917. [Google Scholar] [CrossRef]
  27. Breidenbach, J.; Granhus, A.; Hylen, G.; Eriksen, R.; Astrup, R. A century of National Forest Inventory in Norway-informing past, present, and future decisions. For. Ecosyst. 2020, 7, 46. [Google Scholar] [CrossRef]
  28. Knott, J.; Liknes, G.C.; Giebink, C.L.; Oh, S.; Domke, G.M.; McRoberts, R.E.; Quirino, V.F.; Walters, B.F. Effects of outliers on remote sensing-assisted forest biomass estimation: A case study from the United States national forest inventory. Methods Ecol. Evol. 2023, 14, 1587–1602. [Google Scholar] [CrossRef]
  29. Réjou-Méchain, M.; Muller-Landau, H.C.; Detto, M.; Thomas, S.C.; Le Toan, T.; Saatchi, S.S.; Barreto-Silva, J.S.; Bourg, N.A.; Bunyavejchewin, S.; Butt, N.; et al. Local spatial structure of forest biomass and its consequences for remote sensing of carbon stocks. Biogeosciences 2014, 11, 6827–6840. [Google Scholar] [CrossRef]
  30. Zeng, W.; Tomppo, E.; Healey, S.P.; Gadow, K.V. The national forest inventory in China: History- results -international context. Forest Ecosyst. 2015, 2, 23. [Google Scholar] [CrossRef]
  31. Yu, Y.; Pan, Y.; Yang, X.; Fan, W. Spatial scale effect and correction of forest aboveground biomass estimation using remote sensing. Remote Sens. 2022, 14, 2828. [Google Scholar] [CrossRef]
  32. Nappo, C.J.; Caneill, J.Y.; Furman, R.W.; Gifford, F.A.; Kaimal, J.C.; Kramer, M.L.; Lockhart, T.J.; Pendergast, M.M.; Pielke, R.A.; Randerson, D.; et al. The workshop on the representativeness of meteorological observations, June 1981, Boulder, Colo. Bull. Am. Meteorol. Soc. 1982, 63, 761–764. Available online: https://www.jstor.org/stable/26222836 (accessed on 18 August 2025).
  33. Ma, J.; Zhou, J.; Liu, S.; Göttsche, F.M.; Zhang, X.; Wang, S.; Li, M. Continuous evaluation of the spatial representativeness of land surface temperature validation sites. Remote Sens. Environ. 2021, 265, 112669. [Google Scholar] [CrossRef]
  34. Rossini, M.; Celesti, M.; Bramati, G.; Migliavacca, M.; Cogliati, S.; Rascher, U.; Colombo, R. Evaluation of the spatial representativeness of in situ SIF observations for the validation of medium-resolution satellite SIF products. Remote Sens. 2022, 14, 5107. [Google Scholar] [CrossRef]
  35. Wang, H.; Yakir, D.; Rotenberg, E. Assessing the effectiveness of a central flux tower in representing the spatial variations in gross primary productivity in a semi-arid pine forest. Agr. Forest Meteorol. 2023, 333, 109415. [Google Scholar] [CrossRef]
  36. Liu, S.; Su, H.; Tian, J.; Wang, W. An analysis of spatial representativeness of air temperature monitoring stations. Theor. Appl. Climatol. 2017, 132, 857–865. [Google Scholar] [CrossRef]
  37. Schmid, H.P.; Lloyd, C.R. Spatial representativeness and the location bias of flux footprints over inhomogeneous areas. Agr. Forest Meteorol. 1999, 93, 195–209. [Google Scholar] [CrossRef]
  38. Gong, H.; Wang, Y.; Wang, G.; Gao, Y.; Li, G.; Kuang, Z.; Zhuo, X.; Bi, J.; Wang, P.; Wang, W.; et al. Quantifying the spatial representativeness of carbon flux footprints of a grassland ecosystem in the semi-arid region. J. Geophys. Res. Atmos. 2023, 128, e2022JD038269. [Google Scholar] [CrossRef]
  39. Román, M.O.; Schaaf, C.B.; Woodcock, C.E.; Strahler, A.H.; Yang, X.; Braswell, R.H.; Curtis, P.S.; Davis, K.J.; Dragoni, D.; Goulden, M.L.; et al. The MODIS (Collection V005) BRDF/albedo product: Assessment of spatial representativeness over forested landscapes. Remote Sens. Environ. 2009, 113, 2476–2498. [Google Scholar] [CrossRef]
  40. Wang, Y.; Zheng, Z. Spatial Representativeness Analysis for Snow Depth Measurements of Meteorological Stations in Northeast China. J. Hydrometeorol. 2020, 21, 791–805. [Google Scholar] [CrossRef]
  41. Lesht, B.M.; Barbiero, R.P.; Warren, G.J. Using satellite observations to assess the spatial representativeness of the GLNPO water quality monitoring program. J. Great Lakes Res. 2018, 44, 547–562. [Google Scholar] [CrossRef]
  42. Liu, Q.; Shan, Y.; Shu, L.; Sun, P.; Du, S. Spatial and temporal distribution of forest fire frequency and forest area burnt in Jilin Province, Northeast China. J. Forestry Res. 2018, 29, 1233–1239. [Google Scholar] [CrossRef]
  43. Zhang, X.; Lei, Y. Comparison of annual individual-tree growth models based on variable rate and constant rate methods. Forest Res. 2009, 22, 824–828. [Google Scholar] [CrossRef]
  44. Li, H.; Lei, Y. Estimation and Evaluation of Forest Biomass Carbon Storage in China; China Forestry Publishing House: Beijing, China, 2010. [Google Scholar]
  45. Li, H.; Fa, L. Height-diameter model for major tree species in China using the classified height method (in Chinese). Sci. Silvae Sin. 2011, 47, 83–90. [Google Scholar]
  46. GB/T 43648-2024; Tree Biomass Models and Related Parameters to Carbon Accounting for Major Tree Species. China Standards Press: Beijing, China, 2024.
  47. Buckley, S. NASADEM: Creating a New NASA Digital Elevation Model and Associated Products. Available online: https://earthdata.nasa.gov/esds/competitive-programs/measures/nasadem (accessed on 18 July 2025).
  48. Zhang, X.; Liu, L.; Chen, X.; Gao, Y.; Xie, S.; Mi, J. GLC_FCS30: Global land-cover product with fine classification system at 30 m using time-series Landsat imagery. Earth Syst. Sci. Data 2021, 13, 2753–2776. [Google Scholar] [CrossRef]
  49. Santoro, M.; Cartus, O. ESA Biomass Climate Change Initiative (Biomass_cci): Global Datasets of Forest Above-Ground Biomass for the Years 2010, 2017, 2018, 2019 and 2020. NERC EDS Centre for Environmental Data Analysis. Available online: https://climate.esa.int/en/data (accessed on 1 July 2024).
  50. Dong, J.; Zhou, Y.; You, N.; Chen, C. A 30-m Annual Maximum NDVI Dataset in China from 2000 to 2022. National Ecosystem Science Data Center, China. Available online: https://cstr.cn/15732.11.nesdc.ecodb.rs.2021.012 (accessed on 22 July 2025).
  51. Gorelick, N.; Hancher, M.; Dixon, M.; Ilyushchenko, S.; Thau, D.; Moore, R. Google Earth Engine: Planetary-scale geospatial analysis for everyone. Remote Sens. Environ. 2017, 202, 18–27. [Google Scholar] [CrossRef]
  52. Yang, J.; Huang, X. The 30 m annual land cover datasets and its dynamics in China from 1990 to 2019. Earth Syst. Sci. Data 2021, 13, 3907–3925. [Google Scholar] [CrossRef]
  53. Hakuba, M.Z.; Folini, D.; Sanchez-Lorenzo, A.; Wild, M. Spatial representativeness of ground-based solar radiation measurements. J. Geophys. Res. Atmos. 2013, 118, 8585–8597. [Google Scholar] [CrossRef]
  54. Diakoulaki, D.; Mavrotas, G.; Papayannakis, L. Determining objective weights in multiple criteria problems: The CRITIC method. Comput. Ops. Res. 1995, 22, 763–770. [Google Scholar] [CrossRef]
  55. Fang, H.; Zhang, Y.; Wei, S.; Li, W.; Ye, Y.; Sun, T.; Liu, W. Validation of global moderate resolution leaf area index (LAI) products over croplands in northeastern China. Remote Sens. Environ. 2019, 233, 111377. [Google Scholar] [CrossRef]
  56. Cochran, W.G. Sampling Techniques, 3rd ed.; Wiley: New York, NY, USA, 1977. [Google Scholar]
  57. Food and Agriculture Organization of the United Nations (FAO). Global Forest Resources Assessment 2010: Main Report; FAO: Rome, Italy, 2010. [Google Scholar]
  58. National Forestry and Grassland Administration (NFGA). Technical Guidelines for the Ninth National Forest Inventory of China; NFGA: Beijing, China, 2018. [Google Scholar]
  59. Kennedy, R.E.; Yang, Z.; Cohen, W.B. Detecting trends in forest disturbance and recovery using yearly Landsat time series: 1. LandTrendr-temporal segmentation algorithms. Remote Sens. Environ. 2010, 114, 2897–2910. [Google Scholar] [CrossRef]
  60. Huang, C.; Goward, S.N.; Schleeweis, K.; Thomas, N.; Masek, J.G.; Zhu, Z. Dynamics of national forests assessed using the Landsat record: Case studies in eastern U.S. Remote Sens. Environ. 2009, 113, 1430–1442. [Google Scholar] [CrossRef]
  61. Ji, W.; Zhongke, F.; Hanyue, Z.; Yuan, W. Assessment of Carbon sink potential of arbor forests based on DBH growth rate model for standing trees. J. Agric. Sci. Technol. 2024, 26, 99–109. [Google Scholar] [CrossRef]
  62. Santoro, M.; Cartus, O.; Quegan, S.; Kay, H.; Lucas, R.M.; Araza, A.; Herold, M.; Labrière, N.; Chave, J.; Rosenqvist, Å.; et al. Design and performance of the climate change initiative biomass global retrieval algorithm. Sci. Remote Sens. 2024, 10, 100169. [Google Scholar] [CrossRef]
  63. Kellner, J.R.; Armston, J.; Duncanson, L. Algorithm theoretical basis document for GEDI footprint aboveground biomass density. ESS 2023, 10, e2022EA002516. [Google Scholar] [CrossRef]
  64. Jia, D.; Wang, C.; Hakkenberg, C.R.; Numata, I.; Elmore, A.J.; Cochrane, M.A. Accuracy evaluation and effect factor analysis of GEDI aboveground biomass product for temperate forests in the conterminous United States. GISci. Remote Sens. 2024, 61, 2292374. [Google Scholar] [CrossRef]
  65. Pascual, A.; Guerra-Hernández, J.; Armston, J.; Minor, D.M.; Duncanson, L.I.; May, P.B.; Kellner, J.R.; Dubayah, R. Assessing the performance of NASA’s GEDI L4A footprint aboveground biomass density models using National Forest Inventory and airborne laser scanning data in Mediterranean forest ecosystems. Forest Ecol. Manag. 2023, 538, 120975. [Google Scholar] [CrossRef]
  66. Ehlers, D.; Wang, C.; Coulston, J.; Zhang, Y.; Pavelsky, T.; Frankenberg, E.; Woodcock, C.; Song, C. Mapping forest aboveground biomass using multisource remotely sensed data. Remote Sens. 2022, 14, 1115. [Google Scholar] [CrossRef]
  67. Gupta, R.; Sharma, L.K. Aboveground biomass prediction by fusing GEDI footprints with optical and SAR data using the random forest in the mixed tropical forest, India. In Proceedings of the IGARSS 2022-2022 IEEE International Geoscience and Remote Sensing Symposium, Kuala Lumpur, Malaysia, 17–22 July 2022; pp. 5460–5463. [Google Scholar] [CrossRef]
  68. Wang, X.; Liu, C.; Lv, G.; Xu, J.; Cui, G. Integrating multi-source remote sensing to assess forest aboveground biomass in the Khingan mountains of north-eastern China using machine-learning algorithms. Remote Sens. 2022, 14, 1039. [Google Scholar] [CrossRef]
  69. Banda, F.; Giudici, D.; Le Toan, T.; Mariotti d’Alessandro, M.; Papathanassiou, K.; Quegan, S.; Riembaur, G.; Scipal, K.; Soja, M.; Tebaldini, S.; et al. The BIOMASS Level 2 Prototype Processor: Design and experimental results of above-ground biomass estimation. Remote Sens. 2020, 12, 985. [Google Scholar] [CrossRef]
  70. Wang, M.; Wang, Q.; Wang, Z.; Gao, Y.; Wang, J.; Cui, C.; Li, Y.; Ding, Z.; Wang, K.; Xu, C.; et al. Unlocking aerobatic potential of quadcopters: Autonomous freestyle flight generation and execution. Sci. Robot. 2025, 10, eadp9905. [Google Scholar] [CrossRef]
  71. Zhou, X.; Wen, X.; Wang, Z.; Gao, Y.; Li, H.; Wang, Q.; Yang, T.; Lu, H.; Cao, Y.; Xu, C.; et al. Swarm of micro flying robots in the wild. Sci. Robot. 2022, 7, eabm5954. [Google Scholar] [CrossRef]
  72. Yang, S.; Xing, Y.; Xing, T.; Deng, H.; Xi, Z. Multisensors fusion slam-aided forest plot mapping with backpack Dual-LiDAR System. IEEE Jstars. 2024, 17, 16051–16070. [Google Scholar] [CrossRef]
  73. Liu, H.; Xu, G.; Liu, B.; Li, Y.; Yang, S.; Tang, J.; Pan, K.; Xing, Y. A real time LiDAR-Visual-Inertial object level semantic SLAM for forest environments. Isprs J. Photogramm. 2025, 219, 71–90. [Google Scholar] [CrossRef]
  74. Jagadish, B.; Behera, M.D.; Prakash, A.J.; Paramanik, S.; Ghosh, S.M.; Patnaik, C.; Das, A. Indicating saturation limits of multi-sensor satellite data in estimating aboveground biomass of a mangrove forest. J. Indian Soc. Remote. 2024, 52, 2483–2500. [Google Scholar] [CrossRef]
  75. Wang, Q.; Putri, N.A.; Gan, Y.; Song, G. Combining both spectral and textural indices for alleviating saturation problem in forest LAI estimation using Sentinel-2 data. Geocarto Int. 2022, 37, 10511–10531. [Google Scholar] [CrossRef]
  76. Tian, Z.; Fan, J.; Yu, T.; de Leon, N.; Kaeppler, S.M.; Zhang, Z. Mitigating NDVI saturation in imagery of dense and healthy vegetation. Isprs J. Photogramm. 2025, 227, 234–250. [Google Scholar] [CrossRef]
  77. Gao, S.; Zhong, R.; Yan, K.; Ma, X.; Chen, X.; Pu, J.; Gao, S.; Qi, J.; Yin, G.; Myneni, R.B. Evaluating the saturation effect of vegetation indices in forests using 3D radiative transfer simulations and satellite observations. Remote Sens. Environ. 2023, 295, 113665. [Google Scholar] [CrossRef]
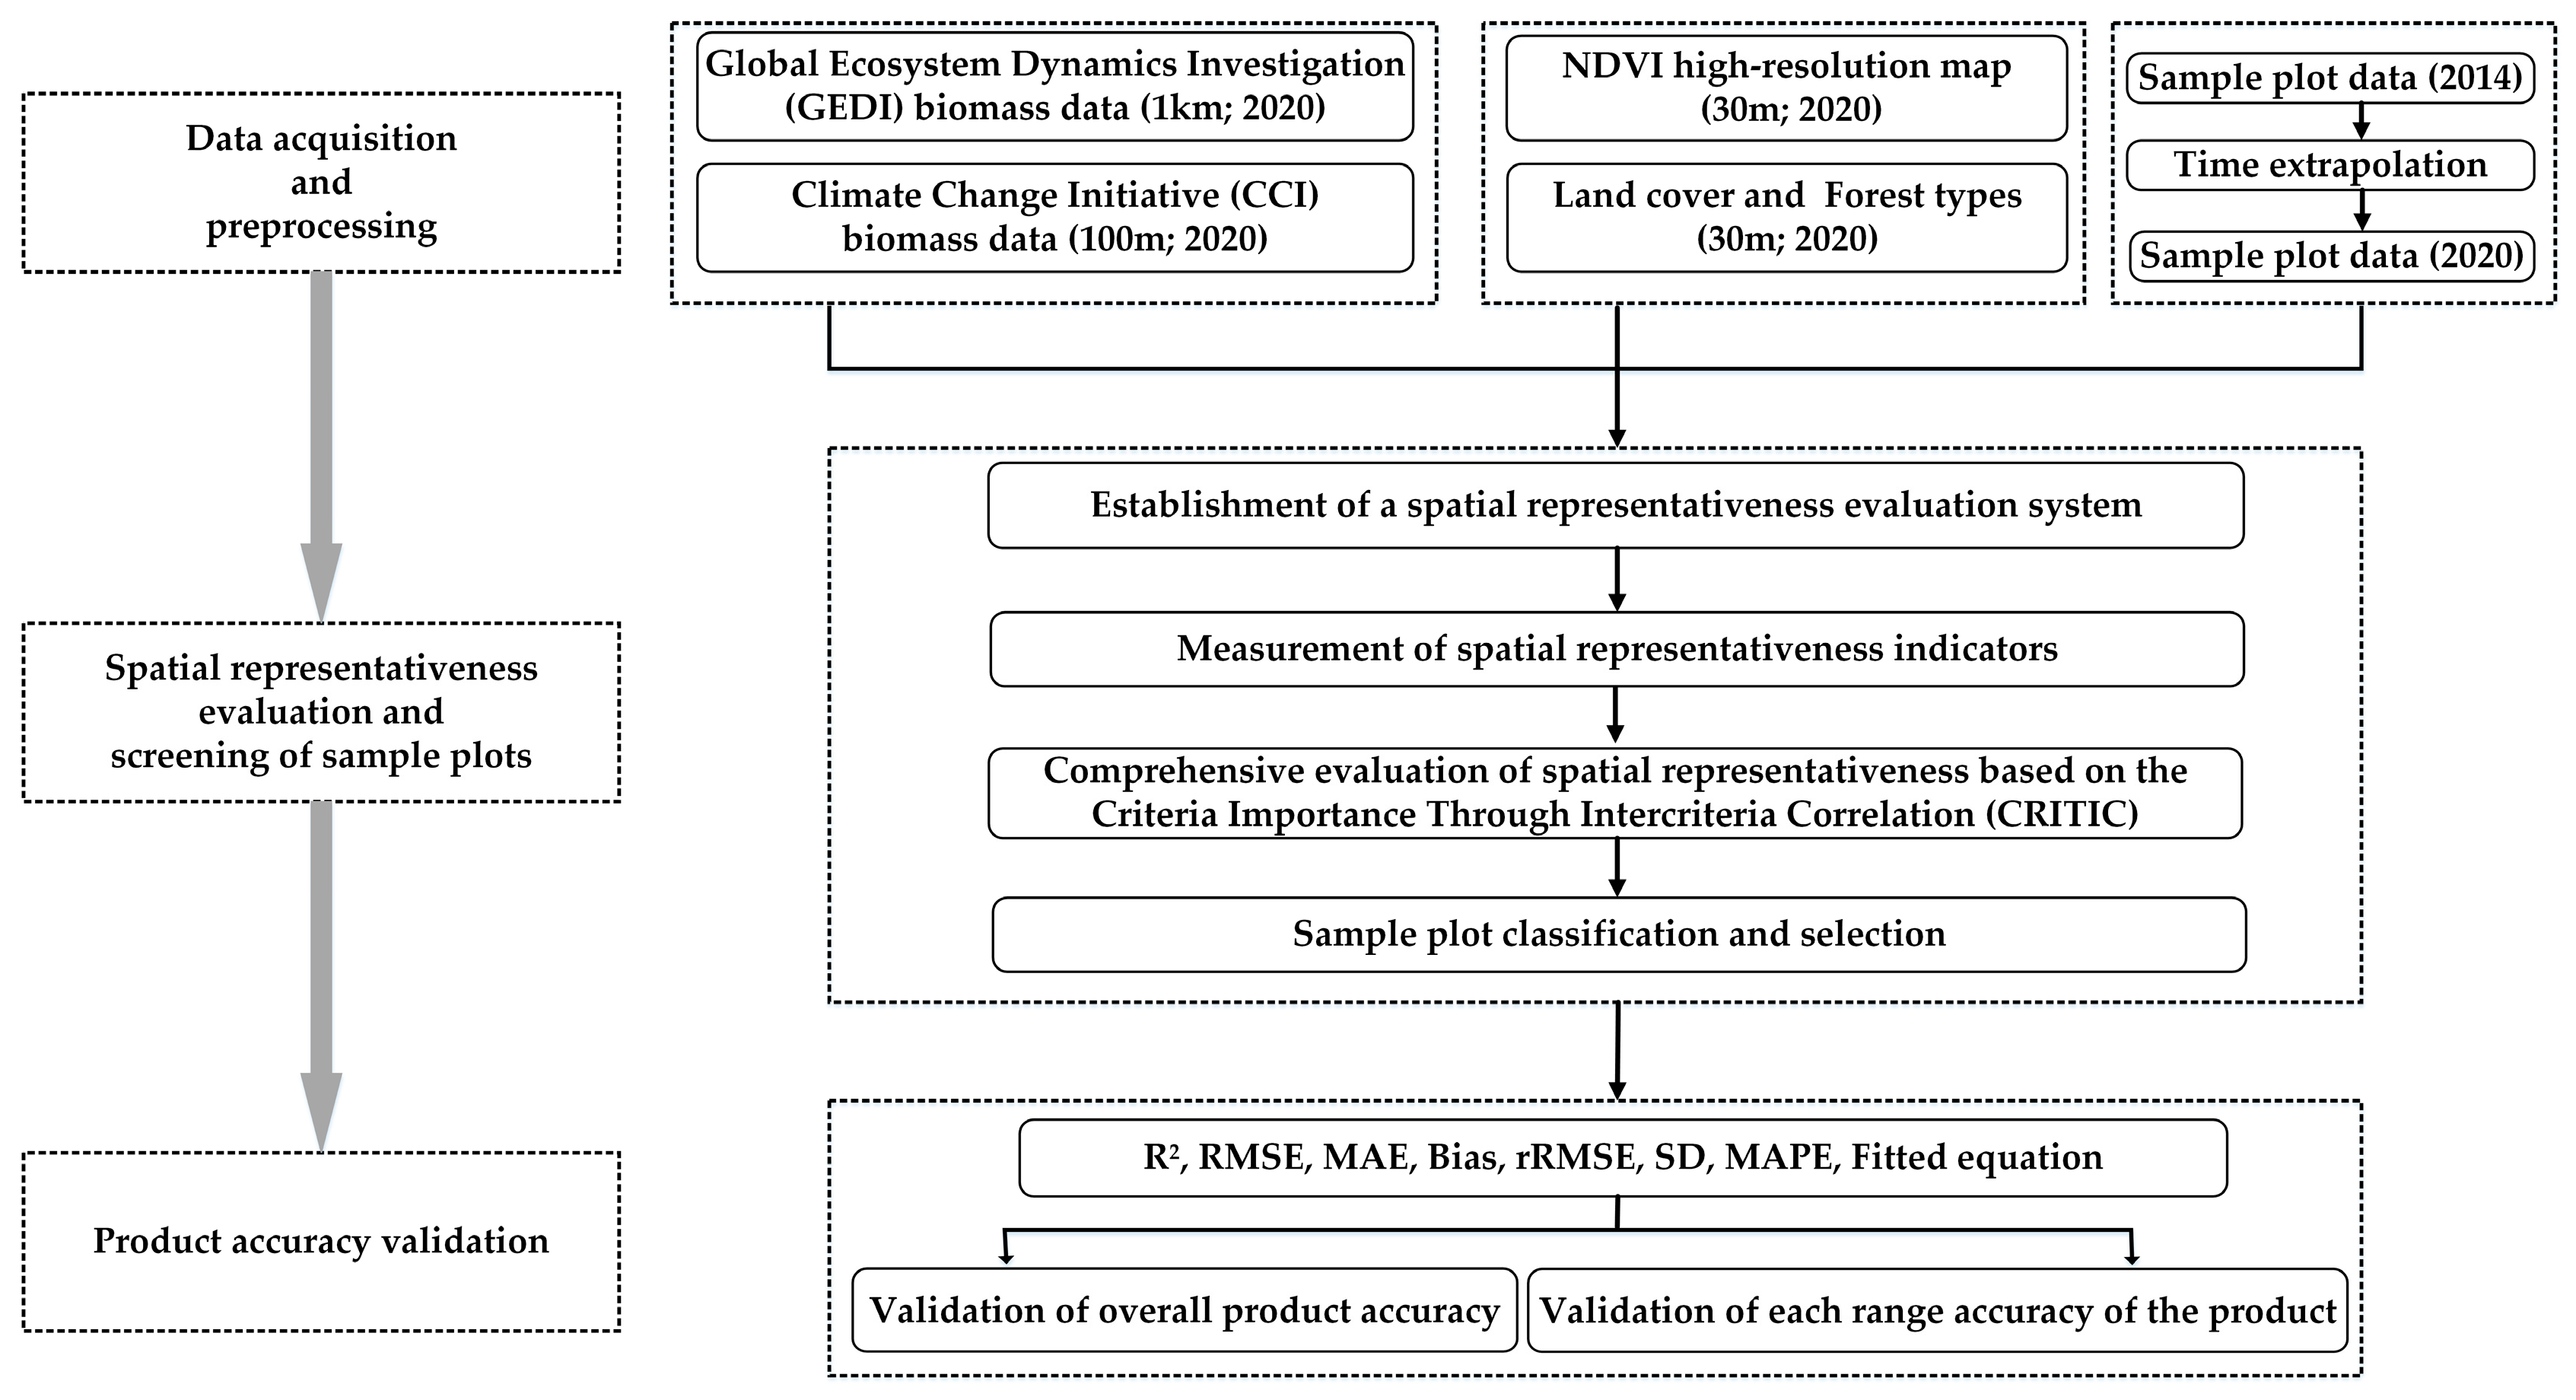
Figure 2. Overall workflow for spatial representativeness analysis and aboveground biomass (AGB) product evaluation. The utilized datasets include GEDI biomass data [7], CCI biomass data [49], NDVI high-resolution data [50], GLC_FCS30 land-cover dataset [48], and annual land cover datasets in China [52]. (r-square (R2), root mean square error (RMSE), mean absolute error (MAE), relative RMSE (rRMSE), standard deviation (SD), and mean absolute percentage error (MAPE)).
Remotesensing 17 02898 g002
Figure 3. Frequency distribution of spatial representativeness scores of sample plots for (a) Global Ecosystem Dynamics Investigation (GEDI) biomass data and (b) Climate Change Initiative (CCI) biomass data. The number of samples corresponding to each score is labeled above each bar.
Remotesensing 17 02898 g003
Figure 4. Evaluation results of Global Ecosystem Dynamics Investigation (GEDI) and Climate Change Initiative (CCI) biomass data before and after spatial representativeness analysis. Sample plots are represented by black dots, while the trend line is depicted in red, and the 1:1 line is illustrated as a dashed black line. (r-square (R2), root mean square error (RMSE), mean absolute error (MAE), relative RMSE (rRMSE), standard deviation (SD), mean absolute percentage error (MAPE), the sample number (N)).
Remotesensing 17 02898 g004
Figure 5. Field aboveground biomass (AGB) distribution grouped by biomass ranges for Global Ecosystem Dynamics Investigation (GEDI) and Climate Change Initiative (CCI) biomass data.
Remotesensing 17 02898 g005
Figure 6. Evaluation of Global Ecosystem Dynamics Investigation (GEDI) and Climate Change Initiative (CCI) biomass data grouped by biomass ranges. The number of samples in each biomass range is labeled near the corresponding inflection points of the polyline. Root mean square error (RMSE), mean absolute error (MAE), relative RMSE (rRMSE), and standard deviation (SD).
Remotesensing 17 02898 g006
Figure 7. Aboveground biomass (AGB) distribution grouped by coniferous forest (CF), broadleaf forest (BF), and mixed conifer–broadleaf forest (MCBF) in Global Ecosystem Dynamics Investigation (GEDI) and Climate Change Initiative (CCI) biomass data. The sample numbers for CF, BF, and MCBF in GEDI biomass data are 16, 114, and 12, respectively, while the corresponding sample numbers for CCI biomass data are 27, 190, and 25.
Remotesensing 17 02898 g007
Figure 8. The altitude distribution grouped by coniferous forest (CF), broadleaf forest (BF), and mixed conifer–broadleaf forest (MCBF) in Global Ecosystem Dynamics Investigation (GEDI) and Climate Change Initiative (CCI) biomass data. The sample numbers for CF, BF, and MCBF in GEDI biomass data are 16, 114, and 12, respectively, while the corresponding sample numbers for CCI biomass data are 27, 190, and 25.
Remotesensing 17 02898 g008
Figure 9. Evaluation results of coniferous forest (CF), broadleaf forest (BF), and mixed conifer–broadleaf forest (MCBF) in Global Ecosystem Dynamics Investigation (GEDI) and Climate Change Initiative (CCI) biomass data. The sample numbers for CF, BF, and MCBF in GEDI biomass data are 16, 114, and 12, respectively, while the corresponding sample numbers for CCI biomass data are 27, 190, and 25.
Remotesensing 17 02898 g009
Table 1. Weights of relative mean absolute deviation (RMAD), relative spatial sampling error (RSSE) and plot vegetation type proportion (PVTP) for Global Ecosystem Dynamics Investigation (GEDI) and Climate Change Initiative (CCI) biomass data.
ProductWeight (%)
RMADRSSEPVTP
GEDI biomass data13.9513.0173.04
CCI biomass data16.4415.0968.47
Table 2. Spatial representativeness classification of sample plots for Global Ecosystem Dynamics Investigation (GEDI) and Climate Change Initiative (CCI) biomass data.
ProductScore
Non-RepresentativeRepresentative
GEDI biomass data<0.75≥0.75
CCI biomass data<0.70≥0.70
Disclaimer/Publisher’s Note: The statements, opinions and data contained in all publications are solely those of the individual author(s) and contributor(s) and not of MDPI and/or the editor(s). MDPI and/or the editor(s) disclaim responsibility for any injury to people or property resulting from any ideas, methods, instructions or products referred to in the content.