Article

Incorporating Building Morphology Data to Improve Urban Land Use Mapping: A Case Study of Shenzhen

1
Key Laboratory of Urban Land Resources Monitoring and Simulation, Ministry of Natural Resources, Shenzhen 518000, China
2
College of Land Science and Technology, China Agricultural University, Beijing 100083, China
3
School of Architecture, Tsinghua University, Beijing 100084, China
4
Beijing Municipal Institute of City Planning and Design, Beijing 100045, China
5
Centre for Advanced Spatial Analysis, University College London, London WC1E 6BT, UK
6
Land Consolidation and Rehabilitation Center, Ministry of Natural Resources, Beijing 100035, China
7
Science and Technology Innovation Bureau, State-Owned Assets Supervision and Administration Commission of the State Council, Beijing 100053, China
8
Shenzhen Urban Planning & Land Resource Research Center, Shenzhen 518034, China
*
Author to whom correspondence should be addressed.
These authors contributed equally to this work.
Remote Sens. 2025, 17(16), 2811; https://doi.org/10.3390/rs17162811
Submission received: 3 July 2025 / Revised: 7 August 2025 / Accepted: 8 August 2025 / Published: 14 August 2025

Abstract

Accurate urban land use classification is vital for urban planning, resource allocation, and sustainable management. Traditional remote sensing methods struggle with fine-grained classification and spatial structure identification, while socio-economic data, like points of interest and road networks, face issues of uneven distribution and outdated updates. To explore the role of building morphology characteristics in enhancing urban land use classification and their potential as a substitute for socio-economic information, this study proposes a method integrating architectural features with multi-source remote sensing data, evaluated through an empirical analysis using a random forest model in Shenzhen. Three models were developed as follows: Model 1, utilizing only remote sensing data; Model 2, combining remote sensing with socio-economic data; and Model 3, integrating building morphology with remote sensing data to evaluate its potential for enhancing classification accuracy and substituting socio-economic data. Experimental results demonstrate that Model 3 achieves an overall accuracy of 80.09% and a Kappa coefficient of 0.77. Compared to this, Model 1 achieves an accuracy of 74.56% and a Kappa coefficient of 0.70, while Model 2 reaches 79.56% accuracy and a Kappa coefficient of 0.76. Model 3 also shows greater stability in complex, smaller parcels. This method offers superior generalization and substitution potential in data-scarce, heterogeneous contexts, providing a scalable approach for fine-grained urban monitoring and dynamic management.

1. Introduction

Accurate urban land use classification is essential for sustainable urban development [1]. With the acceleration of urbanization, the global built-up area of cities increased by about 243,000 km2 between 1990 and 2015 [2], and the percentage of the global urban population is expected to rise to 67% by 2050 [3]. The intensity of urban land development continues to rise, bringing complex challenges (e.g., imbalance in the land use structure) [4,5] which seriously affect the coordinated development of urban ecological security and social functions [6,7]. In this context, mapping urban land use accurately has become an important support for modern cities to achieve efficient spatial governance and informed decision-making [8], which is directly related to the optimization of the urban spatial pattern and the convenience of residents’ daily lives [9,10].
The development of remote sensing technology has greatly advanced the efficiency and scalability of urban land use mapping. Traditional urban land use mapping mostly relied on field surveys and manual interpretation [11]. Although they offer certain advantages in accuracy, they exhibit significant shortcomings regarding efficiency, cost, and cross-regional consistency, which complicates meeting the high demand for the time-sensitive monitoring of dynamics in the context of rapid urbanization [12]. Remote sensing technology now has been widely used in urban land use type mapping [13,14], achieving a shift from traditional manual approaches to automated large-scale analysis. Although it provides multi-dimensional features such as spectral and scattering information, it is primarily limited to surface-level observations [15,16]. In dense urban areas, mixed pixels—containing multiple land use types at class boundaries, which is often referred as the “boundary effect”, impair classification accuracy [17]. Arising from heterogeneous urban landscapes with interspersed buildings, roads, and green spaces, they obscure distinct functional zones (e.g., residential, commercial, industrial). Higher spatial resolution may reduce mixed pixels, enhancing accuracy for small features, but it increases within-class variability, necessitating advanced processing for effective differentiation [18].
Currently, integrating socio-economic data with remote sensing data into the classifier has become a prevailing approach in urban land use mapping research, leading to improvements in classification accuracy [19,20]. Socio-economic data, encompassing datasets such as point of interest (POI) data and OpenStreetMap (OSM) road network data, provide valuable insights into human activities and urban infrastructure [21]. These datasets are typically employed in urban land use mapping to enrich feature sets for classifiers, enabling the identification of land use patterns by capturing socio-economic characteristics, such as commercial activity, residential density, or transportation networks [19,22]. Despite these benefits, socio-economic data availability varies significantly across regions (i.e., being abundant and regularly updated in developed cities but sparse in less developed and rural areas due to limited crowdsourcing and infrastructure documentation) [23,24], and it is further constrained by high costs and lack of temporal continuity [25], limiting its applicability for large-scale, cross-regional, and long-term urban monitoring [26].
In contrast, building morphology characteristics have shown great potential in urban land use mapping [14,27]. Building morphology characteristics describe the physical and spatial attributes of buildings, such as height, footprint area, and shape, derived from Earth Observation datasets and machine learning to map urban 3D structures [28]. These features support applications like urban planning and climate modeling by revealing spatial patterns in building distributions. Different urban land use types may have unique structural patterns [29]. Building morphology data may uncover spatial organizational differences between land parcels at the physical structure level. For instance, commercial zones tend to exhibit high-rise, densely packed, and strongly clustered building forms, whereas industrial zones are often characterized by low-rise, regularly arranged, large-volume factory buildings [30]. Capturing these differences enhances the classification performance in distinguishing complex urban functions [31]. The absence of reliable building footprint and height datasets has led to a reliance on digital surface model (DSM) data for urban studies, which further serves as vertical building information [32]. Recently, the widespread application of machine learning algorithms has significantly improved the extraction of building footprints and height estimation at various scales [33,34]. Many emerging and accessible building footprint and height datasets provide robust support for standardized analysis and dynamic monitoring in data-scarce environments [35]. Although building morphology data have been utilized in urban studies (e.g., urban climate, city planning) in recent years [36,37,38], systematic investigations into their effectiveness for urban land use classification remain scarce. In particular, their potential to serve as a substitute for socio-economic data has not been comprehensively evaluated [39,40].
In this study, we investigated the role of building morphology characteristics in improving urban land use classification and their potential as substitutes for socio-economic information. On the one hand, we developed a robust methodology that integrates morphological features into traditional approaches to enhance classification accuracy. On the other hand, we aimed to evaluate whether these features can provide comparable performance to integrate socio-economic data, offering a more accessible method for urban land use mapping.

2. Materials and Methods

2.1. Study Area

Shenzhen, located in the eastern part of the Pearl River Delta in southern China, was selected as the study area (Figure 1). Since the establishment of the Special Economic Zone in 1980, Shenzhen has experienced rapid and significant urbanization, and its urban spatial structure has continued to change, resulting in a diverse land use pattern and high-density built-up patterns [41]. Its typical rapid urban expansion, mixed-function land use characteristics, and complex urban morphology make it an ideal experimental area for assessing urban land use classification methods. Here, the study area encompasses the mainland portion of Shenzhen, excluding Noi Ling Ding Island.

2.2. Datasets

2.2.1. Urban Land Use Data

We obtained urban land use data of Shenzhen from the Shenzhen Planning and Natural Resources Bureau for parcel-level classification samples with training labels. The original data provided 17 categories of urban land use types at the parcel scale. To enhance the generalizability of the model, we reclassified the data into seven categories (Table S1), including residential land (R), commercial land (C), industrial land (I), transportation land (T), green land (G), public land (P), and “other types (O)”, based on the national basic urban land use classification system (EULUC-China) [12,42]. Although the standard EULUC-China framework is typically divided into five categories, we added green land and “other types” to more comprehensively reflect the important roles of urban ecological space and diverse land use in a rapidly developing city like Shenzhen [42,43]. In addition, considering the spatial resolution limitations of some data sources, we excluded very small parcels that were difficult to identify accurately. These excluded parcels that constituted only 0.37% of the total area, minimizing their impact on overall classification accuracy and utility [44].

2.2.2. Remote Sensing Data

We collected Sentinel-1, Sentinel-2, and DSM data through the Google Earth Engine (GEE) platform to extract features such as surface spectra, texture, and spatial structure for classification. The Sentinel-1 global surface data products are acquired by two C-band SAR satellites in sun-synchronous orbit, providing high-precision surface monitoring capabilities in both co-polarized (VV) and cross-polarized (VH) modes under various weather conditions. Additionally, Sentinel-2 is equipped with a multispectral imager (MSI) capable of acquiring high-quality surface multispectral reflectance information at a 10 m spatial resolution for the inversion of surface types such as vegetation, water bodies, and buildings [45]. We also utilized DSM data from the ALOS satellite to reflect the vertical structural characteristics of urban surfaces. Specifically, the selected AW3D30 data product provides highly accurate surface elevation information [46] and is one of the most widely used datasets in land use/cover (LULC) mapping studies [47].

2.2.3. Socio-Economic Data

Socio-economic data (e.g., POI and road network data) reflect human activity, serving as a crucial source for assisting urban land use classification from a socio-economic perspective. In this study, we obtained POI data from the AMAP platform (https://lbs.amap.com, accessed on 20 December 2022), which provides the name, type, address, latitude, and longitude of each POI. Here, we extracted six key types (i.e., corresponding to the seven land use types mentioned above; there are no “other types (O)”) of POIs related to urban land use to integrate the socio-economic characteristics into the model [48,49]. Moreover, we acquired road network data from OSM (https://www.openstreetmap.org, accessed on 21 December 2022), which possesses a strong capability to express accessibility and boundary information [50]. The Euclidean distance to the nearest POI measures activity proximity, with commercial areas showing shorter distances due to dense business-related POIs (e.g., shops, offices), while residential areas exhibit longer distances due to sparser housing-related POIs, facilitating land use mapping [51]. Similarly, road network Euclidean distance quantifies proximity to roads, with commercial and transportation zones closer to major roads and residential or green spaces farther away, enhancing classification accuracy by capturing similar spatial patterns of the same urban land use type [52].

2.2.4. Building Morphology Data

We utilized building form and height information from the 3D-GloBFP dataset to provide the model with crucial building morphology characteristics for urban land use mapping. The 3D-GloBFP dataset accurately provides building heights at the building scale, with R2 values ranging from 0.66 to 0.96 and root mean square errors (RMSEs) of 1.9 to 14.6 m for 33 subregions [53]. The vertical information of buildings provides structural characteristics across different land use types and supports the identification and classification of complex mixed areas of cities [54]. In Shenzhen, residential land use is mostly concentrated in medium- and high-rise residential districts, industrial areas are mainly distributed with low-rise or multi-story factories, and commercial and public service areas often contain densely distributed high-rise building clusters with obvious differences in building heights, which have good potential for identification (Figure S1).

2.3. Data Preprocessing

In this study, we processed Sentinel-1, Sentinel-2, ALOS DSM, socio-economic, and building morphology data as input features for the urban land use classification model. We employed annual average remote sensing and socio-economic data (Table 1) in the same year (i.e., 2022) as the reference data to ensure temporal alignment. Here, due to the low temporal resolution, we acquired the building morphology data in 2020, and the short time gap resulted in minimal impact [55]. For Sentinel-1, we utilized VV and VH polarizations following outlier removal, with the dual-polarized VVH metric calculated as described in [35]:
V V H n   =   V V   ×   n V H   n   =   3 ,   4 ,   5 ,   6
For Sentinel-2, after cloud masking and radiometric correction [56], we used Level-1C bands (B2–B8, B8A, B11, B12) and derived the NDVI, NDBI, and MNDWI to detect vegetation, built-up areas, and water bodies [57]. ALOS DSM Global 30 data provided elevation features to capture vertical spatial structures [58]. Finally, we calculate the mean values of the above features in terms of urban parcels to construct a multi-source RS feature set to provide input features for the subsequent classification models.
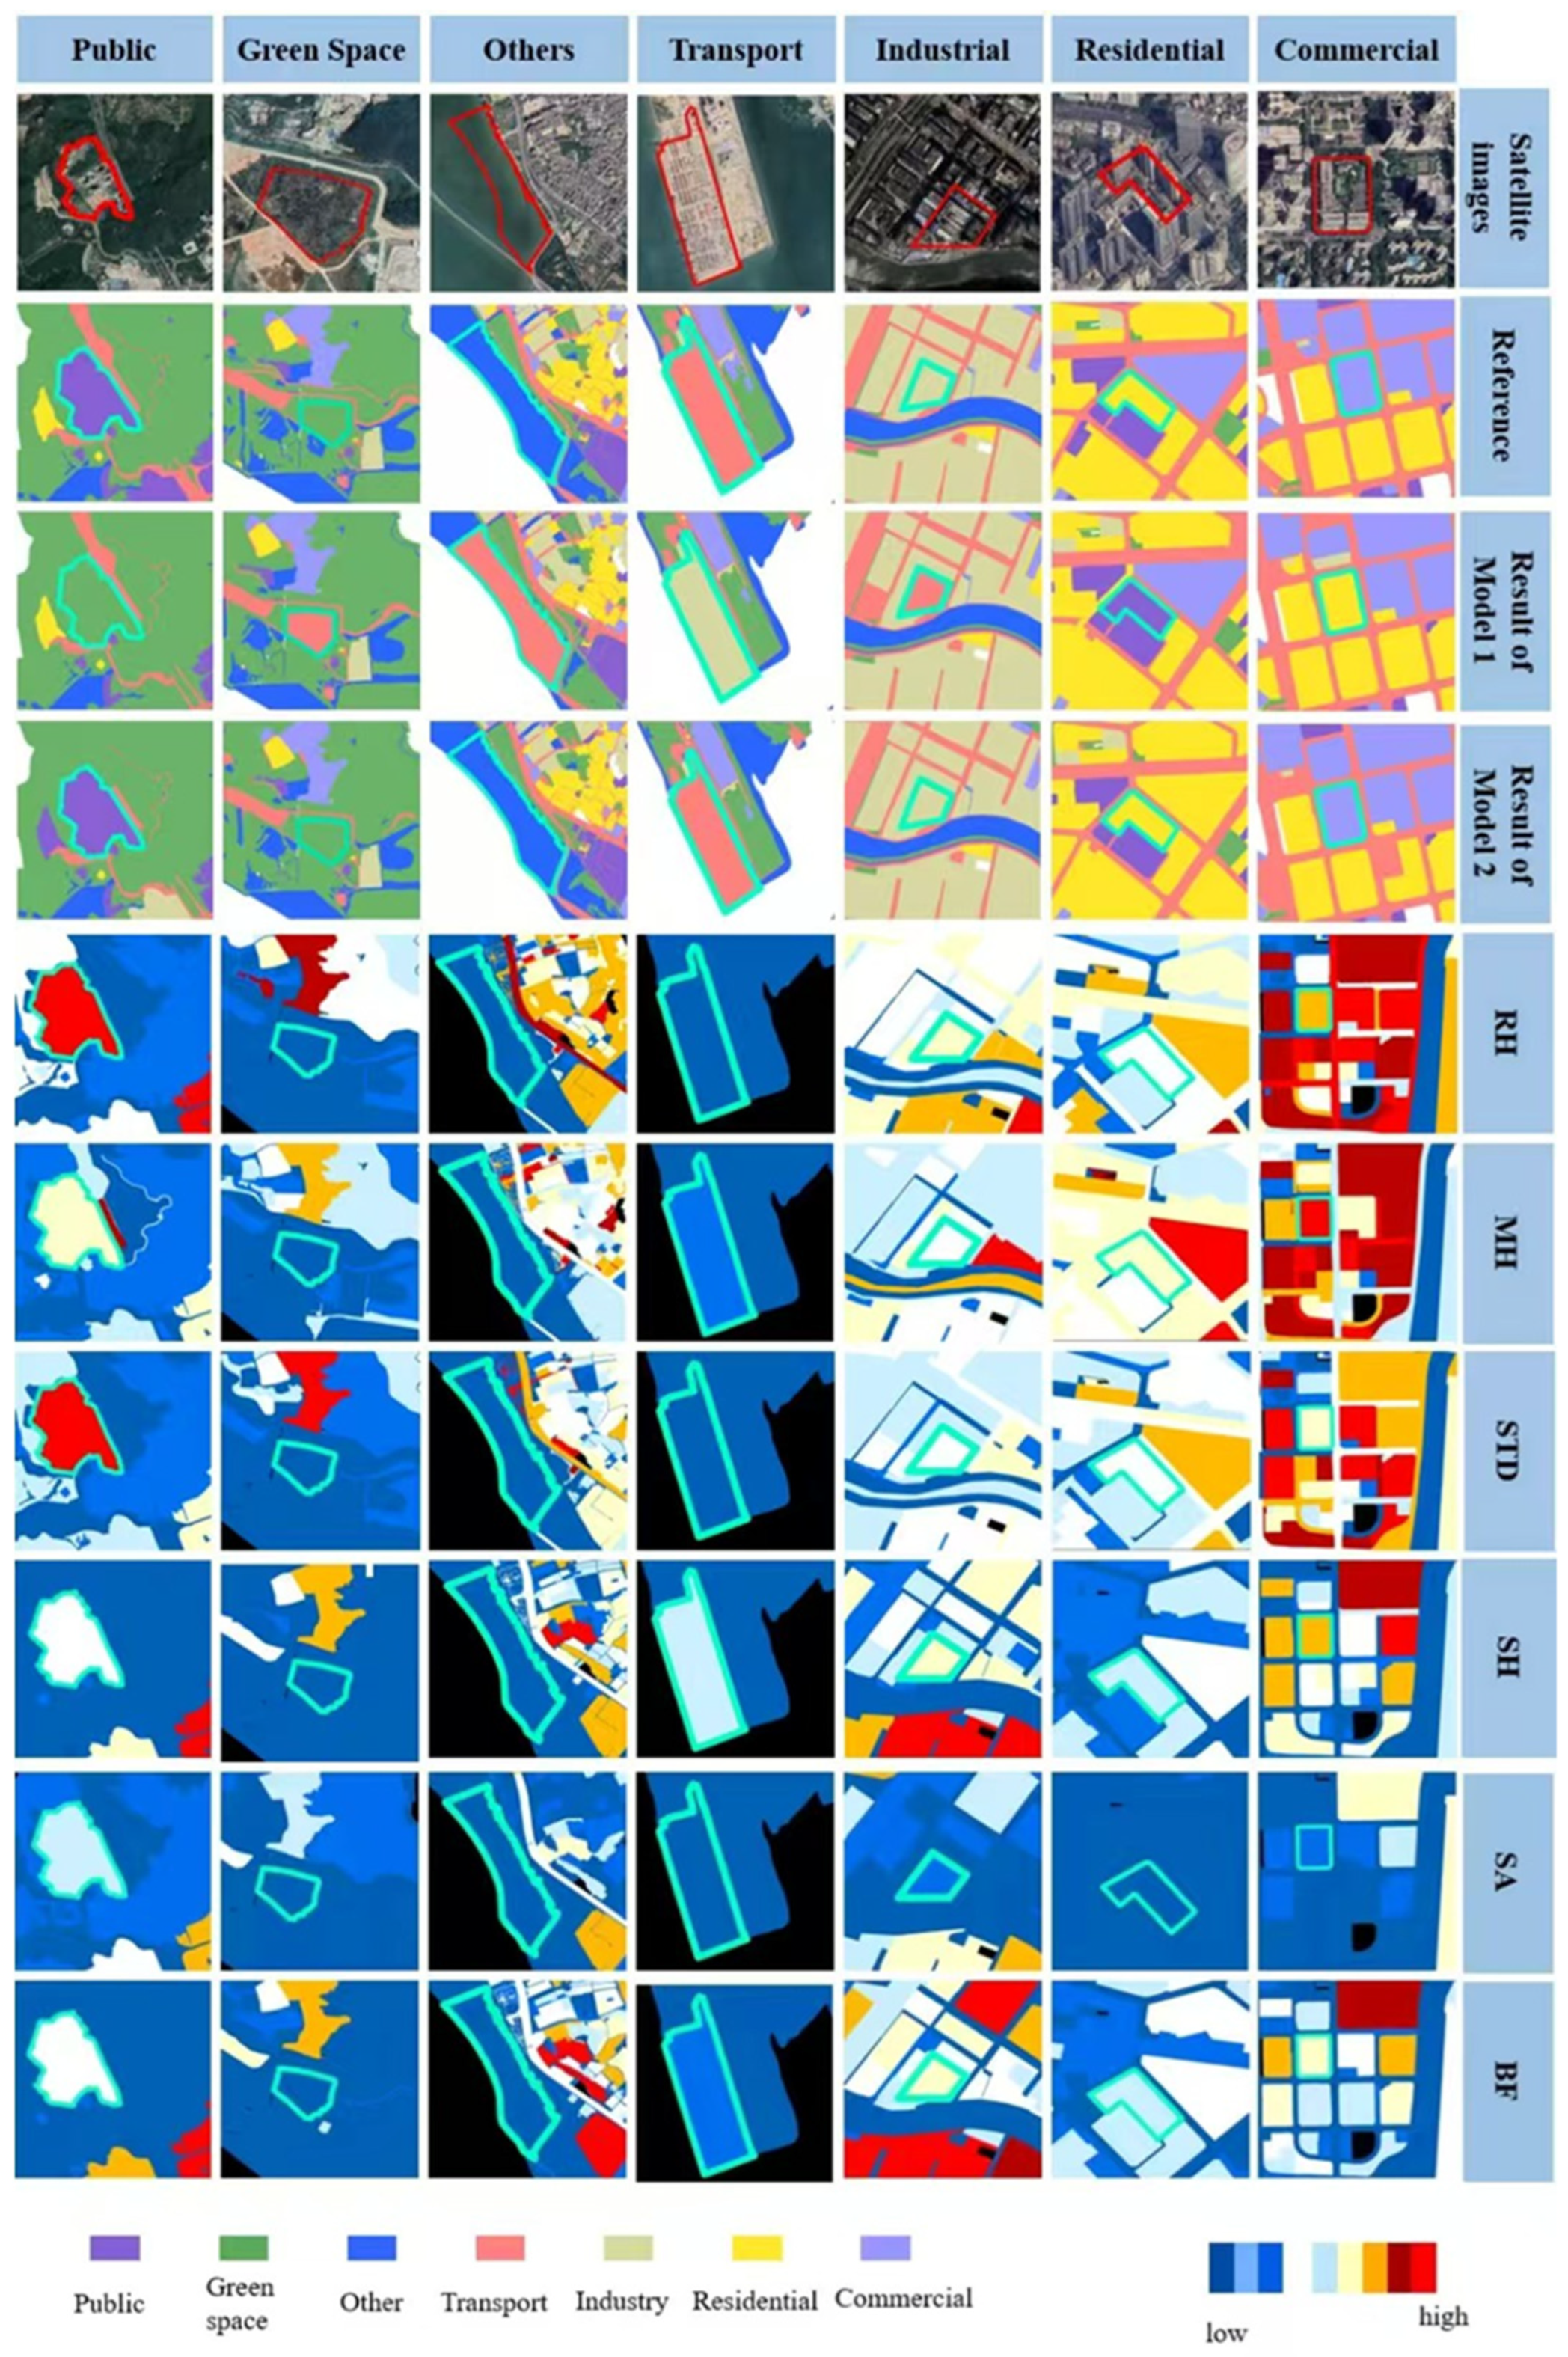
Additionally, to more accurately characterize the spatial form of buildings, we extracted several indicators regarding building height and density to reflect the vertical structure and spatial compactness of urban parcels [28,59]. These indicators include building height range, average height, height standard deviation, total height, total area, and building density. Figure 2 shows the relationship between these factors and land use types. The calculation method for each indicator is shown below.
The range of building heights (RH) is used to measure the heterogeneity of the urban landscape in the vertical direction [60], with larger values indicating a richer hierarchy of built landscapes. This indicator is defined as the height difference between the tallest and the lowest building in the parcel (see Equation (2)).
R H = M A X M I N
where M A X refers to the height of the tallest building in the urban parcel and M I N refers to the height of the shortest building in the urban parcel.
The mean height of buildings (MH) reflects the overall level of building heights within the parcel and is the average of all building heights [61]. This indicator can reflect the general construction intensity of buildings in the area (see Equation (3)).
M H = i = 1 N   H i N
where   H i represents the height of the i-th building and N is the total number of buildings in the urban parcel.
The standard deviation of building height (STD) indicates the degree of fluctuation of building heights within the parcel [62], and it is an important indicator of the degree of confusion of building heights. The larger the standard deviation, the more obvious the difference in building heights in the parcel, reflecting a more complex urban spatial structure (see Equation (4)).
S T D = i = 1 N   H i H ¯ 2 N 1
where   H i represents the height of the i-th building, H ¯ is the average building height, and N is the total number of buildings in the urban parcel.
The sum of building heights (SH) is the sum of the heights of all the buildings in the parcel, which reflects the overall volume of the parcel in vertical space and can also be used to measure the density of urban spatial development (see Equation (5)).
S H = i = 1 N   H i
where   H i represents the height of the i-th building and N is the total number of buildings in the urban parcel.
The sum of building area (SA) is used to measure the total floor area of buildings in a parcel, reflecting the scale of space occupied by buildings in the parcel and the physical intensity of regional development (see Equation (6)).
S A = i = 1 N   A i
where A i refers to the morphology area of the building and N represents the total number of buildings in the urban parcel.
Building coverage (BF) indicates the proportion of space occupied by buildings in the whole parcel and is the core indicator of building density [63]. The larger the value, the more compact the building layout and the higher the degree of development within the parcel. It is defined as the ratio of the total building footprint to the total area of the parcel (see Equation (7)).
B F = S A / A g
where SA refers to the sum of the building area and A g represents the total area of the urban parcel.

2.4. Methodology

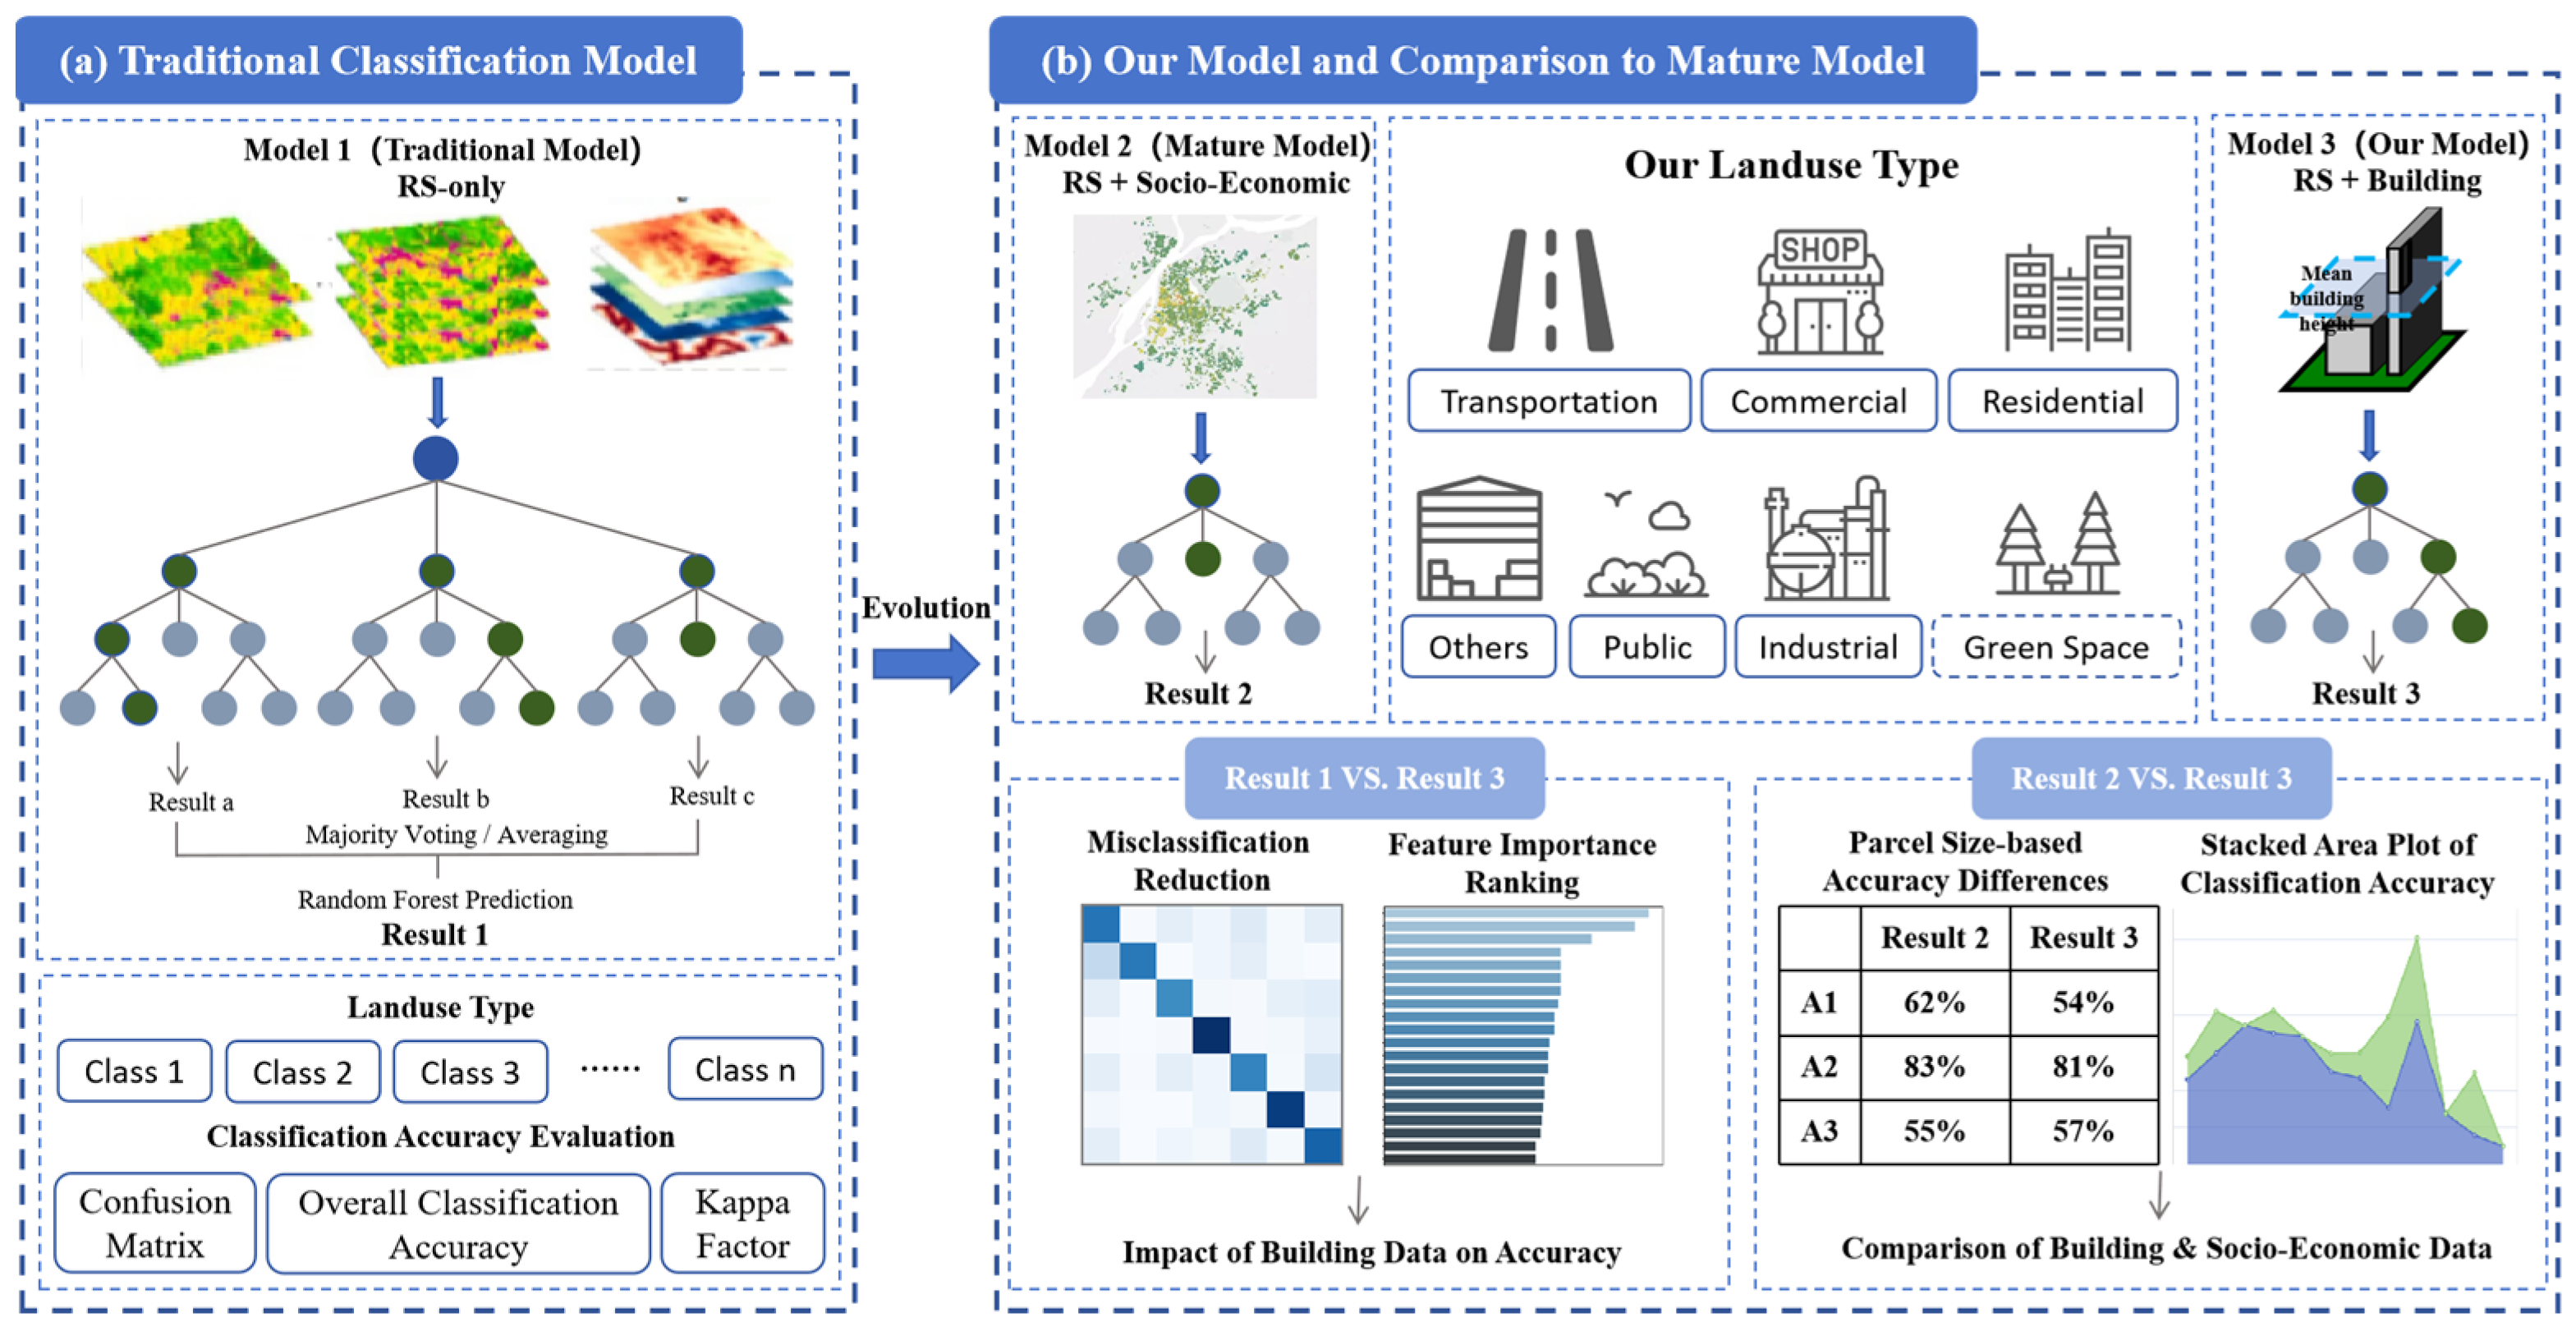
In this study, we proposed an enhanced classification approach by incorporating building morphology features to improve the identification of urban land use (Figure 3). First, we used only RS features with the random forest (RF) classifier to build Model 1 as the baseline model. Second, we integrated building morphology information into Model 1 to develop Model 3 and evaluate the effectiveness of the building data in improving classification accuracy. Finally, we incorporated socio-economic data with remote sensing features to construct Model 2 and compared the model performance with that of Model 3 to explore the potential of building data as a substitute for socio-economic data.

2.4.1. Traditional Classification Model and Accuracy Evaluation

The traditional classification model used multi-source RS data with the RF classifier, which we designated as Model 1. First, we created training and testing sets from RS data by employing the 5-fold cross-validation strategy to reduce the randomness associated with data partitioning. In 5-fold cross-validation, the dataset containing 140,000 parcels was randomly divided into five equal subsets (folds). Each fold served as the testing set once, with the remaining four folds used for training, iterating five times. This method reduced randomness in data partitioning, enhanced model generalizability, and mitigated overfitting by utilizing the entire dataset for both training and testing. It also provided a reliable estimate of model performance by averaging metrics across folds [64]. Second, we employed the random forest (RF) model, implemented with 500 decision trees using the Scikit-learn library in Python 3.11.9, for urban land use classification mapping. As an integrated learning method based on decision trees, RF models have been widely used in land use and cover classification studies with satisfactory performance [65,66]. Finally, we calculated overall accuracy (OA), producer accuracy (PA), and the Kappa coefficient using a confusion matrix to evaluate classification accuracy [67] and assessed the importance scores of each feature to quantify the contribution of different data sources to the classification performance. Here, due to the extreme capacity of the NDVI to identify green spaces, we excluded green areas in the importance assessment of the input feature.

2.4.2. Building Data Classification and Socio-Economic Comparison

To verify the role of building data in land use classification, we designed Model 3 and compared its performance with Model 1. On the one hand, we developed Model 3 by combining building morphological characteristics, such as building height, density, and area, with remote sensing data for classification. On the other hand, we compared the classification results of Model 3 and Model 1 with the same indicators (i.e., OA, PA, and Kappa coefficient) and evaluated the importance of building data input in Model 3 to verify the effectiveness of building data in distinguishing complex functional areas.
We designed Model 2 by integrating socio-economic information into Model 1 and compared the classification result with Model 3 to validate the potential of building data to replace socio-economic data in urban land use mapping. First, we calculated the Euclidean distance for both POI data and road network data using a pixel size of 30 m, consistent with the lowest resolution of the remote sensing data, to represent the spatial pattern of POIs and road accessibility [68]. Second, we combined these socio-economic features with remote sensing data and a random forest (RF) classifier to construct Model 2. Finally, we evaluated the performance of Model 3 and Model 2 in urban land use classification across various spatial area scales and land use category scales to determine the feasibility and advantages of replacing socio-economic data with building data under specific conditions.

3. Results

3.1. Enhancing Urban Land Use Classification with Building Morphology

3.1.1. Classification Results and Evaluation of Accuracy

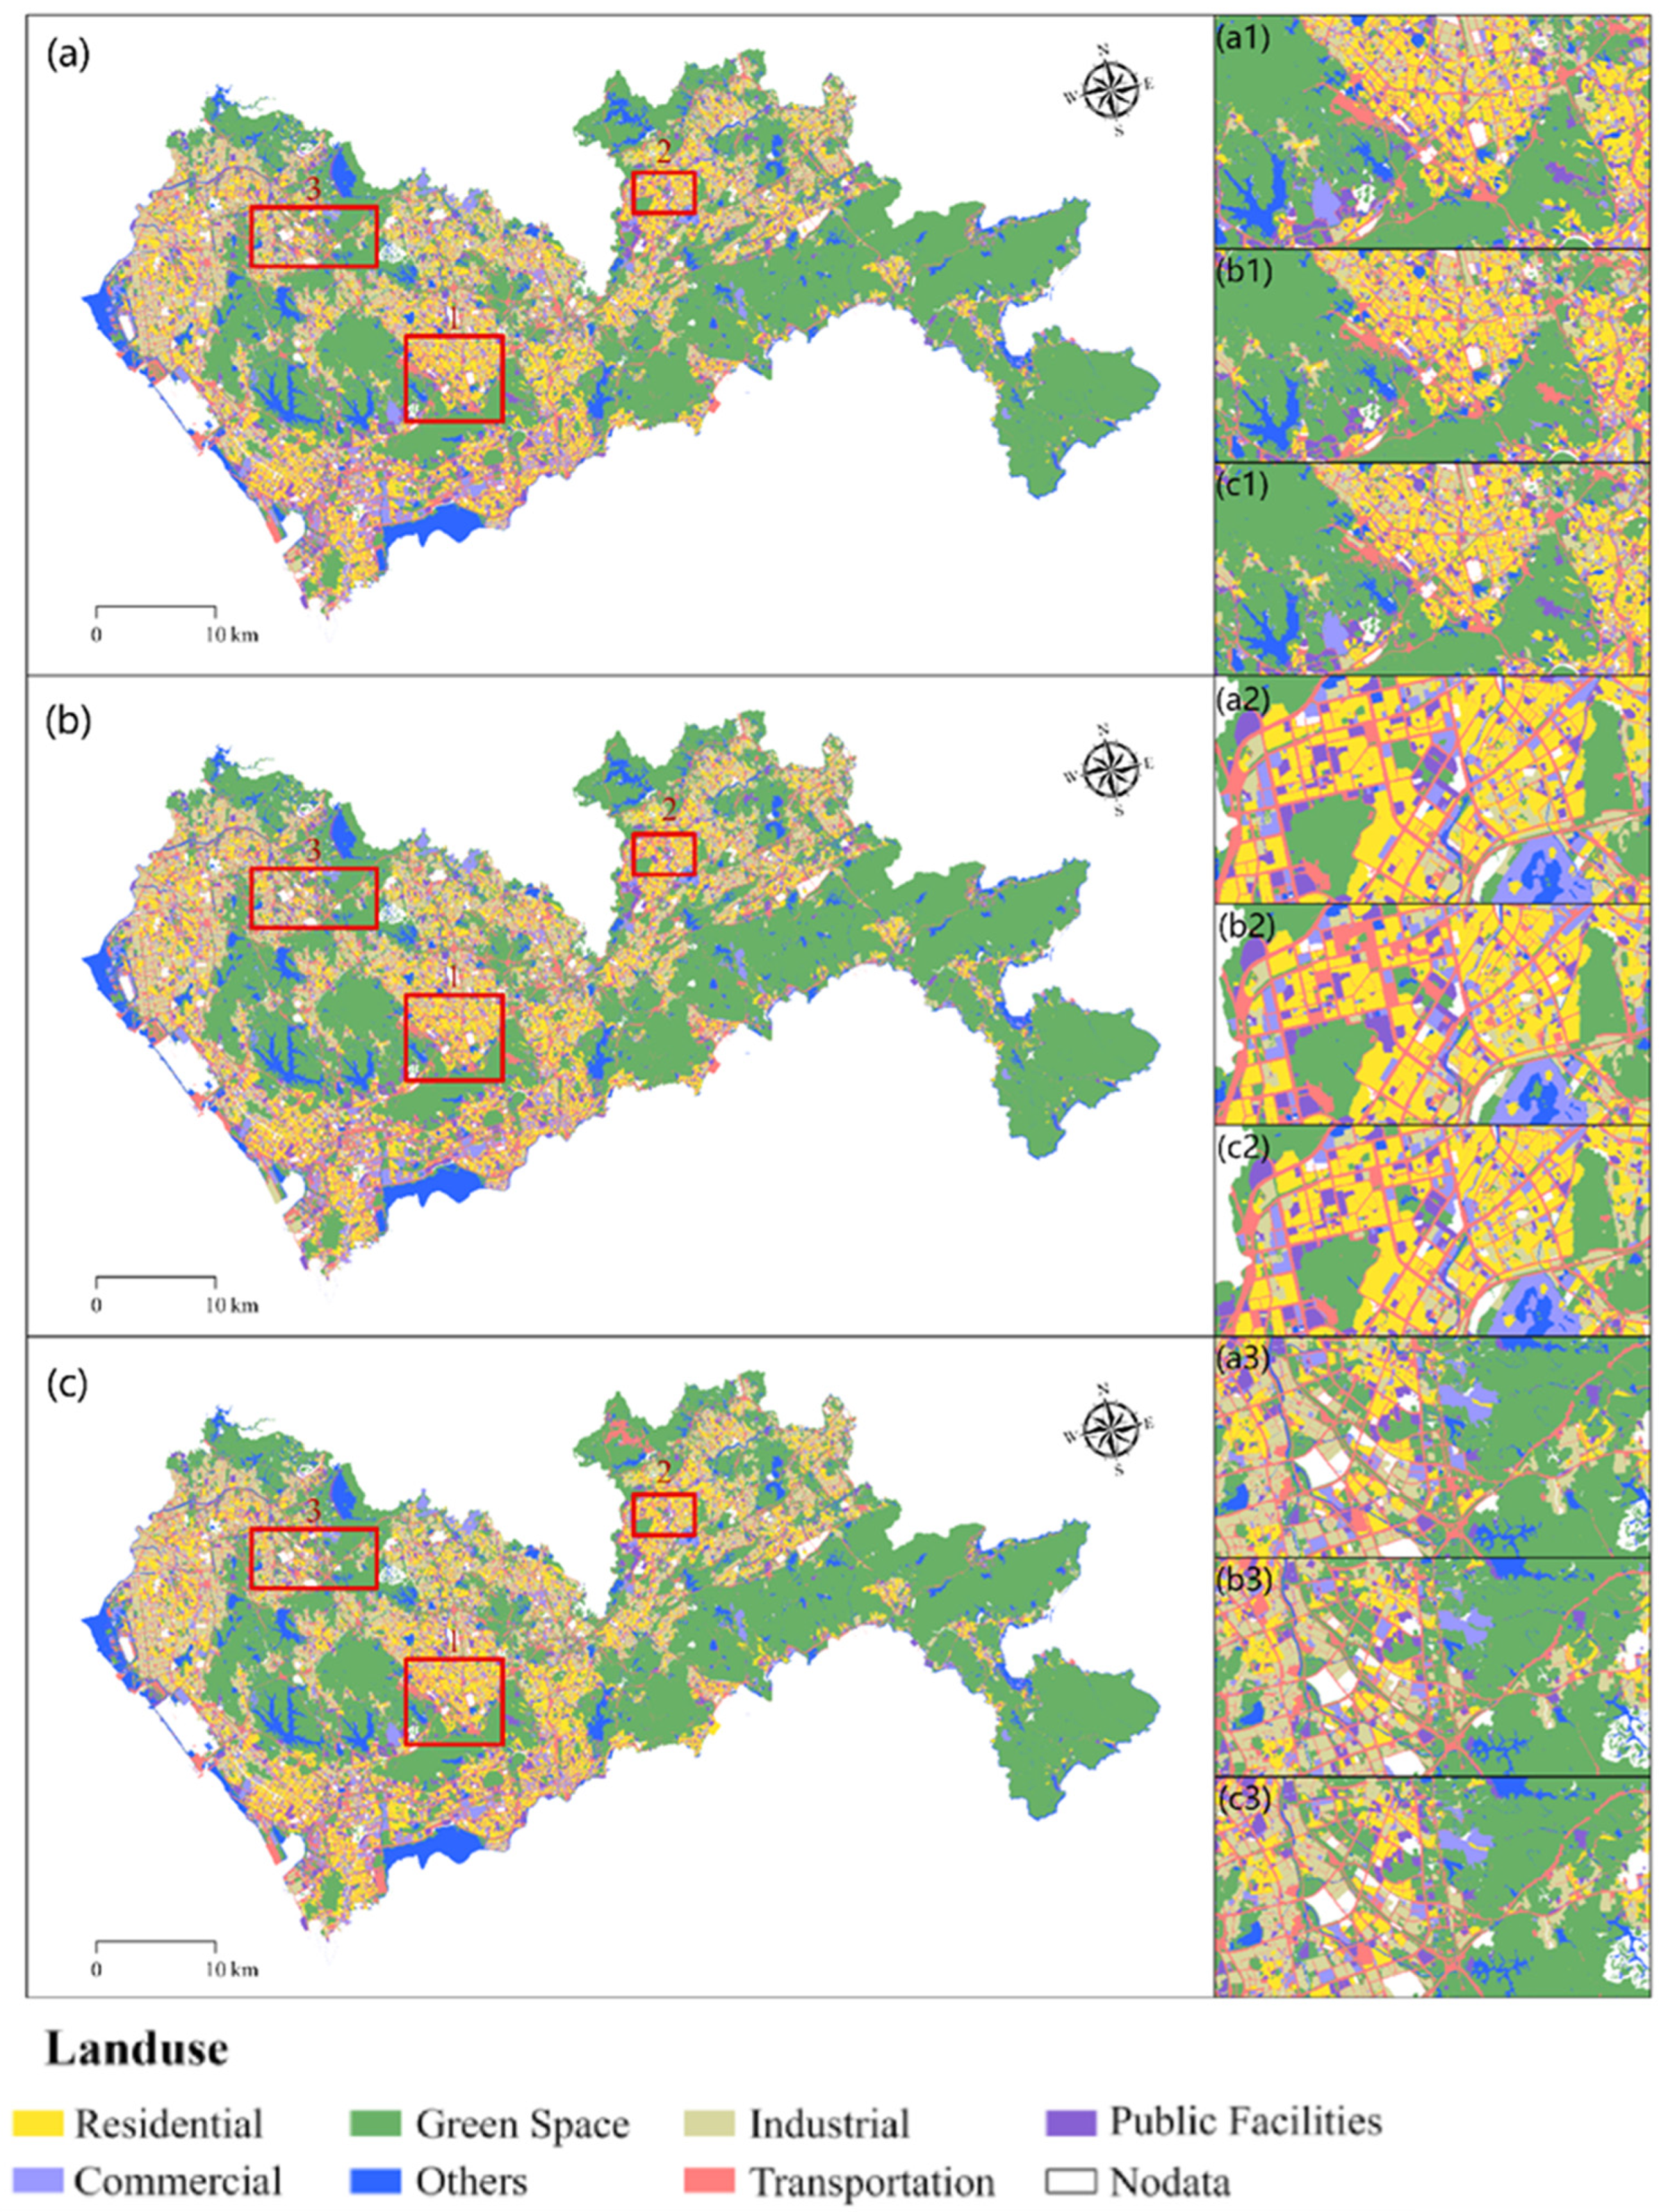
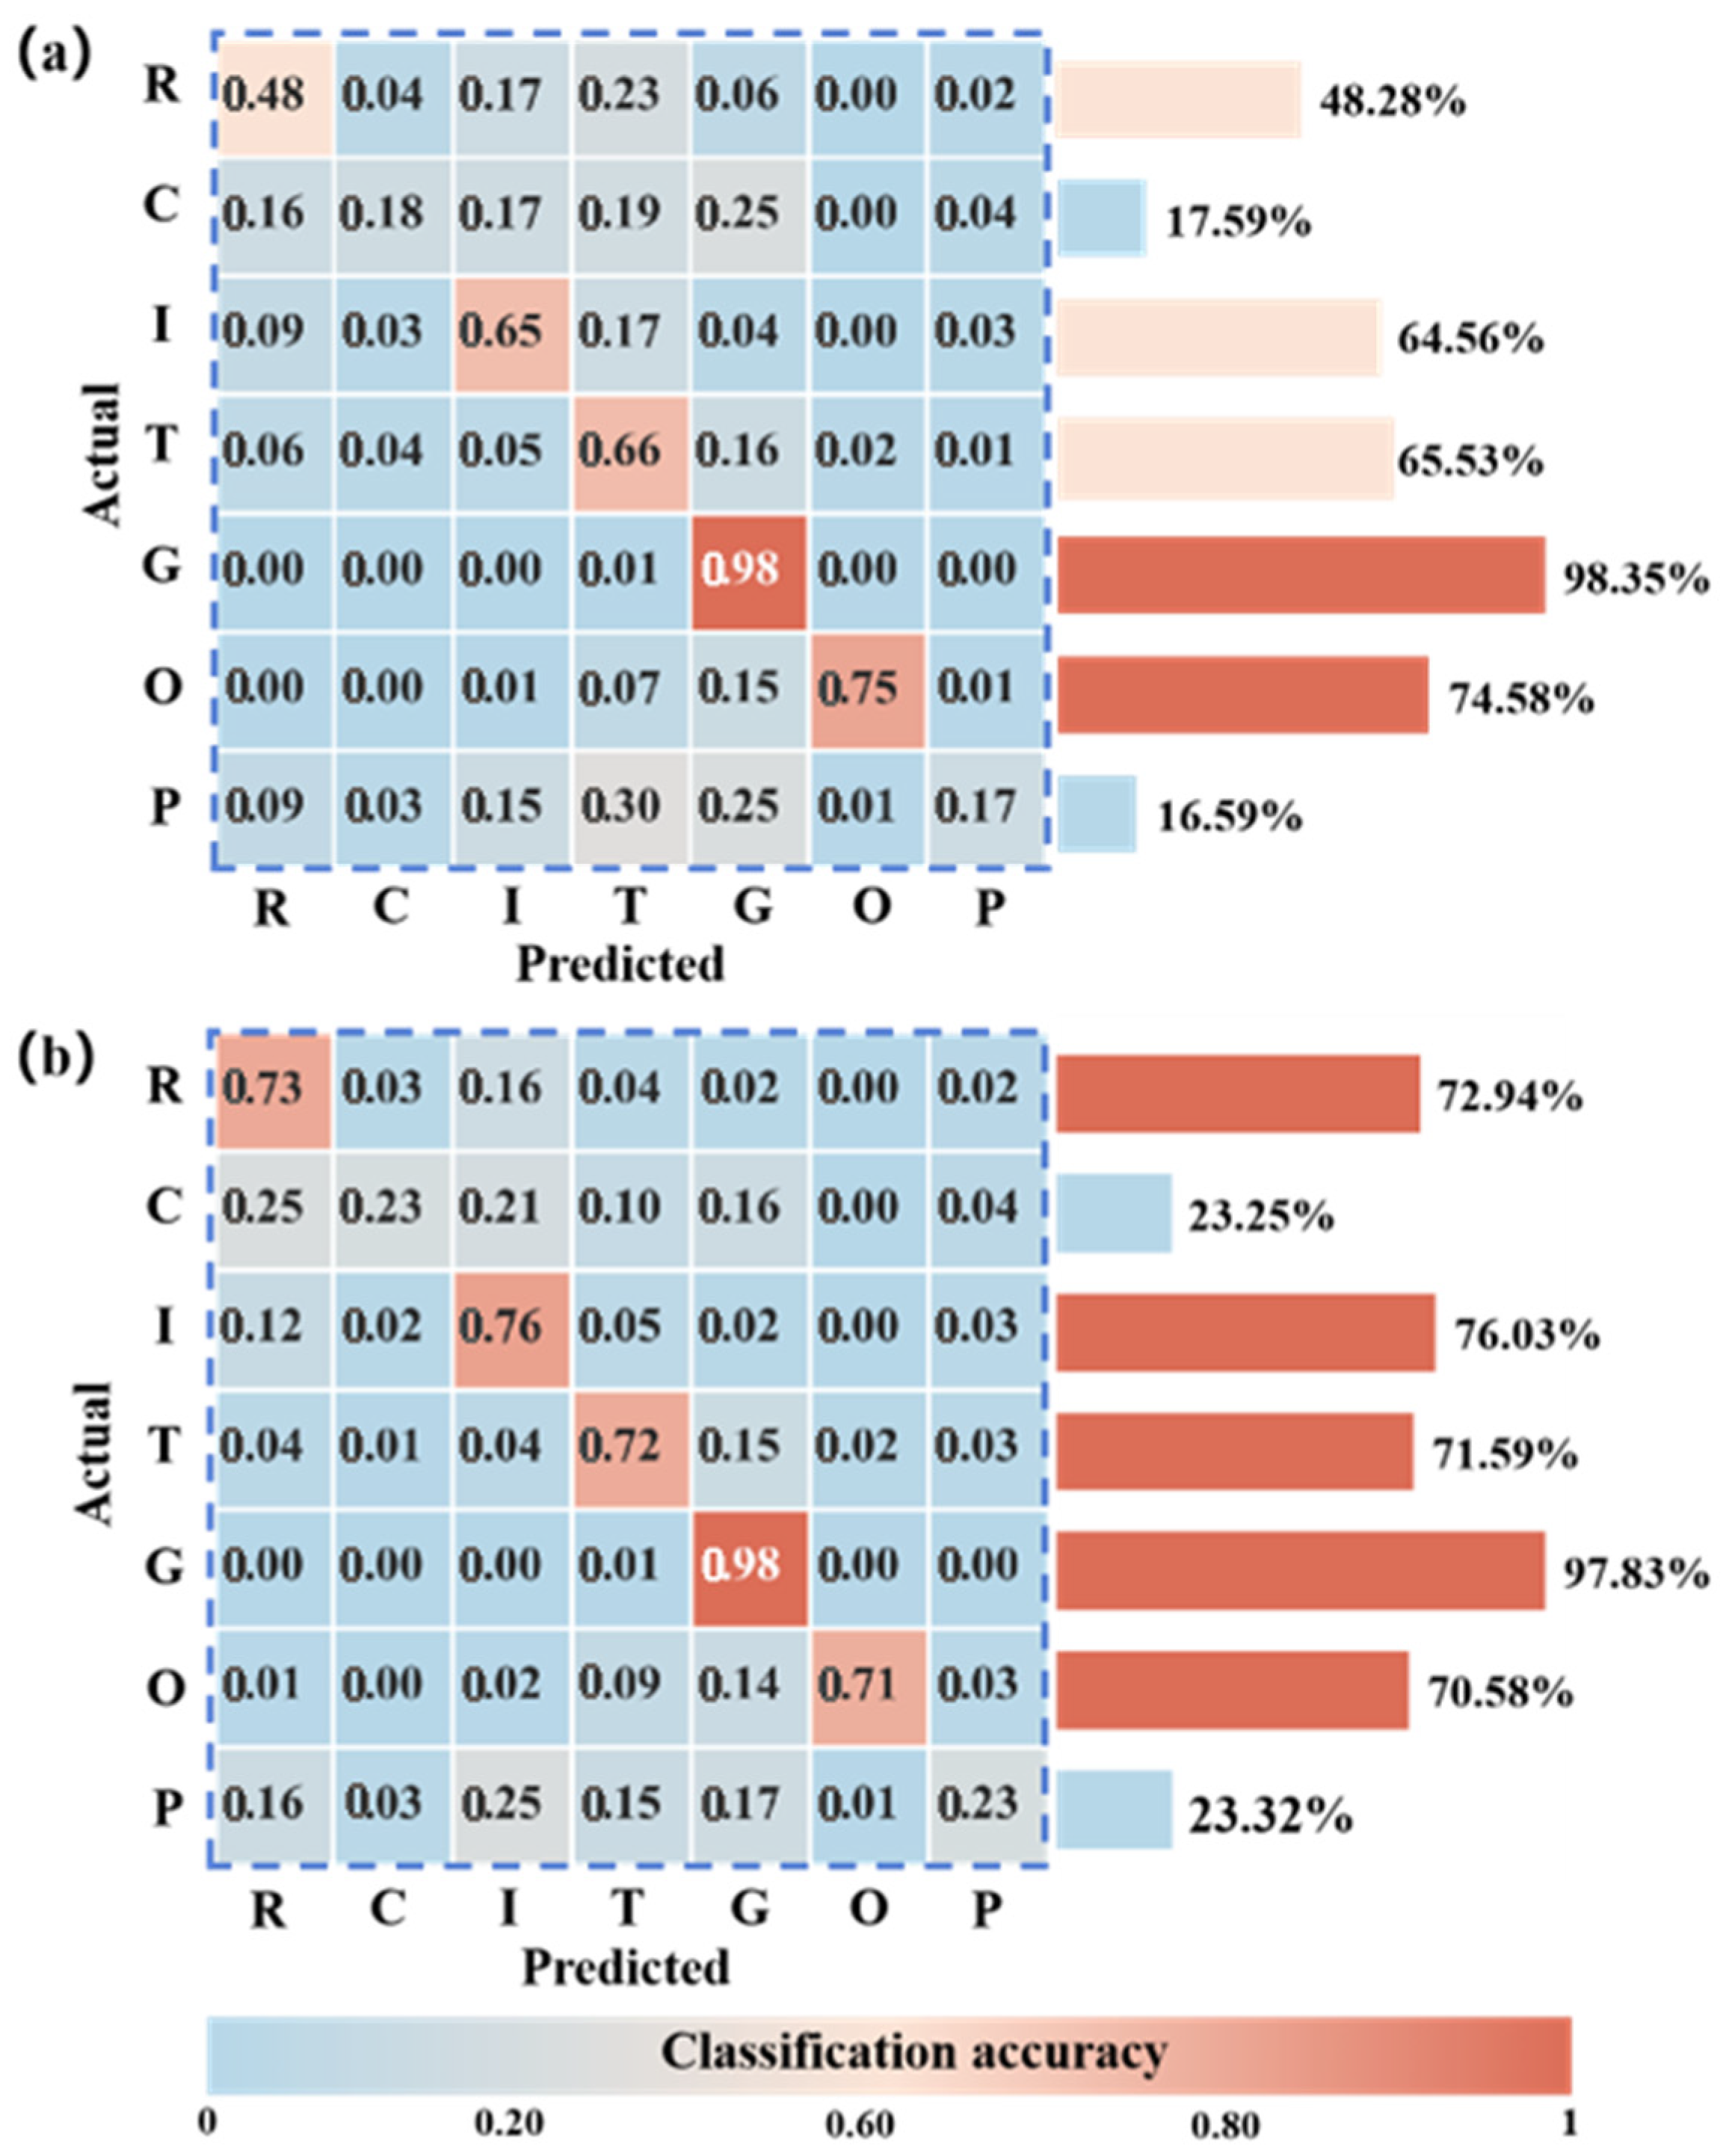
The integration of building morphology data significantly improves the overall accuracy of urban land use classification. The classification results are shown in Figure 4. The result indicated that the classification accuracy increased from 74.56% in Model 1 to 80.09% in Model 3, and the Kappa coefficient increased from 0.70 to 0.77. Specifically, the classification accuracy of the other five types of functional zones was improved, except for green space and other land where buildings are sparse, with the classification accuracy of residential land increasing from 0.48 to 0.73, industrial land increasing from 0.65 to 0.76, and transportation land increasing from 0.77 to 0.83 (Figure 5). Although Model 1 utilized multiple feature indices and radar scattering characteristics extracted from remote sensing data for classification, it remain vulnerable to the mixed pixel effect [69,70]. Building morphology data provide 2D/3D structural characteristics such as building height, density, and spatial distribution, which enable Model 3 to better distinguish the spatial patterns of high-rise buildings in residential areas and low-slung factories in industrial areas (Figure 2), thus significantly enhancing the classification ability [71,72]. In contrast, classification accuracy for green land (G) and other types (O) slightly declined after incorporating building data. Specifically, green space accuracy decreased from 0.98 to 0.97, and other types (O) dropped from 0.75 to 0.71. This decline was mainly due to the sparse or absent building presence in these areas, making building features less informative. Moreover, green space and water bodies can be reliably identified by stable spectral indices (e.g., NDVI and NDWI), and the inclusion of structural data may dilute their dominant contribution in the model, slightly affecting overall performance [73]. Furthermore, an analysis of commission errors for Model 3 reveals the following: residential at 0.27, commercial at 0.52, industrial at 0.24, transportation at 0.28, green space at 0.02, other types at 0.09, and public at 0.55, highlighting varying levels of over-prediction across categories.

3.1.2. Feature Importance Evaluation and Analysis

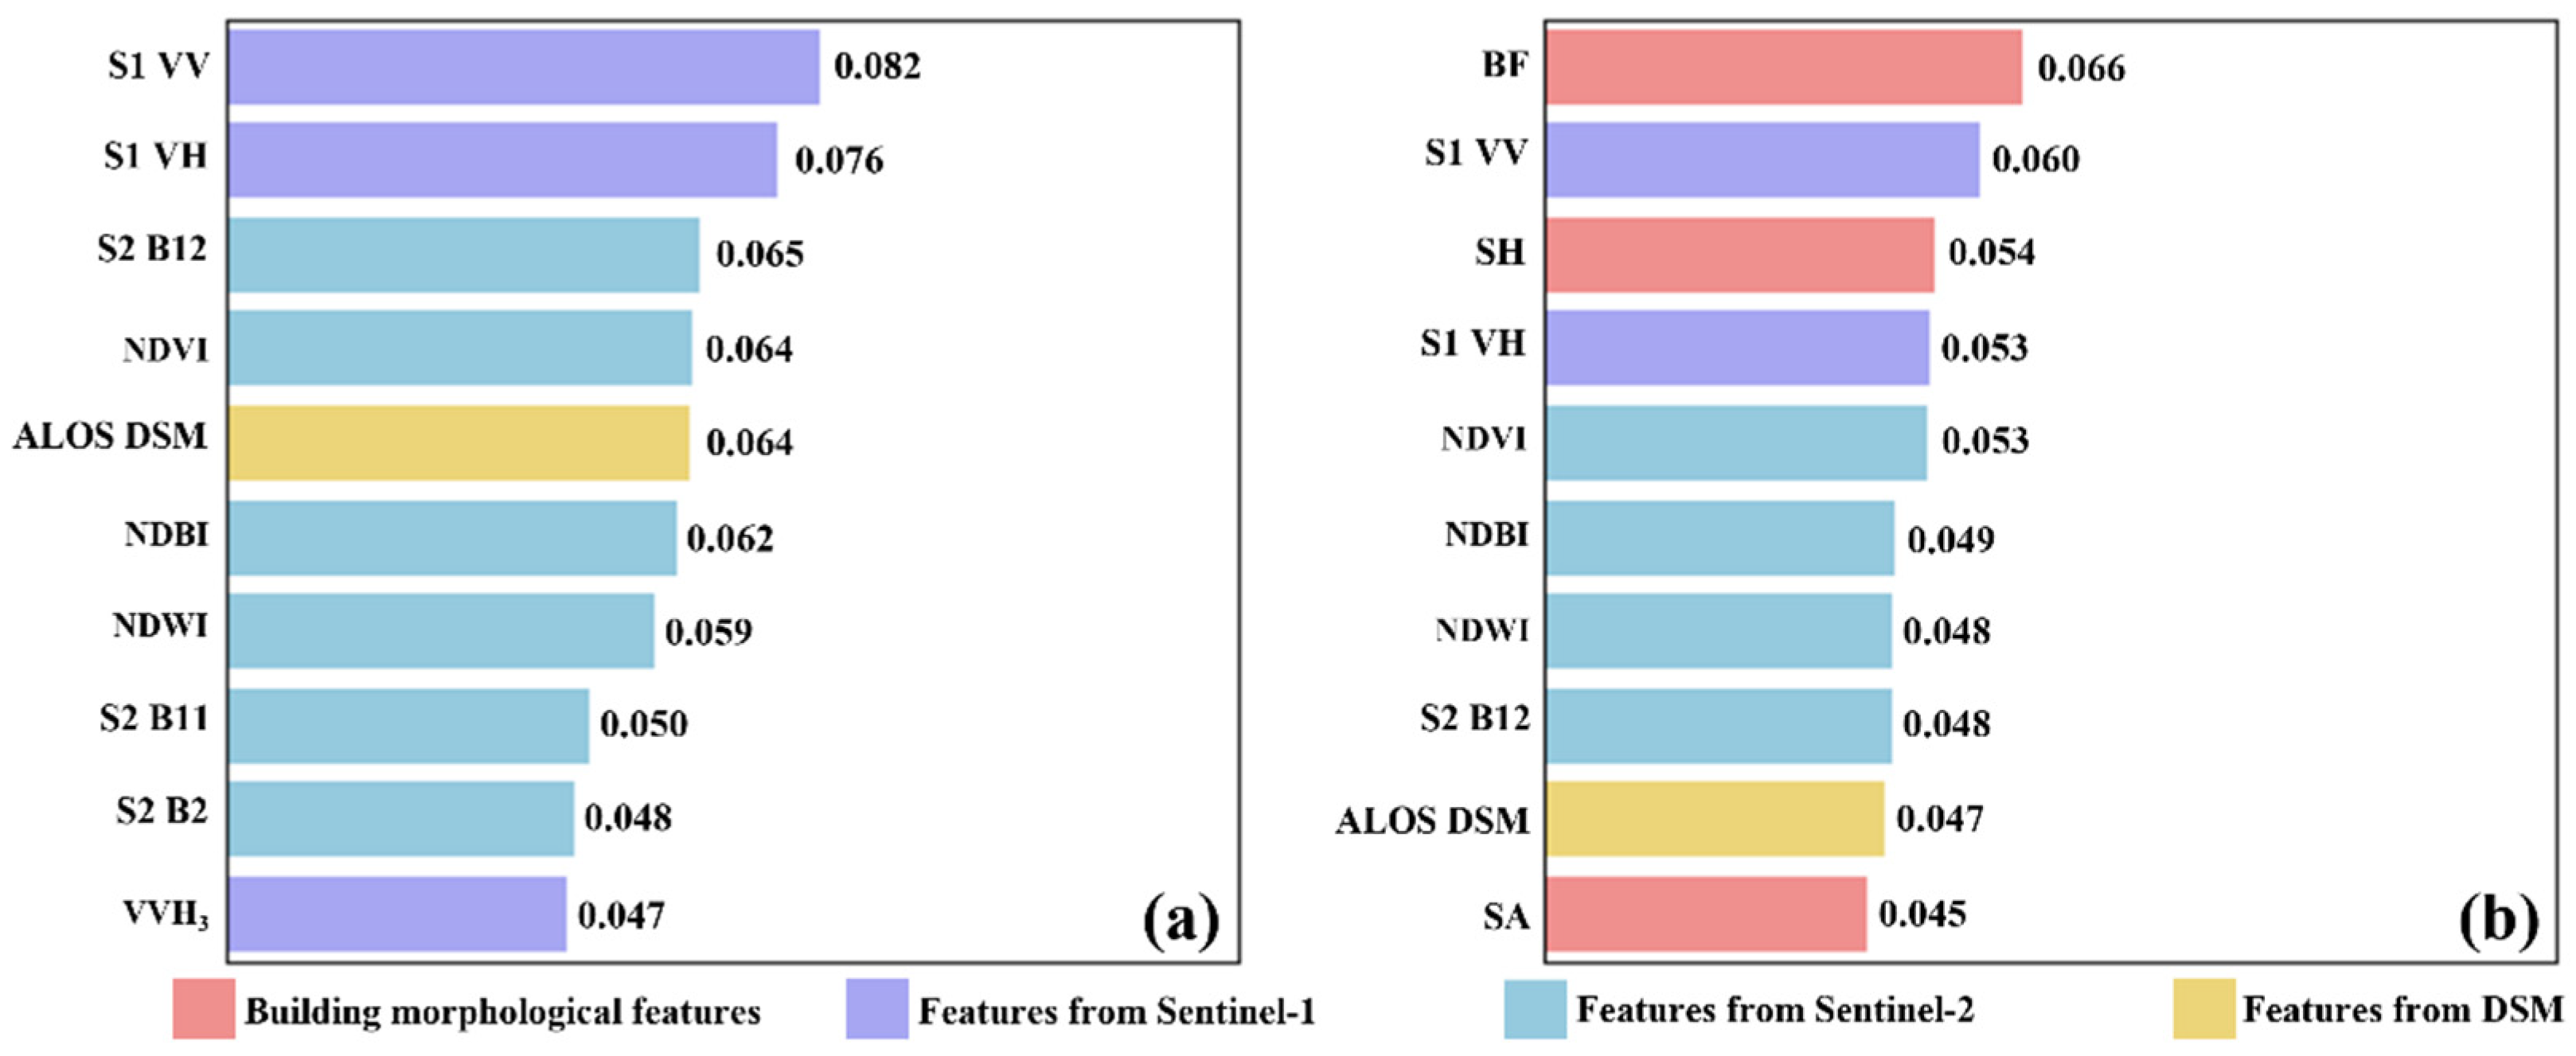
Building morphological characteristics played an important role in urban land use mapping. In Model 1, features derived from Sentinel-1, such as S1 VV and S1 VH, exhibited the highest importance values of 0.082 and 0.076, respectively (Figure 6a). This is because radar backscatter information can capture surface roughness and vertical structures instead of spectral information, offering strong advantages in identifying densely built urban environments [74]. However, building morphological features were highly significant in Model 3, with the BF emerging as the dominant input, holding an importance value of 0.066, followed by SH at 0.054 and SA at 0.045 (Figure 6b). The morphological characteristics provided horizontal and vertical information, improving the land use classification performance of the model. Moreover, building morphological features not only reflect individual building characteristics but also capture the overall spatial distribution patterns of land use types. This spatial pattern information is crucial for distinguishing between densely packed commercial zones and uniformly arranged residential or industrial areas [75].

3.2. Building vs. Socio-Economic Data

3.2.1. Area-Based Comparison

To evaluate the effectiveness of building morphology data and socio-economic data in urban land use classification, an area-based comparison was conducted across different parcel size scales. The performance of building morphology data and socio-economic data in urban land use classification is generally comparable at different parcel size scales, with some scale intervals showing the advantage of building data (see Table 2). For parcels below the 10th percentile in area, classification accuracy was low for both models, with Model 3 achieving 59.94% and Model 2 reaching 60.65% due to the difficulty of categorizing small parcels [76]. For parcels below the 20th and 33rd percentiles in area, Model 3 achieves accuracies of 60.06% and 60.52%, respectively, compared to 58.25% and 56.77% for Model 2. This phenomenon indicated that Model 3 achieved a more significant improvement than Model 2 in parcel areas between the 10th to 33rd percentile range, where building morphology data leverage clear spatial configurations to outperform socio-economic data, which lack the same level of spatial specificity [77,78]. For larger parcels (above the 67th, 80th, and 90th percentiles), Model 3 yields accuracies of 81.93%, 82.86%, and 85.15%, slightly surpassing Model 2’s accuracies of 80.96%, 82.38%, and 84.49%. Both models perform well in these larger parcels due to their distinct and uniform land use patterns, which facilitate classification [79]. The clear delineation of functions in these areas allows both building morphology and socio-economic data to effectively capture relevant characteristics, resulting in comparable performance with only a minor difference in accuracy.

3.2.2. Category-Based Comparison

Building morphology data showed strong potential to replace socio-economic data in urban land use classification. Model 3 achieved comparable or superior performance to Model 2 across the seven land use categories (Figure 7). Specifically, Model 3 outperformed Model 2 in residential and industrial areas, achieving accuracies of 73% and 76% compared to 63% and 75%. The superior performance in residential and industrial areas is mainly attributed to the clear differences in building density, height, and spatial organization among these categories [31], which enables building morphology features to effectively capture the functional distinctions [30]. As shown in the Sankey diagram, the flow confusion between these categories was significantly reduced after incorporating building data, confirming its effectiveness in complex functional regions. However, both models exhibited relatively low classification accuracy in commercial and public service areas. Model 3 achieved an accuracy of 23% for both commercial and public areas, slightly higher than the 21% accuracy observed with Model 2. On the one hand, commercial zones are often embedded within or adjacent to residential areas, taking the form of ground-floor retail or street-facing small shops. Their building morphology resembles those of surrounding residential buildings, leading to frequent misclassification [80]. On the other hand, public service land (e.g., schools, hospitals, administrative centers) is highly heterogeneous, often comprising a mix of greenery, open space, and built structures. Such functional diversity, along with vague boundaries, increases confusion with green space, transportation, or other land use categories, especially in high-density urban environments [81]. Moreover, many public facilities incorporate landscape design and large vegetated areas, which may resemble actual green spaces in spectral and structural characteristics, further reducing classification precision. Here, Model 3 achieved an accuracy of 71% for transportation areas, slightly lower than the 74% attained by Model 2. Both models performed similarly in green spaces, with 97% and 98% accuracies, respectively. This may be because these categories inherently exhibit distinct and stable physical characteristics, such as consistent vegetation patterns or linear infrastructure [82], making them easier to classify regardless of the input data type. Overall, building morphology data provide a robust and scalable alternative to socio-economic data, especially for urban land categories with complex three-dimensional spatial structures [83].

4. Discussion

We evaluated the performance of the proposed models, and Model 3 demonstrates the highest performance, with an overall accuracy of 80.09% and a Kappa coefficient of 0.77 (Figure S2). In comparison, Model 1 achieves an accuracy of 74.56% and a Kappa coefficient of 0.70, while Model 2 reaches 79.56% accuracy and a Kappa coefficient of 0.76. However, the integration of building morphology features raises considerations regarding multicollinearity, as correlations between variables may lead to redundancy. We assessed this using the Pearson correlation coefficient (|r|), where |r| > 0.8 indicates high multicollinearity [84]. The result indicated that most feature pairs show limited correlation, except for BF-SH and RH-STD (Figure S3). Moreover, for the random forest model, the impact of multicollinearity on stability is minimal, as its robustness stems from random feature selection and averaging across decision trees, ensuring that correlated features do not significantly affect predictive performance or stability [85]. Therefore, the selection of these parameters does not pose significant issues.
Although integrating building morphology data has significantly improved urban land use classification accuracy, we acknowledged that there are still some limitations. A key challenge is the classification of multi-functional parcels, where parcels often combine multiple land use types, such as commercial, residential, or public use, leading to potential errors when assigning a single category [86]. Additionally, the reliance on building morphology data limits adaptability to informal settlements and unconventional structures, such as slums, temporary structures, or unplanned developments. These areas often feature unique land use patterns but lack standard morphological indicators, resulting in misclassification or omission due to irregular layouts and diverse or absent building structures [87]. For example, in a slum area, there may be no formal buildings, yet the area serves as a residential function. Despite the absence of typical building structures, these areas are densely populated and used for housing, yet they may be misclassified as non-residential or overlooked entirely due to the lack of recognizable morphological features in satellite imagery or urban datasets.
Building morphology data has great potential for long-term urban land use mapping due to its fine spatial resolution and stronger temporal continuity [88,89]. First, future research could further integrate high-resolution nighttime light data (e.g., SDGSAT-1 glimmer imagery) into Model 3 to capture functional activity better and improve differentiation in the challenging areas (i.e., commercial and public service areas) [90,91]. Second, building morphological data is publicly available globally, making it feasible to apply the proposed methodology consistently across different regions [53]. Unlike socio-economic data, which are often incomplete, inconsistent, or completely unavailable in less developed areas [92], building morphological data provide broader coverage and help overcome spatial data inequalities in global urban research. Third, building morphological data are more suitable for temporal analysis because they are derived from remote sensing imagery, which offers consistent, frequent, and large-scale observations over time. This enables the construction of robust time series for monitoring urban dynamics [93]. In contrast, socio-economic data are typically static, aggregated, and irregularly updated, limiting their applicability in dynamic urban monitoring [94]. Finally, unlike the current single-label classification, which assigns one land use label per parcel, multi-label methods allow for the simultaneous identification of multiple land use categories within a single parcel, better reflecting the heterogeneity of real-world urban settings [95]. Future research could explore multi-label classification approaches to address the complexity of mixed land use mapping.

5. Conclusions

In this study, we proposed a framework to evaluate the effectiveness of building morphological features in urban land use mapping. Specifically, we compared the classification performance of three models (i.e., Model 1, Model 2, and Model 3) to assess the impact of building morphology in improving classification accuracy and explore its potential as a substitute for socio-economic data in urban land use classification. The main findings include the following: (1) the integration of building morphology data significantly enhanced urban land use classification accuracy compared to the baseline Model 1. (2) The BF and SH demonstrated great importance in urban land use classification. (3) Model 3 achieved comparable results to Model 2 across various scales, indicating that building morphology data has significant potential for replacing socio-economic data in urban land use mapping.

Supplementary Materials

The following supporting information can be downloaded at: https://www.mdpi.com/article/10.3390/rs17162811/s1, Figure S1: Building morphology data of different land use categories; Figure S2: Confusion matrix of classification accuracy for different models; Figure S3: confusion matrix of Pearson correlation coefficient for building morphology features; Table S1: Types of road network data; Table S2: Land Use Aggregation.

Author Contributions

Methodology, J.Z., F.S., Y.W., T.C. and X.L.; formal analysis, J.Z., F.S., Y.W., T.C. and X.L.; data curation, J.Z., F.S., Y.W., T.C. and X.L.; writing—original draft, J.Z., F.S., Y.W. and T.C.; writing—review and editing, J.Z., F.S., Y.W., T.C., X.L., X.T., T.H., S.Z., H.L., J.W. and M.S.; supervision, X.L.; funding acquisition, X.L. Although only two authors are listed as equal contributors, Y.W. played a critical role in the study’s design and execution, and their contribution was comparable in scope and significance. All authors have read and agreed to the published version of the manuscript.

Funding

This study was supported by the Open Fund of Key Laboratory of Urban Land Resources Monitoring and Simulation, Ministry of Natural Resources, the National Natural Science Foundation of China (42101418, 42371413, and 42301461), the National Natural Science Foundation of China/RGC Joint Research Scheme (42361164614 and N_HKU722/23), the Chinese University Scientific Fund, and the 2115 Talent Development Program of China Agricultural University.

Data Availability Statement

Data will be made available upon request.

Conflicts of Interest

The authors declare that they have no known competing financial interests or personal relationships that could have appeared to influence the work reported in this paper.

References

  1. Chaturvedi, V.; de Vries, W.T. Machine learning algorithms for urban land use planning: A review. Urban Sci. 2021, 5, 68. [Google Scholar] [CrossRef]
  2. De La Fuente, B.; Bertzky, B.; Delli, G.; Mandrici, A.; Conti, M.; Florczyk, A.J.; Freire, S.; Schiavina, M.; Bastin, L.; Dubois, G. Built-up areas within and around protected areas: Global patterns and 40-year trends. Glob. Ecol. Conserv. 2020, 24, e01291. [Google Scholar] [CrossRef] [PubMed]
  3. Kohlhase, J.E. The new urban world 2050: Perspectives, prospects and problems. Reg. Sci. Policy Pract. 2013, 5, 153–166. [Google Scholar] [CrossRef]
  4. Liu, Y.; Fang, F.; Li, Y. Key issues of land use in China and implications for policy making. Land Use Policy 2014, 40, 6–12. [Google Scholar] [CrossRef]
  5. Li, X.; Zhou, Y.; Hejazi, M.; Wise, M.; Vernon, C.; Iyer, G.; Chen, W. Global urban growth between 1870 and 2100 from integrated high resolution mapped data and urban dynamic modeling. Commun. Earth Environ. 2021, 2, 201. [Google Scholar] [CrossRef]
  6. Li, X.S. Rapid Global Urbanization. In Building Digital Twin Metaverse Cities: Revolutionizing Cities with Emerging Technologies; Springer: Berlin/Heidelberg, Germany, 2024; pp. 3–6. [Google Scholar]
  7. He, W.; Yang, J.; Li, X.; Sang, X.; Xie, X. Research on the interactive relationship and the optimal adaptation degree between land use benefit and industrial structure evolution: A practical analysis of Jiangsu province. J. Clean. Prod. 2021, 303, 127016. [Google Scholar] [CrossRef]
  8. Chen, B.; Xu, B.; Gong, P. Mapping essential urban land use categories (EULUC) using geospatial big data: Progress, challenges, and opportunities. Big Earth Data 2021, 5, 410–441. [Google Scholar] [CrossRef]
  9. Lang, W.; Long, Y.; Chen, T. Rediscovering Chinese cities through the lens of land-use patterns. Land Use Policy 2018, 79, 362–374. [Google Scholar] [CrossRef]
  10. Sun, Z.; Peng, Z.; Yu, Y.; Jiao, H. Deep convolutional autoencoder for urban land use classification using mobile device data. Int. J. Geogr. Inf. Sci. 2022, 36, 2138–2168. [Google Scholar] [CrossRef]
  11. Stefanov, W.L.; Ramsey, M.S.; Christensen, P.R. Monitoring urban land cover change: An expert system approach to land cover classification of semiarid to arid urban centers. Remote Sens. Environ. 2001, 77, 173–185. [Google Scholar] [CrossRef]
  12. Gong, P.; Chen, B.; Li, X.; Liu, H.; Wang, J.; Bai, Y.; Chen, J.; Chen, X.; Fang, L.; Feng, S. Mapping essential urban land use categories in China (EULUC-China): Preliminary results for 2018. Sci. Bull. 2020, 65, 182–187. [Google Scholar] [CrossRef]
  13. Li, Z.; Chen, B.; Wu, S.; Su, M.; Chen, J.M.; Xu, B. Deep learning for urban land use category classification: A review and experimental assessment. Remote Sens. Environ. 2024, 311, 114290. [Google Scholar] [CrossRef]
  14. Hu, S.; Wang, L. Automated urban land-use classification with remote sensing. Int. J. Remote Sens. 2013, 34, 790–803. [Google Scholar] [CrossRef]
  15. Okujeni, A.; Canters, F.; Cooper, S.D.; Degerickx, J.; Heiden, U.; Hostert, P.; Priem, F.; Roberts, D.A.; Somers, B.; van der Linden, S. Generalizing machine learning regression models using multi-site spectral libraries for mapping vegetation-impervious-soil fractions across multiple cities. Remote Sens. Environ. 2018, 216, 482–496. [Google Scholar] [CrossRef]
  16. Weng, Q.; Hu, X.; Liu, H. Estimating impervious surfaces using linear spectral mixture analysis with multitemporal ASTER images. Int. J. Remote Sens. 2009, 30, 4807–4830. [Google Scholar] [CrossRef]
  17. Latty, R.; Nelson, R.; Markham, B.; Williams, D.; Toll, D. Performance comparisons between information extraction techniques using variable spatial resolution data. Photogramm. Eng. Remote Sens. 1985, 51, 1459–1470. [Google Scholar]
  18. Hsieh, P.-F.; Lee, L.C.; Chen, N.-Y. Effect of spatial resolution on classification errors of pure and mixed pixels in remote sensing. IEEE Trans. Geosci. Remote Sens. 2001, 39, 2657–2663. [Google Scholar] [CrossRef]
  19. Andrade, R.; Alves, A.; Bento, C. POI mining for land use classification: A case study. ISPRS Int. J. Geo-Inf. 2020, 9, 493. [Google Scholar] [CrossRef]
  20. Johnson, B.A.; Iizuka, K. Integrating OpenStreetMap crowdsourced data and Landsat time-series imagery for rapid land use/land cover (LULC) mapping: Case study of the Laguna de Bay area of the Philippines. Appl. Geogr. 2016, 67, 140–149. [Google Scholar] [CrossRef]
  21. Grippa, T.; Georganos, S.; Zarougui, S.; Bognounou, P.; Diboulo, E.; Forget, Y.; Lennert, M.; Vanhuysse, S.; Mboga, N.; Wolff, E. Mapping urban land use at street block level using openstreetmap, remote sensing data, and spatial metrics. ISPRS Int. J. Geo-Inf. 2018, 7, 246. [Google Scholar] [CrossRef]
  22. Hu, T.; Yang, J.; Li, X.; Gong, P. Mapping urban land use by using landsat images and open social data. Remote Sens. 2016, 8, 151. [Google Scholar] [CrossRef]
  23. Bishop, A.; Fast, V.; Nelson, T.; Laberee, K. Crowdsourcing the pedestrian experience: Who’s represented in the data? Spat. Knowl. Inf. 2023, 1. [Google Scholar] [CrossRef]
  24. Zhang, G.; Zhu, A.-X. The representativeness and spatial bias of volunteered geographic information: A review. Ann. Gis 2018, 24, 151–162. [Google Scholar] [CrossRef]
  25. Raifer, M.; Troilo, R.; Kowatsch, F.; Auer, M.; Loos, L.; Marx, S.; Przybill, K.; Fendrich, S.; Mocnik, F.-B.; Zipf, A. OSHDB: A framework for spatio-temporal analysis of OpenStreetMap history data. Open Geospat. Data Softw. Stand. 2019, 4, 3. [Google Scholar] [CrossRef]
  26. Psyllidis, A.; Gao, S.; Hu, Y.; Kim, E.-K.; McKenzie, G.; Purves, R.; Yuan, M.; Andris, C. Points of Interest (POI): A commentary on the state of the art, challenges, and prospects for the future. Comput. Urban Sci. 2022, 2, 20. [Google Scholar] [CrossRef]
  27. Lu, Z.; Im, J.; Rhee, J.; Hodgson, M. Building type classification using spatial and landscape attributes derived from LiDAR remote sensing data. Landsc. Urban Plan. 2014, 130, 134–148. [Google Scholar] [CrossRef]
  28. Che, Y.; Li, X.; Liu, X.; Zhang, X. Characterizing the 3-D structure of each building in the conterminous United States. Sustain. Cities Soc. 2024, 105, 105318. [Google Scholar] [CrossRef]
  29. Zhou, Y.; Li, X.; Chen, W.; Meng, L.; Wu, Q.; Gong, P.; Seto, K.C. Satellite mapping of urban built-up heights reveals extreme infrastructure gaps and inequalities in the Global South. Proc. Natl. Acad. Sci. USA 2022, 119, e2214813119. [Google Scholar] [CrossRef]
  30. Fung, K.Y.; Yang, Z.-L.; Niyogi, D. Improving the local climate zone classification with building height, imperviousness, and machine learning for urban models. Comput. Urban Sci. 2022, 2, 16. [Google Scholar] [CrossRef]
  31. Ma, X.; Zheng, G.; Chi, X.; Yang, L.; Geng, Q.; Li, J.; Qiao, Y. Mapping fine-scale building heights in urban agglomeration with spaceborne lidar. Remote Sens. Environ. 2023, 285, 113392. [Google Scholar] [CrossRef]
  32. Wu, X.; Ou, J.; Wen, Y.; Liu, X.; He, J.; Zhang, J. Developing a data-fusing method for mapping fine-scale urban three-dimensional building structure. Sustain. Cities Soc. 2022, 80, 103716. [Google Scholar] [CrossRef]
  33. Tang, X.; Yu, G.; Li, X.; Taubenböck, H.; Hu, G.; Zhou, Y.; Peng, C.; Liu, D.; Huang, J.; Liu, X. A flexible framework for built-up height mapping using ICESat-2 photons and multisource satellite observations. Remote Sens. Environ. 2025, 318, 114572. [Google Scholar] [CrossRef]
  34. Yuan, B.; Yu, G.; Li, X.; Li, L.; Liu, D.; Guo, J.; Li, Y. Reconstructing Long-Term Synthetic Aperture Radar Backscatter in Urban Domains Using Landsat Time Series Data: A Case Study of Jing–Jin–Ji Region. J. Remote Sens. 2024, 4, 0172. [Google Scholar] [CrossRef]
  35. Li, X.; Zhou, Y.; Gong, P.; Seto, K.C.; Clinton, N. Developing a method to estimate building height from Sentinel-1 data. Remote Sens. Environ. 2020, 240, 111705. [Google Scholar] [CrossRef]
  36. Jhaldiyal, A.; Gupta, K.; Gupta, P.K.; Thakur, P.; Kumar, P. Urban Morphology Extractor: A spatial tool for characterizing urban morphology. Urban Clim. 2018, 24, 237–246. [Google Scholar] [CrossRef]
  37. Labetski, A.; Vitalis, S.; Biljecki, F.; Arroyo Ohori, K.; Stoter, J. 3D building metrics for urban morphology. Int. J. Geogr. Inf. Sci. 2023, 37, 36–67. [Google Scholar] [CrossRef]
  38. Che, Y.; Li, X.; Liu, X.; Xu, X.; Huang, K.; Zhu, P.; Shi, Q.; Chen, Y.; Wu, Q.; Arehart, J.H. Mapping of individual building heights reveals the large gap of urban-rural living spaces in the contiguous US. Innov. Geosci. 2024, 2, 100069-1–100069-9. [Google Scholar] [CrossRef]
  39. Chen, W.; Wu, A.N.; Biljecki, F. Classification of urban morphology with deep learning: Application on urban vitality. Comput. Environ. Urban Syst. 2021, 90, 101706. [Google Scholar] [CrossRef]
  40. Li, F.; Yigitcanlar, T.; Nepal, M.; Nguyen, K.; Dur, F. Machine learning and remote sensing integration for leveraging urban sustainability: A review and framework. Sustain. Cities Soc. 2023, 96, 104653. [Google Scholar] [CrossRef]
  41. Su, M.; Guo, R.; Chen, B.; Hong, W.; Wang, J.; Feng, Y.; Xu, B. Sampling strategy for detailed urban land use classification: A systematic analysis in Shenzhen. Remote Sens. 2020, 12, 1497. [Google Scholar] [CrossRef]
  42. Li, M.; Stein, A.; Bijker, W.; Zhan, Q. Urban land use extraction from Very High Resolution remote sensing imagery using a Bayesian network. ISPRS J. Photogramm. Remote Sens. 2016, 122, 192–205. [Google Scholar] [CrossRef]
  43. Feltynowski, M. Urban green spaces in land-use policy–types of data, sources of data and staff–the case of Poland. Land Use Policy 2023, 127, 106570. [Google Scholar] [CrossRef]
  44. Zhang, W.; Li, W.; Zhang, C.; Hanink, D.M.; Li, X.; Wang, W. Parcel-based urban land use classification in megacity using airborne LiDAR, high resolution orthoimagery, and Google Street View. Comput. Environ. Urban Syst. 2017, 64, 215–228. [Google Scholar] [CrossRef]
  45. Schulz, D.; Yin, H.; Tischbein, B.; Verleysdonk, S.; Adamou, R.; Kumar, N. Land use mapping using Sentinel-1 and Sentinel-2 time series in a heterogeneous landscape in Niger, Sahel. ISPRS J. Photogramm. Remote Sens. 2021, 178, 97–111. [Google Scholar] [CrossRef]
  46. Deus, D. Integration of ALOS PALSAR and Landsat Data for Land Cover and Forest Mapping in Northern Tanzania. Land 2016, 5, 43. [Google Scholar] [CrossRef]
  47. Julzarika, A.; Djurdjani, D. DEM classifications: Opportunities and potential of its applications. J. Degrad. Min. Lands Manag. 2019, 6, 1897. [Google Scholar] [CrossRef]
  48. Sun, J.; Wang, H.; Song, Z.; Lu, J.; Meng, P.; Qin, S. Mapping Essential Urban Land Use Categories in Nanjing by Integrating Multi-Source Big Data. Remote Sens. 2020, 12, 2386. [Google Scholar] [CrossRef]
  49. Zong, L.; He, S.; Lian, J.; Bie, Q.; Wang, X.; Dong, J.; Xie, Y. Detailed Mapping of Urban Land Use Based on Multi-Source Data: A Case Study of Lanzhou. Remote Sens. 2020, 12, 1987. [Google Scholar] [CrossRef]
  50. Estima, J.; Painho, M. Investigating the potential of OpenStreetMap for land use/land cover production: A case study for continental Portugal. In OpenStreetMap in GIScience: Experiences, Research, and Applications; Springer: Cham, Switzerland, 2015; pp. 273–293. [Google Scholar]
  51. Wang, S.; Xu, G.; Guo, Q. Street centralities and land use intensities based on points of interest (POI) in Shenzhen, China. ISPRS Int. J. Geo-Inf. 2018, 7, 425. [Google Scholar] [CrossRef]
  52. Pan, H.; Deal, B.; Chen, Y.; Hewings, G. A reassessment of urban structure and land-use patterns: Distance to CBD or network-based?—Evidence from Chicago. Reg. Sci. Urban Econ. 2018, 70, 215–228. [Google Scholar] [CrossRef]
  53. Che, Y.; Li, X.; Liu, X.; Wang, Y.; Liao, W.; Zheng, X.; Zhang, X.; Xu, X.; Shi, Q.; Zhu, J.; et al. 3D-GloBFP: The first global three-dimensional building footprint dataset. Earth Syst. Sci. Data Discuss. 2024, 2024, 1–28. [Google Scholar] [CrossRef]
  54. Du, S.; Zhang, F.; Zhang, X. Semantic classification of urban buildings combining VHR image and GIS data: An improved random forest approach. ISPRS J. Photogramm. Remote Sens. 2015, 105, 107–119. [Google Scholar] [CrossRef]
  55. Yu, L.; Wang, J.; Li, X.; Li, C.; Zhao, Y.; Gong, P. A multi-resolution global land cover dataset through multisource data aggregation. Sci. China Earth Sci. 2014, 57, 2317–2329. [Google Scholar] [CrossRef]
  56. Xu, F.; Heremans, S.; Somers, B. Urban land cover mapping with Sentinel-2: A spectro-spatio-temporal analysis. Urban Inf. 2022, 1, 8. [Google Scholar] [CrossRef]
  57. Osgouei, P.E.; Kaya, S.; Sertel, E.; Alganci, U. Separating built-up areas from bare land in mediterranean cities using Sentinel-2A imagery. Remote Sens. 2019, 11, 345. [Google Scholar] [CrossRef]
  58. Al-Najjar, H.A.; Kalantar, B.; Pradhan, B.; Saeidi, V.; Halin, A.A.; Ueda, N.; Mansor, S. Land cover classification from fused DSM and UAV images using convolutional neural networks. Remote Sens. 2019, 11, 1461. [Google Scholar] [CrossRef]
  59. Sun, Y.; Zhang, N.; Miao, S.; Kong, F.; Zhang, Y.; Li, N. Urban morphological parameters of the main cities in China and their application in the WRF model. J. Adv. Model. Earth Syst. 2021, 13, e2020MS002382. [Google Scholar] [CrossRef]
  60. Ding, C. Building height restrictions, land development and economic costs. Land Use Policy 2013, 30, 485–495. [Google Scholar] [CrossRef]
  61. Srivastava, S.; Vargas-Muñoz, J.E.; Tuia, D. Understanding urban landuse from the above and ground perspectives: A deep learning, multimodal solution. Remote Sens. Environ. 2019, 228, 129–143. [Google Scholar] [CrossRef]
  62. Zhu, D.; Zhou, X.; Cheng, W. Water effects on urban heat islands in summer using WRF-UCM with gridded urban canopy parameters—A case study of Wuhan. Build. Environ. 2022, 225, 109528. [Google Scholar] [CrossRef]
  63. Burian, S.J.; Velugubantla, S.P.; Brown, M.J. Morphological analyses using 3d building databases: Salt lake city, utah. Adv. Atmos. Sci. 2002, 4, 55–56. [Google Scholar]
  64. Fushiki, T. Estimation of prediction error by using K-fold cross-validation. Stat. Comput. 2011, 21, 137–146. [Google Scholar] [CrossRef]
  65. Amini, S.; Saber, M.; Rabiei-Dastjerdi, H.; Homayouni, S. Urban Land Use and Land Cover Change Analysis Using Random Forest Classification of Landsat Time Series. Remote Sens. 2022, 14, 2654. [Google Scholar] [CrossRef]
  66. Nguyen, L.H.; Joshi, D.R.; Clay, D.E.; Henebry, G.M. Characterizing land cover/land use from multiple years of Landsat and MODIS time series: A novel approach using land surface phenology modeling and random forest classifier. Remote Sens. Environ. 2020, 238, 111017. [Google Scholar] [CrossRef]
  67. Rwanga, S.S.; Ndambuki, J.M. Accuracy assessment of land use/land cover classification using remote sensing and GIS. Int. J. Geosci. 2017, 8, 611. [Google Scholar] [CrossRef]
  68. Tatit, P.; Adhinugraha, K.; Taniar, D. Navigating the maps: Euclidean vs. road network distances in spatial queries. Algorithms 2024, 17, 29. [Google Scholar] [CrossRef]
  69. Zhang, W.; Li, W.; Zhang, C.; Li, X. Incorporating spectral similarity into Markov chain geostatistical cosimulation for reducing smoothing effect in land cover postclassification. IEEE J. Sel. Top. Appl. Earth Obs. Remote Sens. 2016, 10, 1082–1095. [Google Scholar] [CrossRef]
  70. Chen, X.; Wang, D.; Chen, J.; Wang, C.; Shen, M. The mixed pixel effect in land surface phenology: A simulation study. Remote Sens. Environ. 2018, 211, 338–344. [Google Scholar] [CrossRef]
  71. Rahman, M.M.; Avtar, R.; Ahmad, S.; Inostroza, L.; Misra, P.; Kumar, P.; Takeuchi, W.; Surjan, A.; Saito, O. Does building development in Dhaka comply with land use zoning? An analysis using nighttime light and digital building heights. Sustain. Sci. 2021, 16, 1323–1340. [Google Scholar] [CrossRef]
  72. Yin, G.; Lin, Z.; Jiang, X.; Qiu, M.; Sun, J. How do the industrial land use intensity and dominant industries guide the urban land use? Evidences from 19 industrial land categories in ten cities of China. Sustain. Cities Soc. 2020, 53, 101978. [Google Scholar] [CrossRef]
  73. Schneider, A. Monitoring land cover change in urban and peri-urban areas using dense time stacks of Landsat satellite data and a data mining approach. Remote Sens. Environ. 2012, 124, 689–704. [Google Scholar] [CrossRef]
  74. Koukiou, G. SAR Features and Techniques for Urban Planning—A Review. Remote Sens. 2024, 16, 1923. [Google Scholar] [CrossRef]
  75. De Bellefon, M.-P.; Combes, P.-P.; Duranton, G.; Gobillon, L.; Gorin, C. Delineating urban areas using building density. J. Urban Econ. 2021, 125, 103226. [Google Scholar] [CrossRef]
  76. Ren, Y.; Xie, Z.; Zhai, S. Urban Land Use Classification Model Fusing Multimodal Deep Features. ISPRS Int. J. Geo-Inf. 2024, 13, 378. [Google Scholar] [CrossRef]
  77. Zhang, Y.; Kwan, M.P.; Yu, B.; Liu, Y.; Song, L.; Chen, N. Quantitative Identification of Mixed Urban Functions: A Probabilistic Approach Based on Physical and Social Sensing Data. Trans. GIS 2025, 29, e13272. [Google Scholar] [CrossRef]
  78. Li, T.; Feng, Q.; Niu, B.; Chen, B.; Yan, F.; Gong, J.; Liu, J. Mapping urban villages based on point-of-interest data and a deep learning approach. Cities 2025, 156, 105549. [Google Scholar] [CrossRef]
  79. Lu, D.; Hetrick, S.; Moran, E. Land cover classification in a complex urban-rural landscape with QuickBird imagery. Photogramm. Eng. Remote Sens. 2010, 76, 1159–1168. [Google Scholar] [CrossRef]
  80. Wu, J.; Plantinga, A.J. The influence of public open space on urban spatial structure. J. Environ. Econ. Manag. 2003, 46, 288–309. [Google Scholar] [CrossRef]
  81. Lovell, S.T.; Johnston, D.M. Designing landscapes for performance based on emerging principles in landscape ecology. Ecol. Soc. 2009, 14, 44. [Google Scholar] [CrossRef]
  82. Du, S.; Zhang, X.; Lei, Y.; Huang, X.; Tu, W.; Liu, B.; Meng, Q.; Du, S. Mapping urban functional zones with remote sensing and geospatial big data: A systematic review. GISci. Remote Sens. 2024, 61, 2404900. [Google Scholar] [CrossRef]
  83. Sun, B.; Zhang, Y.; Zhou, Q.; Zhang, X. Effectiveness of Semi-Supervised Learning and Multi-Source Data in Detailed Urban Landuse Mapping with a Few Labeled Samples. Remote Sens. 2022, 14, 648. [Google Scholar] [CrossRef]
  84. Liu, X.S. A probabilistic explanation of Pearson′s correlation. Teach. Stat. 2019, 41, 115–117. [Google Scholar] [CrossRef]
  85. Gregorutti, B.; Michel, B.; Saint-Pierre, P. Correlation and variable importance in random forests. Stat. Comput. 2017, 27, 659–678. [Google Scholar] [CrossRef]
  86. Dovey, K.; van Oostrum, M.; Chatterjee, I.; Shafique, T. Towards a morphogenesis of informal settlements. Habitat Int. 2020, 104, 102240. [Google Scholar] [CrossRef]
  87. Kamalipour, H.; Dovey, K. Mapping the visibility of informal settlements. Habitat Int. 2019, 85, 63–75. [Google Scholar] [CrossRef]
  88. Chen, T.; Liu, S.; Li, X.; Pei, L.; Geng, M.; Yu, G.; Shi, Z.; Hu, T. Urbanization induced Urban Canopy Parameters enhance the heatwave intensity: A case study of Beijing. Sustain. Cities Soc. 2025, 119, 106089. [Google Scholar] [CrossRef]
  89. Kumar, V.; Agrawal, S. Urban modelling and forecasting of landuse using SLEUTH model. Int. J. Environ. Sci. Technol. 2023, 20, 6499–6518. [Google Scholar] [CrossRef]
  90. Jie, N.; Cao, X.; Zhuo, L. Identifying the Central Business Districts of global megacities using nighttime light remote sensing data. Int. J. Digit. Earth 2024, 17, 2356118. [Google Scholar] [CrossRef]
  91. Zhao, M.; Zhou, Y.; Li, X.; Cao, W.; He, C.; Yu, B.; Li, X.; Elvidge, C.D.; Cheng, W.; Zhou, C. Applications of satellite remote sensing of nighttime light observations: Advances, challenges, and perspectives. Remote Sens. 2019, 11, 1971. [Google Scholar] [CrossRef]
  92. Gerland, P. Socio-economic data and GIS: Datasets, databases, indicators, and data integration issues. In Proceedings of the UNEP/CGIAR (Consultative Group on International Agricultural Research), Arendal, Norway, 17 June 1996. [Google Scholar]
  93. Huang, X.; Zhang, L.; Zhu, T. Building change detection from multitemporal high-resolution remotely sensed images based on a morphological building index. IEEE J. Sel. Top. Appl. Earth Obs. Remote Sens. 2013, 7, 105–115. [Google Scholar] [CrossRef]
  94. Khanal, N.; Uddin, K.; Matin, M.A.; Tenneson, K. Automatic detection of spatiotemporal urban expansion patterns by fusing OSM and landsat data in Kathmandu. Remote Sens. 2019, 11, 2296. [Google Scholar] [CrossRef]
  95. Stoimchev, M.; Levatić, J.; Kocev, D.; Džeroski, S. Semi-supervised multi-label classification of land use/land cover in remote sensing images with predictive clustering trees and ensembles. IEEE Trans. Geosci. Remote Sens. 2024, 62, 1–16. [Google Scholar] [CrossRef]
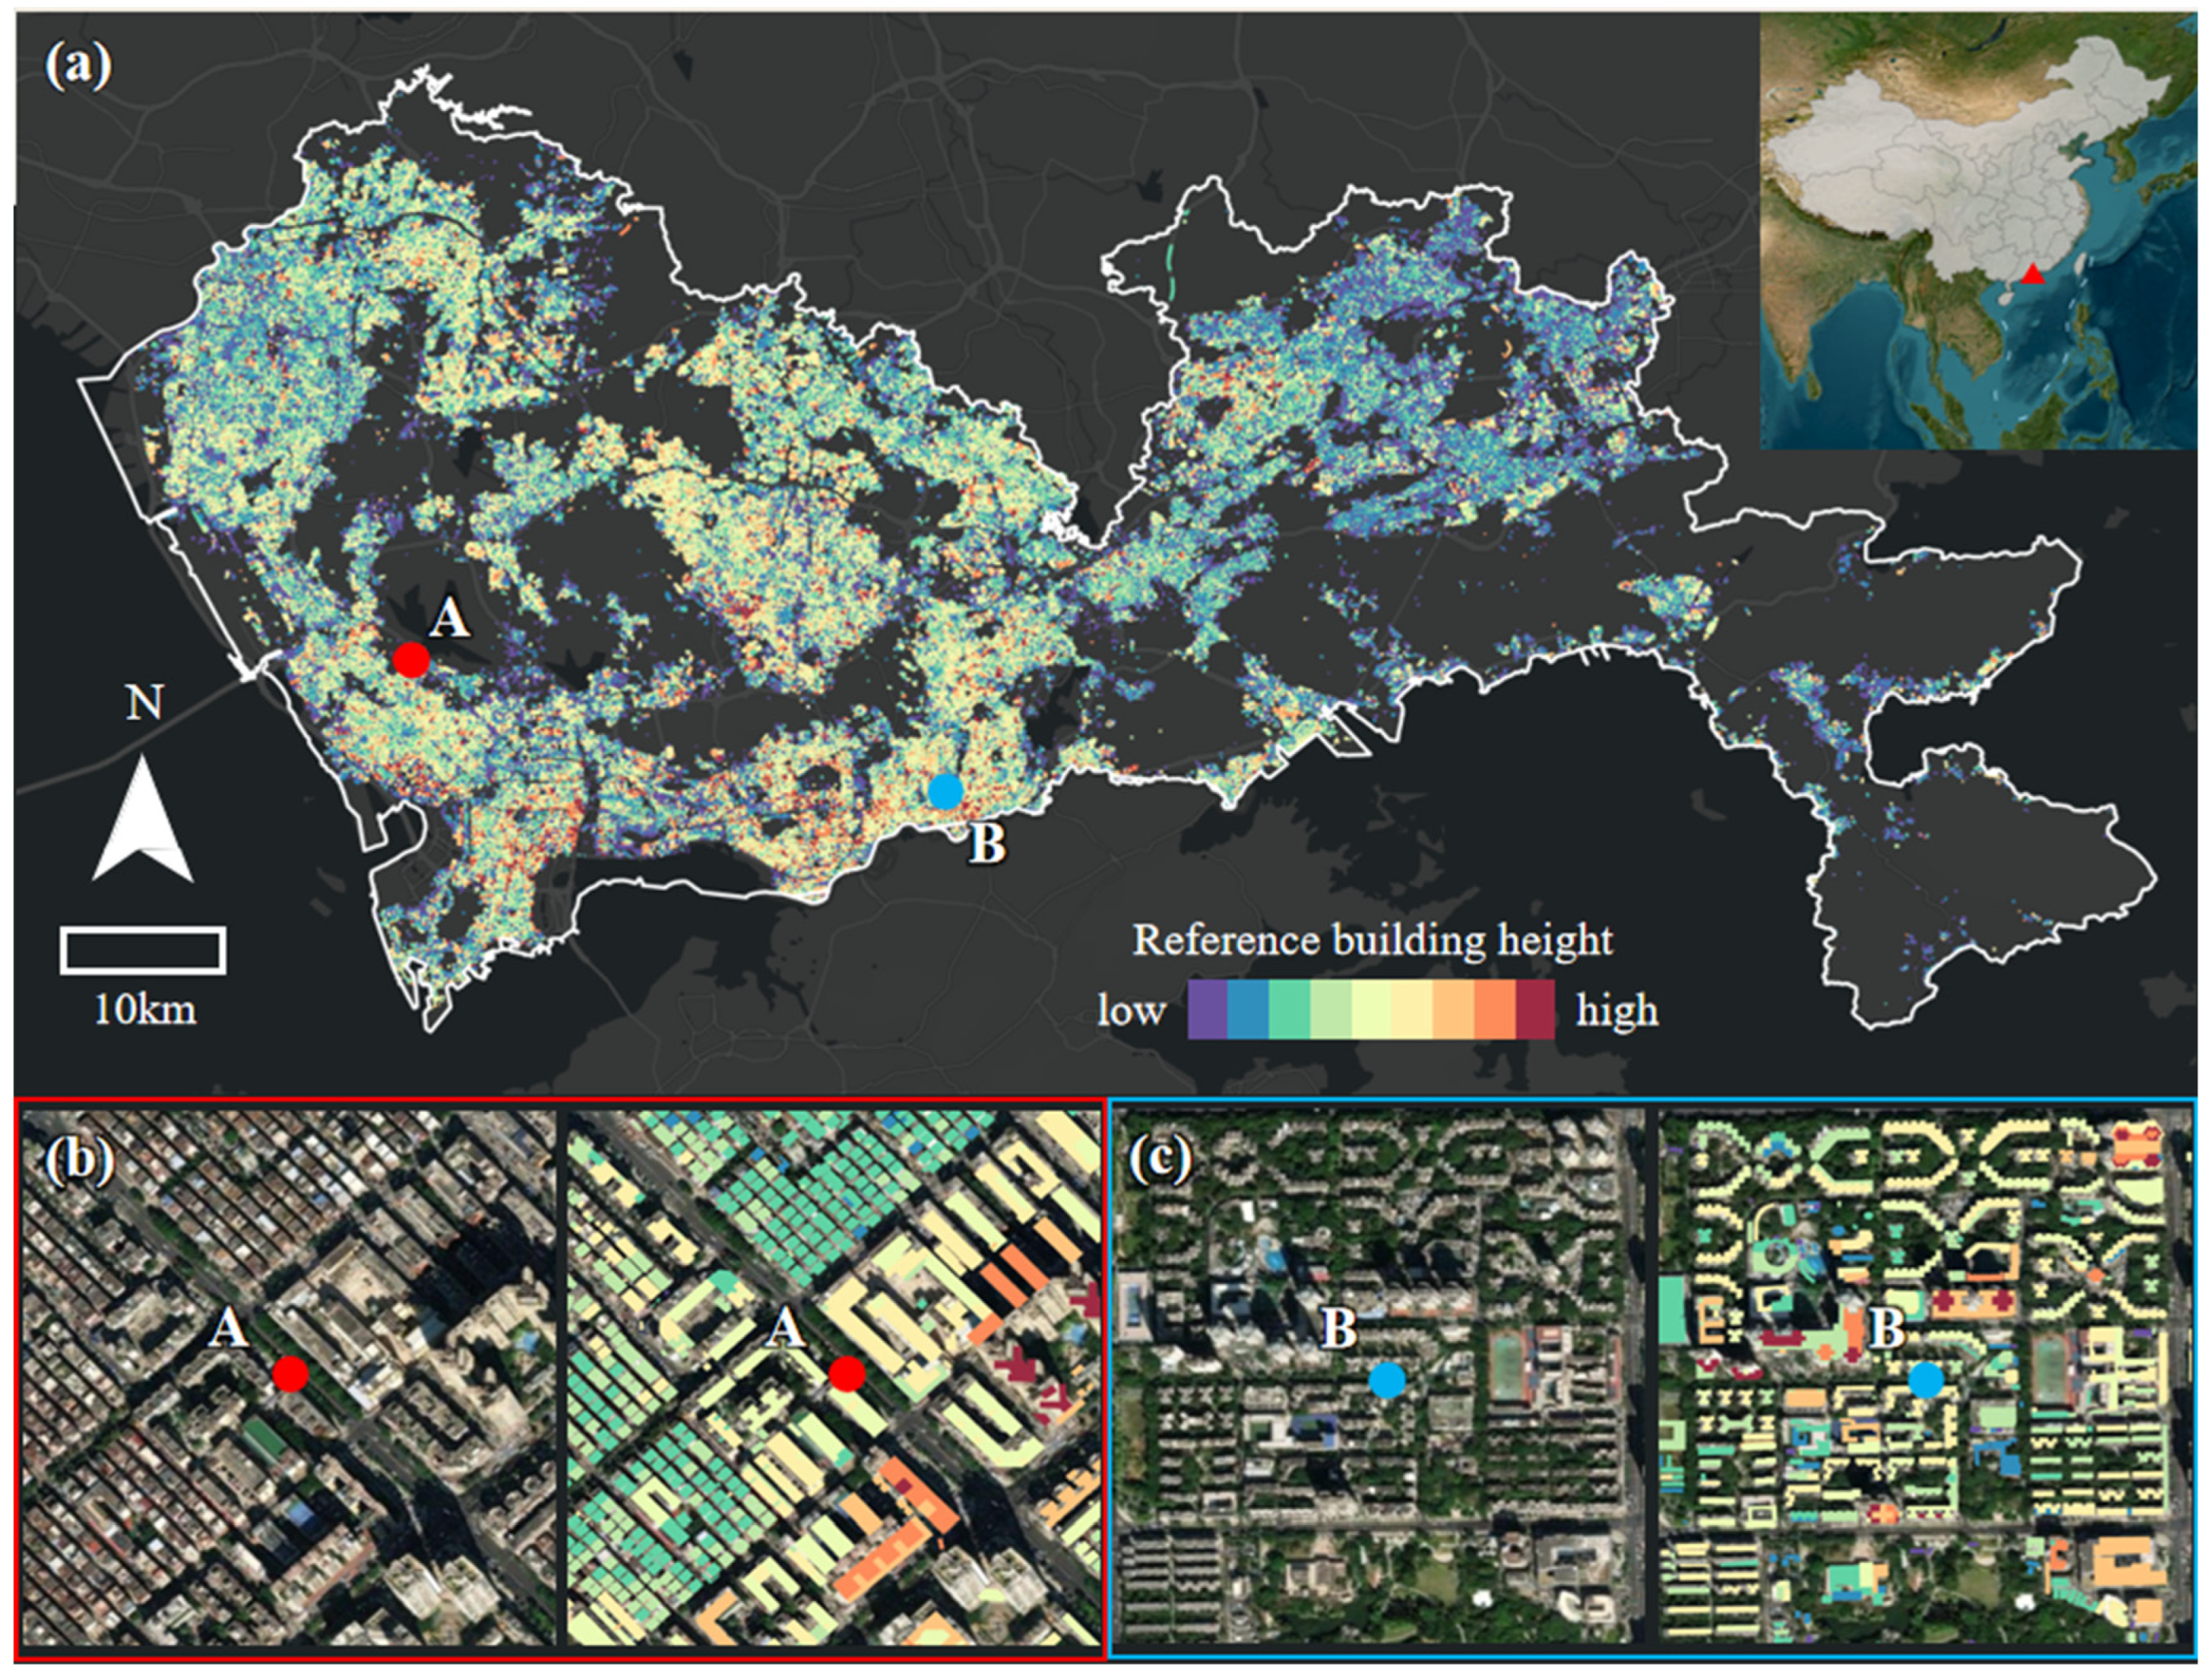
Figure 1. Illustration of our study area. (a) The building footprint data. The red triangle represents the location of the study area within China. (b,c) A and B point views of the high-resolution satellite images from Google Earth, and the corresponding building morphology with height information derived from 3D-GloBFP.
Remotesensing 17 02811 g001
Figure 2. The detailed classification results of seven land cover types and illustrations of six building morphology data.
Remotesensing 17 02811 g002
Figure 3. The overall framework of urban land use classification. (a) Traditional land use classification model and accuracy evaluation; (b) our proposed model and comparison with mature models.
Remotesensing 17 02811 g003
Figure 4. Classification result of study area for different models. (a) Reference land use, (b) result of Model 1, (c) result of Model 3 with detailed views (a1a3, b1b3, c1c3) highlighting specific regions (1–3).
Remotesensing 17 02811 g004
Figure 5. The impact of building morphology data on classification accuracy. (a) The classification accuracy of Model 1. (b) The classification accuracy of Model 3. R represents residential land, C represents commercial land, I represents industrial land, T represents transportation land, G represents green land, P represents public land, and O represents “other types”.
Remotesensing 17 02811 g005
Figure 6. Feature importance evaluation result. The top 10 feature importance scores for (a) Model 1 and (b) Model 3. The abbreviation explanation is as follows: S1 represents Sentinel-1 data, including VV and VH bands and processed VVHn; S2 represents Sentinel-2 data, including B2-B8, B8A, B11, and B12 bands; BF stands for building coverage rate; SH stands for the sum of building heights; and SA stands for the sum of building areas.
Remotesensing 17 02811 g006
Figure 7. Sankey diagram of changes in classification accuracy at the urban land use category scale for Models 2 and 3. R represents residential land, C represents commercial land, I represents industrial land, T represents transportation land, G represents green land, P represents public land, and O represents “other types”.
Remotesensing 17 02811 g007
Table 1. List of data used in the study.
TypeNameCharacteristic IndicatorsDescriptionTimeFormatResolution
Land use dataLand use data/Provided by the Shenzhen Municipal Bureau of Planning and Natural Resources2022Vector/
Remote
sensing data
Sentinel-1VVMeasures like polarized returns sensitive to bare surfaces2022Raster10 m
VHCaptures depolarized scattering from vegetation and complex structures
VVHnVVHn = VV × nVH
(n = 3, 4, 5, 6)
Sentinel-2NDVINDVI = B 8 B 4 B 8 + B 4 2022Raster10 m/20 m
NDBINDBI = B 11     B 8 B 11 + B 8
NDWINDWI = B 3 B 8 B 3 + B 8
B2-B8, B8A, B11, B12Sentinel-2 Level-1C data provided spectral bands from visible to SWIR
ALOS DSM Global 30Global digital surface model (DSM) data for elevationRepresents Earth’s surface elevation including vegetation and infrastructure2022Raster30 m
Socio-economic dataOSM road dataVarious road network dataUsed for road information extraction2022Vector/
POIVarious types of
POI data
Includes the point’s name, latitude, longitude, and its social function2022Vector/
Building morphology data3D-GloBFPRH R H = M A X M I N 2020Vector/
MH M H = i = 1 N   H i N
STD S T D = i = 1 N   H i H 2 N 1
SH S H = i = 1 N   H i
SA S A = i = 1 N   A i
BF B F = A / A g
Table 2. Classification accuracy of different models across different parcel size divisions.
Area CategoryModel 1Model 2Model 3
<10%58.99%60.65%59.94%
>90%80.59%84.49%85.15%
<20%58.90%58.25%60.06%
>80%77.71%82.38%82.86%
<33%58.52%56.77%60.52%
33–67%59.13%59.33%60.94%
>67%76.07%80.96%81.93%
Disclaimer/Publisher’s Note: The statements, opinions and data contained in all publications are solely those of the individual author(s) and contributor(s) and not of MDPI and/or the editor(s). MDPI and/or the editor(s) disclaim responsibility for any injury to people or property resulting from any ideas, methods, instructions or products referred to in the content.