Article

Parking Pattern Guided Vehicle and Aircraft Detection in Aligned SAR-EO Aerial View Images

College of Electronics and Information Engineering, Nanjing University of Aeronautics and Astronautics, Nanjing 211106, China
*
Author to whom correspondence should be addressed.
Remote Sens. 2025, 17(16), 2808; https://doi.org/10.3390/rs17162808
Submission received: 26 June 2025 / Revised: 8 August 2025 / Accepted: 11 August 2025 / Published: 13 August 2025
(This article belongs to the Special Issue Applications of SAR for Environment Observation Analysis)

Abstract

Although SAR systems can provide high-resolution aerial view images all-day, all-weather, the aspect and pose-sensitivity of the SAR target signatures, which defies the Gestalt perceptual principles, sets a frustrating performance upper bound for SAR Automatic Target Recognition (ATR). Therefore, we propose a network to support context-guided ATR by using aligned Electro-Optical (EO)-SAR image pairs. To realize EO-SAR image scene grammar alignment, the stable context features highly correlated to the parking patterns of the vehicle and aircraft targets are extracted from the EO images as prior knowledge, which is used to assist SAR-ATR. The proposed network consists of a Scene Recognition Module (SRM) and an instance-level Cross-modality ATR Module (CATRM). The SRM is based on a novel light-condition-driven adaptive EO-SAR decision weighting scheme, and the Outlier Exposure (OE) approach is employed for SRM training to realize Out-of-Distribution (OOD) scene detection. Once the scene depicted in the cut of interest is identified with the SRM, the image cut is sent to the CATRM for ATR. Considering that the EO-SAR images acquired from diverse observation angles often feature unbalanced quality, a novel class-incremental learning method based on the Context-Guided Re-Identification (ReID)-based Key-view (CGRID-Key) exemplar selection strategy is devised so that the network is capable of continuous learning in the open-world deployment environment. Vehicle ATR experimental results based on the UNICORN dataset, which consists of 360-degree EO-SAR images of an army base, show that the CGRID-Key exemplar strategy offers a classification accuracy 29.3% higher than the baseline model for the incremental vehicle category, SUV. Moreover, aircraft ATR experimental results based on the aligned EO-SAR images collected over several representative airports and the Arizona aircraft boneyard show that the proposed network achieves an F1 score of 0.987, which is 9% higher than YOLOv8.

1. Introduction

Synthetic Aperture Radar (SAR) can provide high-resolution images in all-day, all-weather conditions and is widely used for automatic vehicle, aircraft, and ship detection in critical areas such as military bases, battlefields, airports, and harbors. Despite their ability to reveal targets beneath dense clouds and thick smoke, SAR images are notorious for being challenging to interpret due to their unique and complex imaging mechanism and target aspect/pose-sensitivity, which defies the Gestalt perceptual principles. This sets a frustrating performance upper bound for Automatic Target Recognition (ATR) approaches based solely on SAR images. To resolve this problem, a network is proposed in this work to support context-guided ATR by using aligned Electro-Optical (EO)-SAR image pairs. Specifically, the stable context features highly correlated to the parking patterns of vehicle and aircraft targets are extracted from the EO images as prior knowledge, which is used to assist in SAR-ATR. Figure 1 provides an example of the parking pattern of aircraft that could be learned from the EO images and used to assist in SAR aircraft detection. Figure 1a is a close-up image of Heathrow Airport, which shows aircraft parked at the center of each parking space and connected to the terminal gate via boarding bridges. This knowledge is applicable to most civilian airports and could be exploited for false alarm elimination in the problem of SAR aircraft detection. Figure 1b shows the ICEYE SAR image of a particular terminal at Heathrow Airport and the EO image depicting the same region downloaded from EarthOnline. Like GoogleEarth, EarthOnline provides high-resolution aerial and satellite imagery of most places on earth for free and updates its imagery database monthly. It is easy to see that, the parking lines and boarding bridges provide critical information for pinpointing the spots where an aircraft is most likely to be present. Unfortunately, most of the existing SAR datasets constructed to support vehicle and aircraft detection lack the “context information”; i.e., only the targets themselves are annotated. Since deep neural networks can only learn from data via annotations, the high-value information contained in the surroundings has not been properly utilized. Considering that the context information is freely available via online data access services provided by GoogleEarth and the Copernicus Data Space Ecosystem, we argue that more knowledge could be learned from an SAR image when it is analyzed together with its EO counterpart. This argument is based on the fact that the rules learned from EO images when the light condition allows it offer invaluable guidance for SAR image interpretation in cases where the light source is cut-off by nature or by adversaries (e.g., smoke grenade) and the SAR images become the final resource.
Many deep learning-based algorithms have been proposed for SAR vehicle and aircraft detection [1,2]. The mainstream algorithms include (1) vanilla CNN-based methods that rely solely on the CNN model for feature extraction, which involve classic CNN models like AlexNet-style shallow CNN [3] and ResNet [4], as well as more complicated schemes like the student–teacher paradigm [5], (2) reflectivity attribute model-based methods that exploit the Attribute Scattering Center (ASC) model of the targets [6,7] and sparse representation [8,9,10,11], and (3) CNN-based architectures incorporating Generative Adversarial Networks (GANs) and Computational Electromagnetic (CEM)-based SAR data augmentation methods [12,13,14]. Unfortunately, due to the scarcity of high-quality annotated SAR data in the public domain and the fact that SAR images defy the foundation for human and computer vision, i.e., the Gestalt perceptual principles, makes it unreasonable to expect a deep neural network trained with limited data to excel in open world environments full of out-of-library targets and numerous target-like clutters.
To solve this problem, many scholars resort to the research line of joint EO-SAR or cross-modality scene analysis and target detection. The most frequently used datasets in this line of research include (1) the UNIfied COincident Optical and Radar for recognitioN (UNICORN) dataset, which consists of aligned EO-SAR images collected over the Wright–Patterson Air Force Base in the U.S. using the airborne GOTCHA/NDU radar and monochromatic EO sensor [15]; (2) the SpaceNet6 dataset, which consists of optical images collected by the Maxar WorldView 2 satellite and SAR images collected by Capella’s X-band quad-pol SAR sensor mounted on an aircraft to mimic the space-borne sensors across the Netherlands [16]; (3) the QXS-SAROPT dataset, which consists of EO-SAR image pairs collected by GaoFen-3 and cover three port cities: San Diego, Shanghai, and Qingdao [17]; (4) the SEN1-2 dataset [18], which consists of EO-SAR image pairs collected by Sentinel-1 and Sentinel-2 across the entire globe in four seasons; and (5) the So2Sat-LCZ42 dataset [19], which consists of Local Climate Zone (LCZ) labels of approximately half a million aligned EO-SAR image patches featuring 42 urban agglomerations across the world collected by Sentinel-1 and Sentinel-2. Since the SAR images in the SEN1-2 dataset (5–10 m resolution), the So2Sat-LCZ42 dataset (5–10 m resolution), and the QXS-SAROPT dataset (1 m resolution) are of coarse resolution, they have been mainly used to support research in SAR-optical image translation [20] and scene classification [21] rather than object detection. In contrast, the UNICORN dataset features a submeter resolution that is comparable to the wide angle SAR data used in [22] for civilian vehicle discrimination research. In [15], the main findings of the 2022 Multi-modal Aerial View Object Classification (MAVOC) challenge based on the UNICORN dataset are summarized. Although the highest accuracy obtained by the 2022 winner with the aligned EO-SAR image pairs is only 51.09%, it is 65% higher than the result obtained in 2021.
Joint EO-SAR image interpretation could be realized either through SAR-optical Information Fusion (IF) when the light condition is favorable or SAR-optical Image Translation (IT) in cases where the quality of the light condition deteriorates so that the optical images fails to meet the minimum requirement [23]:
(1) IF-based joint processing. IF can be categorized as pixel-level fusion, feature-level fusion, and decision-level fusion. Most pixel-level and feature-level IF methods are based on one or two of the following transforms: Wavelet Transform (WT) [24], Contourlet Transform (CT) [25], Intensity-Hue-Saturation (IHS) transform [25], and Shearlet Transform (ST) [26]. The CT-based method performs multi-scale and multi-directional decompositions of the source images, which leads to a better shift-invariance property and directional selectivity at the cost of higher computational complexities. The IHS transform divides the optical image into three channels, intensity, hue, and saturation, and the intensity component is substituted with a grayscale stretched SAR image. Since SAR and optical sensors are typical heterogeneous sensors employing different imaging mechanisms, feature-level and decision-level IF methods are much more common than pixel-level methods. In [27], the shape features of the vehicle targets (length, width, ratio of length and width, and shape complexity of a target region) from the optical images and the fractal dimension features from the SAR images (Hausdorff dimension of the spatial distribution of the N brightest scatterers) are combined with the Fuzzy C-Means (FCM) algorithm. In [28], a Multimodal-Cross Attention Network (MCANet) is proposed, which extracts the low-level and high-level feature maps of optical and SAR images separately with a pseudo-Siamese network and then combines these features based on second-order correlation between the features captured by two sensors with the multimodal-cross attention module and the feature fusion module. In [29], a feature-level SAR-optical image fusion method based on a Non-Subsampled Shearlet Transform (NSST)-Pulse Coupled Neural Network (PCNN) is proposed, which employs iterative computation and does not require a training process. Decision-level IF does not require pixel/time alignment and is realized by combining the detection results based on SAR and optical images with either linear sum-based decision fusion (majority weighting, weighted average, logical operators) [30] or nonlinear neural network fusion [31].
(2) IT-based joint processing. SAR-to-optical IT utilizes the SAR sensor’s capability of all-day, all-weather high resolution imaging to compensate for the uncertainties in light conditions and converts the challenging problem of SAR image interpretation to the familiar problem of optical image interpretation, which has advanced to the level of scene analysis. In [32,33], an end-to-end diffusion model (E3Diff) is developed, which exhibited outstanding performance in SAR-to-optical IT missions. Specifically, the multilevel SAR prior features are used to control U-Net for denoising, and the iterative denoising process of diffusion is transformed into one-step deterministic mapping by treating the generative process as the reverse of a particular Markovian diffusion process. Optical-to-SAR IT aims to exploit the advantages of SAR images in capturing the prominent features of roads and rivers while suppressing the redundant landscape clutters induced by buildings and vegetation. In [34], the authors introduced the HybridSAR Road Dataset (HSRD) constructed based on the SpaceNet 6 EO-SAR Road dataset and two synthetic SAR road datasets, and it has been proved that models trained by the HSRD achieve higher accuracy in road segmentation tasks over models trained only by SAR images. To combine the distinctive advantages of SAR and optical images mentioned above, in [35], a GAN-based two-way EO-SAR image translation model is proposed based on the SpaceNet dataset.
Unlike the IF- and IT-based joint processing methods mentioned above, we look beyond the image pixels and propose a context-driven joint scene–target analysis method based on optical-SAR image scene grammar alignment. Probabilistic scene grammar defines the scene as a set of building blocks (bricks), which can be expanded according to a set of production rules [36]. It is comprised of symbols, which include non-terminal symbols (e.g., object category) and terminal symbols (e.g., object), rules, and probabilities. Vision systems based on scene grammar aim to break the mission into several stages and use high-level information (causal relationships among objects) to guide low-level interpretations (object identity) rather than to make decisions based solely on the pixels of interest. To begin, the parking region is identified with the Scene Recognition Model (SRM). After that, binary predictions about the presence of targets are made by the Cross-Modality ATR Module (CATRM) for the potential parking areas sifted out based on prior knowledge regarding the configuration of the parking region.
The SRM is designed to adaptively assign weights to the predictions made based on the EO and the SAR images according to the light condition and identify the cuts of interest based on the parking pattern features in different scenarios. In practice, the scene recognition mission could involve both in-library and Out-of-Distribution (OOD) scenes, i.e., scenes that have not been included in the library for network training. In [37], Hendrycks et al., proposed the Maximum Softmax Probability (MSP) method for OOD detection, which is based on the fact that a properly trained network is able to assign higher softmax scores to in-library samples than to OOD samples. In [38], Liang et al. proposed the ODIN method, which has been widely adopted for OOD detection problems concerning SAR images [13,14,39]. In [40], Yang et al. argue that the problems of the existing CNNs encountered in OOD detection are mainly caused by the softmax layer, which is based on the assumption of a fixed number of categories. Therefore, they proposed a novel framework called Convolutional Prototype Learning (CPL), which learns multiple prototypes in the convolutional feature space and use prototype matching for decision making. To increase the intra-class compactness and expose the OOD samples, a Generalized Margin-based Classification Loss (GMCL) function is proposed. In [41,42], Zhu et al. proposed the Classification Supervised Autoencoder (CSAE) based on Predefined Evenly Distributed Class Centroids (PEDCCs). In [43], Zhu et al., proposed an OOD detection method based on PEDCC-loss by decomposing the confidence score in the Euclidean space and constructing three complementary scoring functions accordingly for feature fusion. Considering that in all the datasets considered in this work the inter-class separation is wide enough to support OOD detection without further manipulations, we follow the MSP method proposed in [37] and the preprocessing method for ODIN [38] for SRM training. The identified image cuts are then sent to the Cross-modality ATR Module (CATRM) for ATR. A novel class-incremental learning method [44,45] based on the context-guided Re-Identification (ReID)-based [46] Key-view (CGRID-Key) exemplar selection strategy is devised so that the network is capable of continuous learning in the open-world deployment environment based on key-view exemplar selection.
To support context guided vehicle detection, a dataset containing ten representative parking lots is constructed based on the UNICORN dataset, which contains the aligned EO-SAR images collected over the Wright–Patterson Air Force Base in the U.S. (six different resolutions ranging from 0.282 m × 0.232 m to 9.04 m × 7.44 m, 25.1 km2 coverage). To support aircraft detection based on EO-SAR scene grammar alignment, we construct an EO-SAR aircraft dataset featuring Heathrow Airport in the U.K., the Kuala Lumpur International Airport in Malaysia, the Suvarnabhumi airport in Thailand, and the Arizona aircraft boneyard. The SAR-EO aircraft instances are annotated based on the free-to-download SAR images provided by ICEYE (0.5 m resolution, 15–25 km2 km coverage) and the optical images downloaded from EarthOnline (0.5 m resolution), while the SAR-EO aircraft instances of the Arizona aircraft boneyard are self-annotated based on the OSdataset [47], which was collected with C-band GaoFen-3 (1 m resolution, 10 km2 coverage). The proposed framework opens up the possibility of training a network that is capable of class-incremental learning in an expanding virtual world synthesized based on real EO-SAR remote sensing images featuring stable facilities in urban, harbor, or airport scenes [48] and a mixture of real–synthetic vehicle targets following realistic parking pattern.
The rest of this work is organized as follows. Section 2 presents the proposed ATR network based on optical-SAR image scene grammar alignment, which is comprised of the SRM and the CATRM. In Section 2.1, the two-stage OE training process for the SRM is detailed. In Section 2.2, the CATRM for target recognition based on the CGRID-Key strategy and class-incremental learning is explained. In Section 3, the proposed methodology is tested against two datasets: (1) the UNICORN dataset, which contains the aligned EO-SAR images collected over an army base in the U.S.; (2) the self-constructed EO-SAR aircraft dataset, which features Heathrow Airport in the U.K., the Kuala Lumpur International Airport in Malaysia, the Suvarnabhumi airport in Thailand, and the Arizona aircraft boneyard. Section 4 concludes this paper by summarizing the key findings and identifying the future research directions.

2. ATR Based on Optical-SAR Image Scene Grammar Alignment with SRM and CATRM

The proposed ATR method based on optical-SAR image scene grammar alignment is motivated by three factors. (1) Pixel/time alignment difficulty for heterogeneous sensors. The similarity level between the aligned SAR-optical image pairs depends on both the parameters of the sensors and the properties of the region/object of interest, which makes pixel-level and feature-level image fusion technically challenging and not generalizable. (2) Unbalanced SAR-optical data availability and interpretability. High-resolution SAR datasets available for public use are scarce due to the data collection cost, the complexity involved in image annotation, and security concerns. In contrast, optical remote sensing images of civil airports all over the world and the associated apron design have become a data resource that is freely available in the public domain. (3) Necessity of causal reasoning for tiny object recognition. The scale-variance of objects in remote sensing images demands a causal-reasoning-based method that can look beyond pixels and convert the background clutter to useful information since the objects of interest might contain only a few pixels buried in landscape clutters. Considering that the airport apron design is marked by line features that are invisible in SAR images, it is critical to transform these data to masks that can be applied to the SAR image for efficient information fusion.
The overall architecture of the proposed automatic target recognition method based on optical-SAR image scene grammar alignment is shown in Figure 2. It is carried out in three steps: (1) SRM for scene recognition; (2) image cuts generation based on scene grammar alignment; (3) CATRM for target detection/recognition. Different network architectures have been used for airplane ATR and vehicle ATR in Step 3 due to the difference in the two datasets regarding the number of views and the annotation style. Specifically, the UNICORN dataset comprises multiview images with fine-labels while the self-constructed EO-SAR aircraft dataset comprises single-view images with only the super-class label “airplane”. Moreover, the annotations for the vehicles are based on image chips (i.e., the image chip is labeled as “motorcycle” if it contains at least one motorcycle, with multi-label supported), while the annotations for planes are based on bounding boxes generated according to the terminal area markings. The logic of the experiment design is as follows. There are 1.644 billion vehicles around the world, and they could be densely-parked anywhere. If the human operator wants to sift out all the images of a specific size containing a certain type of vehicle (for some operations that would impact all the objects within the resolution cell), ideally the performance should not degrade due to the occlusions posed by other vehicles parking right beside the vehicle of interest. In practice, there could be many vehicles in the parking lot, and small targets like motorcycles might take only a few pixels in an aerial image. If the annotation task is designed to be like an item checklist to go through for each resolution cell of arbitrary size of interest, the efficiency would improve dramatically. Compared with vehicles, planes are much larger in size, carry higher values, and require expert knowledge for accurate annotation. Since there are only a total of 39,000 planes and 41,700 airports around the world, bounding box generation based on the potential parking positions for the airplanes in the form of image chips based on the terminal area markings is a more preferable choice. The SRM and CATRM are detailed in Section 2.1 and Section 2.2, respectively.

2.1. The SRM for In-Library and OOD Scene Detection Based on MSP and AdvOE

Assume that the neural network g = ( g 1 , , g C ) is trained to classify C categories. For each input x , the neural network assigns a label by computing the softmax output for each class and ranking them from high to low. The key idea of ODIN is to separate the in-library samples from the OOD samples based on a score via temperature scaling as [14,38,39]
S ODIN ( x ) = max i C exp ( g i ( x ) / T ) j = 1 C exp ( g j ( x ) / T )
where T is the temperature scaling parameter. If S ODIN is greater than a pre-determined threshold for a certain test sample, it reflects high-confidence prediction. In this case, the sample is considered ID and a class-label is assigned accordingly. Otherwise, the sample is declared to be OOD and rejected. With T set as 1, (1) reduces to the baseline detector presented in [38].
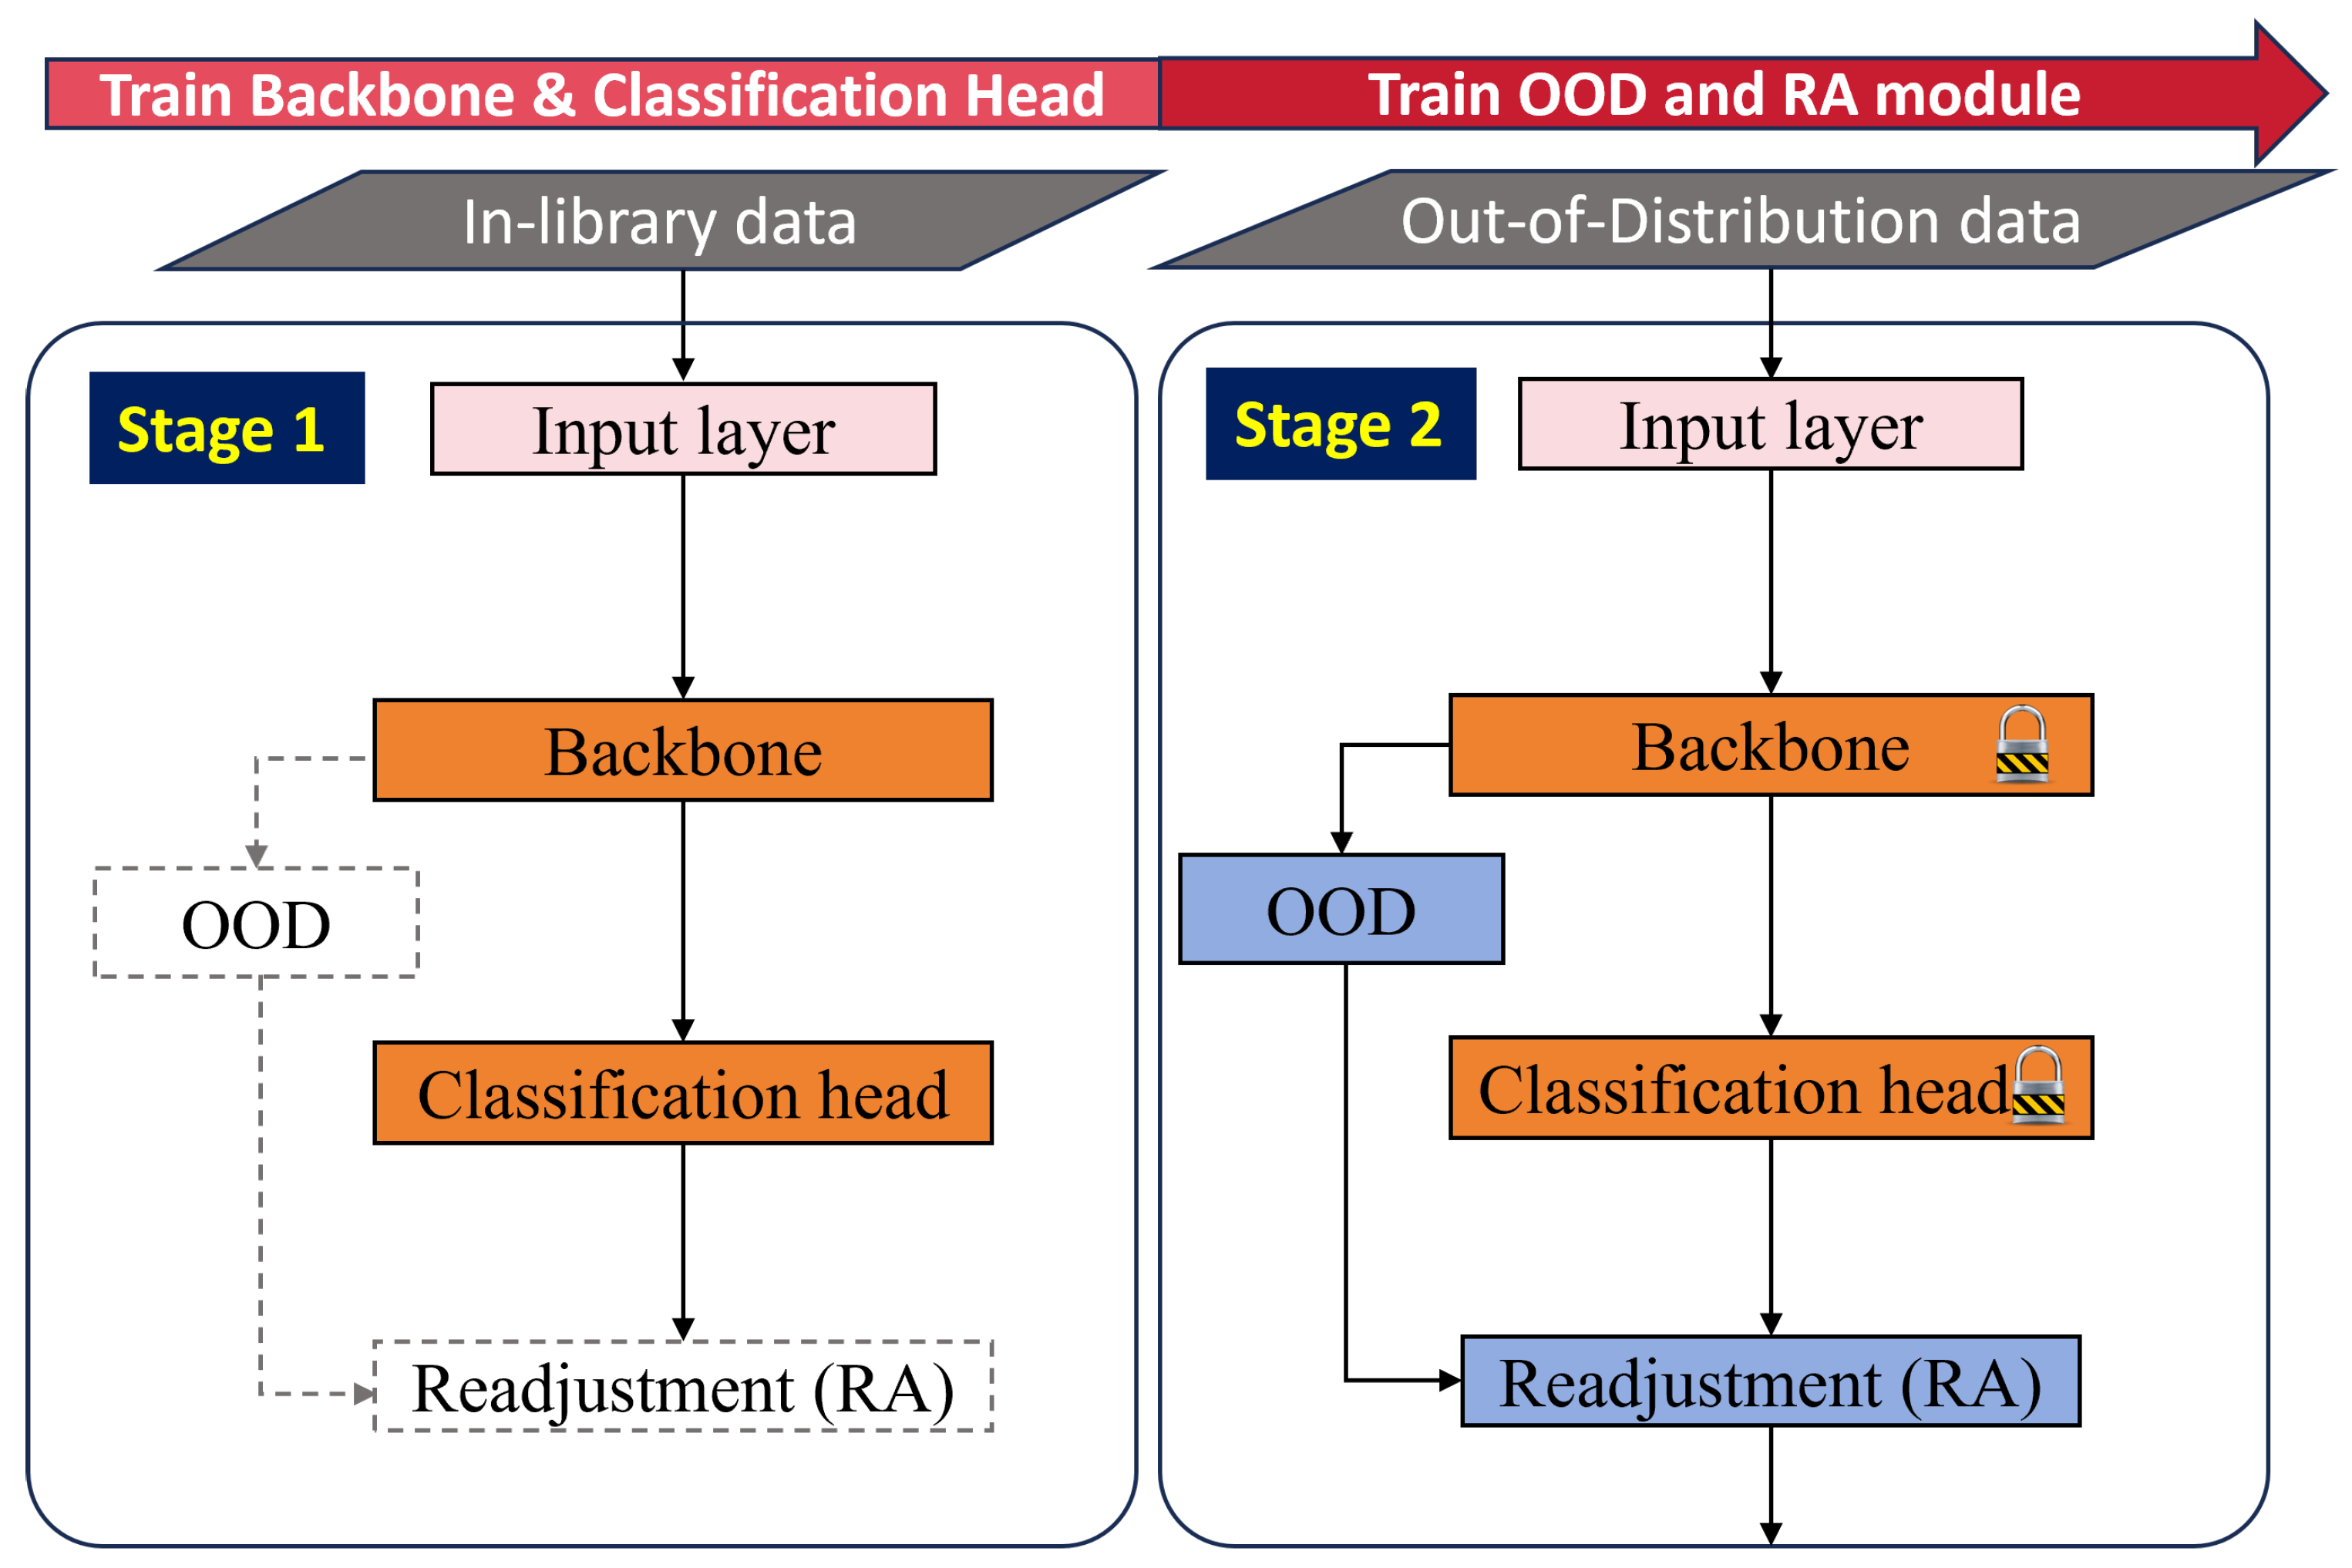
The Readjustment (RA) module we designed for OOD detection is shown in Figure 3. A two-stage model training strategy is devised. In Stage 1, the model concentrates on the task of in-library model training, hence only the “Backbone” module and the “Classification head” module are involved while the RA module is exempt from training. Consequently, a C + 1 -category classification model is obtained, which is able to generate C positive in-library class labels and 1 negative class label (note that only in-library samples have been used in Stage 1). In Stage 2, the model concentrates on Outlier Exposure (OE) training, hence the diverse OOD sample dataset D O O D O E is employed to train the OOD module and the RA module while keeping the weights for “Backbone” and “Classification head” frozen. Assume a batch size of N, then the output of the “Classification head” is of the dimension N × C + 1 , with the last column corresponding to the category OOD or negative label. Meanwhile, the output of the “OOD” module is of dimension N × 1 , which could be used to correct the negative predictions based on the learnable scaling coefficient s R A generated by the RA module. Define f ( x i ; θ 1 ) as the model in Stage 1, with θ 1 representing the parameters, which accepts image x i as the input and generates a logit vector z f ( x i ; θ 1 ) over the set of C in-library classes plus one OOD class. Define the output of the OOD module as g ( x i ; θ 2 ) , with θ 2 representing the parameters of the model in Stage 2. Further assume that the input image x i belongs to category D i , i = 0 , , C . The final logit vector z g ( x i ; θ 1 ; θ 2 ) , which is generated by the model that has been thoroughly trained in two stages, is given by (2):
z g ( x i ; θ 1 ; θ 2 ) = f ( x i ; θ 1 ) , 0 i C 1 f ( x i ; θ 1 ) + s R A × g ( x i ; θ 2 ) , i = C
The loss function for Stage 2 is composed of Multi-class Cross Entropy (MCE) loss for in-library scene classification and Binary Cross Entropy (BCE) loss for OOD scene discrimination, and it is given by
L o s s = ( 1 α ) × L o s s M C E + α × L o s s B C E
where α is the hyperparameter. To improve the training efficiency, the Adversarial Outlier Exposure (AdvOE) training strategy commonly used for ODIN [38] is also incorporated into the proposed network architecture. As illustrated in Figure 4, each AdvOE sample is made of a small fraction (20–30%) of a randomly selected in-library sample (narrow strip marked with red outline) and a large fraction (70–80%) of a randomly chosen OOD sample.

2.2. The CATRM for Target Recognition Based on the CGRID-Key Strategy

To avoid catastrophic forgetting, it is a common procedure to train the network with a small number of in-library class samples (exemplars) and the newly acquired OOD samples for class-incremental learning. However, to the best of the authors’ knowledge, the research on exemplar selection for vehicle detection in aligned optical-SAR image pairs is rare. Therefore, we propose a novel class-incremental learning method based on the CGRID-Key exemplar selection strategy to deal with aspect-sensitive EO-SAR images. The proposed method is based on the assumption that any vehicle movement within the area of interest could be captured with SAR-based Ground Moving Target Indication (GMTI); hence, vehicle Re-Identification (ReID) could be realized based on the contextual information (i.e., the target surroundings) given that the vehicle of interest is stationary throughout the whole EO-SAR data collection process. Furthermore, to reduce the time and computational cost in a large-area surveillance mission that calls for scene analysis rather than instance-by-instance detection, group target classification is expected. For example, the end-user might just want to know if the vehicles parked in a specific region belong to a certain type that is of interest rather than pinpoint each vehicle [49]. It follows that the parking pattern of the vehicles, the roadway markings, and the landmarks surrounding the multitarget group in the EO images should be exploited for vehicle ReID, which is similar to background (clutter and shadow)-based SAR-ATR under the assumption of closed data, e.g., the MSTAR dataset [2]. By first clustering the diverse-aspect EO-SAR images for the same multitarget group, key-view samples for each group are selected and employed for training and testing like champions for a competition. It is worth mentioning that the proposed group-based ATR is only advantageous over the individual-based ATR when the quality of the samples is extremely unbalanced, in which case a large number of samples offers misleading information that is detrimental to the ATR mission, and more is less. Moreover, just like a person who is familiar with an area knows where to get the best vantage point for certain scenery, it is essential to pinpoint the superior views among the 360-degree EO-SAR data in cases where the light condition no longer supports high-quality EO imagery and SAR imagery becomes the last resort.
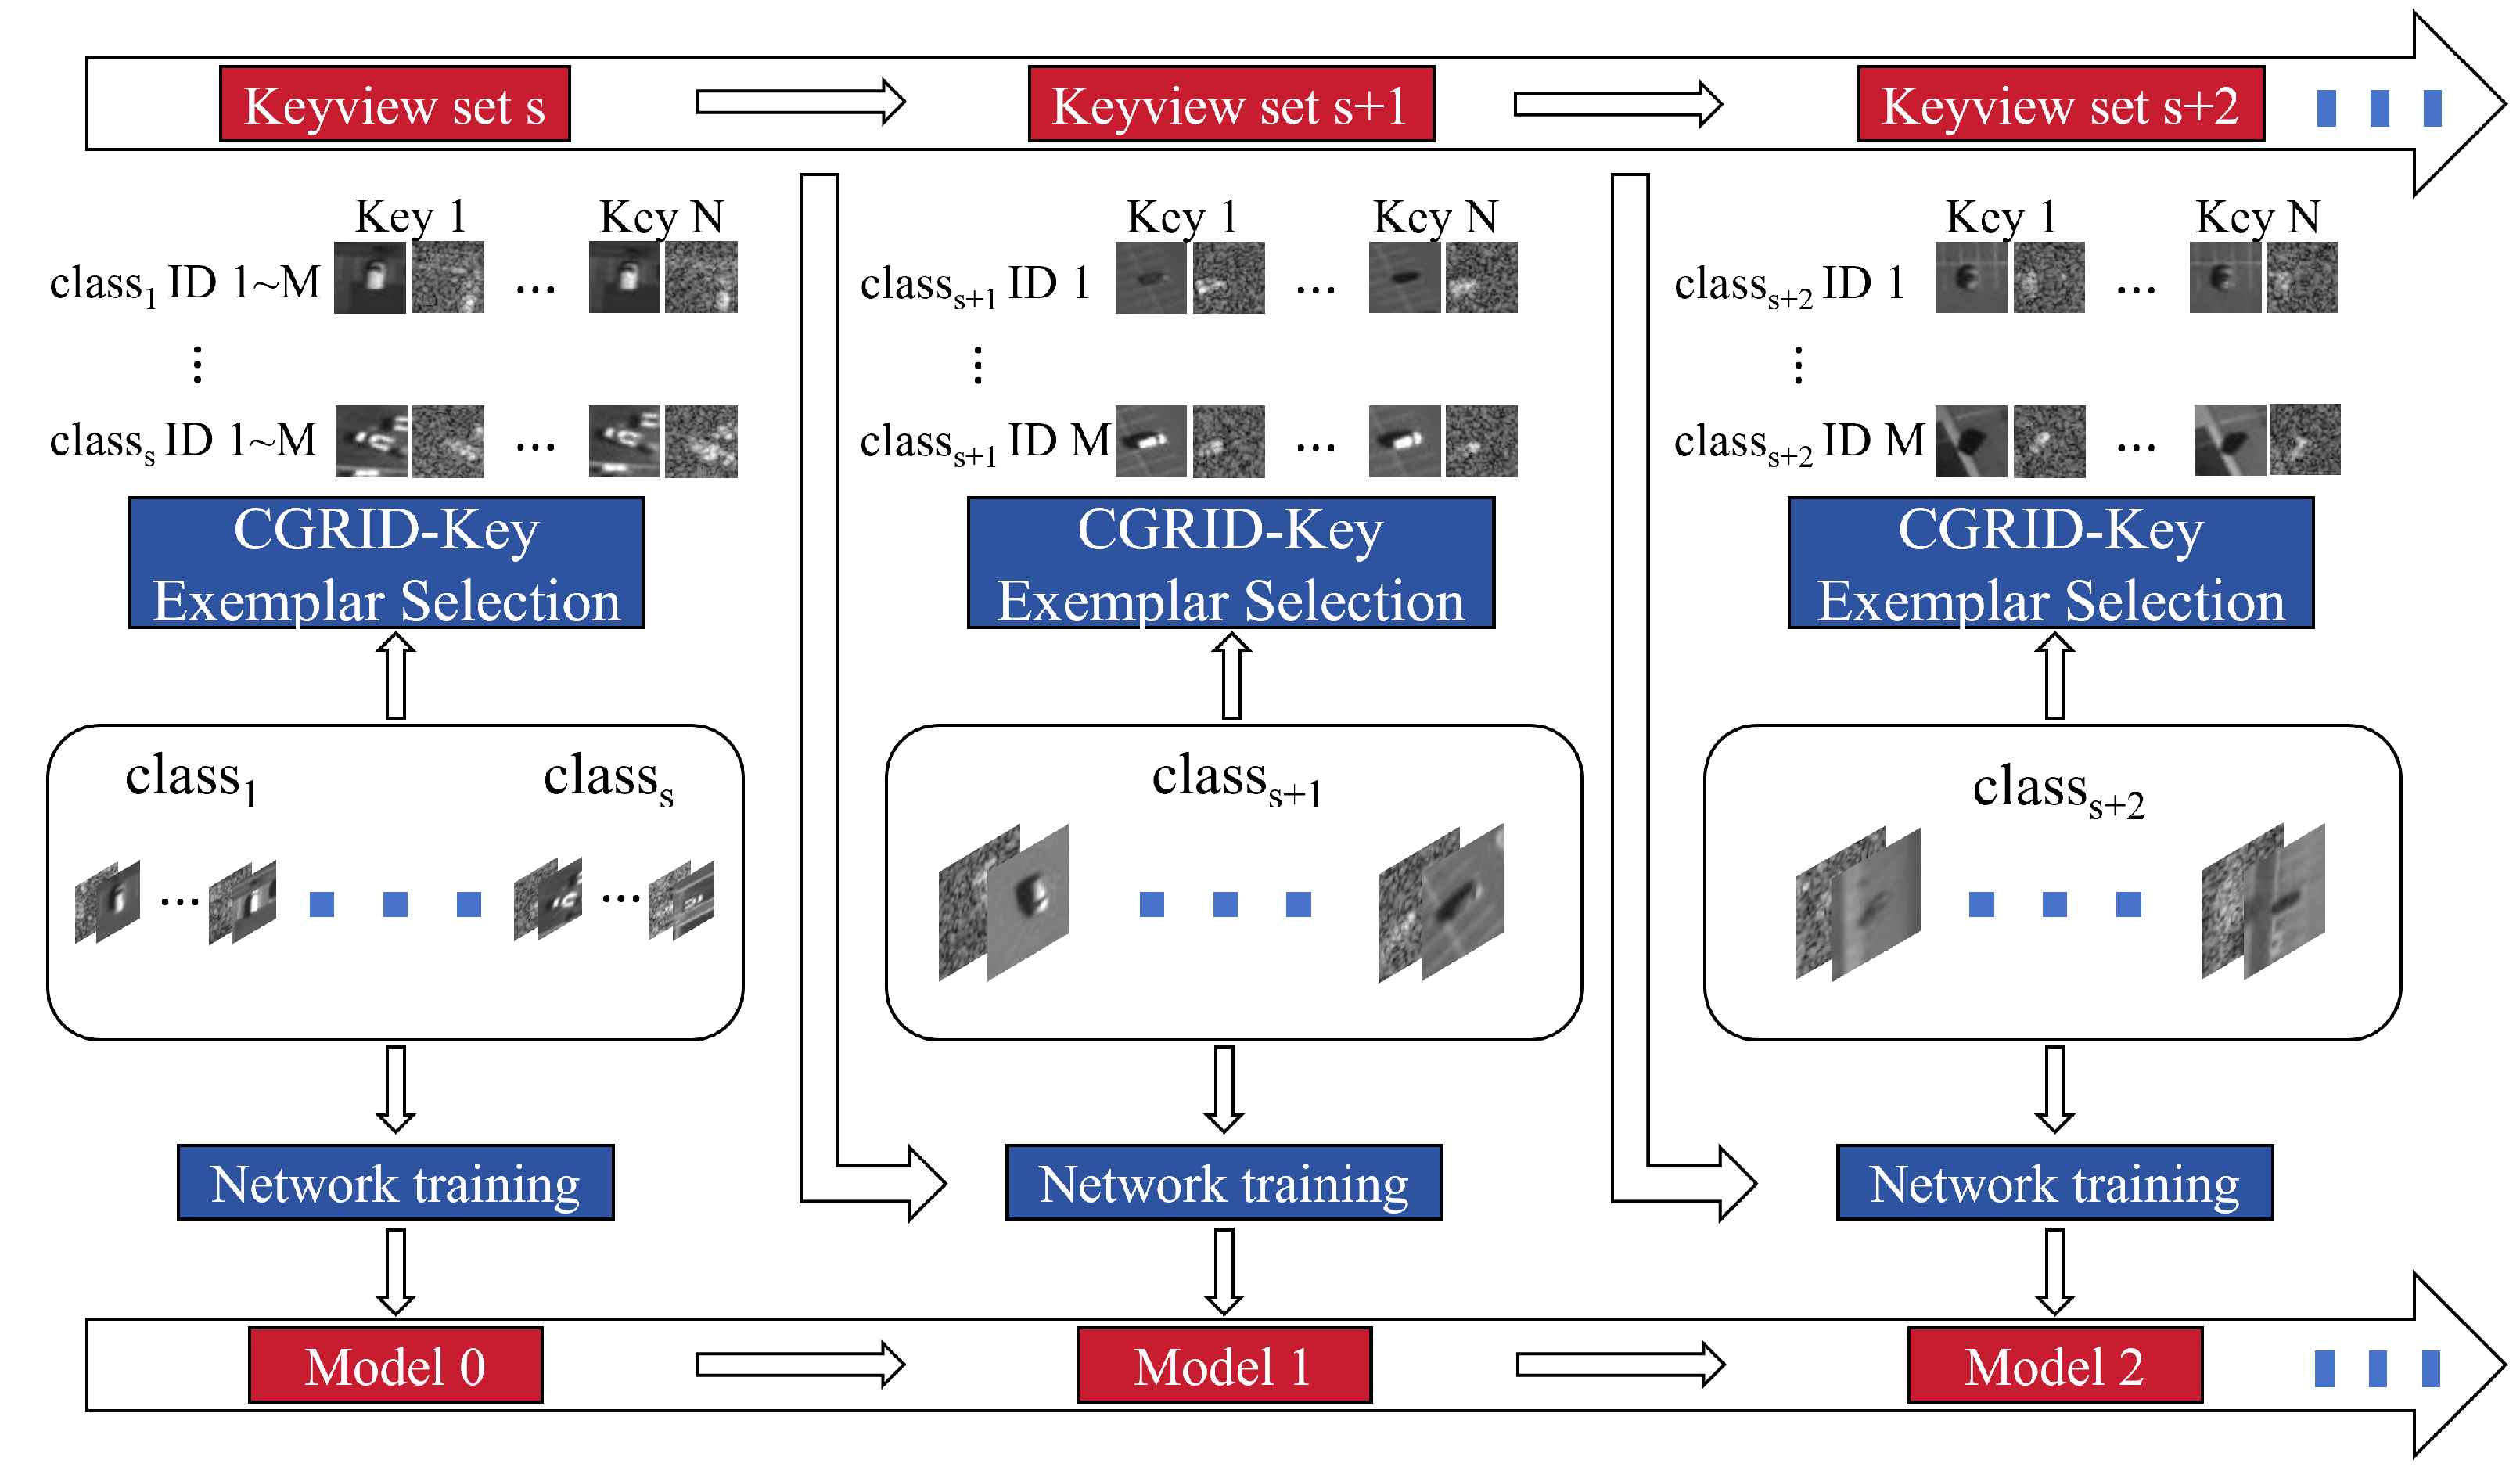
The CGRID-Key strategy is illustrated in Figure 5, assuming that SUV is a new target category that has never been seen by the network in the training process. The EO-SAR image pair quality ranking problem is formulated as a bi-objective ranking problem by jointly considering the score of EO features (i.e., structure features of the target) and the score of SAR features (the ERIM size and contrast features of the target) [50]. The scoring strategy is illustrated at the left of Figure 5 using an example consisting of eight EO-SAR image pairs featuring the same two SUVs acquired from eight different angles. To ensure that the quantity of targets in the SAR image and that in the EO image match, a “rejection region” is designed, which is marked as gray. Considering that SAR could be the last resort for target information in poor light conditions, the score weighting scheme is designed to be biased towards SAR images. The right side shows the EO-SAR image pairs chosen according to the scoring strategy mentioned above for 19 SUV prototypes in the UNICORN dataset (note: since airborne wide-angle EO-SAR sensors provide 360 degrees of azimuth around each target, although there are 20,000+ EO-SAR image chips for SUV in the UNICORN dataset, they correspond to only 19 prototypes for the cases that one or two SUVs are present). It is expected that the human operator annotate a small fraction of these SUV prototypes (the optimum-view sample sifted out with the CGRID-Key strategy for each prototype) manually, which are then used as seeds for OOD training sample clustering and network training so that the system would recognize other SUV prototypes automatically in the future.
The incremental learning scenario is illustrated in Figure 6. We define the initial model obtained via in-library data training and the updated model obtained by the exemplar data corresponding to the new target category as Model 0 and Model 1, respectively. The detailed procedure is as follows:
  • Step 1: Offline in-library/In-Distribution (ID) target detection training with image samples featuring s categories of targets and offline Outlier Exposure (OE) training with diverse unlabeled EO-SAR image samples from the wider OOD set, obtain Model 0;
  • Step 2: Deploy the trained system into the test environment and present to Model 0 N OOD samples;
  • Step 3: Divide the N OOD samples into C clusters by jointly considering the target feature and the context information with a clustering module, with cluster c i , i = 1 , , C consisting of s i , i = 1 , , C samples;
  • Step 4: If s i passes a predetermined threshold N i t r , or s i + s i + 1 (i.e., the total number of OOD samples in a cluster and its nearest neighbor in feature space) passes threshold N 1 , i t r , allow a human observer to add a new target category label to the library and annotate less than N 2 , i e x e m p representative OOD EO-SAR pairs according to the CGRID-Key exemplar selection strategy, with N i e x e m p N i t r < N i t r N ;
  • Step 5: Update Model 0 using the samples belonging to c i and representative old samples (to avoid catastrophic forgetting), obtain Model 1;
  • Step 6: (optional) Repeat Steps 2–5 if necessary;
  • Step 7: Redeploy the system to the test environment to test the ID target classification performance and the OOD sample detection performance.
Figure 6. The incremental learning scenario.
Remotesensing 17 02808 g006
Further implementation details are provided in Section 3.1.2.

3. Simulation Results

To verify the effectiveness of the proposed EO-SAR scene understanding architecture, the experimental results obtained in a series of numerical simulations are presented in this section.
In Section 3.1, the experiments are based on the UNICORN dataset, which contains the aligned EO-SAR images collected over the Wright–Patterson Air Force Base in the U.S., and the coverage is 25.1 km2. The images are collected with the airborne sensors described in [51] and are available in six different resolutions ( R 0 , R 1 , , R 5 ), which have a common ratio of 2 between every adjacent two of them. For SAR images, R 0 = 0.282 m ×   0.232 m (finest resolution), R 1 = 0.564 m × 0.465 m, R 2 = 1.13 m × 0.929 m, R 3 = 2.26 m × 1.86 m, R 4 = 4.52 m × 3.72 m, R 5 = 9.04 m × 7.44 m. For EO images, R 0 = 0.41 m × 0.41 m (finest resolution), R 1 = 0.82 m × 0.82 m, R 2 = 1.64 m × 1.64 m, R 3 = 3.28 m × 3.28 m, R 4 = 6.57 m × 6.57 m, R 5 = 13.14 m × 13.14 m. Since the images contained in the dataset for vehicle ATR are multiview images spanning 0–360 degrees collected by airborne SAR-EO sensors and annotated with fine-labels, it supports target recognition based on the CGRID-Key strategy and class-incremental learning, i.e., the 3B branch in Figure 2.
In Section 3.2, the experiments are based on the self-constructed EO-SAR aircraft dataset featuring Heathrow Airport in the U.K. (coverage: 16.3 km2), the Kuala Lumpur (KL) International Airport in Malaysia (coverage: 24.0 km2), and the Suvarnabhumi airport in Thailand (coverage: 24.4 km2), as well as the OSdataset [47]. According to [47], the OSdataset is supposed to cover 20 civilian airports in Beijing, Shanghai, Suzhou, Wuhan, Sanhe, Yancheng, Dengfeng, Zhongshan, and Zhuhai in China; Renne in France; Tucson, Omaha, Guam, and Jacksonville in the U.S.; and Dwarka and Agra in India. But with close inspection, we notice that it also covers the Arizona aircraft boneyard, which houses about 4000 retired civilian and military aircraft. The SAR images of Heathrow Airport, KL airport, and Suvarnabhumi airport share a common resolution of 0.5 m (collected by X-band ICEYE satellite-borne SAR), and those from the OSdataset have 1 m resolution (collected by C-band GaoFen-3). The optical images of the airports share a common resolution of 0.5 m. The total number of annotated SAR images and optical images are 2719 and 2897, respectively. The difference is due to the fact that the optical and the SAR images for the airplane ATR experiment were acquired at different dates from different angles, and hence contain different aircraft targets. Since the images in the aircraft dataset are single-view images annotated with a common superclass label (“airplane”) rather than fine-class labels (e.g., “Boeing737”), binary predictions are made about the presence of the aircraft (i.e., the 3A branch in Figure 2).

3.1. Experiment Results on the UNICORN Dataset

3.1.1. Parking Lot Recognition with SRM

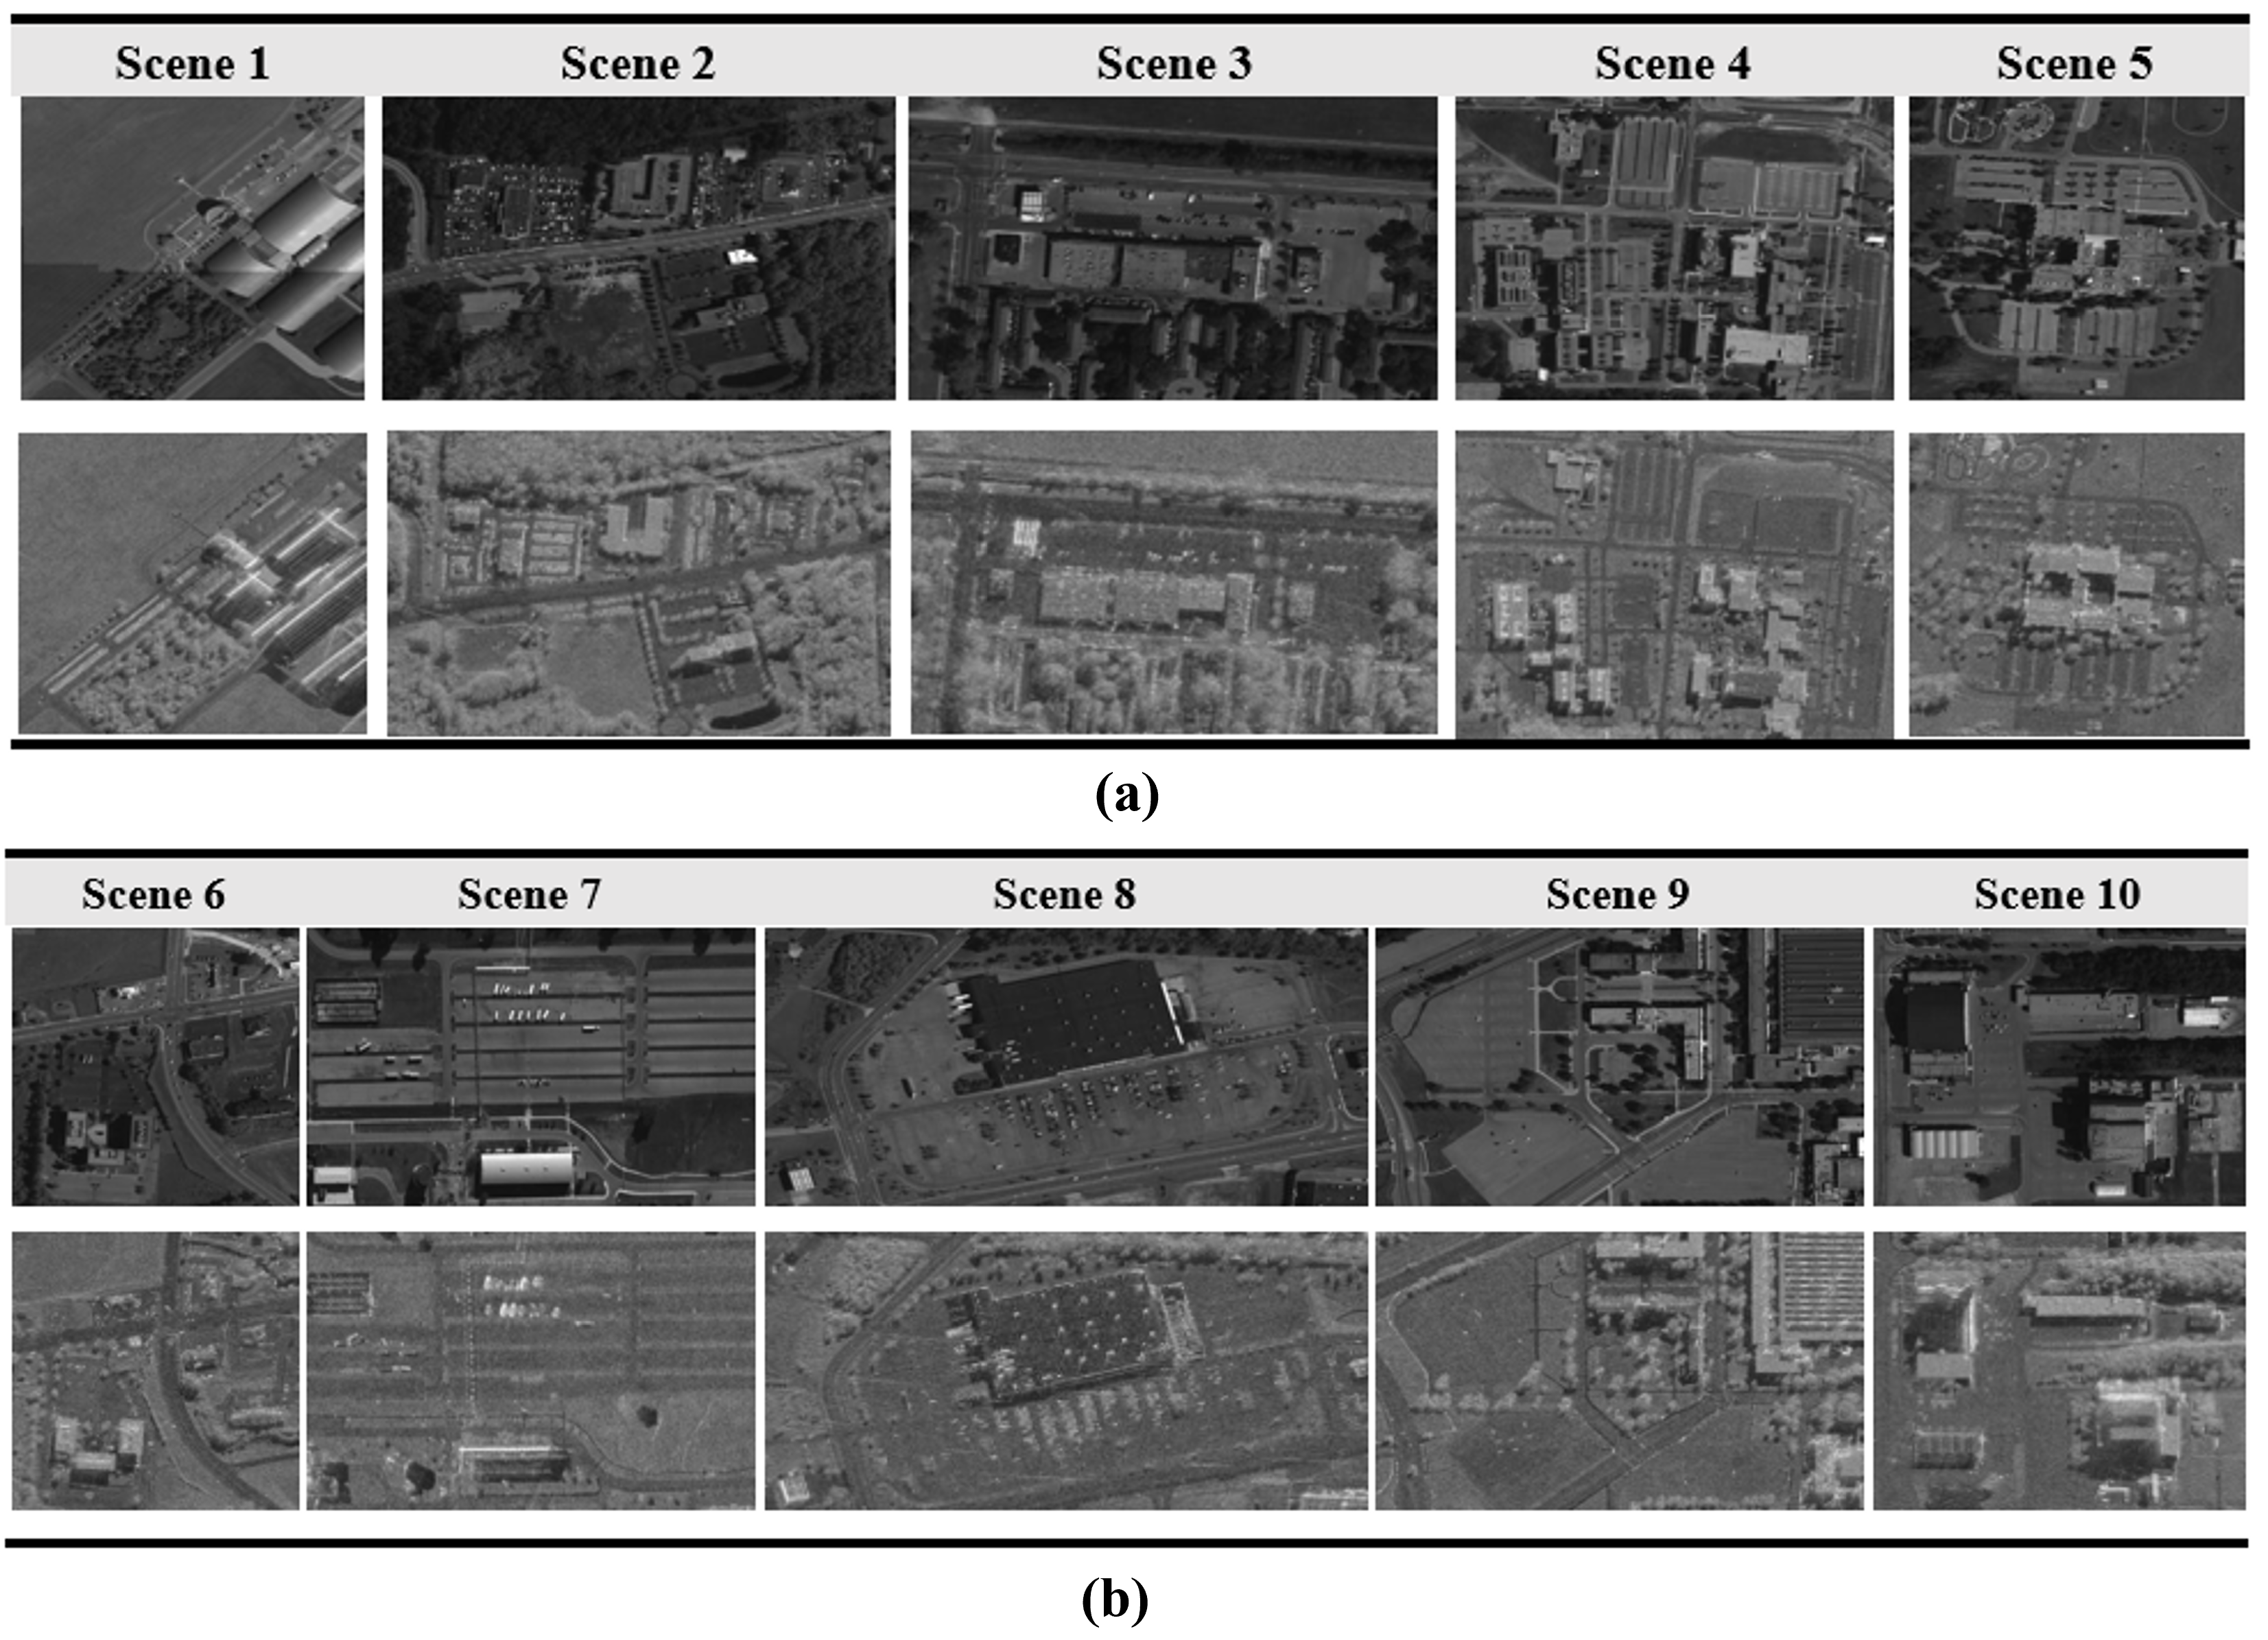
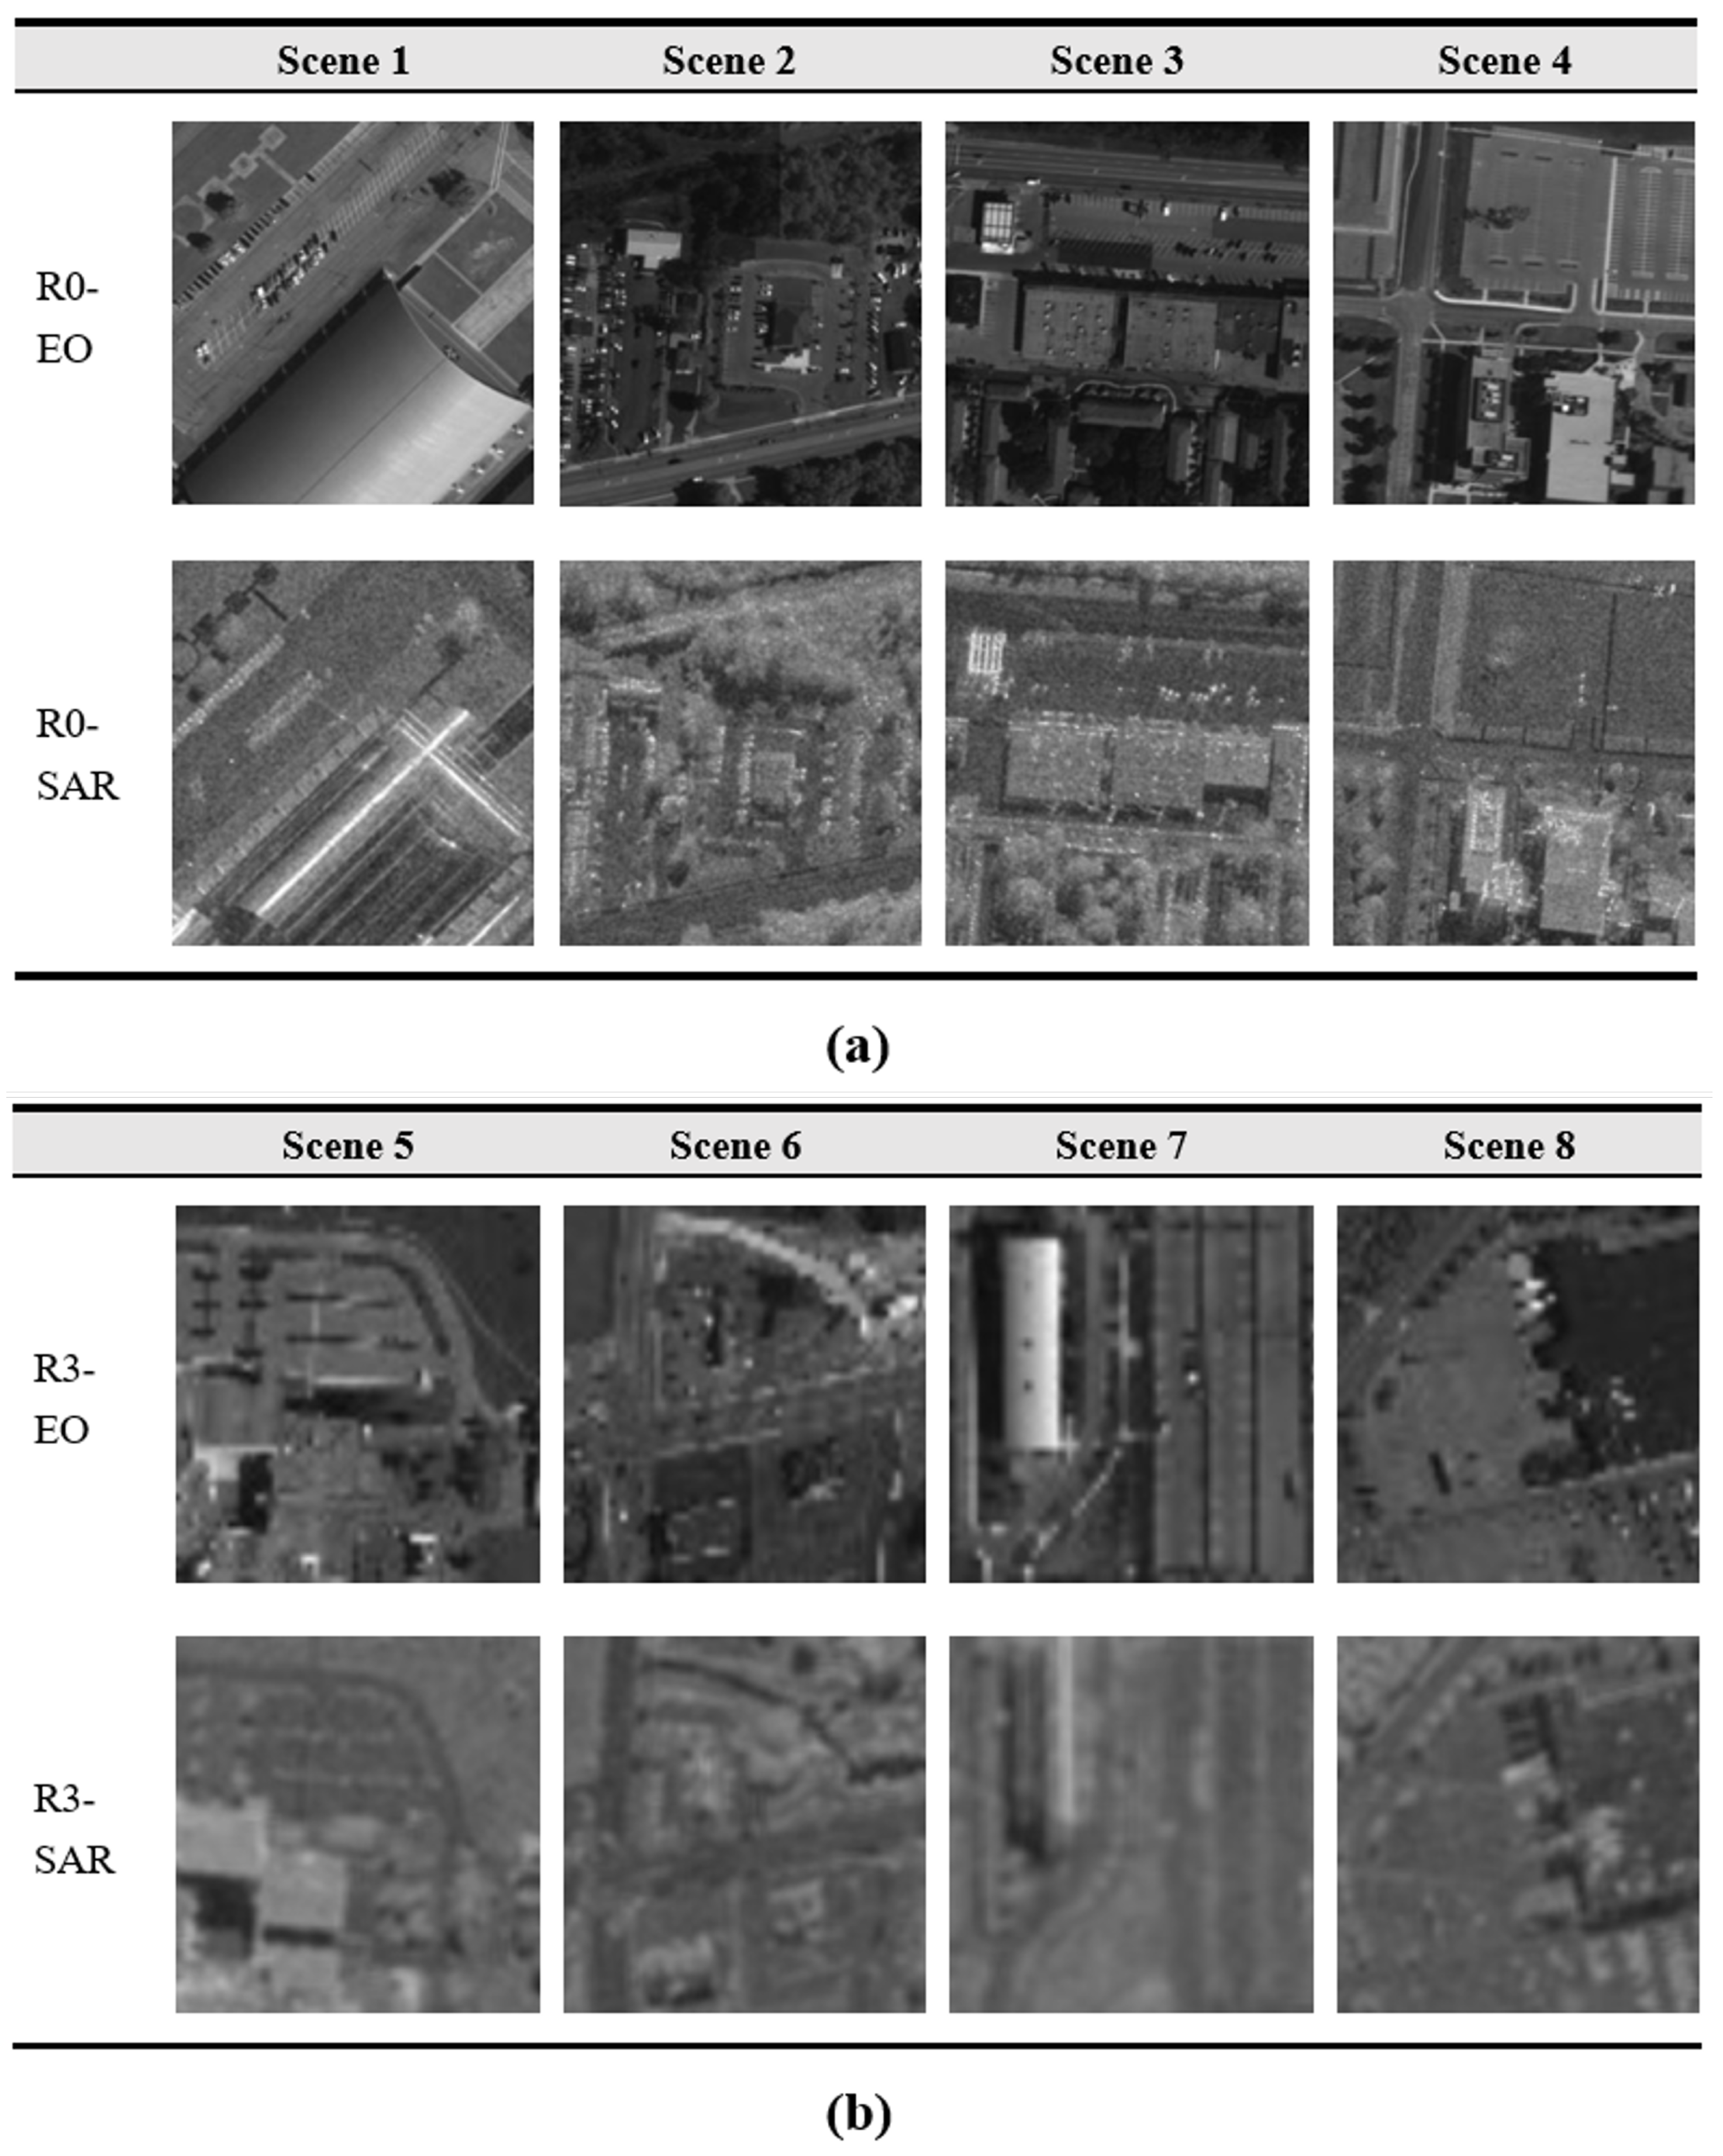
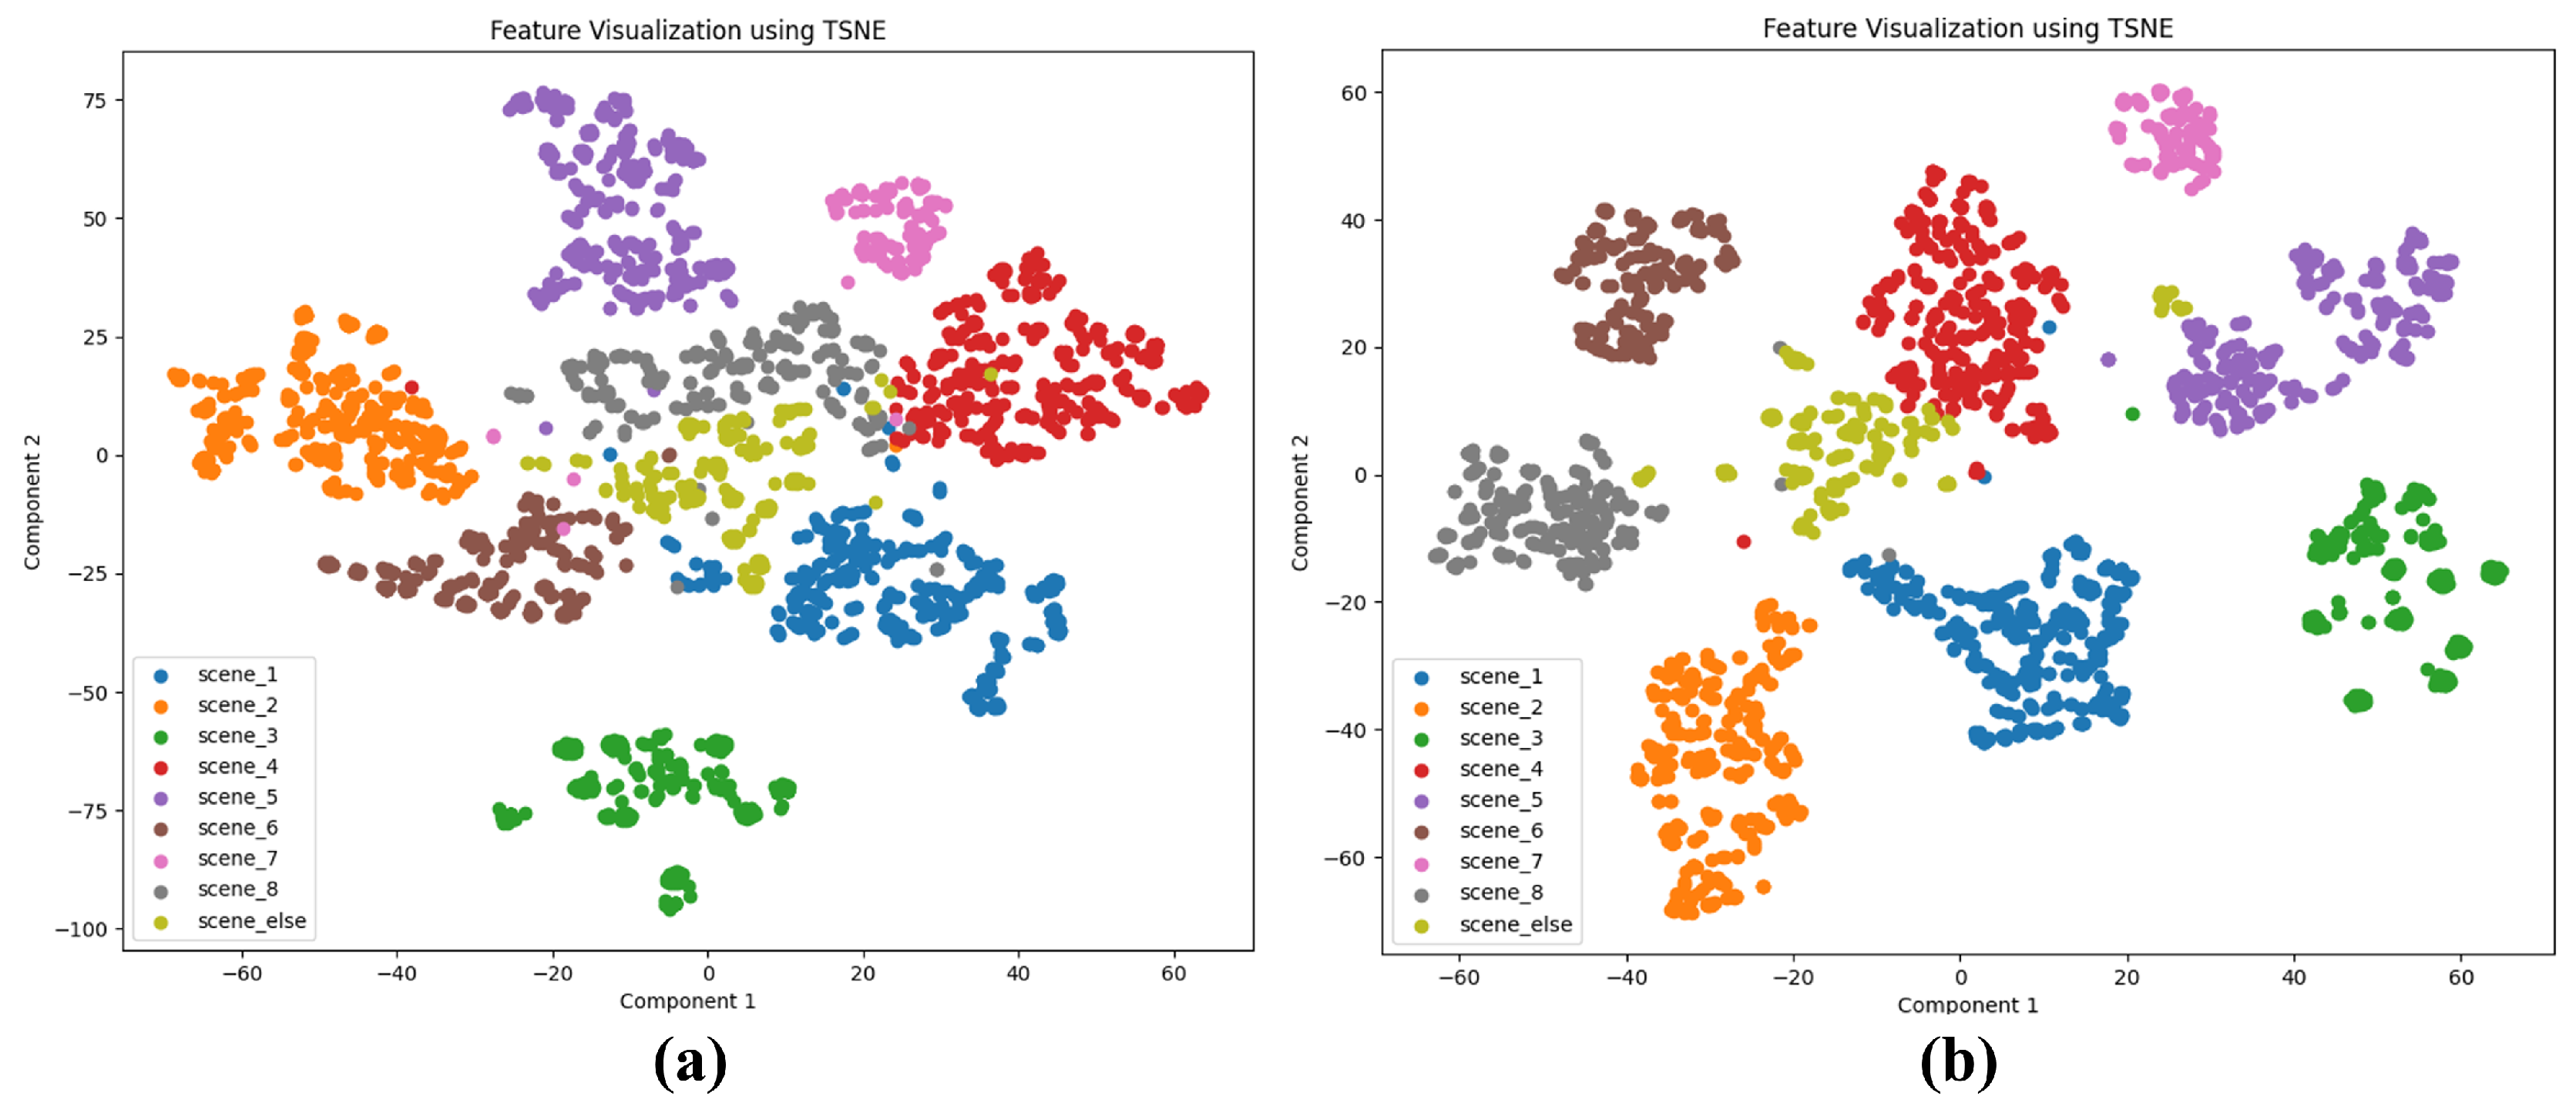
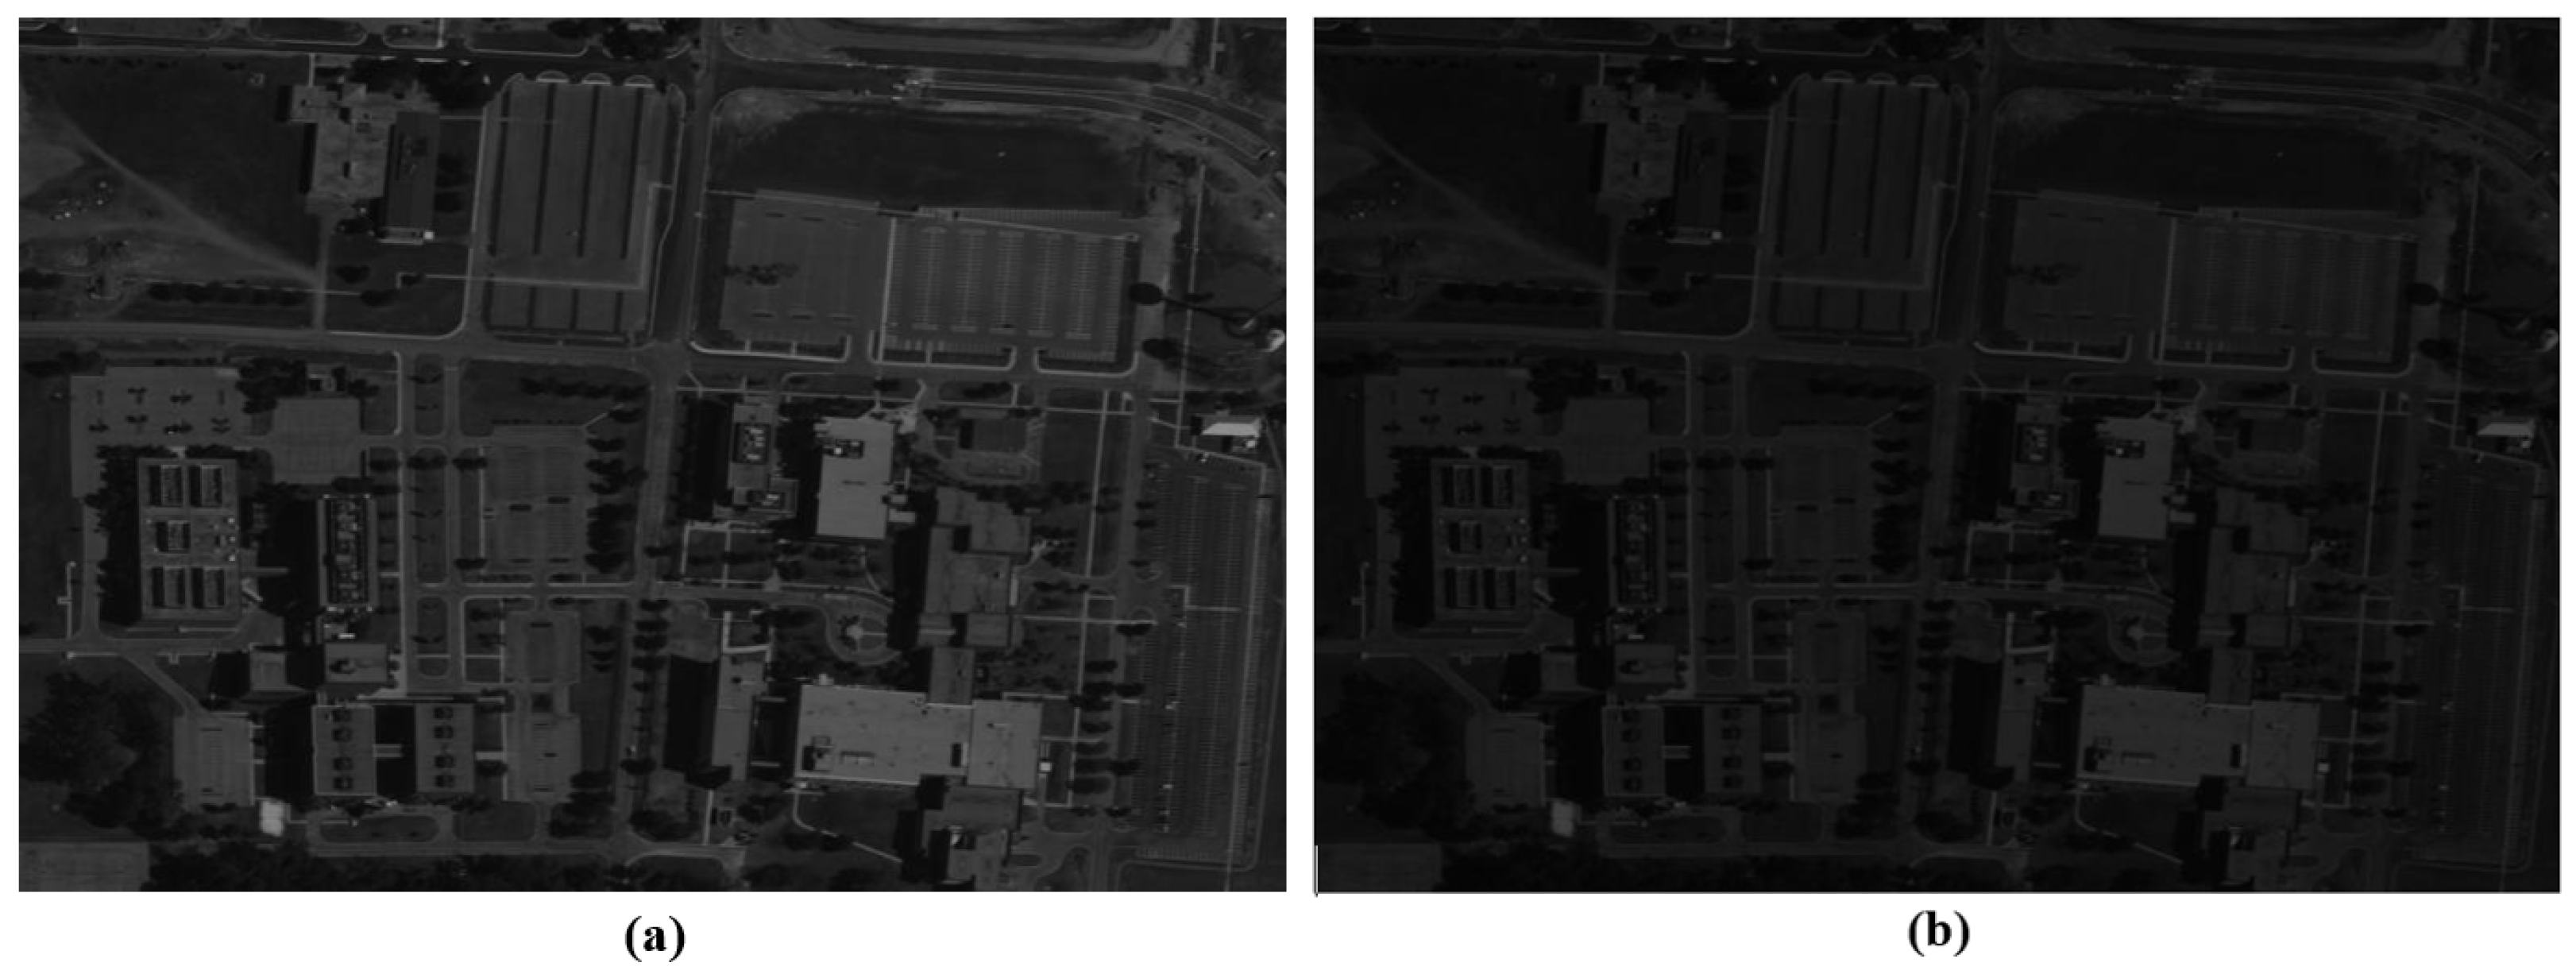
We select ten representative parking lots at the Wright–Patterson Air Force Base for parking lot recognition. Scene 1–Scene 8 are used as the in-library/In-Distribution (ID) scenes. Scene 9 and Scene 10 are used as the OOD data. The EO-SAR images for Scene 1–Scene 10 are summarized in Figure 7. To investigate the impact of image resolution on scene recognition, we use the high-resolution SAR images for training, which consist of 2485 EO-SAR image pairs, and the low-resolution ones collected from other observation angles for testing. The EO-SAR image chips of the eight parking lots used for training and testing are shown in Figure 8. The t-Distributed Stochastic Neighbor Embedding (t-SNE) Visualizations for SAR and EO images are illustrated in Figure 9. It can be seen that the spacing between the EO image feature clusters is greater than that of the SAR image feature clutters. EO image quality degradation in poor light conditions is illustrated in Figure 10. “Lux” is a value measuring illuminance, whose values are extracted from the HSV (Hue, Saturation, Value) images with a mapping function. By jittering the V channel in the HSV images, the Lux values could be adjusted.
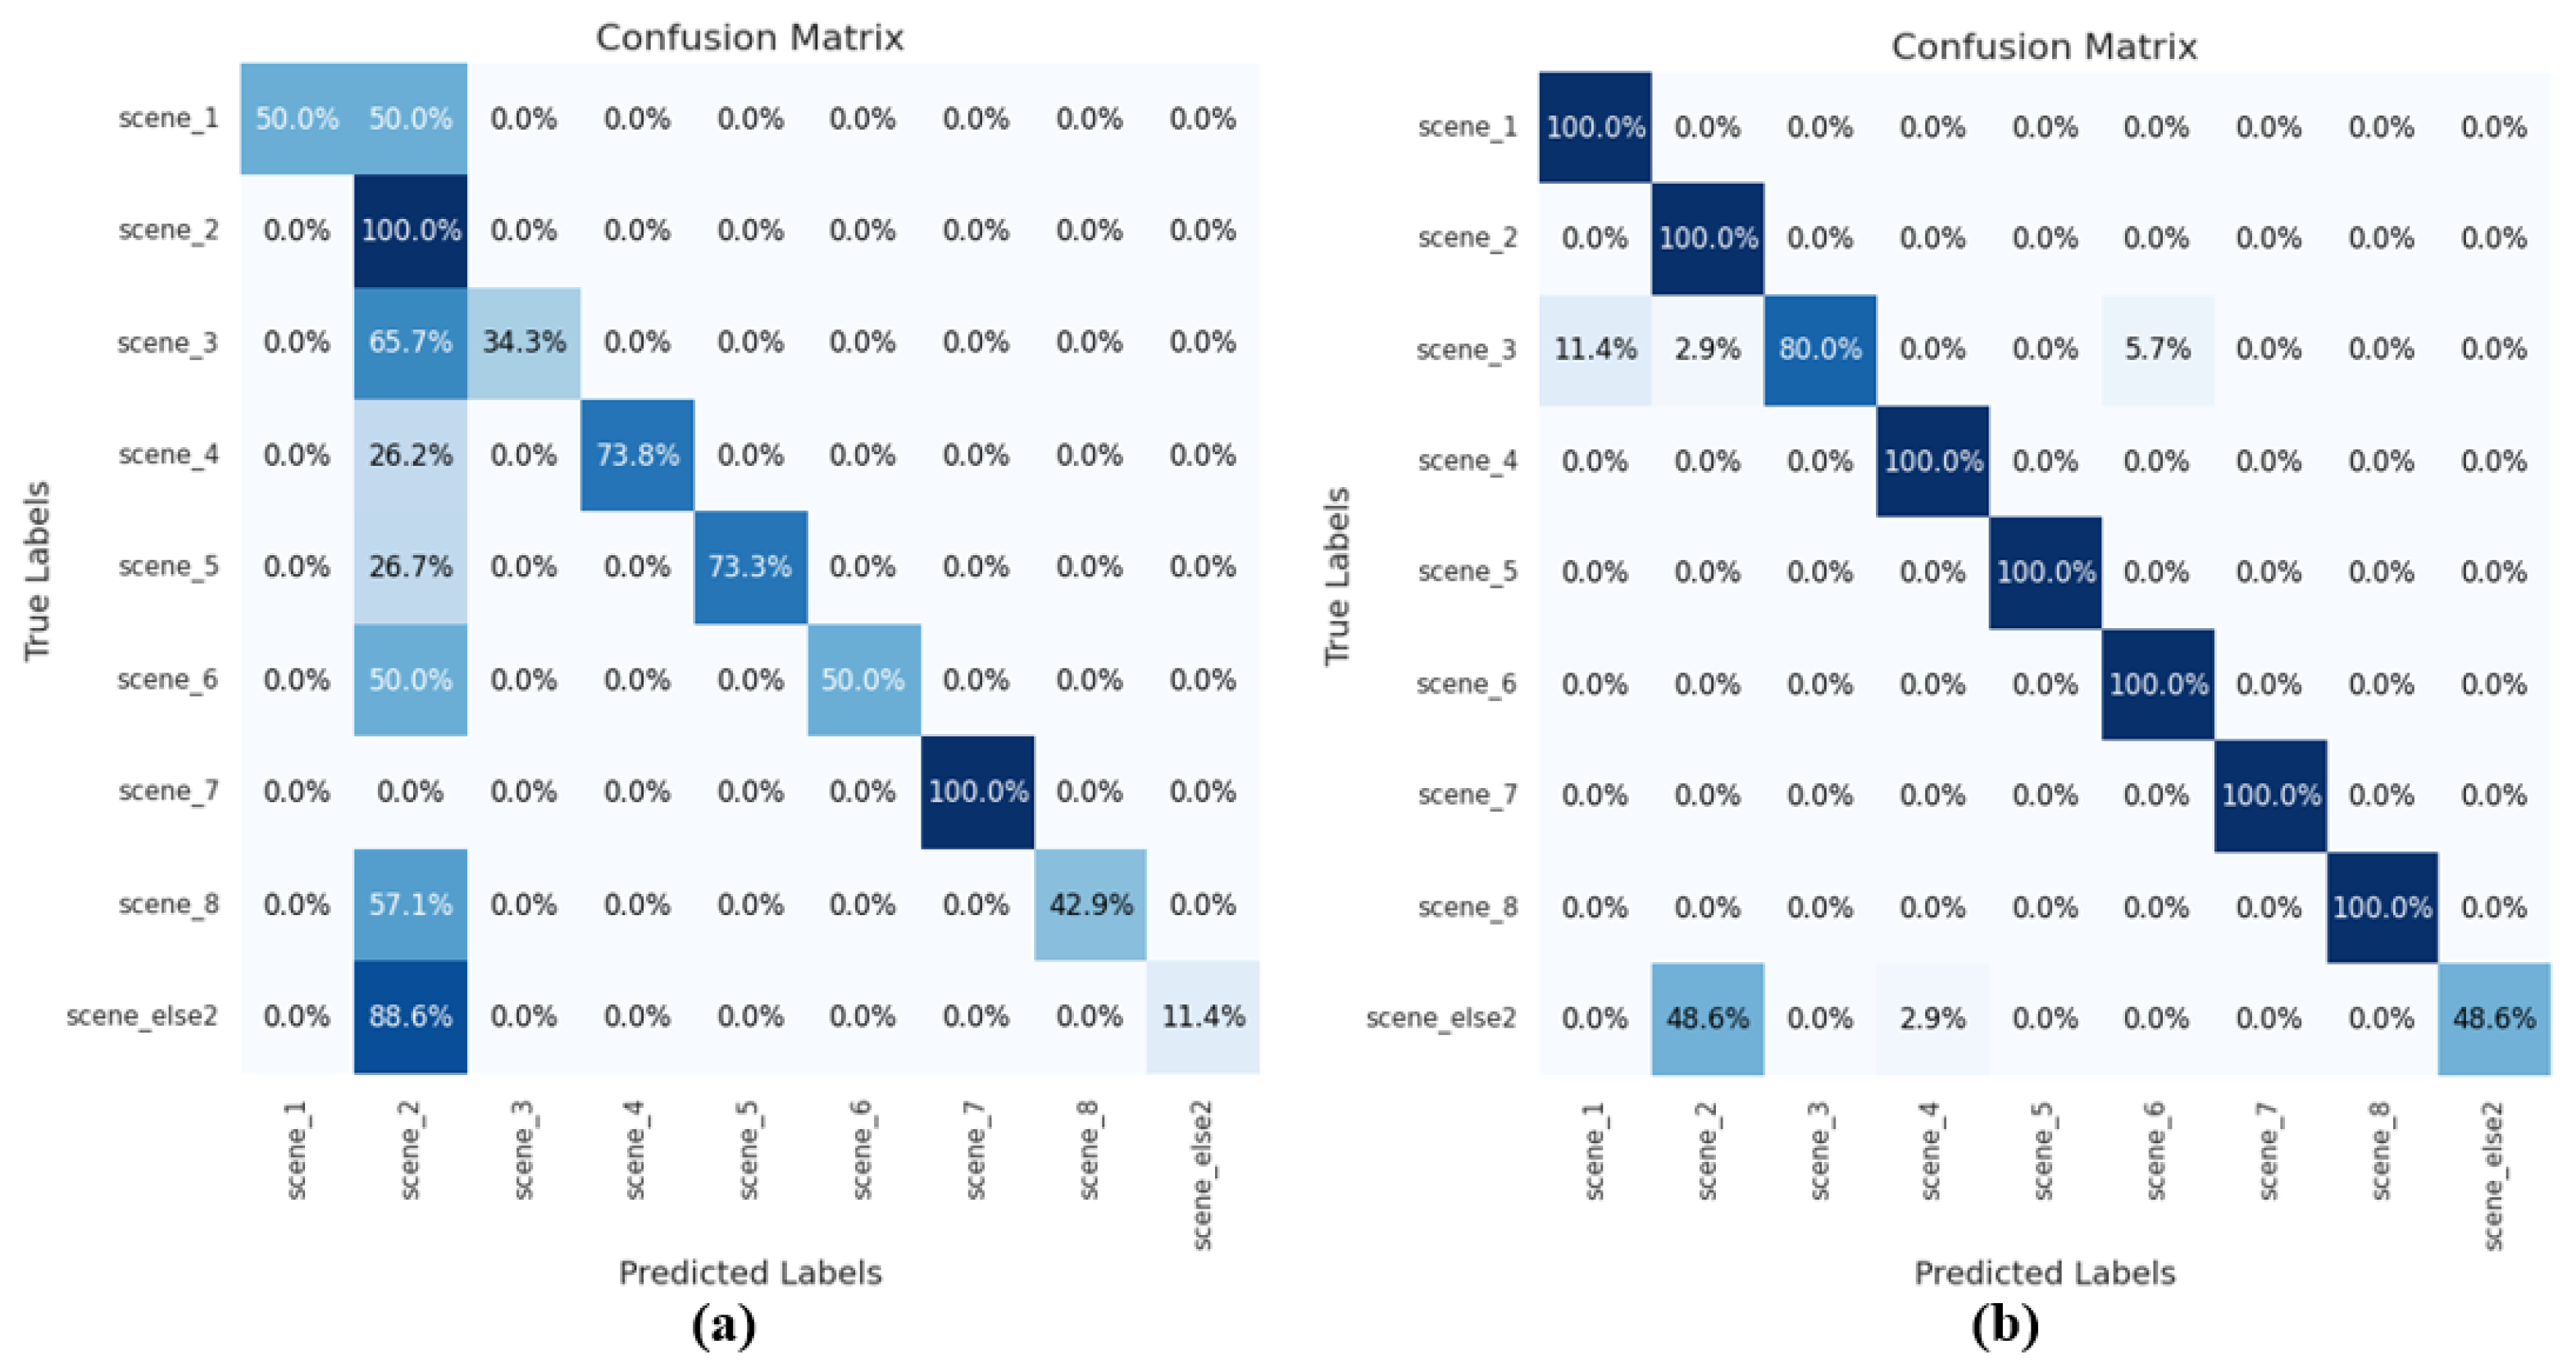
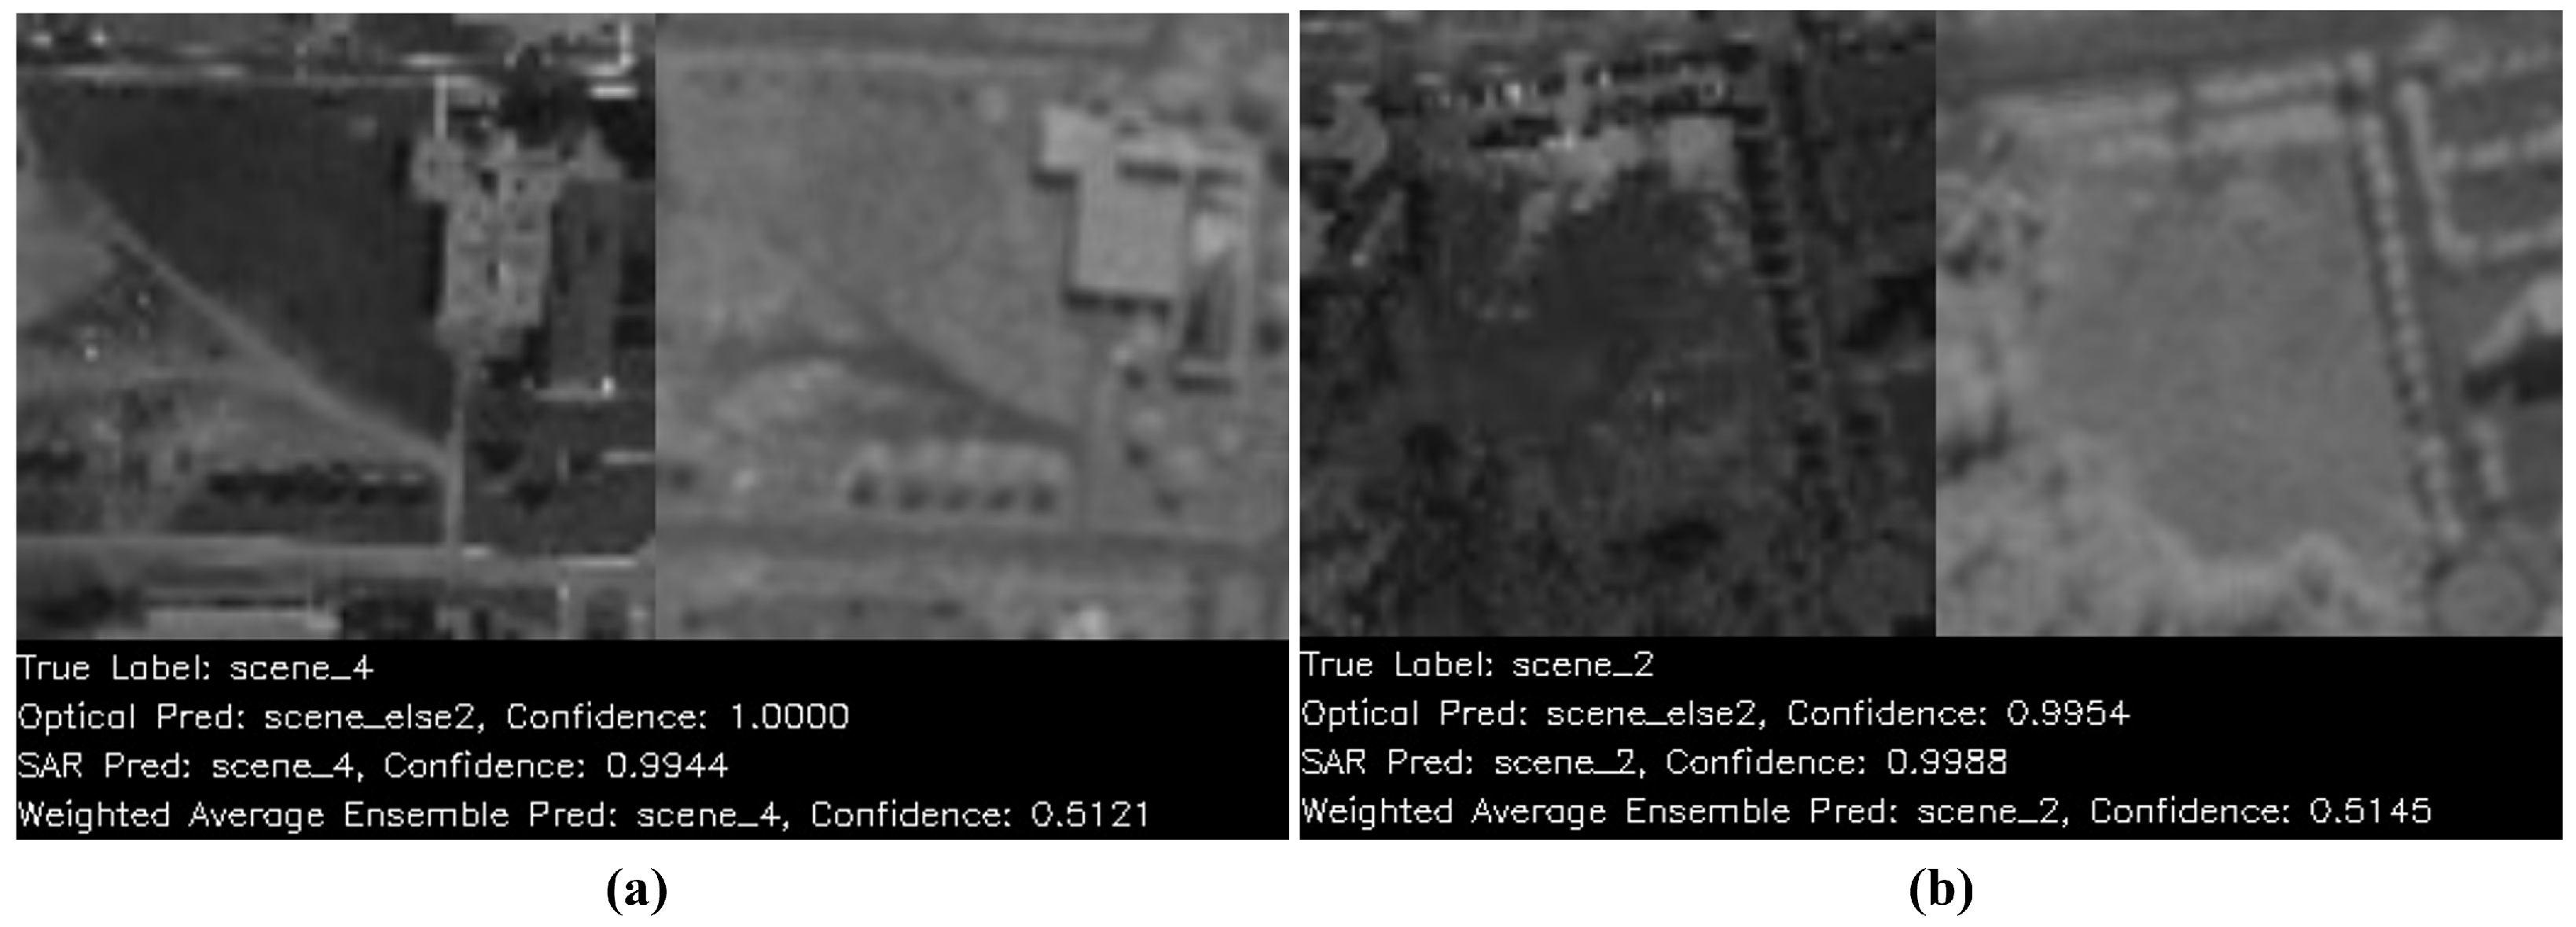
Classification accuracies obtained with naive average, score ranking, and weighted average are summarized in Table 1. The weighting factors for EO and SAR images under various light conditions in the parking lot ATR experiment are summarized in Table 2. Note that these Lux values are selected to show the impact of weight adjustment in the reactive region, i.e., from the point the recognition performance starts to deteriorate to the point that the information contained in the EO images is fully corrupted. The EO images were collected with an airborne EO sensor composed of a matrix of six cameras. Each camera was made by Illunis employing a Kodak KAI-11002 Charge Coupled Device (CCD). The optics are a Canon 135 mm EF mount lens controlled with a Birger adapter. Thanks to the multiview monochronic EO images featuring high dynamic range, the overall classification performance starts to benefit from weighting factor increase for the SAR images only when the Lux value reduces to 50. Confusion matrices corresponding to ensemble learning based on naive average and weighted average when the light condition is poor (Lux = 20) are shown in Figure 11. The advantage of weighted average is obvious. The predictions made for two example images based only on the optical image, the SAR image, and the prediction made via weighted average ensemble are provided in Figure 12. It can be seen that, for Example 1, the predictions made based solely on the optical and the SAR image are “Scene-else 2 (1.0000)” and “Scene 4 (0.9944)”, respectively. And the weighted average based on the weights provided in Table 2 is “Scene 4 (0.5121)”.

3.1.2. Target Recognition Based on the CGRID-Key Strategy

The EO-SAR image pairs for 10 types of vehicle in the UNICORN dataset are shown in Figure 13. In the vehicle ATR experiment, we treat Class #0 (sedan) and Class #1 (SUV) as the OOD data and train the network with the remaining eight categories of vehicle. Note that the data are heavily imbalanced: the Class #2 (pickup truck) and #3 (van) are majority classes consisting of 15,301 and 10,655 samples, respectively, while Classes #4–9 are minority classes with 1741, 852, 828, 624, 840, and 633 samples, respectively. The EO-SAR images of two SUVs collected from eight different observation angles are illustrated in Figure 14, and it can be easily observed that the characteristics of these images varies dramatically. Specifically, EO3 and EO6 are the only two side-view images of the two SUVs, which could be exploited for SUV height estimation and structure analysis. On the other hand, although EO8 is the best top-view EO image, the target features are barely visible in SAR8. Meanwhile, the imaging quality of SAR6 is much better than that of SAR3, and SAR5 is the best among all top-view SAR images. Hence, for this particular example, more information regarding the two SUVs could be extracted from the two superior EO-SAR pairs (EO5-SAR5, EO6-SAR6) than from the six inferior EO-SAR image pairs. As a result, they obtain the highest scores based on the CGRID-Key strategy, as shown in Figure 5.
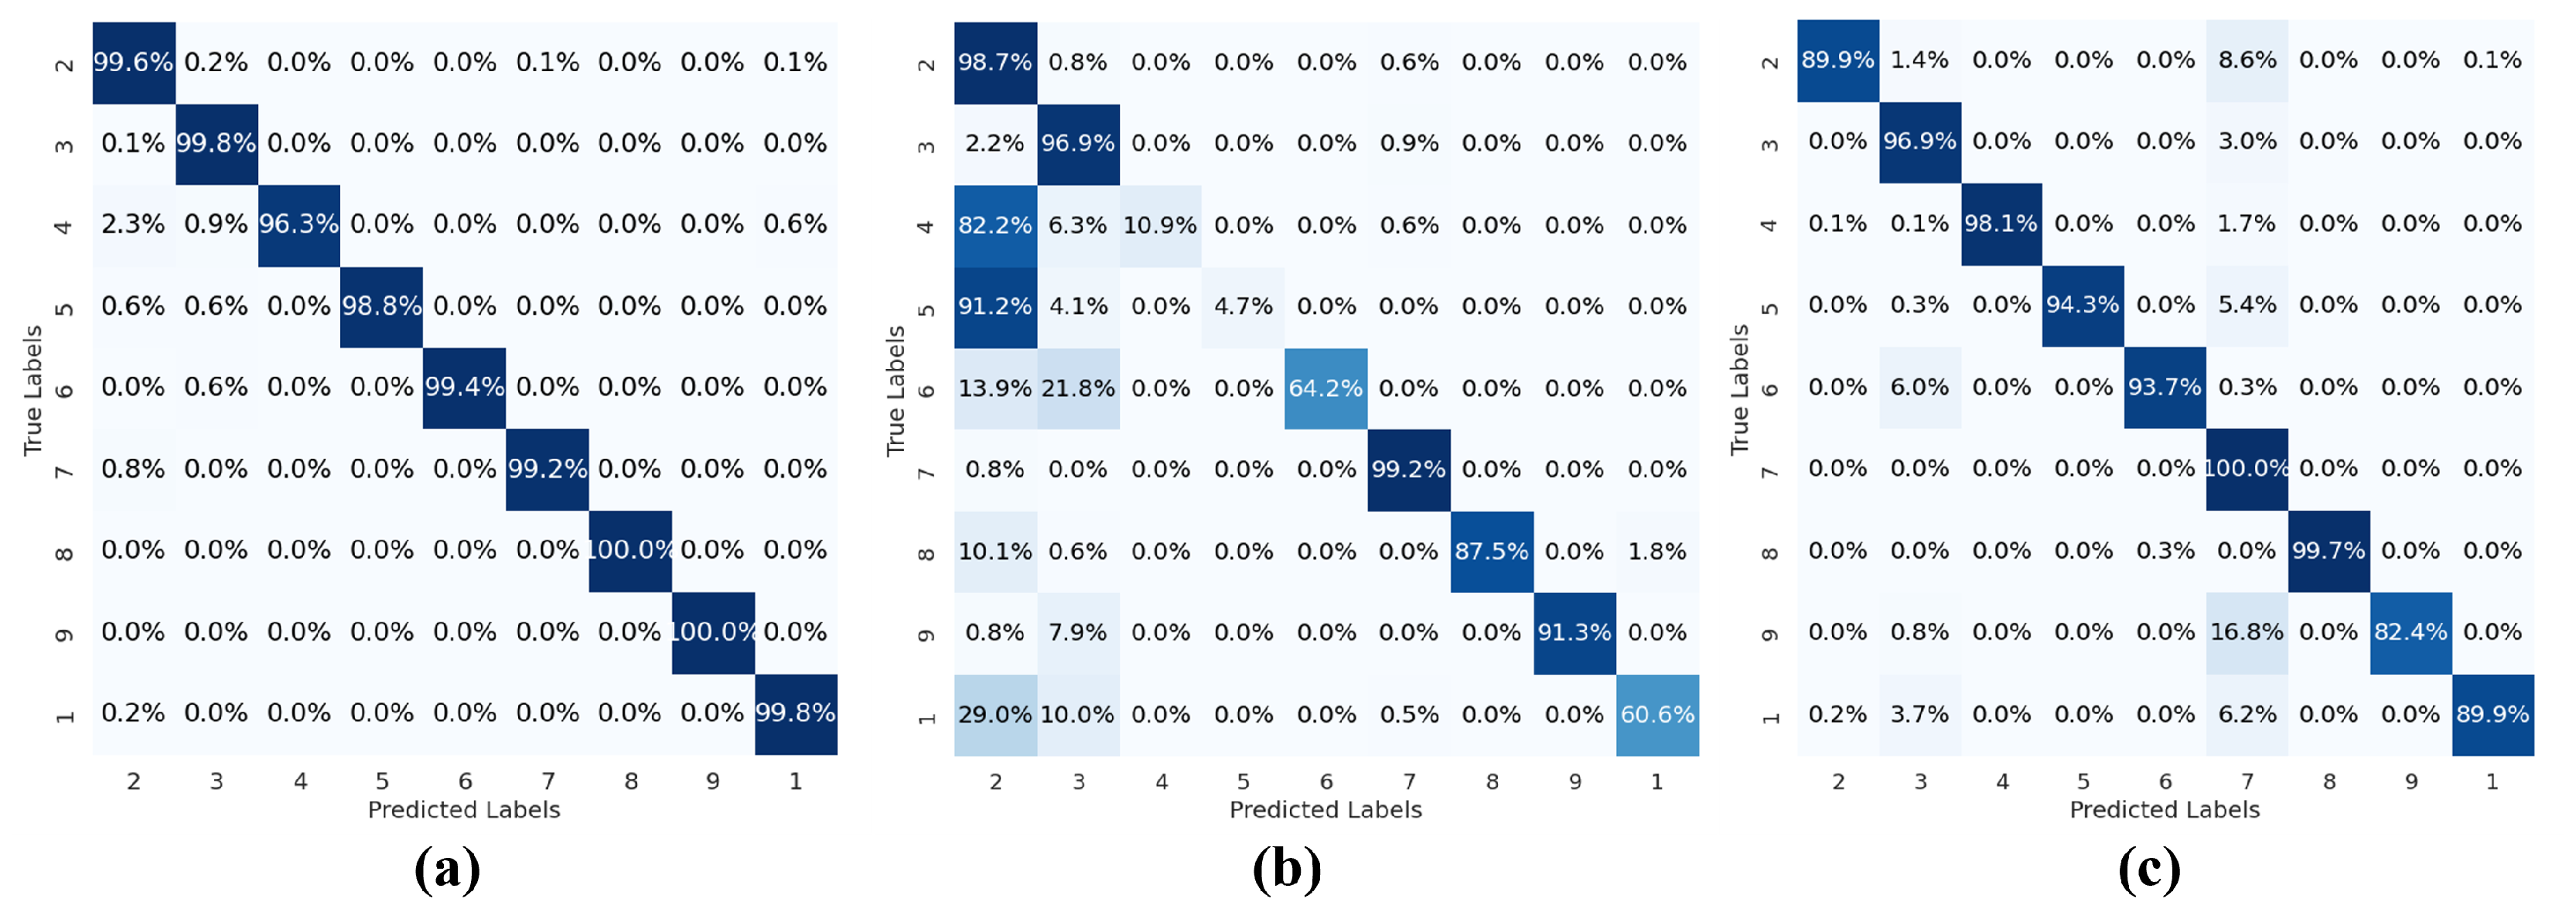
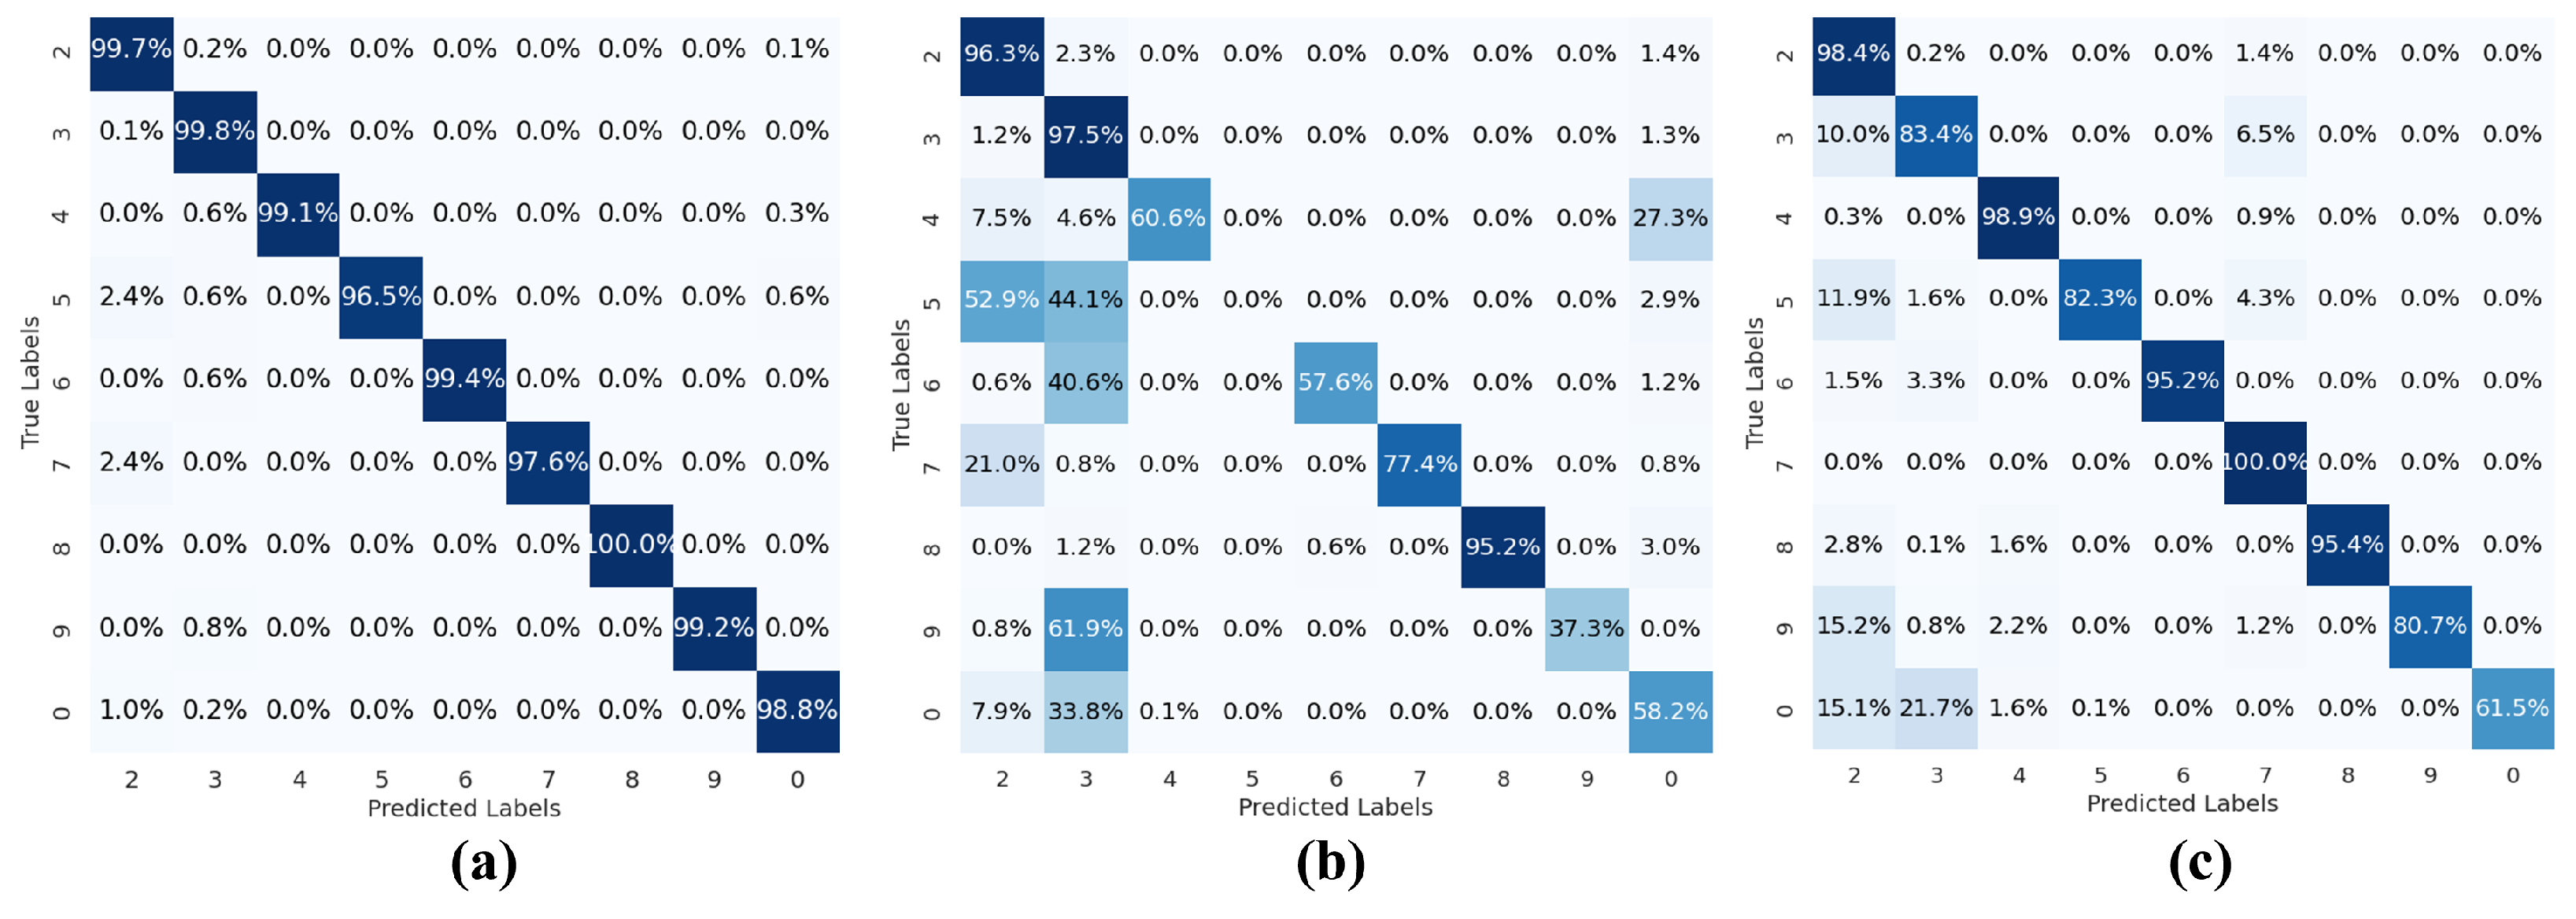
To demonstrate the effectiveness of the proposed exemplar selection strategy, a series of experiments are carried out, with the results summarized in Table 3 (80% of the data for training and 20% for testing). “Exp-1” stands for 8-category classification experiment based on Unicorn-8. For “Exp-2A” and “Exp-2B”, the incremental classes are SUV and sedan, respectively. For each experiment, “OracleSam” represents the strategy of training the network with samples from all the categories and then testing it sample-by-sample. It represents the performance upper-bound for sample-based EO-SAR-ATR methods. “CGRID-Key” corresponds to the method described in Section 2.2, which is carried out as follows:
  • Divide the images into N T + N O E = N P subsets, with N T accounting for the cases that 1 or 2 vehicles are present, and N O E accounting for the cases that 3+ vehicles are present.
  • Use images in N O E for OE training and obtain Model 0, in which process random vehicle cropping and poisson image fusion are employed to reduce the impact of vehicle quantity and the background (see Figure 15).
  • Assume that N T contains N T prototypes, add new vehicle category, and have N T r a i n S e e d 1 / 4 N T prototypes of the incremental class annotated manually.
  • Use the annotated samples as seeds and generate N T r a i n training samples via clustering.
  • Train Model 0 with N T r a i n synthesized samples and representative old samples (to avoid cartographic forgetting), obtain Model 1.
  • Test the performance of Model 1 with N T N T r a i n S e e d 3 / 4 N T prototypes based on the key-view exemplars.
Table 3. EO-SAR ATR accuracies obtained with OracleSam (performance upper bound), the random selection strategy (baseline), and the proposed CGRID-Key strategy (%). The class indexes match the ones assigned in Figure 13.
Class0123456789
Method
Exp-1OracleSam--99.899.698.010010098.4100100
Exp-2AOracleSam-99.899.699.896.398.899.499.2100100
Baseline-60.698.796.910.94.764.299.287.591.3
CGRID-Key-89.989.996.998.194.393.710099.782.4
Exp-2BOracleSam98.8-99.799.899.196.599.497.610099.2
Baseline58.2-96.397.560.6057.677.495.237.3
CGRID-Key61.5-98.483.498.982.395.210095.480.7
Note that the procedure described above fits well with a typical field mission, where the human operator elects to annotate a small amount of representative OOD samples and expects the deployed ATR system to learn from these samples and would recognize these targets in the future. Specifically, for Exp-2A, N T = 19 , N T r a i n S e e d = 5 , N T r a i n = 4000 . “Baseline” represents the strategy of “retraining the network with randomly-selected samples rather than key-view exemplars selected according to the CGRID-key strategy in Figure 5”. It is shown that, in Exp-2A, CGRID-Key offers a classification accuracy of 89.9% for SUV, which is 29.3% higher than the baseline model.
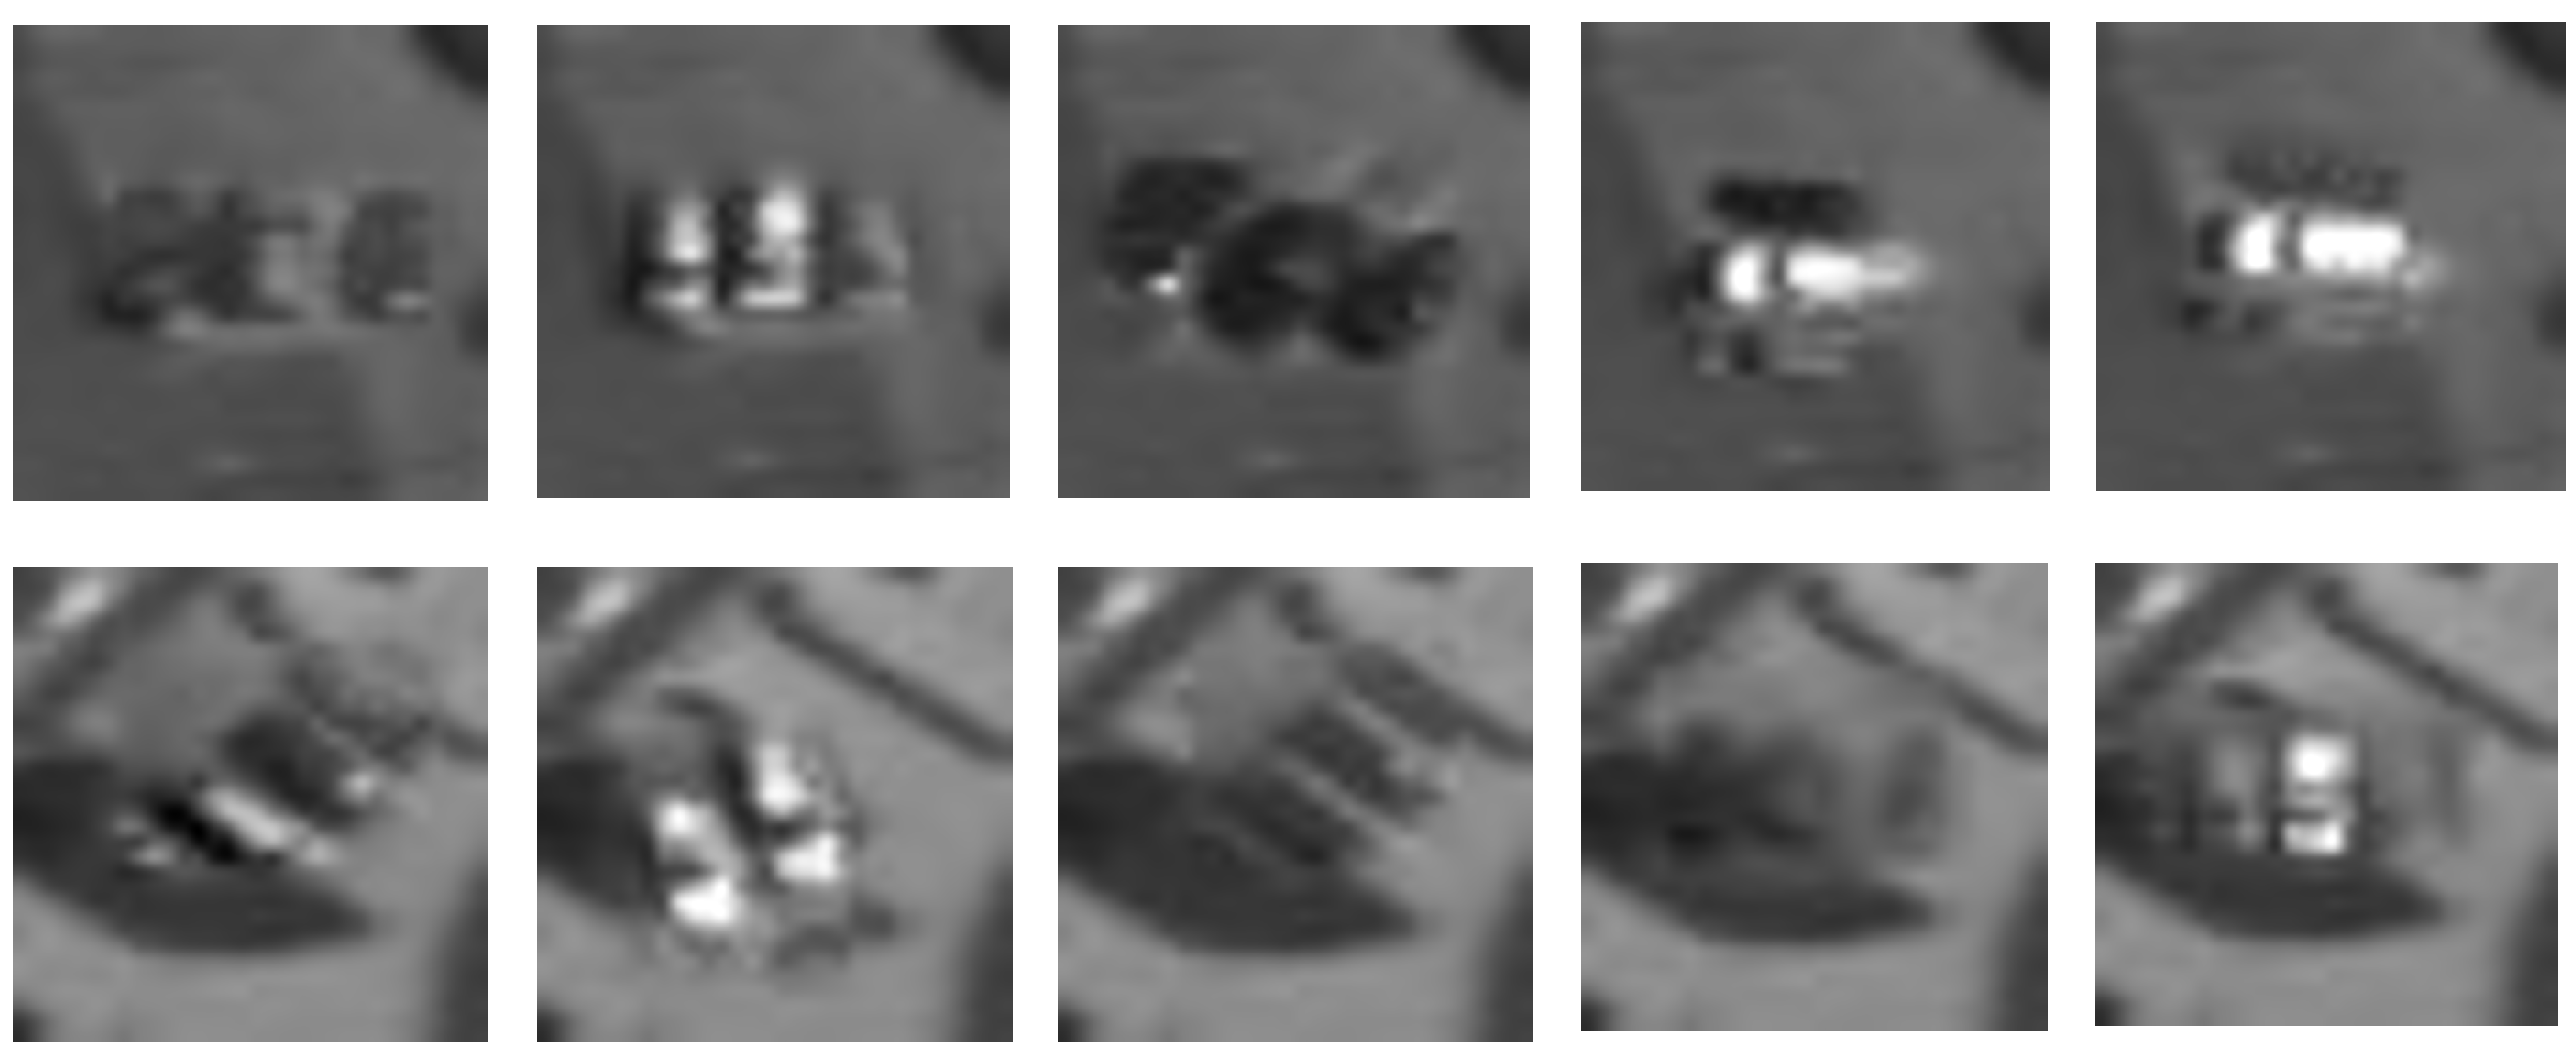
The confusion matrices obtained with randomly selected exemplars (i.e., “Baseline”) and the proposed CGRID-Key strategy in Exp-2A and Exp-2B are presented in Figure 16 and Figure 17, respectively. It can be seen from Figure 16 that in Exp-2A the baseline method misclassified 29% samples of the new category Class #1 (SUV) as Class #2 (pickup trucks, majority class) and 10% as Class #3 (vans, majority class), while the classification accuracy for Class #1 provided by CGRID-Key is 89.9%. In comparison, Figure 17 shows that in Exp-2B, where Class #0 (sedan) is used as the incremental class, the classification accuracy for Class #5 (motorcycle) offered by the baseline method drops to zero since a large amount of image samples contain both motorcycles and sedans/SUVs (see Figure 18). By retraining the network with randomly selected samples, catastrophic forgetting happened and the memory regarding the features of some in-library minority classes (e.g., Class #5, motorcycle) are erased. Moreover, although the performance degradation of CGRID-Key due to the introduction of Class #0 is much less severe than the baseline method, the classification accuracy for Class #0 is only 3.3% higher. This indicates that the similarity between the new category and the in-library categories exerts great impact on the performance of the proposed incremental learning method. The feature maps for Experiment 2-A and Experiment 2-B are presented in Figure 19 and Figure 20, respectively.
It is worth mentioning that the vehicle category imbalance has a great impact on the results. Fortunately, Step 5 of the proposed incremental learning strategy is to “update Model 0 using the samples belonging to c i and representative old samples, obtain Model 1”, in which process the number of samples from each in-library category is equal. As a result, when more categories are introduced into the continual learning process, the impact of category imbalance is expected to abate gradually.
The essence of the proposed CGRID-Key is that “not every view is created equal” and there is “quality over quantity” for multiview image datasets. This is motivated by the fact that the length/width/height features of a target are more prominent in images acquired from certain angles since the target is anisotropic and resides in an environment full of over-shadowing high-rise buildings. At present, the research in optimum view identification for EO-SAR image pairs is still limited. Once more methods are published, we plan to follow the logic of Query-by-Committee rather than prove that the proposed one is the best. Specifically, a key-view selection committee would be formed and would vote on the selection results they do not agree on.

3.2. Experiment Results on the Self-Constructed EO-SAR Aircraft Dataset

Classification accuracies obtained with naive average, score ranking, and weighted average are summarized in Table 4. The weighting factors for EO and SAR images under various light conditions in the parking lot ATR experiment are summarized in Table 5. Unlike the parking lot experiment, which employs monochromatic EO images collected by advanced airborne EO sensors comprised of Kodak KAI-11002 camera matrices, single-view optical images downloaded from EarthOnline (a provider of satellite imagery) via screenshot are used in the airport recognition experiment, which results in a reactive region with the Lux values presented in Table 2.
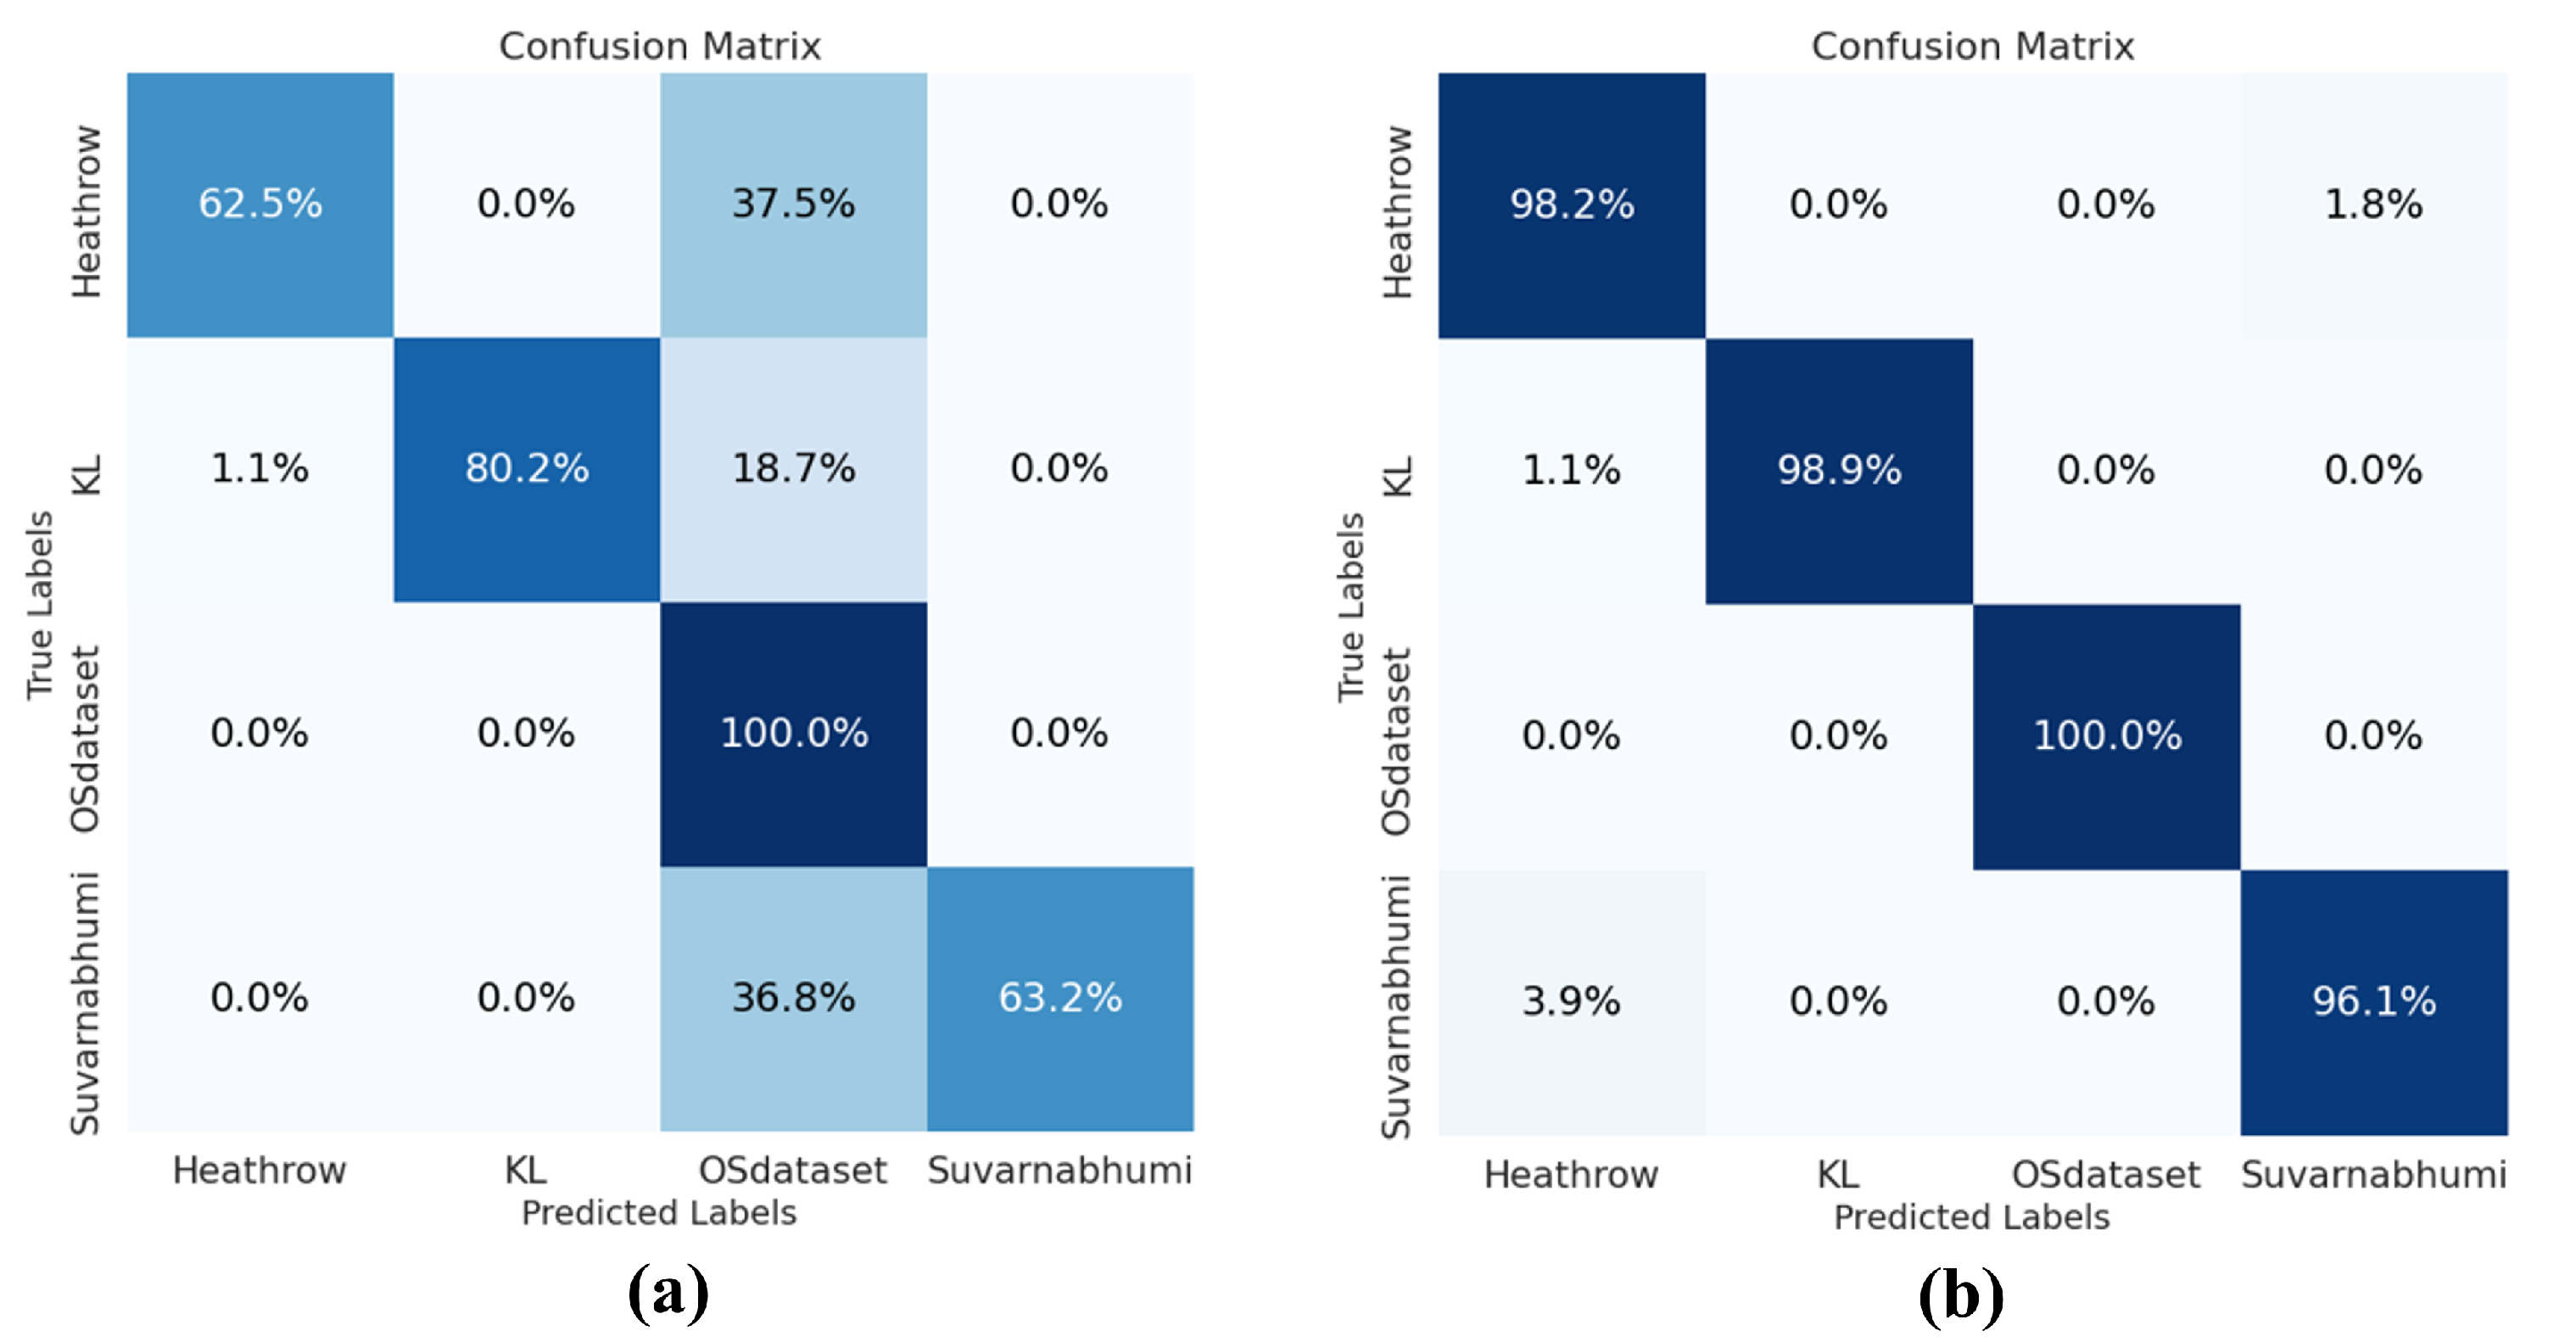
The airport ATR results based only on the optical image, the SAR image, and the prediction made via weighted average ensemble are shown in Figure 21. The confusion matrices corresponding to ensemble learning based on naive average and weighted average in the airport ATR experiment under the condition Lux = 60 are provided in Figure 22a and b, respectively. The advantage of the proposed weighted average method is obvious, especially for Heathrow Airport in the U.K. and the Suvarnabhumi airport in Thailand.
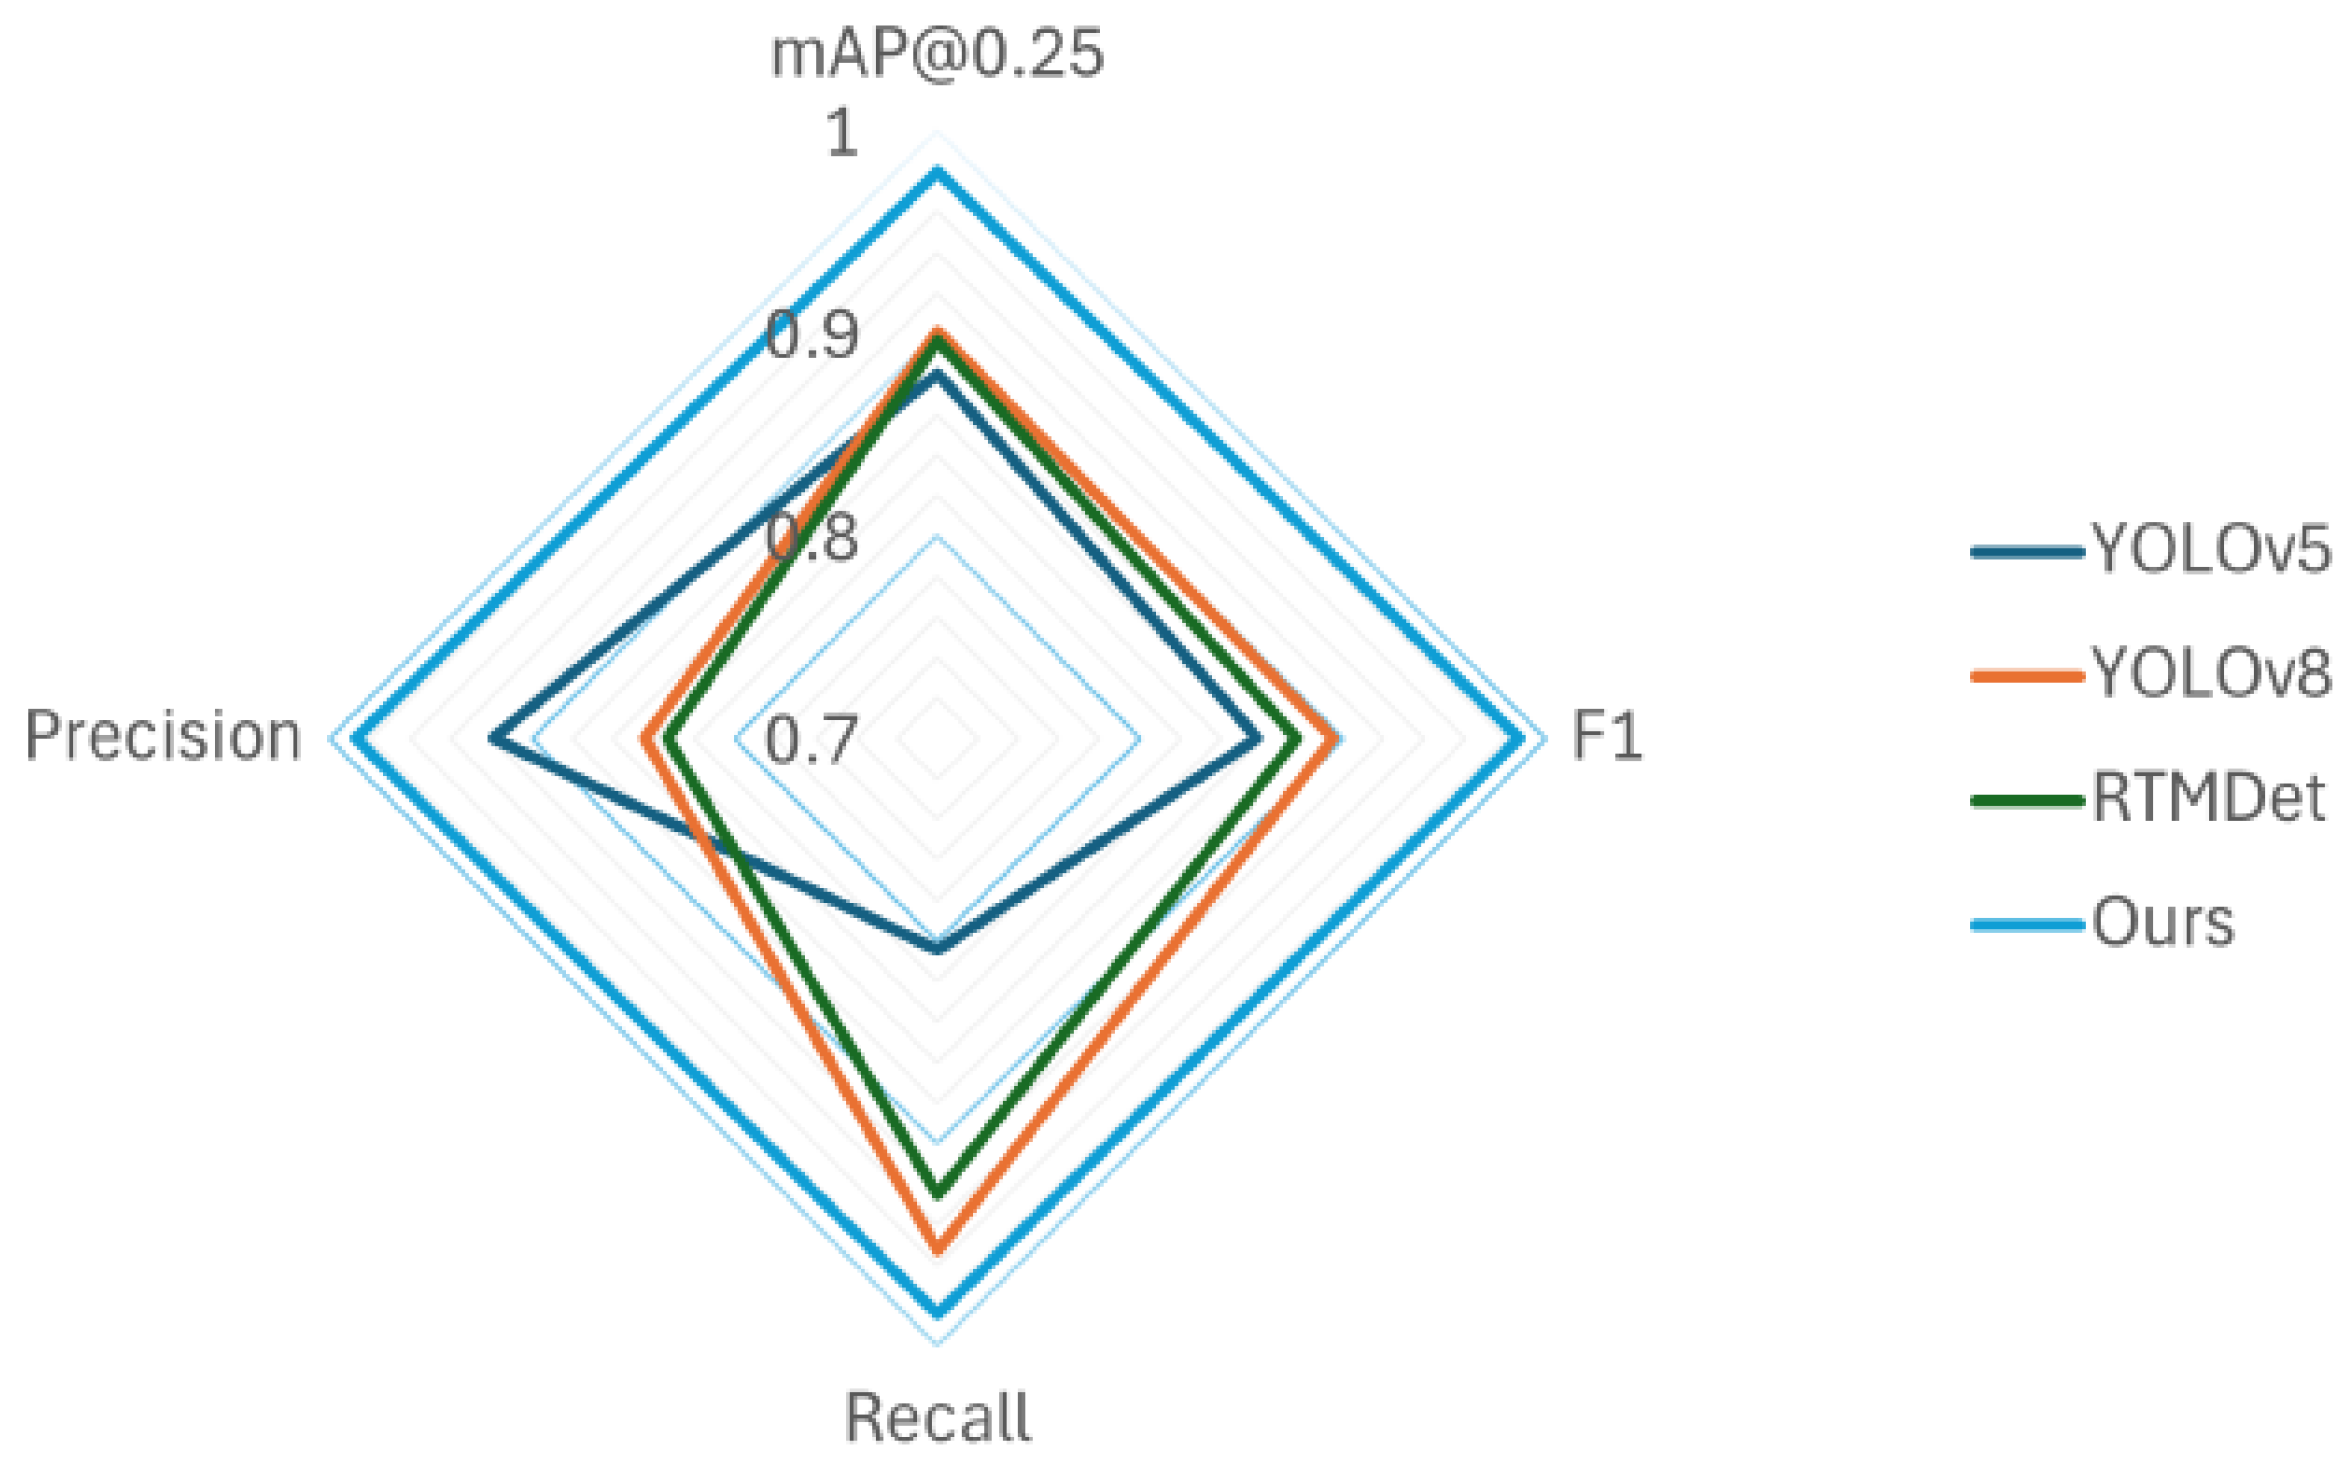
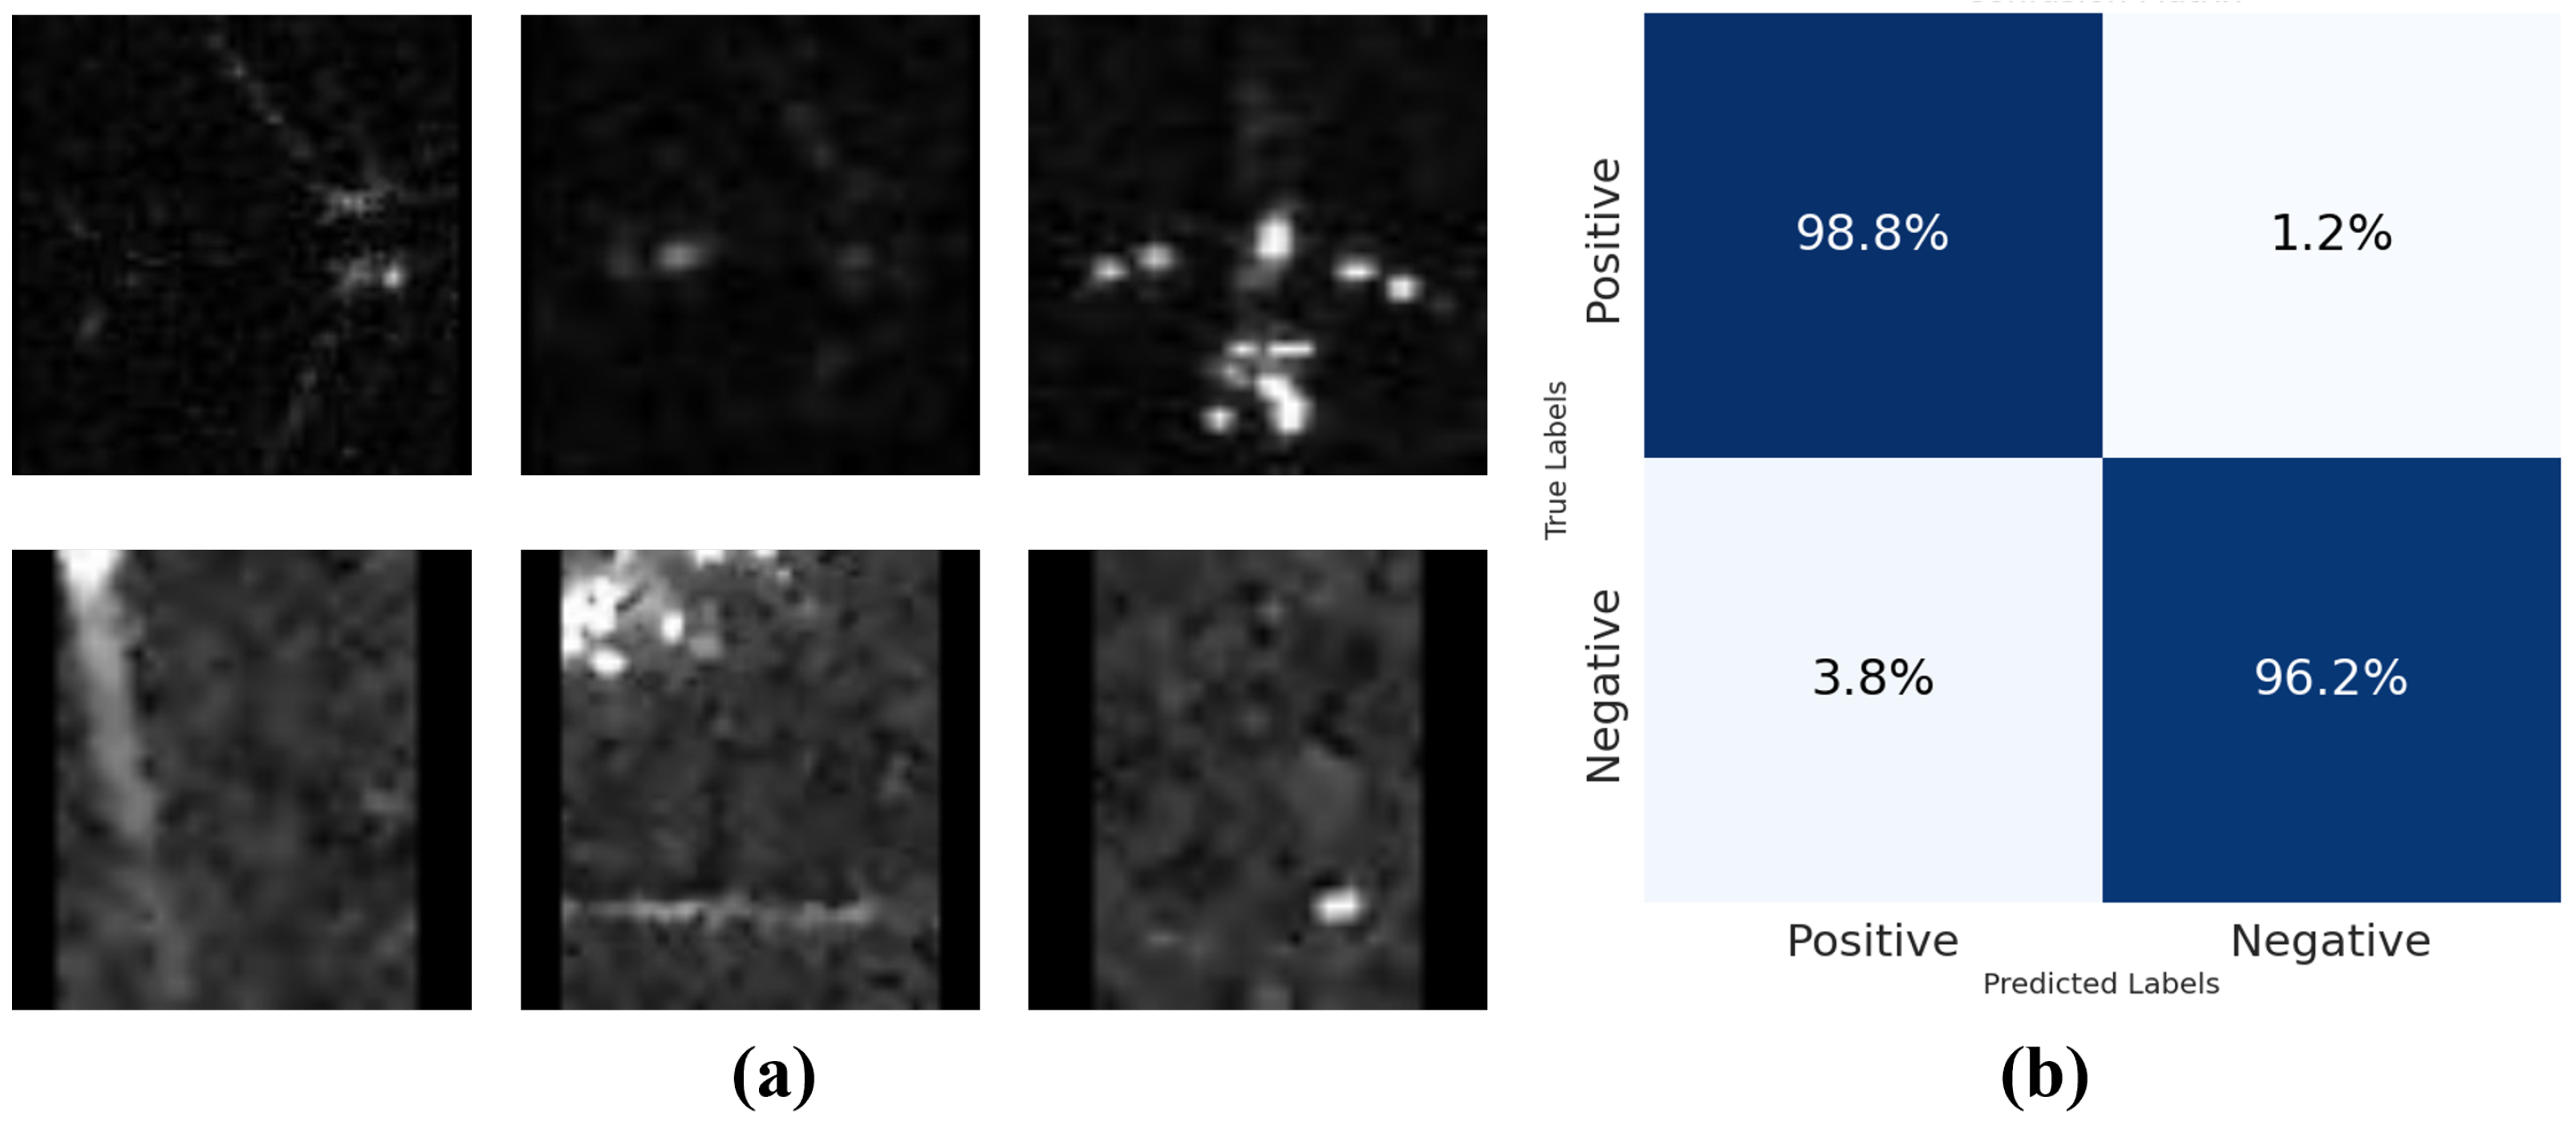
Next, the multi-scale sliding window attention mechanism is employed to sift out the potential parking positions for the airplanes in the form of image chips based on the terminal area markings shown on the optical images of the airports. As indicated in [52], aprons could be classified as terminal area apron, deicing apron, cargo apron, maintenance apron, remote apron, and general aviation apron (i.e., those without commercial service), and each type of apron features distinctive layouts, specific facilities, and unique surroundings. In this paper, the context reflected in the airport ATR data include three commercial airports and the Arizona aircraft boneyard. By pinpointing the key facilities in the airport of interest based on EO-SAR image pairs [34,53] and determining the apron configuration, performance metrics such as the recall rate and the precision could be improved simultaneously. The lead-in/lead-out lines and the stop lines in the terminal area aprons provide key clues regarding the potential aircraft parking positions. In some cases, the centerlines are labeled to identify the maximum wing span (e.g., MAX SPAN xxx FEET) or specific aircraft models (e.g., 747) with 24-inch letters, and the stop lines are marked with letters (A, B, C, D) to identify the nosewheel stopping positions for aircraft of different lengths (A: 737, B: 757, C: A320). Moreover, since the Passenger Loading Bridges (PLBs) are more prominent and stable than the aircraft themselves in the SAR images, it is technically feasible to generate a rough estimate of the relative position of the door with respect to the head and the tail as well as the size of the aircraft based on the geometry of the PLBs. Meanwhile, the Arizona aircraft boneyard is a typical example of a general aviation apron featuring long-term parking of based aircraft. The performance of the proposed CATRM and the baseline object detection models (YOLOv5, YOLOv8 [54], and RTMDet [55]) in the airplane detection experiment are compared in Figure 23. Some representative True Positive (TP), i.e., “aircraft”, and True Negative (TN), i.e., “non-aircraft clutter”, ATR examples are given in the first row and the second row of Figure 24a, respectively. The confusion matrix is given in Figure 24b, where “positive” and “negative” represent “aircraft” and “non-aircraft clutter”. It can be seen that the TP rate is 98.8%, which demonstrates the superiority of the proposed method over the classic aircraft detection models based on YOLOv8.

4. Conclusions and Future Works

In this work, the parking patterns of vehicle and aircraft targets extracted from EO-SAR image pairs are exploited for context-guided ATR. Considering that the EO-SAR images acquired from diverse observation angles often feature unbalanced quality, a novel class-incremental learning method based on the CGRID-Key exemplar selection strategy is devised. Experiment results based on the UNICORN dataset show that when SUV is used as the incremental class (i.e., Exp-2A), the proposed group-champion-based CGRID-Key exemplar selection strategy offers a classification accuracy 29.3% higher than the individual-based baseline model for SUV. Moreover, the aircraft ATR experiments based on a self-constructed dataset consisting of aligned EO-SAR images collected over an army base, several representative airports, and the Arizona aircraft boneyard show that the parking-pattern-guided target detection method achieves an F1 score of 0.987, which is 9% higher than YOLOv8.
Although the proposed method requires matching EO-SAR image pairs depicting the same region, it does not require accurate pixel/time alignment. The scene is broken into a set of functional building blocks, and then the parking/none-parking regions are segmented according to rules known by humans but that do not manifest as image features. The motivation is that the pavement markings and the apron configuration, which are highly correlated to the probability that vehicles/airplanes are presented, are invisible in SAR images and the golden rule that a feasible route must exist between the parking position and the exit are not known to the neural networks. Passing these pieces of knowledge onto the SAR images via optical-SAR image scene grammar alignment is very important, especially for airplane detection. To reduce the impact of misalignment, in the future we plan to exploit the road (including airport runway) and water body features, which exhibit a high level of cross-modality robustness, and concentrate on the Projective-Invariant Contour Feature (PICF) descriptor presented in [34,56], which exhibited impressive robustness to changes in viewing angle and Ground Sample Distance (GSD).

Author Contributions

Conceptualization, methodology, and writing, Z.G.; experiments and validation, S.Z.; data curation and visualization, Y.Z., C.X. and L.W.; funding acquisition and supervision, D.Z. All authors have read and agreed to the published version of the manuscript.

Funding

This work was supported by the National Natural Science Foundation of China, Grant No. 62301250.

Data Availability Statement

The original contributions presented in the study are included in the article, further inquiries can be directed to the corresponding author.

Conflicts of Interest

The authors declare no conflicts of interest.

References

  1. Kechagias-Stamatis, O.; Aouf, N. Automatic Target Recognition on Synthetic Aperture Radar Imagery: A Survey. IEEE Aerosp. Electron. Syst. Mag. 2021, 36, 56–81. [Google Scholar] [CrossRef]
  2. Belloni, C.; Balleri, A.; Aouf, N.; Le Caillec, J.M.; Merlet, T. Explainability of Deep SAR ATR Through Feature Analysis. IEEE Trans. Aerosp. Electron. Syst. 2021, 57, 659–673. [Google Scholar] [CrossRef]
  3. Chen, S.; Wang, H.; Xu, F.; Jin, Y.Q. Target Classification Using the Deep Convolutional Networks for SAR Images. IEEE Trans. Geosci. Remote Sens. 2016, 54, 4806–4817. [Google Scholar] [CrossRef]
  4. Chen, H.; Zhu, D.; Wu, D.; Huang, J.; Lv, J. An Addition Network with ResNet for Fine-Grained Visual Classification in SAR Images. In Proceedings of the IET International Radar Conference (IRC 2023), Chongqing, China, 3–5 December 2023; Volume 2023, pp. 589–593. [Google Scholar] [CrossRef]
  5. Min, R.; Lan, H.; Cao, Z.; Cui, Z. A Gradually Distilled CNN for SAR Target Recognition. IEEE Access 2019, 7, 42190–42200. [Google Scholar] [CrossRef]
  6. Feng, S.; Ji, K.; Zhang, L.; Ma, X.; Kuang, G. SAR Target Classification Based on Integration of ASC Parts Model and Deep Learning Algorithm. IEEE J. Sel. Top. Appl. Earth Obs. Remote Sens. 2021, 14, 10213–10225. [Google Scholar] [CrossRef]
  7. Huang, Z.; Wu, C.; Yao, X.; Zhao, Z.; Huang, X.; Han, J. Physics Inspired Hybrid Attention for SAR Target Recognition. ISPRS J. Photogramm. Remote Sens. 2024, 207, 164–174. [Google Scholar] [CrossRef]
  8. Kechagias-Stamatis, O. Target Recognition for Synthetic Aperture Radar Imagery Based on Convolutional Neural Network Feature Fusion. J. Appl. Remote Sens. 2018, 12, 046025. [Google Scholar] [CrossRef]
  9. Kechagias-Stamatis, O.; Aouf, N. Fusing Deep Learning and Sparse Coding for SAR ATR. IEEE Trans. Aerosp. Electron. Syst. 2019, 55, 785–797. [Google Scholar] [CrossRef]
  10. Zhou, Z.; Cao, Z.; Pi, Y. Subdictionary-Based Joint Sparse Representation for SAR Target Recognition Using Multilevel Reconstruction. IEEE Trans. Geosci. Remote Sens. 2019, 57, 6877–6887. [Google Scholar] [CrossRef]
  11. Zheng, P.; Zhou, Y.; Wang, W.; Wang, T.; Li, X. SAR Target Recognition through Adaptive Kernel Sparse Representation Model Based on Local Contrast Perception. Signal Process. 2024, 223, 109558. [Google Scholar] [CrossRef]
  12. Inkawhich, N.; Inkawhich, M.J.; Davis, E.K.; Majumder, U.K.; Tripp, E.; Capraro, C.; Chen, Y. Bridging a Gap in SAR-ATR: Training on Fully Synthetic and Testing on Measured Data. IEEE J. Sel. Top. Appl. Earth Obs. Remote Sens. 2021, 14, 2942–2955. [Google Scholar] [CrossRef]
  13. Inkawhich, N.; Zhang, J.; Davis, E.K.; Luley, R.; Chen, Y. Improving Out-Of-Distribution Detection by Learning from the Deployment Environment. IEEE J. Sel. Top. Appl. Earth Obs. Remote Sens. 2022, 15, 2070–2086. [Google Scholar] [CrossRef]
  14. Geng, Z.; Xu, Y.; Wang, B.N.; Yu, X.; Zhu, D.Y.; Zhang, G. Target Recognition in SAR Images by Deep Learning with Training Data Augmentation. Sensors 2023, 23, 941. [Google Scholar] [CrossRef] [PubMed]
  15. Low, S.; Nina, O.; Sappa, A.D.; Blasch, E.; Inkawhich, N. Multi-modal Aerial View Object Classification Challenge Results-PBVS 2022. In Proceedings of the 2022 IEEE/CVF Conference on Computer Vision and Pattern Recognition Workshops (CVPRW), New Orleans, LA, USA, 19–20 June 2022; pp. 349–357. [Google Scholar] [CrossRef]
  16. Shermeyer, J.; Hogan, D.; Brown, J.; Van Etten, A.; Weir, N.; Pacifici, F.; Hänsch, R.; Bastidas, A.; Soenen, S.; Bacastow, T.; et al. SpaceNet 6: Multi-Sensor All Weather Mapping Dataset. In Proceedings of the 2020 IEEE/CVF Conference on Computer Vision and Pattern Recognition Workshops (CVPRW), Seattle, WA, USA, 14–19 June 2020; pp. 768–777. [Google Scholar] [CrossRef]
  17. Huang, M.; Xu, Y.; Qian, L.; Shi, W.; Zhang, Y.; Bao, W.; Wang, N.; Liu, X.; Xiang, X. The QXS-SAROPT Dataset for Deep Learning in SAR-Optical Data Fusion. arXiv 2021, arXiv:2103.08259. [Google Scholar] [CrossRef]
  18. Schmitt, M.; Hughes, L.H.; Zhu, X.X. The SEN1-2 Dataset for Deep Learning in SAR-Optical Data Fusion. ISPRS Ann. Photogramm. Remote Sens. Spat. Inf. Sci. 2018, 4.1, 141–146. [Google Scholar] [CrossRef]
  19. Zhu, X.; Hu, J.; Qiu, C.; Shi, Y.; Kang, J.; Mou, L.; Bagheri, H.; Haberle, M.; Hua, Y.; Huang, R.; et al. So2Sat LCZ42: A Benchmark Data Set for the Classification of Global Local Climate Zones [Software and Data Sets]. IEEE Geosci. Remote Sens. Mag. 2020, 8, 76–89. [Google Scholar] [CrossRef]
  20. Li, Y.; He, J.; Xu, F.; Xiang, J.; Chen, J. OGRN: Optical-Guided Residual Dense Network for SAR Image Super-Resolution Reconstruction Network. Int. J. Remote Sens. 2024, 45, 9287–9310. [Google Scholar] [CrossRef]
  21. Geng, Z.; Li, W.; Xu, Y.; Wang, B.N.; Zhu, D.Y. SAR Image Scene Classification and Out-of-Library Target Detection with Cross-Domain Active Transfer Learning. In Proceedings of the IGARSS 2023—2023 IEEE International Geoscience and Remote Sensing Symposium, Pasadena, CA, USA, 16–21 July 2023; pp. 7023–7026. [Google Scholar] [CrossRef]
  22. Dungan, K.E.; Ash, J.N.; Nehrbass, J.W.; Parker, J.T.; Gorham, L.A.; Scarborough, S.M. Wide Angle SAR Data for Target Discrimination Research. In Proceedings of the Defense + Commercial Sensing, Baltimore, MD, USA, 23–27 April 2012. [Google Scholar]
  23. Low, S.; Nina, O.; Sappa, A.D.; Blasch, E.; Inkawhich, N. Multi-modal Aerial View Image Challenge: Translation from Synthetic Aperture Radar to Electro-Optical Domain Results—PBVS 2023. In Proceedings of the 2023 IEEE/CVF Conference on Computer Vision and Pattern Recognition Workshops (CVPRW), Vancouver, BC, Canada, 17–24 June 2023; pp. 515–523. [Google Scholar] [CrossRef]
  24. Cheng, J.; Liu, H.; Liu, T.; Wang, F.; Li, H. Remote sensing image fusion via wavelet transform and sparse representation. ISPRS J. Photogramm. Remote Sens. 2015, 104, 158–173. [Google Scholar] [CrossRef]
  25. Ankarao, V.; Sowmya, V.; Soman, K.P. Multi-sensor data fusion using NIHS transform and decomposition algorithms. Multimed. Tools Appl. 2018, 77, 30381–30402. [Google Scholar] [CrossRef]
  26. Easley, G.; Labate, D.; Lim, W.Q. Sparse directional image representations using the discrete shearlet transform. Appl. Comput. Harmon. Anal. 2008, 25, 25–46. [Google Scholar] [CrossRef]
  27. Lei, L.; Su, Y.; Jiang, Y. Feature-based classification fusion of vehicles in high-resolution SAR and optical imagery. In Proceedings of the MIPPR 2005: SAR and Multispectral Image Processing, Wuhan, China, 3 November 2005; Volume 6043, p. 604323. [Google Scholar] [CrossRef]
  28. Li, X.; Zhang, G.; Cui, H.; Hou, S.; Wang, S.; Li, X.; Chen, Y.; Li, Z.; Zhang, L. MCANet: A joint semantic segmentation framework of optical and SAR images for land use classification. Int. J. Appl. Earth Obs. Geoinf. 2022, 106, 102638. [Google Scholar] [CrossRef]
  29. Li, W.; Wu, J.; Liu, Q.; Zhang, Y.; Cui, B.; Jia, Y.; Gui, G. An Effective Multimodel Fusion Method for SAR and Optical Remote Sensing Images. IEEE J. Sel. Top. Appl. Earth Obs. Remote Sens. 2023, 16, 5881–5892. [Google Scholar] [CrossRef]
  30. Chureesampant, K.; Susaki, J. Multi-temporal SAR and Optical Data Combination with Textural Measures for Land Cover Classification. J. Jpn. Soc. Photogramm. Remote Sens. 2012, 51, 211–223. [Google Scholar] [CrossRef]
  31. Kim, S.; Song, W.J.; Kim, S.H. Double Weight-Based SAR and Infrared Sensor Fusion for Automatic Ground Target Recognition with Deep Learning. Remote Sens. 2018, 10, 72. [Google Scholar] [CrossRef]
  32. Qin, J.; Wang, K.; Zou, B.; Zhang, L.; van de Weijer, J. Conditional Diffusion Model With Spatial-Frequency Refinement for SAR-to-Optical Image Translation. IEEE Trans. Geosci. Remote Sens. 2024, 62, 1–14. [Google Scholar] [CrossRef]
  33. Qin, J.; Zou, B.; Li, H.; Zhang, L. Efficient End-to-End Diffusion Model for One-Step SAR-to-Optical Translation. IEEE Geosci. Remote Sens. Lett. 2025, 22, 1–5. [Google Scholar] [CrossRef]
  34. Lan, T.; He, S.; Qing, Y.; Wen, B. Leveraging Mixed Data Sources for Enhanced Road Segmentation in Synthetic Aperture Radar Images. Remote Sens. 2024, 16, 3024. [Google Scholar] [CrossRef]
  35. Qing, Y.; Zhu, J.; Feng, H.; Liu, W.; Wen, B. Two-Way Generation of High-Resolution EO and SAR Images via Dual Distortion-Adaptive GANs. Remote Sens. 2023, 15, 1878. [Google Scholar] [CrossRef]
  36. Chua, J.; Felzenszwalb, P.F. Scene Grammars, Factor Graphs, and Belief Propagation. arXiv 2019, arXiv:1606.01307. [Google Scholar] [CrossRef]
  37. Hendrycks, D.; Gimpel, K. A Baseline for Detecting Misclassified and Out-of-Distribution Examples in Neural Networks. In Proceedings of the International Conference on Learning Representations, Toulon, France, 24–26 April 2017. [Google Scholar]
  38. Liang, S.; Li, Y.; Srikant, R. Enhancing The Reliability of Out-of-distribution Image Detection in Neural Networks. In Proceedings of the International Conference on Learning Representations, Vancouver, BC, Canada, 30 April–3 May 2018. [Google Scholar]
  39. Inkawhich, N.A.; Davis, E.K.; Inkawhich, M.J.; Majumder, U.K.; Chen, Y. Training SAR-ATR Models for Reliable Operation in Open-World Environments. IEEE J. Sel. Top. Appl. Earth Obs. Remote Sens. 2021, 14, 3954–3966. [Google Scholar] [CrossRef]
  40. Yang, H.M.; Zhang, X.Y.; Yin, F.; Liu, C.L. Robust Classification with Convolutional Prototype Learning. In Proceedings of the 2018 IEEE/CVF Conference on Computer Vision and Pattern Recognition, Salt Lake City, UT, USA, 18–23 June 2018; pp. 3474–3482. [Google Scholar] [CrossRef]
  41. Zhu, Q.; Zhang, R. A Classification Supervised Auto-Encoder Based on Predefined Evenly-Distributed Class Centroids. arXiv 2020, arXiv:1902.00220. [Google Scholar] [CrossRef]
  42. Zhu, Q.; Zhang, P.; Wang, Z.; Ye, X. A New Loss Function for CNN Classifier Based on Predefined Evenly-Distributed Class Centroids. IEEE Access 2020, 8, 10888–10895. [Google Scholar] [CrossRef]
  43. Zhu, Q.; Zheng, G.; Shen, J.; Wang, R. Out-of-Distribution Detection Based on Feature Fusion in Neural Network Classifier Pre-Trained by PEDCC-Loss. IEEE Access 2022, 10, 66190–66197. [Google Scholar] [CrossRef]
  44. Li, B.; Cui, Z.; Sun, Y.; Yang, J.; Cao, Z. Density Coverage-Based Exemplar Selection for Incremental SAR Automatic Target Recognition. IEEE Trans. Geosci. Remote Sens. 2023, 61, 1–13. [Google Scholar] [CrossRef]
  45. Tang, Z.; Sun, Y.; Liu, C.; Xu, Y.; Lei, L. Simulated Data-Guided Incremental SAR ATR Through Feature Aggregation. IEEE J. Sel. Top. Appl. Earth Obs. Remote Sens. 2024, 17, 13602–13615. [Google Scholar] [CrossRef]
  46. Zakria; Deng, J.; Hao, Y.; Khokhar, M.S.; Kumar, R.; Cai, J.; Kumar, J.; Aftab, M.U. Trends in Vehicle Re-Identification Past, Present, and Future: A Comprehensive Review. Mathematics 2021, 9, 3162. [Google Scholar] [CrossRef]
  47. Xiang, Y.; Tao, R.; Wang, F.; You, H.; Han, B. Automatic Registration of Optical and SAR Images Via Improved Phase Congruency Model. IEEE J. Sel. Top. Appl. Earth Obs. Remote Sens. 2020, 13, 5847–5861. [Google Scholar] [CrossRef]
  48. Ros, G.; Sellart, L.; Materzynska, J.; Vazquez, D.; Lopez, A.M. The SYNTHIA Dataset: A Large Collection of Synthetic Images for Semantic Segmentation of Urban Scenes. In Proceedings of the 2016 IEEE Conference on Computer Vision and Pattern Recognition (CVPR), Las Vegas, NV, USA, 27–30 June 2016; pp. 3234–3243. [Google Scholar] [CrossRef]
  49. Basgalupp, M.; Cerri, R.; Schietgat, L.; Triguero, I.; Vens, C. Beyond global and local multi-target learning. Inf. Sci. 2021, 579, 508–524. [Google Scholar] [CrossRef]
  50. Xue, L.; Zeng, P.; Yu, H. SETNDS: A SET-Based Non-Dominated Sorting Algorithm for Multi-Objective Optimization Problems. Appl. Sci. 2020, 10, 6858. [Google Scholar] [CrossRef]
  51. Leong, C.; Rovito, T.; Mendoza-Schrock, O.; Menart, C.; Bowser, J.; Moore, L.; Scarborough, S.; Minardi, M.; Hascher, D. Unified Coincident Optical and Radar for Recognition (UNICORN) 2008 Dataset. Available online: https://github.com/AFRL-RY/data-unicorn-2008 (accessed on 30 December 2024).
  52. Airport Cooperative Research Program. ACRP Report 96: Apron Planning and Design Guidebook; Technical Report; Transportation Research Board of the National Academies: Washington, DC, USA, 2013. [Google Scholar]
  53. Kim, J.; Shin, S.; Kim, S.; Kim, Y. EO-Augmented Building Segmentation for Airborne SAR Imagery. IEEE Geosci. Remote Sens. Lett. 2022, 19, 1–5. [Google Scholar] [CrossRef]
  54. Yaseen, M. What is YOLOv8: An In-Depth Exploration of the Internal Features of the Next-Generation Object Detector. arXiv 2024, arXiv:2408.15857. [Google Scholar] [CrossRef]
  55. Lyu, C.; Zhang, W.; Huang, H.; Zhou, Y.; Wang, Y.; Liu, Y.; Zhang, S.; Chen, K. RTMDet: An Empirical Study of Designing Real-Time Object Detectors. arXiv 2022, arXiv:2212.07784. [Google Scholar] [CrossRef]
  56. Li, Y.; Wang, S.; He, H.; Meng, D.; Yang, D. Fast Aerial Image Geolocalization Using the Projective-Invariant Contour Feature. Remote Sens. 2021, 13, 490. [Google Scholar] [CrossRef]
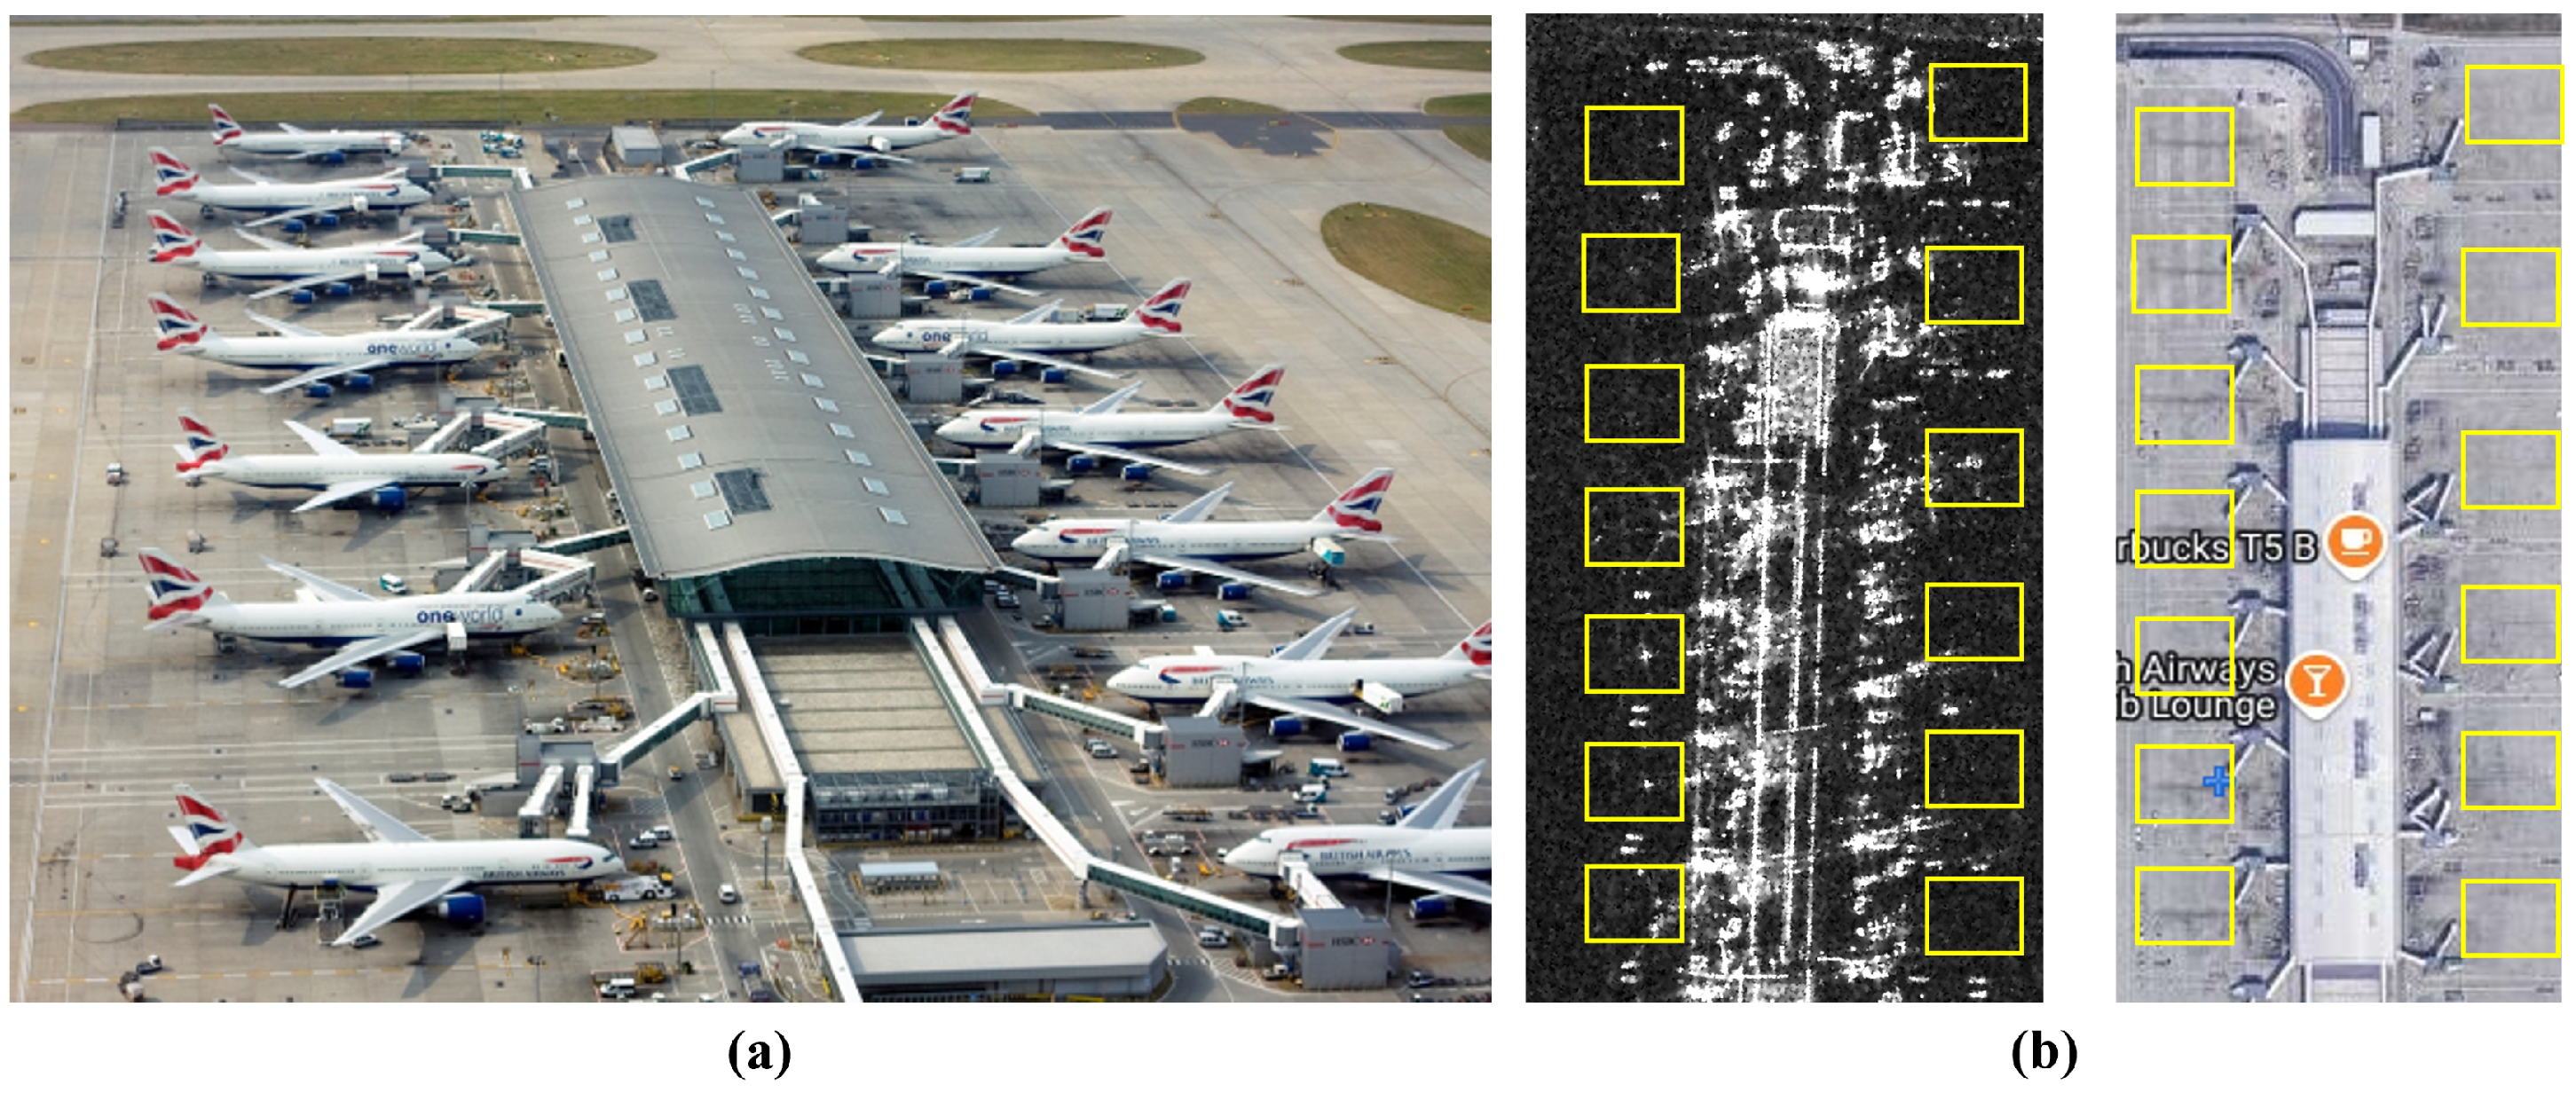
Figure 1. Illustration of the parking patterns of aircraft. (a) Aircraft at Heathrow Airport. (b) The parking pattern revealed in the optical image could facilitate SAR-ATR for aircraft (note: the aircraft are not shown in the optical image downloaded from EarthOnline for privacy protection).
Remotesensing 17 02808 g001
Figure 2. The overall pipeline and key components for the proposed ATR method based on optical-SAR image scene grammar alignment.
Remotesensing 17 02808 g002
Figure 3. The adjust module for OOD detection.
Remotesensing 17 02808 g003
Figure 4. The concatenated SAR and EO images for AdvOE training.
Remotesensing 17 02808 g004
Figure 5. The CGRID-Key strategy.
Remotesensing 17 02808 g005
Figure 7. EO-SAR image pairs of eight in-library scenes (Scene 1–8) and two OOD scenes (Scene 9–10). (a) Scene 1–5. (b) Scene 6–10.
Remotesensing 17 02808 g007
Figure 8. Illustration of the eight scenes used for training and testing. (a) Training data with fine resolution (SAR image R 0 = 0.282 m × 0.232 m), EO image R 0 = 0.41 m × 0.41 m. (b) Test data with coarse resolution (SAR image R 3 = 2.26 m × 1.86 m, EO image R 3 = 3.28 m × 3.28 m).
Remotesensing 17 02808 g008
Figure 9. t-SNE Visualizations for SAR and EO images of Scene 1–8 and the OOD scene (i.e., scene else in the legend) used in the experiment. (a) t-SNE Visualizations for SAR images. (b) t-SNE Visualizations for EO images.
Remotesensing 17 02808 g009
Figure 10. EO image quality degradation in poor light conditions. (a) Lux = 40. (b) Lux = 20.
Remotesensing 17 02808 g010
Figure 11. Confusion matrices corresponding to ensemble learning based on naive average and weighted average in parking lot ATR experiment (Lux = 20). (a) Naive average. (b) Weighted average.
Remotesensing 17 02808 g011
Figure 12. Comparison of the predictions made based only on the optical image, the SAR image, and the prediction made via weighted average ensemble in parking lot ATR experiment. (a) Example 1. (b) Example 2.
Remotesensing 17 02808 g012
Figure 13. EO-SAR image pairs for 10 types of vehicle in the UNICORN dataset.
Remotesensing 17 02808 g013
Figure 14. The EO-SAR images of two SUVs collected from eight different observation angles.
Remotesensing 17 02808 g014
Figure 15. OE training samples generated by random vehicle cropping and poisson image fusion to reduce the impact of vehicle quantity and the background.
Remotesensing 17 02808 g015
Figure 16. Confusion matrices for Experiment 2-A. (a) OracleSam. (b) The random selection strategy (baseline). (c) The proposed CGRID-Key strategy.
Remotesensing 17 02808 g016
Figure 17. Confusion matrices for Experiment 2-B. (a) OracleSam. (b) The random selection strategy (baseline). (c) The proposed CGRID-Key strategy.
Remotesensing 17 02808 g017
Figure 18. Image samples containing both motorcycle and sedan/SUV, where the motorcycles are marked with red boxes.
Remotesensing 17 02808 g018
Figure 19. t-SNE Visualizations for Experiment 2-A. (a) OracleSam. (b) The random selection strategy (baseline). (c) The proposed CGRID-Key strategy.
Remotesensing 17 02808 g019
Figure 20. t-SNE Visualizations for Experiment 2-B. (a) OracleSam. (b) The random selection strategy (baseline). (c) The proposed CGRID-Key strategy.
Remotesensing 17 02808 g020
Figure 21. Comparison of the predictions made based only on the optical image, the SAR image, and the prediction made via weighted average ensemble in airport ATR experiment. (a) Example 1. (b) Example 2. (c) Example 3. (d) Example 4.
Remotesensing 17 02808 g021
Figure 22. Confusion matrices corresponding to ensemble learning based on naive average and weighted average in airport ATR experiment (Lux = 60). (a) Naive average. (b) Weighted average.
Remotesensing 17 02808 g022
Figure 23. Comparison of the performance of the proposed CATRM and the baseline object detection models in the airplane detection experiment.
Remotesensing 17 02808 g023
Figure 24. Airplane ATR examples and the confusion matrix. (a) Some representative airplane ATR examples, with the first and the second row correspond to TP and TN examples, respectively. (b) The confusion matrix.
Remotesensing 17 02808 g024
Table 1. Classification accuracy obtained with various ensemble learning methods in the parking lot ATR experiment.
AverageScore RankingWeighted Average
Lux-original + SAR0.95740.95650.9602
Lux-50 + SAR0.90910.90260.9318
Lux-40 + SAR0.89770.88500.9290
Lux-30 + SAR0.87780.86540.9290
Lux-20 + SAR0.58810.58240.9290
Table 2. Weighting factors for EO and SAR images under various light conditions in the parking lot ATR experiment.
Lux-OriginalLux-50Lux-40Lux-30Lux-20
EO weight0.4850.420.30.150.15
SAR weight0.5150.580.70.850.85
Table 4. Classification accuracy obtained with various ensemble learning methods in the airport ATR experiment.
AverageScore RankingWeighted Average
Lux-original + SAR1.00001.00001.0000
Lux-120 + SAR0.97580.97281.0000
Lux-100 + SAR0.91540.90331.0000
Lux-80 + SAR0.80970.80060.9849
Lux-60 + SAR0.79760.79460.9849
Table 5. Weighting factors for EO and SAR images under various light conditions in the airport ATR experiment.
Lux-OriginalLux-120Lux-100Lux-80Lux-60
EO weight0.50.450.40.30.2
SAR weight0.50.550.60.70.8
Disclaimer/Publisher’s Note: The statements, opinions and data contained in all publications are solely those of the individual author(s) and contributor(s) and not of MDPI and/or the editor(s). MDPI and/or the editor(s) disclaim responsibility for any injury to people or property resulting from any ideas, methods, instructions or products referred to in the content.