Article

Classification Algorithms for Fast Retrieval of Atmospheric Vertical Columns of CO in the Interferogram Domain

1
LATMOS/IPSL, Sorbonne Université, UVSQ, CNRS, 75005 Paris, France
2
DOTA, ONERA, Université Paris Saclay, 31055 Palaiseau, France
*
Author to whom correspondence should be addressed.
Remote Sens. 2025, 17(16), 2804; https://doi.org/10.3390/rs17162804
Submission received: 25 April 2025 / Revised: 18 July 2025 / Accepted: 4 August 2025 / Published: 13 August 2025
(This article belongs to the Section Atmospheric Remote Sensing)

Abstract

Onboard the MetOp satellite series, Infrared Atmospheric Sounding Interferometer (IASI) is a Fourier Transform spectrometer based on the Michelson interferometer. IASI acquires interferograms, which are processed to provide high-resolution atmospheric emission spectra. These spectra enable the derivation of temperature and humidity profiles, among other parameters, with exceptional spectral resolution. In this study, we evaluate a novel, rapid retrieval approach in the interferogram domain, aiming for near-real-time (NRT) analysis of large spectral datasets anticipated from next-generation tropospheric sounders, such as MTG-IRS. The Partially Sampled Interferogram (PSI) method, applied to trace gas retrievals from IASI, has been sparsely explored. However, previous studies suggest its potential for high-accuracy retrievals of specific gases, including CO, CO2, CH4, and N2O at the resolution of a single IASI footprint. This article presents the results of a study based on retrieval in the interferogram domain. Furthermore, the optical pathway differences sensitive to the parameters of interest are studied. Interferograms are generated using a fast Fourier transform on synthetic IASI spectra. Finally, the relationship to the total column of carbon monoxide is explored using three different algorithms—from the most intuitive to a complex neural network approach. These algorithms serve as a proof of concept for interferogram classification and rapid predictions of surface temperature, as well as the abundances of H2O and CO. IASI spectra simulations were performed using the LATMOS Atmospheric Retrieval Algorithm (LARA), a robust and validated radiative transfer model based on least squares estimation. The climatological library TIGR was employed to generate IASI interferograms from LARA spectra. TIGR includes 2311 atmospheric scenarios, each characterized by temperature, water vapor, and ozone concentration profiles across a pressure grid from the surface to the top of the atmosphere. Our study focuses on CO, a critical trace gas for understanding air quality and climate forcing, which displays a characteristic absorption pattern in the 2050–2350 cm 1 wavenumber range. Additionally, the study explores the potential of correlating interferogram characteristics with surface temperature and H2O content, aiming to enhance the accuracy of CO column retrievals. Starting with intuitive retrieval algorithms, we progressively increased complexity, culminating in a neural network-based algorithm. The results of the NN study demonstrate the feasibility of fast interferogram-domain retrievals, paving the way for operational applications.

1. Introduction

Carbon monoxide plays a major role in the atmospheric chemistry of the Earth’s atmosphere—firstly, because it acts as an intermediary in the Carbon Cycle (indirect GHG), secondly, because of its impact on atmospheric oxidation capacity, and finally, because of its contribution to ozone formation in the troposphere [1]. Carbon monoxide appears mostly due to anthropogenic activity such as transportation, heating, and industrial activities. However, a large contributor to the total emissions of CO comes from the natural (or induced) biomass-burning fires [2].
Many space-borne missions have instruments capable of capturing significant CO emissions. Hence, satellite observations are a very common way to monitor CO. With an increasing number of satellite observations, the quantity of data collected for processing is also increasing [3]. Large amounts of data imply time-consuming processes for full physics retrieval. Furthermore, there exists a large number of Earth atmosphere observation missions based on Fourier Transform (FT) spectrometry, including Infrared Atmospheric Sounding Interferometer (IASI) on board Metop-A/B and C [4], which base their efficiency on capturing the signal in the interferogram domain. However, due to the conventional approaches to the retrieval of columns of gases and vertical profiles, the signal is typically preprocessed from the interferogram to the radiance domain, which is then used for retrieval. This approach, as well as the need for processing larger and larger amounts of data, requires algorithms that are able to retrieve concentrations of molecules very quickly and straight from the interferogram domain, which would shorten the production time (explored in this paper) but also cut a large part of the preprocessing chain and data storage, making this proposal more efficient as well as environmentally friendly.
The idea of a classification algorithm for rapid detection and quantification of CO plumes from hyperspectral measurements may be a more effective answer to the need for concrete applications such as near-real-time fire monitoring. Furthermore, their coupling with new geostationary hyperspectral satellite instruments, such as MTG-IRS, could prove to have significant improvements compared to the current methods, especially for restricted geographical zone monitoring, such as urban monitoring applications.
In this paper we explore three different interferogram-based classification approaches, from the simplest, most intuitive one, to a more complex neural network algorithm that is able to predict CO vertical column concentration very efficiently.

2. Background

2.1. Measurements from Space

Monitoring gases from space is crucial for understanding the Earth’s atmosphere and tracking changes on a global scale. Satellites provide continuous, consistent measurements with frequent revisit times, allowing for regular updates on gas concentrations across different regions. This data is essential for studying climate change, assessing air quality, and detecting environmental hazards like wildfires or volcanic eruptions. New generation sounders, such as IASI-NG (IASI New Generation, [5]), or MTG-IRS (Meteosat Third Generation Infrared Sounder, [6]), will generate significantly more data compared to the current ones, such as the IASI mission, due to improvements in spatial and temporal resolution, as well as their advanced scanning and imagery capabilities. IASI has a spectral resolution of 0.25 cm−1 across a range of 645–2760 cm−1 (3.62–15.5 μm) while MTG-IRS will provide a spectral resolution of 0.625 cm−1 over two bands: Long-Wave Infrared (LWIR, 700–1210 cm−1) and Mid-Wave Infrared (MWIR, 1600–2175 cm−1). Moreover, MTG-IRS will have a spatial resolution of 4 km at nadir, compared to IASI’s 12 km, offering significantly finer detail. Temporally, MTG-IRS will provide full-disk coverage every 30 min, a substantial improvement over IASI’s twice-daily coverage. Combined, these features mean MTG-IRS will produce around 250 times more data than current IASI instruments, delivering high spectral and spatial quality, more frequent temporal measurements for improved atmospheric monitoring, weather forecasting, and climate studies, but initiating the need for more efficient and faster retrieval techniques [7,8]. Furthermore, new Fourier-transform imaging spectrometers based on the partial interferogram sampling techniques, such as NanoCarb [9] and The Space Carbon Observatory (SCARBO) project [10,11], are emerging. The prospect of such potential new missions, according to Croizé [12], further emphasizes the need for efficient, high-volume retrievals.

2.2. Interferogram Versus Spectrum

The conventional methods of retrieval of the atmospheric trace gases are based on the optimal-estimation-methods algorithms in the spectral domain [13]. This paper focuses on the retrieval from the product of a Fourier transform spectrometer- an interferogram. There exist many types of Fourier Transform Spectrometers (FTS), amongst which the subject of this study is a Michelson Interferometer. Michelson’s principle is based on a beam splitter that divides the incoming light into two paths. One beam traverses a fixed optical path, while the other reflects off a moving mirror, introducing a variable optical path difference (OPD). Upon recombination, the beams interfere, producing a modulated (cosine) intensity pattern that encodes spectral information [14]. This intensity pattern is recorded by a detector as the mirror moves. The Fourier Transform of this interferogram reveals the spectrum of the source, with wavelengths represented as a function of radiances [15]. Similarly, the interferogram signal can be described as the intensity of light as a function of Optical Path Difference (OPD). Hence, an important concept that relates the spectrum to the interferogram is known as a Fourier transform described in Equation (1) [16].
I ( x ) = + r ( σ ) e i 2 π σ x d σ
When using the interferogram approach for the retrieval of total columns of gases, we benefit from two principles named Fellgett and Jacquinot advantages [17]. Firstly, FTS systems maximize throughput because the aperture is large, and light from a wide angle can contribute to the whole interferogram. Instead of dispersing light into different wavelengths, FTS systems use an interferometer to measure all wavelengths simultaneously. This approach improves sensitivity and signal-to-noise (SNR) ratio. Similarly, Fellgett or multiplex gain is based on the principle that the interferogram is a linear combination of the whole set of spectral radiance forming spectra. Thus, to retrieve information from the spectrum, one has to focus their retrieval on a wide range of the spectral domain.
According to Blumstein et al. [4], for a FTS such as IASI instrument onboard MetOp satellite, the measured quantity is the interferogram intensity I ( x ) in Wm 2 sr 1 (see Figure 1c and Equation (1)), where x represents the optical path difference (OPD) in units of cm (usually called level 0 for satellite data). The corresponding spectrum r ( σ ) (level 1), where σ is the wavenumber (in cm 1 ), is recovered using a Fourier Transform (see Figure 1a). For any calibrated and band-limited spectrum, regardless of its origin or measurement technique, the interferogram is obtained as the Fourier Transform of the symmetrical spectrum r ( σ ) , where σ 1 σ σ 2 . Here, σ 1 and σ 2 denote the band endpoints, which are both positive, and the bandwidth is defined as σ 2 σ 1 . In this framework, the interferogram can be viewed as a mathematical representation applicable to any spectrum, whether measured with a radiometer or an interferometer. A partial interferogram I ( x ) , restricted to a specific range x 1 x x 2 , corresponds to the interferogram over a limited optical path difference interval, with x 1 and x 2 as the endpoints, which for IASI spans from 0 to 2 cm . In this work we will focus on the total column gases retrieval, more precisely, the retrieval of carbon monoxide, water vapor, and surface temperature in the interferogram domain. Figure 1a depicts the difference of CO-abundant and CO-poor spectra, revealing the CO signature Figure 1b over the specific range of wavelengths. This difference translates to the interferogram domain, where from the full interferogram Figure 1c it is difficult to see the difference between the high and low CO vertical column concentration curves. However, the partial interferogram Figure 1d reveals this difference very clearly around the CO signature, whose significant OPD can be calculated from the period of CO absorption at 4 cm 1 . Hence, using Niquist rule: x = 1 / 4 cm 1 = 0.25 cm .
As we indicated previously, the retrieval of geophysical parameters from FTS measurements is performed from the spectra to date. There are only very rare studies proposing to base the retrieval directly on interferograms. Interferogram approach for the retrieval of the atmospheric parameters was first introduced by Kyle [18] and Fortunato [19]. Since then, studies have been conducted on using a correlation interferometer for the measurement of atmospheric trace species [20]. Furthermore, a concept of retrieval from small segments of interferograms commonly known as the Partially Sampled Interferogram approach (PSI) has been explored by Smith et al. [21], Serio et al. [22], and Grieco et al. [23]. According to Kyle [18] and Fortunato [19], the useful information for retrieval of species is concentrated in a small portion of the interferogram where each point bears information from any part of the spectrum, allowing to capture the full spectral information with high resolution, wide spectral range, and excellent SNR in a single measurement.

2.3. Existing Fast Retrieval in Spectral Domain

Nonetheless, atmospheric retrieval from spectral data, particularly using hyperspectral instruments, is a fundamental method for deriving atmospheric properties such as temperature profiles, trace gas concentrations, and surface characteristics. Traditional approaches often rely on optimal estimation methods [13], which solve the inverse problem by minimizing the difference between observed and simulated spectra while incorporating prior information to regularize the solution. However, the high dimensionality and nonlinearity of hyperspectral data and speed of retrievals necessitate advanced techniques [13]. Recent neural network retrieval systems often utilize feedforward multi-layer perceptrons (MLPs) with two to four hidden layers and nonlinear activation functions such as ReLU or sigmoid, ensuring the network can capture the complex, nonlinear relationships between hyperspectral radiances and atmospheric state variables. Dropout regularization and L2 penalties are commonly applied to prevent overfitting, while batch normalization can stabilize training and improve convergence speed [24,25,26]. Novel machine learning approaches, such as the regularized neural network method developed by Chevallier et al. [24], have demonstrated improved accuracy by embedding a priori information into the retrieval process for temperature and surface properties. Similarly, the Artificial Neural Network for IASI (ANNI) framework, introduced in its first version by Whitburn et al. [25] and refined further by Van Damme et al. [26], showcases the application of neural networks in the efficient retrieval of ammonia (NH3) from hyperspectral data. These innovations emphasize the potential of neural networks to address nonlinearities and enhance retrieval speed, making them suitable for both real-time and reanalyzed datasets. Furthermore, principal component-based approaches and hybrid methods have played a significant role in atmospheric retrieval using hyperspectral data. For example, Susskind [27] applied principal component analysis (PCA) in the Atmospheric Infrared Sounder (AIRS) retrieval system to reduce spectral dimensionality while preserving key information for temperature and moisture profile retrievals. This methodology enabled computational efficiency without significant loss of accuracy. Similarly, Liu et al. [28] demonstrated the use of PCA for noise reduction in hyperspectral data from the Tropospheric Emission Spectrometer (TES), contributing to accurate retrieval of tropospheric ozone. Hybrid AI approaches, such as those combining PCA and neural networks, have also been explored, as shown in the work of Murty Divakarla [29] with the Cross-track Infrared Sounder (CrIS), where PCA-reduced data is fed into machine learning models to improve retrievals of atmospheric properties. Collectively, these advancements illustrate the growing trend of integrating AI-driven methods, including neural networks and PCA-based models, to overcome the challenges in hyperspectral atmospheric retrieval and speed up the retrieval processes in the spectral domain. Furthermore, the limitations of traditional spectral retrieval methods—particularly the high computational cost associated with iterative inversion algorithms, and the extensive preprocessing required to transform raw interferograms into spectra—provide strong motivation for the development of more efficient approaches. In missions such as IASI, this preprocessing step is especially burdensome and somewhat redundant, given the feasibility of performing retrievals directly from interferograms. These challenges are especially critical for new-generation, high-volume missions such as IMT-IRS [6]. In this paper, we propose a proof of concept of fast retrieval techniques in the interferogram domain, which omits a part of the redundant preprocessing chain in instruments such as IASI and speeds up the retrieval.

3. Methodology

3.1. Reference Dataset

3.1.1. Radiative Transfer Computation

The Infrared Atmospheric Sounding Interferometer (IASI), which operates onboard the Metop-B and Metop-C satellites of the Meteorological Operational Satellite (MetOp) program, has been developed by the Centre National d’Études Spatiales (CNES) in France. IASI is part of the European Polar System (EPS) managed by the European Organization for the Exploitation of Meteorological Satellites (EUMETSAT). A single spectrum consists of 8461 data points or channels. The calibrated IASI interferogram spans an OPD range from 0 to a maximum of 2 cm [4]. In this article we use a synthetically calculated interferogram dataset.
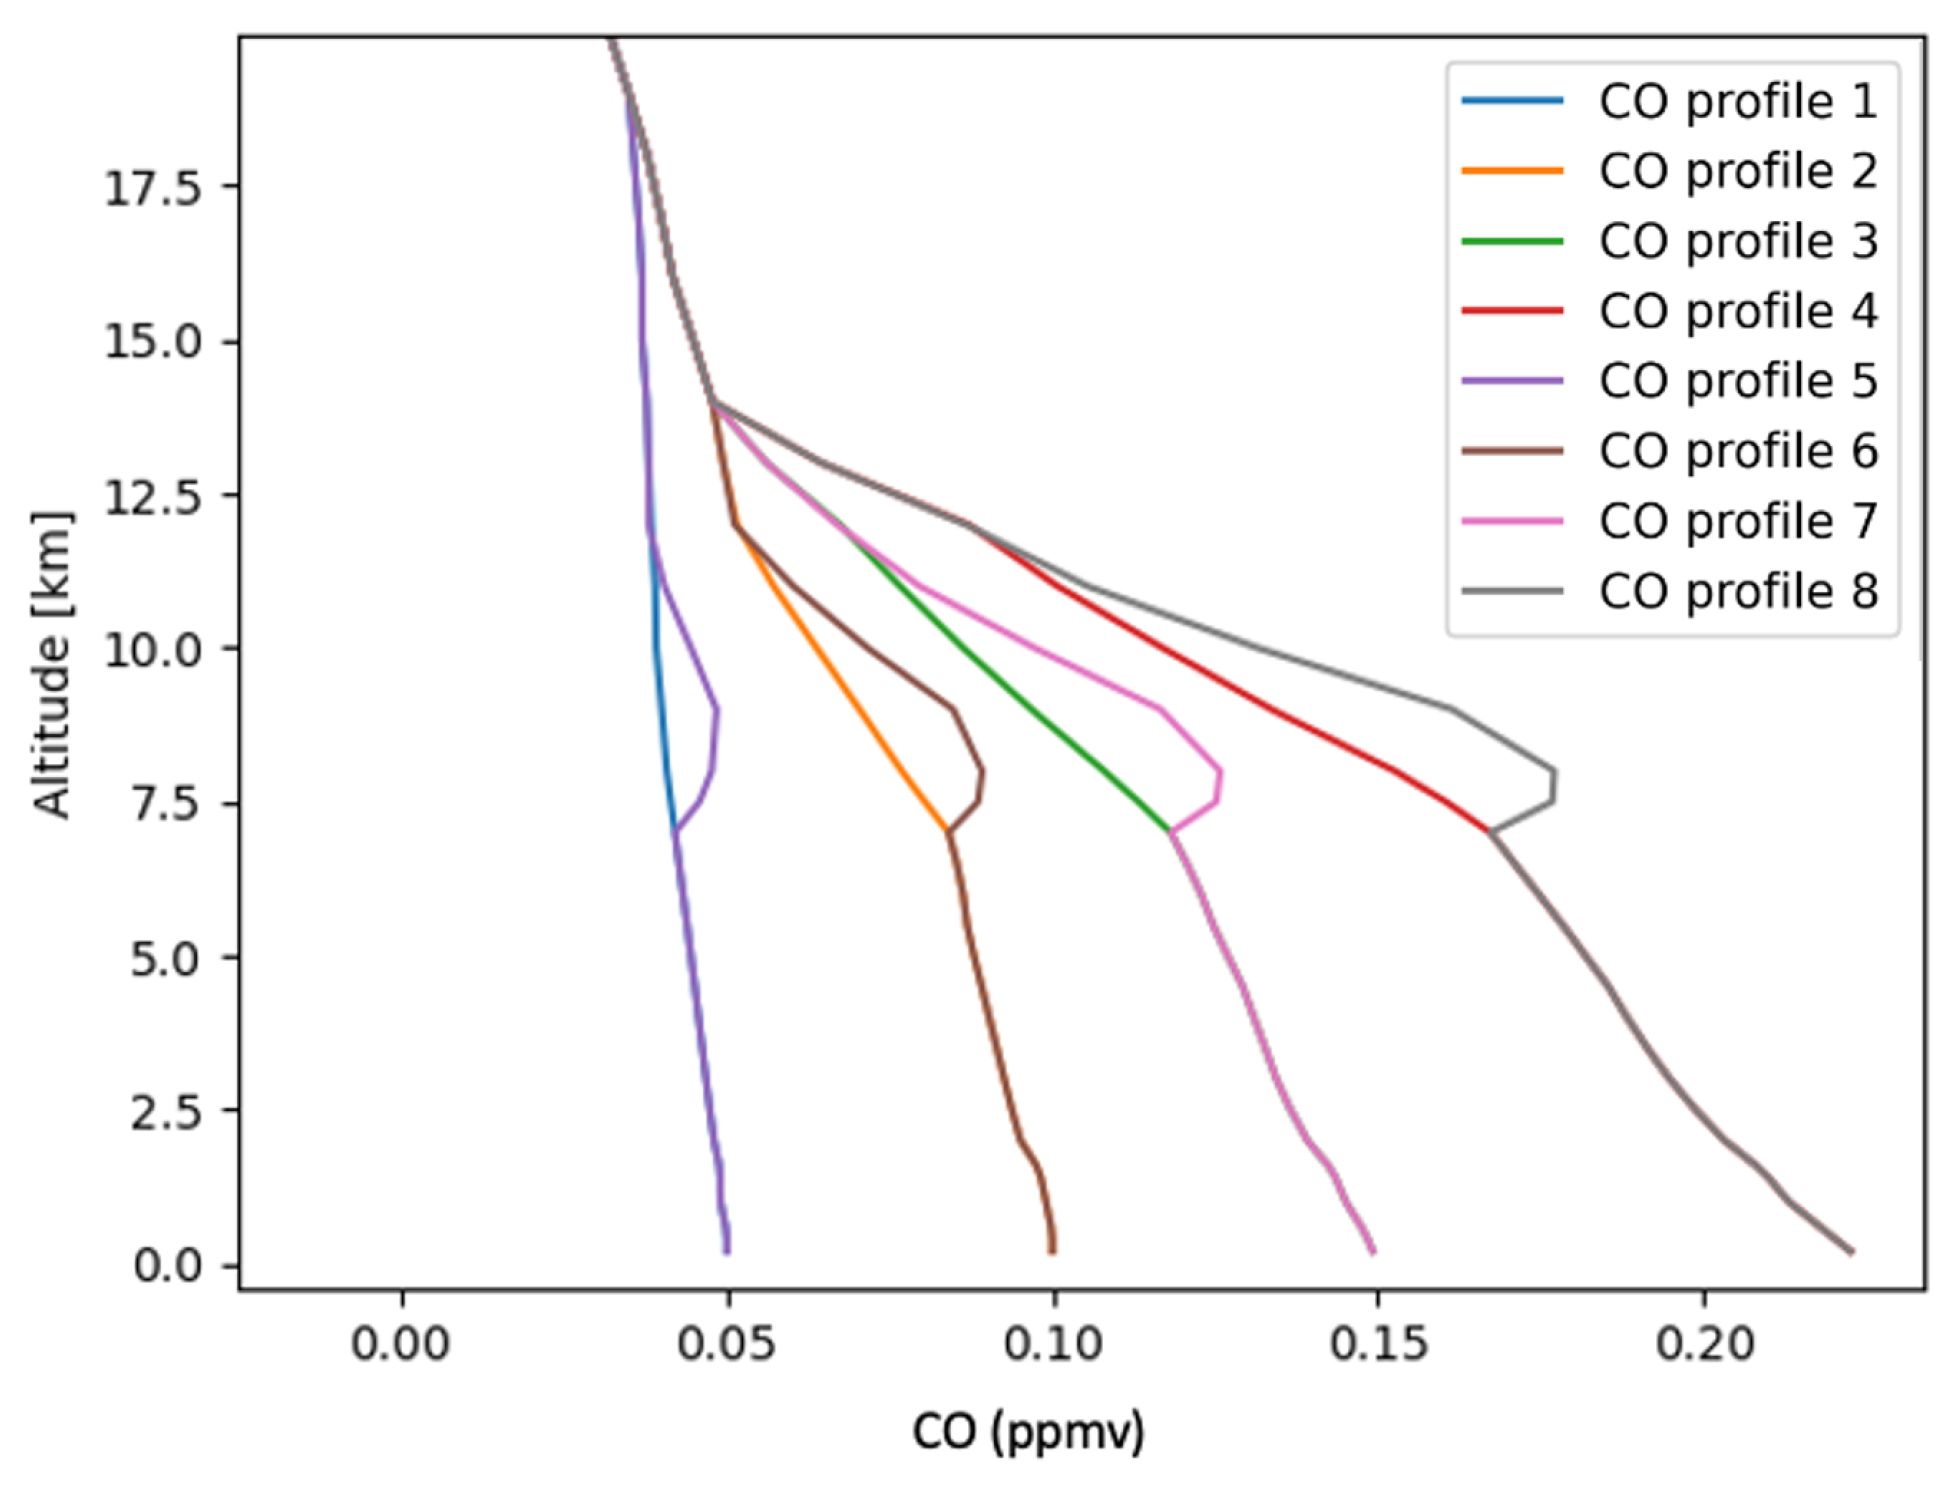
The dataset is generated with 7 different surface temperatures to estimate their impact on the retrieval of geophysical parameters (widely used in the spectral retrieval, such as those shown in Bauduin et al. [30]). Furthermore, eight different CO vertical profiles were used for the generation of spectra, whose concentrations are presented in the Figure 2. This set of CO profiles is divided into 4 cases representing low to high values in the low troposphere. For each of them, a deviation around 8 km is aimed at stimulating long-range transport of CO from high sources like fires. For the simulations we use the Thermodynamic Initial Guess Retrieval (TIGR) dataset, which is a climatological archive consisting of 2311 atmospheric states that statistically represent Earth’s atmosphere [31]. These profiles were selected using radiosonde data and statistical techniques from Chédin et al. [32], Achard [33], and Chevallier et al. [34]. Each atmospheric state in the TIGR dataset spans from the surface to the uppermost layers of the atmosphere, reaching pressures as low as 0.0026 hPa. The dataset provides essential atmospheric parameters, including temperature, water vapor, and ozone concentrations distributed across a defined pressure grid.
The spectra are simulated using a radiative transfer code called LARA (LATMOS Atmospheric Retrieval Algorithm). LARA has been developed over the years [35,36]. It has been widely used to analyze atmospheric spectra recorded from ground-based, balloon or satellite-borne experiments, both in absorption or emission mode, and for the limb or the nadir geometry: LPMA-balloon [37,38], MIPAS-Envisat satellite [39], IASI-Metop satellite [40,41], volcanic plumes of FTIR compare to UV imager [42,43]. LARA allows the simultaneous retrieval of spectra in several windows for the joint retrieval of vertical profiles (or slant column densities) of various species. Surface temperature and emissivity, and, if needed, instrumental instrumental line shape or instrumental spectral shift may be fitted together with the species, or even cloud or plume parameters like altitude, half width, optical thickness, and others. The retrieval algorithm uses the optimal estimation method and includes an accurate line-by-line radiative transfer model and an efficient minimization algorithm of the Levenberg-Marquardt type. The full error covariance matrix is computed within the retrieval process. The forward model (i.e., the radiative transfer model) uses molecular parameters which are mainly extracted from the HITRAN 2021 database [44]. Individual line shapes are calculated with a Voigt profile based on the Lorentzian parameters listed in the spectroscopic database, and the line shifting coefficient can be used when non-zero in HITRAN 2021.
The calculation takes into account the water vapor continuum as well as water vapor self-broadening. The reflected downward flux and the reflected or diffused sunlight are modeled [45]. LARA has recently been completed to simulate interferograms (instead of spectra) and perform retrieval from these. For the present work, the algorithm was tailored to the specificities of IASI interferograms or spectra. Simplifying assumptions have been chosen to limit the number of calculations and consequently reduce the computation time, which would otherwise be prohibitive if too large a number of scenario cases were used. In addition, assumptions should help to more easily distinguish differences between the two retrievals (spectra/interferogram). In this study, we considered a nadir viewing line of sight, implying that the angle with the local vertical is equal to zero. Observations were assumed to occur under clear-sky conditions for all IASI pixels. The surface emissivity was set to one. The ground altitude was considered to be at sea level. Finally, only the major absorbers, namely H2O, CO2, O3, N2O, and CO, were taken into account in the spectral region considered here.
The line of sight considered is divided into 51 layers from the ground up to the top of the atmosphere (chosen at 80 km ) , with an altitude adaptive layering (from 100 m for the first layers, to 5 km for the last). For each path in each layer, temperature, pressure, path length, air concentration, and molecular slant column densities (SCD) are estimated. As mentioned, the temperature and pressure have been taken from the TIGR database. Infinite resolution spectrum is calculated in the spectral window 2050–2350 cm 1 . Volume mixing rations vertical profiles of H2O and O3 are taken in TIGR, whereas CO2 and N2O are fixed (N2O from AGFL, CO2 fixed at 410 ppmv ) .

3.1.2. Interferogram Generation

On all the simulated spectra, we perform a routine that relies on the principle described by Equation (1). In the discrete case, spectra are computed between σ 1 and σ 2 , with a sampling size of Δ σ = 0.001 cm 1 (N points where N = σ 2 σ 1 Δ σ + 1 and σ j = σ 1 + j Δ σ ):
I ( x ) = j = 0 N r ( σ j ) e i 2 π x σ ( j ) Δ σ
The same approach applies to the instrumental function ISRF ( F ( x ) = σ 1 σ 2 f ( j ) e i 2 π x σ ( j ) Δ σ ). Then we can calculate the FT of the instrumental function to finally obtain the FT of IASI spectra L ( x ) as follows:
L ( x ) = F ( x ) · I ( x )
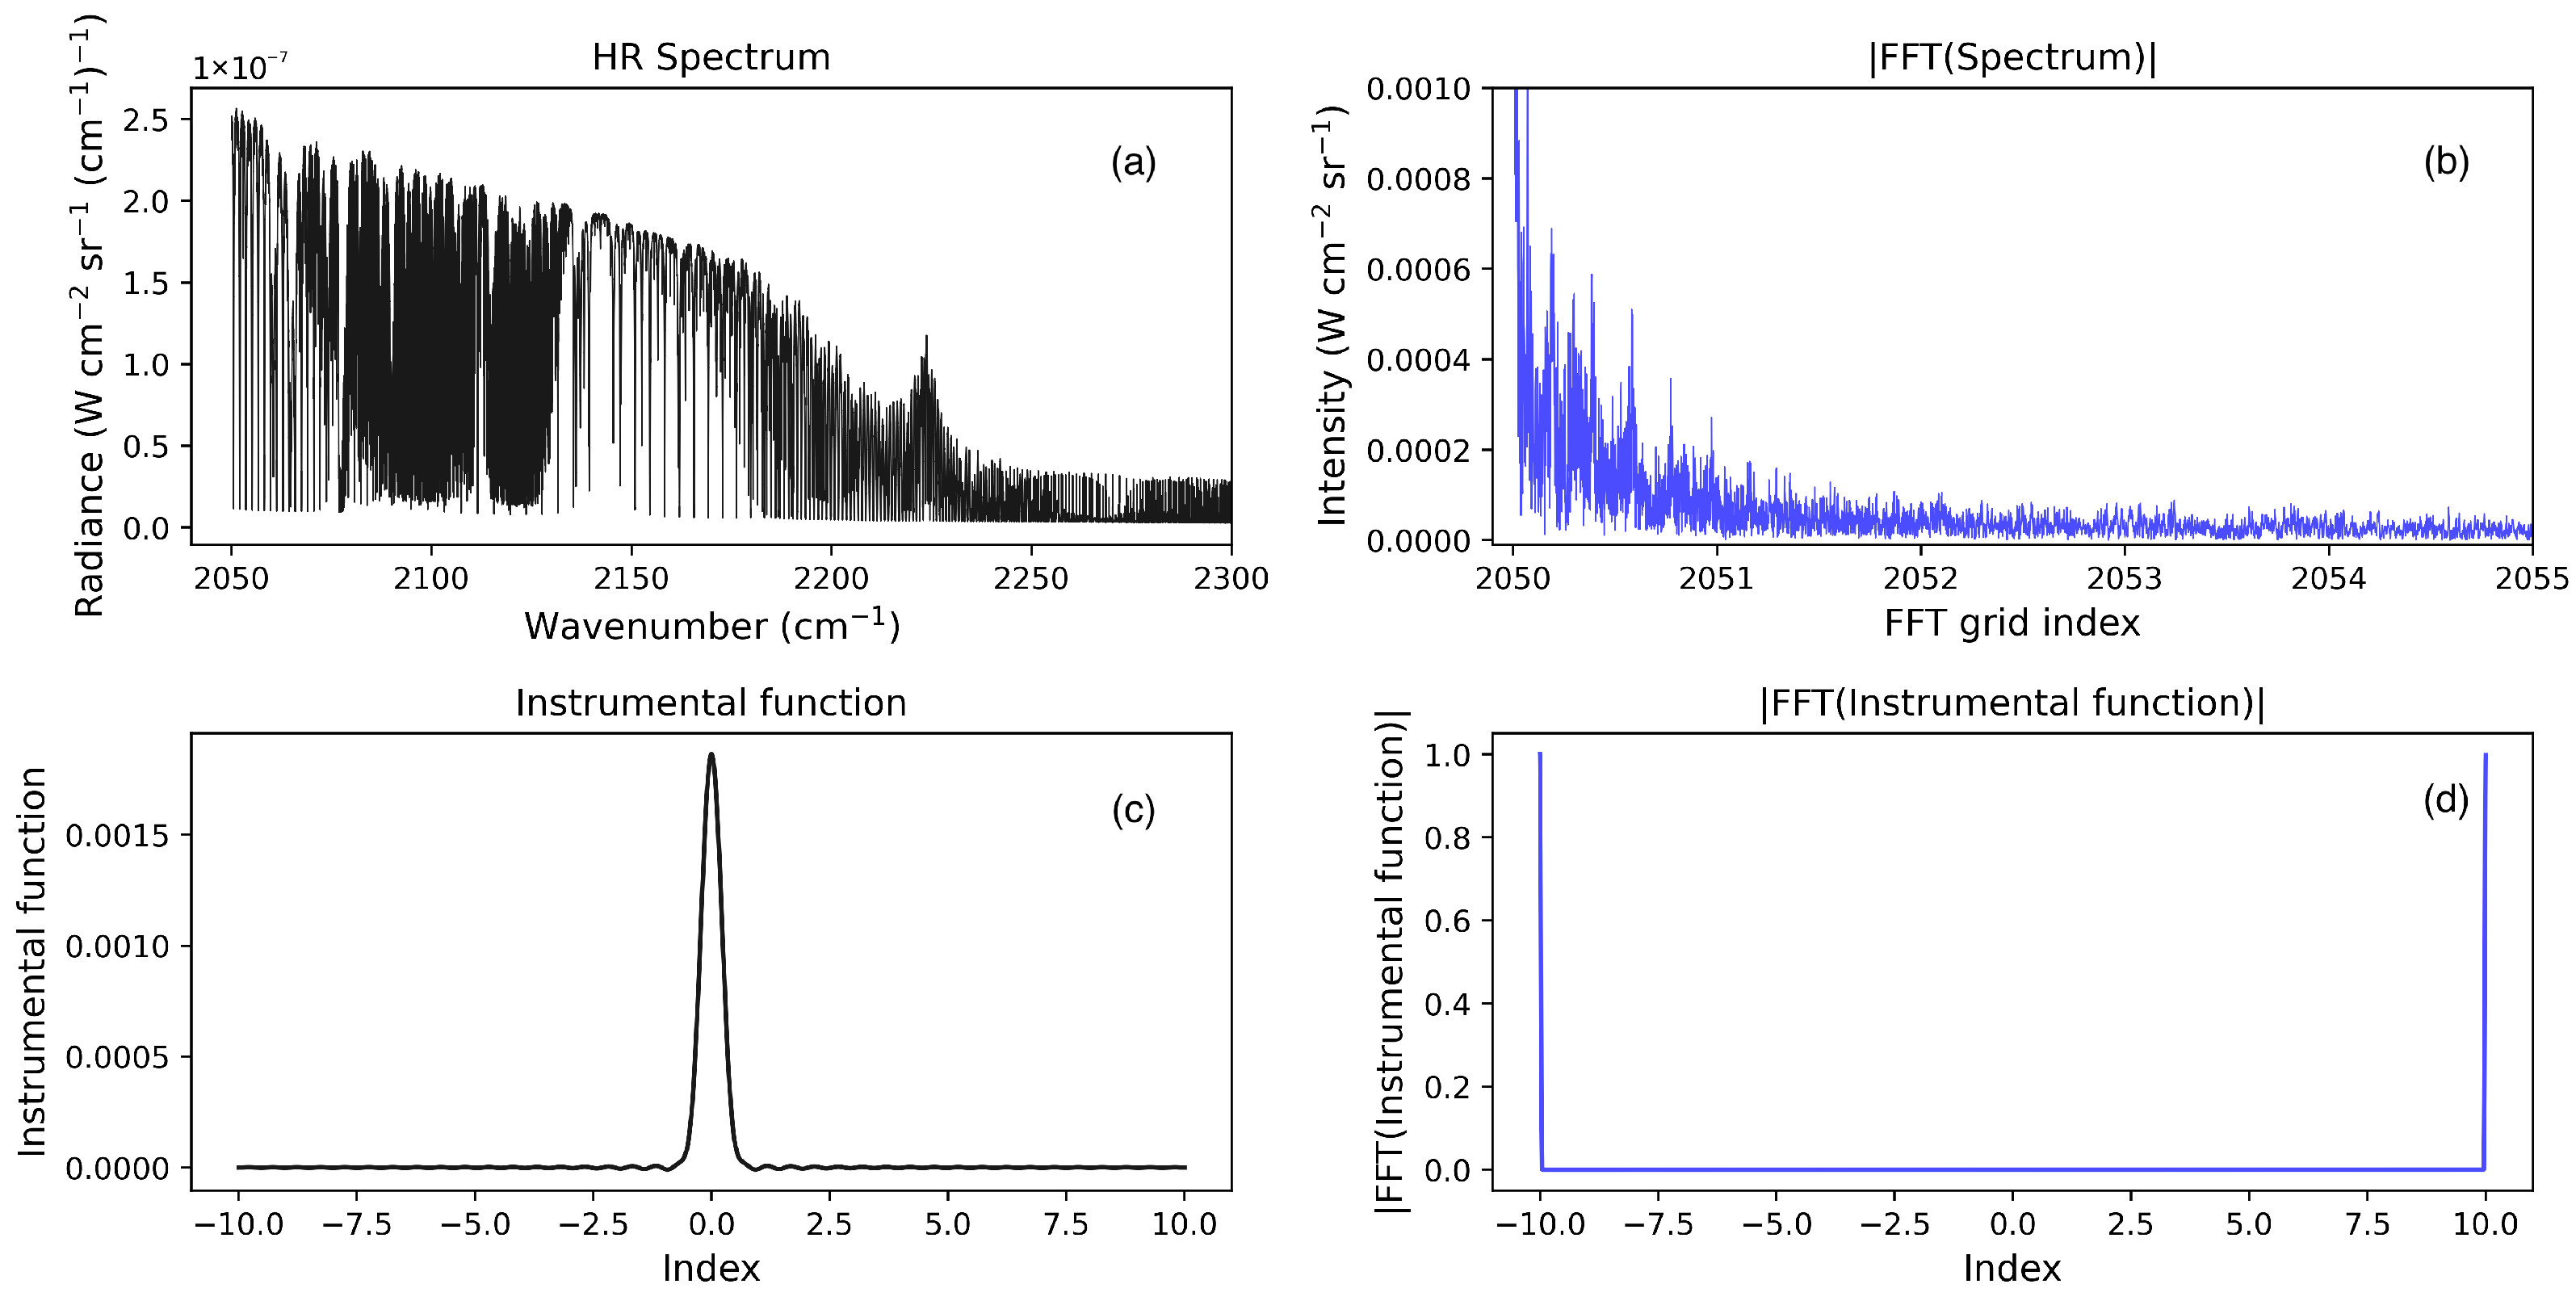
The principle is visually described in Figure 3 and yields a full simulated interferogram such as shown in Figure 4. Any IASI interferogram that shows a portion of OPDs smaller than 0 to 2 cm is called a partial interferogram (see Figure 1d).
The partial interferogram in the Figure 1d shows the region that clearly emphasises the peak portraying the beating of CO molecule, who’s periodic signature in spectral space of ∼ 4 cm 1 yields a first harmonic at 0.24 cm in the interferogram domain.
The sampling size of the interferogram, j, was chosen to be 0.001907 cm , giving 1051 points in the range of a full IASI interferogram, spanning to 2 cm . To simulate realistic measurement uncertainties, uniform random noise was added to the final module of a complex interferogram (Appendix A Figure A1). The noise follows a uniform distribution, ensuring a consistent level of perturbation across the signal. This approach is commonly used in interferometric simulations to account for detector noise and environmental fluctuations such as those suggested in Gordon et al. [44]. Furthermore, it represents the expected IASI noise as mentioned by Smith et al. [47].

3.2. Selection of Optical Path Differences

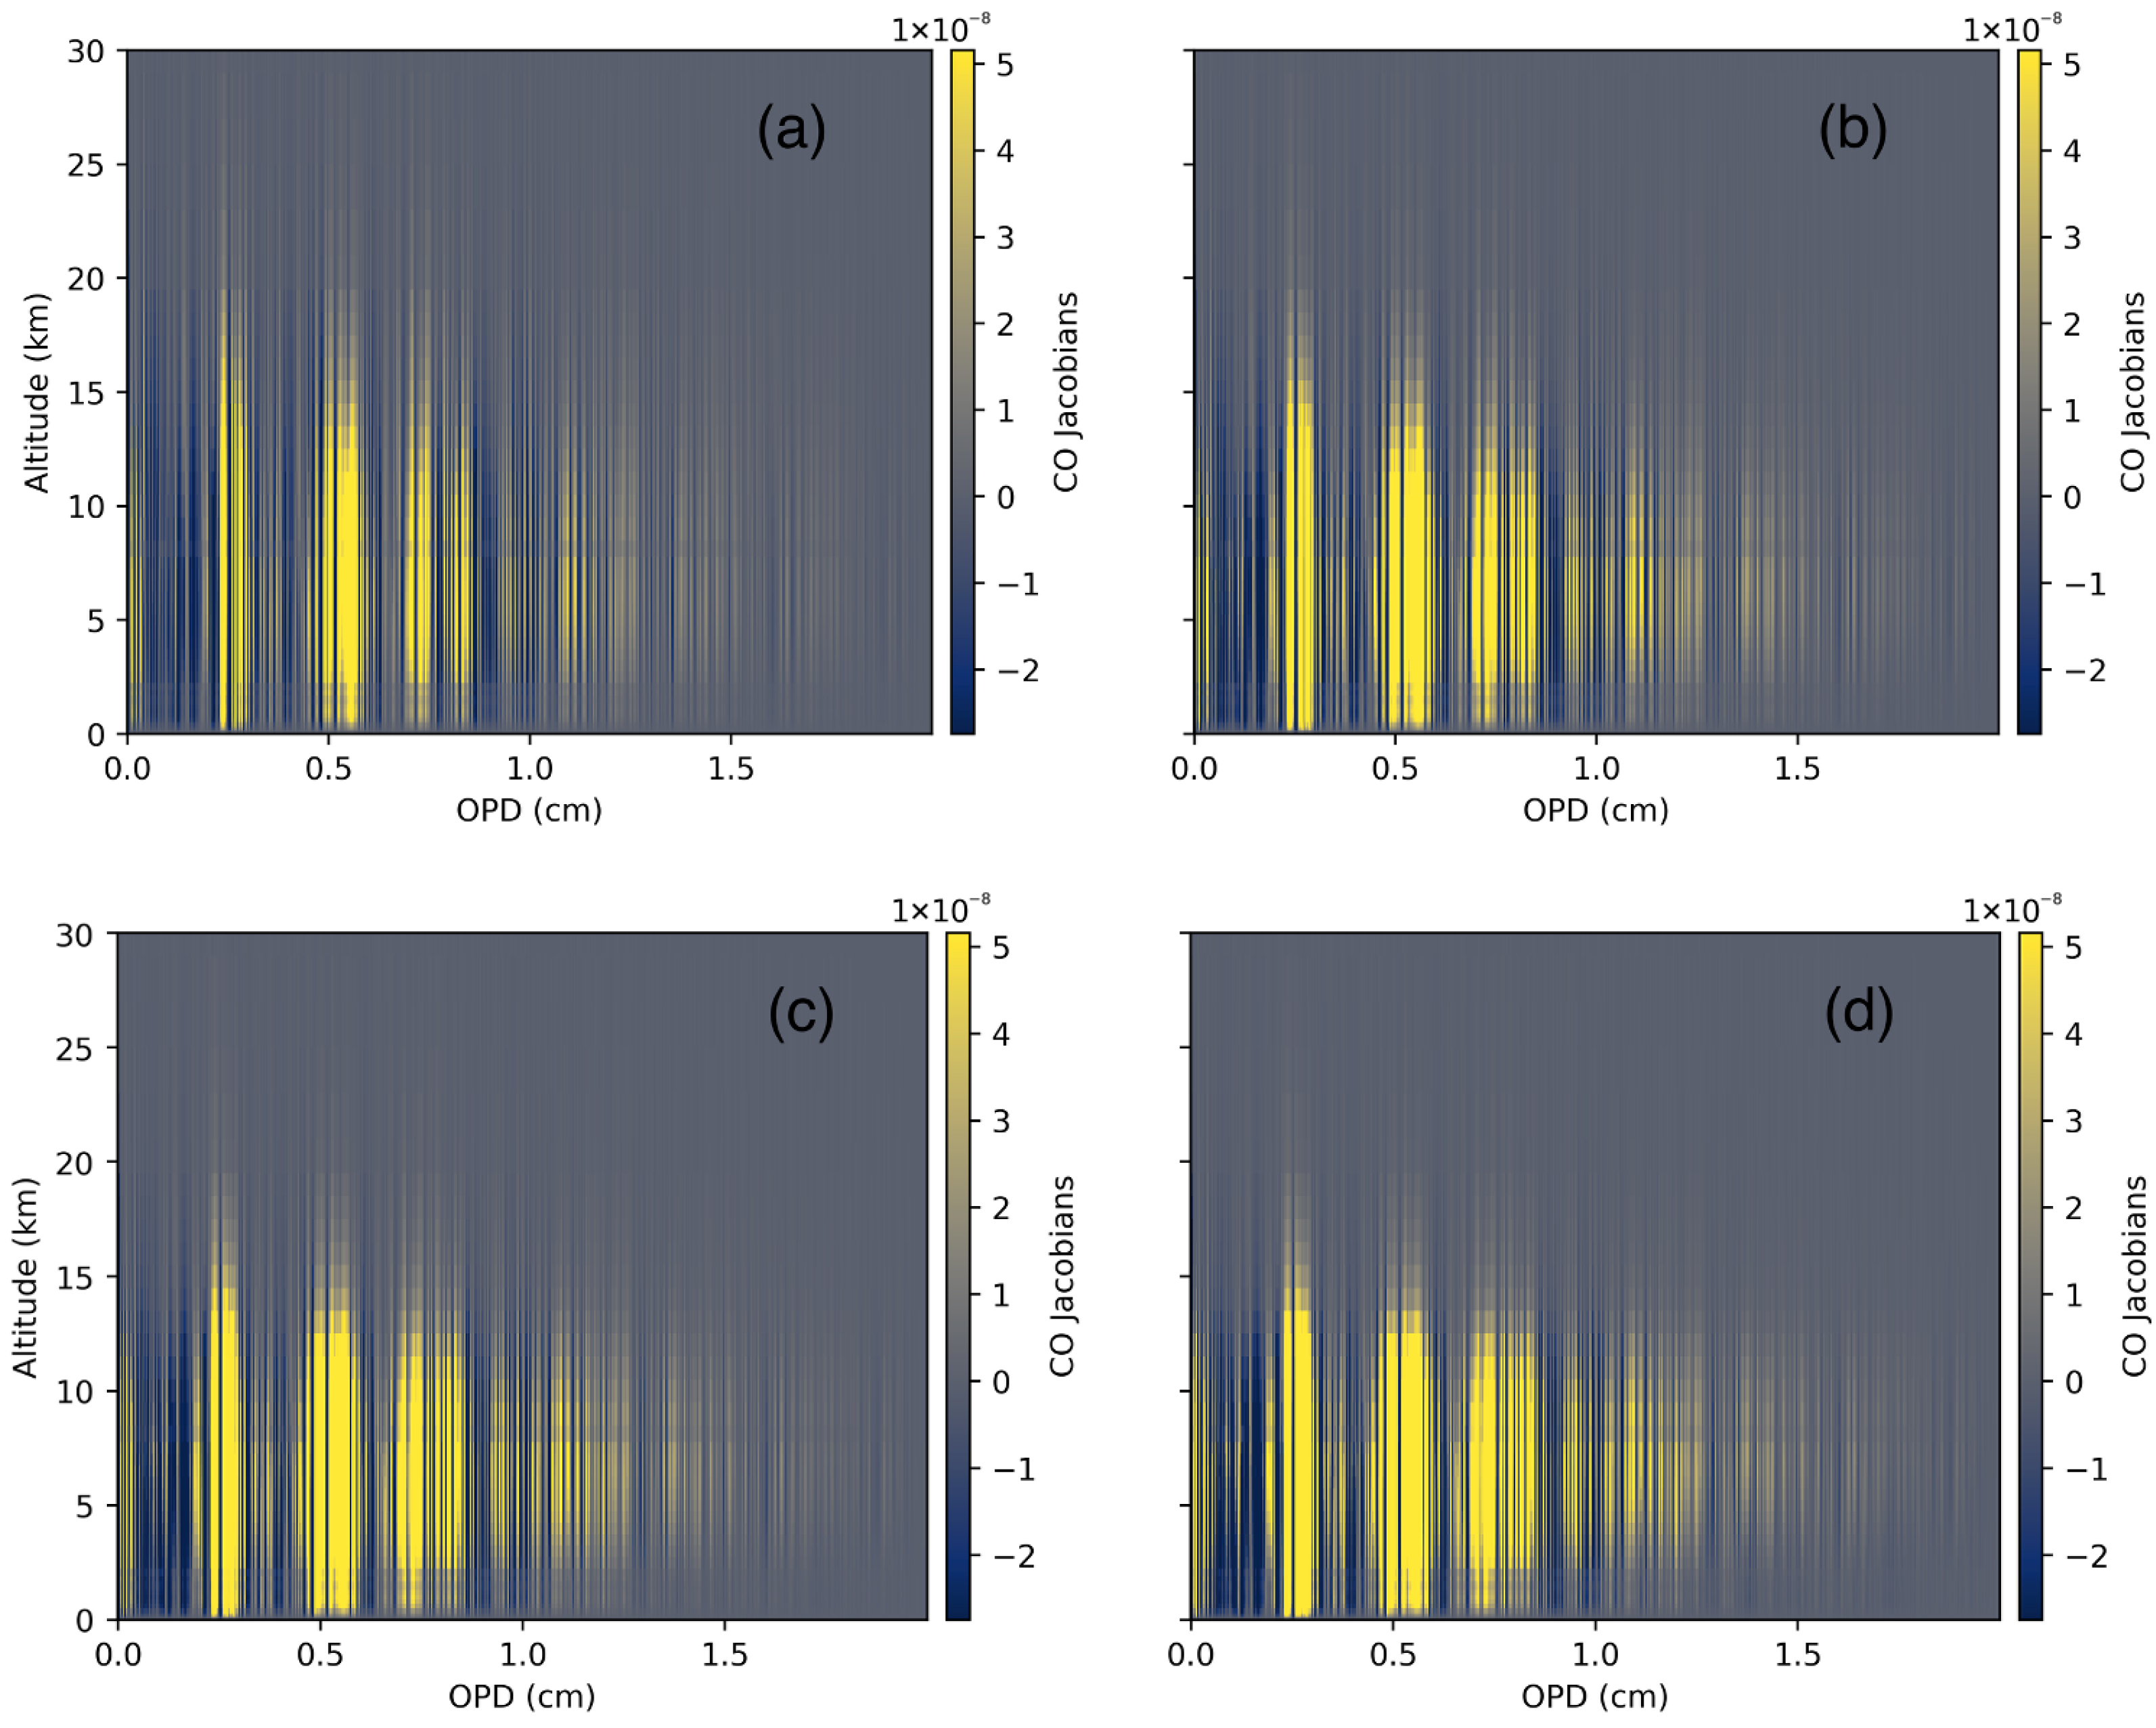
Due to the property of the high density information condensed in the interferograms [22,23],there is a need to find the most CO-sensitive radiances as a function of the optical path differences. Specific ranges of the interferogram are said to be sensitive to certain species. Hence, a Jacobian study can be used to indicate the ranges of OPDs at which the radiances disclose sensitivity to a geophysical parameter in question, brightness surface temperature, H2O, and CO in our case. Receptivity of the signal to CO, as shown in Figure 5, lies at 0.25 cm of OPD. Also called the first harmonic, it implies more interferogram spots sensitive to CO, which, due to the molecular energetic transition rules of CO, also show in a periodic pattern. (e.g., 0.5 cm , 0.75 cm , etc.) There is no or very little CO sensitivity at OPDs lower than 0.20 cm . Figure 5 shows CO Jacobians for low to high concentrations of CO, from (a) to (d), respectively. Profiles of CO correspond to profiles 1 to 4 in the Figure 2 in an increasing order of concentration in the low troposphere. The yellow regions become wider, and so CO is easier to detect at a wider range of OPDs (for each harmonic). Thus, the higher the concentration of CO, the easier the retrieval.

3.3. Algorithm 1: Classification from Geophysical Parameters

The focus of all three algorithms introduced in this paper is on retrieving the surface brightness temperature, vertical column concentrations of water vapor, and carbon monoxide. Retrieval of these 3 parameters is envisioned only by using the radiances at specific OPDs in all three approaches explored. This approach aims to test the expected relative linearity between the geophysical parameter and its signature in the interferogram signal, taking into account the interference between the different retrieved parameters.
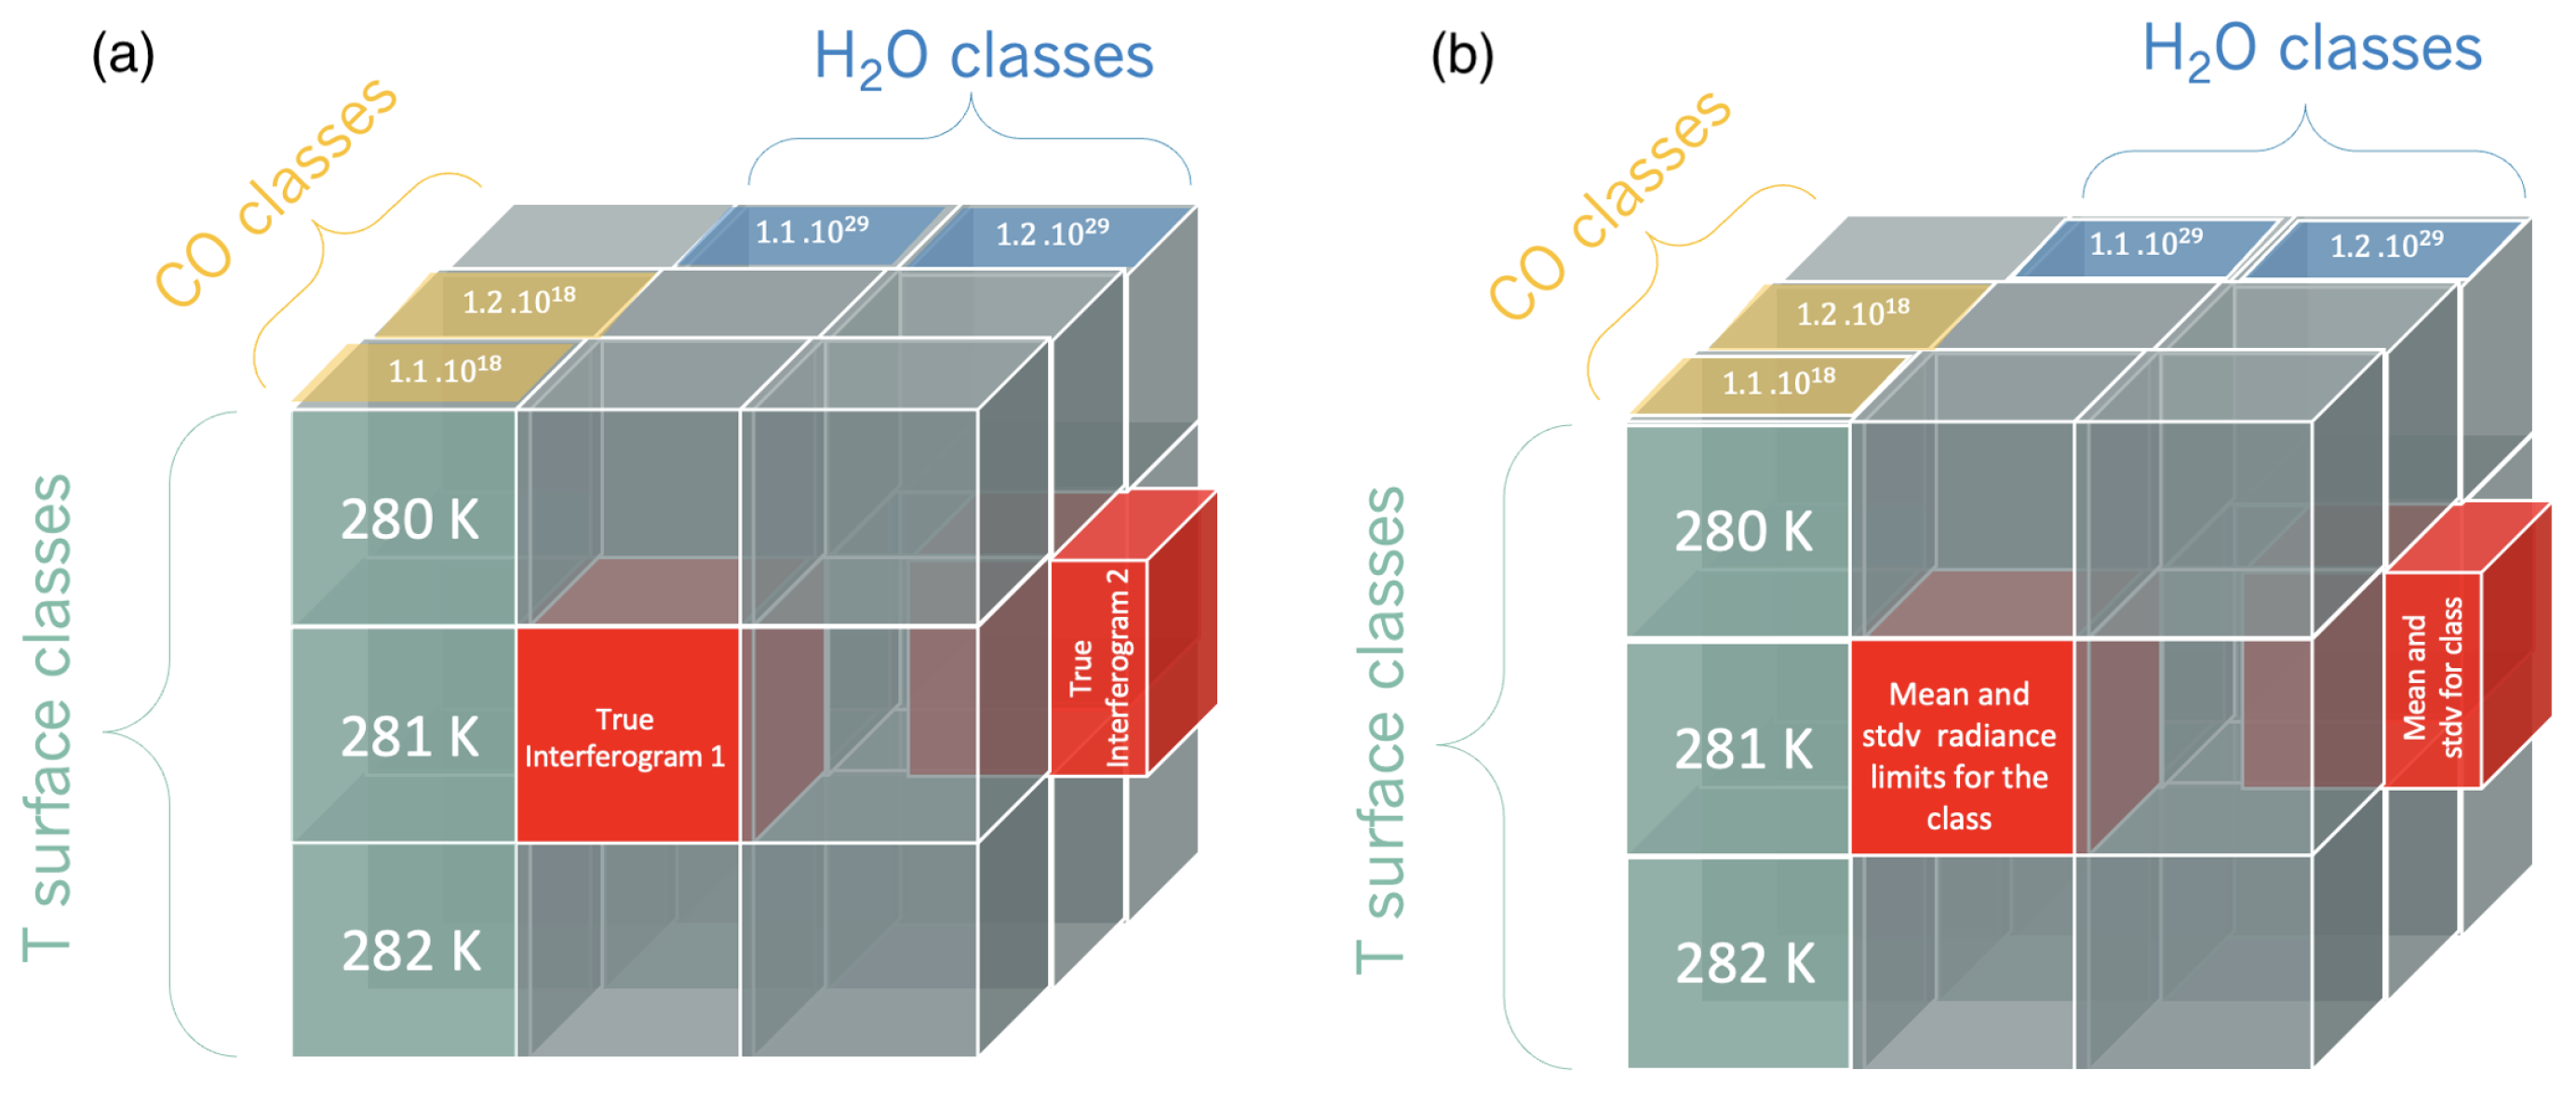
The first quick prediction method focuses on the intuitive approach consisting of three main steps: creating a control set, extracting limits of each class in terms of radiances, and finally, classifying all interferograms. By binning the range of each geophysical parameter that we would like to retrieve, we control the final sampling precision. This also allows for a classification of each interferogram from the dataset into the correctly designated ‘place’ in our 3D matrix, depending on its corresponding true values for each geophysical parameter, as depicted in the Figure 6a. Having created the control set with all interferograms in the correct class (e.g., represented by a red cube on Figure 6) for each parameter and sampling considered, one can move to the second stage of this algorithm. It includes finding the radiance limits and standard deviations for each dimension of the matrix representing a geophysical parameter within one class. This can be seen as radiance limits for each class. It is possible to use one or more radiances at chosen OPDs for the control set. Finally, having our 3d matrix filled with radiance means and standard deviations for each class, we can now, by cross-checking values of radiances at chosen OPDs of unknown interferograms, place the unknown interferograms into the class whose limits allow for it. This means that one interferogram is classed as many times as there exist OPDs that we use as an input for our classification. If classes assigned are different for different OPDs, then the final value predicted is the mean of all the predictions.

3.4. Algorithm 2: Radiance Classification

Just as before, this algorithm processes interferogram data to classify and predict surface temperature, water vapor concentration H2O, and carbon monoxide vertical column, based on radiance values at specific optical path differences. Algorithm 2, similarly to Algorithm 1, relies on creating classes. However, this time instead of creating classes for the geophysical parameters, it relies on creating radiance bins in which the interferograms are going to be classed. Initially, it reads the data file containing interferograms, extracting relevant columns that include radiances r a d at chosen OPDs and metadata such as the corresponding true values of geophysical parameters. Noise is introduced into the radiances using a uniform distribution scaled by standard deviations to simulate realistic measurement errors, expressed as follows: r a d i = r a d i + ϵ i , where , ϵ i U ( σ , σ ) . In which ϵ i is the noise added at index i and σ represents the standard deviation of that noise. Perturbed radiance values at selected OPDs are used as features, and their minimum and maximum values are dynamically tracked. For classification, these features are divided into bins by discretizing their values. The bin index for each feature is determined as follows:
j k = ttX [ i , k ] Δ x k + 1
where Δ x k represents the bin width for feature k. The matrix ttX represents the feature matrix used in the algorithm. Each row index i of ttX corresponds to a specific data sample, in this case an interferogram, while each column k represents a distinct feature derived from the sample, such as radiance values at a specific OPD. For instance, if the features correspond to radiances at particular OPDs, ttX [ i , k ] would represent the radiance measured at the k-th OPD for the i-th interferogram. This feature matrix serves as the input to the prediction algorithm, where features (radiances) are discretized into bins for classification purposes. Classification counts and cumulative radiance values are updated for the respective bins, enabling the algorithm to map interferograms to discrete categories effectively. This processed data can then be used to train models for accurate prediction of T surface brightness as well as the vertical columns of H 2 O , and CO.

3.5. Algorithm 3: Neural Networks

Algorithm 3 presents a deep learning-based approach to retrieve brightness surface temperature, water vapor, and carbon monoxide from spectral measurements using a hybrid Convolutional Neural Network (CNN) and Long Short-Term Memory (LSTM) architecture. The input file contains the radiances for chosen OPDs for the interferogram dataset described in Section 2. Uniform noise (Appendix A Figure A1) is added to the OPD features to enhance the model’s robustness by introducing variability, with a defined standard deviation for noise generation. Similarly to Algorithm 2, noise is uniform, U ( σ , σ ) . The NN proposed integrates convolutional feature extraction with sequential learning. The Conv1D layer processes interferogram inputs by learning local patterns in adjacent points, a crucial step since interferogram features contain structured correlations. CNNs have been successfully applied in atmospheric retrieval, particularly in hyperspectral imaging [48] and trace gas estimation [49] in the spectral space. Following this, fully connected dense layers refine the learned features before passing them to an LSTM layer, which captures dependencies in the interferogram profile. LSTM networks have been applied in similar atmospheric retrieval problems, including cloud property estimation [50] and hyperspectral inversion [51].
To connect the Conv1D and LSTM layers in our neural network architecture, we begin by applying a Conv1D layer with 96 filters and a kernel size of 3 to the input of length 33 (representing 33 selected OPD values). This results in a 2D output of shape ( sequence length = 33 ,   filters = 96 ) . We then flatten this output into a 1D vector of size 3168, followed by a Dense layer with 128 neurons. The output of this dense layer is reshaped into a 3D tensor of shape ( 128 ,   1 ) , allowing it to be fed into the LSTM layer as a sequence of 128 time steps with 1 feature per step. The network uses the ReLU activation function in the Dense layers to introduce non-linearity [52], while the LSTM layer employs the tanh activation function to capture sequential dependencies [53]. Training is performed using the Adam optimizer with a tunable learning rate, and the mean squared error (MSE) is used as the loss function. The model is trained for up to 50 epochs with a batch size of 8, incorporating early stopping with a patience of 5 epochs to prevent overfitting. A validation split of 20% is used from the training set during optimization. These configurations were determined through hyperparameter tuning using Optuna [54]. The best trial achieved a validation loss of 0.002345 for log scaled targets (12% relative error), with the following optimal hyperparameters: 96 convolution filters, kernel size of 3, 128 units in the first dense layer, 64 LSTM units, 128 units in the second dense layer, a dropout rate of 0.2, and a learning rate of 0.0005.
This Conv1D-LSTM model offers an efficient and accurate method for retrieving atmospheric temperature and gas vertical columns from interferogram radiance data. The use of structured scaling, Optuna-based optimization, and deep learning techniques ensures robust generalization and good accuracy in retrievals. Compared to previous approaches such as pure CNN-based retrievals [49] and LSTM-based spectral time series models [51] in spectral space, the hybrid architecture combines spatial and sequential feature extraction, intending to improve the performance of NN retrieval in the interferogram space. With the intensities of the interferogram being the only inputs, this approach offers a new alternative for fast predictions of gases from FTIR instruments.

4. Results

4.1. Algorithm 1: Starting with Geophysical Parameters

Table 1 shows the mean square errors of results obtained using Algorithm 1. There were seven different cases tested, labeled A to F in Table 1. The different cases served a testing purpose in which we varied the conditions of the retrieval: number of inputs, choice of OPDs, and resolution of classification, also called the number of bins from here on forth. Cases A, B, and C consider only retrieval for temperature and water vapor and leave out the retrieval of CO. Case A tests retrieval using only two radiance values at 0.20 and 0.23 cm of OPD, for 112 temperature bins and 20 H2O bins. Case B tests retrieval using three radiance values at 0.20, 0.23, and 0.25 cm , for the same bin numbers for temperature and H2O, while case C shows the results for 300 and 50 bins for both latter parameters, respectively. Furthermore, we test classification D, in which CO retrieval is added with ‘lower bin resolution’ at 20 bins for CO, and case E, where we test with better resolution of 50 bins for CO. Once the results were obtained, a decision to do retrieval with different choices of OPDs was taken. For this, a study of Jacobian matrices was conducted and introduced (see Figure 5), yielding the case F, with three radiances chosen at higher sensitivity, namely, 0.25, 0.50, and 0.75 cm OPDs.

4.2. Algorithm 2: Radiance Classes

In accordance with the results presented before, the mean squared error for surface temperature, H2O, and CO for Algorithm 2, respectively, are 0.81%, 29%, 28%.

4.3. Algorithm 3: Neural Networks

The Algorithm 3 was used to test for neural networks approach, every time with slightly different inputs being represented by different ranges of optical path difference from interferograms, such that indices (ranging from 1 to 1051 for a whole interferogram of 0 to 2 cm) chosen are as follows: indices 1–30 called case A, index ranges 1–17, 128–135, 243–250, which we call case B, and finally, ranges 1–17, 124–139 called case C. Indices 1–30 are said to contain the “background” signal corresponding to optical path differences from 0 to 0.05 cm . While indices 128–135, 243–250 correspond to ∼ 0.23 0.25 cm and ∼ 0.46 0.49 cm respectively, and are said to be points of interest of first and second CO harmonics. Table 2 shows different tests of the neural networks algorithm with different OPD ranges described and different numbers of interferograms.

Bias in the Neural Networks Approach

To analyze model performance in specific value ranges, such as low CO concentration regions (being the most critical), we calculate the inversion bias as the mean difference between predicted and true values:
Bias = 1 N i = 1 N y ^ i y i
where y ^ i is the predicted CO value, y i is the true CO value, and N is the number of samples in the region of interest (e.g., the lowest 25% of CO values).
The bias is found to be 2.8 × 10 17 mol / cm 2 , and the threshold for low CO values is set at the 25th percentile, which corresponds to 1.13 × 10 18 mol / cm 2 . Then, the relative error is computed as follows:
Relative Error = | Bias | True Value = 2.8 × 10 17 1.13 × 10 18 24.8 %
This indicates that the model, on average, deviates by nearly 25% in low-concentration CO regions, which may be considered moderately high for common CO detection. The model tends to underestimate the values predicted, here indicated by a negative bias, which often arises due to the under-representation of low CO samples in the training data or because the model underfits those regions. Biases less than 15% are found for the 3 higher concentration clusters (Figure 9) corresponding to higher-concentration CO profiles 2, 3, 4, 6, 7, 8 (Figure 2).

5. Discussion

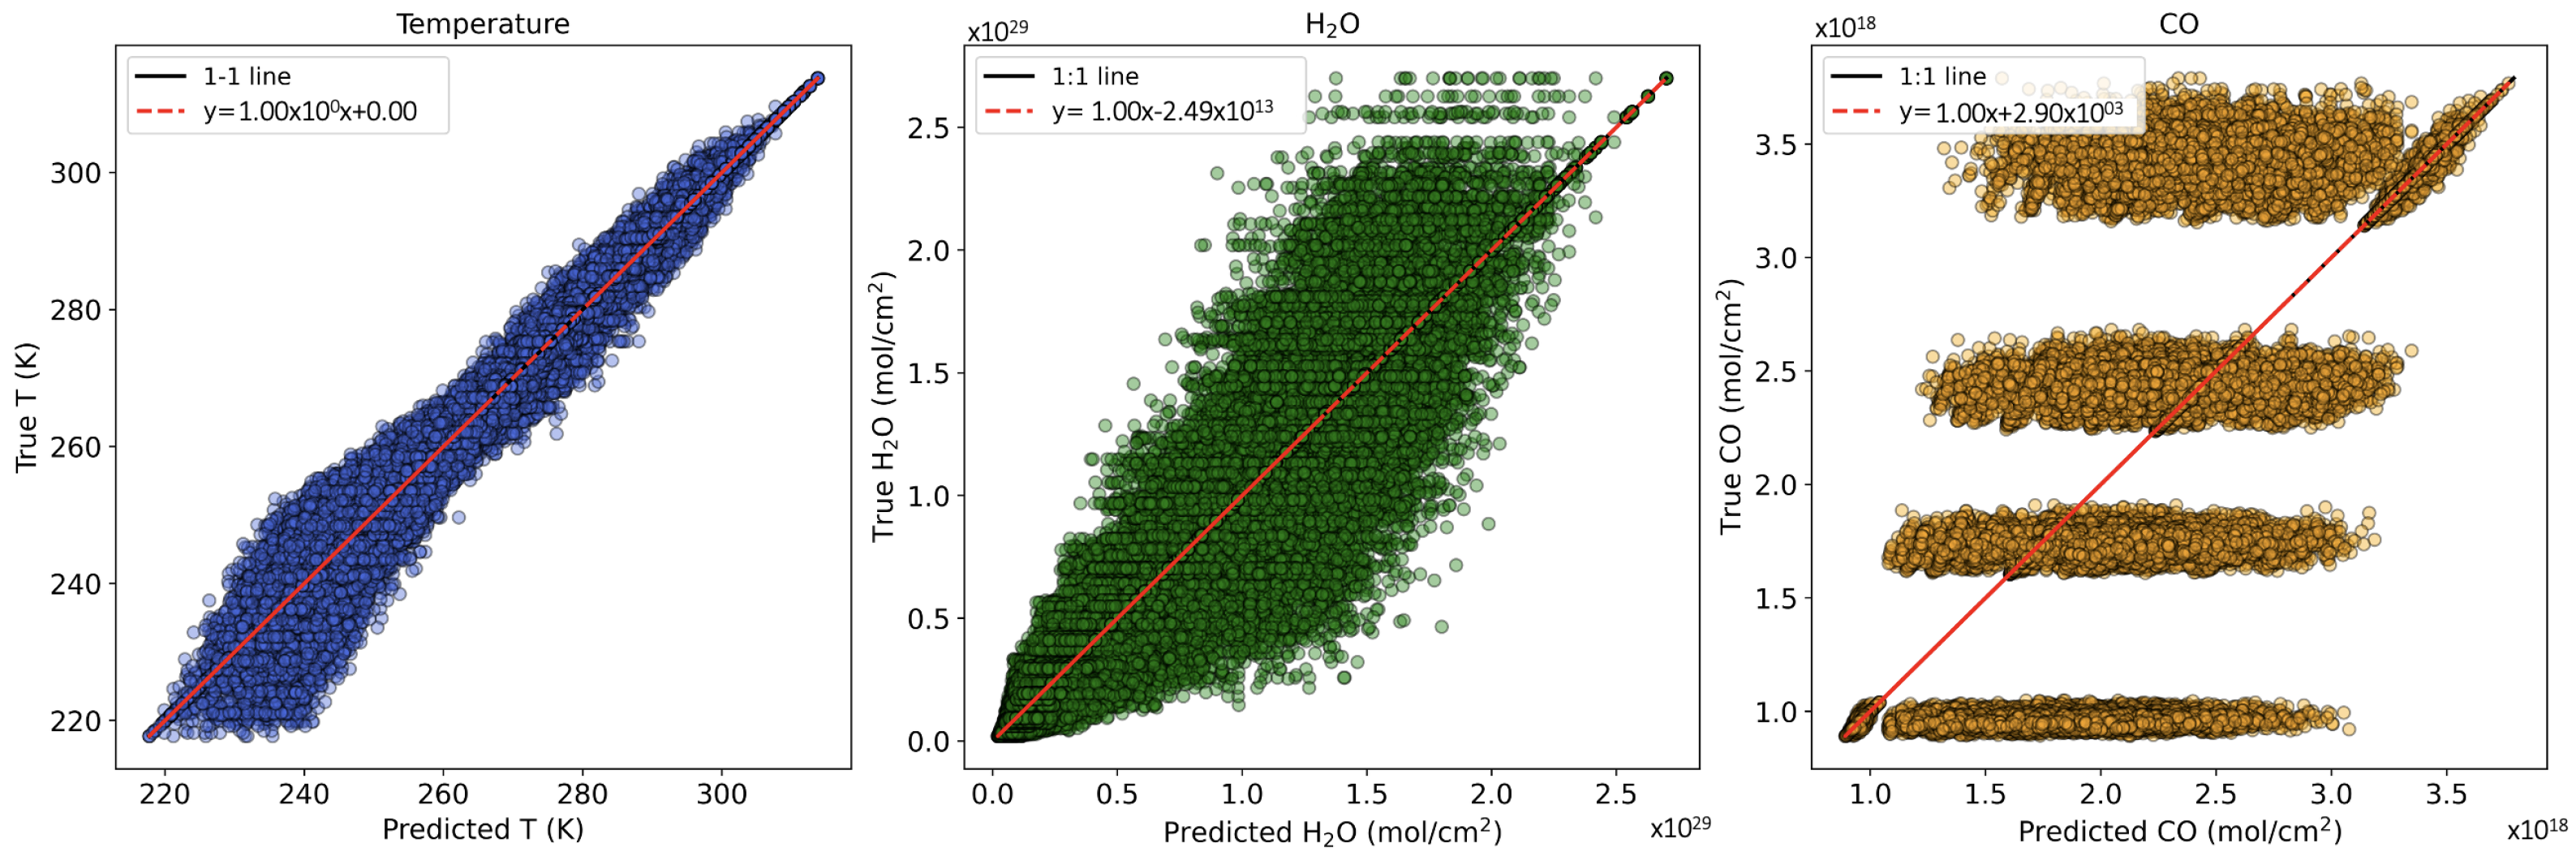
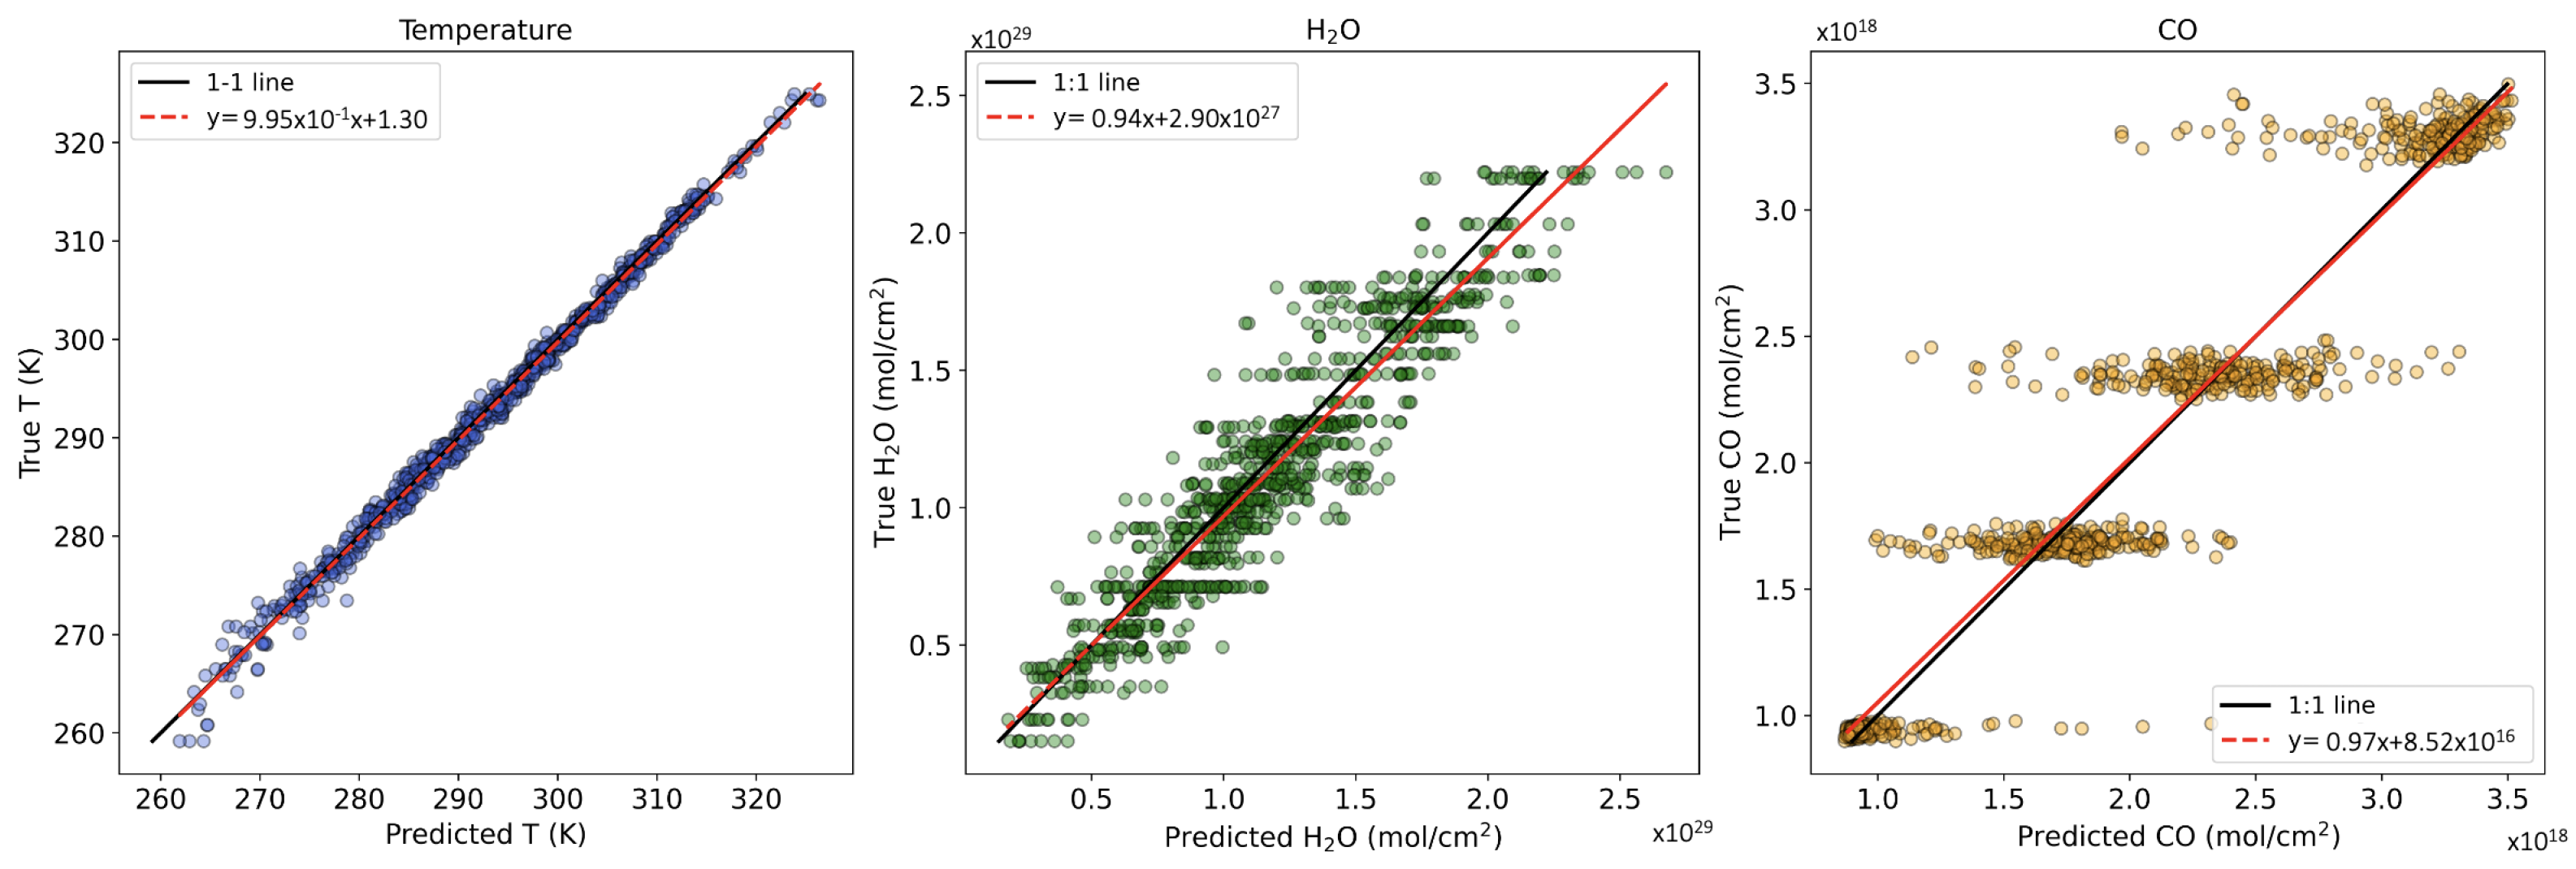
A general trend observed across the results from Algorithm 1 to Algorithm 3 indicates a progressive reduction in percentage error for all three geophysical parameters under consideration in this study. These algorithms collectively demonstrate the feasibility of rapid prediction of surface temperature, as well as the abundances of CO and H2O, directly from interferogram space. Figure 7, Figure 8 and Figure 9, effectively depict the improvement in the retrieval of predicted parameters (x-axis) versus the true values of temperature, and concentrations of H2O and CO for each interferogram (y-axis). The four clusters in the CO graph correspond to the 8 CO profiles used in the simulations.
Figure 7. The true versus predicted values for retrieval of (from left to right) surface brightness temperature, water vapor, and CO total columns using classification Algorithm 1. The red line represents the gradient of the data fit and the black line the idealized fit. Figure corresponds to the dataset E in the Table 1.
Remotesensing 17 02804 g007
Figure 8. The true versus predicted values for retrieval of (from left to right) surface brightness temperature, water vapor, and CO total columns using classification Algorithm 2. The red line represents the gradient of the data fit and the black line the idealized fit.
Remotesensing 17 02804 g008
Figure 9. The true versus predicted values for retrieval of (from left to right) surface brightness temperature, water vapor, and CO total columns using classification Algorithm 3. The red line represents the gradient of the data fit and the black line the idealized fit. Figure corresponds to the OPD range C in the Table 2 for 4616 interferograms in the dataset.
Remotesensing 17 02804 g009
Algorithm 1 represents the most basic and intuitive approach to the problem, laying down the groundwork for improving our understanding of the relationship between interferogram radiances and geophysical parameters. Its primary advantage lies in the creation of discrete bins for each geophysical parameter, which effectively introduces a controlled precision in the classification process. Additionally, this method provides multiple predictions for a single interferogram, with the final output being the mean of these predictions. The number of Optical Path Differences (OPDs) used significantly influences the percentage error of each parameter: increasing the number of OPDs leads to more precise results (case A to case B). For the D/E pair, a slight improvement of less than 1% in percentage error is observed with an increase in the number of bins. However, the associated doubling of computation time suggests that the relative improvement in accuracy is not substantial. The selection of specific OPDs, given their concentrated information content, is critical. Jacobians, which quantify the sensitivity of observed radiances to variations in retrieved atmospheric state variables, provide a theoretical basis for optimizing OPD selection. Thus, following a Jacobian study, the OPDs chosen for the classification algorithm in case F (sensitivity-based selection) should theoretically outperform those in case E (random OPD selection). Nonetheless, the observed improvements in accuracy are marginal, particularly for H2O and CO, where gains are approximately 1%. This limited enhancement underscores the constraint imposed by the small number of OPDs (three) considered in this study. Regardless of the selection strategy, the restricted number of OPDs inherently limits further improvements in vertical column density predictions. Furthermore, since Jacobians are dependent on the atmospheric state, identifying “the most sensitive OPDs” in a general context remains a significant challenge.
The use of binned radiances demonstrates a superior approach to classification, even when limited to only three radiances at specific OPDs. Similar to Algorithm 1, various OPD configurations were tested, but no significant improvement was observed. This suggests that with a small and restricted number of OPDs, the accuracy of concentration predictions is constrained, regardless of the OPD selection. Notably, the 10% improvement for H2O and approximately 3% for CO represents a meaningful enhancement, with only a minimal degradation (0.4%) in surface temperature predictions. However, a key limitation of Algorithm 2 is its reliance on a single radiance per parameter. Algorithm 2 could be further refined by incorporating multiple radiances for each parameter, potentially enhancing retrieval accuracy.
The primary advantage of Algorithm 3 over its predecessors lies in its use of 30 radiances at 0 to 0.051498 cm of OPD. By leveraging the full range of interferogram points for training and testing a neural network model, this algorithm was expected to deliver superior performance. The significant reduction in all error metrics confirms this, achieving a surface temperature prediction error of just 0.3%, less than 20% error for H2O, and under 15% for CO concentration. It is estimated that for the retrieval using NN for a map of 100 pixels, five hours of computation time would be saved, compared to the full physics retrieval. In addition to the more time-efficient retrieval, the interferogram approach shows that the precision of the retrieval is the same as the one in the spectral domain [55]. However, to operationalize the NN algorithm, further improvements are necessary. First and foremost, the bias found in the low-concentration CO predictions has to be improved. One of the ways to do this is to introduce a weighted loss function or introduce a multitask approach where CO prediction receives an extra supervision. We also suggest using more than 30 OPDs as an input to the retrieval algorithm, especially covering the OPDs at CO-sensitive regions of the partial interferogram suggested in the Section 3.2. Overall, with its high precision and consistent results across different OPD ranges even with a bias, the errors remain stable, demonstrating the feasibility of transforming this approach into an operational algorithm and proving the concept of fast retrieval in the interferogram domain.

6. Conclusions and Perspectives

We have presented a new basic approach for fast-retrieval algorithms, which demonstrates the potential of the concept for fast predictions of atmospheric trace gases from interferograms. IASI-like interferograms were generated using the LATMOS Atmospheric Retrieval Algorithm (LARA) with 2311 TIGR climatological situations to simulate high-resolution spectra. Spectra were then transformed into interferograms using an appropriate Fourier Transform algorithm, making up the main data input for the three fast-retrieval algorithms explored. The first and the second algorithms rely on a binning method of either geophysical parameter or radiances; the true radiances at chosen optical path differences are used to “classify” a specific interferogram as a correct bin, giving a prediction for surface temperature, H2O, and CO related to that bin. Further improvements to these studies could include testing a larger number of radiances for inputs, as well as a different choice of optical path differences, to account for sensitivity to the parameter over a larger range of climatological conditions. As the use of interferogram has been poorly studied till now, and the physical meaning of geophysical parameters in an interferogram is yet to be learnt, the current approaches are intuitive and, despite having errors (at best) of 40% for H2O, 30% for CO and less than 1% for brightness surface temperature, they show a potential of retrieval from interferograms and the fast-retrieval approach. Hence, the next step of the study introduced a neural network algorithm, which significantly reduced the prediction errors, achieving less than ±15% error in the estimation of carbon monoxide. In order to assess the value of this approach compared to a more classic one (e.g. neural network based on spectra), we plan to apply the same suite of calculations on spectra, using the same inputs, radiative transfer algorithm, and instrumental line shape, thereby making the comparison in terms of fully conclusive precision based on simulations. In addition, we believe that further work and understanding of the full-physics retrieval from the interferogram domain and PSI by the scientific community could bring new interesting tools and conclusions, as well as exploiting this concept to improve and make this algorithm operational. With that, we concluded that the concept of fast retrieval from the interferogram domain is possible and potentially a fruitful topic of future research, providing additional comparison of both approaches. Finally, when interferogram-based retrieval is mastered, we will be able to apply full physics or fast retrieval on real IASI observations, with the advantage of having a large set of mature retrievals in the spectral domain to compare with our new approach.

Author Contributions

Conceptualization, S.P., N.E. and L.C.; methodology, S.P., N.E. and L.C.; software, S.P.; data curation, N.E.; writing—original draft preparation, N.E.; writing—review and editing, N.E., S.P. and L.C.; supervision, S.P. and L.C.; project administration, N.E.; funding acquisition, S.P., L.C. and N.E. All authors have read and agreed to the published version of the manuscript.

Funding

This research is a part of PhD thesis funded by the Sciences de l’Environnement d’Ile de France ED 129.

Data Availability Statement

The TIGR database used in generation of the interferogram set can be found on AERIS [56]. The full interferogram dataset can be acquired by contacting the authors directly.

Acknowledgments

We would like to thank ED 129 and Sorbonne Université for funding the PhD which contributed to this scientific article. Furthermore, we thank AERIS, which continues to provide the observation and campaign data, and from which the TIGR dataset was retrieved [56]. Finally, IASI [4], which was developed and constructed under the leadership of the Centre National d’Études Spatiales (CNES, France) and operates onboard the MetOp satellites as part of the EUMETSAT Polar System, to which we would also like to thank for their contribution to this work. We thank the anonymous reviewers for their comments and suggestions that have greatly improved the article.

Conflicts of Interest

The authors declare no conflicts of interest. The funders had no role in the design of the study; in the collection, analyses, or interpretation of data; in the writing of the manuscript; or in the decision to publish the results.

Abbreviations

The following abbreviations are used in this manuscript:
OPDOptical Path Difference
TIGRThermodynamic Initial Guess Retrieval
IASIInfrared Atmospheric Sounding Interferometer
NNNeural Network
NRTNear-real-time
LARALATMOS Atmospheric Retrieval Algorithm
LATMOSLaboratoire atmosphères, milieux, observations spatiales

Appendix A

Figure A1. The representation of the uniform noise used in the 3 algorithms.
Remotesensing 17 02804 g0a1

References

  1. George, M.; Clerbaux, C.; Hurtmans, D.; Turquety, S.; Coheur, P.-F.; Pommier, M.; Hadji-Lazaro, J.; Edwards, D.P.; Worden, H.; Luo, M.; et al. Carbon monoxide distributions from the IASI/METOP mission. Atmos. Chem. Phys. 2009, 9, 8317–8330. [Google Scholar] [CrossRef]
  2. Müller, J.F.; Stavrakou, T.; Bauwens, M.; George, M.; Hurtmans, D.; Coheur, P.F.; Clerbaux, C.; Sweeney, C. Top-Down CO Emissions Based on IASI Observations and Hemispheric Constraints on OH Levels. Geophys. Res. Lett. 2018, 45, 1621–1629. [Google Scholar] [CrossRef]
  3. George, M.; Clerbaux, C.; Bouarar, I.; Coheur, P.; Deeter, M.N.; Edwards, D.P.; Francis, G.; Gille, J.C.; Hadji-Lazaro, J.; Hurtmans, D.; et al. An examination of the long-term CO records from MOPITT and IASI: Comparison of retrieval methodology. Atmos. Meas. Tech. 2015, 8, 4313–4328. [Google Scholar] [CrossRef]
  4. Blumstein, D.; Chalon, G.; Carlier, T.; Buil, C.; Hébert, P.; Maciaszek, T.; Ponce, G.; Phulpin, T.; Tournier, B.; Simeoni, D.; et al. IASI instrument: Technical overview and measured performances. Proc. SPIE 2004, 5543, 196–207. [Google Scholar] [CrossRef]
  5. Crevoisier, C.; Clerbaux, C.; Guidard, V.; Phulpin, T.; Armante, R.; Barret, B.; Camy-Peyret, C.; Chaboureau, J.-P.; Coheur, P.-F.; Crépeau, L.; et al. Towards IASI-New Generation (IASI-NG): Impact of improved spectral resolution and radiometric noise on the retrieval of thermodynamic, chemistry and climate variables. Atm. Meas. Techniq. 2014, 12, 4367–4385. [Google Scholar] [CrossRef]
  6. Stuhlmann, R.; Rodriguez, A.; Tjemkes, S.; König, M. MTG-IRS: A Highly Advanced Infrared Sounder for Meteosat Third Generation. In Proceedings of the EUMETSAT Meteorological Satellite Conference, Vienna, Austria, 16–20 September 2013; EUMETSAT: Darmstadt, Germany, 2013. [Google Scholar]
  7. EUMETSAT. MTG-IRS Level 1 Algorithm Theoretical Basis Document. 2019. Available online: https://user.eumetsat.int/s3/eup-strapi-media/MTG_IRS_Level_1_Algorithm_Theoretical_Basis_Document_v2_7b42d5efaa.pdf (accessed on 16 December 2024).
  8. ESA. Meteosat Third Generation: Infrared Sounder (MTG-IRS). 2023. Available online: https://www.eumetsat.int/meteosat-third-generation-sounder-1-and-copernicus-sentinel-4 (accessed on 16 December 2024).
  9. Gousset, S.; Croize, L.; Le Coarer, E.; Ferrec, Y.; Rodrigo-Rodrigo, J.; Brooker, L. NanoCarb hyperspectral sensor: On performance optimization and analysis for greenhouse gas monitoring from a constellation of small satellites. CEAS Space J. 2019, 11, 507–524. [Google Scholar] [CrossRef]
  10. Brooker Lizon-Tati, L.; Serra, S.V.; Bovensman, H.; Crevoisier, C.; Dogniaux, M.; Croiz’e, L.; Ferrec, Y.; Le Coarer, E.; Gousset, S.; Sic, B.; et al. SCARBO: A constellation of small satellites for the monitoring of anthropogenic greenhouse gases. In Proceedings of the 73rd International Astronautical Congress (IAC), Paris, France, 18–22 September 2022. [Google Scholar]
  11. Dogniaux, M.; Crevoisier, C.; Gousset, S.; Le Coarer, E.; Ferrec, Y.; Croizé, L.; Wu, L.; Hasekamp, O.; Sic, B.; Brooker, L. The Space Carbon Observatory (SCARBO) concept: Assessment of XCO2 and XCH4 retrieval performance. Atmos. Meas. Tech. 2022, 15, 4835–4858. [Google Scholar] [CrossRef]
  12. Croizé, L. Performance Assessment for Total CO2 and CH4 Column Monitoring Using a Miniaturized Static Spectrometer; EGU, European Geosciences Union: Vienna, Austria, 2019; Available online: https://meetingorganizer.copernicus.org/EGU2019/EGU2019-13333.pdf (accessed on 16 December 2024).
  13. Rodgers, C.D. Inverse Methods for Atmospheric Sounding: Theory and Practice; World Scientific: Singapore, 2000. [Google Scholar] [CrossRef]
  14. Michelson, A.A. On the Application of Interference Methods to Spectroscopic Measurements.—I. Lond. Edinb. Dublin Philos. Mag. J. Sci. 1891, 31, 338–346. [Google Scholar] [CrossRef]
  15. Beer, R. Remote Sensing by Fourier Transform Spectrometry; John Wiley & Sons: Hoboken, NJ, USA, 1992. [Google Scholar]
  16. Bracewell, R.N. The Fourier Transform and Its Applications, 2nd ed.; McGraw-Hill Book Company: Columbus, OH, USA, 1986. [Google Scholar]
  17. Bell, R. Introductory Fourier Transform Spectroscopy; Academic Press: Cambridge, MA, USA, 1972. [Google Scholar]
  18. Kyle, T.G. Temperature soundings with partially scanned interferograms. Appl. Opt. 1977, 16, 326–333. [Google Scholar] [CrossRef]
  19. Fortunato, G. Application of interferential correlation of spectrum to the detection of atmospheric pollutants. J. Opt. 1978, 9, 281. [Google Scholar] [CrossRef]
  20. Goldstein, H.W.; Grenda, R.N.; Bortner, M.H.; Dick, R. CIMATS—A correlation interferometer for the measurement of atmospheric trace species. In Proceedings of the Joint Conference on Sensing of Environmental Pollutants, New Orleans, LA, USA, 6–11 November 1977; American Chemical Society: Washington, DC, USA, 1978; pp. 586–589. [Google Scholar]
  21. Smith, W.L.; Howell, H.B.; Woolf, H.M. The Use of Interferometric Radiance Measurements for Sounding the Atmosphere. J. Atmos. Sci. 1979, 36, 566–575. [Google Scholar] [CrossRef]
  22. Serio, C.; Masiello, G.; Grieco, G. Fourier Transform Spectroscopy with Partially Scanned Interferograms as a Tool to Retrieve Atmospheric Gases Concentrations from High Spectral Resolution Satellite Observations—Methodological Aspects and Application to IASI. In Atmospheric Model Applications; IntechOpen: London, UK, 2012. [Google Scholar] [CrossRef]
  23. Grieco, G.; Masiello, G.; Matricardi, M.; Serio, C. Partially scanned interferogram methodology applied to IASI for the retrieval of CO, CO2, CH4 and N2O. Opt. Express 2013, 21, 24753–24769. [Google Scholar] [CrossRef] [PubMed]
  24. Chevallier, F.; Chéruy, F.; Scott, N.A.; Chédin, A. A regularized neural network approach for retrieval of atmospheric and surface temperatures with the IASI instrument. J. Appl. Meteorol. 2002, 41, 144–159. [Google Scholar] [CrossRef]
  25. Whitburn, S.; Van Damme, M.; Clarisse, L.; Clerbaux, C.; Hurtmans, D.; Coheur, P.F. A new neural network-based methane retrieval algorithm for IASI: Analysis of sensitivity to spectroscopy and ancillary data. Atmos. Meas. Tech. 2016, 9, 4955–4977. [Google Scholar] [CrossRef]
  26. Van Damme, M.; Whitburn, S.; Clarisse, L.; Clerbaux, C.; Hurtmans, D.; Coheur, P.F. An improved NH3 retrieval algorithm for IASI using the neural network-based ANNI-NH3-v2.1 framework. Atmos. Meas. Tech. 2017, 10, 4905–4914. [Google Scholar] [CrossRef]
  27. Susskind, J.; Barnet, C.D.; Blaisdell, J.M. Improved Determination of Surface and Atmospheric Temperatures Using Only Shortwave AIRS Channels: The AIRS Version 6 Retrieval Algorithm. IEEE International Geoscience and Remote Sensing Symposium (IGARSS), Paper ID 20100014828. 2010. Available online: https://ntrs.nasa.gov/api/citations/20100014828/downloads/20100014828.pdf?utm_source=chatgpt.com (accessed on 16 December 2024).
  28. Liu, X.; Chance, K.; Sioris, C.E.; Kurosu, T.P.; Spurr, R.J.D. Tropospheric ozone profiles from the Tropospheric Emission Spectrometer (TES): Characterization of the optimal estimation retrievals. J. Geophys. Res. Atmos. 2006, 111, D22S08. [Google Scholar] [CrossRef]
  29. Murty, D.; Barnet, C.; Xu, L.; Gu, D.; Wilson, M.; Kizer, S.; Xiong, X.; Maddy, E.; Ferraro, R.; Knuteson, R.; et al. The CrIMSS EDR Algorithm: Characterization, Optimization, and Validation. JGR Atmos. 2014. [Google Scholar] [CrossRef]
  30. Bauduin, S.; Clarisse, L.; Theunissen, M.; George, M.; Hurtmans, D.; Clerbaux, C.; Coheur, P.F. IASI’s sensitivity to near-surface carbon monoxide (CO): Theoretical analyses and retrievals on test cases. J. Quant. Spectrosc. Radiat. Transf. 2017, 189, 428–440. [Google Scholar] [CrossRef]
  31. AERIS Data Center. Thermodynamical Initial Guess Retrieval (TIGR); AERIS Data Center: Paris, France, 2025. [Google Scholar]
  32. Chédin, A.; Scott, N.A.; Wahiche, C.; Moulinier, P. The Improved Initialization Inversion Method: A High-Resolution Physical Method for Temperature Retrievals from Satellites of the TIROS-N Series. J. Clim. Appl. Meteorol. 1985, 24, 1283–1299. [Google Scholar] [CrossRef]
  33. Achard, V. A statistical method for selecting a representative set of atmospheric situations for satellite simulations. J. Appl. Meteorol. 1991, 30, 476–490. [Google Scholar]
  34. Chevallier, F.; Chédin, A.; Chéruy, F.; Morcrette, J.J. TIGR-like atmospheric-profile databases for accurate radiative-flux computation. Q. J. R. Meteorol. Soc. 1998, 124, 1431–1454. [Google Scholar]
  35. Payan, S.; Camy-Peyret, C.; Jeseck, P.; Hawat, T.; Durry, G.; Lefèvre, F. First direct simultaneous HCl and ClONO2 profile measurements in the Arctic Vortex. Geophys. Res. Lett. 1998, 25, 2663–2666. [Google Scholar] [CrossRef]
  36. Payan, S.; Camy-Peyret, C.; Bureau, J. Comparison of Retrieved L2 Products from Four Successive Versions of L1B Spectra in the Thermal Infrared Band of TANSO-FTS over the Arctic Ocean. Remote Sens. 2017, 9, 1167. [Google Scholar] [CrossRef]
  37. Mondelain, D.; Payan, S.; Deng, W.; Camy-Peyret, C.; Hurtmans, D.; Mantz, A.W. Measurement of the temperature dependence of line mixing and pressure broadening parameters between 296 and 90 K in the ν3 band of 12CH4 and their influence on atmospheric methane retrievals. J. Mol. Spectrosc. 2007, 244, 130–137. [Google Scholar] [CrossRef]
  38. Butz, A.; Bösch, H.; Camy-Peyret, C.; Dorf, M.; Engel, A.; Payan, S.; Pfeilsticker, K. Observational constraints on the kinetics of the ClO-BrO and ClO-ClO ozone loss cycles in the Arctic winter stratosphere. Geophys. Res. Lett. 2007, 34, L05801. [Google Scholar] [CrossRef]
  39. Payan, S.; Camy-Peyret, C.; Oelhaf, H.; Wetzel, G.; Maucher, G.; Keim, C.; Pirre, M.; Huret, N.; Engel, A.; Volk, M.C.; et al. Validation of version-4.61 methane and nitrous oxide observed by MIPAS. Atmos. Chem. Phys. 2009, 9, 413–442. [Google Scholar] [CrossRef]
  40. Keim, C.; Eremenko, M.; Orphal, J.; Dufour, G.; Flaud, J.M.; Höpfner, M.; Boynard, A.; Clerbaux, C.; Payan, S.; Coheur, P.F.; et al. Tropospheric ozone from IASI: Comparison of different inversion algorithms and validation with ozone sondes in the northern middle latitudes. Atmos. Chem. Phys. 2009, 9, 9329–9347. [Google Scholar] [CrossRef]
  41. Razavi, A.; Clerbaux, C.; Wespes, C.; Clarisse, L.; Hurtmans, D.; Payan, S.; Camy-Peyret, C.; Coheur, P.F. Characterization of methane retrievals from the IASI space-borne sounder. Atmos. Chem. Phys. 2009, 9, 7889–7899. [Google Scholar] [CrossRef]
  42. Segonne, C.; Huret, N.; Payan, S.; Gouhier, M.; Catoire, V. A Spectra Classification Methodology of Hyperspectral Infrared Images for Near Real-Time Estimation of the SO2 Emission Flux from Mount Etna with LARA Radiative Transfer Retrieval Model. Remote Sens. 2020, 12, 4107. [Google Scholar] [CrossRef]
  43. Huret, N.; Segonne, C.; Payan, S.; Salerno, G.; Catoire, V.; Ferrec, Y.; Roberts, T.; Pola Fossi, A.; Rodriguez, D.; Croizé, L.; et al. Infrared hyperspectral and ultraviolet remote measurements of volcanic gas plume at Mt Etna during IMAGETNA campaign. Remote Sens. 2019, 11, 1175. [Google Scholar] [CrossRef]
  44. Gordon, I.E.; Rothman, L.S.; Hargreaves, E.R.; Hashemi, R.; Karlovets, E.V.; Skinner, F.M.; Conway, E.K.; Hill, C.; Kochanov, R.V.; Tan, Y.; et al. The HITRAN2020 Molecular Spectroscopic Database. J. Quant. Spectrosc. Radiat. Transf. 2022, 277, 107949. [Google Scholar] [CrossRef]
  45. Clough, S.A.; Shephard, M.W.; Mlawer, E.; Delamere, J.S.; Iacono, M.; Cady-Pereira, K.; Boukabara, S.; Brown, P.D. Atmospheric radiative transfer modeling: A summary of the AER codes. J. Quant. Spectrosc. Radiat. Transf. 2005, 91, 233–244. [Google Scholar] [CrossRef]
  46. Strang, G. Calculus; Wellesley-Cambridge Press: Wellesley, MA, USA, 1999. [Google Scholar]
  47. Smith, F.; Armante, R.; August, T.; Barnet, C.; Bouchard, A.; Camy-Peyret, C.; Capelle, V.; Clarisse, L.; Clerbaux, C.; Coheur, P.F.; et al. Hyperspectral Earth Observation from IASI: Five Years of Accomplishments. Bull. Am. Meteorol. Soc. 2012, 93, 347–370. [Google Scholar] [CrossRef]
  48. Feng, L.; Zhang, X.; Zhang, L. A hybrid deep learning approach for hyperspectral image classification using convolutional and recurrent neural networks. ISPRS J. Photogramm. Remote Sens. 2020, 165, 182–192. [Google Scholar]
  49. Niemeyer, T.; Ustinov, E.; Burrows, J.P. Convolutional neural networks for atmospheric trace gas retrievals from hyperspectral remote sensing data. Remote Sens. 2020, 12, 1998. [Google Scholar]
  50. Kadowaki, Y.; Tanaka, Y.; Takamura, E. Cloud property retrievals using deep learning and LSTM networks from MODIS and VIIRS observations. Atmos. Res. 2021, 250, 105366. [Google Scholar]
  51. Sun, H.; Chen, X.; Wu, J. LSTM-based spectral inversion for atmospheric trace gas retrievals from TROPOMI satellite data. IEEE Trans. Geosci. Remote Sens. 2022, 60, 4108711. [Google Scholar]
  52. Reichstein, M.; Camps-Valls, G.; Stevens, B.; Jung, M.; Denzler, J.; Carvalhais, N.; Prabhat. Deep learning and process understanding for data-driven Earth system science. Nature 2019, 566, 195–204. [Google Scholar] [CrossRef]
  53. Shi, X.; Chen, Z.; Wang, H.; Yeung, D.Y.; Wong, W.K.; Woo, W.C. Convolutional LSTM Network: A Machine Learning Approach for Precipitation Nowcasting. In Proceedings of the Advances in Neural Information Processing Systems, Montreal, QC, Canada, 7–12 December 2015; Curran Associates, Inc.: Red Hook, NY, USA, 2015; Volume 28, pp. 802–810. [Google Scholar]
  54. Akiba, T.; Sano, S.; Yanase, T.; Ohta, T.; Koyama, M. Optuna: A next-generation hyperparameter optimization framework. In Proceedings of the 25th ACM SIGKDD International Conference on Knowledge Discovery & Data Mining, Anchorage, AK, USA, 4–8 August 2019; pp. 2623–2631. [Google Scholar]
  55. Giuseppe, G.; Masiello, G.; Serio, C. Interferometric vs Spectral IASI Radiances: Effective Data-Reduction Approaches for the Satellite Sounding of Atmospheric Thermodynamical Parameters. Remote Sens. 2010, 2, 2323–2346. [Google Scholar] [CrossRef]
  56. AERIS Data Infrastructure. AERIS Data and Services for the Atmosphere. 2025. Available online: https://www.aeris-data.fr (accessed on 14 January 2025).
Figure 1. High resolution spectra (a) and their corresponding interferogram (c) for a mid-latitude atmospheric situation with black curves for a situation with very low column of CO and red curves with high CO signature. Difference of spectra with and without CO reveals the signature ‘comb’ structure, typical for carbon monoxide (b). The zoom of the interferogram (d), showing an OPD region in range 0.23 to 0.33 cm, shows the difference of the interferogram signal with and without CO.
Remotesensing 17 02804 g001
Figure 2. CO profiles used in dataset simulation of spectra. Main 4 profiles (1 to 4) and their corresponding pairs (5 to 8) representing long-range transport of CO from high sources like fires.
Remotesensing 17 02804 g002
Figure 3. Generating the interferogram from high-resolution simulated spectra in the case of IASI. An interferogram is a convolution of spectrum (a) and an instrumental function (c). Hence, by definition [46], multiplying the Fourier transform of the spectrum (b) with a Fourier transform of the instrumental function (d), we obtain the interferogram (Figure 4b).
Remotesensing 17 02804 g003
Figure 4. IASI spectra in the spectral window 2050 to 2350 cm 1 (a), and its corresponding IASI interferogram (b) simulation.
Remotesensing 17 02804 g004
Figure 5. Jacobians for carbon monoxide. Subplots shown for CO profiles 1 in (a), 2 in (b), 3 in (c), 4 in (d). CO profiles are described in Figure 2 and represent increasing concentrations in the low troposphere. Intensification of the sensitivity to CO (stronger yellow regions from (a,d)) can be spotted, proportionally to the increasing concentration of CO (profiles 1 to 4). Calculation of derivatives with respect to CO was performed using LARA [35].
Remotesensing 17 02804 g005
Figure 6. (a) The schema of the first algorithm (1) based on binning 3 geophysical parameters and leading to a 3D matrix allowing for the classification of the interferograms into the correct bins; (b) The schema representing the same 3D matrix, this time, in terms of true radiance ranges allowing for the interferograms to be assigned the correct bin.
Remotesensing 17 02804 g006
Table 1. Classification starting from geophysical parameters.
CaseNo. of OPDsNo. of T ClassesNo. of H2O ClassesNo. of CO ClassesT Surface (K) MSEH2O (mol/cm2) MSECO (mol/cm2) MSE
A21122057%89%
B31122043%77%
C33005013%46%
D311220200.48%42%31%
E330050500.47%41%31%
F311220200.41%39%30%
Table 2. Classification starting from geophysical parameters for algorithm 3.
Case—OPD RangesNo. of InterferogramsT Surface (K) MSEH2O (mol/cm2) MSECO (mol/cm2) MSETraining Time
A46160.28%12%23%∼5 h
B46160.31%14%14%∼5 h
B100,0000.34%18%16%∼7 days
C46160.33%14%9%∼5 h
C100,0000.25%18%13%∼7 days
Disclaimer/Publisher’s Note: The statements, opinions and data contained in all publications are solely those of the individual author(s) and contributor(s) and not of MDPI and/or the editor(s). MDPI and/or the editor(s) disclaim responsibility for any injury to people or property resulting from any ideas, methods, instructions or products referred to in the content.