Author Contributions
Conceptualization, R.G.; methodology, R.G.; software, R.G.; validation, R.G.; formal analysis, R.G.; investigation, R.G.; resources, R.G.; data curation, R.G.; writing—original draft preparation, R.G.; writing—review and editing, R.G. and P.S.; visualization, R.G.; supervision, P.S.; project administration, P.S.; funding acquisition, P.S. All authors have read and agreed to the published version of the manuscript.
Figure 1.
This figure illustrates the evolutionary refinement of hyperspectral target spectra over generations. The top row shows RGB visualizations of SanDiego2 in the SanDiego1 → SanDiego2 adaptation benchmark, while the bottom row presents detection maps. Candidate solutions are color coded. In Generation 1, the best solution (red) only has a single pixel on one of the target airplanes. By Generation 2 and Generation 3, this improves to two and three pixels, respectively. By Generation 50, six of the ten pixels in the best solution have landed across all three airplanes, yielding the detection map with the clearest target delineation.
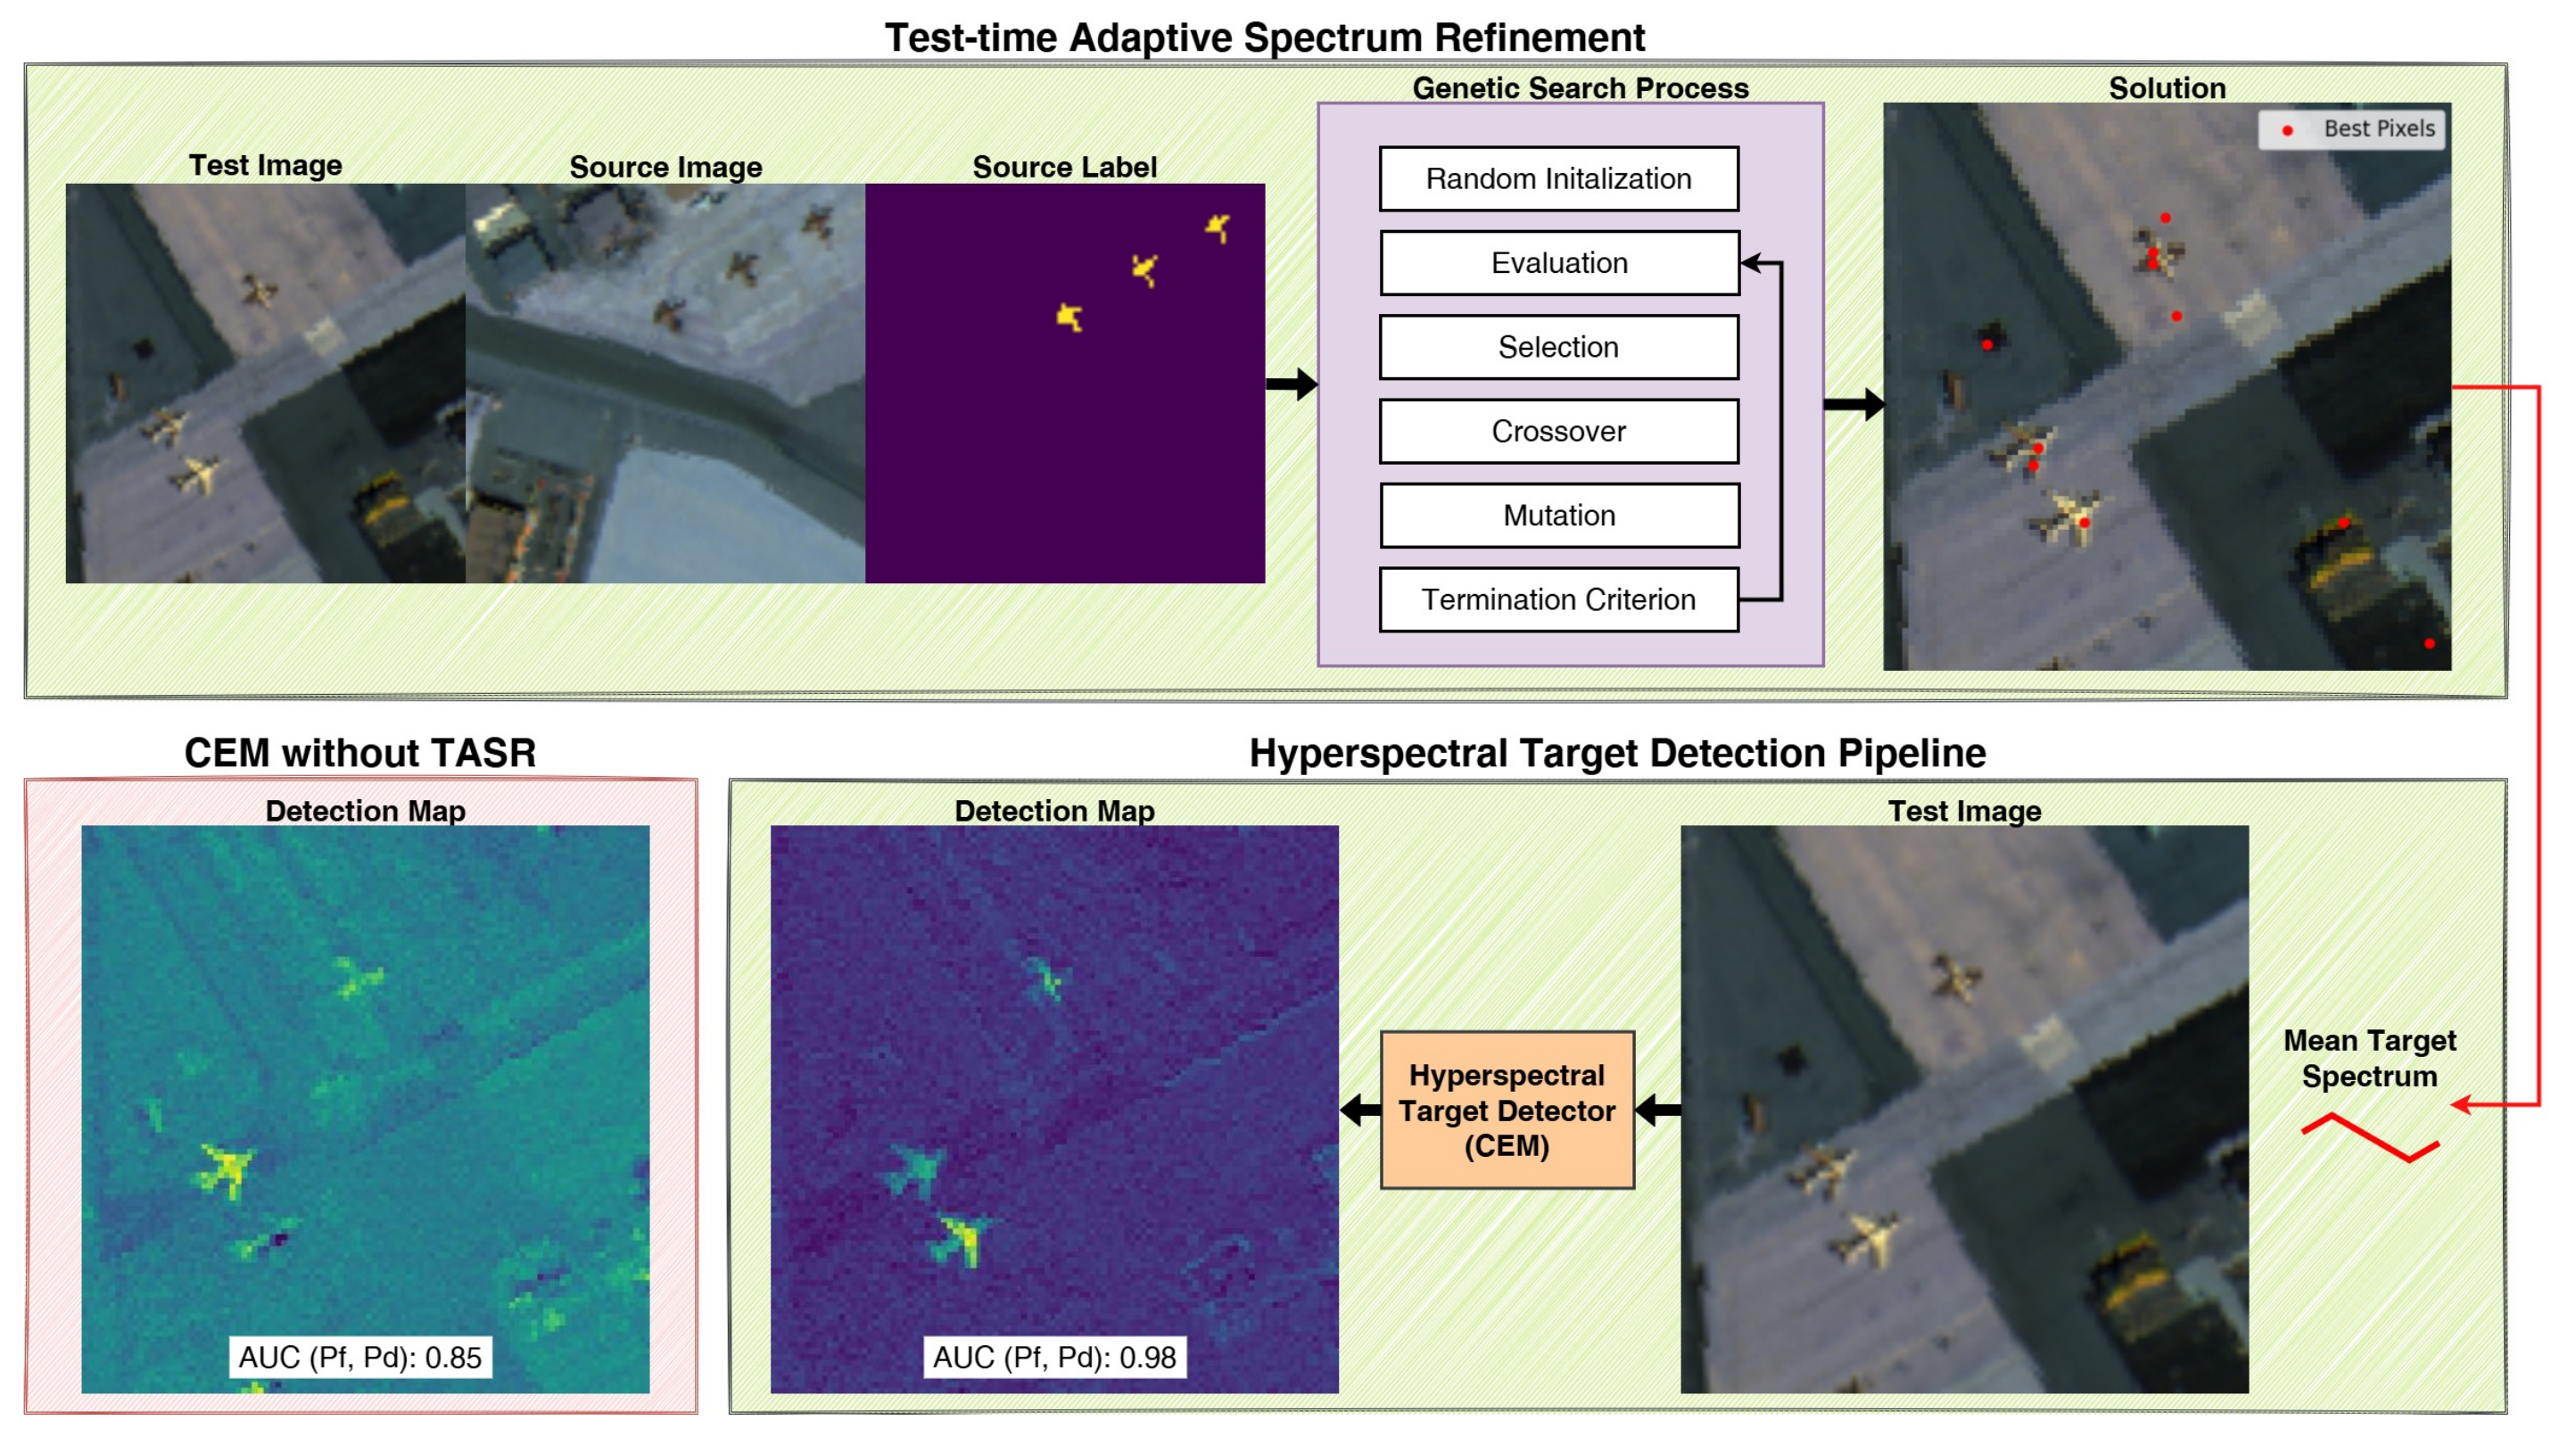
Figure 2.
The diagram presents an overview of our TASR framework, which refines target spectra at test time by selecting pixels that optimize the fitness objective. This refined mean spectrum is then used for hyperspectral target detection. Conventional methods rely on source-labeled spectra without adapting to the test scene, making them vulnerable to spectral variability. TASR overcomes this limitation, achieving an of 0.98 compared to 0.85 on SanDiego1→SanDiego2.
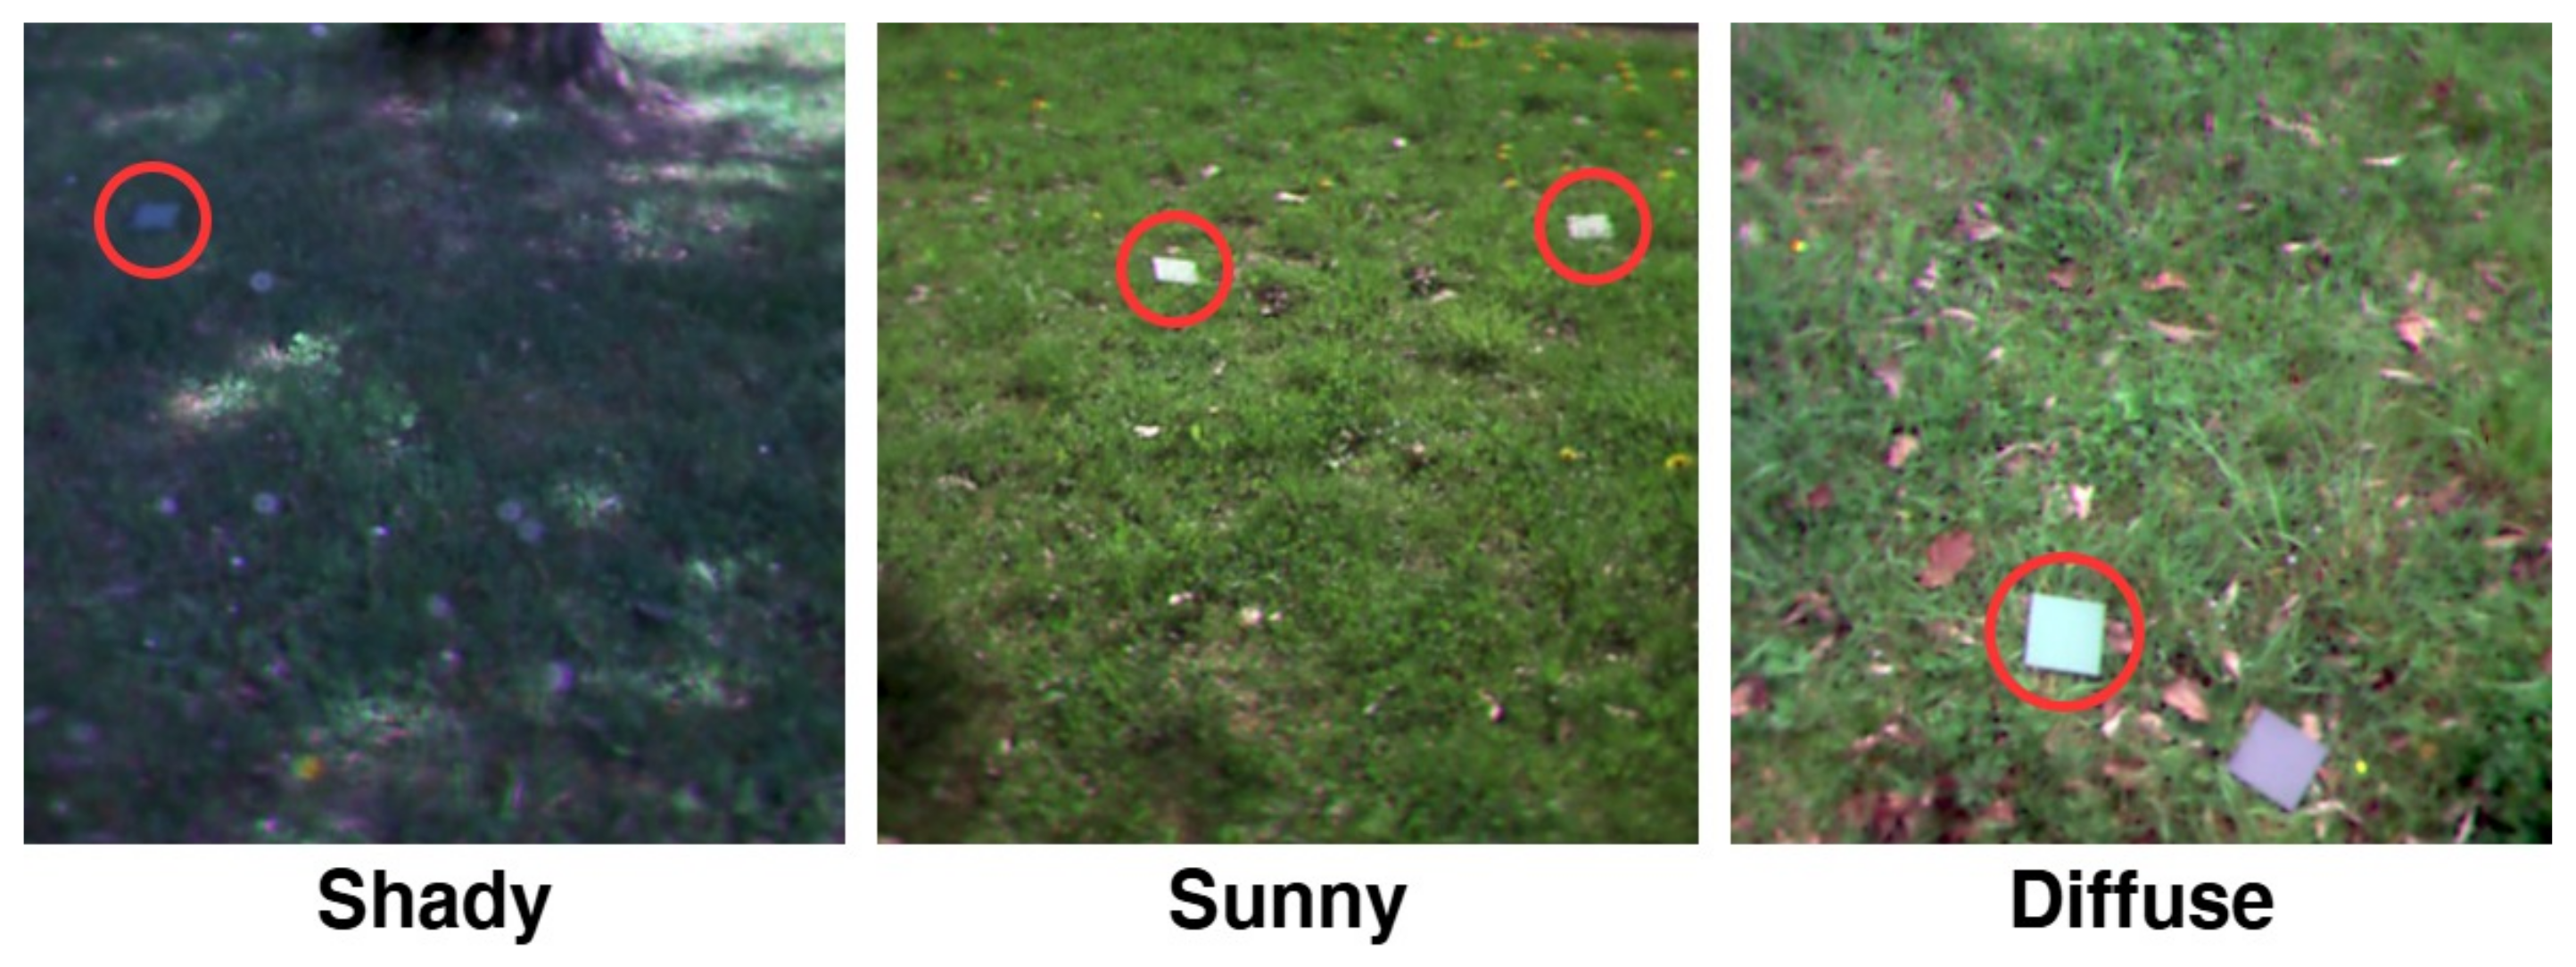
Figure 3.
RGB composites of the SSD dataset under three illumination conditions: under-illuminated target in shaded environment (shady), over-illuminated targets in direct sunlight (sunny), and evenly illuminated target with a spectral decoy (diffuse). Red circles indicate target locations.
Figure 3.
RGB composites of the SSD dataset under three illumination conditions: under-illuminated target in shaded environment (shady), over-illuminated targets in direct sunlight (sunny), and evenly illuminated target with a spectral decoy (diffuse). Red circles indicate target locations.
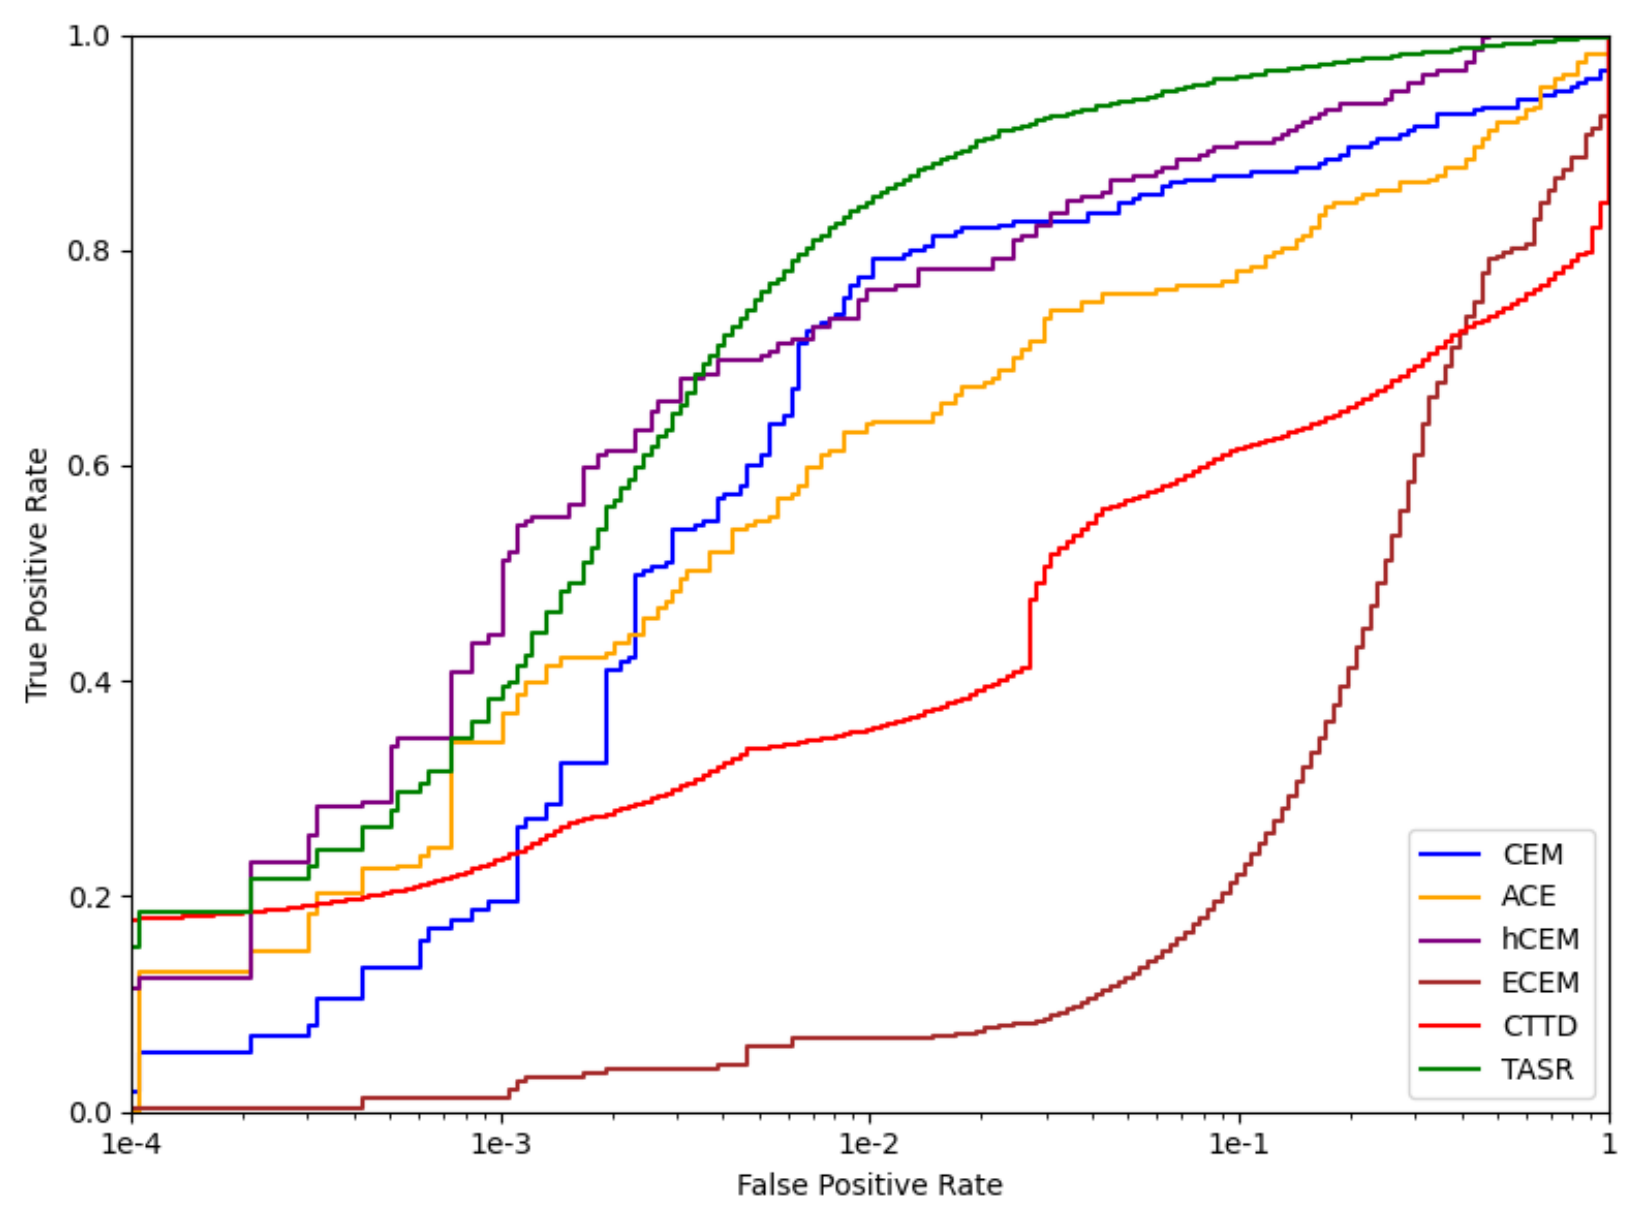
Figure 4.
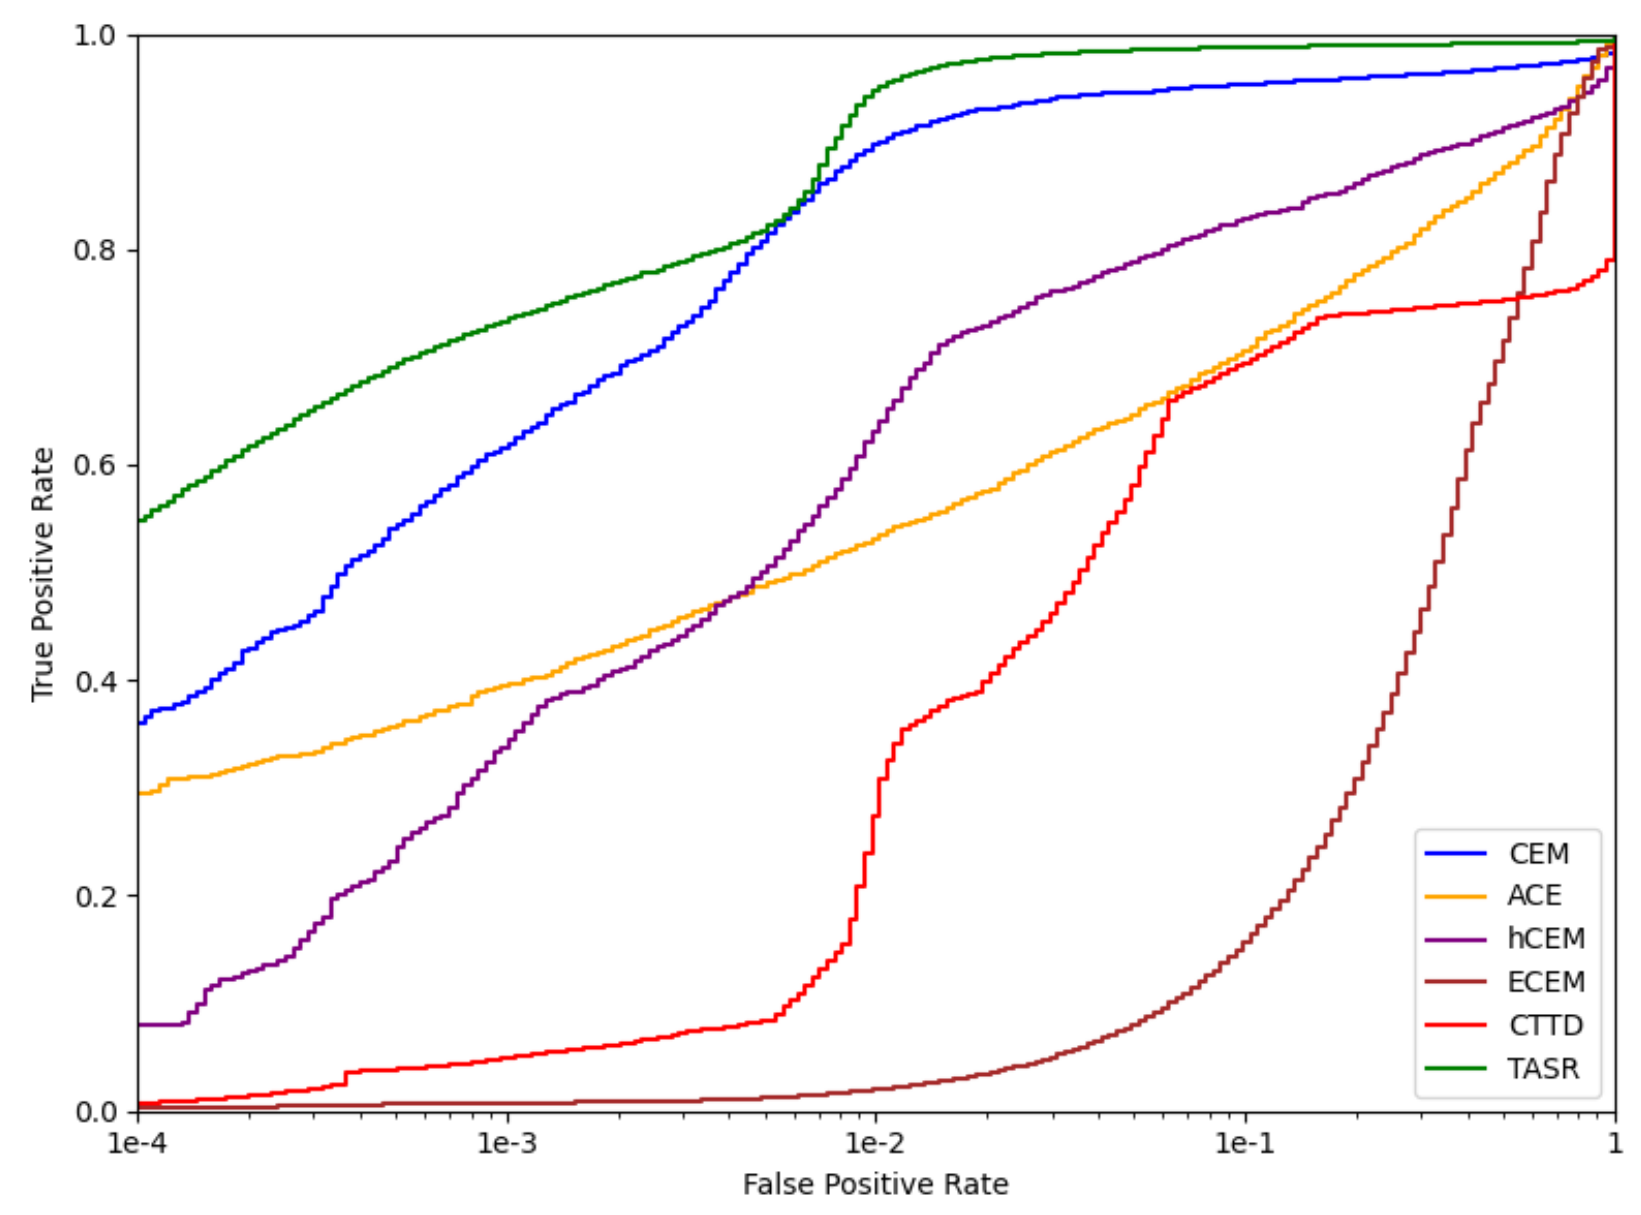
ROC curves comparing the detection performance of all benchmarked methods on the SanDiego dataset.
Figure 4.
ROC curves comparing the detection performance of all benchmarked methods on the SanDiego dataset.
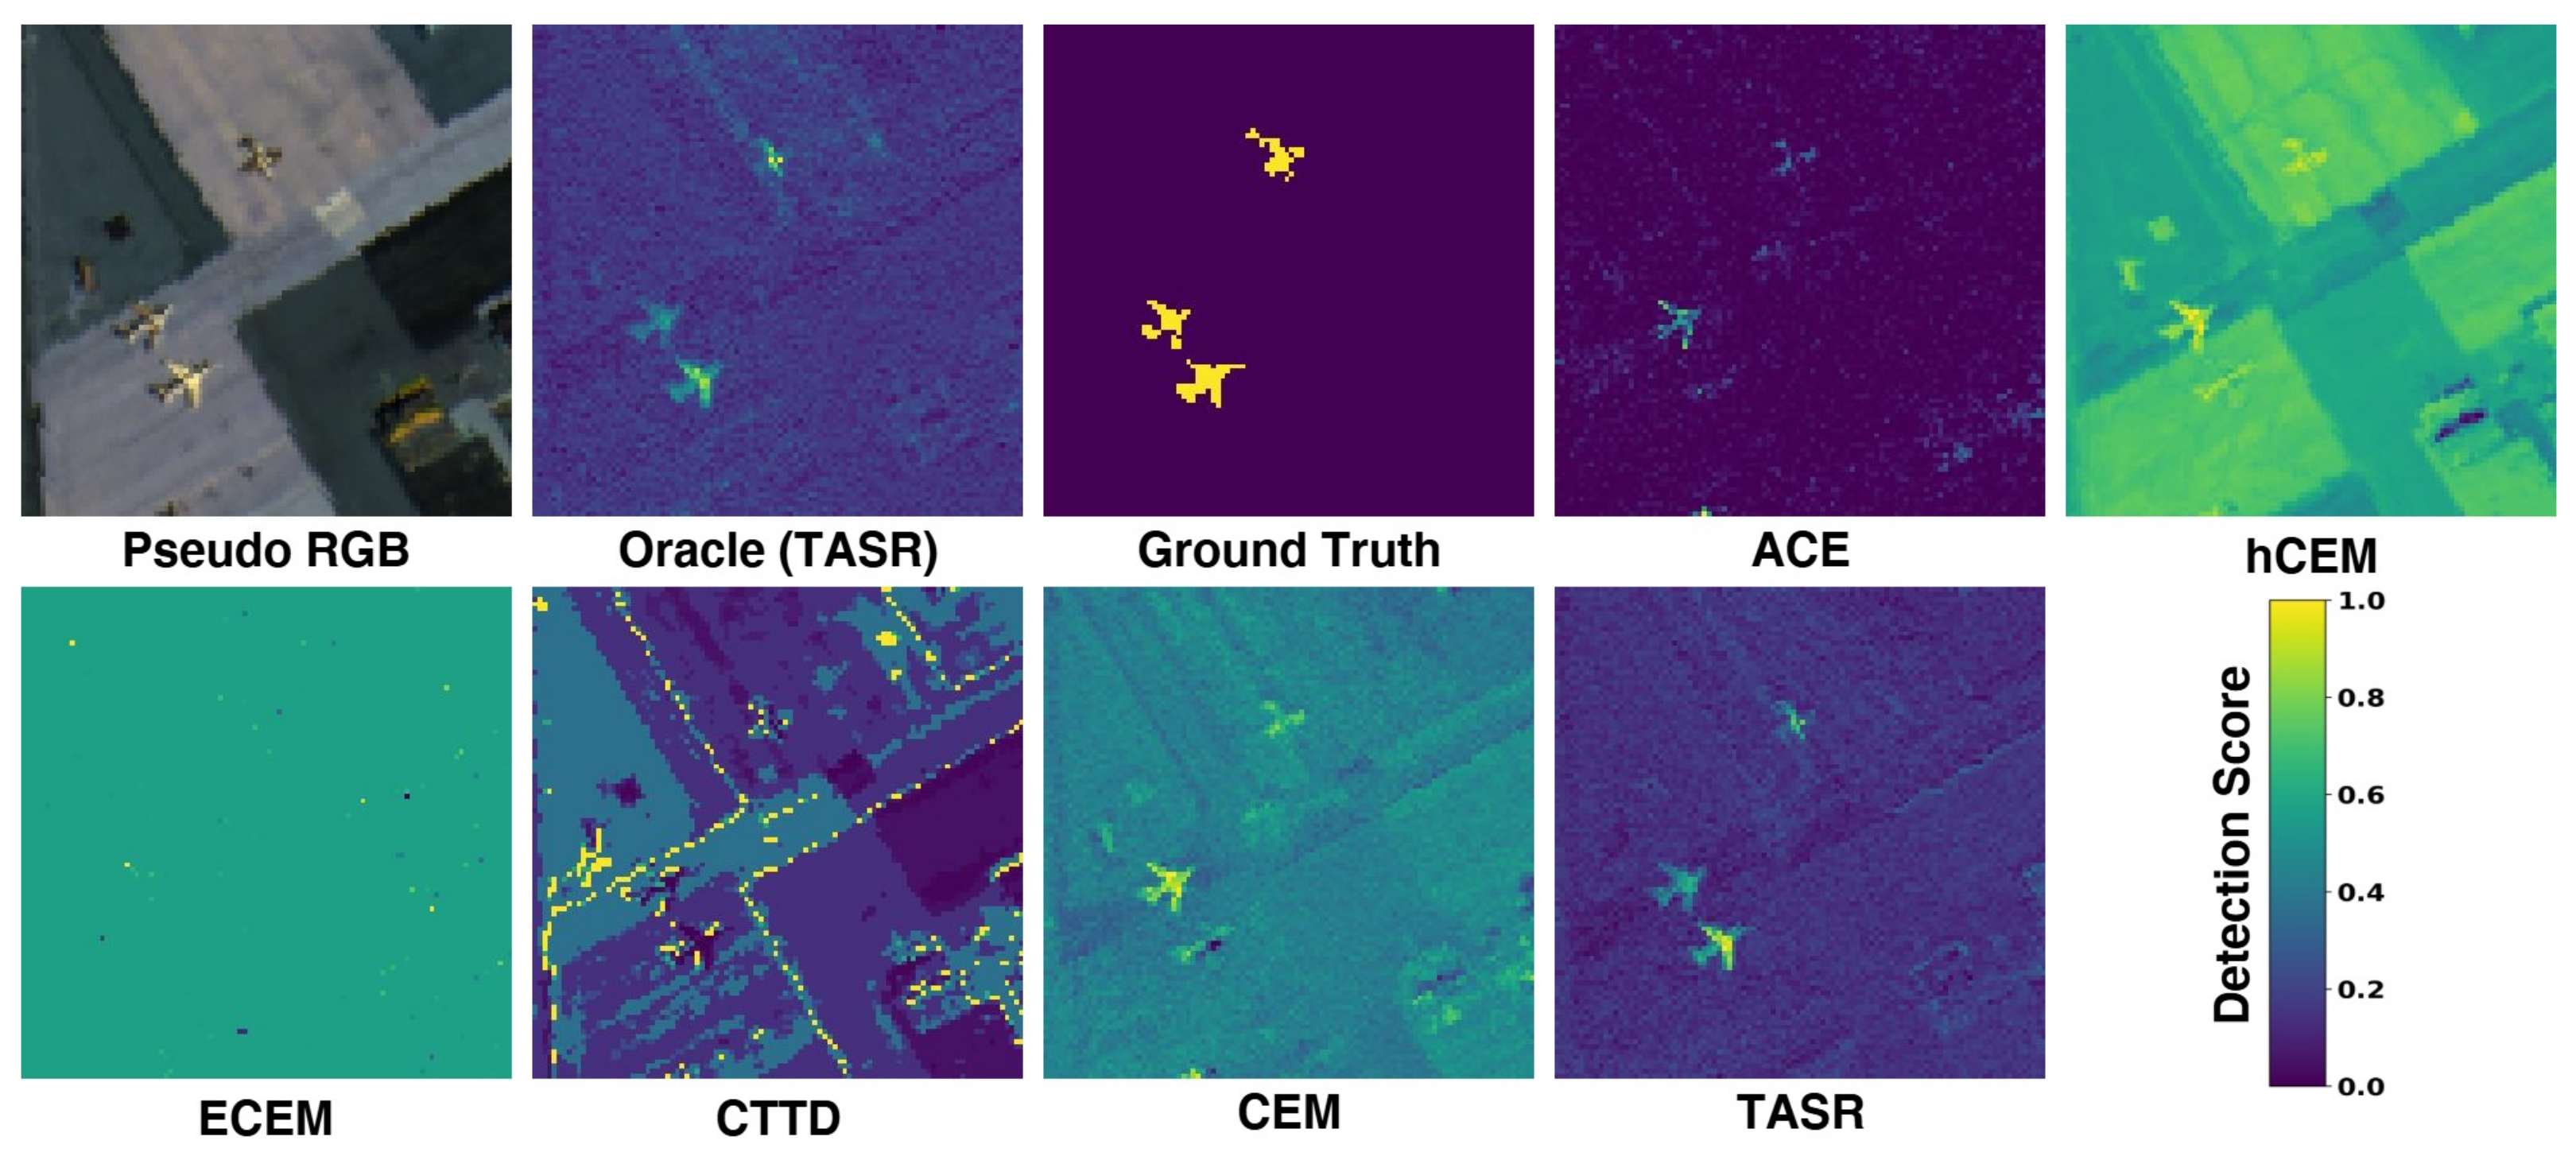
Figure 5.
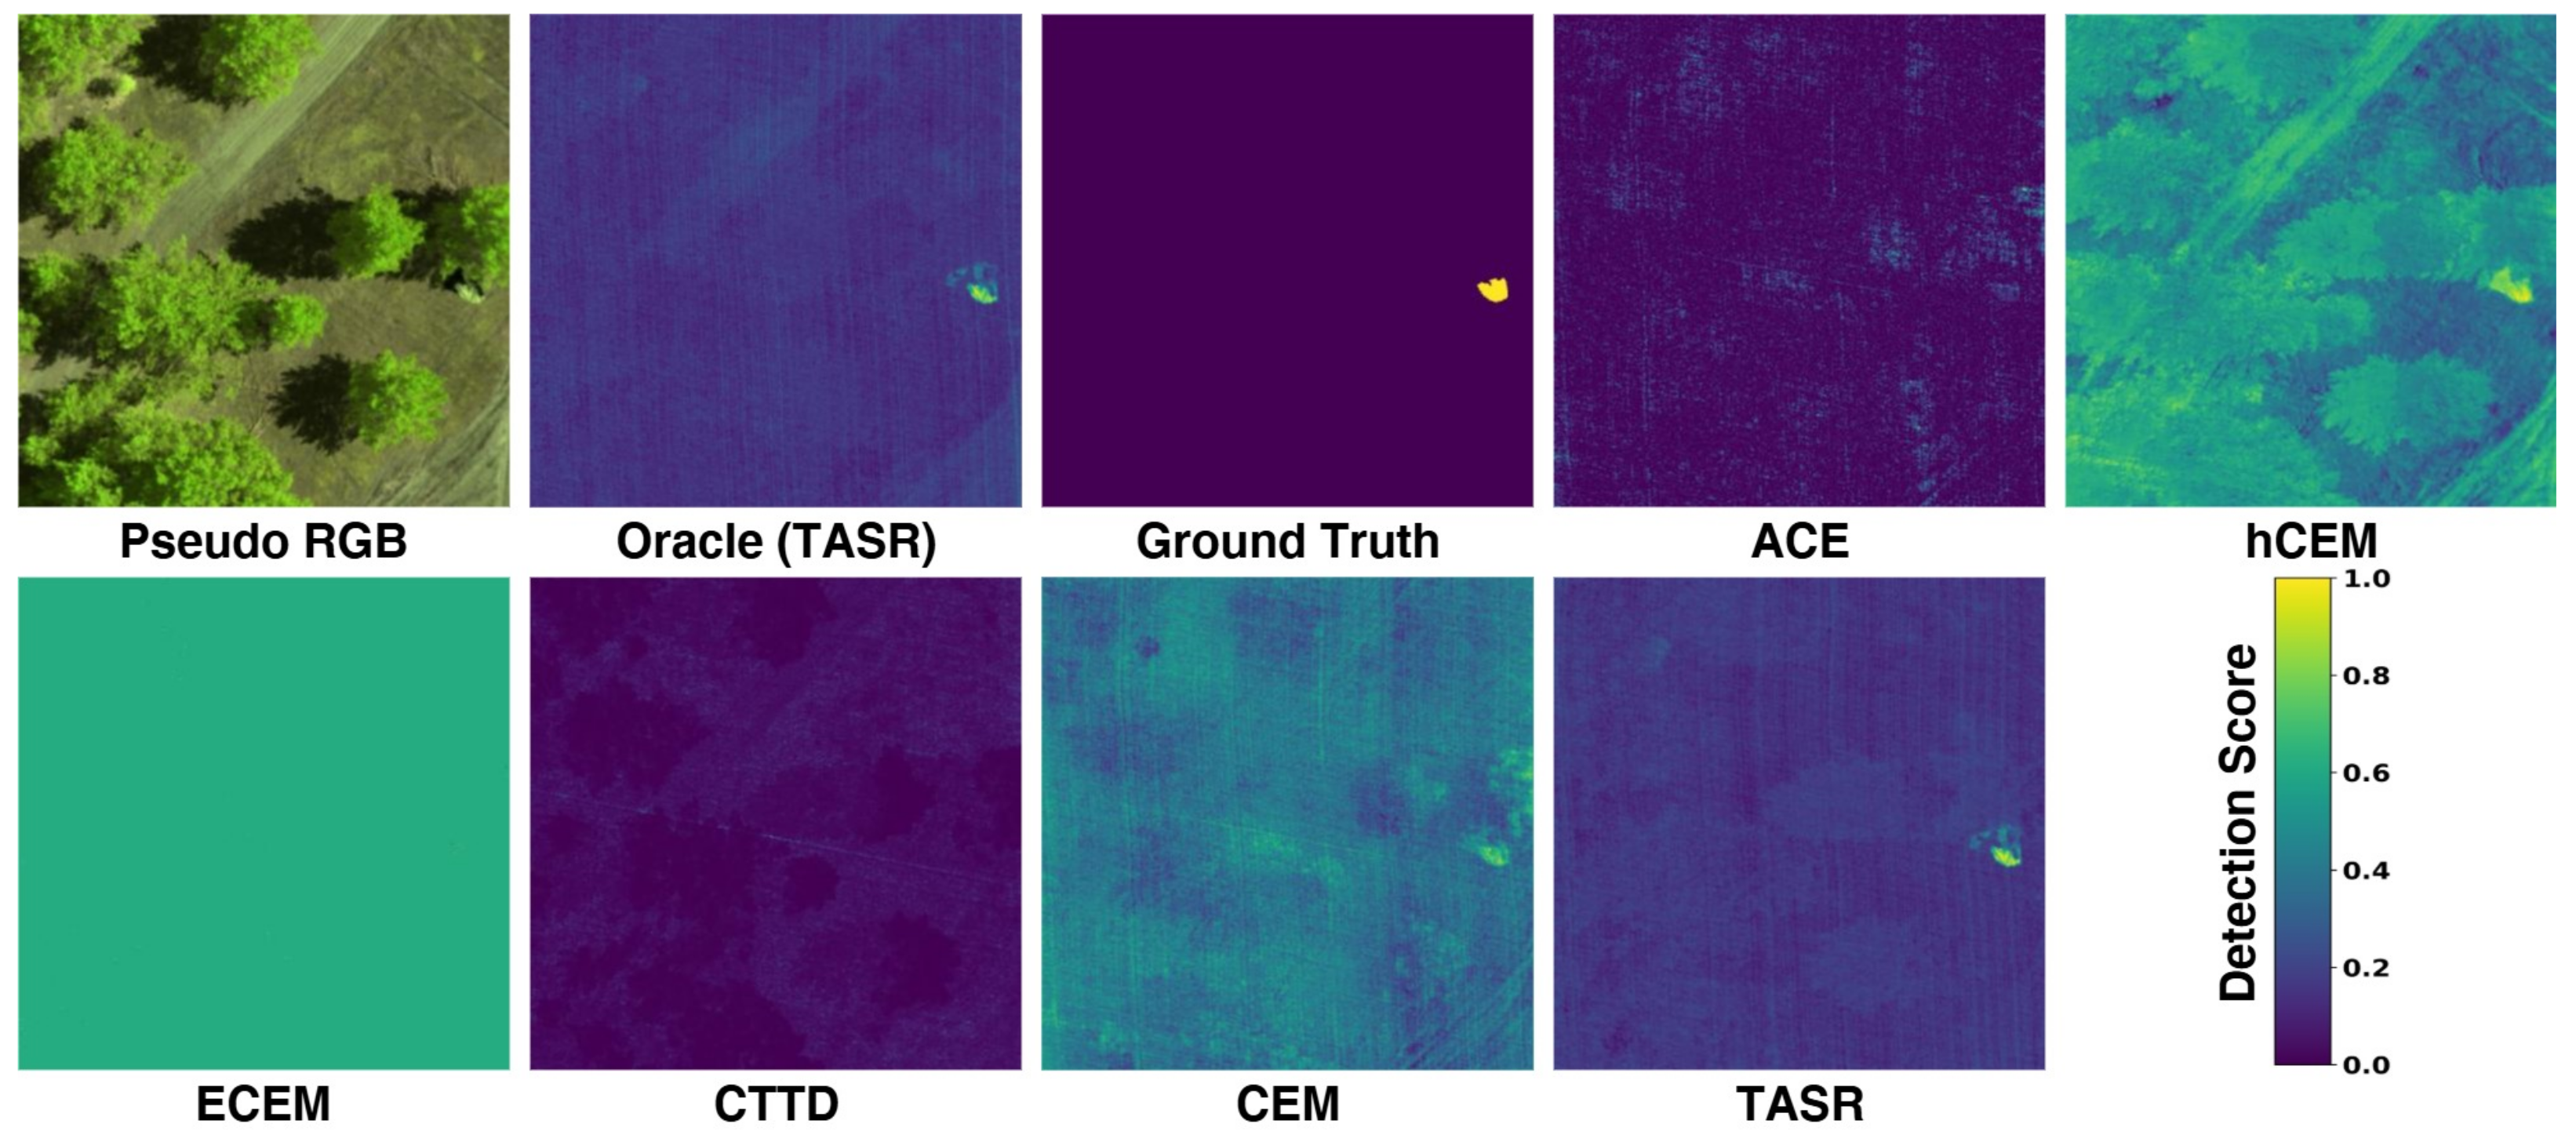
This figure provides a qualitative comparison of all benchmarked detectors on the SanDiego1→SanDiego2 sample.
Figure 5.
This figure provides a qualitative comparison of all benchmarked detectors on the SanDiego1→SanDiego2 sample.
Figure 6.
ROC curves comparing the detection performance of all benchmarked methods on the Camo dataset.
Figure 6.
ROC curves comparing the detection performance of all benchmarked methods on the Camo dataset.
Figure 7.
This figure provides a qualitative comparison of all benchmarked detectors on the Camo1→Camo2 sample.
Figure 7.
This figure provides a qualitative comparison of all benchmarked detectors on the Camo1→Camo2 sample.
Figure 8.
ROC curves comparing the detection performance of all benchmarked methods on the SSD dataset.
Figure 8.
ROC curves comparing the detection performance of all benchmarked methods on the SSD dataset.
Figure 9.
This figure provides a qualitative comparison of all benchmarked detectors on the diffuse→sunny sample.
Figure 9.
This figure provides a qualitative comparison of all benchmarked detectors on the diffuse→sunny sample.
Figure 10.
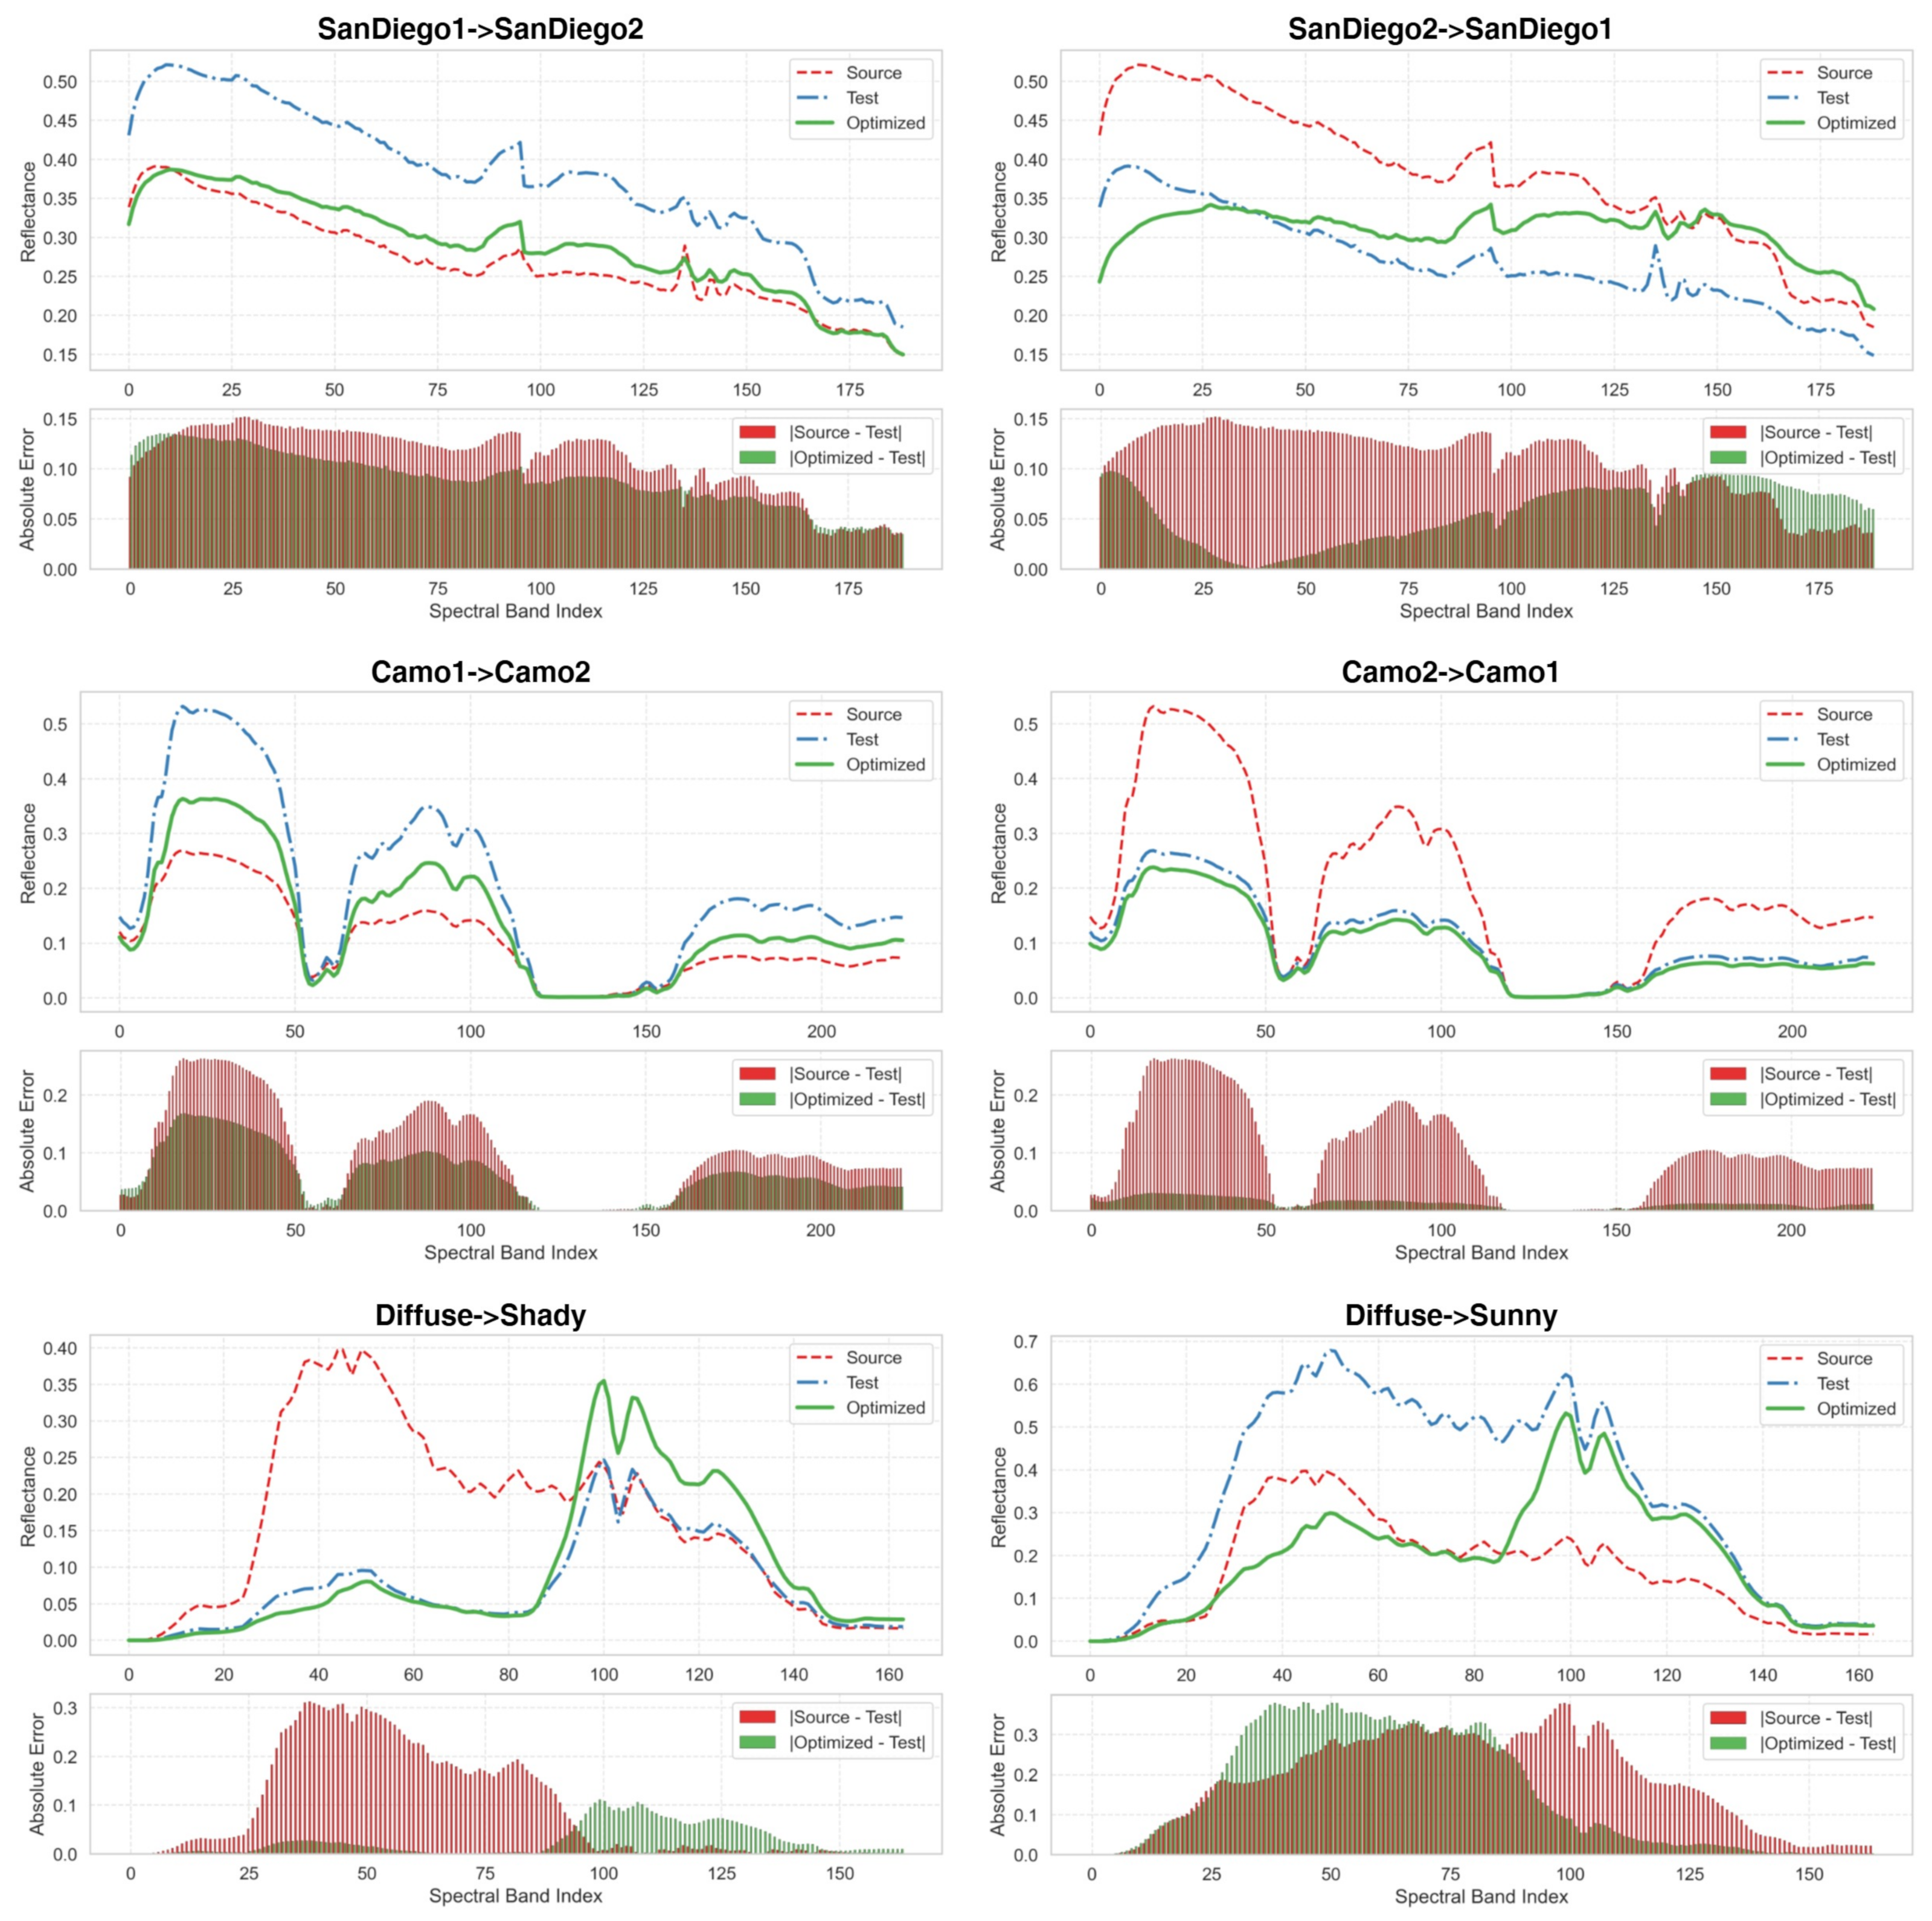
Examples of source, test, and optimized (TASR) spectra across several experimental conditions.
Figure 10.
Examples of source, test, and optimized (TASR) spectra across several experimental conditions.
Figure 11.
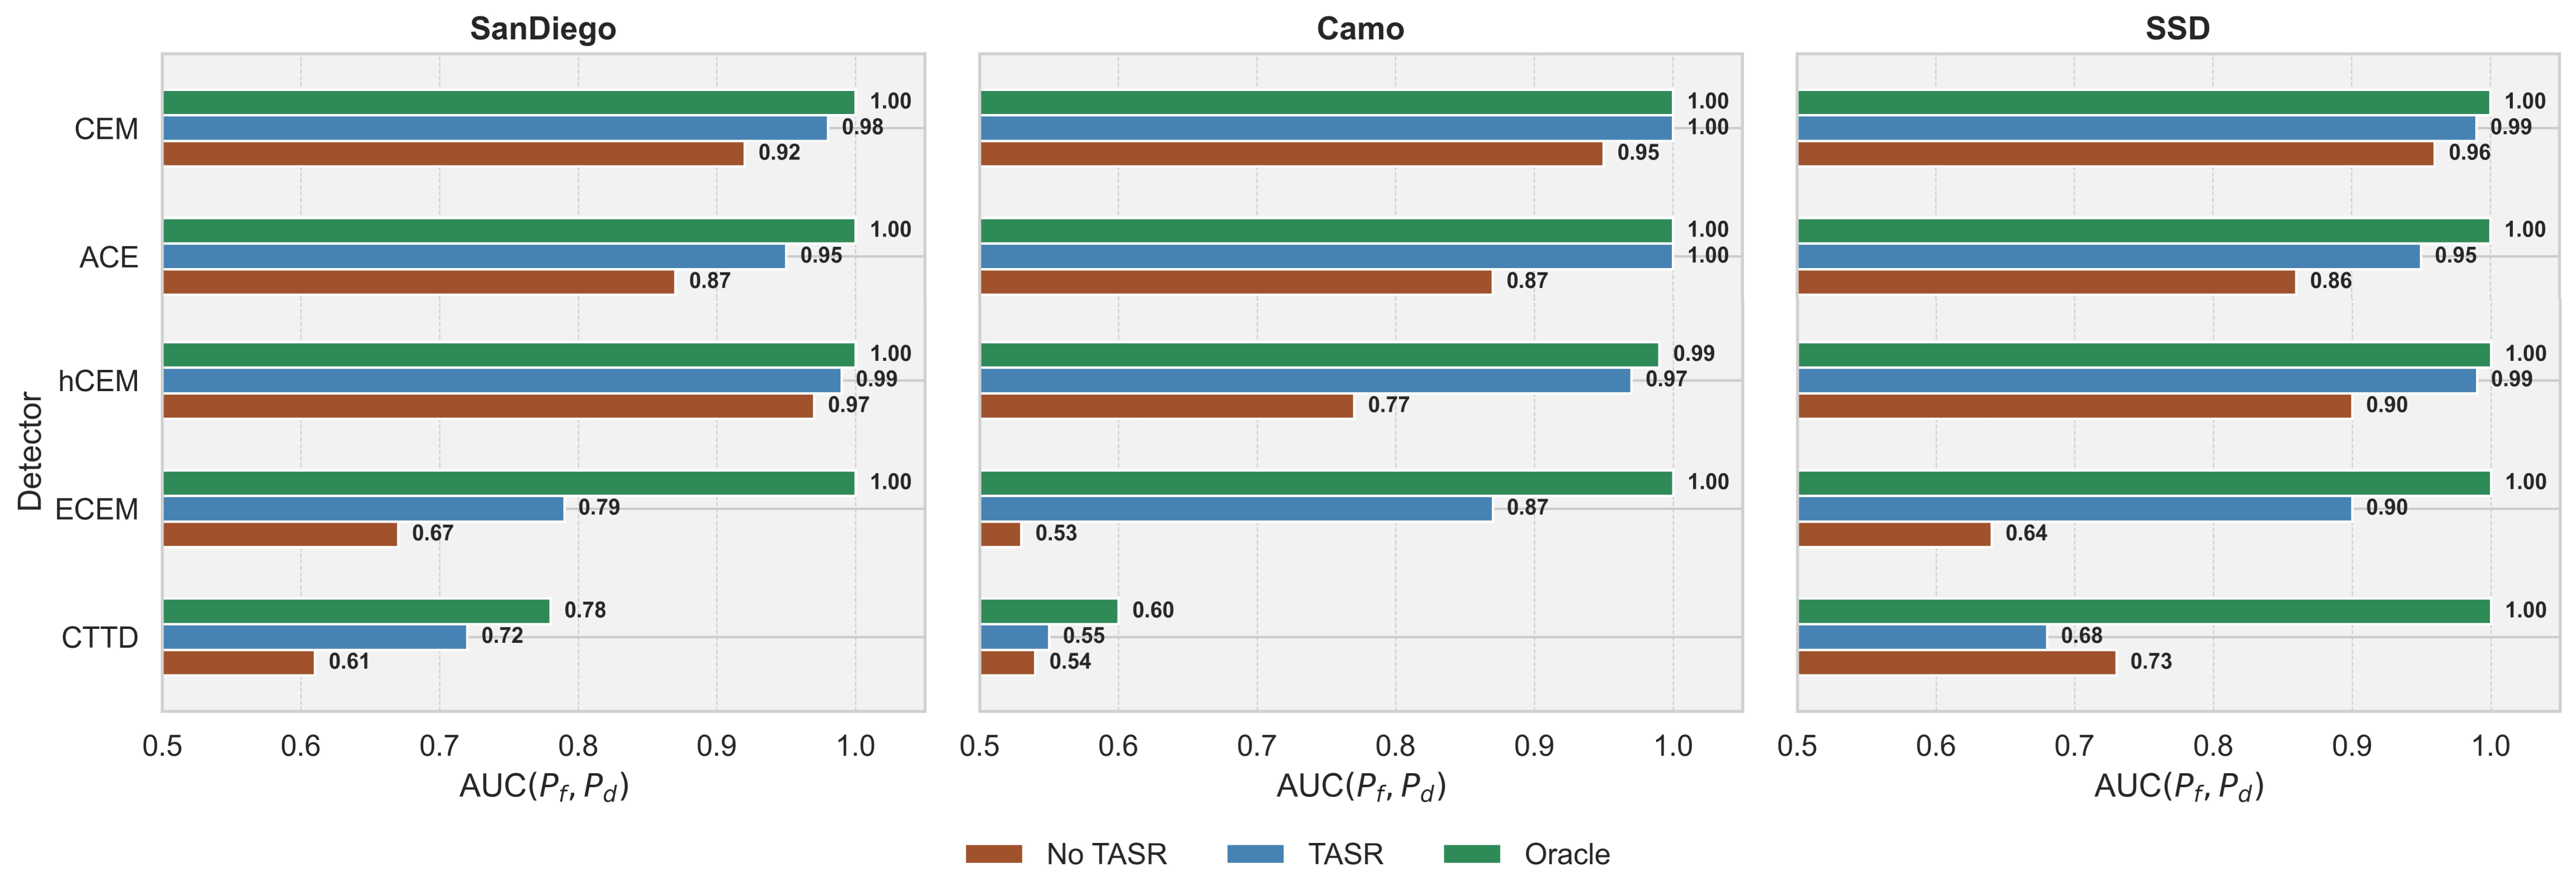
Comparison of AUC() for all detectors with and without test-time adaptive spectrum refinement (TASR). Due to TASR’s stochasticity, we report the mean over 25 runs.
Figure 11.
Comparison of AUC() for all detectors with and without test-time adaptive spectrum refinement (TASR). Due to TASR’s stochasticity, we report the mean over 25 runs.
Figure 12.
Left: Fitness over generations. Right: Test-time downstream AUC() across generations. The strong correlation confirms the effectiveness of optimizing fitness as a proxy for final detector effectiveness.
Figure 12.
Left: Fitness over generations. Right: Test-time downstream AUC() across generations. The strong correlation confirms the effectiveness of optimizing fitness as a proxy for final detector effectiveness.
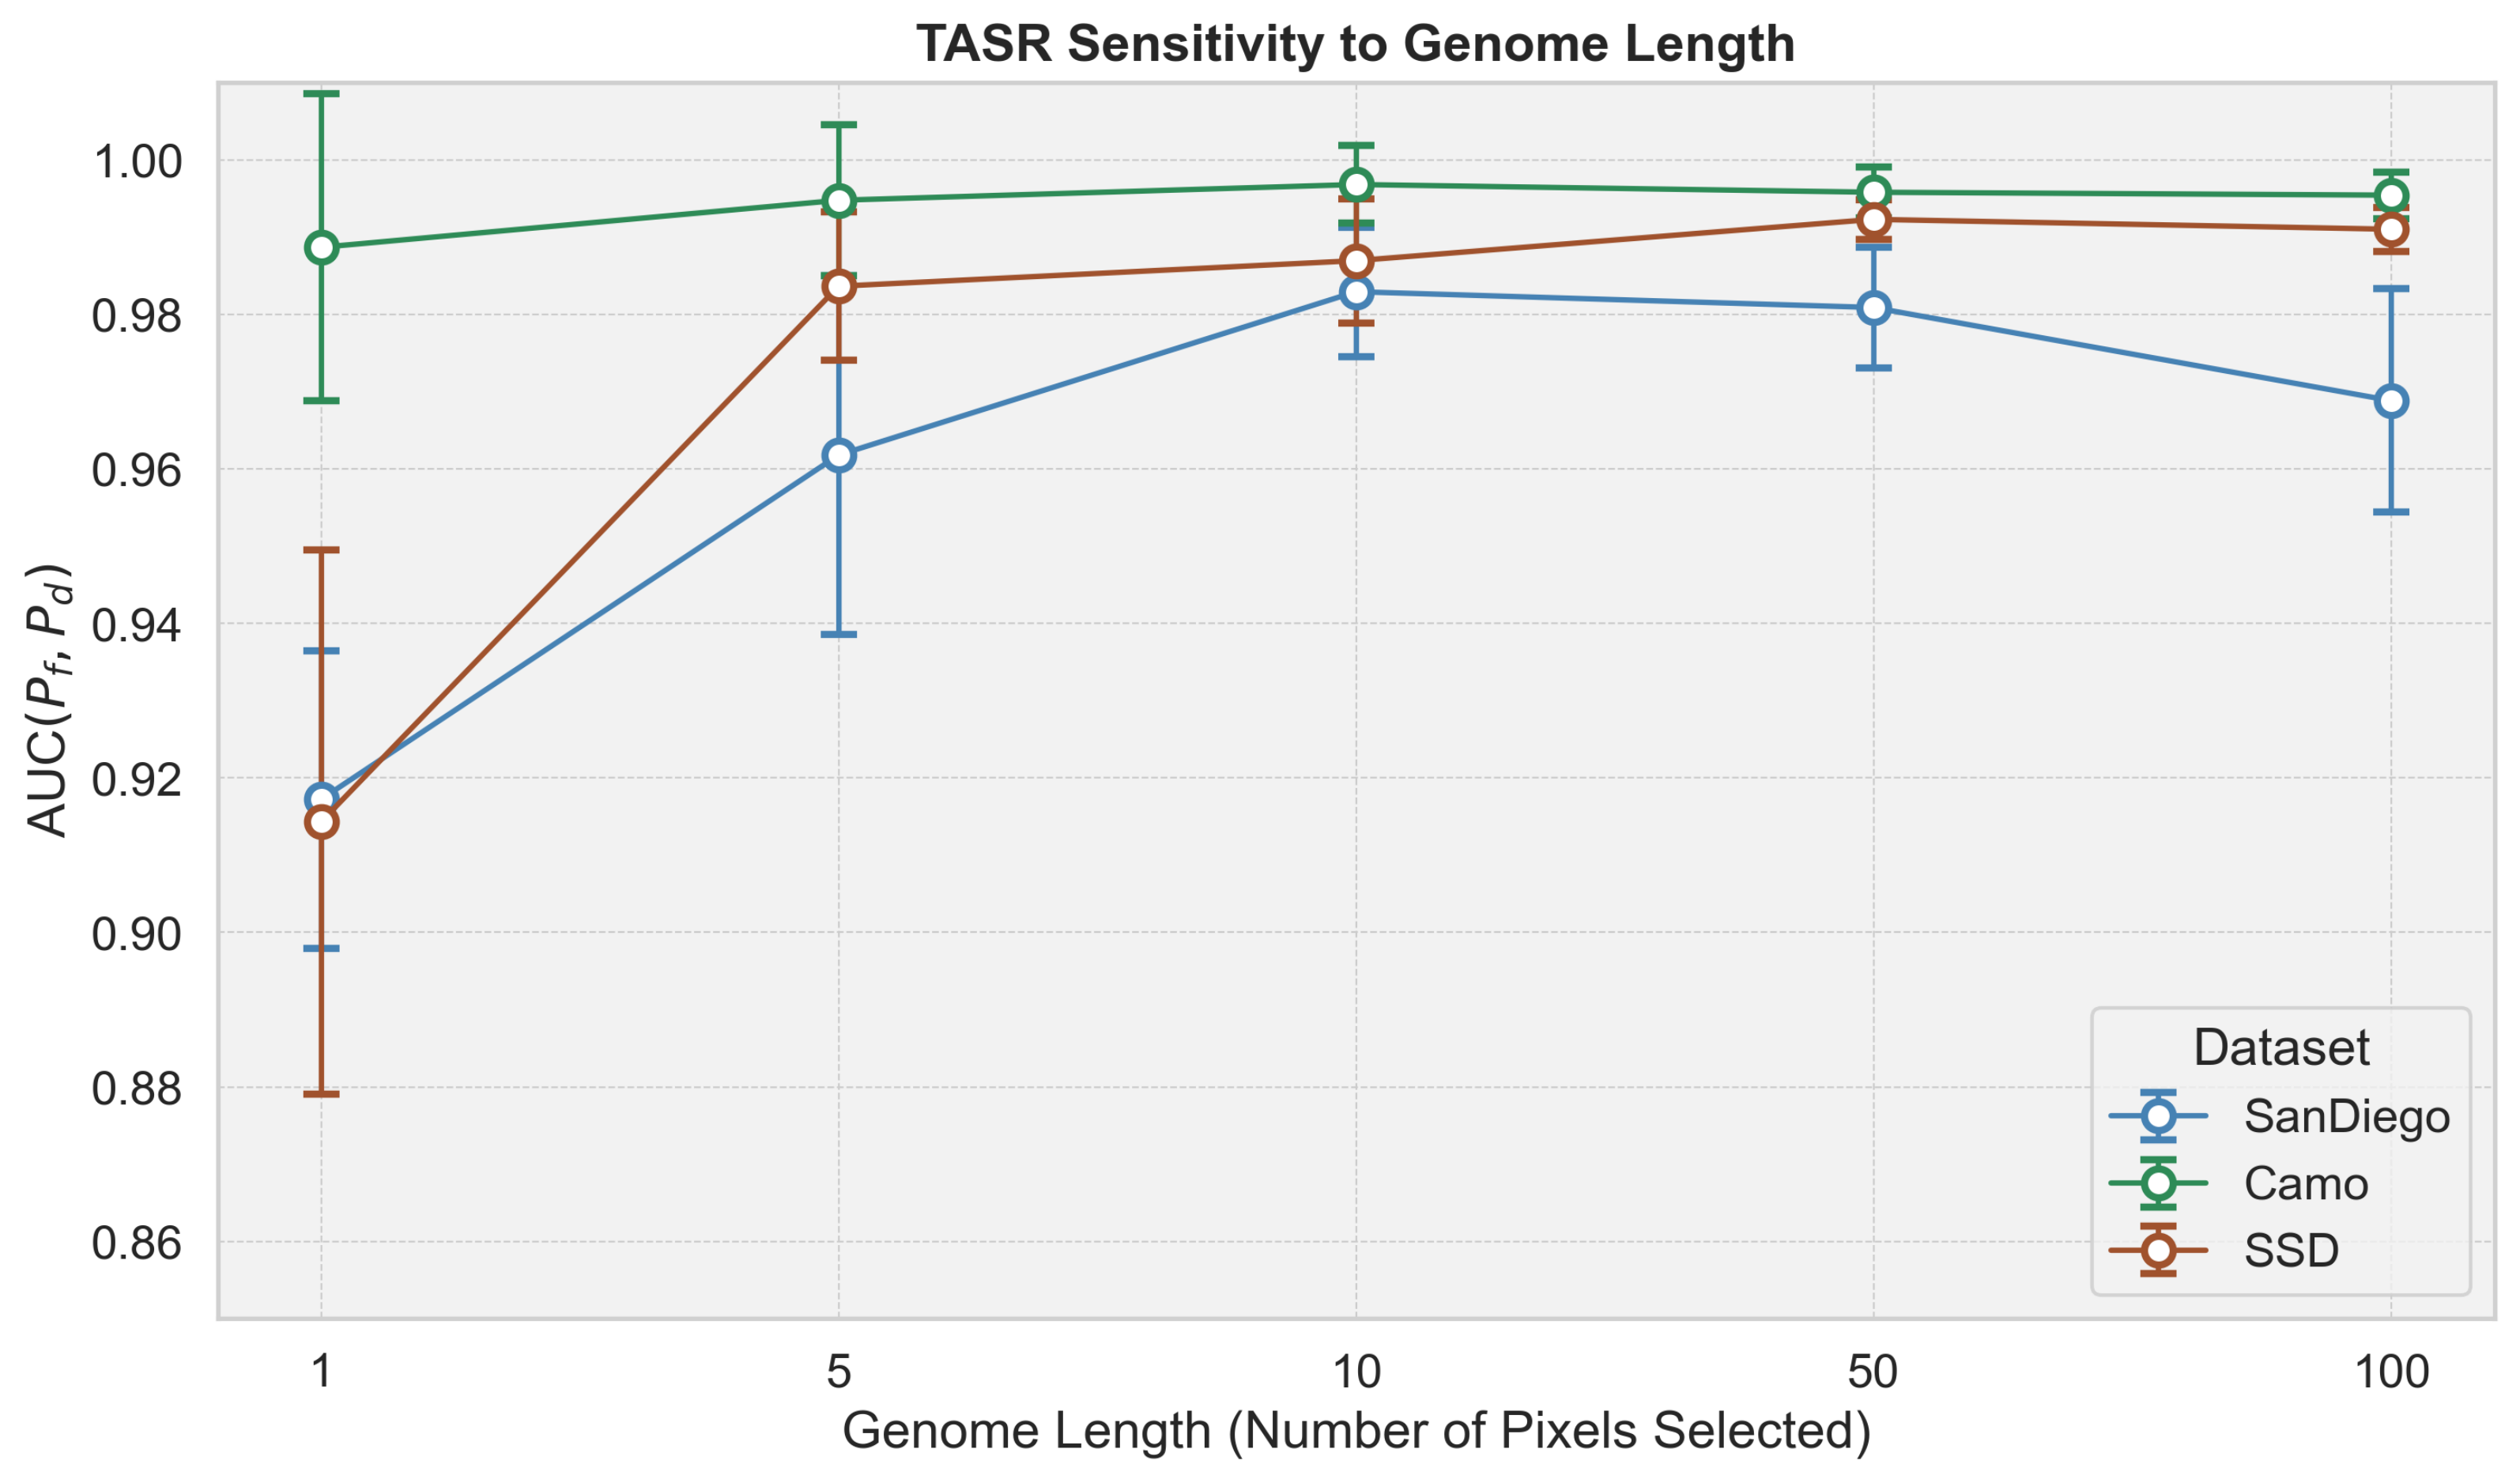
Figure 13.
TASR sensitivity to genome length. A very short genome (e.g., 1) lacks expressive power. Increasing genome length improves detection up to a point, but larger values (e.g., 100) can reduce performance due to the increased optimization complexity. A length of 10 provides a good trade-off between accuracy, efficiency, and interpretability.
Table 1.
Summary of AUC-based performance metrics for hyperspectral target detection. Arrow values () indicate whether higher or lower values are better.
Table 1.
Summary of AUC-based performance metrics for hyperspectral target detection. Arrow values () indicate whether higher or lower values are better.
| | AUC ()↑ | AUC ()↑ | AUC ()↓ | AUCOA↑ | AUCSNPR↑ |
|---|
| Perspective | Effectiveness | Detectability | False Alarm | Overall | Overall |
| Range | [0, 1] | [0, 1] | [0, 1] | [−1, 2] | [0, +∞) |
Table 2.
Benchmarks of hyperspectral target detectors on SanDiego1↔SanDiego2. Arrow values () indicate the change from the respective Oracle, where the Oracle extracts the target spectrum directly from the test scene (i.e., no target spectrum shift). Green indicates performance improvement over the Oracle, while red indicates degradation.
| Method | AUC() ↑ | AUC () ↑ | AUC () ↓ | AUCOA ↑ | AUCSNPR ↑ | Inference Time (s) |
|---|
| Oracle (TASR) | ± 0.002 | ± 0.064 | ± 0.049 | ± 0.038 | ± 0.297 | ± 0.049 |
| CEM [28] | ↓0.079 | ↑0.033 | ↑0.207 | ↓0.253 | ↓2.126 | |
| ACE [5] | ↓0.104 | ↓0.210 | ↑0.015 | ↓0.329 | ↓92.739 | |
| hCEM [10] | ↓0.033 | ↓0.030 | ↓0.024 | ↓0.039 | ↑0.312 | |
| ECEM [9] | ↓0.329 | ↓0.268 | ↑0.536 | ↓1.133 | ↓80.417 | |
| CTTD [8] | ↓0.062 | ↑0.014 | ↑0.070 | ↓0.118 | ↓0.545 | |
| TASR (Ours) | 0.978 ± 0.013 | 0.544 ± 0.051 | 0.237 ± 0.034 | 1.283 ± 0.051 | 2.359 ± 0.301 | 4.225 ± 0.047 |
Table 3.
Benchmarks of hyperspectral target detectors on Camo1↔Camo2. Arrow values () indicate the change from the respective Oracle, where the Oracle extracts the target spectrum directly from the test scene (i.e., no target spectrum shift). Green indicates performance improvement over the Oracle, while red indicates degradation.
| Method | AUC() ↑ | AUC() ↑ | AUC() ↓ | AUCOA ↑ | AUCSNPR ↑ | Inference Time (s) |
|---|
| Oracle (TASR) | ± 0.006 | ± 0.049 | ± 0.009 | ± 0.052 | ± 0.0403 | ± 0.127 |
| CEM [28] | ↓0.045 | ↑0.050 | ↑0.271 | ↓0.266 | ↓3.757 | |
| ACE [5] | ↓0.130 | ↓0.366 | ↑0.037 | ↓0.533 | ↓256.269 | |
| hCEM [10] | ↓0.228 | ↑0.205 | ↑0.365 | ↓0.388 | ↓1.058 | |
| ECEM [9] | ↓0.465 | ↓0.095 | ↑0.465 | ↓1.025 | ↓5.318 | |
| CTTD [8] | ↓0.059 | ↓0.397 | ↓0.287 | ↓0.169 | ↓0.722 | |
| TASR (Ours) | 0.997 ± 0.003 | 0.594 ± 0.063 | 0.131 ± 0.015 | 1.460 ± 0.055 | 4.710 ± 0.332 | ± 0.165 |
Table 4.
Benchmarks of hyperspectral target detectors on ShadySunnyDiffuse. Arrow values () indicate the change from the respective Oracle, where the Oracle extracts the target spectrum directly from the test scene (i.e., no target spectrum shift). Green indicates performance improvement over the Oracle, while red indicates degradation.
| Method | AUC () ↑ | AUC () ↑ | AUC () ↓ | AUCOA ↑ | AUCSNPR ↑ | Inference Time (s) |
|---|
| Oracle (TASR) | ± 0.003 | ± 0.068 | ± 0.043 | ± 0.048 | ± 0.190 | ± 0.063 |
| CEM [28] | ↓0.035 | ↓0.125 | ↑0.134 | ↓0.294 | ↓0.908 | |
| ACE [5] | ↓0.144 | ↓0.249 | ↑0.016 | ↓0.409 | ↓943.088 | |
| hCEM [10] | ↓0.103 | ↓0.043 | ↑0.210 | ↓0.356 | ↓0.777 | |
| ECEM [9] | ↓0.359 | ↓0.233 | ↑0.399 | ↓0.991 | ↓7.733 | |
| CTTD [8] | ↓0.262 | ↓0.332 | ↓0.000 | ↓0.594 | ↓179.280 | |
| TASR (Ours) | 0.987 ± 0.009 | 0.746 ± 0.036 | 0.411 ± 0.025 | 1.322 ± 0.034 | 1.835 ± 0.103 | ± 0.056 |
Table 5.
Spectrum quality improvements across datasets. We report MAE, MSE, and cosine similarity for the source and optimized spectra with respect to the true test spectrum. The final column indicates the relative change (%) from the source to the optimized spectrum; positive values represent improvements and negative values indicate degradation. Arrow values () indicate whether higher or lower values are better.
| Dataset | Metric | Source | Optimized | Relative Change (%) |
|---|
| SanDiego | MAE ↓ | | | |
| MSE ↓ | | | |
| Cos ↑ | | | |
| Camo | MAE ↓ | | | |
| MSE ↓ | | | |
| Cos ↑ | | | |
| SSD | MAE ↓ | | | |
| MSE ↓ | | | |
| Cos ↑ | | | |
Table 6.
Ablation study on TASR with and without separability fitness cross-scene benchmarks. The reported metric is AUC ().
Table 6.
Ablation study on TASR with and without separability fitness cross-scene benchmarks. The reported metric is AUC ().
| Method | Separability | SanDiego | Camo | SSD |
|---|
| TASR | ✓ | 0.965 ± 0.012 | 0.997 ± 0.003 | 0.987 ± 0.009 |
| TASR | x | 0.905 ± 0.025 | 0.996 ± 0.003 | 0.947 ± 0.013 |

