Article

ScaleViM-PDD: Multi-Scale EfficientViM with Physical Decoupling and Dual-Domain Fusion for Remote Sensing Image Dehazing

1
School of Computer Science and Technology, Anhui University of Technology, Ma’anshan 243002, China
2
School of Engineering Research Institute, Anhui University of Technology, Ma’anshan 243002, China
3
College of Computer and Information Science, Southwest University, Chongqing 400715, China
4
College of Automation Engineering, Nanjing University of Aeronautics and Astronautics, Nanjing 211106, China
*
Author to whom correspondence should be addressed.
Remote Sens. 2025, 17(15), 2664; https://doi.org/10.3390/rs17152664 (registering DOI)
Submission received: 27 April 2025 / Revised: 30 July 2025 / Accepted: 30 July 2025 / Published: 1 August 2025

Abstract

Remote sensing images are often degraded by atmospheric haze, which not only reduces image quality but also complicates information extraction, particularly in high-level visual analysis tasks such as object detection and scene classification. State-space models (SSMs) have recently emerged as a powerful paradigm for vision tasks, showing great promise due to their computational efficiency and robust capacity to model global dependencies. However, most existing learning-based dehazing methods lack physical interpretability, leading to weak generalization. Furthermore, they typically rely on spatial features while neglecting crucial frequency domain information, resulting in incomplete feature representation. To address these challenges, we propose ScaleViM-PDD, a novel network that enhances an SSM backbone with two key innovations: a Multi-scale EfficientViM with Physical Decoupling (ScaleViM-P) module and a Dual-Domain Fusion (DD Fusion) module. The ScaleViM-P module synergistically integrates a Physical Decoupling block within a Multi-scale EfficientViM architecture. This design enables the network to mitigate haze interference in a physically grounded manner at each representational scale while simultaneously capturing global contextual information to adaptively handle complex haze distributions. To further address detail loss, the DD Fusion module replaces conventional skip connections by incorporating a novel Frequency Domain Module (FDM) alongside channel and position attention. This allows for a more effective fusion of spatial and frequency features, significantly improving the recovery of fine-grained details, including color and texture information. Extensive experiments on nine publicly available remote sensing datasets demonstrate that ScaleViM-PDD consistently surpasses state-of-the-art baselines in both qualitative and quantitative evaluations, highlighting its strong generalization ability.

1. Introduction

Enhancing the visibility of remote sensing imagery through dehazing is critical for accurate environmental monitoring and timely disaster response. However, turbid atmospheric substances—such as haze, clouds, and rain—often degrade image quality, leading to reduced scene clarity. This image degradation not only affects visual perception but also hinders high-level analysis tasks, such as object detection and scene classification. Traditional dehazing techniques typically rely on physical models or empirical assumptions [1,2,3,4]. Among them, the widely used atmospheric scattering model (ASM) is formulated as follows:
I ( x ) = J ( x ) t ( x ) + A ( 1 t ( x ) )
where x denotes the pixel location. I ( x ) is the observed intensity in the hazy image, while J ( x ) is the scene radiance under clear conditions. A represents the global atmospheric light, and t ( x ) is the transmission map, quantifying the proportion of light that reaches the sensor. This model serves as the foundation for many traditional dehazing algorithms. While effective in certain scenarios, prior-based methods often lack adaptability to diverse scenes, frequently resulting in over-enhanced contrast or visual artifacts such as halos and color distortions. Consequently, they are insufficient for handling the complexity and variability inherent in dynamic haze environments.
In recent years, remote sensing image dehazing technology has made significant progress with deep learning techniques, especially the use of convolutional neural networks (CNNs) [5,6,7] and Transformer-based models [8,9,10,11,12,13,14,15,16,17]. CNNs can automatically extract local features, while Transformers improve performance by effectively modeling long-range dependencies between image regions. Unlike CNNs (which have limitations in capturing these dependencies) and Transformers (which are computationally intensive due to their complexity), Mamba [18] is a state-space model (SSM)-based architecture that has garnered significant attention for its efficacy in modeling long-range dependencies and capturing global contextual information. Efficient Vision Mamba [19] (EfficientViM) is one of the best models based on the Hidden State Mixer–State Space Dual (HSM-SSD) architecture, which improves on the State Space Dual (SSD) by effectively capturing global dependencies while achieving high performance at a lower computational cost. Given these advantages, EfficientViM presents a highly promising architecture to serve as a baseline for our work. However, as a general-purpose vision backbone network, directly applying it to the ill-posed dehazing problem is often suboptimal, as it lacks domain-specific mechanisms to explicitly handle the physical degradation process. This motivates us to explore how to adapt and enhance this powerful architecture for remote sensing dehazing task.
Meanwhile, most of these learning-based methods are end-to-end neural networks, independent of the atmospheric scattering model, but some researchers are currently combining physical models with neural networks for remote sensing dehazing. AU-Net [20] is a notable recent work that adopts a two-stage architecture based on physical principles. First, it estimates the atmospheric scattering and transmission maps to generate a rough dehazed image; then, it is refined using an asymmetric U-Net in the second stage. However, this method uses a physical model to preprocess the image in the first stage, and applies a single A value and a smooth T map to a large scene, which produces inconsistent restoration effects in areas of different depths and details, resulting in poor generalization, and cannot solve the entanglement problem with residual physical artifacts in the multi-scale information feature extraction stage in restoring remote sensing fog images.
To address the challenge of capturing multi-scale global features while maintaining physical interpretability, we propose the Multi-scale Efficient ViM with Physical Decoupling Block (ScaleViM-P). This module integrates three key designs into a unified block: it employs a physical module to decouple haze effects at each feature scale, utilizes multiple convolution kernels of varying sizes to extract rich spatial features, and leverages EfficientViM as its core to effectively capture global context and integrate this information.
Traditional skip connections usually only perform simple feature concatenation or addition, which has limited ability to restore high-frequency details and color fidelity that are severely damaged by fog. We observe that the contents of clear and degraded images can be effectively separated by exchanging spectrum and phase through the Fourier transform, which suggests that feature information may be more easily distinguished and restored in the frequency domain. On this basis, we design a Frequency Domain Module (FDM) and combine it with channel and position attention mechanisms to form a dual domain fusion (DD Fusion) module. This module replaces the traditional skip connection, solves the information loss problem usually generated during feature bridging, and improves the retention rate of details.
In summary, this paper presents an innovative Multi-scale EfficientViM network with Physical Decoupling and Dual-Domain Fusion (ScaleViM-PDD). First, a physical module is employed to estimate A and T, decouple haze effects, and perform preliminary dehazing based on the atmospheric scattering model, thereby simplifying the feature space. Then, ScaleViM is used to capture global contextual dependencies across scales. Finally, to recover subtle visual details—especially color—we propose a frequency-aware FDM block, combined with attention mechanisms, to construct the DD Fusion module. This module effectively replaces conventional skip connections and enables deeper integration of spatial and frequency information.
In summary, this paper offers the following key contributions:
  • We propose an innovative remote sensing dehazing network ScaleViM-PDD, which integrates state-space models, physical modules, and frequency domain representation, achieving SOTA performance compared with existing methods.
  • We design the ScaleViM-P module, a novel multi-scale state-space module with physical interpretability. We further improve the performance by combining physical structure priors with the optimized Multi-scale EfficientViM. We show strong generalization capabilities across different remote sensing datasets.
  • We designed the DD Fusion module to go beyond traditional image restoration by emphasizing frequency domain features and enabling more effective integration of spatial and frequency representations for enhanced remote sensing haze removal.
Results indicate that our method outperforms current techniques, ScaleViM-PDD performs well in multiple remote sensing image dehazing tasks, and achieves satisfactory visualization effects in multiple complex scenes, such as military, construction, and farmland, which have obvious advantages and provide a more effective solution for practical applications. Code is available at https://github.com/Aaronwangz/ScaleViM-PDD (accessed on 10 July 2025).

2. Related Works

2.1. Remote Sensing Dehazing

Dehazing remote sensing images remains a persistent challenge in computer vision and image processing. Over the years, a variety of methods have been proposed to tackle this problem, which are broadly divided into two categories: physical model-based and learning-based approaches. The former mainly depends on manually designed priors and atmospheric scattering models, such as the dark channel prior and color attenuation prior [2,21]. However, these priors are derived from empirical observations and often fail to accurately model the haze formation process, particularly under complex or spatially varying haze conditions. With the advancement of deep learning, researchers have begun integrating physical models with neural networks to learn the estimation of transmission maps T and atmospheric light A in a data-driven manner [15]. A notable example is DehazeNet [4], which was among the first to employ CNNs for predicting the transmission map, subsequently applying the atmospheric scattering model to recover the dehazed image, achieving state-of-the-art performance at its time. AOD-Net [3] redefines the atmospheric scattering model so that the network only needs to estimate one parameter to generate the dehazed image. The authors of GriDehazeNet [6] argued that estimating t will fall into a suboptimal solution, and it is better to directly learn to restore the image. FFANet [7] introduces a feature attention module, combining the attention mechanism with multi-level features to achieve high-quality dehazing. Li et al. [22] proposed a coarse-to-fine two-stage dehazing structure. The first stage obtains a rough estimate of the fog image, and the second stage performs fine restoration. The overall structure is an encoder–decoder architecture. Similarly, AU-Net [20] also adopts a two-stage architecture based on physical principles. First, it estimates the atmospheric scattered light and transmittance map to generate a coarse dehazed image, which is then refined using an asymmetric U-Net in the second stage. MixDehazeNet [23] is a hybrid structure module that combines convolutional layers and attention mechanisms to improve the local and global feature modeling capabilities of image dehazing. MMDP-Net [24] is specially designed for remote sensing images. It introduces multi-dimensional (such as space, channel) and multi-scale (detail and global) feature processing, and combines the atmospheric scattering model for physical modeling.
Recently, the Vision Transformer architecture has shown remarkable potential in the field of image restoration with its excellent global dependency modeling capabilities, and has emerged as a mainstream approach of learning-based methods. DeHamer [8] applied Transformer to image dehazing, effectively combining the local representation capabilities of CNN and the global modeling capabilities of Transformer. DehazeFormer [10] achieved notable improvements in dehazing quality through advancements in normalization techniques, activation functions, and the design of spatial information aggregation modules. Restormer [25] proposed a multi-scale local-global representation learning that does not require the image to be decomposed into local windows and can still efficiently process high-resolution images. Trinity-Net [9] introduced dark channel priors in Swin Transformer to guide gradients and reasonably estimate hazy parameters.
Despite their success, these methods primarily focus on spatial feature learning, often overlooking valuable frequency domain information. This oversight can limit their ability to fully restore high-frequency details and accurate color fidelity. Therefore, a key challenge remains in how to effectively integrate both spatial and frequency representations for more comprehensive dehazing.

2.2. Mamba Dehazing

A significant disadvantage of the Transformer architecture is its high computational complexity. In contrast, Mamba [18] can achieve sequence modeling with linear complexity, and its long-range dependency modeling capability is not inferior to that of the Transformer. Mamba [18] has shown excellent performance in tasks such as image, video, and medical image segmentation [26,27,28,29], and its application to image restoration has yielded equally promising outcomes. MambaIR [30] uses multi-directional scanning to overcome the causal scanning of its architecture, and has achieved excellent results in tasks including image super-resolution and denoising. RSDehamba [31] integrates the selective state space model into the Unet architecture, effectively improving the dehazing effect. The effectiveness of Mamba in image dehazing has been highlighted by UVM-Net [32], which adopts a streamlined architecture. Meanwhile, UDAVM-Net [33] employs a U-shaped design with dual-attention and multi-path scanning strategies to enhance feature extraction while minimizing redundancy. While these Mamba-based methods are promising, they tend to employ the architecture as a generic ’black-box’ backbone, lacking specific adaptations for the physical nature of haze and the multi-scale complexity of remote sensing images. This can lead to suboptimal results, like color distortion or inconsistent dehazing. This highlights the need for a Mamba architecture that is specifically enhanced with physical awareness and multi-scale adaptability.

2.3. Frequency Domain Dehazing

In recent years, more and more studies have begun to focus on frequency-domain information to find effective spectral features. In addition to processing images in the spatial domain, researchers have also begun to introduce frequency-domain information through wavelet transforms or Fourier transforms to strengthen the ability of the network to capture and represent features [34,35,36,37]. Fourmer [38] introduced Fourier transform as prior information into spatial modeling, providing a new way for global modeling. DWT-FFC [39] proposed a novel dual-branch network, which obtains prior knowledge through a pre-trained model, and uses two-dimensional wavelet transform and fast Fourier convolution to obtain more high-frequency features and a larger receptive field. The multi-branch full-core module proposed by OK-Net [40] effectively combines local, global, and frequency domain information through different branches to obtain a better dehazing effect. EENet [41] uses a dual-branch network to interactively learn spatial domain and frequency domain information, thereby effectively improving the dehazing effect. AdaIR [42] is a general image restoration framework, the core of which is frequency mining and modulation. This method uses the inconsistency of low-frequency and high-frequency information in the frequency domain to perform feature modeling for tasks such as dehazing and has strong adaptability. Although powerful for detail recovery, these frequency-domain methods often operate from a pure signal processing perspective, neglecting the physical principles of the atmospheric scattering model (ASM). This lack of physical grounding can limit their interpretability and generalization to diverse real-world haze conditions. Thus, a significant opportunity lies in synergizing the detail-recovery strengths of frequency-domain processing with the robustness offered by a physical model.

3. Method

First, we briefly review EfficientViM [19], the core of which is to effectively capture global dependencies through the HSM-SSD layer. Figure 1b describes the main framework of EfficientViM [19], and Figure 1a is the pseudo code of the HSM-SSD layer with a single head design. HSM-SSD uses a shared global hidden state h to perform channel mixing (including gating and output projection), which is the fourth step of Figure 1a, operating on the reduced potential array h, thus lowering computational cost while enhancing overall model performance.
Our proposed ScaleViM-PDD network architecture is based on EfficientViM [19] and makes targeted improvements to the inherent limitations of the original model in image dehazing applications. Specifically, we aim to address three key issues: (1) the model lacks physical interpretability, resulting in incomplete dehazing; (2) its standard single-scale processing is insufficient to cope with the complex multi-scale characteristics of remote sensing scenes; (3) only processing spatial domain information leads to the loss of frequency domain details. Below, I will introduce the overall architecture of the model ScaleVIM-PDD, as shown in 
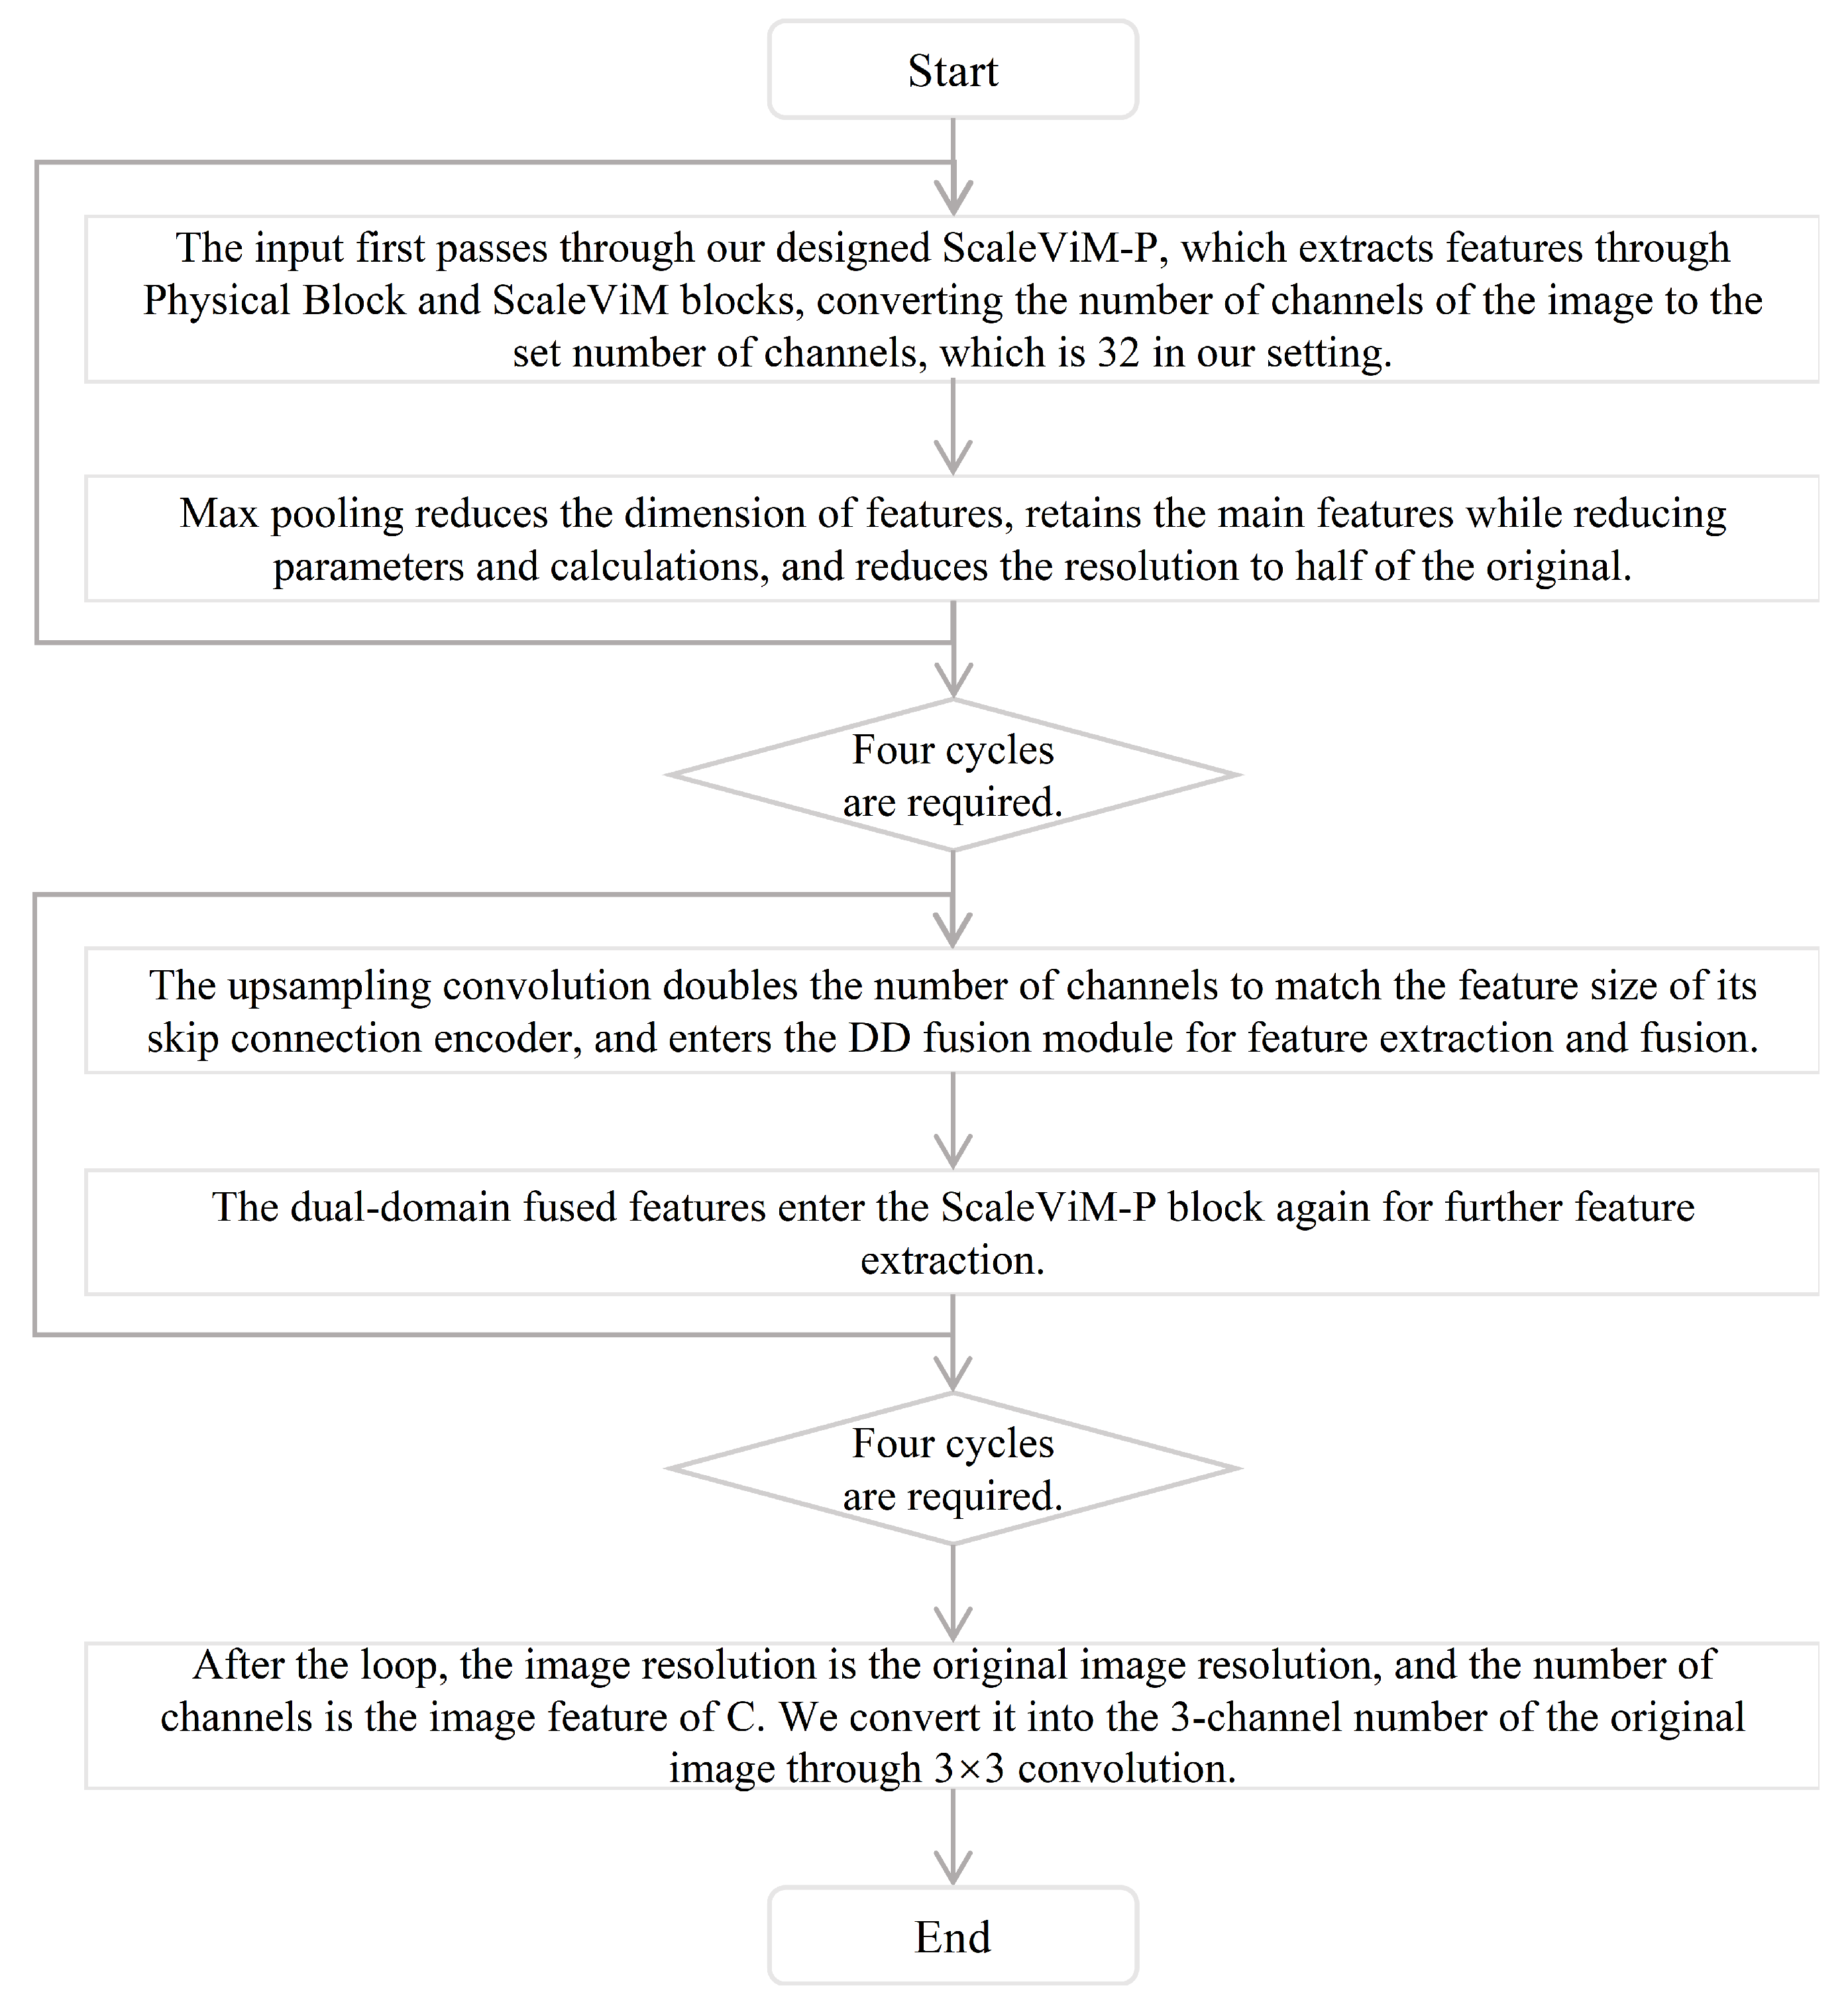
Figure 2. The overall framework is an encoder–decoder structure obtained through four layers of upsampling, four layers of downsampling, and four layers of fusion. Each sampling block is composed of a basic ScaleViM-P, and the fusion layer is composed of DD Fusion. We will introduce these two modules in detail below. In addition, we supplement our algorithm flow chart, as shown in Figure 3, to better understand the process of the proposed model from input to output.

3.1. Multi-Scale EfficientViM with Physical Decoupling Block

The exploration of state-space model (SSM) architectures for remote sensing dehazing is still limited. While the recently proposed EfficientViM is highly promising due to its efficiency; our preliminary experiments revealed two interconnected challenges when applying it directly. First, as a deep learning model, it lacks physical awareness of the haze formation process, often leading to color distortion and artifacts. Second, this problem is exacerbated by the multi-scale complexity of remote sensing images; a model that cannot fundamentally distinguish haze from scene content will struggle even more to process features correctly across different scales and resolutions.
Therefore, a simple combination approach—like adding a multi-scale design to a deep learning model, or pre-processing with a physical model before feeding into a single-scale network—is insufficient. A truly effective solution demands a module that is simultaneously multi-scale and physically-aware. This is the core motivation for our ScaleViM-P module. It does not just combine these two concepts; it deeply integrates physical Decoupling within the multi-scale feature extraction process at each stage, allowing the network to progressively refine features by removing haze-like components at each level of abstraction.

3.1.1. Multi-Scale EfficientViM

To specifically address the challenge of handling features at varying scales—a key limitation we identified in remote sensing dehazing—we developed a multi-scale front-end for the EfficientViM block. Our Multi-scale EfficientViM module is based on the EfficientViM [19] architecture and inspired by the famous Inception model [43]. Specifically, we divide the input image into four branches, each of which is processed using convolution kernels of different scales to extract multi-scale structural feature maps (including 1 × 1, 3 × 3, and 5 × 5 convolution kernels), as well as contour information extracted by the Max-Pooling layer.
Among these operations, the 1 × 1 convolution transforms the channel dimension while preserving spatial resolution, thereby reducing computational complexity, whereas LeakyReLU provides non-linear activation to increase the expressiveness of the network. This combination can effectively extract features at different scales while maintaining the efficiency and non-linear expressiveness of the network. By concatenating the output matrices from different convolution layers along the depth dimension, we obtain a deeper feature matrix that fully captures the multi-level and multi-scale information of the image.
Finally, we adjust the number of channels through a layer of 1 × 1 convolution and pass this feature information to the EfficientViM module for processing. Through an efficient global receptive field, effective information integration is ultimately achieved, providing richer feature representations for subsequent tasks.

3.1.2. Physical Decoupling Block

To tackle the problem of physical unawareness and improve model interpretability, we designed the Physical Decoupling (PD) block. Inspired by C2PNet [44], we constructed a Physical Decoupling(PD) block based on the atmospheric scattering model. It is derived from the physical model of Equation (1). We represent the clear image J according to the physical model as follows:
J ( x ) = I ( x ) 1 t ( x ) + A ( 1 1 t ( x ) )
J ( x ) = I ( x ) T ( x ) + A ( 1 T ( x ) )
Equation (2) is obtained by transforming Equation (1). In Equation (3), we define T ( x ) = 1 t ( x ) for simplicity. The light green part in Figure 2 is the PB architecture we designed. Prior to estimating the atmospheric light A and transmittance T, we employ a 3 × 3 convolution layer for feature extraction, followed sequentially by a Batch Normalization layer and a ReLU activation function. This sequence serves to transform the input tensor across channels while enabling initial feature extraction and integration. Next, the network divides into two branches to estimate atmospheric light and transmittance separately. Given that atmospheric light A is uniform across the image, we apply global average pooling (Global AvgPool2d) to minimize spatial redundancy and achieve a more reliable estimation.
Unlike atmospheric light, the transmission map shows obvious spatial non-uniformity and detail changes. If global average pooling is used directly, important spatial detail information will be lost. To avoid this problem, we discard the global average pooling operation in the transmittance branch and replace it with a 3 × 3 convolution layer. This choice effectively retains local detail information in the spatial dimension. Furthermore, unlike the 1 × 1 convolution used in the atmospheric light estimation branch, the transmittance estimation branch employs a larger 3 × 3 convolutional kernel to enlarge the receptive field and better capture local contextual information, thereby enabling more accurate transmittance estimation.

3.2. Dual-Domain Fusion

In traditional U-Net architectures, skip connections are employed to bridge feature maps between the encoder and decoder, aiming to preserve high-resolution details. However, these connections often perform simple feature concatenation or addition, a naive fusion strategy that can indiscriminately pass haze-corrupted or redundant features, thereby “polluting” the reconstruction process. While more advanced methods incorporate spatial attention to make this fusion more selective, they remain confined to the spatial domain. This is a fundamental limitation, as haze not only degrades spatial features but also corrupts frequency components, leading to the loss of high-frequency textures and shifts in color fidelity. We subsequently observed, as shown in the Figure 4, that the Fourier transform can separate image degradation and content to a certain extent, where the degradation is mainly reflected in the amplitude spectrum. In order to enhance the processing of degraded images, we designed the Frequency Domain Module (FDM) and integrated it into our Dual-Domain Fusion (DD Fusion) module in combination with the attention mechanism, aiming to effectively fuse spatial information with frequency domain components, as shown in Figure 5.
The process begins with input 1 and input 2, each undergoing a 1 × 1 convolution, then passing through Batch Normalization and ReLU activation. This sequence of convolution, normalization, and activation boosts the capacity of the network to capture intricate features. For this reason, we apply the same sequence of operations to the feature maps fed into the spatial and frequency domain processing modules. Next, the feature map enters the Frequency Domain Module (FDM), which is our innovative design. Frequency domain processing helps capture and utilize global information, allowing the network to better understand long-distance dependencies. After frequency domain processing, the feature map is fed into the spatial domain processing block. This block contains channel attention [45], which aims to strengthen important features between different channels, and position attention [46], which focuses on important spatial regions. To enhance network robustness and mitigate performance degradation, residual connections are incorporated within the spatial processing block.

Frequency Domain Module

We propose a Frequency Domain Module(FDM) that processes the amplitude A and phase P components separately using 1 × 1 convolutions. Our FDM can learn to accurately locate and correct the damage caused by haze in the amplitude spectrum while preserving the key structural information encoded in the phase spectrum, as shown in the orange block below Figure 5. Specifically, the input is first processed by a 1 × 1 convolution layer, and then a fast Fourier transform (FFT) is performed to separate the amplitude A and phase P components. The components A and P are processed independently, and then pass through a layer of 1 × 1 convolution layer, a layer of activation function, and a layer of 1 × 1 convolution, as shown in the following formula:
A ^ = σ ( C o n v 1 ( L e a k y R e l u ( C o n v 1 ( A ) ) ) ) P ^ = σ ( C o n v 1 ( L e a k y R e l u ( C o n v 1 ( P ) ) ) )
where A ^ and P ^ are the processed amplitude and phase components, respectively. Subsequently, the components A ^ and P ^ are combined to reconstruct the image by applying an inverse fast Fourier transform (IFFT). This operation is mathematically formulated as follows:
X ^ = IFFT ( A ^ cos ( P ^ ) , A ^ sin ( P ^ ) )
where X ^ is the final reconstructed feature map. Finally, X ^ will pass through a layer of 1 × 1 convolution and be added to the residual of the original input to yield the final output.

3.3. Loss Function

The loss function is critical for generating high-quality images. We employ a combination of L1, MSE, and SSIM losses to optimize the output quality. The loss function is defined as follows:
Loss ssim = 1 SSIM ( y i , y ^ i )
L o s s L 1 = y i y i ^ 1
L o s s mse = y i y i ^ 2 2
L o s s total = L o s s L 1 + L o s s mse + L o s s ssim
where y i denotes the generated image, and y ^ i denotes the ground truth image.

4. Experiment

4.1. Datasets

We evaluate our ScaleViM-PDD on nine public datasets, each with different characteristics and uses. The SateHaze1k [47] dataset includes three subsets: thin, medium, and thick, which we train together, with a total of 900 image pairs for training and 45 image pairs in each subset for testing. The RSID [9] dataset contains 1000 image pairs and is a remote sensing dataset involving military scenes, covering ships and airports. We randomly select one image from every 10 groups of images for testing according to the order of the dataset. In order to ensure that each type of scene can be selected for testing, a total of 100 pairs are randomly selected for testing, and the remaining 900 pairs are used for training. There are two large datasets in HRSD [48]: DHID and LHID [48]. The DHID [48] dataset is designed for dense haze dehazing tasks and contains 14,490 image pairs for training and a separate 500-pair test set. The LHID [48] dataset is specifically constructed for synthetic optical dehazing and includes a training set and two independent test sets: LHID-A and LHID-B. In this study, we test on LHID-A. RRSHID [49] is a state-of-the-art real-world remote sensing haze dataset. Similar to SateHaze1k, it also contains three subsets: light haze, moderate haze, and heavy haze. Different from the training strategy of SateHaze1k, ours trains each of them separately. For light haze, there are 610 pairs of images in the training set, 77 pairs of images in the evaluation set, and 76 pairs of images in the test set; for moderate haze, there are 1220 pairs of images in the training set, 154 pairs of images in the evaluation set, and 152 pairs of images in the test set; for heavy haze, there are 611 pairs of images in the training set, 77 pairs of images in the evaluation set, and 76 pairs of images in the test set. In addition, the size of the subset images in SateHaze1k and HRSD datasets is 512 × 512, and the size of the RSID and RRSHID datasets is 256 × 256.

Experimental Setup

Our model ScaleViM-PDD is trained on two NVIDIA RTX A5000 GPUs. The model was trained for 400 epochs on the SateHaze1k [47] and RRSHID [49] datasets, 200 epochs on the RSID [9] dataset, and 100 epochs on the DHID [48] and LHID [48] datasets. For 512 × 512 size images, we randomly crop them to 400 × 400 images to enhance generalization, the batch size is 8, the initial learning rate is 0.0003, and for 256 × 256 size images, no cropping is performed, the batch size is 20, and the initial learning rate is 0.0004. Other experimental settings are consistent, using the Adam optimizer with β 1 = 0.9, β 2 = 0.999, which is decayed to 0.000001 by a cosine annealing scheduler.

4.2. Comparison with Existing Methods

We conducted comparative experiments and verified the performance of the proposed network framework through quantitative and qualitative evaluations. We selected the SateHaze1k [47], RSID [9], LHID [48], and DHID [48] datasets for comparative experiments. To examine the performance of our proposed ScaleViM-PDD method for synthetic remote sensing image dehazing, we conducted comparative experiments with several state-of-the-art methods: DCP [2], AOD [3], GridDehaze-Net [6], FFA-Net [7], Trinity-Net [9], Dehazeformer-b [10], MixDehaze-Net [23], OK-Net [40], AU-Net [20], and AdaIR [42], and obtained qualitative and quantitative results on the StateHaze1K [47] and RSID [9] datasets. We conducted comparative experiments with several representative methods on large-scale datasets including DHID [48] and LHID [48]: DCP [2], AOD [3], FCTF-Net [22], GridDehaze-Net [6], FFA-Net [7], Trinity-Net [9], Dehazeformer-b [10], MixDehaze-Net [23], OK-Net [40], MMDP-Net [24], AU-Net [20], and AdaIR [42]. We conducted comparative experiments with several representative methods on the real-world remote sensing dataset RRSHID [49]: DCP [2], AOD [3], GridDehaze-Net [6], FFA-Net [7], Dehazeformer-b [10], MixDehaze-Net [23], OK-Net [40], AU-Net [20], and AdaIR [42]. To ensure fairness, we adopted the official implementations provided by the respective authors for training and reported the highest performance metrics. Peak signal-to-noise ratio (PSNR) and structural similarity (SSIM) are used for evaluation, and all methods are tested under the same evaluation code. The selection of comparison methods varies slightly across the tables to ensure a robust benchmark against techniques that are either commonly used or have reported state-of-the-art performance on these specific datasets in the literature.

4.3. Quantitative Evaluations

Table 1 summarizes the quantitative results on the SateHaze1k [47] and RSID [9] datasets, and Table 2 reports the performance on the LHID and DHID [48] datasets. Table 3 reports the quantitative results on the RRSHID [49] dataset. PSNR and SSIM are used as evaluation metrics. In addition, the average results of SateHaze1k and RRSHID at different haze concentrations are analyzed, and the average results of the two subsets of HRSD are also shown.
As shown in Table 1, our proposed ScaleViM-PDD achieves the best dehazing performance across thin, moderate, and thick haze conditions, as well as on the synthetic military scene dataset. Traditional methods such as DCP and AOD-Net yield the lowest scores, whereas Dehazeformer and AdaIR perform relatively well. Although several competing approaches produce competitive results, none surpass the performance of ScaleViM-PDD. For instance, on the moderate haze dataset, our model outperforms the second-best method, Dehazeformer, by 1.19 in PSNR and 0.068 in SSIM. These results highlight the robustness and superiority of ScaleViM-PDD in handling diverse haze scenarios.
As shown in Table 2, ScaleViM-PDD demonstrates strong performance on the two synthetic datasets, LHID and DHID [48]. On LHID, it surpasses the second-best method by 0.24 dB in PSNR and 0.0145 in SSIM. On DHID, the improvements reach 0.72 dB in PSNR and 0.0093 in SSIM. These results further confirm the effectiveness of ScaleViM-PDD in dehazing large remote sensing images.
As shown in Table 3, the scores of indicators for processing haze images with different interference levels in the real world are not high, but our proposed ScaleViM-PDD has achieved the best defogging performance under light fog, moderate fog, and dense fog conditions in the real world. Among them, the low scores of DCP, AOD-Net, and AU-Net are likely attributable to the limitations of their underlying physical model assumptions when applied to these complex real-world scenes. The OK-Net model can handle image defogging in the real world and also performs well in real-world remote sensing datasets. Although these competing methods have also achieved comparable results, none of them has surpassed the performance of ScaleViM-PDD. For example, on the light fog dataset, our model has a PSNR of 0.34 higher and an SSIM of 0.0372 higher than the second-best method, OK-Net. These results highlight the robustness and superiority of ScaleViM-PDD in processing real-world haze scenes.
As illustrated in Table 4, our ScaleViM-PDD achieves an excellent balance between performance and computational efficiency. For instance, compared to recent high-performing yet computationally expensive methods like Dehazeformer-b and AdaIR, our model not only achieves superior PSNR/SSIM scores (as seen in Table 1) but does so with far greater efficiency. Our model requires only 19.21 M parameters and 68.6 G FLOPs, whereas Dehazeformer-b uses 25.44 M parameters and 139.8 G FLOPs, and AdaIR demands even more with 28.77 M parameters and 147.4 G FLOPs. While some methods like MixDehaze-Net are more lightweight, our model offers a substantial performance gain across all datasets, demonstrating a superior performance-to-cost trade-off. This indicates that our proposed architecture is not only effective but also highly efficient, making it suitable for practical applications.

4.4. Visual Quality Assessment

We conduct a qualitative comparison between ScaleViM-PDD and several state-of-the-art dehazing methods, using SateHaze1k [47], RSID [9], HRSD [48], and RRSHID [49] as benchmark datasets for remote sensing haze removal evaluation.
Figure 6 illustrates the effects of various dehazing methods on the SateHaze1k [47] test set under different haze conditions: thin, moderate, and thick. From the first row of thin haze images, it is apparent that DCP and AU-Net suffer from considerable color distortion. FFA-Net, OK-Net, and AdaIR achieve some degree of dehazing, yet residual haze remains when compared to the real image. Trinity-Net and Dehazeformer exhibit stronger dehazing, but their restored images have ground colors that appear lighter than the real image. In contrast, the results from our method are closer to the true image. The indicators below the picture can be seen more clearly to see the differences between various methods. In the moderate haze images in the second row, we enlarged the most seriously polluted part of the picture below. Including our method, all methods have residual haze. Among them, Trinity-Net, Dehazeformer, and our model have the best dehazing effect. However, Dehazeformer has serious color loss, and Trinity-Net has unclear color detail representation. Our method not only has the best dehazing effect but also reflects the best color details. The last row is a thick, hazy image. DCP and AU-Net have serious haze residue. Although Trinity-Net and Dehazeformer have a certain dehazing effect, their results are somewhat white and retain a certain degree of haze. Although FFA-Net, OK-Net, and AdaIR have better dehazing effects, the restoration of ground details is still lacking.
Figure 7 shows the visual effects of various methods on the RSID [9] test set. Among them, DCP is more obviously affected by haze, and the colors in AU-Net are also somewhat distorted. Although FFA, Dehazeformer, and AdaIR have good dehazing effects, they are still affected by residual haze. Trinity-Net is better than all models, including this one, in expressing dark ground colors, but the color of the aircraft is white. The various indicators of OK-Net rank second only to those of this method, yet the model fails to capture the overall ground-truth structure of the airport.
Figure 8 qualitatively compares the effects of various dehazing methods on the LHID and DHID test sets. These two rows of figures jointly reflect the advantages and disadvantages of these models. DCP dehazes excessively, causing the output to be significantly darker, and AU-Net has the worst color restoration. FCTF-Net has a little haze that is not removed, and the overall color of GridDehaze-Net is a little darker. Methods such as FFA-Net, MMDP-Net, and AdaIR have achieved visually acceptable results, but there are still significant differences in PSNR and SSIM scores. In contrast, ScaleViM-PDD effectively retains fine details and significantly improves the overall visual quality of the restored image, achieving satisfactory results.
Figure 9 shows the performance of various dehazing methods on the RRSHID [49] test set under light, moderate, and heavy haze conditions. In the first row of light haze images, DCP achieves good dehazing performance, but the color restoration is overly bright. AOD-Net and AU-Net both suffer from noticeable color distortion. FFA-Net, Dehazeformer-b, OK-Net, and AdaIR show moderate dehazing effects, but residual haze remains when compared with the ground truth. Trinity-Net and Dehazeformer demonstrate strong dehazing capabilities, yet the fine details in their restored images appear blurry when zoomed in. In contrast, our method achieves better detail preservation. In the second row of moderate haze images, we zoom in on the most polluted region. All methods, including ours, still show some residual haze. Among them, DCP, AOD-Net, and AU-Net perform poorly due to the strong haze interference. The results of FFA and AdaIR also reveal incomplete haze removal. Dehazeformer-b, OK-Net, and our model achieve the best dehazing results. However, Dehazeformer tends to produce darker color tones, while OK-Net lacks detail clarity. Our method not only provides the strongest dehazing effect but also excels in brightness and detail preservation. The third row contains images with heavy haze. DCP and AOD-Net are significantly affected, resulting in severe color shifts, and AU-Net leaves noticeable haze residue. AdaIR also fails to remove the haze effectively. Although FFA-Net, Dehazeformer-b, and OK-Net can cleanly remove haze, they struggle with restoring fine details—especially OK-Net, which fails to recover structural lines and accurate colors. Our method performs well in both dehazing quality and restoration of color and texture details, achieving satisfactory results overall.

5. Ablation Study

To evaluate the individual impact of each component within our framework, we performed an ablation study using the RSID dataset, examining the roles of ScaleViM (Multi-scale EfficientViM), PD (physics-based block), and DD (Dual-Domain Fusion), as well as further analysis of the role of a single PD block and multiple PD blocks, and a further detailed analysis of FDM (Frequency Domain Module). Additionally, we analyzed the specific effects of different loss function combinations on the model. The corresponding PSNR and SSIM scores are listed in Table 5, Table 6 and Table 7, while qualitative comparisons are shown in Figure 10 and Figure 11. All experiments followed consistent settings, and the top-performing configurations were used for evaluation.
The basic architecture starts with EfficientViM [19] as the baseline model. Then, ScaleViM is created by adding different convolution kernels to enable multi-scale processing. Next, the PD block is introduced to incorporate the atmospheric scattering model for initial dehazing. Subsequently, the DD block is employed to enable Dual-Domain Fusion, aiming to enhance detail restoration. Table 5 presents a comprehensive analysis of the impact of each module—ScaleViM, PD, and DD. Specifically, the multi-scale optimized ScaleViM improves PSNR by 0.52 and SSIM by 0.0012 compared to the baseline. With the addition of the PD block (forming ScaleViM-P), performance further increases by 0.18 in PSNR and 0.0003 in SSIM. Although these gains may appear minor numerically, the visual enhancements, as illustrated in Figure 10, are substantial. Finally, incorporating the DD block to form ScaleViM-PDD leads to an additional improvement of 0.54 in PSNR and 0.0059 in SSIM over ScaleViM-P. These results clearly demonstrate that each module contributes meaningfully to the overall effectiveness of the framework.
The visual quality evaluation of our ablation experiments is shown above. As shown in Figure 10b, under haze conditions, the baseline has difficulty in recovering accurate ground truth details, and the output is significantly brighter than the original reference image. These results show that EfficientViM alone is not enough to reconstruct fine-grained features in remote sensing images affected by complex haze. Figure 10c shows the result after we introduced a multi-scale feature extraction operation, which effectively alleviates the whitening effect. We then introduced a Physical Decoupling block to estimate the atmospheric light A and transmittance T through an atmospheric scattering model, thereby reducing the complexity of the haze input. As shown in Figure 10d, the restored image shows enhanced realism and balanced restoration effects. Finally, we introduced the dual domain fusion (DD Fusion) module. As shown in Figure 10e, ScaleViM-PDD achieves excellent results in both ground truth approximation and color restoration.
To validate our design choice of integrating the Physical Decoupling (PD) into every ScaleViM-P module, we conducted a targeted ablation study. We compared our final model against a variant where the PB block is only applied once at the initial stage (similar to the strategy in some other works like AU-Net). As shown in Figure 11, the model using only a single PB block suffers from obvious incomplete dehazing. In contrast, our final model, which incorporates a PB block at each stage, achieves significantly better visual results. The corresponding transmission map also appears more detailed and accurate. This experiment demonstrates that progressively refining features with physical guidance at each scale is a superior and necessary strategy for handling complex haze.
We conducted further experiments on the FDM to verify its effectiveness. As shown in Figure 12, the model incorporating FDM exhibits faster and more stable convergence during the 200-epoch training process on the RSID dataset. The quantitative results in Table 6 further confirm its contribution, showing a notable performance gain of 0.29 dB in PSNR and 0.0037 in SSIM.
To further investigate the effect of different loss functions on model performance, we conducted an ablation study using the full ScaleViM-PDD architecture. As shown in Table 7, three commonly used loss functions were evaluated: L1 loss, MSE loss, and SSIM loss, along with their various combinations.
Individually, the L o s s L 1 achieved relatively balanced performance, while L o s s mse produced lower SSIM, indicating limited effectiveness in structural preservation. The L o s s ssim , although designed to emphasize perceptual quality, yielded higher SSIM but slightly lower PSNR. When combining two losses, L o s s L 1 + L o s s ssim showed the best performance among the pairwise combinations, achieving a PSNR of 25.94 and SSIM of 0.9534. This demonstrates the synergy between pixel-wise accuracy and structural fidelity. Finally, the joint use of all three loss components— L o s s L 1 , L o s s mse , and L o s s ssim —led to the best results overall, with a PSNR of 26.57 and SSIM of 0.9558, surpassing all other configurations. These results confirm that combining complementary loss functions significantly enhances the ability of the model to restore both fine details and global structures in hazy remote sensing images.

6. Conclusions

In this paper, we propose ScaleViM-PDD, a novel and effective network for remote sensing image dehazing. Our method enhances the powerful EfficientViM backbone with two key innovations. First, the ScaleViM-P module integrates a Physical Decoupling block within a multi-scale architecture, enabling the model to capture global context while mitigating haze effects in a physically-aware manner. Second, the DD Fusion module replaces conventional skip connections, leveraging frequency-domain information to significantly improve the recovery of fine details and color fidelity. Extensive experiments demonstrate that ScaleViM-PDD achieves state-of-the-art performance, outperforming existing methods in both quantitative metrics and visual quality across multiple challenging datasets.
Despite its strong performance, our proposed method has certain limitations. First, the applicability of the model to extremely high-resolution images (e.g., 4096 × 4096 or larger) is constrained by current GPU memory capacity. While it can still handle resolutions up to 1024 × 1024 (tested on a 24 GB GPU), processing larger images requires slicing strategies or further model optimization, which may affect context completeness and performance. Second, our method is designed for RGB remote sensing images and is not applicable to hyperspectral images. Based on our findings and the identified limitations, our future work will proceed in several directions. We plan to explore advanced model compression and optimization techniques, such as pruning, quantization, and knowledge distillation, to improve computational efficiency and scalability for large-scale remote sensing image processing. Furthermore, extending the physical model and frequency-domain analysis to hyperspectral imagery presents a promising research avenue, requiring adaptations to accommodate the unique spectral characteristics of such data. Finally, to address the data scarcity bottleneck in the field, we intend to create and release a large-scale, high-quality public dataset for remote sensing dehazing to catalyze broader research progress.

Author Contributions

Conceptualization and methodology, H.Z.; writing—original draft preparation and software, Y.W.; data curation, W.P.; supervision, X.G.; resources and validation, T.T. All authors have read and agreed to the published version of the manuscript.

Funding

This research was supported by the National Natural Science Foundation of China (62401012), the Collaborative Innovation Program of Anhui Universities (Grant No. GXXT-2023-021), the Key Project of Natural Science Foundation of Anhui Provincial Department of Education (Grant No. 2022AH050319), and the Young Teachers Scientific Research Fund Project of Anhui University of Technology (QZ202313).

Data Availability Statement

The SateHaze1k [47], RSID [9], and HRSD [48] datasets are for academic and research use only. Please refer to the paper for details.

Conflicts of Interest

The authors declare no conflicts of interest.

References

  1. Middleton, W.E.K. Vision through the atmosphere. In Geophysik II/Geophysics II; Springer: Berlin/Heidelberg, Germany, 1957; pp. 254–287. [Google Scholar]
  2. He, K.; Sun, J.; Tang, X. Single image haze removal using dark channel prior. IEEE Trans. Pattern Anal. Mach. Intell. 2010, 33, 2341–2353. [Google Scholar] [CrossRef]
  3. Li, B.; Peng, X.; Wang, Z.; Xu, J.; Feng, D. Aod-net: All-in-one dehazing network. In Proceedings of the IEEE International Conference on Computer Vision, Venice, Italy, 22–29 October 2017; pp. 4770–4778. [Google Scholar]
  4. Cai, B.; Xu, X.; Jia, K.; Qing, C.; Tao, D. Dehazenet: An end-to-end system for single image haze removal. IEEE Trans. Image Process. 2016, 25, 5187–5198. [Google Scholar] [CrossRef]
  5. Wang, M.; Yan, Z.; Wang, T.; Cai, P.; Gao, S.; Zeng, Y.; Wan, C.; Wang, H.; Pan, L.; Yu, J.; et al. Gesture recognition using a bioinspired learning architecture that integrates visual data with somatosensory data from stretchable sensors. Nat. Electron. 2020, 3, 563–570. [Google Scholar] [CrossRef]
  6. Liu, X.; Ma, Y.; Shi, Z.; Chen, J. Griddehazenet: Attention-based multi-scale network for image dehazing. In Proceedings of the IEEE/CVF International Conference on Computer Vision, Seoul, Republic of Korea, 27 October–2 November 2019; pp. 7314–7323. [Google Scholar]
  7. Qin, X.; Wang, Z.; Bai, Y.; Xie, X.; Jia, H. FFA-Net: Feature fusion attention network for single image dehazing. In Proceedings of the AAAI Conference on Artificial Intelligence, New York, NY, USA, 7–12 February 2020; Volume 34, pp. 11908–11915. [Google Scholar]
  8. Guo, C.L.; Yan, Q.; Anwar, S.; Cong, R.; Ren, W.; Li, C. Image dehazing transformer with transmission-aware 3d position embedding. In Proceedings of the Computer Vision and Pattern Recognition Conference, New Orleans, LA, USA, 18–24 June 2022; pp. 5812–5820. [Google Scholar]
  9. Chi, K.; Yuan, Y.; Wang, Q. Trinity-Net: Gradient-guided Swin transformer-based remote sensing image dehazing and beyond. IEEE Trans. Geosci. Remote Sens. 2023, 61, 4702914. [Google Scholar] [CrossRef]
  10. Song, Y.; He, Z.; Qian, H.; Du, X. Vision transformers for single image dehazing. IEEE Trans. Image Process. 2023, 32, 1927–1941. [Google Scholar] [CrossRef] [PubMed]
  11. Yan, Q.; Yang, K.; Hu, T.; Chen, G.; Dai, K.; Wu, P.; Ren, W.; Zhang, Y. From Dynamic to Static: Stepwisely Generate HDR Image for Ghost Removal. IEEE Trans. Circuits Syst. Video Technol. 2025, 35, 1409–1421. [Google Scholar] [CrossRef]
  12. Yan, Q.; Wang, H.; Ma, Y.; Liu, Y.; Dong, W.; Woźniak, M.; Zhang, Y. Uncertainty estimation in HDR imaging with Bayesian neural networks. Pattern Recognit. 2024, 156, 110802. [Google Scholar] [CrossRef]
  13. Yan, Q.; Hu, T.; Wu, P.; Dai, D.; Gu, S.; Dong, W.; Zhang, Y. Efficient Image Enhancement with a Diffusion-Based Frequency Prior. IEEE Trans. Circuits Syst. Video Technol. 2025. [Google Scholar] [CrossRef]
  14. Yan, Q.; Zhang, L.; Liu, Y.; Zhu, Y.; Sun, J.; Shi, Q.; Zhang, Y. Deep HDR imaging via a non-local network. IEEE Trans. Image Process. 2020, 29, 4308–4322. [Google Scholar] [CrossRef] [PubMed]
  15. Zhou, H.; Chen, Z.; Liu, Y.; Sheng, Y.; Ren, W.; Xiong, H. Physical-priors-guided DehazeFormer. Knowl.-Based Syst. 2023, 266, 110410. [Google Scholar] [CrossRef]
  16. Wang, X.; Liu, Z.; Gao, Y.; Zheng, X.; Dang, Z.; Shen, X. A near-optimal protocol for the grouping problem in RFID systems. IEEE Trans. Mob. Comput. 2019, 20, 1257–1272. [Google Scholar] [CrossRef]
  17. Wang, X.; Liu, Z.; Liu, A.X.; Zheng, X.; Zhou, H.; Hawbani, A.; Dang, Z. A near-optimal protocol for continuous tag recognition in mobile rfid systems. IEEE/ACM Trans. Netw. 2023, 32, 1303–1318. [Google Scholar] [CrossRef]
  18. Gu, A.; Dao, T. Mamba: Linear-Time Sequence Modeling with Selective State Spaces. arXiv 2023, arXiv:2312.00752. [Google Scholar] [CrossRef]
  19. Lee, S.; Choi, J.; Kim, H.J. Efficientvim: Efficient vision mamba with hidden state mixer based state space duality. In Proceedings of the Computer Vision and Pattern Recognition Conference, Nashville, TN, USA, 10–17 June 2025; pp. 14923–14933. [Google Scholar]
  20. Du, Y.; Li, J.; Sheng, Q.; Zhu, Y.; Wang, B.; Ling, X. Dehazing network: Asymmetric unet based on physical model. IEEE Trans. Geosci. Remote Sens. 2024, 62, 5607412. [Google Scholar] [CrossRef]
  21. Zhu, Q.; Mai, J.; Shao, L. A fast single image haze removal algorithm using color attenuation prior. IEEE Trans. Image Process. 2015, 24, 3522–3533. [Google Scholar] [CrossRef]
  22. Li, Y.; Chen, X. A coarse-to-fine two-stage attentive network for haze removal of remote sensing images. IEEE Geosci. Remote Sens. Lett. 2020, 18, 1751–1755. [Google Scholar] [CrossRef]
  23. Lu, L.; Xiong, Q.; Xu, B.; Chu, D. MixDehazeNet: Mix structure block for image dehazing network. In Proceedings of the 2024 International Joint Conference on Neural Networks (IJCNN), Yokohama, Japan, 30 June–5 July 2024; pp. 1–10. [Google Scholar]
  24. Zhou, H.; Wang, L.; Li, Q.; Guan, X.; Tao, T. Multi-Dimensional and Multi-Scale Physical Dehazing Network for Remote Sensing Images. Remote Sens. 2024, 16, 4780. [Google Scholar] [CrossRef]
  25. Zamir, S.W.; Arora, A.; Khan, S.; Hayat, M.; Khan, F.S.; Yang, M.H. Restormer: Efficient transformer for high-resolution image restoration. In Proceedings of the Computer Vision and Pattern Recognition Conference, New Orleans, LA, USA, 18–24 June 2022; pp. 5728–5739. [Google Scholar]
  26. Zeng, H.; Li, Y.; Niu, R.; Yang, C.; Wen, S. Enhancing spatiotemporal prediction through the integration of Mamba state space models and Diffusion Transformers. Knowl.-Based Syst. 2025, 316, 113347. [Google Scholar] [CrossRef]
  27. Ma, J.; Li, F.; Wang, B. U-Mamba: Enhancing Long-Range Dependency for Biomedical Image Segmentation. arXiv 2024, arXiv:2401.04722. [Google Scholar]
  28. Ma, X.; Zhang, X.; Pun, M.O. RS3Mamba: Visual State Space Model for Remote Sensing Image Semantic Segmentation. IEEE Geosci. Remote Sens. Lett. 2024, 21, 6011405. [Google Scholar] [CrossRef]
  29. Liu, Q.; Yue, J.; Fang, Y.; Xia, S.; Fang, L. HyperMamba: A Spectral–Spatial Adaptive Mamba for Hyperspectral Image Classification. IEEE Trans. Geosci. Remote Sens. 2024, 62, 5536514. [Google Scholar] [CrossRef]
  30. Guo, H.; Li, J.; Dai, T.; Ouyang, Z.; Ren, X.; Xia, S.T. Mambair: A simple baseline for image restoration with state-space model. In Proceedings of the European Conference on Computer Vision, Milan, Italy, 29 September–4 October 2024; pp. 222–241. [Google Scholar]
  31. Zhou, H.; Wu, X.; Chen, H.; Chen, X.; He, X. RSDehamba: Lightweight Vision Mamba for Remote Sensing Satellite Image Dehazing. arXiv 2024, arXiv:2405.10030. [Google Scholar] [CrossRef]
  32. Zheng, Z.; Wu, C. U-Shaped Vision Mamba for Single Image Dehazing. arXiv 2024, arXiv:2402.04139. [Google Scholar] [CrossRef]
  33. Sui, T.; Xiang, G.; Chen, F.; Li, Y.; Tao, X.; Zhou, J.; Hong, J.; Qiu, Z. U-Shaped Dual Attention Vision Mamba Network for Satellite Remote Sensing Single-Image Dehazing. Remote Sens. 2025, 17, 1055. [Google Scholar] [CrossRef]
  34. Li, R.; Jiang, M.; Liu, Q.; Wang, K.; Feng, K.; Sun, Y.; Zhou, X. Faith: Frequency-domain attention in two horizons for time series forecasting. Knowl.-Based Syst. 2025, 309, 112790. [Google Scholar] [CrossRef]
  35. Zhou, M.; Huang, J.; Yan, K.; Hong, D.; Jia, X.; Chanussot, J.; Li, C. A General Spatial–Frequency Learning Framework for Multimodal Image Fusion. IEEE Trans. Pattern Anal. Mach. Intell. 2025, 47, 5281–5298. [Google Scholar] [CrossRef]
  36. Shirali, A.; Kazemi, R.; Amini, A. Collaborative Filtering with Representation Learning in the Frequency Domain. Inf. Sci. 2024, 681, 121240. [Google Scholar] [CrossRef]
  37. Qu, S.; Zhang, Q.; Bai, S.; Guan, C.; Gao, X.; Jiang, P.; Qi, H.; Shang, Y.; Lv, J.; Jiang, W.; et al. High Spatial Resolution and Wide Strain Measurement of Optical Frequency Domain Reflectometry Based on Correlation Spectrum Self-Compensation Method. J. Light. Technol. 2025, 43, 5352–5357. [Google Scholar] [CrossRef]
  38. Zhou, M.; Huang, J.; Guo, C.L.; Li, C. Fourmer: An efficient global modeling paradigm for image restoration. In Proceedings of the International Conference on Machine Learning, Honolulu, HI, USA, 23–29 July 2023; pp. 42589–42601. [Google Scholar]
  39. Zhou, H.; Dong, W.; Liu, Y.; Chen, J. Breaking through the haze: An advanced non-homogeneous dehazing method based on fast fourier convolution and convnext. In Proceedings of the Computer Vision and Pattern Recognition Conference, Vancouver, BC, Canada, 17–24 June 2023; pp. 1895–1904. [Google Scholar]
  40. Cui, Y.; Ren, W.; Knoll, A. Omni-Kernel Network for Image Restoration. In Proceedings of the AAAI Conference on Artificial Intelligence, Vancouver, BC, Canada, 26–27 February 2024; Volume 38, pp. 1426–1434. [Google Scholar]
  41. Cui, Y.; Wang, Q.; Li, C.; Ren, W.; Knoll, A. EENet: An Effective and Efficient Network for Single Image Dehazing. Pattern Recognit. 2025, 158, 111074. [Google Scholar] [CrossRef]
  42. Cui, Y.; Zamir, S.W.; Khan, S.; Knoll, A.; Shah, M.; Khan, F.S. AdaIR: Adaptive All-in-One Image Restoration via Frequency Mining and Modulation. In Proceedings of the Thirteenth International Conference on Learning Representations, Vienna, Austria, 7–11 May 2025; pp. 1–12. [Google Scholar]
  43. Szegedy, C.; Liu, W.; Jia, Y.; Sermanet, P.; Reed, S.; Anguelov, D.; Erhan, D.; Vanhoucke, V.; Rabinovich, A. Going Deeper with Convolutions. In Proceedings of the Computer Vision and Pattern Recognition Conference, Boston, MA, USA, 7–12 June 2015; pp. 1–9. [Google Scholar]
  44. Zheng, Y.; Zhan, J.; He, S.; Dong, J.; Du, Y. Curricular contrastive regularization for physics-aware single image dehazing. In Proceedings of the Computer Vision and Pattern Recognition Conference, Vancouver, BC, Canada, 17–24 June 2023; pp. 5785–5794. [Google Scholar]
  45. Wang, Q.; Wu, B.; Zhu, P.; Li, P.; Zuo, W.; Hu, Q. ECA-Net: Efficient channel attention for deep convolutional neural networks. In Proceedings of the Computer Vision and Pattern Recognition Conference, Seattle, WA, USA, 13–19 June 2020; pp. 11534–11542. [Google Scholar]
  46. Wang, X.; Wang, S.; Li, J.; Li, M.; Li, J.; Xu, Y. Omnidirectional Image Super-Resolution via Position Attention Network. Neural Netw. 2024, 178, 106464. [Google Scholar] [CrossRef] [PubMed]
  47. Huang, B.; Zhi, L.; Yang, C.; Sun, F.; Song, Y. Single satellite optical imagery dehazing using SAR image prior based on conditional generative adversarial networks. In Proceedings of the IEEE/CVF Winter Conference on Applications of Computer Vision, Snowmass Village, CO, USA, 1–5 March 2020; pp. 1806–1813. [Google Scholar]
  48. Zhang, L.; Wang, S. Dense haze removal based on dynamic collaborative inference learning for remote sensing images. IEEE Trans. Geosci. Remote Sens. 2022, 60, 5631016. [Google Scholar] [CrossRef]
  49. Zhu, Z.H.; Lu, W.; Chen, S.B.; Ding, C.H.Q.; Tang, J.; Luo, B. Real-World Remote Sensing Image Dehazing: Benchmark and Baseline. arXiv 2025, arXiv:2503.17966. [Google Scholar] [CrossRef]
Figure 1. (a) is the pseudo code of the HSM-SSD layer with a single-head design, and (b) describes the main framework of EfficientViM [19].
Remotesensing 17 02664 g001
Figure 2. ScaleViM-PDD is an improved Unet structure. The architecture in the ScaleViM-P module consists of a physical module and a multi-scale ViM, and uses DD Fusion (dual domain fusion) to replace the skip connection. The input undergoes four layers of downsampling, four layers of upsampling, and four layers of fusion. The tensor size of the feature map at each stage is shown in the figure above.
Remotesensing 17 02664 g002
Figure 3. Flowchart of the ScaleViM-PDD.
Remotesensing 17 02664 g003
Figure 4. We demonstrate the use of the Fourier transform to exchange the amplitude and phase components between clear and hazy remote sensing images. Observations indicate that the Fourier transform can partially disentangle image content from degradation, with the latter primarily reflected in the amplitude spectrum. The provided amplitude and phase diagrams are all single-channel representations. This observation serves as the core motivation for the design of our FDM.
Remotesensing 17 02664 g004
Figure 5. The architecture of the Dual-Domain Fusion module. The orange blocks are Frequency Domain Modules, the blue boxes are spatial domain blocks, CA is channel attention, and PA is position attention. FFT and IFFT are fast Fourier transform and inverse operations, respectively.
Remotesensing 17 02664 g005
Figure 6. SateHaze1k [47] dataset, which is divided into three subsets: thin, moderate, and thick haze. In the visual comparison, the “Hazy Image” refers to the input haze image, “Ours” denotes the image restored by our method, and “GT” represents the ground truth. The remaining images depict the results of various state-of-the-art methods.
Remotesensing 17 02664 g006
Figure 7. Visual samples produced by the tested methods on the RSID [48] dataset. In the visual comparison, the “Hazy Image” refers to the input haze image, “Ours” denotes the image restored by our method, and “GT” represents the ground truth. The remaining images depict the results of various state-of-the-art methods.
Remotesensing 17 02664 g007
Figure 8. Visual results generated by the evaluation method on the LHID [48] and DHID [48] datasets. LHID is the first row, and DHID is the second row. In the visual comparison, the “Hazy Image” refers to the input haze image, “Ours” denotes the image restored by our method, and “GT” represents the ground truth. The remaining images depict the results of various state-of-the-art methods.
Remotesensing 17 02664 g008
Figure 9. RRSHID [49] dataset, which is divided into three subsets: thin, moderate, and thick haze. In the visual comparison, the “Hazy Image” refers to the input haze image, “Ours” denotes the image restored by our method, and “GT” represents the ground truth. The remaining images depict the results of various state-of-the-art methods.
Remotesensing 17 02664 g009
Figure 10. The impact of different components of ScaleViM-PDD, shown from (a) to (f ), is as follows: (a) the hazy image; (b) replacing the convolutional layers in Unet with EfficientViM blocks as the baseline model; (c) EfficientViM with different scales; (d) ScaleViM with the PD; (e) our complete model, ScaleViM with both PD and the DD; and (f) the ground-truth image. Here, PD refers to the physics module, and DD refers to the Dual-Domain Fusion module.
Remotesensing 17 02664 g010
Figure 11. We further present the ablation experiment of the physical module, showing the visualization of the results with only one physical module and the comparison with our final model. In addition, we also provide the transmittance graph of the two results.
Remotesensing 17 02664 g011
Figure 12. Ablation experiment on FDM. Reflects the loss convergence status with or without FDM under the same conditions.
Remotesensing 17 02664 g012
Table 1. StateHaze1k [47] and RSID [9] datasets remote sensing image dehazing effects. In this table, bold and underlined represent the best and second-best quantitative performance, respectively.
MethodsThin HazeModerate HazeThick HazeAverageRSID
PSNR SSIM PSNR SSIM PSNR SSIM PSNR SSIM PSNR SSIM
DCP [2]20.470.870520.830.897116.710.743519.340.837017.590.8488
AOD-Net [3]16.360.816817.880.866615.870.740216.700.807918.780.8579
GridDehaze-Net [6]23.990.905724.090.926020.910.818722.990.883425.150.9504
FFA-Net [7]25.160.916824.790.929622.360.845324.100.897226.040.9519
Trinity-Net [9]23.460.899825.980.937220.470.814823.300.883925.340.9455
Dehazeformer-b [10]25.680.919327.150.940822.740.849425.190.903225.790.9548
MixDehaze-Net [23]22.360.887524.630.920919.580.797722.190.868723.930.9082
OK-Net [40]22.160.897426.000.943720.510.825722.890.888925.020.9489
AU-Net [20]22.710.899221.040.903821.810.845821.850.882917.010.7671
AdaIR [42]25.550.916326.450.940122.780.857524.740.889226.170.9484
Ours25.710.922528.340.950522.780.857525.610.910226.570.9558
Table 2. LHID [48] and DHID [48] datasets remote sensing image dehazing effects. In this table, bold and underlined represent the best and second-best quantitative performance, respectively.
MethodsLHIDDHIDAverage
PSNR SSIM PSNR SSIM PSNR SSIM
DCP [2]21.340.800419.160.817820.250.8091
AOD-Net [3]21.910.815916.030.717618.970.7668
FCTF-Net [22]28.580.876622.640.844225.610.8604
GridDehaze-Net [6]25.810.861326.810.882026.310.8717
FFA-Net [7]29.360.879324.660.862527.010.8709
MixDehaze-Net [23]29.420.866627.310.883828.370.8752
MMDP-Net [24]29.800.880928.300.897029.050.8889
AU-Net [20]16.820.599323.730.857320.270.7283
AdaIR [42]24.010.867828.080.877626.040.8726
Ours30.040.895429.020.906329.530.9009
Table 3. RRSHID [49] remote sensing image dehazing effects. In this table, bold and underlined represent the best and second-best quantitative performance, respectively.
MethodsThin HazeModerate HazeThick HazeAverage
PSNR SSIM PSNR SSIM PSNR SSIM PSNR SSIM
DCP [2]17.650.488415.540.499314.090.472915.760.4868
AOD-Net [3]18.220.485015.260.392315.100.384716.190.4206
GridDehaze-Net [6]22.540.620322.540.647523.840.712522.970.6601
FFA-Net [7]23.090.640923.240.618325.090.739723.800.6839
Dehazeformer-b [10]23.090.645220.930.618324.710.730922.910.6648
MixDehaze-Net [23]22.020.566622.430.623323.640.672822.690.6209
OK-Net [40]23.550.659924.180.702524.760.741524.160.7013
AU-Net [20]17.510.349217.150.530015.550.475416.730.4515
AdaIR [42]22.540.600723.120.667123.980.714623.210.6608
Ours23.890.697124.380.716625.160.759524.480.7244
Table 4. Comparison of FLOPs and Parameters across models.
FFA-NetGridDehaze-NetDehazeformer-bTrinity-NetMixDehaze-NetOK-NetAU-NetAdaIROurs
FLOPs (G)575.642.98139.869.528.639.638.6147.468.6
Parameters (M)4.450.95625.4420.143.174.722.428.7719.21
Table 5. The table shows the ablation study results of ScaleViM block PD block and DD Fusion. The baseline model removes the PD block, replaces the DD with a concatenation operation, and finally removes the multi-scale feature extraction. In this table, bold and underlined represent the best and second-best quantitative performance, respectively.
ModelPSNRSSIM
Baseline Model25.330.9485
Model with ScaleViM25.850.9497
Model with ScaleViM+PD26.030.9499
Model with ScaleViM+PD+DD26.570.9558
Table 6. This table shows the results of the FDM ablation study. bold represents the best quantitative performance.
ModelPSNRSSIM
ScaleViM-PDD without FDM26.280.9521
ScaleViM-PDD26.570.9558
Table 7. The table shows the ablation study results of the ScaleViM-PDD model loss function. We used three loss functions: L1 loss, MSE loss, and SSIM loss. In this table, bold and underlined represent the best and second-best quantitative performance, respectively.
Loss FunctionPSNRSSIM
L o s s L 1 25.870.9443
L o s s mse 25.520.9434
L o s s ssim 25.600.9512
L o s s L 1 + L o s s mse 25.850.9463
L o s s L 1 + L o s s ssim 25.940.9534
L o s s ssim + L o s s mse 25.720.9526
L o s s L 1 + L o s s mse + L o s s ssim 26.570.9558
Disclaimer/Publisher’s Note: The statements, opinions and data contained in all publications are solely those of the individual author(s) and contributor(s) and not of MDPI and/or the editor(s). MDPI and/or the editor(s) disclaim responsibility for any injury to people or property resulting from any ideas, methods, instructions or products referred to in the content.

