1. Introduction
Multimodal remote sensing image registration serves as a fundamental prerequisite and critical step for numerous multimodal collaborative processing tasks and integrated remote sensing applications. The registration between optical images and SAR images is one of the typical multimodal image registration tasks and plays a crucial role in various remote sensing applications, including image fusion, change detection, and target recognition [
1]. The key to the registration of optical images and SAR images is to identify as many correct corresponding point pairs as possible that are uniformly distributed on both types of remote sensing images to obtain the correct geometric transformation model between the two images [
2]. However, owing to the different imaging principles and imaging platforms of optical images and SAR images, there are significant nonlinear radiation differences and geometric distortions between the images [
3], as shown in
Figure 1. To address these challenges, current research primarily employs traditional manual registration methods and deep learning-based registration methods. Among these, traditional manual registration methods can be further categorized into feature-based registration methods and area-based registration methods [
4].
Feature-based registration methods are mainly divided into extracting features (such as corner points and edges), constructing feature descriptors, feature matching, and calculating a transformation model, thus achieving high-precision image registration [
5]. The Scale-Invariant Feature Transform (SIFT) algorithm is the most widely used image registration algorithm in computer vision [
6]. However, the speckle noise in SAR images causes the feature points detected by the traditional SIFT algorithm to be highly unstable, resulting in numerous incorrect matches. Therefore, it is difficult to apply the SIFT method directly to SAR image registration. Currently, many researchers have proposed corresponding improved algorithms to address this issue. Dellinger F et al. [
7] proposed the SAR-SIFT method, which calculates the ratio gradient through the ROEWA operator [
8] to enhance the resistance to speckle noise in SAR images. Xiang et al. [
9] proposed the OS-SIFT method, which uses multi-scale Sobel and ROEWA operators to design consistent gradients for optical and SAR images, integrating multi-scale information to enhance the robustness of matching. Li et al. [
10] proposed the RIFT method, which used the phase congruence (PC) [
11] for feature point detection and constructed a maximum index map based on the log-Gabor convolutional sequence for feature description, thereby enhancing feature detection stability and radiometric invariance. However, it requires a strategy of ring feature calculation to overcome the rotation discrepancy, which is less technically efficient. Therefore, they proposed a new rotation strategy to optimize the efficiency [
12].
Area-based registration methods focus on the comprehensive properties and resemblances of whole or segmental image regions. Such methods commonly utilize attributes including gray value, texture, and shape to ascertain matching regions through the computation of similarity measurement between designated regions [
13]. Commonly used similarity measurement in template matching include sum of squared differences (SSD), normalized cross correlation (NCC) [
14], and mutual information (MI) [
15]. In recent years, many scholars have conducted in-depth research on this method. Ye et al. [
16] proposed a novel structural feature descriptor, the Histogram of Orientated Phase Congruency (HOPC), which replaces traditional Histogram of Oriented Gradient (HOG) [
17] with PC features. The method enhances registration precision but suffers from computational inefficiency that needs to be addressed. To address this issue, a fast and robust pixel-wise template matching framework was developed using Channel Features of Oriented Gradients (CFOG) [
18], where the SSD similarity measure was optimized in the frequency domain via Fast Fourier Transform (FFT) to accelerate matching performance. Fan et al. [
19] improved CFOG using the Angle-Weighted Oriented Gradients (AWOG) strategy, distributing the gradient values to the two most relevant directions to enhance registration accuracy. Tong et al. [
20] proposed the Multi-scale Orientated Gradient Fusion (MOGF) operator based on AWOG, which employs multi-scale gradient quantization decomposition for feature description, along with convolutional merging and feature dimensionality reduction to enhance the accuracy and efficiency of image registration. Ye et al. [
21] proposed the FED-HOPC registration method, which distinguishes texture regions through the Weighted Edge Density (WED) map to improve the registration accuracy of the HOPC descriptor and used FFT to accelerate the matching calculation, thereby enhancing the robustness of the registration algorithm.
Recently, deep learning has been utilized to cross-source image registration because of its strong feature extraction abilities. These methods improve the precision and robustness of registration by learning deep-level representations of different pattern images [
22]. Current research in the domain of image registration primarily focuses on two approaches: feature descriptor learning and style transfer. In feature descriptor learning, deep neural networks have effectively supplanted conventional feature extraction and description processes in image registration. By leveraging hierarchical feature representations learned from data, these deep learning-based methods significantly enhance both registration accuracy and robustness [
23,
24,
25]. In the field of style transfer, advanced models such as Generative Adversarial Networks (GANs) have been successfully employed to first achieve modality unification through sophisticated style transfer algorithms. This preprocessing step enables subsequent registration of the transformed images using either traditional area-based or feature-based registration methods [
26,
27,
28]. However, the development of deep learning-based registration methods currently faces substantial data-related constraints. The inherent complexity, extensive spatial coverage, and heterogeneous noise characteristics of multimodal remote sensing imagery make it challenging to construct sufficiently large and representative training datasets. This data scarcity severely constrains the development potential of deep learning-based registration methods in terms of feature extraction, model generalization, and performance optimization. Therefore, traditional manual registration methods remain widely employed in current applications.
In this paper, we propose a novel optical–SAR image registration method named GDWF, which addresses the limitations of traditional approaches that rely solely on single gradient features (e.g., CFOG, AWOG) in scenarios with significant regional differences. The key innovation of GDWF lies in its dual-feature adaptive fusion strategy, which employs an intelligent weighting scheme to automatically balance feature contributions. This approach achieves both precise registration in structured environments and robust performance in texture-deficient areas. Specifically, in high-texture regions (e.g., urban buildings, farmlands, and other man-made structures), the method preserves the discriminative capability of gradient features, while in low-texture areas (e.g., oceans, forests, and natural landscapes), it compensates for gradient feature limitations by incorporating LSD features that demonstrate superior performance in repetitive textures. This balanced approach enables GDWF to achieve superior performance across diverse and challenging registration scenarios. The main contributions of this paper are summarized as follows:
A Block-local standard deviation feature point extraction operator is proposed, which can accurately identify the effective texture regions in the image, avoiding the problem that feature points in weak texture regions may affect the matching accuracy. It can precisely and efficiently achieve region-adaptive feature point extraction.
A dual-modal feature description operator is proposed that integrates local standard deviation texture features with traditional gradient features. By combining the geometric sensitivity of gradients with the statistical robustness of local standard deviation features, the proposed operator significantly enhances the robustness of feature descriptions. In optical–SAR image registration tasks, it effectively improves both fault tolerance and generalization performance.
A confidence-weighted dual-modal fusion feature matching strategy is proposed. By establishing a confidence evaluation model based on the peak side lobe ratio and the integral side lobe ratio of the similarity measurement map, the contribution weights of gradient features and local standard deviation features can be adaptively optimized, enhancing the reliability of the similarity measurement map and significantly improving the accuracy of image registration.
The remainder of this article is organized as follows.
Section 2 introduces the registration framework of the GDWF algorithm proposed in this paper.
Section 3 details the datasets used in our experiments, presents the experimental results, and provides analysis to validate the effectiveness of the proposed method.
Section 4 analyzes the impact of template size on registration performance and conducts ablation studies to demonstrate the necessity and advantages of each component in the proposed method. Finally, the conclusion is presented in
Section 5.
2. Methods
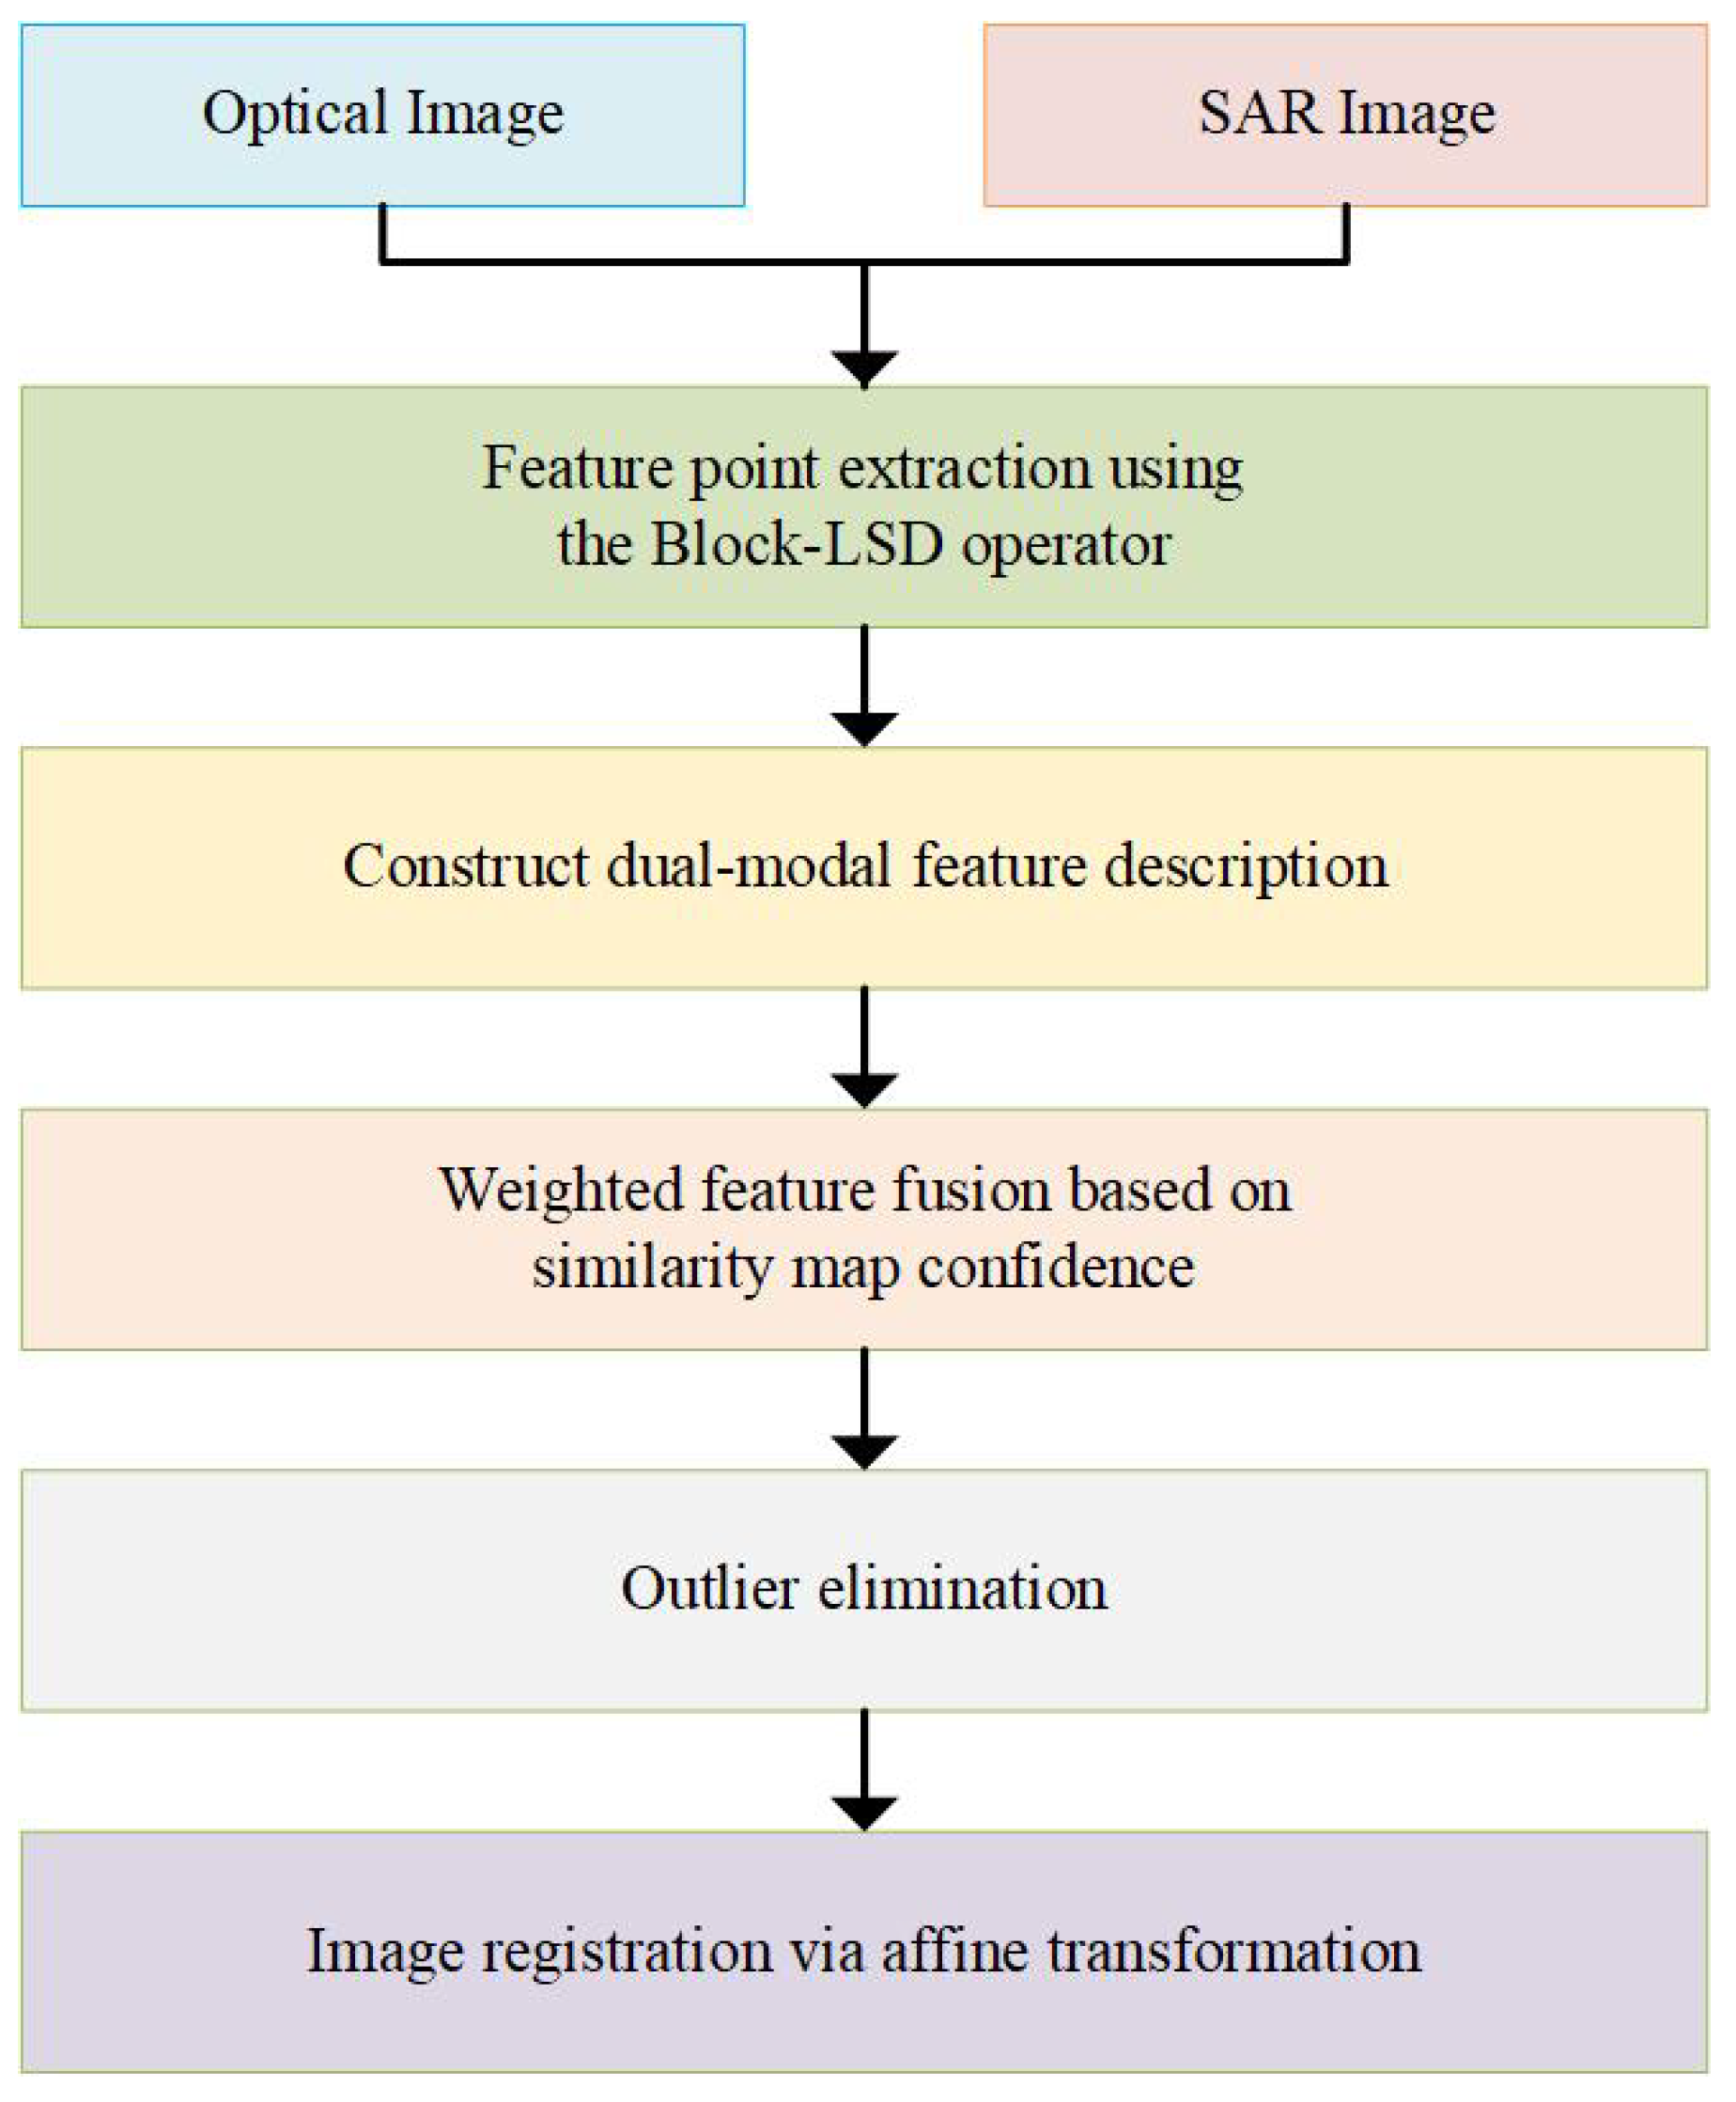
This section presents a robust registration method for optical–SAR image registration.
Figure 2 illustrates the flowchart of the proposed algorithm, which consists of four main components: (1) Feature Extraction: The Block-LSD operator is employed to detect reliable and uniformly distributed feature points in the optical image. For each feature point, a template region is established, and a corresponding search region is defined in the SAR image. (2) Feature Description: Gradient-based and LSD-based feature descriptors are constructed for both the template regions (optical image) and search regions (SAR image) to enhance discriminative matching. (3) Adaptive Feature Fusion: The similarity measurement maps of the two feature types are adaptively weighted and fused based on their confidence scores, ensuring robust matching performance. (4) Outlier Elimination: The initial correspondence set obtained from template matching undergoes geometric verification via the Fast Sample Consensus (FSC) algorithm [
29] to discard spatial outliers.
2.1. Block-LSD Operator
In the optical–SAR image registration task, extracting high-quality feature points serves as the core step to achieve high-precision registration. To construct a reliable geometric transformation model, it is essential to extract as many feature points as possible from remote sensing images. These feature points should be evenly distributed and robust, and their surrounding areas should be effectively represented through local invariant feature descriptors.
Although traditional feature point detection methods based on image intensity or gradient information, such as the traditional Harris [
30] and FAST [
31] operators, are widely used in computer vision, they exhibit significant limitations when applied to remote sensing images with substantial regional differences. In weak texture regions, the detection of feature points is susceptible to misjudgment due to weak gradient features, uniform gray-level distribution, and local noise interference, which significantly reduces the matching accuracy. To address these issues, Ye et al. [
21] proposed the WED operator, which effectively distinguishes weak texture regions from effective texture regions by fusing PC and edge density features. However, due to the frequency domain calculations required for PC, this method exhibits high computational complexity, leading to an efficiency bottleneck in practical applications. Therefore, this study focuses on developing an efficient feature extraction operator capable of accurately identifying effective texture regions in heterogeneous scenes while ensuring a sufficient number of feature points, even distribution, and strong robustness.
Texture constitutes a fundamental visual characteristic that captures homogeneous spatial patterns within an image, representing intrinsic surface properties of objects. This perceptual feature encodes critical structural information about both the spatial organization of surfaces and their contextual relationships with surrounding elements. Image regions demonstrating slow spatial variation or periodic intensity patterns in their local statistics are typically classified as textured areas [
32,
33].
Inspired by the research on texture segmentation in medical images [
34], the LSD emerges as an efficient and computationally lightweight approach for texture characterization. This statistical measure quantifies intensity variations within local image neighborhoods, demonstrating distinct discriminative capabilities: smooth texture regions exhibit minimal intensity fluctuations (yielding low LSD values), while complex textures produce significant variations (resulting in high LSD values). The LSD’s ability to capture these differential patterns enables robust texture classification, forming a critical foundation for advanced image processing tasks including feature extraction, object detection, and segmentation.
For a given image
I, the LSD
within the local neighborhood (
window) of a pixel point
is defined as follows:
where
denotes the floor operation, which extracts the largest integer not greater than the value inside the parentheses.
n is an odd number, representing the size of the sliding window,
denotes the local mean within the
windows, and
denotes the gray-level intensity of the image at coordinate
.
After constructing the LSD texture intensity distribution map for the entire image, the maximum and minimum values are first normalized. Subsequently, a grid-based block partitioning strategy is employed to uniformly divide the image into blocks. Through the dual control of the initial threshold and the dynamic optimization mechanism, a two-stage screening process is performed in each sub-region. First, low-value regions of local standard deviation (e.g., water surfaces and other weak texture regions) are filtered out based on the preset threshold. Then, candidate points that pass the test are sorted in descending order of standard deviation, with the top k maximum value points retained as feature points. This strategy ensures a high capture rate in effective texture regions while suppressing the interference of pseudo-features in weak texture regions, thereby enhancing the quality and robustness of feature points. By enforcing uniform distribution of feature points through a grid-based block approach, it mitigates matching deviations caused by spatial aggregation, ensuring global spatial consistency and registration accuracy, and substantially improves image registration performance in heterogeneous scenes.
Figure 3 illustrates the optical image and its corresponding LSD intensity map. As can be observed from the figure, the prominent regions of the LSD intensity map are predominantly concentrated in the effective texture regions, whereas the response in weak texture regions is relatively subdued. This demonstrates that the LSD features effectively differentiates between weak texture regions and effective texture regions, thereby providing a robust foundation for subsequent feature point extraction.
To verify the effectiveness of the Block-LSD operator, a comparative experiment was conducted with the Block-Harris operator, Block-FAST operator, and Block-WED operator after introducing the block strategy. The results are presented in
Figure 4, while the efficiency comparison is summarized in
Table 1.
The experimental results demonstrate that, compared with the Block-Harris and Block-FAST operators, the feature points extracted by the Block-LSD operator are more uniformly distributed in effective texture regions, effectively avoiding false detection in weak texture regions. Moreover, although the Block-WED operator can also accurately locate feature points in effective texture regions, the Block-LSD operator exhibits significantly higher computational efficiency than the Block-WED operator, thereby showcasing superior performance in both effectiveness and efficiency for feature point extraction.
2.2. Dual-Modal Feature Description
The significant nonlinear radiation differences between optical and SAR images lead to inconsistent gray-level representations of identical ground objects, which may induce gradient inversion phenomena [
35]. In this context, LSD features demonstrate unique advantages due to their statistical nature. As a texture descriptor based on local statistical distributions, LSD achieves gray-value invariance by quantifying pixel intensity dispersion within local regions. This fundamental property provides exceptional robustness against nonlinear radiometric variations between optical and SAR modalities. The descriptor maintains stable statistical characteristics even under contrast stretching or nonlinear transformations. Crucially, by operating independently of gradient direction information, LSD effectively eliminates matching errors caused by gradient inversion, offering a reliable solution for cross-modal image registration challenges.
Although feature point selection deliberately excludes weak-texture regions during extraction, the inherent limitations of template coverage inevitably incorporate portions of these areas. This partial inclusion of low-texture regions creates persistent challenges for completely mitigating their interference with feature descriptors. Importantly, this coverage constraint simultaneously establishes a natural complementarity between gradient and LSD features in multimodal registration, as each feature type compensates for the other’s weaknesses across different texture environments.
As shown in
Figure 5, gradient features, owing to their direction sensitivity and precise geometric edge capture capability, exhibit obvious advantages over LSD features when handling scenes rich in structural features, such as urban building outlines and road networks, and can extract more detailed information. However, when the template includes weak texture regions, factors such as repetitive texture patterns, uniform gray-level distribution, and local noise interference may cause gradient features to produce highly similar responses in these areas, thereby resulting in false matches of corresponding points. In contrast, although LSD features are less effective than gradient features in depicting complex structural features such as urban building contours and road networks, when the template includes weak texture regions, the intensity of LSD features in these regions remains relatively low in both optical and SAR images, thereby effectively avoiding matching interference caused by weak texture regions. This characteristic not only substantially diminishes the risk of false matching but also significantly enhances the reliability of matching by emphasizing the correspondence between effective textures within the region. This complementarity offers theoretical support for constructing a robust multimodal registration framework. By integrating the geometric sensitivity of gradient features with the statistical robustness of LSD features, the fault tolerance and generalization capability of multimodal image registration can be effectively improved.
In the previous section, we introduced the LSD feature using Formula (
1). The following section outlines the process of constructing the gradient feature description in the proposed algorithm. For a given optical image and SAR image, the Sobel operator and ROEWA operator are first employed to compute the directional gradients in the
x-direction and
y-direction for the optical image and SAR image, respectively. Subsequently, the gradient magnitude
and gradient direction
are calculated through Formulas (
3) and (
4).
where
and
respectively denote the directional gradients in the
x-direction and the
y-direction. To mitigate the impact caused by the nonlinear radiation differences between optical images and SAR images, the values in the gradient direction
that fall within the
range are uniformly reduced by
, adjusting the value range of
to
. Next, it is necessary to calculate the angles
and
between the gradient direction
and the left and right feature directions, respectively. The calculation formulas are as follows:
where
denotes the angle interval,
N denotes the number of gradient direction channels, and
denotes the index of the right feature direction for the image pixel, which is utilized for subsequent accelerated matching. Subsequently, the weighted gradient magnitudes
in the left direction and
in the right direction are calculated separately. The corresponding calculation formulas are as follows:
Finally, statistical windows are defined over and to construct feature vectors. These feature vectors are then aligned along the z-axis pixel by pixel and subsequently filtered and normalized via convolution, yielding the gradient feature description of the image.
The LSD feature description
is computed using Formula (
1) and subsequently normalized. By concatenating the two features along the
z-axis, the final feature descriptor
can be obtained.
where ⊕ is concat operator.
2.3. Weighted Normalized Cross-Correlation
Following feature descriptor construction for both template and search regions, the matching process proceeds by evaluating similarity measures between corresponding feature vectors. The matching points in the SAR image are determined through extremum detection on the resulting similarity map. To enhance matching reliability, we propose a confidence evaluation mechanism for assessing extremum point reliability along with a weighted normalized cross-correlation (WNCC) method that incorporates confidence weights into the similarity analysis. This combined approach effectively improves the accuracy of corresponding point identification between optical and SAR imagery. The detailed implementation of the feature matching method is illustrated in
Figure 6.
The calculation formula of the traditional NCC method is presented as follows:
where
and
respectively denote the single-layer feature descriptors of optical image and SAR image,
and
respectively denote the mean values of
and
. Since the Fast Fourier Transform (FFT) technology can significantly improve computational efficiency in the frequency domain [
36], the cross-correlation calculation is therefore implemented in the frequency domain:
where
F denotes the Fourier forward transform,
denotes the Fourier inverse transform, and
denotes the complex conjugate of
F. By identifying the position of the maximum value in the NCC similarity map, the corresponding matching points can be determined. Since the denominator is a constant, the offset
v between the two images can be calculated by the following formula:
However, determining the offset solely based on the position of the maximum point has inherent limitations. As illustrated in
Figure 7, the focusing effect of the similarity map considerably influences the accuracy of the matching results. When the energy concentration of the similarity map is low, its peak distribution becomes more dispersed, which may cause the maximum point to deviate from the true matching point and consequently reduce the registration accuracy. Conversely, a similarity map with superior focusing performance enables the maximum point to more reliably converge toward the true matching point, thereby improving both the reliability and precision of feature matching.
For this purpose, this paper proposes a confidence evaluation model for similarity maps based on the peak side lobe ratio (PSLR) and the integrated side lobe ratio (ISLR). This model draws inspiration from the PSLR and ISLR metrics in the radar point target imaging quality evaluation system [
37], while making adaptive adjustments tailored to the feature matching problem. Specifically, the neighborhood with a fixed radius around the maximum value point in the similarity map is defined as the main lobe region, while the remaining area is considered as the side lobe region. PSLR can effectively characterize whether the similarity map exhibits a significant multi-peak distribution phenomenon by calculating the ratio of the main lobe peak to the side lobe peak. ISLR can reflect the focusing performance of the similarity map through calculating the energy ratio of the main lobe region to the side lobe region. Compared with traditional methods that solely depend on a single peak position, this evaluation system comprehensively takes into account the global characteristics of energy distribution and can more accurately reflect the reliability of the similarity map. The calculation formulas for PSLR, ISLR, and confidence are presented as follows:
where
denotes the peak value of the main lobe,
denotes the peak value of the side lobe,
M denotes the main lobe region,
S denotes the side lobe region, and
denotes the value corresponding to coordinate point
on the similarity map. The product formulation enforces a stringent ‘AND’ condition, requiring simultaneously high PSLR and ISLR values to achieve high confidence. This mathematical relationship naturally embodies the dual requirement that a reliable similarity map must exhibit both localized peak sharpness and global energy concentration, ensuring comprehensive quality assessment. Considering the requirements for numerical stability in energy calculation, the similarity map should be preprocessed with min–max normalization to map its dynamic range to the interval
. Subsequently, the formula for calculating WNCC can be expressed as follows:
Considering that the gradient feature description exhibits a multi-level structure, when calculating its similarity measure, it is essential to extend WNCC into three-dimensional space and perform integrated normalization of confidence values across all levels. This approach ensures both the accuracy and comprehensiveness of the measurement results. The calculation formula for 3D-WNCC based on gradient feature description is presented as follows:
where
denotes the NCC coefficient of the gradient feature description,
denotes the confidence value associated with the gradient feature description. Subsequently, the similarity maps derived from the gradient feature description and those obtained from the LSD feature description are fused with confidence weighting, thereby obtaining a comprehensive weighted fusion feature similarity map. The calculation formula is presented as follows:
Finally, the maximum value point is located on the similarity map , and the coordinates of the matching points are subsequently determined. This feature fusion strategy, which integrates confidence weighting, not only fully exploits the complementary advantages of gradient features and LSD features but also achieves optimal integration of feature responses through a dynamic weight allocation mechanism, thereby substantially enhancing the accuracy and robustness of image registration.
Figure 8 illustrates the comparison of similarity maps generated by various feature description algorithms using the same feature point extraction operator. Through a systematic comparative analysis of these algorithms, it is evident that among the investigated methods, the GDWF algorithm demonstrates superior matching performance. More specifically, compared with other algorithms, the GDWF algorithm achieves the smallest positional deviation for corresponding homonymous points, thereby substantially enhancing the accuracy and reliability of the registration results.
2.4. Outlier Elimination
Following template matching, the corresponding coordinate pairs of homonymous points between the optical image and the SAR image are output. However, some incorrect matching points may still exist among these homonymous point pairs. Consequently, it is essential to conduct the elimination of these incorrect matching points. In this context, the FSC algorithm is utilized to further eliminate the incorrect matching point pairs. The FSC algorithm is an extension of the RANSAC algorithm [
38], and by integrating subset sampling, it not only decreases computational time but also improves robustness.
After eliminating the abnormal points via the FSC algorithm, reliable correct matching point pairs can be obtained. Subsequently, based on these matching point pairs, an accurate geometric transformation model is established using the least squares method, thereby achieving a high-precision image registration result.
3. Results
In this section, we assess the performance of the proposed optical–SAR image registration algorithm. First, we provide detailed information on the datasets utilized in the comparative experiments. Second, we elaborate on the specific performance evaluation metrics adopted and the algorithm parameter configurations selected for this study. Subsequently, we compare and analyze the algorithm’s performance across different ground object scenes and large sample datasets. Finally, we discuss the influence of template size on the algorithm’s performance.
3.1. Datasets
This experiment adopts the SOPatch dataset [
39] as the core experimental data. This dataset is constructed by integrating three sub-datasets: OS-dataset [
40], SEN1-2 [
41], and WHU-SEN-City [
42]. It is characterized by multi-scale coverage and scene diversity, providing a standardized benchmark testing environment for optical–SAR image registration research.
The OS-dataset comprises 2673 pairs of high-resolution optical and SAR images, each with a size of 512 × 512 pixels. These images encompass multiple cities and their surrounding regions worldwide, featuring diverse objects such as buildings, vehicles, and various types of ships. This diversity provides a robust experimental environment for SAR and optical image registration.
The SEN1-2 dataset comprises image data acquired from the Sentinel-1 and Sentinel-2 satellites, including a total of 5428 optical–SAR image pairs. Sentinel-1 is a multi-polarization C-band SAR satellite, while Sentinel-2 is a multispectral optical remote sensing satellite. This dataset features an image resolution of 10 m and covers diverse terrains and seasonal characteristics globally, offering comprehensive data support for investigating optical–SAR image registration across various environments and conditions.
The WHU-SEN-City dataset is also based on the image data from Sentinel-1 and Sentinel-2 satellites but focuses on Chinese cities and their surrounding areas. This dataset encompasses a variety of land cover types, including mountains, lakes, forests, urban buildings, and farmlands, and consists of 1380 optical–SAR image pairs.
To construct a unified and standardized experimental dataset, the SOPatch dataset has been subjected to consistent processing of images from the aforementioned three sub-datasets. First, alignment operations were performed to resample and uniformly resize the images from different sources. Subsequently, the overlapping regions of these images were further resampled and uniformly cropped to a size of 512 × 512 pixels, enabling standardized processing in subsequent experiments. To address potential misalignment issues between image pairs, the RIFT and CFOG algorithms were employed for additional registration of the image pairs.
3.2. Evaluation Criteria and Parameter Setting
In this experiment, the performance of the proposed registration method is evaluated using four indicators: correct matching rate (CMR), root mean square error (RMSE), failure rate (FR), and algorithm time consumption (TIME).
CMR is defined as the ratio of the number of correctly matched points to the total number of matched points. In this experiment, matching points with a Euclidean distance of less than 3 pixels are considered correctly matched points [
43]. That is,
where
denotes the number of correctly matched points, and
N denotes the total number of matching points.
RMSE is an indicator used to measure the accuracy of the algorithm, and its value represents the square root of the average of the transformation errors across all matching point pairs. The calculation formula is presented as follows:
where
represents the coordinates of the matching points on the optical image, and
denotes the position coordinates of the matching points on the SAR image after being transformed onto the optical image by the geometric transformation model
H.
FR serves as an indicator for evaluating the robustness of the algorithm. Specifically, it is calculated as the ratio of the number of image pairs that failed to achieve successful matching to the total number of image pairs considered. In this experiment, registration results with an RMSE value greater than or equal to 10 are defined as matching failures, which can be expressed as follows:
where
is the indicator function, which returns 1 when the condition is true and 0 otherwise, and
M denotes the total number of image pairs for matching. A lower FR value indicates a higher level of robustness in the algorithm.
The running time of the algorithm serves as a critical metric for evaluating its efficiency. A shorter running time generally implies superior algorithmic performance in terms of computational efficiency.
In the experiments of this paper, the number of feature points extracted is set to 200, the size of the local standard deviation calculation window is set to , and the feature point screening threshold is set to 0.1; the angle interval of the gradient feature is set to , and the number of gradient directions N is set to 9; the template window size is set to , and the search window size is set to . The main lobe area is defined as a neighborhood range near the maximum value. Additionally, comparison methods such as MOGF, CFOG, and FED-HOPC all adopt their default optimal parameter configurations. All experiments were conducted on a Lenovo Legion laptop (Lenovo Group Ltd., Beijing, China) equipped with 64GB DDR5 RAM and an Intel Core i7-14700K processor (Intel Corporation, Santa Clara, CA, USA) operating at 3.40 GHz.
3.3. Experimental Results of Different Ground Object Scenes
In this section, six groups of optical–SAR image pairs covering diverse scene types were selected from multiple datasets. Through these experiments, the algorithm proposed in this paper was systematically compared with several state-of-the-art algorithms, including MOGF, CFOG, and FED-HOPC. The detailed information of the selected images is summarized in
Table 2, while the corresponding optical–SAR images are illustrated in
Figure 9. The registration results for these images are presented in
Figure 10, and a comprehensive comparison of various performance metrics is provided in
Figure 11.
As shown in
Figure 10, the GDWF algorithm proposed in this study exhibits superior registration performance when handling typical optical and synthetic aperture radar (SAR) heterogeneous image registration scenarios, such as urban building clusters, farmlands, and port areas. Through visual analysis of the checkerboard mosaic images, it is evident that in all scenarios, the boundaries of ground objects remain highly continuous, and the texture transitions are smooth and natural, with no noticeable misalignment or breakage.
From a quantitative analysis perspective, as shown in
Figure 11, the experimental results clearly demonstrate that the GDWF algorithm achieves the highest registration accuracy across six typical scenarios of optical and SAR registration tasks. Specifically, in port and coastal scenes, this algorithm attains sub-pixel registration accuracy (with RMSE values of 0.69 and 0.87, respectively), representing an improvement of up to 62.3% compared to the second-best algorithm. In high-complexity scenes such as urban areas and building clusters, the GDWF algorithm maintains a significant performance advantage, with RMSE improvements ranging from 7.0% to 28.6%. Additionally, the GDWF algorithm achieves the highest CMR metric values across all scenarios, with an average CMR of 86.8%, representing a 9.7% to 25.3% improvement compared to competing algorithms. Notably, it achieves perfect matching (CMR = 100%) in farmland and port scenes. Although its computational time (on average 1.59 s) is slightly longer than that of the MOGF and CFOG algorithms, it is 72.7% faster than the FED-HOPC algorithm. By integrating an innovative feature weighting mechanism, the GDWF algorithm achieves superior registration performance across these scenarios, thereby providing stable and reliable technical support for multi-scenario remote sensing applications.
3.4. Performance Evaluation Based on Large Sample Data
In this section, to comprehensively and thoroughly evaluate the robustness and registration accuracy of the proposed method, a multidimensional comparative experimental scheme is designed. The specific experimental settings are as follows: 2000 pairs of optical–SAR images are randomly selected from the OS-dataset; a similar number of samples are selected from the SEN1-2 dataset at the same scale; and 1000 pairs of images are chosen from the WHU-SEN-CITY dataset to evaluate performance in complex scenarios. On the basis of constructing a complete test set, the proposed method in this paper is systematically compared and analyzed with the current mainstream advanced algorithms such as MOGF, CFOG, and FED-HOPC. The experiment adopts a multidimensional evaluation system, measures the robustness of the algorithm through the FR index, and statistically calculates the three key indicators of RMSE, CMR, and TIME in the case of successful matching. The final comparison results are detailed in
Table 3.
As shown in
Table 3, this study systematically demonstrated the comprehensive performance advantages of the GDWF algorithm in terms of robustness, matching accuracy, and operational efficiency via multidimensional comparative experiments. Specifically, in terms of robustness, the GDWF algorithm achieved FR values of 1.2% and 1.5% on the OS-dataset and SEN1-2 datasets, respectively, which were 21.1–69.6% and 30–60% lower than those of the comparison algorithms. On the WHU-SEN-City dataset, its FR value was 2.5%, matching the performance of the best comparison algorithm, thereby fully demonstrating its strong adaptability to complex scenarios. In terms of matching accuracy, the GDWF algorithm demonstrated significant dual-index synergy advantages: on the OS-dataset, its RMSE value was 2.557, which was 8.9%, 16.6%, and 34.4% lower than those of MOGF, CFOG, and FED-HOPC, respectively; simultaneously, its CMR value reached 73.3%, significantly exceeding other algorithms by 4.5–20.7 percentage points, thereby achieving a dual breakthrough in error control and the number of effective matches. On the SEN1-2 dataset, the GDWF algorithm achieved a sub-pixel RMSE value of 0.752 (9.0% better than the second-best MOGF) and a near-saturation CMR value of 97.9%, further validating its high-precision characteristics in remote sensing image matching. On the WHU-SEN-City dataset, the GDWF algorithm maintained its superiority, with an RMSE value of 3.025, which was 2.9–8.6% lower than that of the comparison algorithms, and a CMR value of 57.5%, which was 0.8–4.1% higher than that of the comparison algorithms. In terms of algorithm efficiency, although the GDWF algorithm consumed slightly more time than MOGF and CFOG, it still maintained a speed advantage of more than three times over FED-HOPC, thereby demonstrating its excellent balance between accuracy and efficiency. Overall, the GDWF algorithm not only achieves high matching accuracy and efficient operation but also exhibits strong robustness in complex environments, making it the algorithm with the best comprehensive performance.
5. Conclusions
This paper proposes a robust optical–SAR image registration algorithm named GDWF, which innovatively addresses the limitations of traditional gradient feature methods in heterogeneous image matching via a dual-feature adaptive fusion strategy. The algorithm combines the strengths of gradient features and local standard deviation features, dynamically optimizing their contribution weights through a reliability evaluation model of the similarity measurement map. This significantly enhances both the robustness and registration accuracy of the registration algorithm.
In the experiments, the Block-LSD feature point extraction operator proposed in this paper efficiently extracts feature points in effective texture regions, demonstrating superior performance in both the effectiveness and computational efficiency of feature point extraction. Meanwhile, the proposed registration algorithm exhibits the best robustness and registration accuracy across tests on different ground object scene types (including urban building clusters, farmlands, ports, etc.) and multiple public datasets.
Although the experimental results demonstrate that the algorithm proposed in this paper outperforms current mainstream methods in terms of performance, several limitations remain that require further investigation. First, as an area-based image registration method, this algorithm, similar to others in its category, lacks scale and rotation invariance. This limitation will be addressed in subsequent research by incorporating multi-scale feature pyramids and rotation-invariant feature descriptors. Second, in mountainous terrain with significant elevation changes, the geometric distortion caused by terrain undulations may exceed the compensation capability of the current algorithm, resulting in registration failure. To overcome this challenge, we plan to integrate Digital Elevation Model (DEM) data in future work and develop a three-dimensional geometric correction model to mitigate registration errors induced by elevation differences. These improvement directions will constitute the focus of future research to enhance the adaptability and robustness of the algorithm in complex scenarios.


