Article

WHU-RS19 ABZSL: An Attribute-Based Dataset for Remote Sensing Image Understanding

1
Department of Agricultural, Food and Environmental Sciences (D3A), Università Politecnica delle Marche, 60131 Ancona, Italy
2
Department of Political Sciences, Communication and International Relations, University of Macerata, 62100 Macerata, Italy
3
Department of Construction, Civil Engineering and Architecture (DICEA), Università Politecnica delle Marche, 60131 Ancona, Italy
*
Author to whom correspondence should be addressed.
Remote Sens. 2025, 17(14), 2384; https://doi.org/10.3390/rs17142384
Submission received: 7 May 2025 / Revised: 5 July 2025 / Accepted: 8 July 2025 / Published: 10 July 2025
(This article belongs to the Special Issue Remote Sensing Datasets and 3D Visualization of Geospatial Big Data)

Abstract

The advancement of artificial intelligence (AI) in remote sensing (RS) increasingly depends on datasets that offer rich and structured supervision beyond traditional scene-level labels. Although existing benchmarks for aerial scene classification have facilitated progress in this area, their reliance on single-class annotations restricts their application to more flexible, interpretable and generalisable learning frameworks. In this study, we introduce WHU-RS19 ABZSL: an attribute-based extension of the widely adopted WHU-RS19 dataset. This new version comprises 1005 high-resolution aerial images across 19 scene categories, each annotated with a vector of 38 features. These cover objects (e.g., roads and trees), geometric patterns (e.g., lines and curves) and dominant colours (e.g., green and blue), and are defined through expert-guided annotation protocols. To demonstrate the value of the dataset, we conduct baseline experiments using deep learning models that had been adapted for multi-label classification—ResNet18, VGG16, InceptionV3, EfficientNet and ViT-B/16—designed to capture the semantic complexity characteristic of real-world aerial scenes. The results, which are measured in terms of macro F1-score, range from 0.7385 for ResNet18 to 0.7608 for EfficientNet-B0. In particular, EfficientNet-B0 and ViT-B/16 are the top performers in terms of the overall macro F1-score and consistency across attributes, while all models show a consistent decline in performance for infrequent or visually ambiguous categories. This confirms that it is feasible to accurately predict semantic attributes in complex scenes. By enriching a standard benchmark with detailed, image-level semantic supervision, WHU-RS19 ABZSL supports a variety of downstream applications, including multi-label classification, explainable AI, semantic retrieval, and attribute-based ZSL. It thus provides a reusable, compact resource for advancing the semantic understanding of remote sensing and multimodal AI.

1. Introduction

In recent years, remote sensing (RS) has played a pivotal role in areas such as environmental monitoring, urban development, and disaster management [1,2,3,4,5,6,7]. The proliferation of high-resolution aerial and satellite imagery, coupled with advances in computational resources and machine learning algorithms, has enabled significant advances in tasks such as land use classification, object detection, scene recognition, and change detection [8,9,10]. One of the most impactful developments has been the application of deep learning to RS imagery, where Convolutional Neural Networks (CNNs) and transformer-based models have demonstrated exceptional performance in supervised learning tasks [11,12]. These achievements have been greatly aided by the availability of public datasets, which allow researchers to train and benchmark models under standardised conditions. While class-labelled datasets have served the community well for traditional supervised learning tasks, they are not sufficient to address new challenges in artificial intelligence (AI) for RS. In the recent literature, semantic attributes (or semantically defined attributes) have proven highly effective as intermediate representations for visual understanding tasks that involve complex or unseen categories. For instance, Lampert et al. [13] demonstrated that attribute-based learning enables classification in zero-shot settings by bridging visual data with semantic attributes, while Xian et al. [14] showed that attributes support robust generalisation in low-data regimes. In the context of remote sensing, where scenes often contain multiple overlapping features (e.g., roads, vegetation, and water bodies), attributes allow models to recognise diverse elements within the same image. This attribute-centric perspective facilitates tasks such as explainable AI (XAI), multi-label classification, and Zero-Shot Learning (ZSL), where traditional class-level labels are often too coarse or insufficiently informative. As the field moves towards more interpretable, transferable, and flexible learning paradigms, there is a growing demand for datasets that provide richer forms of supervision. In particular, tasks such as multi-label classification, XAI, multimodal learning and ZSL benefit greatly from richer supervision. XAI involves techniques that enable models to justify and explain their predictions in a way that is understandable to humans. Multimodal learning involves integrating information from different data types, such as imagery and text, to improve model generalisation. ZSL enables models to classify new categories that they have not seen before by using semantic descriptions or attributes rather than relying only on visual examples during training. For example, multi-label prediction models benefit from the availability of semantic descriptors that can capture the presence of multiple visual elements within a single scene. Similarly, in XAI, interpretable features, such as the identification of objects, textures or geometric structures, can be used to justify and analyse model decisions. In multimodal learning, such features act as bridges between visual and linguistic representations. Perhaps most notably, ZSL relies heavily on the presence of semantically defined attributes to enable classification of unseen classes based on their descriptions. However, the field of RS still lacks datasets that deliver semantic-level supervision, especially at the image level. Existing datasets in the ZSL literature, such as AwA2 and SUN [14], provide class-level attribute vectors, meaning that each class is associated with a fixed set of semantic features. While this approach is effective in some domains, it fails to capture the rich intra-class variation that is typical of RS imagery, where scenes belonging to the same class can differ significantly in terms of composition, colours, textures, and visible structures. This lack of granularity limits the ability of models to generalise and understand fine distinctions, ultimately limiting the scope of research that can be conducted with these datasets. A commonly adopted benchmark in aerial scene classification is the WHU-RS19 dataset [15], which consists of 1005 images extracted from Google Earth. These images are evenly distributed across 19 scene classes, such as airport, forest, harbour and residential areas. Each image has a resolution of 600 × 600 pixels, and the dataset is designed to ensure a balanced class distribution, low intra-class variance, and high inter-class variability. These characteristics make WHU-RS19 an ideal dataset for testing a wide range of classification models and architectures. However, despite its popularity, the dataset, like most in the RS domain, provides only class-level labels, limiting its utility for more complex or semantically rich tasks that require deeper image understanding.
Building on these observations, this paper introduces a new dataset which overcomes the limitations of conventional scene-level annotation in remote sensing. This is achieved by enriching the WHU-RS19 dataset with detailed, image-level semantic supervision. This new dataset, named WHU-RS19 ABZSL (Attribute-Based Zero-Shot Learning), was developed through collaborative annotation by trained remote sensing experts from the University of Macerata and the Polytechnic University of Marche. The annotation process began in March 2024 and was completed by the end of May 2024. Six annotators, all experts in geographic information systems, independently labelled each image. This was followed by a consensus-based validation phase to ensure consistency and accuracy. A comprehensive set of 38 binary attributes covering three semantic categories—objects (e.g., roads, bridges, trees, and buildings), geometric patterns (e.g., rectangles, curves, and lines), and dominant colours (e.g., green, beige, blue, and grey)—is used to describe each of the 1005 images in the dataset. Although this annotation effort was originally intended to support attribute-based ZSL experiments, the resulting WHU-RS19 ABZSL dataset is designed to be applicable to a wide range of AI and RS tasks. By providing fine-grained, image-level semantic descriptors, the dataset enables research into intra-class variability, the evaluation of interpretable models, the prediction of multiple semantic labels, the learning of semantic embeddings, and other tasks requiring structured supervision. Compact and easy to process yet semantically rich and well balanced, the WHU-RS19 ABZSL dataset serves as a strong prototyping benchmark for deep learning applications in RS. Each image is linked to a binary vector of 38 attributes, enabling learning approaches that move beyond conventional scene classification. To demonstrate its value, we present baseline experimental results using state-of-the-art deep learning architectures: ResNet18 [16], VGG16 [17], InceptionV3 [18], EfficientNet [19] and ViT-B/16 [20] trained and evaluated on the multi-attribute classification task. Our experiments provide quantitative insights into the capabilities of convolutional and transformer-based architectures when evaluated under fine-grained, attribute-level supervision. By predicting attributes rather than classes, models can better handle complex scenes where multiple elements coexist, a typical situation in RS imagery.
Our contributions can be summarised as follows:
  • We introduce WHU-RS19 ABZSL, the first version of the WHU-RS19 dataset to include fine-grained, expert-annotated image-level semantic attributes, enabling support for complex tasks such as XAI, ZSL, and multi-label classification in RS.
  • We design a semantically diverse attribute taxonomy composed of 38 binary attributes grouped into Objects, Geometric Patterns, and Dominant Colours, offering interpretable, structured descriptions of remote sensing scenes.
  • We establish a rigorous multi-stage annotation and validation pipeline involving trained annotators and remote sensing experts to ensure the consistency, reliability, and interpretability of the annotations.
  • We provide a set of baseline experimental results using both CNN-based (e.g., ResNet18, VGG16, InceptionV3, and EfficientNet) and Transformer-based (ViT-B/16) architectures for multi-attribute classification, demonstrating the applicability of the dataset for modern deep learning pipelines.
  • We release a reusable and accessible benchmark for researchers in AI and RS, designed to support future work on interpretable, transferable, and multimodal learning in RS.
In the context of RS, attribute classification is crucial for improving the semantic understanding of complex aerial scenes [21,22,23]. Unlike traditional single-label classification, attribute-based annotation can identify multiple co-occurring elements, such as infrastructure, vegetation, bodies of water, and geometric structures, within a single image. This level of detail is particularly valuable for subsequent tasks such as fine-grained land use mapping, XAI, content-based retrieval and zero-shot classification. By explicitly modelling the presence of interpretable visual features, attribute classification facilitates the development of more flexible, transparent, and generalisable AI systems for RS applications.
The paper is structured as follows. Section 2 reviews related work on RS datasets and the role of semantic attributes in AI, including literature from the fields of multi-label learning, ZSL, and explainable models. Section 3 describes the construction of the WHU-RS19 ABZSL dataset, including the design of the attribute schema, the expert annotation protocol, and a summary of the dataset’s composition. Section 4 presents baseline experiments on attribute classification using several deep learning models, and reports the per-attribute and overall performance metrics. In Section 5, we analyse the outcomes in the context of RS tasks and highlight the relevance of attribute-level annotations. Finally, Section 6 summarises the main contributions and outlines directions for future research, including plans for dataset expansion and applications in multimodal and ZSL settings.

2. Related Works

The rapid growth of RS as a key technology in environmental and geospatial applications has led to the development of numerous datasets tailored to different computer vision tasks. In this section, we review the existing datasets that have contributed significantly to the advancement of RS-based AI. We divide this review into three thematic subsections: (i) large-scale RS datasets supporting scene classification and land cover analysis (Section 2.1), (ii) datasets for object recognition in aerial imagery (Section 2.2), and (iii) datasets developed for RS image annotation and vision language research (Section 2.3). For each category, we highlight the scope, strengths, and limitations of existing resources, particularly with respect to their suitability for tasks involving semantic-level understanding, multi-label annotation, or ZSL.

2.1. Large-Scale Remote Sensing Datasets

In recent years, a variety of RS datasets have been introduced for general computer vision tasks. Many of these datasets are structured around the classification of scenes or image patches. For example, the UC Merced Land Use (UCM) [24] and BigEarthNet [25] datasets support land cover classification with 21 and 43 different categories, respectively. Other datasets such as AID [26], Million-AID [27], RESISC45 [28], and the Functional Map of the World (FMoW) [29] extend this by including categories that include man-made infrastructure such as bridges, airstrips, and train stations-up to 63 classification categories. However, only a handful of datasets address more complex tasks beyond basic classification. For example, DOTA [30] focuses on object detection over 18 categories, ranging from helicopters to roundabouts. Similarly, iSAID [31] aims at instance segmentation across 15 defined classes. Despite their contributions, these datasets typically share several limitations: they focus on single-label predictions, are often limited to single-image inputs, and provide a relatively narrow range of categories. As a result, they provide limited support for models that aim to learn from spatio-temporal context or that require diverse label structures.
Some specialised datasets attempt to address these limitations. For example, xView3 [32] is tailored to detect vessels and infer their attributes (such as type and length) from SAR imagery, supporting both detection and regression tasks. PASTIS-R [33] enables the panoptic segmentation of agricultural crops using multi-temporal satellite data from Sentinel-1 and Sentinel-2, combining both SAR and optical modalities. In addition, datasets from the IEEE Data Fusion competition contribute high-resolution imagery to land cover segmentation and related challenges [34]. SATLASPRETRAIN extends the scope with a richer annotation scheme, covering 137 categories across seven different label types, and incorporates image sequences over time, allowing models to learn temporal dynamics and achieve greater predictive accuracy [35].

2.2. Datasets for Object Recognition in Remote Sensing Images

RS imagery, typically acquired from a top–down perspective using sensors with varying spatial resolutions, presents unique challenges for object detection. These include a wide range of object scales and arbitrary orientations, which make accurate detection and classification difficult. To address these issues and promote progress in aerial object detection, several specialised datasets have been introduced. One of the earlier datasets, NWPU VHR-10 [36], contains 10 types of geospatial objects in 715 high-resolution images from Google Earth. Despite its usefulness, its relatively modest size, only 3775 object annotations, limits its effectiveness for training robust recognition models.
The HRRSD dataset [37] provides a broader range, with over 55,000 instances across 13 object categories. The images in HRRSD are taken from both Google Earth and Baidu Maps, and range in resolution from 0.15 to 1.2 metres. However, each image is small in size ( 227 × 227 pixels), which limits the utility of the dataset for tasks involving large scenes or high spatial variability. To further increase the size and diversity of the dataset, the DIOR dataset [38] was introduced, which contains over 23,000 images and nearly 192,000 instances across 20 object classes. However, DIOR’s use of horizontal bounding boxes (HBBs) makes it less suitable for detecting arbitrarily oriented objects, which are common in aerial imagery. In contrast, the DOTA dataset [30] addresses this limitation by using oriented bounding boxes (OBBs), which better capture the angles and shapes of real-world objects. It contains 15 categories and over 188,000 annotations distributed across 2806 images collected from different platforms, and have resolutions ranging from 800 to 4000 × 4000 pixels. Due to its comprehensive design, DOTA has become a standard benchmark in the field.
Other datasets focus on more specific detection tasks. For example, the RSOD dataset [39] targets four categories, overpasses, oil tanks, airplanes and playgrounds, across 976 images with spatial resolutions between 0.3 and 3 m, resulting in 6950 annotations. Similarly, the UCAS-AOD dataset [40] is divided into aircraft and vehicle subsets, comprising 600 and 310 images, respectively, with a total of over 6000 annotated instances. Datasets such as COWC [41] specialise in single-category detection; for example, COWC is dedicated exclusively to car detection and contains approximately 32,700 instances. LEVIR [42] covers three classes, aircraft, ships, and oil tanks, spread over 21,900 images and annotated with around 11,000 bounding boxes. These images, which are 600 × 800 pixels in size, were acquired from Google Earth and vary in resolution from 0.2 to 1 m. For building detection, several datasets are noteworthy: the SemCity Toulouse dataset [43], the ISPRS benchmark for urban object detection and 3D reconstruction [44], the Inria Aerial Image Labelling dataset [45], and the DeepGlobe 2018 dataset [46]. While useful, these resources typically focus on broad classifications and lack the granularity needed to distinguish between fine-grained geospatial object subtypes.

2.3. Remote Sensing Image Captioning Dataset

The act of creating textual descriptions for RS images, known as image captioning, has gained momentum with the introduction of several specialised datasets. Pioneers in this field include UCM-Captions [47] and Sydney-Captions, which were developed using the UCM dataset [24] and the Sydney dataset [48], respectively. UCM-Captions consists of 2100 aerial images paired with 10,500 captions, while Sydney-Captions provides 613 annotated images and a total of 3065 captions.
Building on this foundation, later datasets such as RSICD [49] and NWPU-Captions [50] introduced a greater variety of scenes and significantly more image–caption pairs. RSICD includes 10,921 images annotated with 54,605 captions, but only about 24,333 of these captions are unique. NWPU-Captions scales this effort further with 31,500 images and 157,500 captions. In both datasets, each image is associated with five short textual descriptions. However, the captions tend to be similar in structure and vocabulary, typically providing only a high-level summary of visible features without delving into more nuanced scene characteristics.
A more recent development in this area is the introduction of RS5M [51], a large-scale multimodal dataset containing five million image–text pairs. RS5M was compiled by filtering RS-related content from large open datasets such as LAION400M [52] and CC3 [53], and using the BLIP2 model [54] to automatically generate captions. While RS5M represents a significant step towards expanding vision language research in RS, its reliance on machine-generated captions introduces limitations. In contrast, the RSICaps dataset offers significant improvements. Instead of relying on automated captioning systems, RSICaps uses expert human annotators to provide high-quality, manually curated textual descriptions. Human-generated annotations tend to be more accurate and contextual, capturing subtle details that current annotation models often miss. For example, while advanced models such as BLIP2 struggle to infer seasonal cues from leaf colour, a human can easily identify autumn based on visual patterns such as yellowing leaves.
In addition to captioning datasets, recent multimodal resources such as RSICD [49], BigEarthNet-MM [55] and RS5M [56] have made significant strides in offering fine-grained or multimodal supervision for RS imagery. For example, BigEarthNet-MM builds upon BigEarthNet by incorporating multimodal inputs (e.g., Sentinel-1 and Sentinel-2) and multi-label annotations. RSICD combines image-level captions with standard classification labels, and RS5M uses large-scale weak supervision through machine-generated text. However, these datasets either lack structured, image-level semantic attributes, or rely on automated annotation methods. The RS5M dataset [56] was constructed using image data from open-access sources, such as LAION400M, and was filtered using RS-related keywords. The captions are automatically generated using large vision language models such as BLIP2. While RS5M has proven valuable for training multimodal models, its reliance on machine-generated captions introduces potential semantic noise and inconsistencies that could affect the interpretability of downstream applications. By contrast, RSICaps [57] offers a smaller, higher-quality dataset in which each image is annotated with human-generated textual descriptions by domain experts. These annotations capture finer scene details and contextual cues that are often missed by automated systems, such as seasonal variations or subtle object arrangements. RSICaps is particularly well-suited to grounded vision-language alignment and supports tasks such as RS captioning and content-based retrieval. However, neither RSICaps nor RS5M provides structured, image-level, binary semantic attributes, which are essential for tasks such as attribute-based zero-shot learning, multi-label classification and explainable scene understanding.
Despite the wide range of datasets available for scene classification, object detection, and image annotation in RS, most existing resources fall short in one or more critical areas. Many are limited to single label annotations, provide only class-level monitoring, or lack the semantic granularity required for tasks such as XAI or zero-shot classification. The captioning of datasets has introduced a vision language dimension, but often relies on high-level textual descriptions or automated annotations that lack precision. The WHU-RS19 ABZSL dataset provides expert-annotated binary attributes covering objects, colours, and geometric structures. These attributes are explicitly suited to tasks such as zero-shot classification and explainable AI, and offer interpretable supervision. Consequently, our work complements these benchmarks by introducing a dataset that emphasises structured, human-defined, attribute-level semantics.
To the best of our knowledge, no existing dataset provides expert-generated, image-level semantic attributes that comprehensively describe the visual, structural, and colour-based elements of RS scenes. Our proposed WHU-RS19 ABZSL dataset directly addresses this gap by enriching a well-established RS benchmark with fine-grained, manually annotated features. In doing so, it supports a broader set of AI tasks, including multi-label classification, visual-semantic alignment, and attribute-based ZSL, that remain underexplored in the RS domain. While several existing datasets provide high-level or multimodal annotations, such as RS5M [51], BigEarthNet-MM [55], and SATLASPRETRAIN [35], these efforts typically rely on weak supervision (e.g., machine-generated text or auto-labelling pipelines) or offer only coarse-grained or task-specific semantic tags (e.g., vessel type or land cover category). In contrast, WHU-RS19 ABZSL is distinctive in its use of expert-generated, image-level semantic attribute vectors that encode interpretable object types, geometric patterns, and dominant colours. These annotations are not derived from class-level assumptions or Natural Language Processing (NLP) models but are systematically designed to support generalisation and interpretability across tasks such as multi-label learning, XAI, and attribute-based zero-shot classification. To contextualise the contribution of WHU-RS19 ABZSL, Table 1 offers a comparison with several prominent RS benchmarks that include semantic or attribute-style information.

3. Materials and Methods

This section outlines the methodological framework adopted for dataset creation, including image collection and pre-processing, semantic attribute category design, annotation protocol, and dataset characteristics. We also describe the strategy used to split the dataset to support standardised training and evaluation procedures.

3.1. Image Collection and Pre-Processing

To build the WHU-RS19 ABZSL dataset, we use the well-established WHU-RS19 dataset [15], which was originally designed for scene classification in RS applications. The images in WHU-RS19 were collected using Google Earth, ensuring access to high-resolution, globally distributed aerial scenes covering a wide range of geographical and infrastructural environments. Each image in the dataset is standardised to a resolution of 600 × 600 pixels and belongs to 1 of 19 scene categories, including natural environments (e.g., forest, river, and mountain), urban infrastructure (e.g., residential, commercial, and parking) and transport hubs (e.g., airport, port, and railway station). We carefully construct the dataset to minimise intra-class variance and maximise inter-class diversity, ensuring a balanced and representative sample for classification tasks. Table 2 summarises the distribution of images per class in the WHU-RS19 dataset. Although the original images are already of high quality, several pre-processing steps are applied to ensure consistency and to prepare them for semantic attribute annotation and deep learning experiments. First, all images are converted to a uniform RGB format and checked for artefacts, distortions, or irrelevant overlays. The original authors removed images with poor visual quality, such as those affected by excessive cloud cover or compression noise, during the initial dataset creation process. Therefore we focus our annotation efforts only on clean, interpretable examples. To improve visual consistency and model compatibility, we resize all images to the appropriate input dimensions required by each deep learning architecture (e.g., 224 × 224 for ResNet, VGG16, EfficientNet, and ViT; 299 × 299 for InceptionV3). Images are converted to RGB format (if not already in RGB), and normalised using the standard ImageNet pre-processing scheme: pixel values are scaled to [0, 1], then normalised using mean = [0.485, 0.456, 0.406] and standard deviation = [0.229, 0.224, 0.225] per channel. These standardisation parameters ensure compatibility with models pretrained on ImageNet and are critical for effective transfer learning. No other spectral enhancements or data augmentations are applied prior to training. No further geometric or spectral enhancement is applied prior to annotation in order to preserve the semantic fidelity of the scenes as perceived by human annotators.

3.2. Category Design

Most existing RS datasets emphasise broad scene-level categories or static object types (e.g., bridges, parks, or buildings), without providing detailed semantic breakdowns within individual images. Such coarse-grained labels fail to capture the complexity and variability typical of aerial scenes, especially when aiming at tasks such as attribute-based ZSL, interpretability, or multimodal analysis. In WHU-RS19 ABZSL, we address this gap by introducing a comprehensive set of 38 image-level attributes grouped into three semantically meaningful categories: Objects, Geometric Patterns, and Dominant Colours.
The Objects category contains 19 attributes and covers both natural and man-made elements commonly observed in aerial scenes. These include typically found infrastructure (e.g., roads, bridges, and buildings), transportation elements (e.g., aircraft, road vehicles, water vehicles, and trains), and landscape features (e.g., trees, terrain, meadow, mountains, water, and sand). The selection of object types is driven by their recurrence across the 19 classes in the original WHU-RS19 dataset and their visual discriminability from a top–down perspective. These object-level annotations are critical for supporting interpretable model decisions and enabling fine-grained scene understanding.
The Geometric Pattern category includes 11 attributes representing abstract visual structures found in aerial imagery, such as rectangles, triangles, lines, curves, and closed curves. These geometric features are particularly valuable for interpreting the structural layout of scenes and understanding how man-made and natural elements are arranged spatially. For example, straight lines and rectangles often indicate man-made structures, while organic curves may correspond to rivers, terrain or forest boundaries. Such features are very useful in XAI environments, where the semantic justification of model predictions is required.
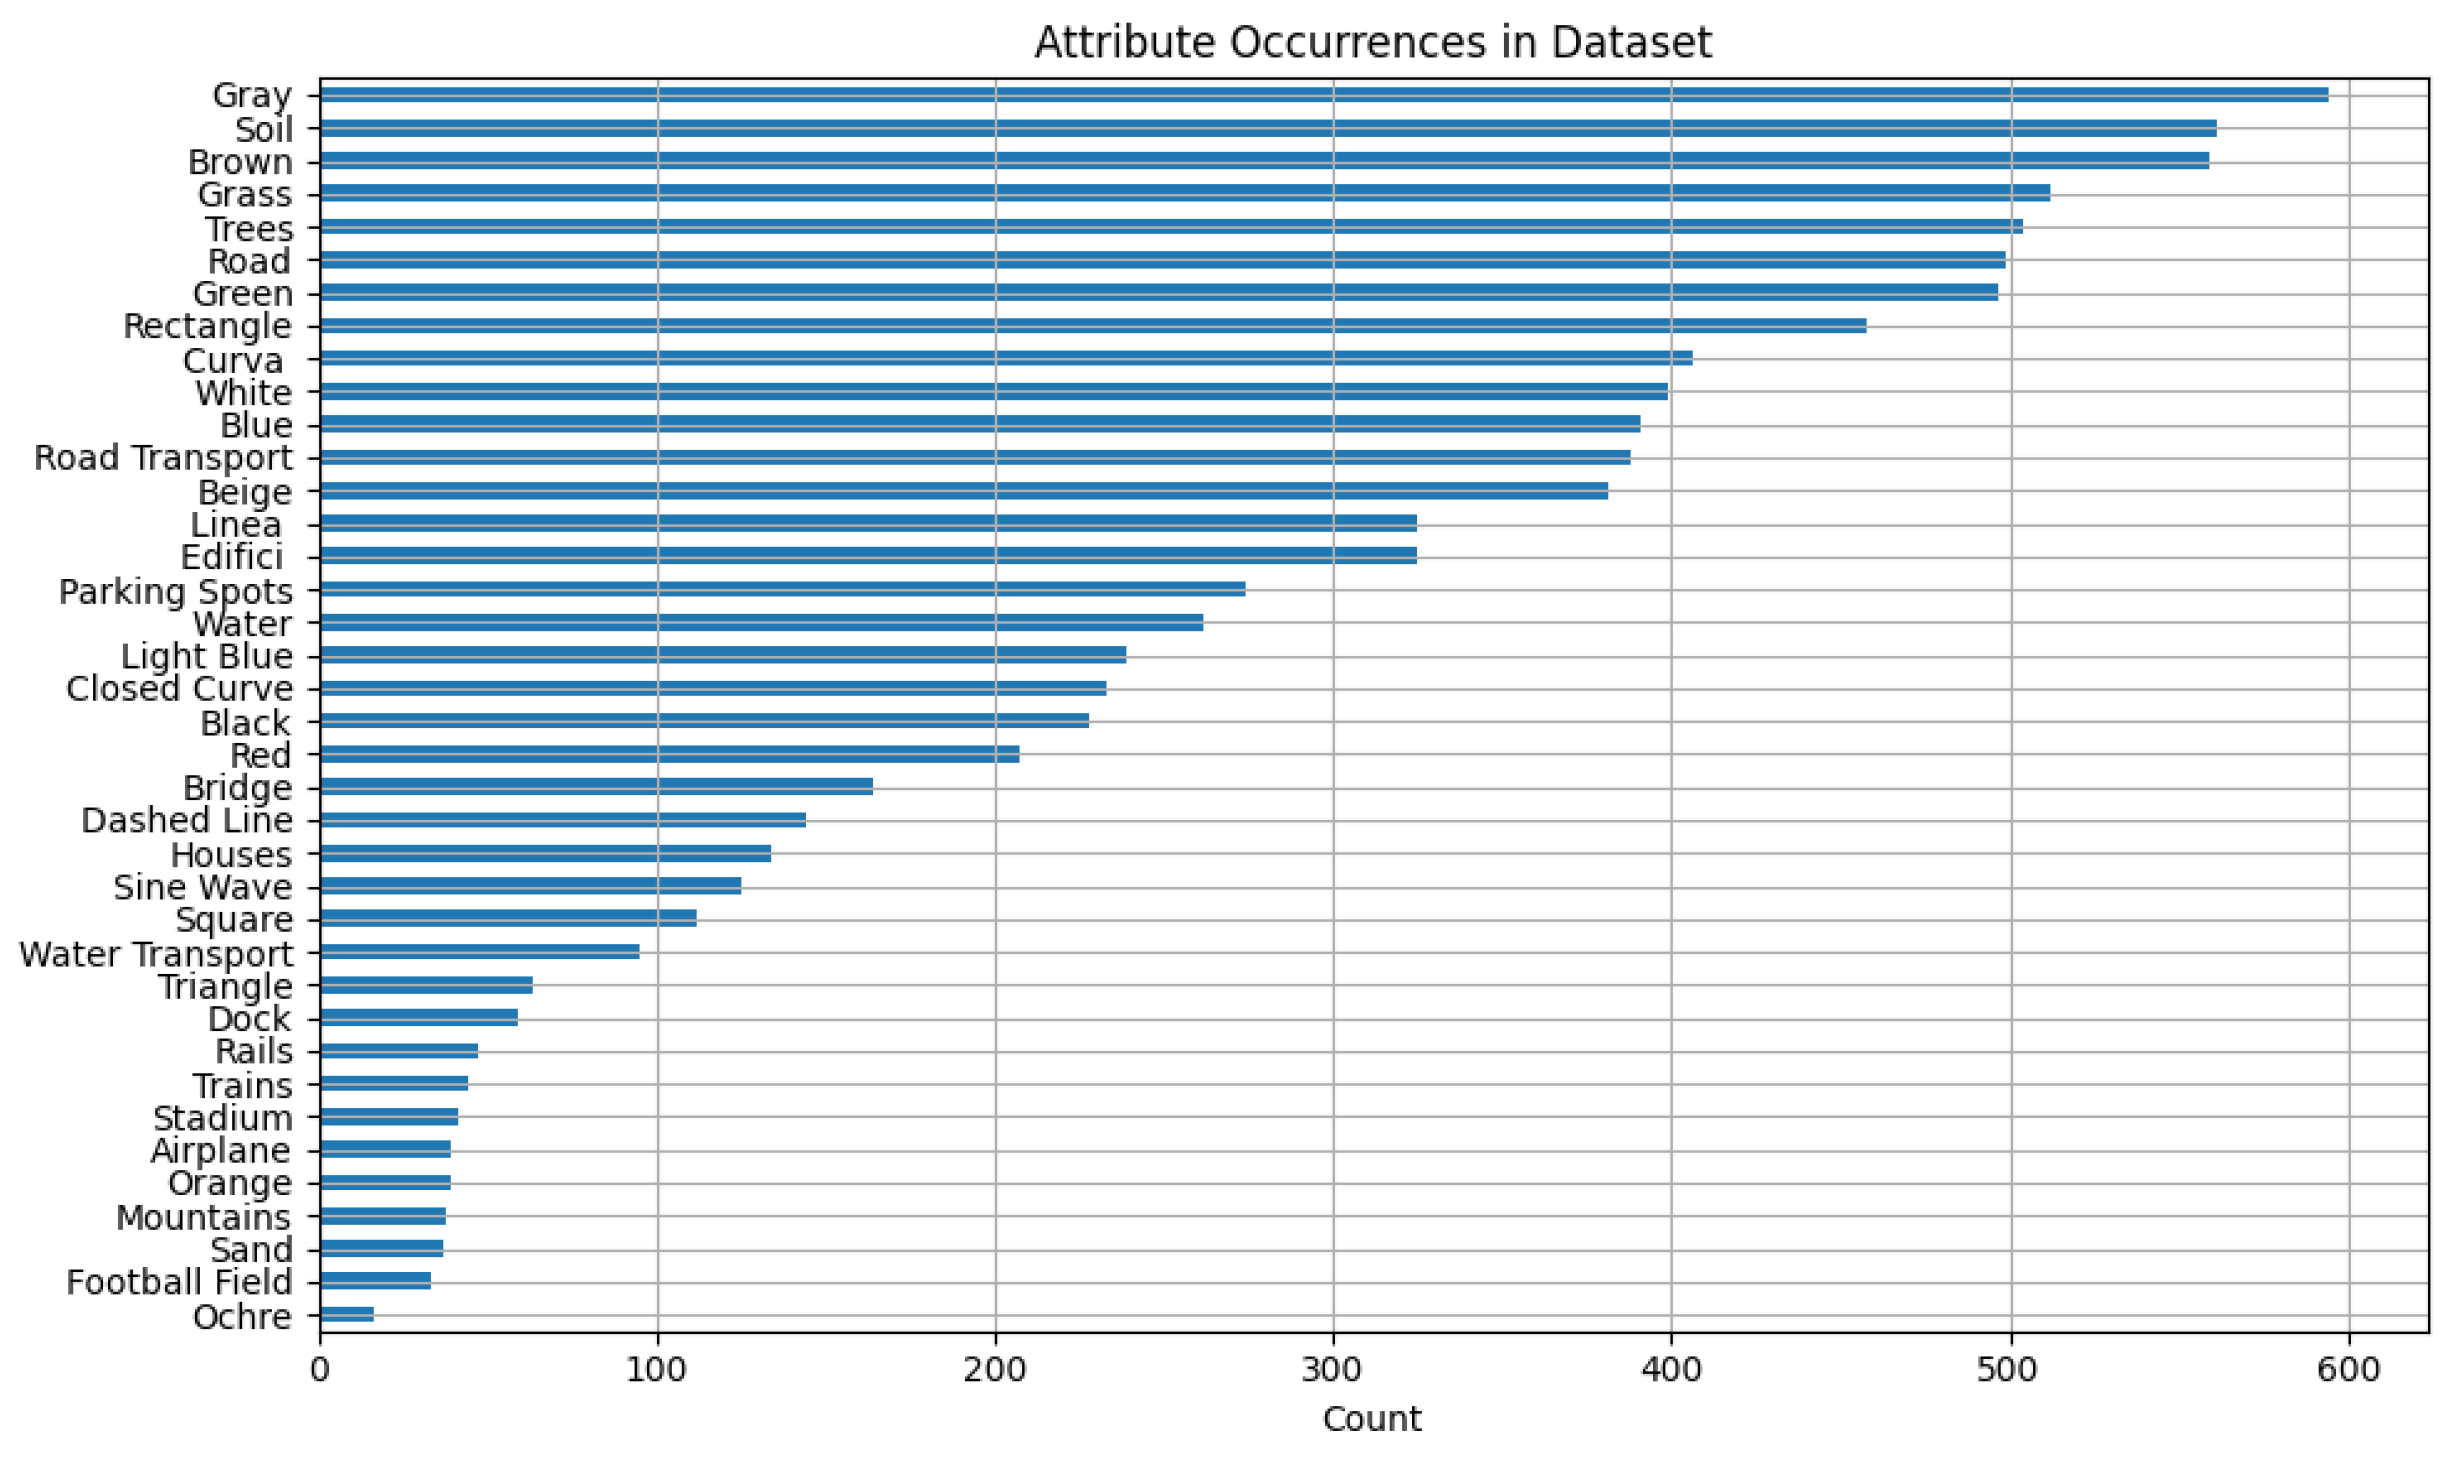
Finally, the Dominant Colour category includes eight key colours that are commonly found in aerial scenes: red, orange, ochre, beige, green, light blue, blue, brown, grey, white, and black. These colours are selected based on visual surveys of the dataset and are useful not only for improving zero-shot generalisation through semantic embedding but also for scene characterisation (e.g., distinguishing vegetation from urban areas, or identifying seasonal cues such as autumn foliage). In contrast to RGB pixel distributions, dominant colour annotations reflect human-perceived scene composition and are useful for vision language alignment. Overall, our attribute set is designed to be compact yet expressive, allowing for the detailed yet manageable annotation of the 1005 images in WHU-RS19. These categories are selected in collaboration with RS experts and refined through iterative pilot annotations. Each image in WHU-RS19 ABZSL is annotated with a binary presence/absence vector across the 38 attributes, resulting in a highly structured and interpretable representation of the scene content. This attribute taxonomy lays the foundation for novel experimental scenarios in RS, particularly attribute-based ZSL, where unseen scene classes need to be predicted based on semantic descriptions. In contrast to the existing class-level attribute datasets (e.g., AwA2 or SUN), our fine-grained image-level annotations allow intra-class variability analysis and support a wide range of tasks, including semantic embedding learning, content-based retrieval, and explainable classification.
The selection of the 38 semantic attributes is the result of a hybrid strategy combining expert elicitation, domain-specific literature review, and visual inspection of the dataset. Initially, a broad set of candidate attributes was proposed by domain experts in remote sensing from the University of Macerata and the Polytechnic University of Marche, based on their relevance in aerial scene interpretation and their visual distinguishability at the given resolution. This list was further refined through an iterative process that included pilot annotations, internal feedback rounds, and removal of ambiguous or redundant terms. Particular emphasis was placed on selecting attributes that are (i) semantically meaningful across multiple scene categories, (ii) interpretable by both humans and machine learning models, and (iii) useful for tasks such as XAI, ZSL, and visual–semantic alignment. By grounding attribute selection in both expert knowledge and empirical image analysis, we can ensure that the final set is both representative and practically useful for downstream applications.
The grouping of attributes into Objects, Geometric Patterns, and Dominant Colours is designed to balance visual discriminability, human annotator consistency, and semantic relevance for downstream tasks. These categories reflect three core types of visual information typically used in human scene interpretation: what is present (objects), how it is arranged (geometry), and what it looks like (colour). Other potential categories, such as texture, vegetation index (NDVI), or elevation, are not considered due to limitations in the input data. WHU-RS19 provides only 2D RGB imagery, and thus lacks the spectral or topographic information needed to derive vegetation indices or elevation models. Additionally, texture is a low-level visual pattern that is difficult to annotate consistently by humans and is better handled through learned feature extraction. Our taxonomy is therefore intentionally aligned with perceptually accessible features, enabling reliable, interpretable, and reproducible human annotation across the entire dataset.

3.3. Image Annotation

The annotation process produces a comprehensive, structured, semantic representation of each image in the WHU-RS19 ABZSL dataset. By combining object-level, geometric, and colour-based attributes, the dataset enables learning scenarios that go beyond traditional scene classification. Below, we describe the dataset’s overall characteristics, emphasising its diversity, semantic richness, and potential to support a wide range of AI tasks in RS.

3.3.1. Annotation Format

The WHU-RS19 ABZSL dataset uses an attribute-based, image-level annotation strategy. Each of the 1005 images in the WHU-RS19 dataset is annotated with a binary vector of 38 descriptors, which are grouped into three main categories: Objects, Geometric Patterns, and Dominant Colours. These annotations offer a simplified yet semantically rich description of scene content, facilitating interpretable and explainable ZSL experiments. Each attribute is marked as 1 if it is visibly present in the image, or 0 otherwise. The initial design of the attribute space includes 40 labels, which are later reduced to 26, and finally consolidated into 8 grouped macro-attributes for more robust and interpretable classification performance. These 8 macro-attributes are Transportation, Infrastructure, Buildings, Sports Structures, Water Elements, Land Elements, Polygons, and Curved Shapes. This grouping is guided by semantic affinity and practical observations during annotation. Attributes that exhibit high variability or ambiguity, such as fine-grained colours and complex shapes, are excluded during refinement. 
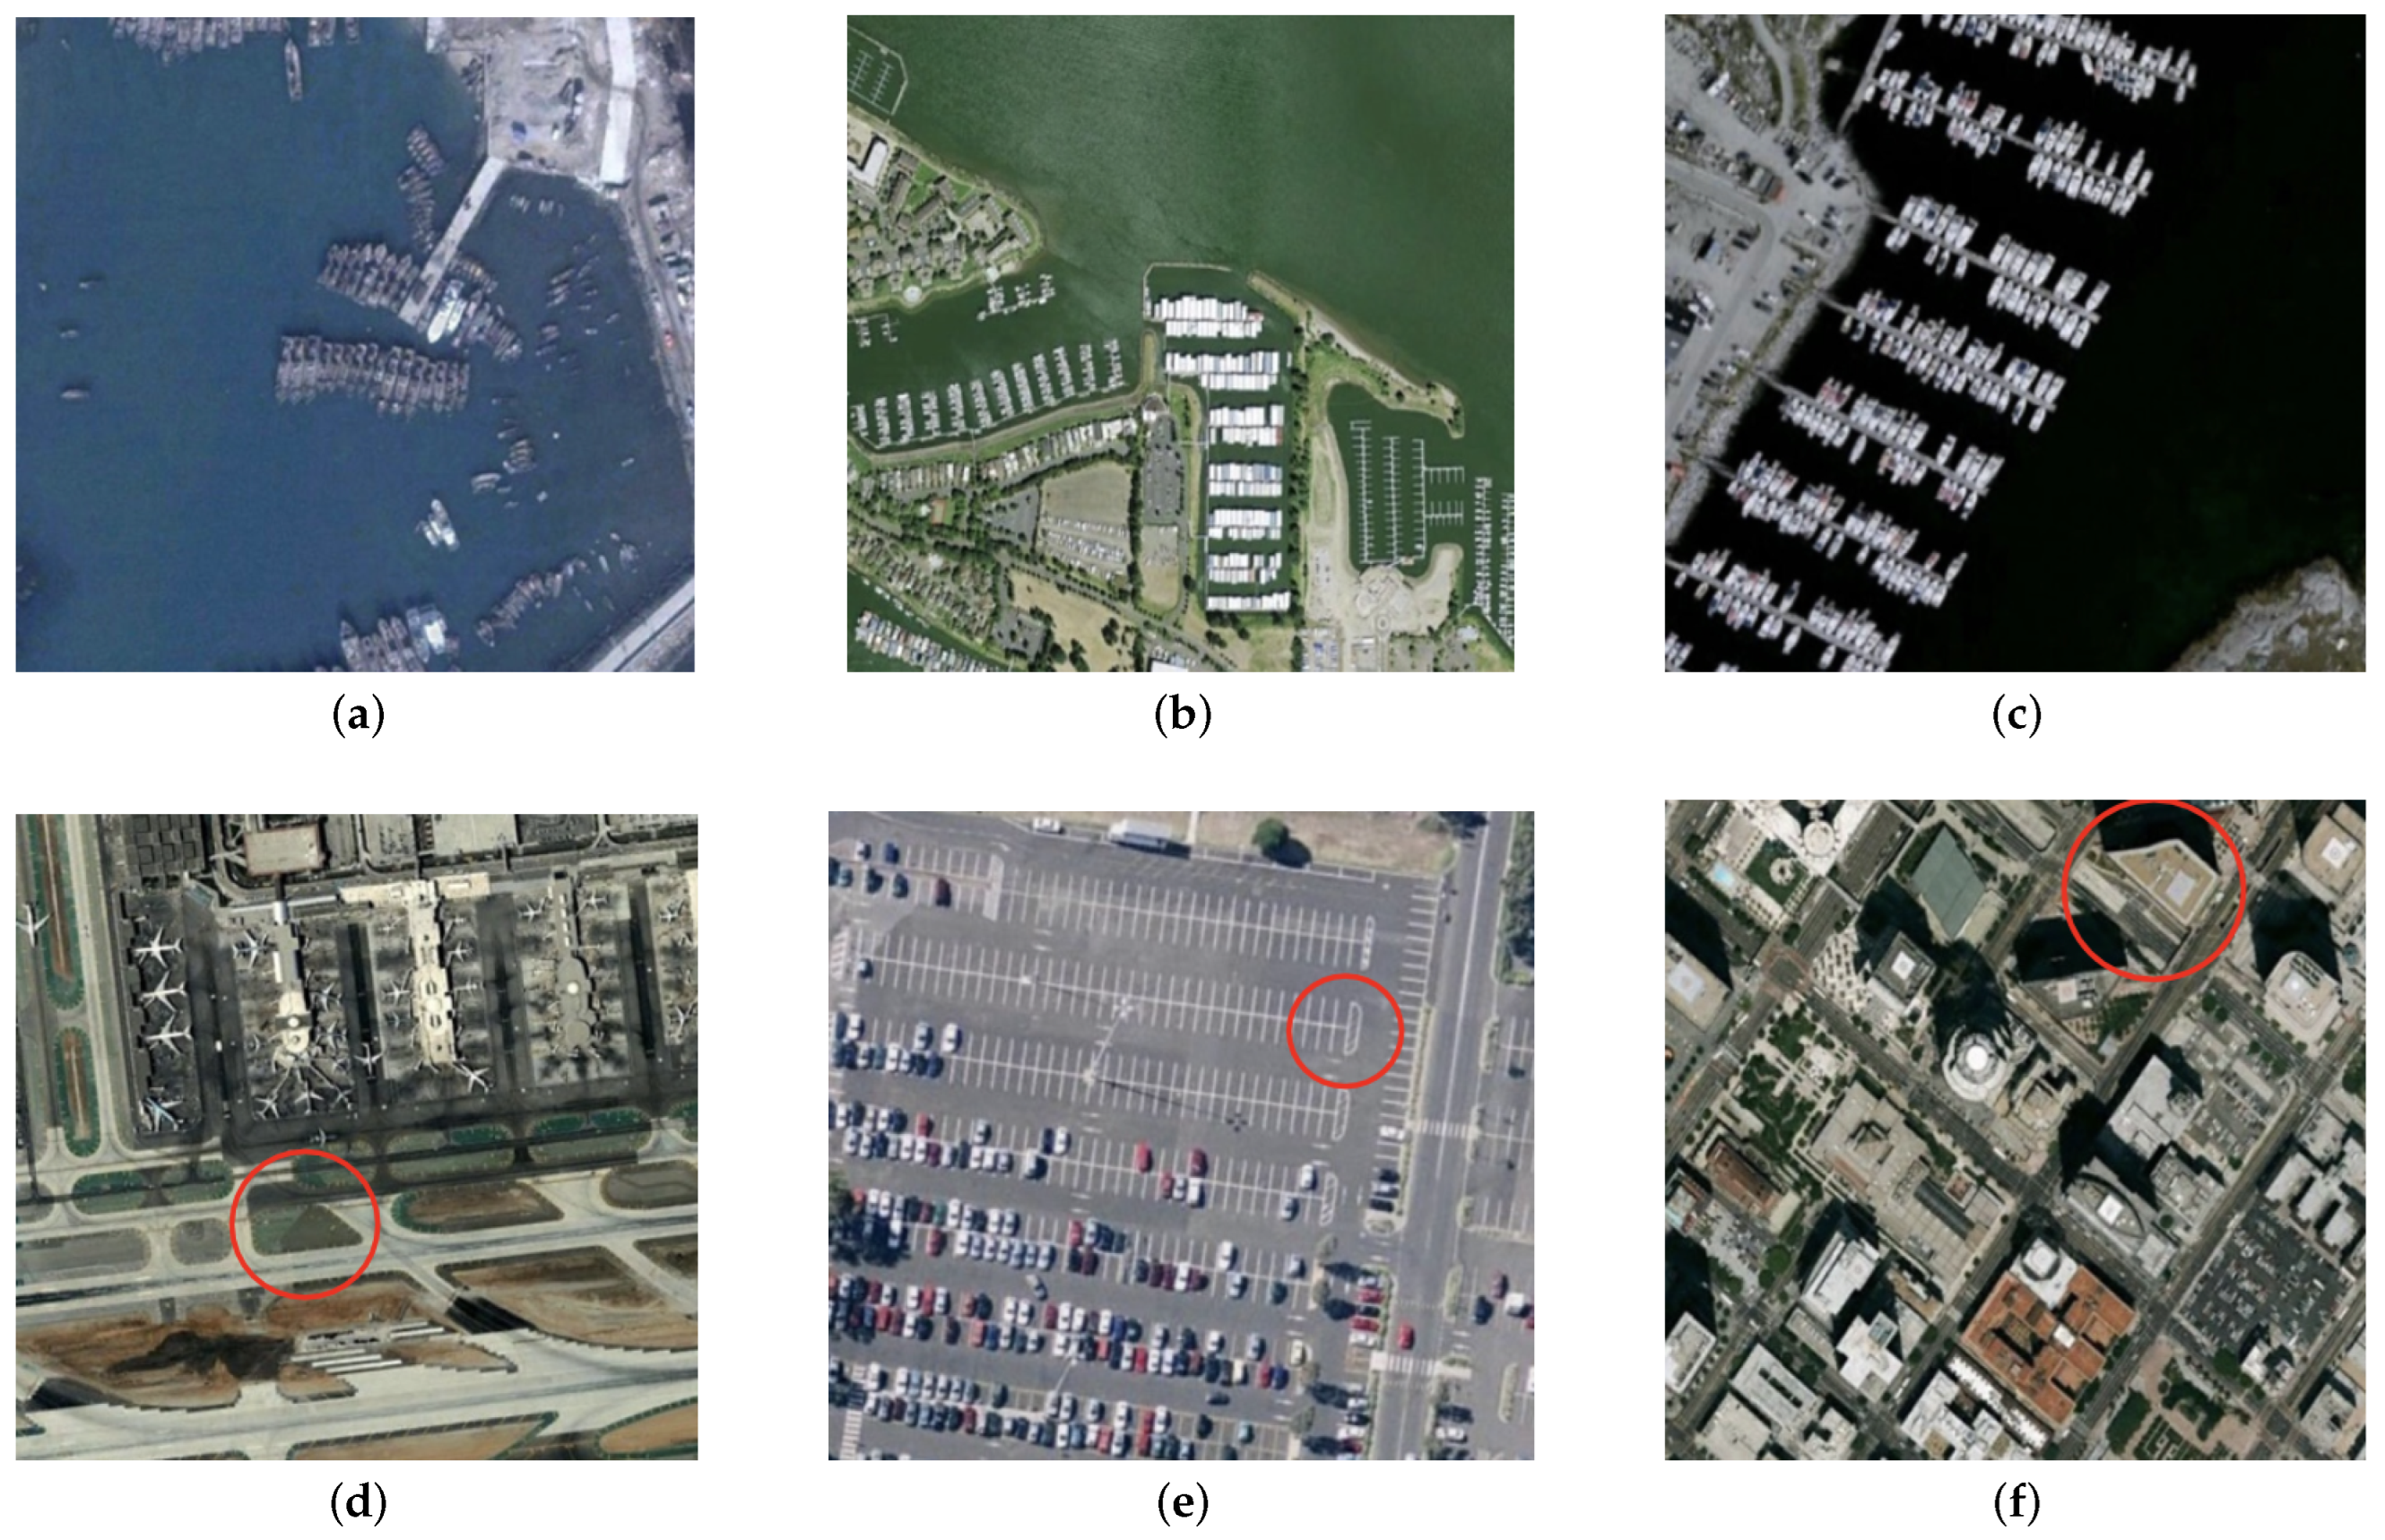
Figure 1 shows an example of this evolution, displaying three sample images from the Port class alongside their attribute annotations. These illustrate the level of detail and challenge involved in attribute classification, especially under varying lighting, resolution, and scene complexity conditions.
During the annotation process, particular attention is paid to reduce mislabelling and semantic ambiguity. Duplicate or corrupted images are removed to minimise potential misclassification due to redundancy. After cleaning, the dataset consists of 1005 unique, high-quality annotated samples.

3.3.2. Annotation Quality

A rigorous multi-stage quality control process is established to ensure the high quality and reliability of the annotations. After collecting the initial annotations, we design a three-stage verification and correction pipeline to ensure their consistency and accuracy. In the first stage, annotators are randomly paired, and each annotator is tasked with independently re-annotating the images assigned to the other. Following this cross-validation step, the paired annotators collaborate to merge their respective annotations, resolving discrepancies to produce a more accurate and reliable result. In the second step, a dedicated supervisor conducts an in-depth review of the merged annotations. The supervisor systematically examines key annotation attributes, including exact locations, category labels, and bounding box orientation, to ensure they meet the predefined standards and guidelines. Finally, in the third stage, domain experts specialising in RS imagery perform a final quality assessment. These experts conduct a comprehensive review of the dataset, validating both individual annotations and the overall dataset consistency. This multi-stage quality assurance process is critical in achieving a high-quality dataset suitable for robust downstream applications.

3.3.3. Attribute Refinement and Grouping

During the initial design phase, we define a set of 40 image-level attributes spanning various semantic concepts. Through iterative annotation trials and expert feedback, we refine this list to 26 by eliminating ambiguous or infrequently occurring attributes. Finally, to facilitate interpretable classification and multi-task evaluation, we group the remaining attributes into eight macro-attributes based on semantic similarity and co-occurrence patterns. Table 3 presents the full list of original attributes, indicates their final status (retained, removed, or merged), and provides the reasons behind each decision.

3.4. Characteristics of the Dataset

As mentioned above, numerous datasets have been developed in the field of RS for scene classification tasks. However, many existing datasets have certain limitations, such as a limited number of categories, limited intra-class variability, and category selections that do not fully meet the needs of real-world applications. These shortcomings can hinder the development and generalisation of classification models based on remotely sensed images. In this study, we use the WHU-RS19 dataset, a widely recognised dataset for RS image classification. WHU-RS19 contains a wide range of scenes acquired from satellite imagery, providing a solid foundation for the evaluation and training of classification models. After pre-processing to remove duplicate images, the final dataset consists of 1005 images distributed across 19 different categories. To enrich the dataset and better understand the complexity of the images, an extensive attribute-based characterisation is performed. The main features of WHU-RS19 ABZSL dataset are outlined below:
  • Wide Diversity of Scene Categories: The dataset includes 19 different scene types, such as airports, ports, business parks, rivers, and deserts. These categories are chosen to cover a wide range of real-world environments, offering significant variation in structural layouts, textures, and natural or man-made elements. This diversity provides a valuable challenge to the scene classification algorithms.
  • Attribute Annotation: To enhance the dataset beyond simple scene labels, detailed semantic annotation is performed. Initially, 40 attributes are manually assigned to each image, taking into account elements such as landscape features (e.g., water, terrain, and vegetation), dominant colours and geometric patterns. This attribute-based description allows for a deeper semantic representation of the images.
  • Attribute Reduction for Improved Efficiency: Given the complexity associated with a large number of attributes, a progressive attribute reduction strategy is applied. First, the number of attributes is reduced from 40 to 26 by eliminating redundant or overly vague features. Further grouping then results in a final set of eight core attributes grouped by semantic similarity (e.g., infrastructure, transport, and land elements). This process helps to retain essential information while optimising model performance and interoperability.
  • Presence of Multi-scale and Complex Visual Patterns: The images in WHU-RS19 show objects and landscape features at multiple scales and under varying conditions. Variations in spatial resolution, viewing angle, and seasonal factors add significant complexity to the dataset, requiring robust generalisation capabilities from classification models.
  • Visual Ambiguities and Classification Challenges: Several scenes have strong visual ambiguities. For example, rivers and roads in satellite imagery can appear visually similar depending on the context, and harbours and car parks often have repeating geometric structures. These challenges highlight the real-world difficulty of RS classification and underscore the need for models capable of sophisticated feature extraction.
The WHU-RS19 ABZSL dataset therefore provides not only a benchmark for traditional scene classification but also a foundation for advancing multi-label, explainable, and ZSL research in RS.

3.5. Inter-Annotator Agreement and Label Validation

The quality of the RS attribute annotations is evaluated based on the performance of deep learning models in relation to human-labelled data. The annotation process follows a consistent three-step protocol defined by RS domain experts, who applied a fixed set of rules to identify the presence or absence of 38 semantic attributes in aerial scenes. While the complexity of the task naturally introduces an element of subjectivity, rigorous annotation guidelines helped to ensure consistency. In order to quantitatively assess the reliability of the annotation process, we evaluate the degree of agreement between the ground truth annotations and the model predictions. The following statistical metrics are used for this evaluation:
  • Cohen’s Kappa coefficient ( κ ): a statistical measure of inter-rater agreement that corrects for chance. It ranges from −1 to 1, where κ = 1 denotes perfect agreement and κ < 0 indicates disagreement [58].
  • Kendall’s Tau coefficient ( τ ): used to assess ordinal association between two ranked variables. A value of τ = 1 indicates perfect agreement in ranking, τ = 0 denotes independence, and τ = 1 reflects inverse ranking [59].
  • Opposition Ratio (O): the proportion of samples for which the model prediction directly contradicts the ground truth, i.e., one assigns an attribute and the other does not.

3.6. Dataset Splits

For the experiments conducted in this study, we split the WHU-RS19 ABZSL dataset into training and testing subsets to enable model development, validation and evaluation. Following standard machine learning practices, we adopt a split ratio of 70–30% between the training and testing sets. Table 2 reports the number of images per category and the corresponding train/test split. The splitting strategy is carefully designed to maintain a balanced and representative distribution of images across all categories in both subsets. This balanced partitioning allows the models to learn robust and transferable features from a wide range of real-world environments, including airports, harbours, deserts, rivers, residential areas, and more. It also ensures that no particular class dominates the training or testing phases, promoting the fair evaluation of model performance across all scene types. In addition to the scene labels, each image in both subsets is annotated with 38 detailed features covering objects, colours and geometric patterns. We use these multi-label annotations in our experiments to train and evaluate deep learning models within a multi-attribute classification framework.

3.7. Algorithm Analysis

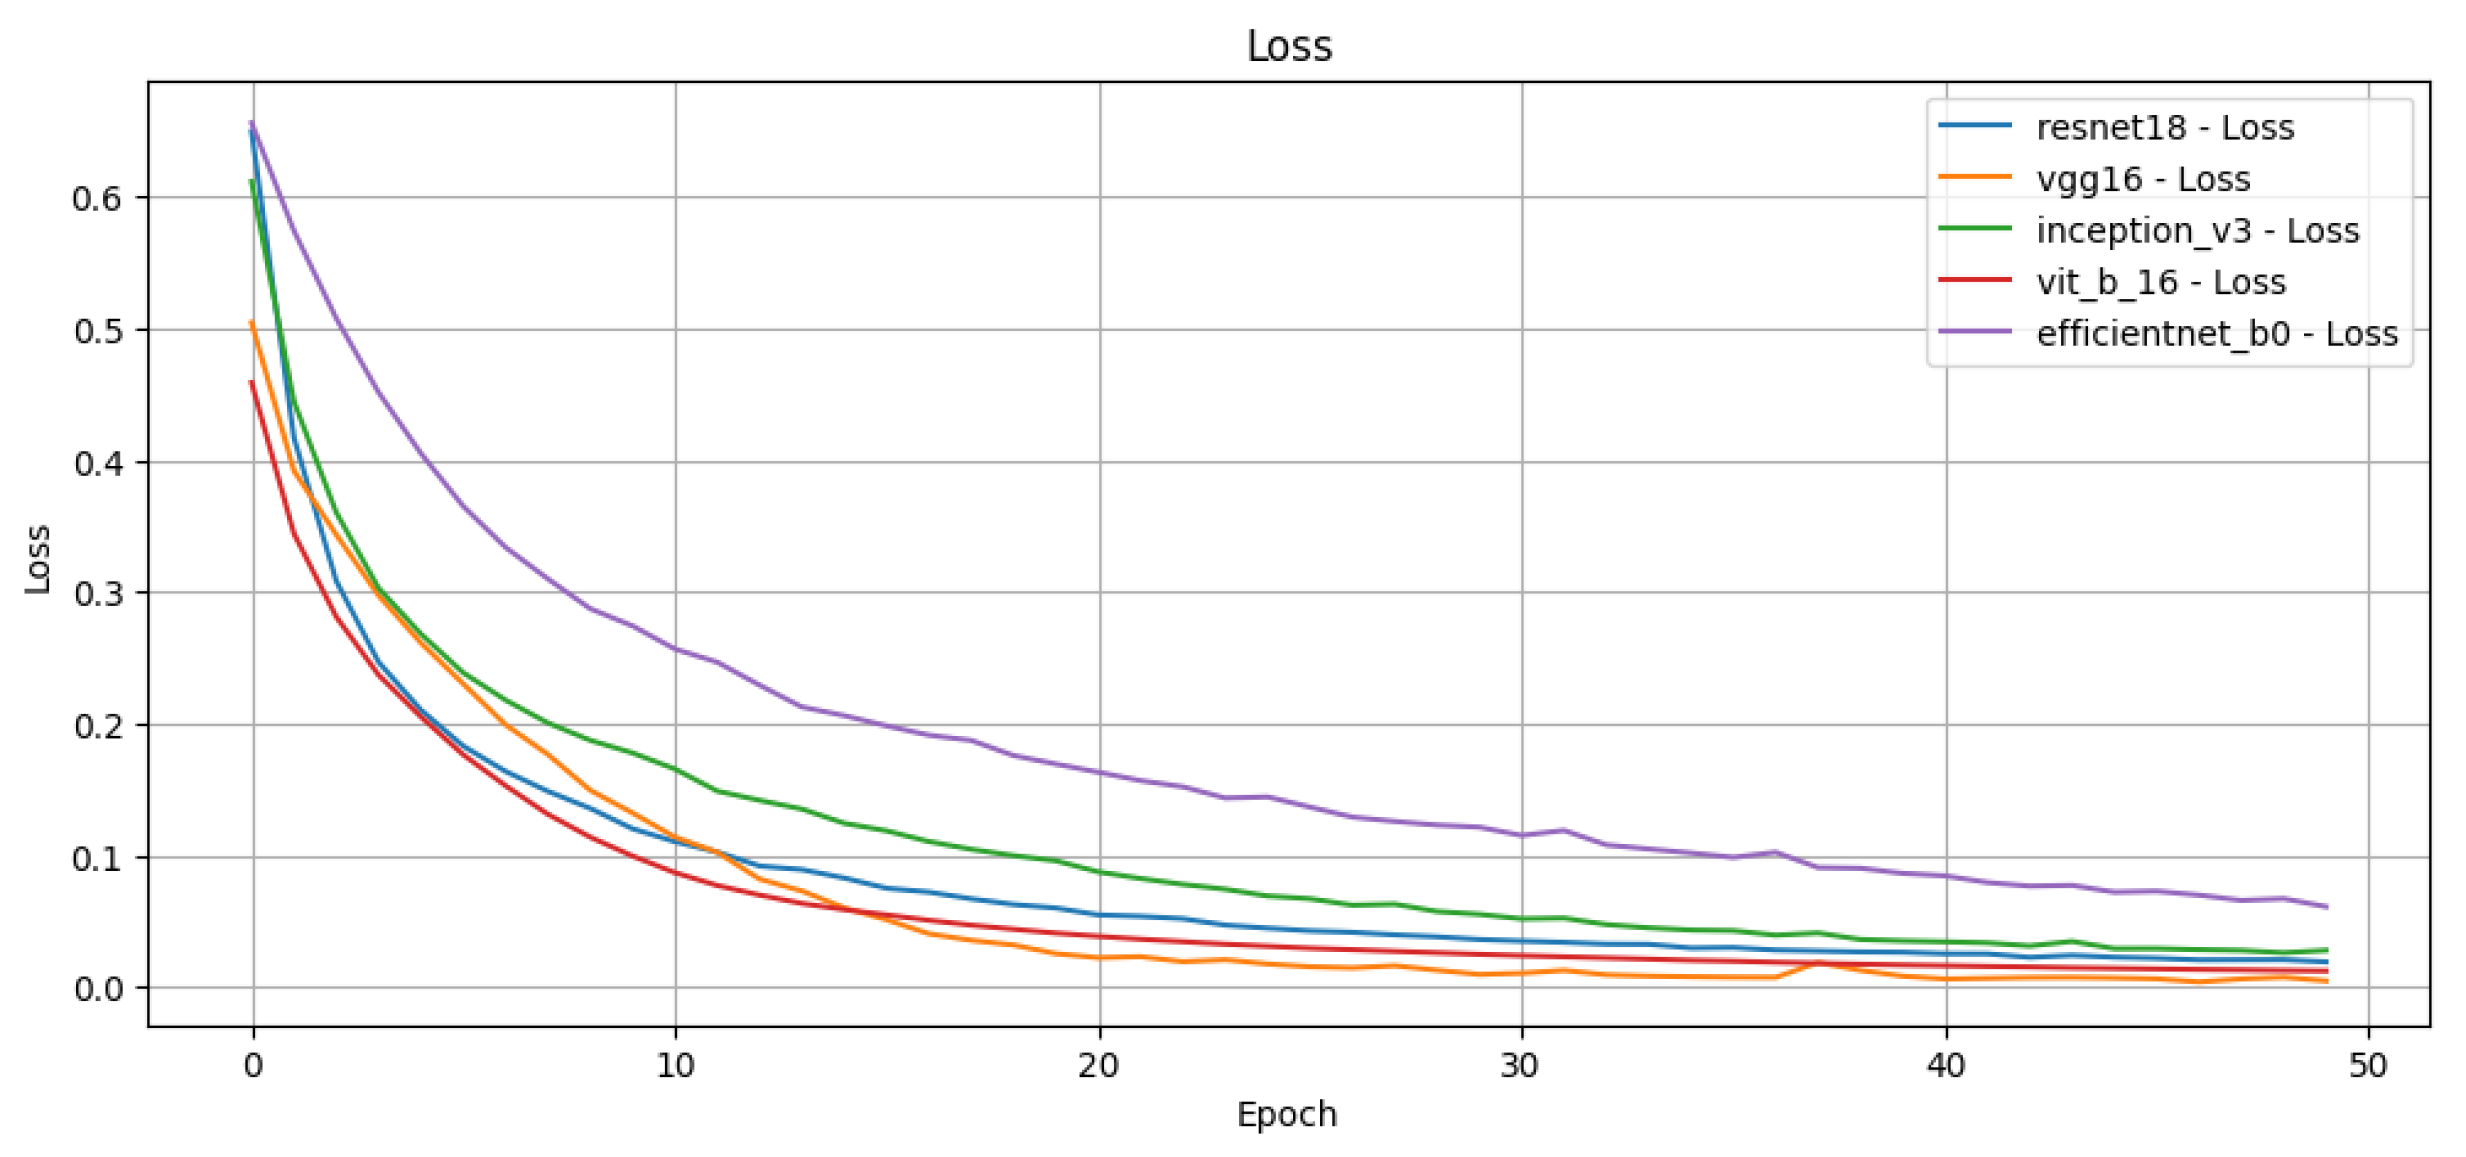
In this study, we evaluate several CNNs and Transformer-based architectures to perform multi-label attribute classification on the WHU-RS19 ABZSL dataset. The selected models are as follows:
  • ResNet-18 [16]—a residual network with 18 layers, known for its efficient skip connections.
  • VGG-16 [17]—a deep convolutional network using sequential small convolutional kernels.
  • InceptionV3 [18]—a network based on inception modules designed for computational efficiency.
  • EfficientNet-B0 [19]—a lightweight and scalable CNN that balances network depth, width, and resolution through compound scaling, achieving high accuracy with fewer parameters.
  • Vision Transformer (ViT) [20]—a Transformer-based architecture that processes images as sequences of patches.
We initialize all models using pretrained weights from ImageNet [60] to take advantage of transfer learning. The fully connected classification layers are modified to match the number of target attributes (multi-label setup), using a final sigmoid activation function to predict multiple labels simultaneously. The training procedure is kept homogeneous across the models to ensure a fair comparison. The main hyperparameters used for training are summarised in Table 4.
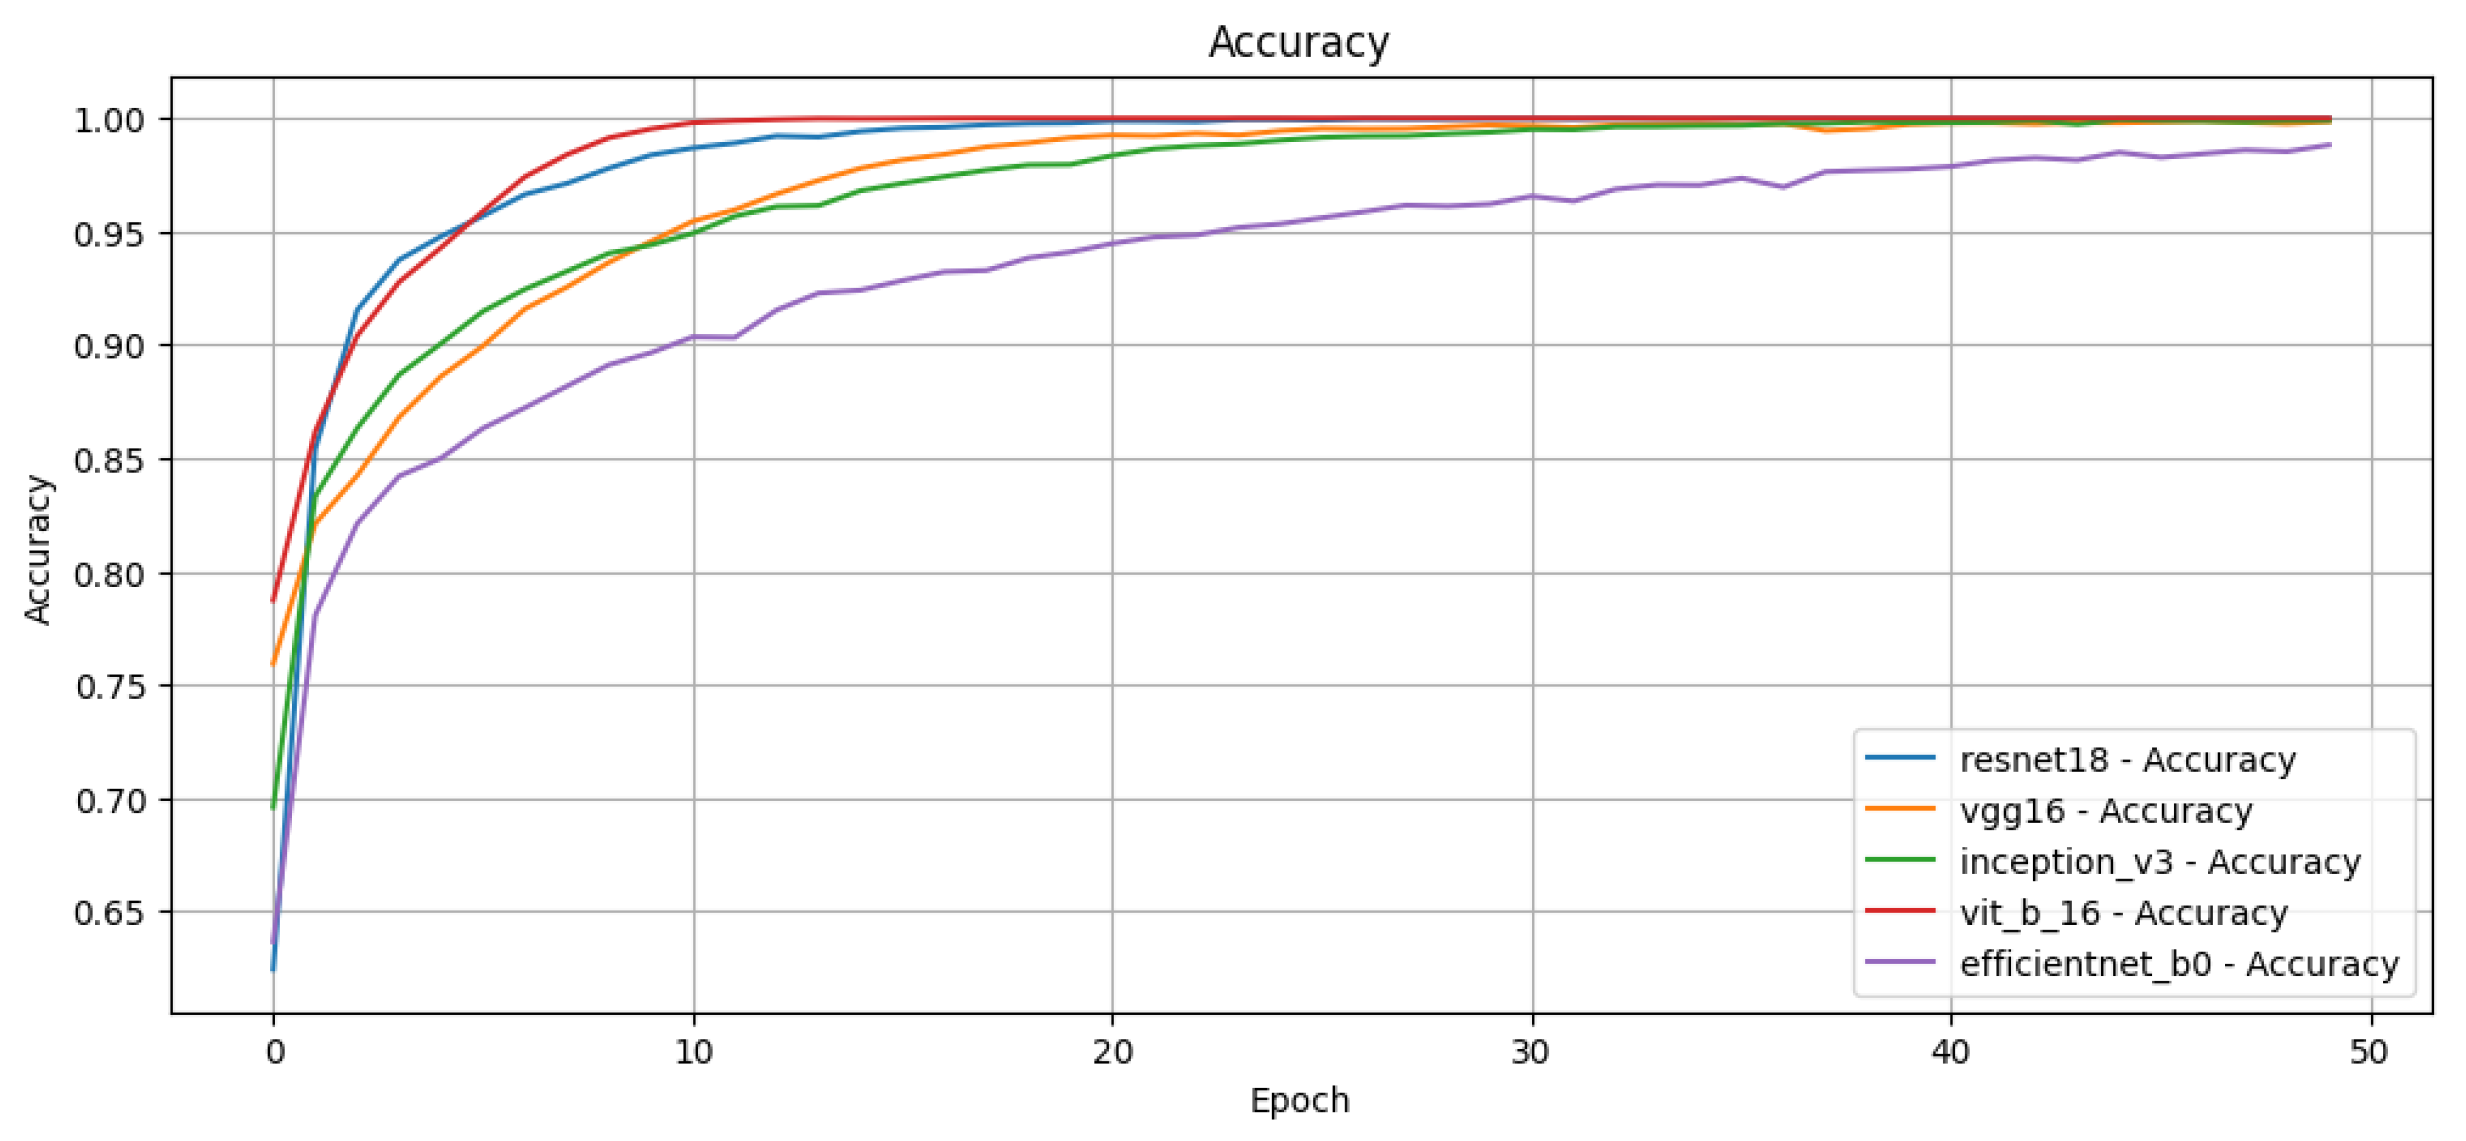
We train each model for 50 epochs using binary cross-entropy loss to optimise multi-label predictions. We apply a resize transformation to the input images to match the required input dimensions for each network. In addition, we normalise the images for ViT to match the range expected by the pretrained model.
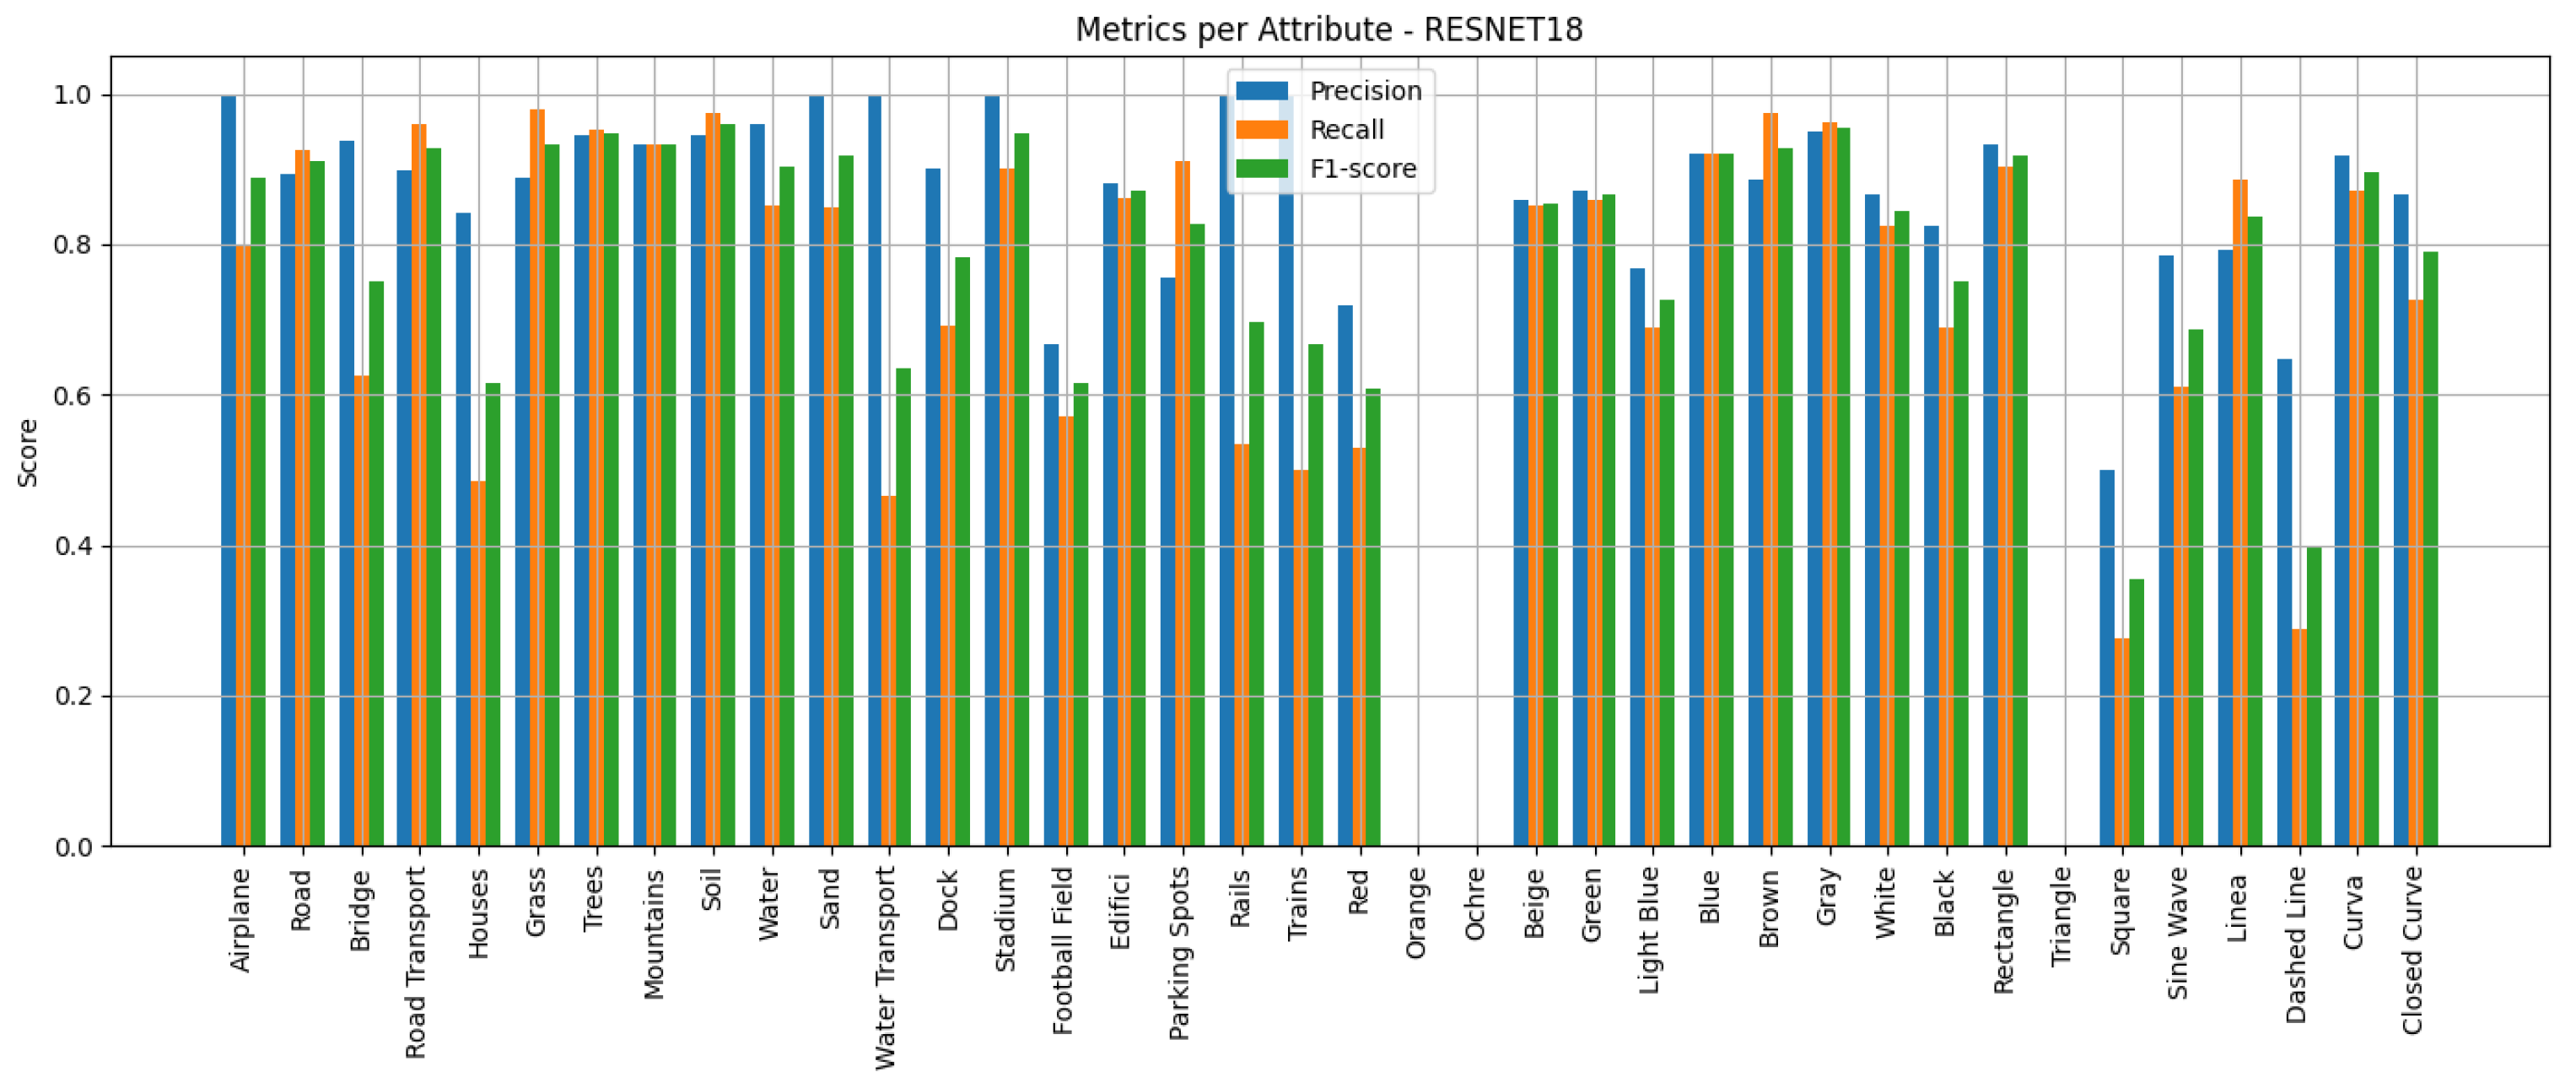
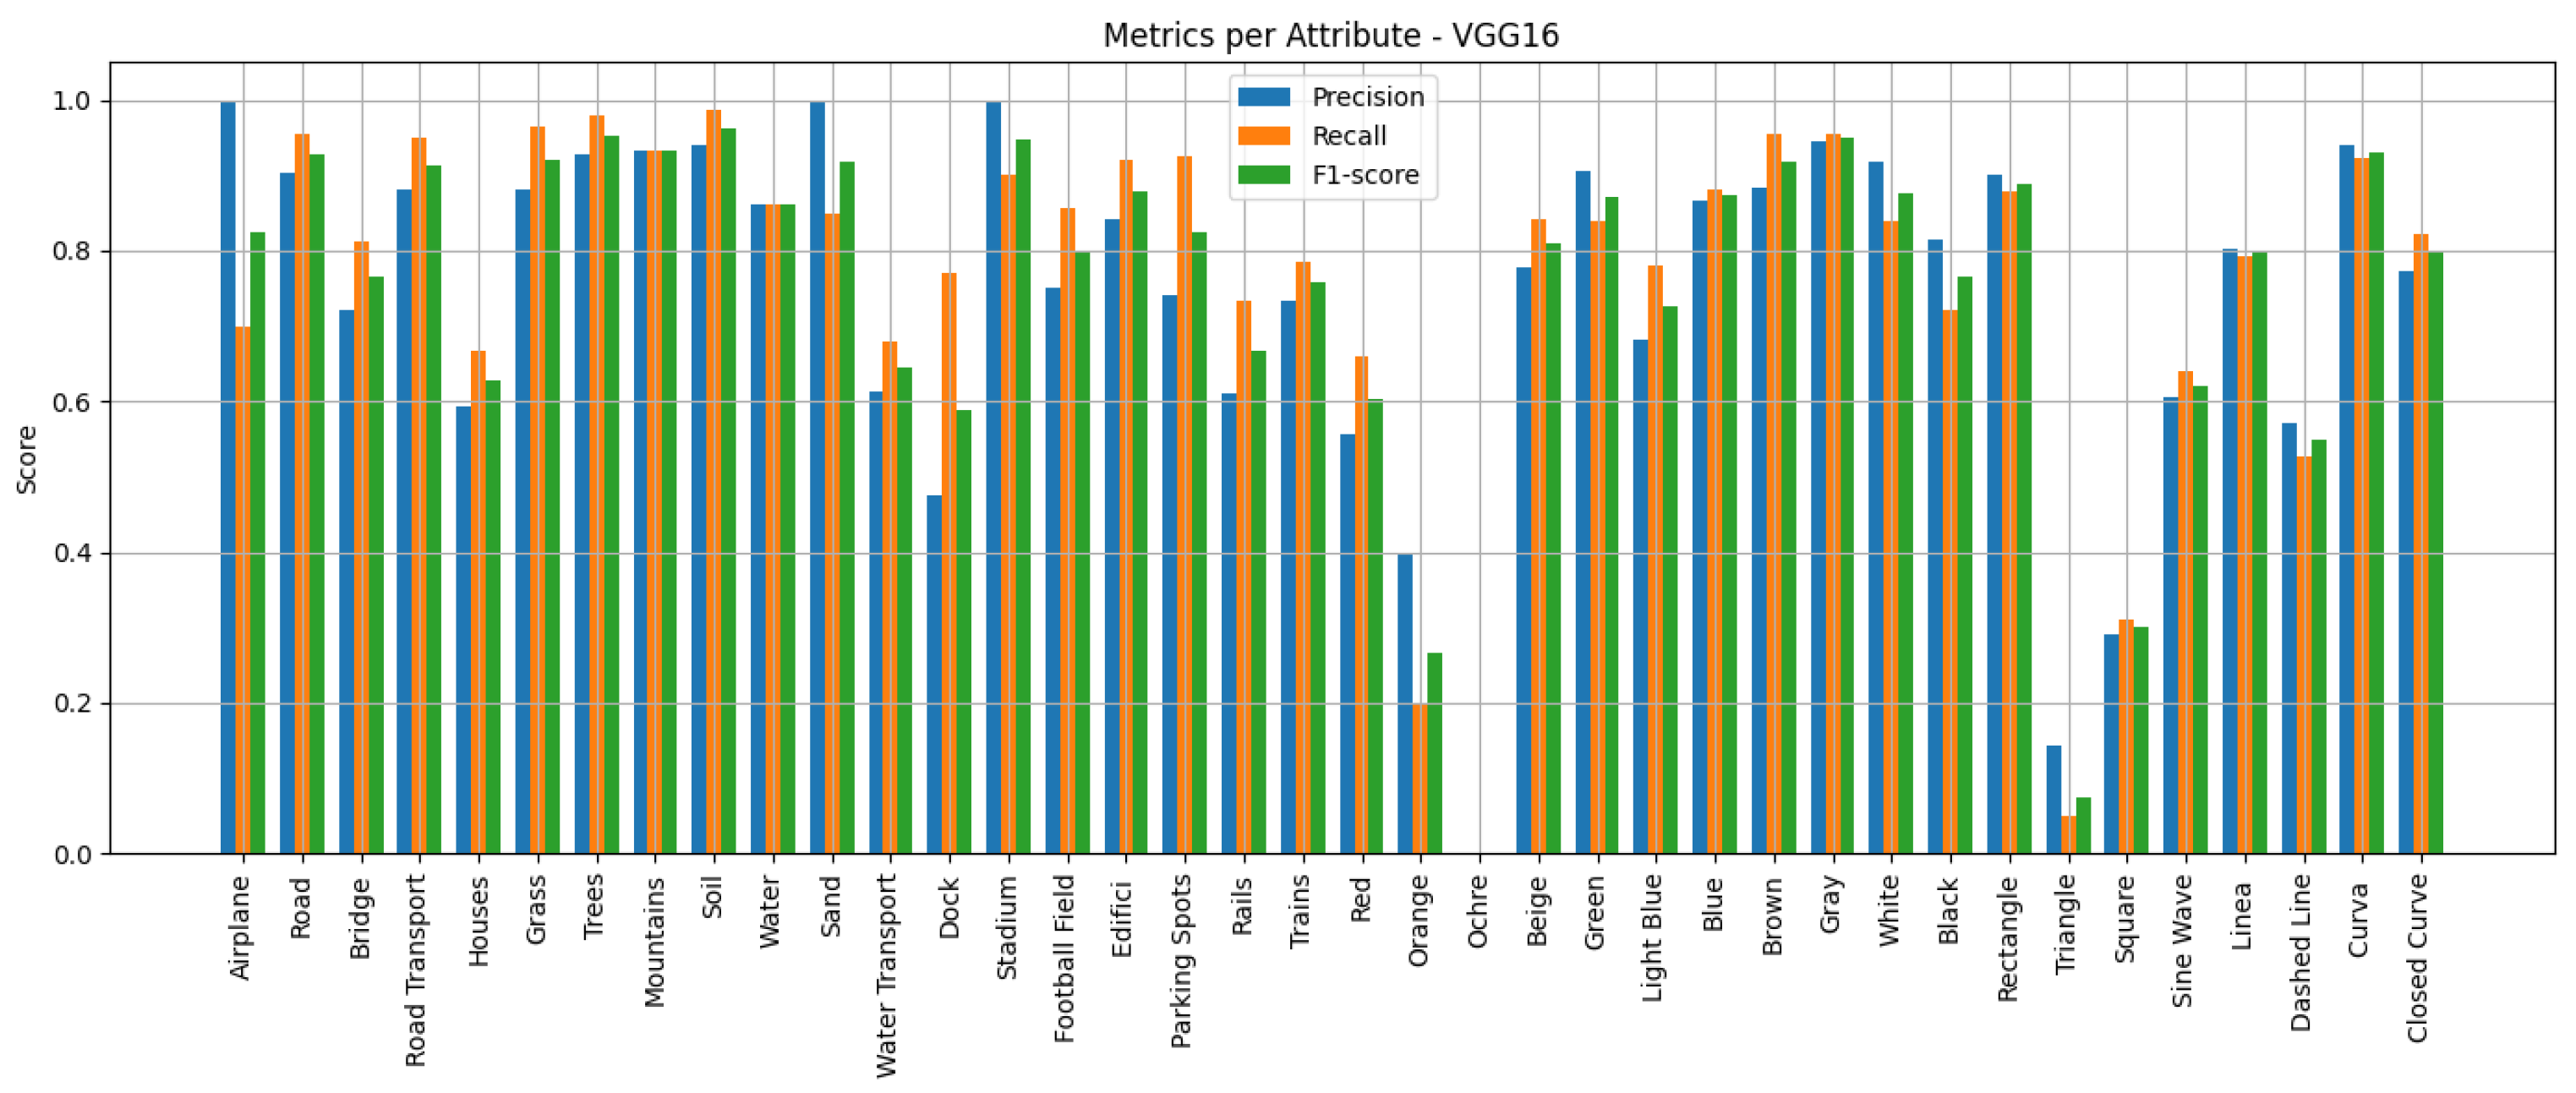
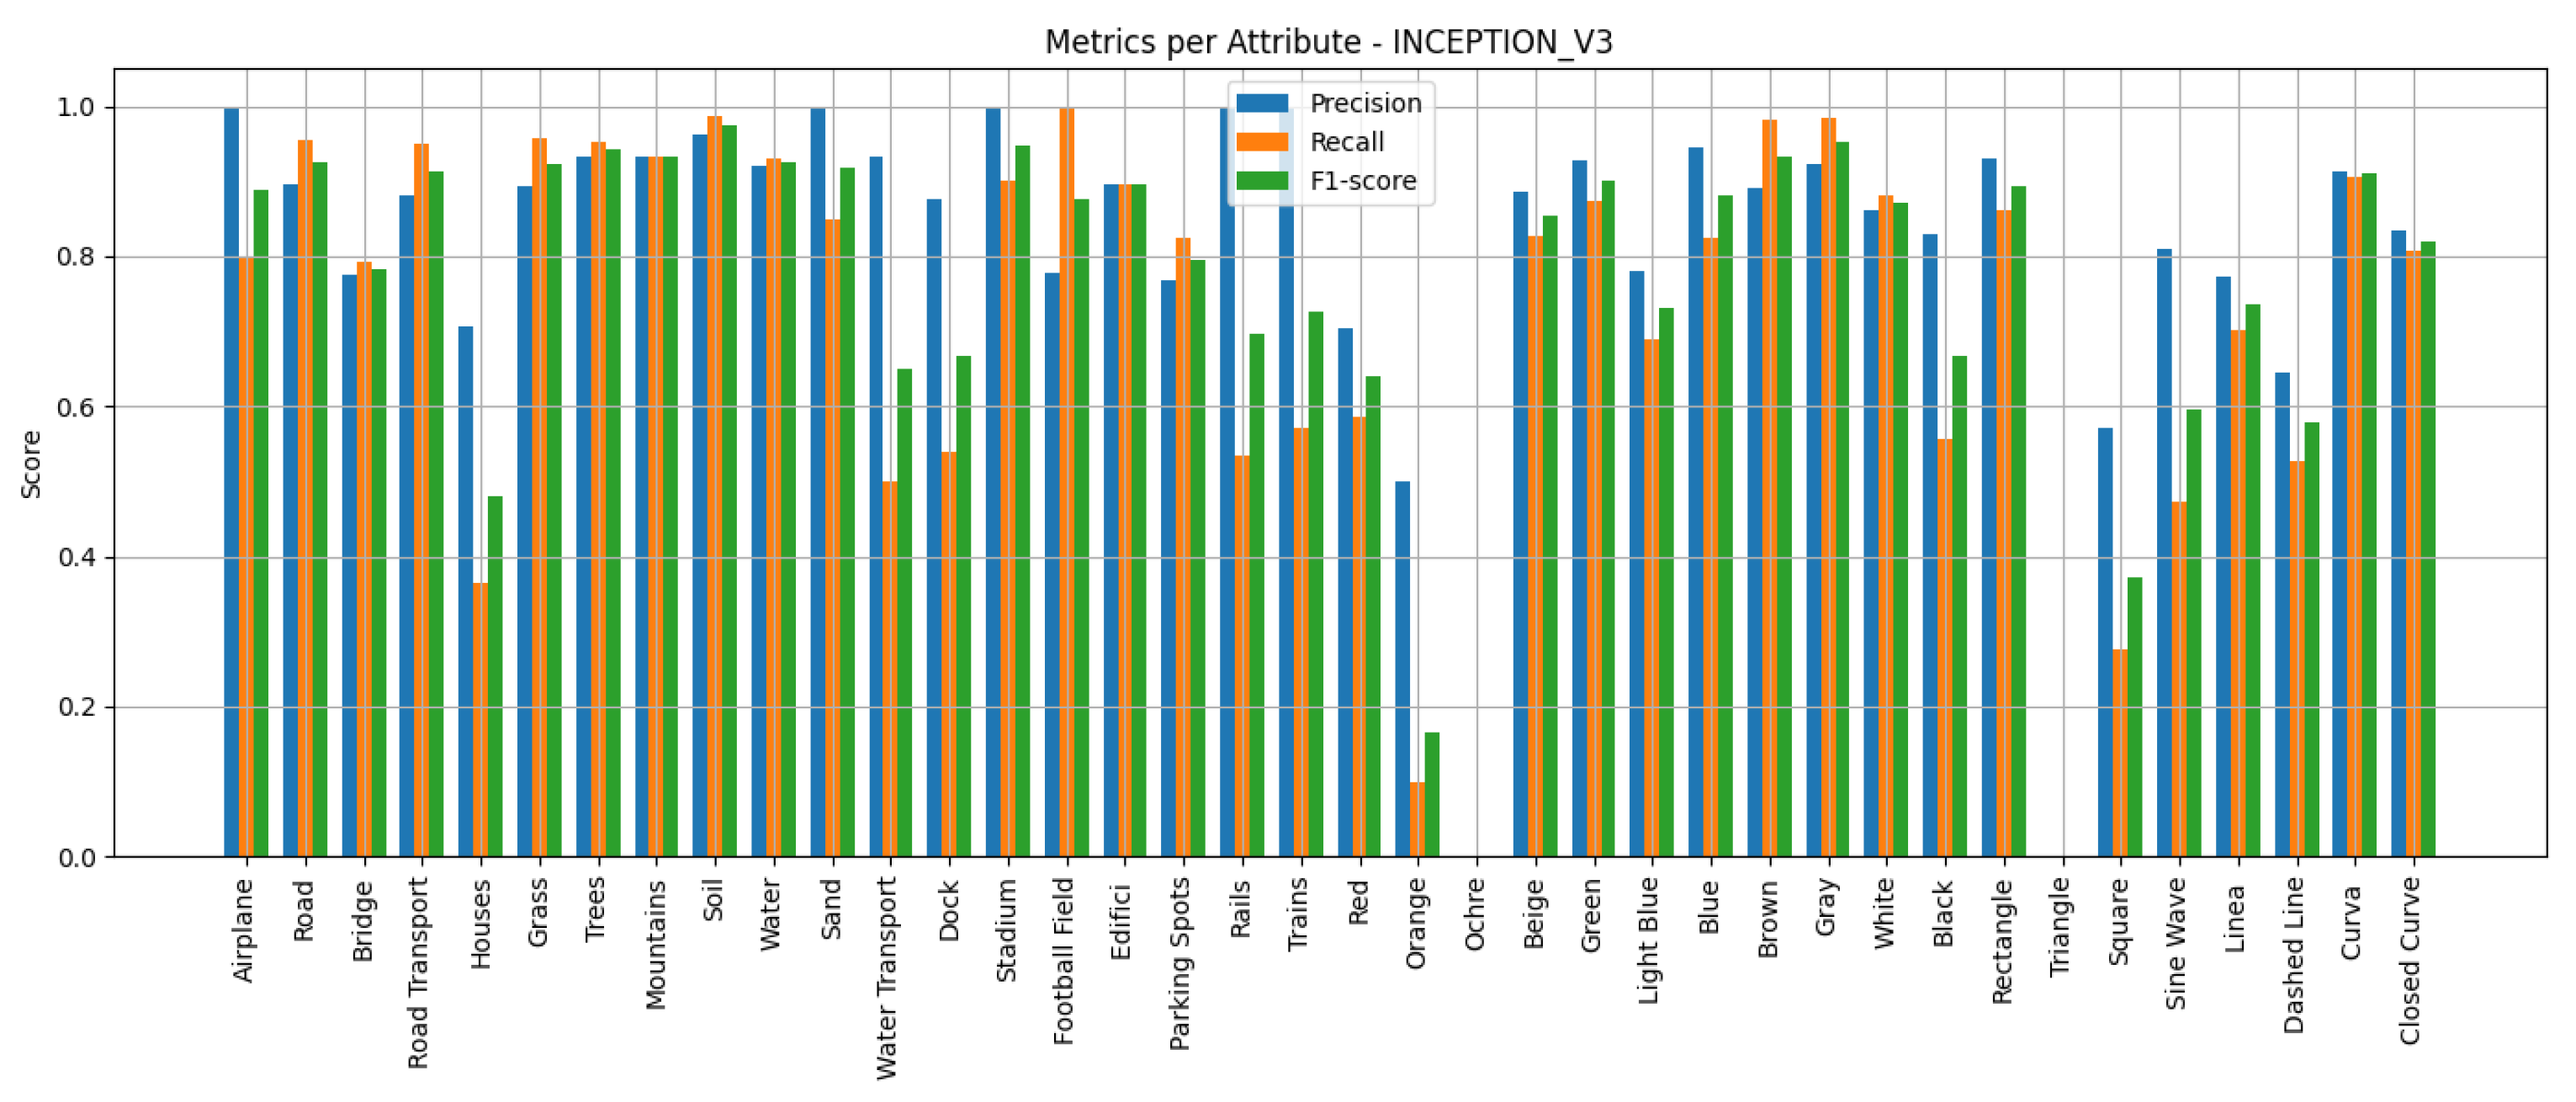
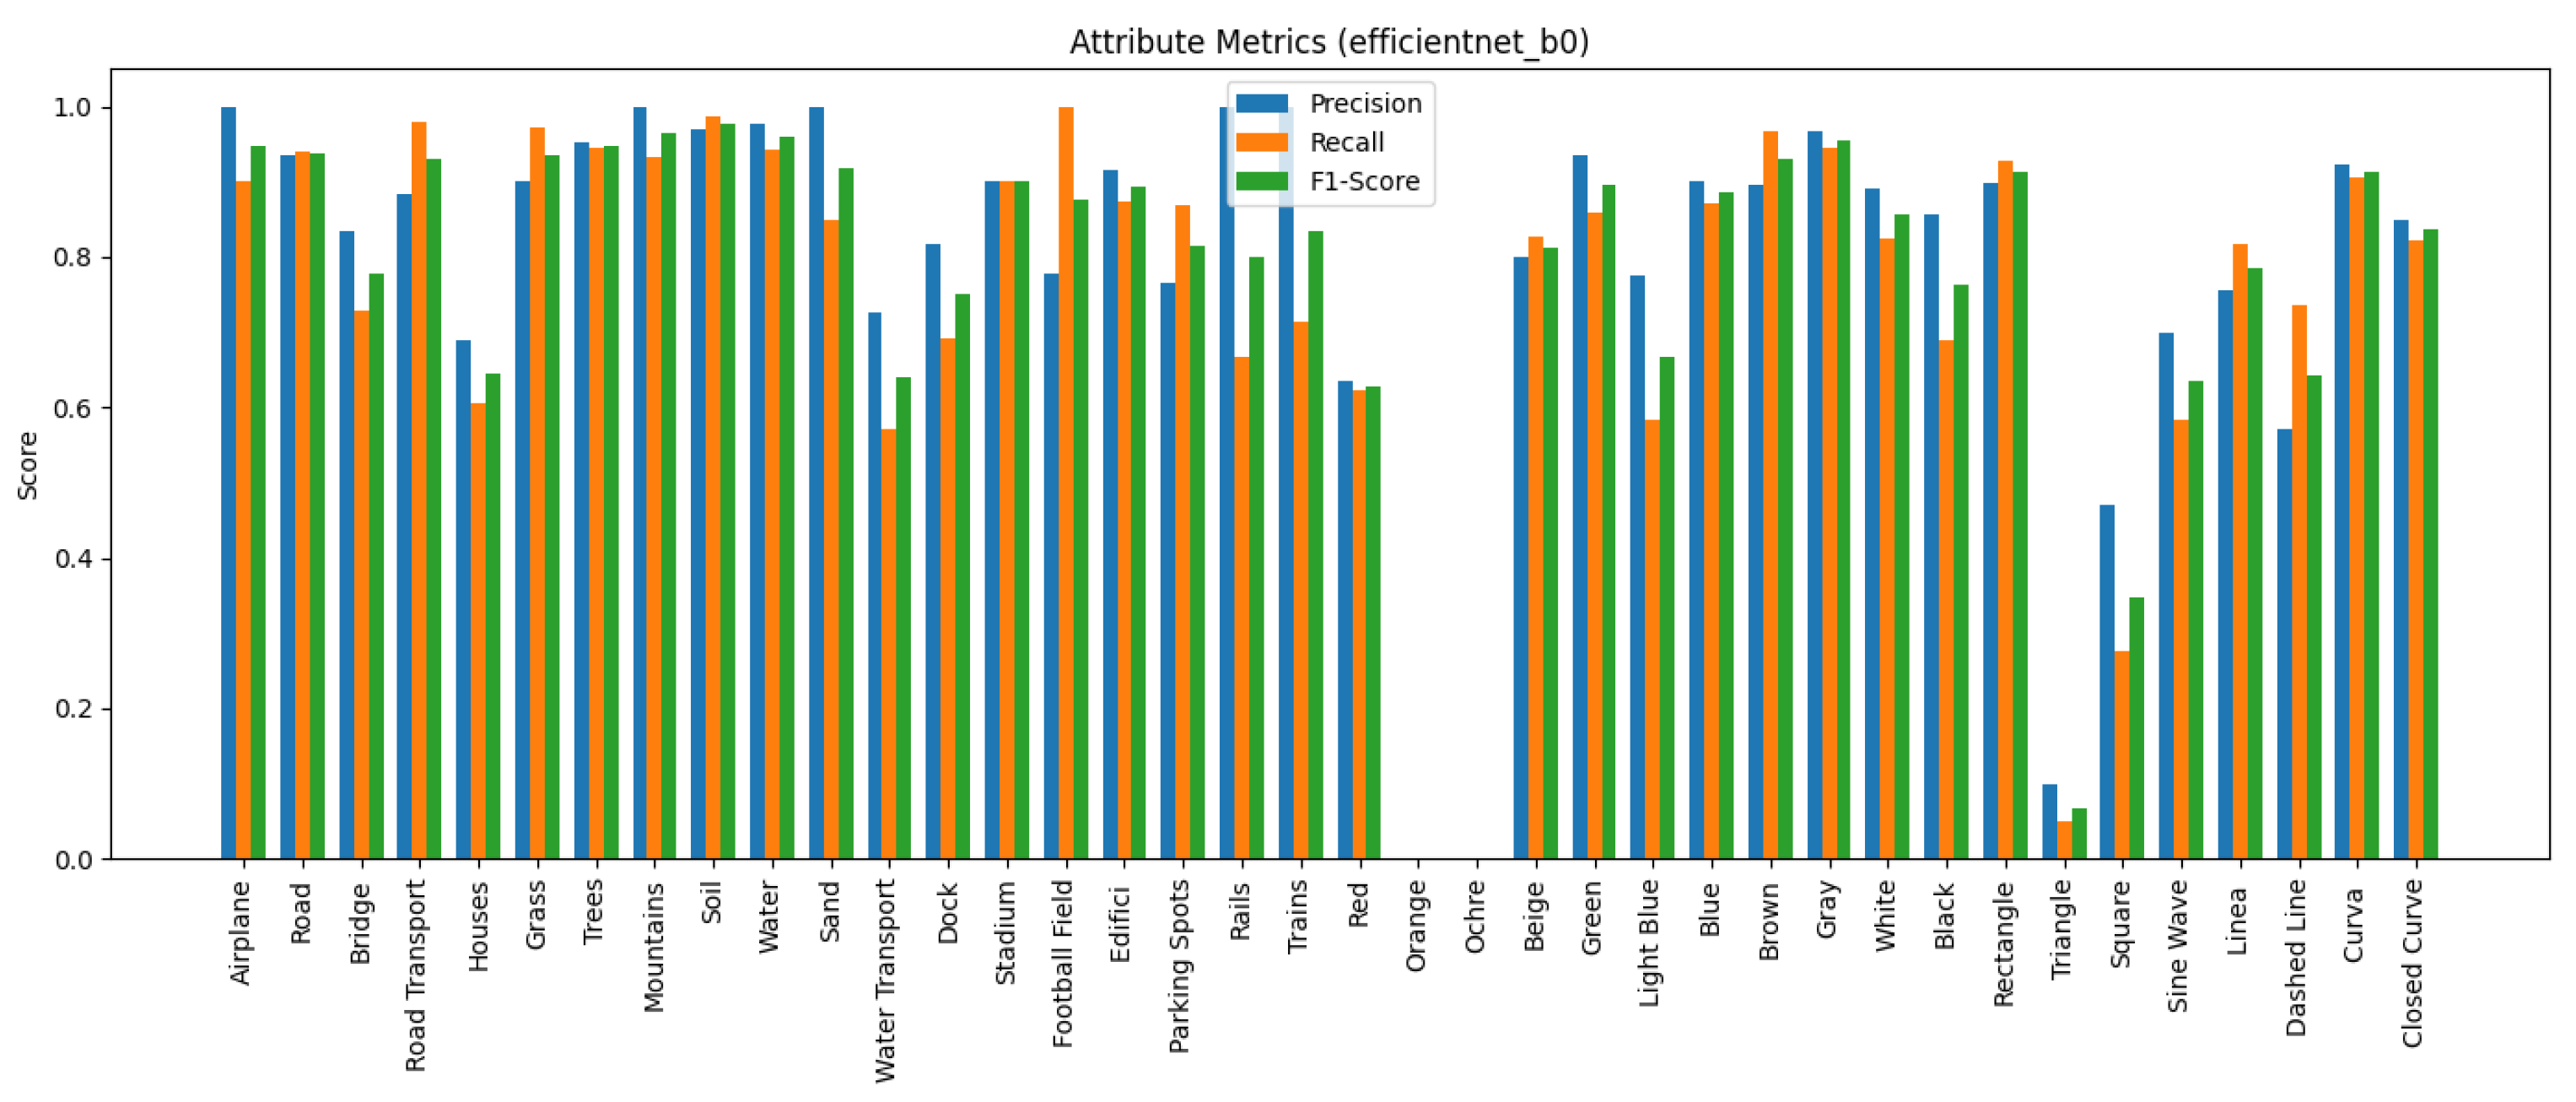
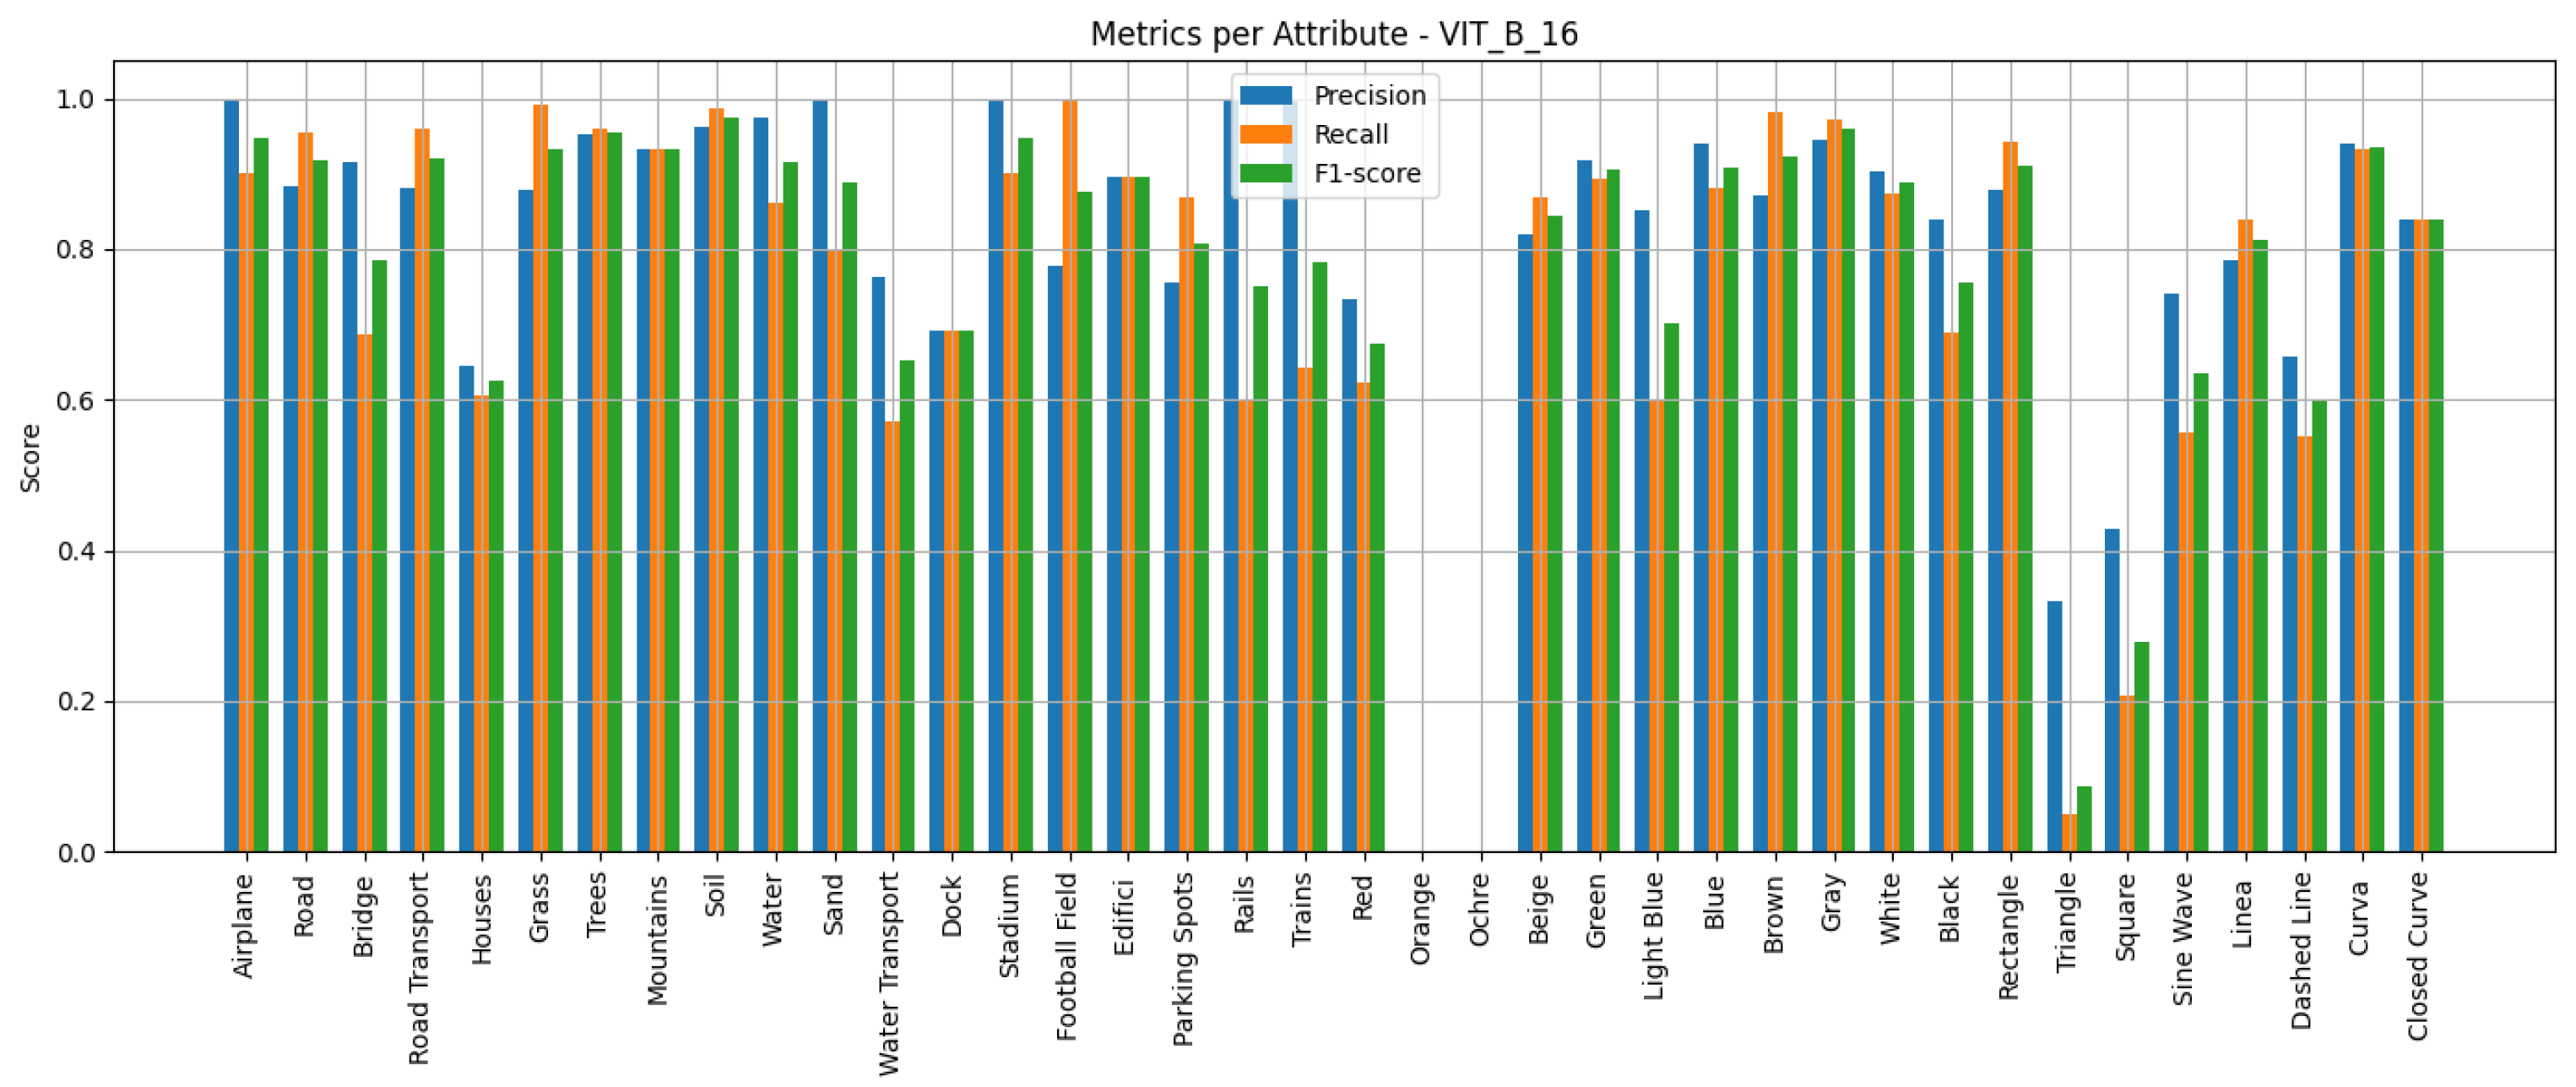
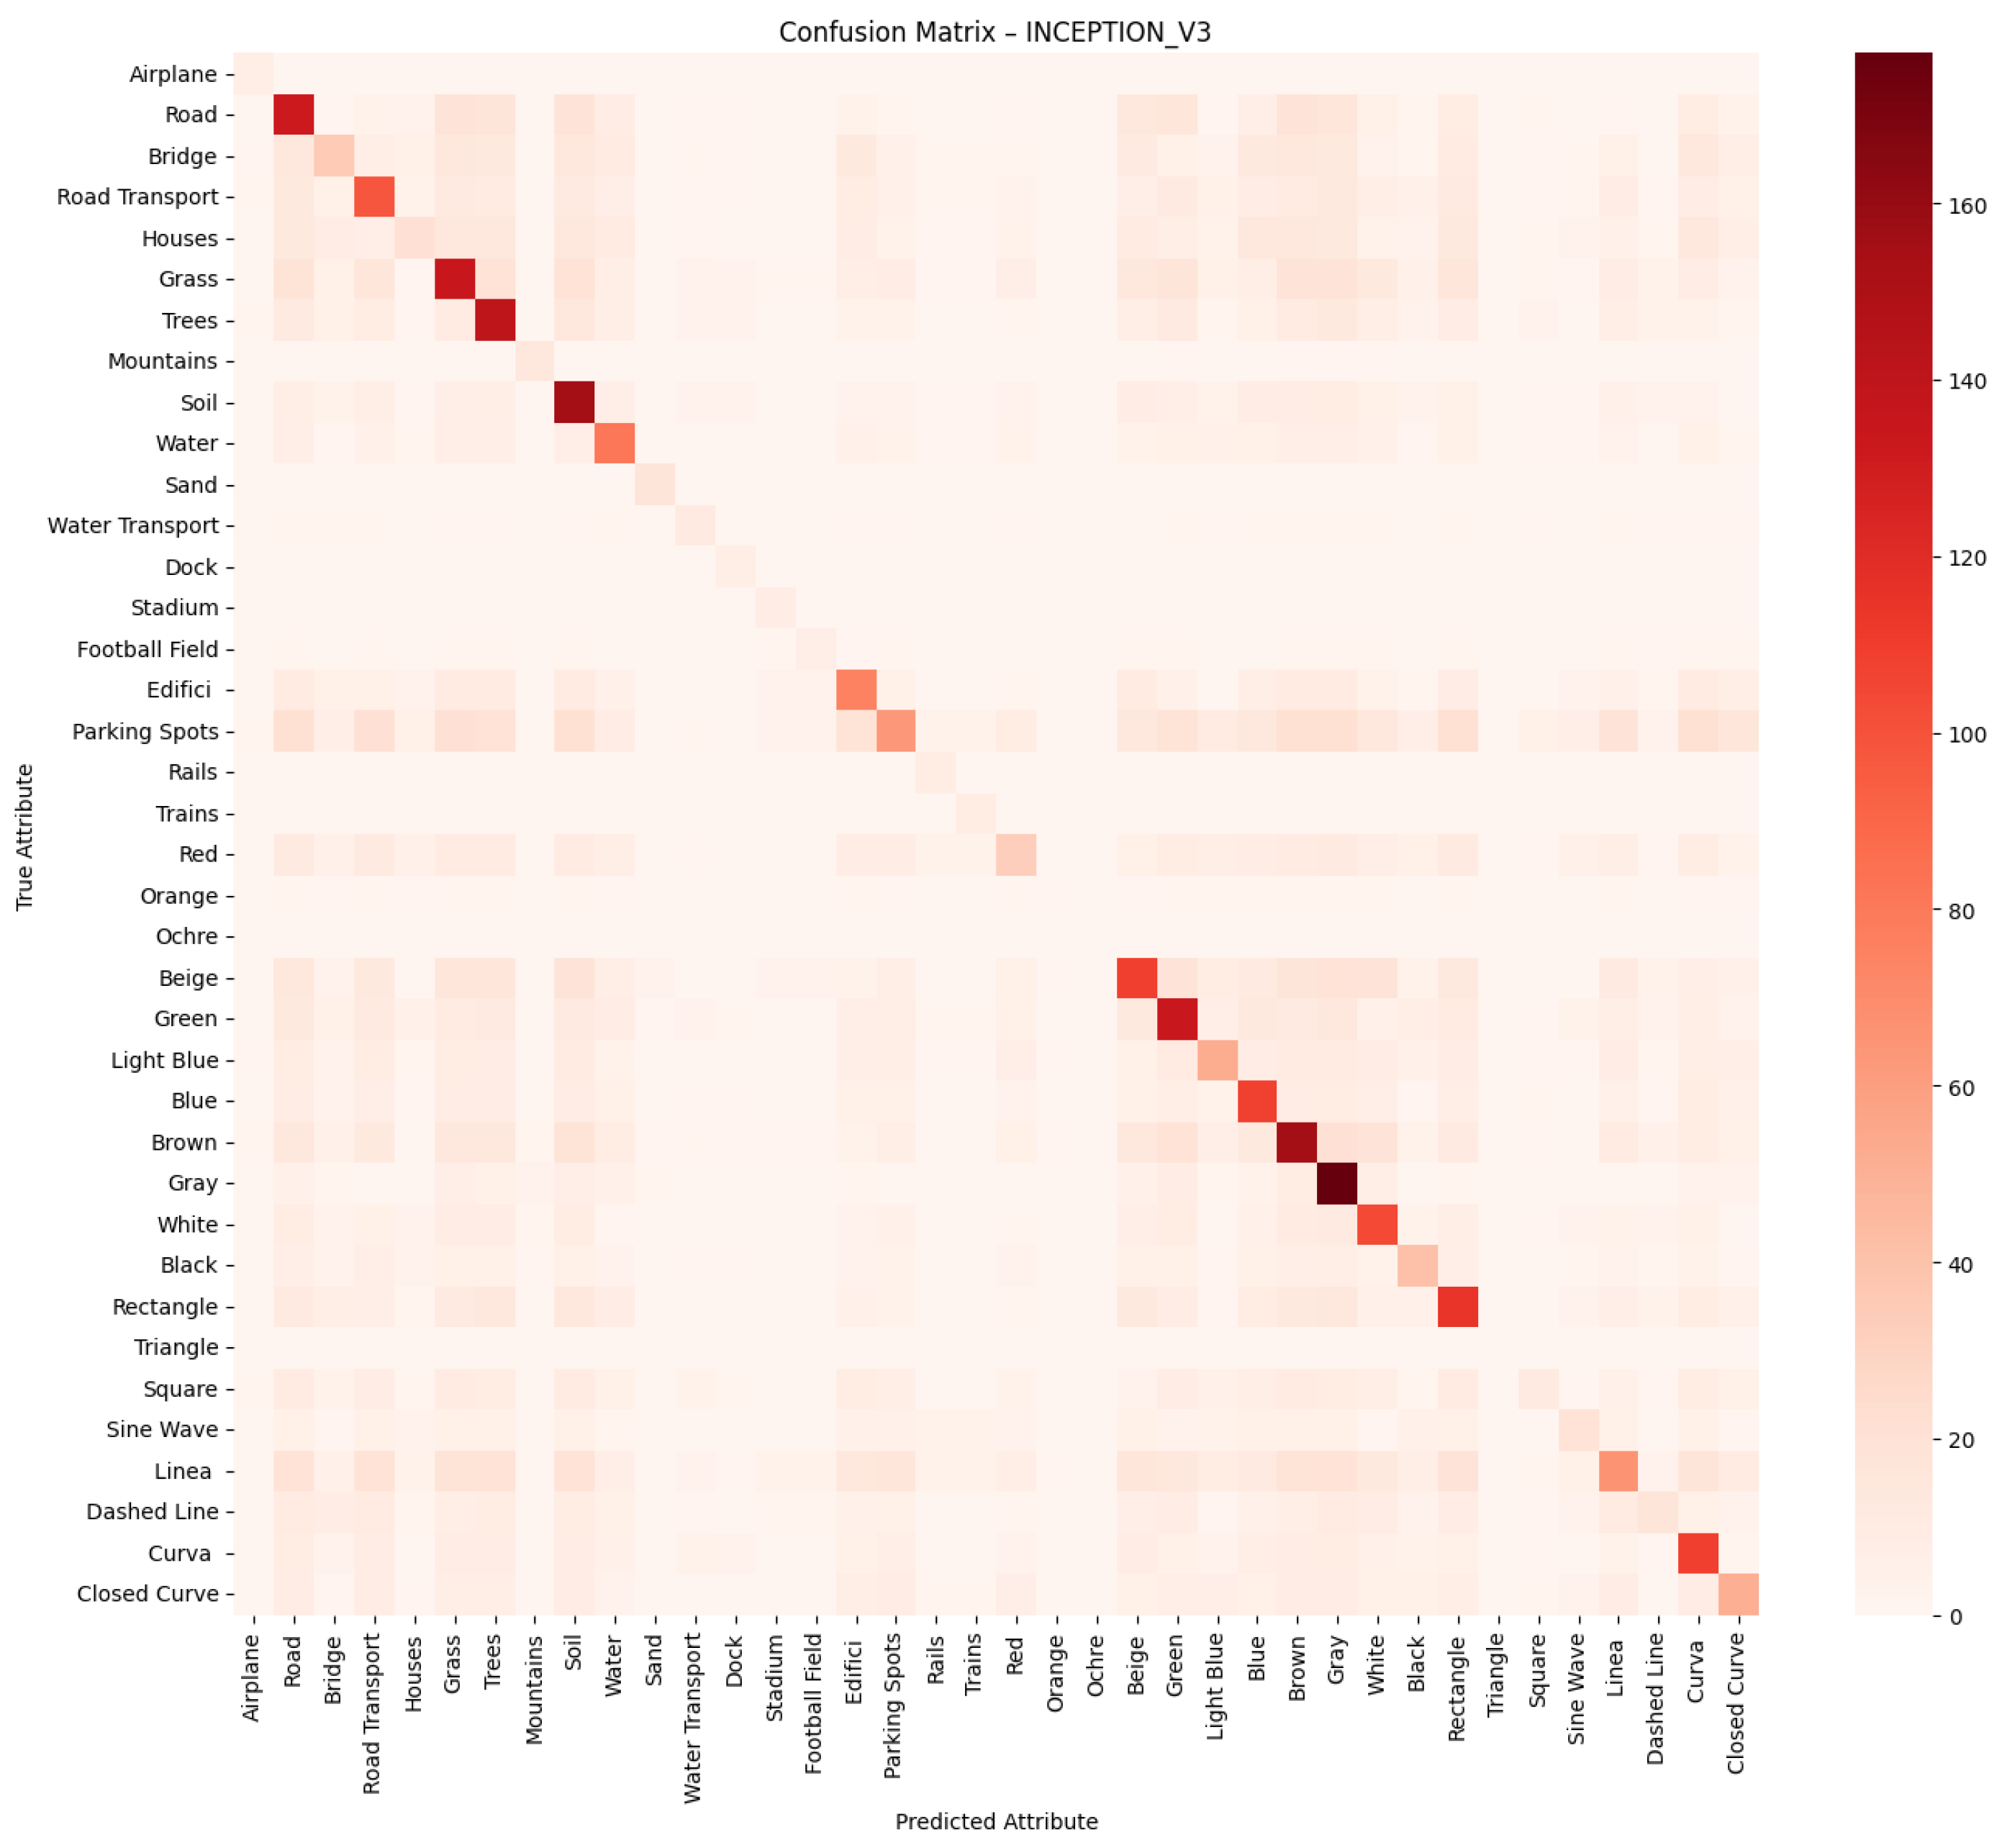
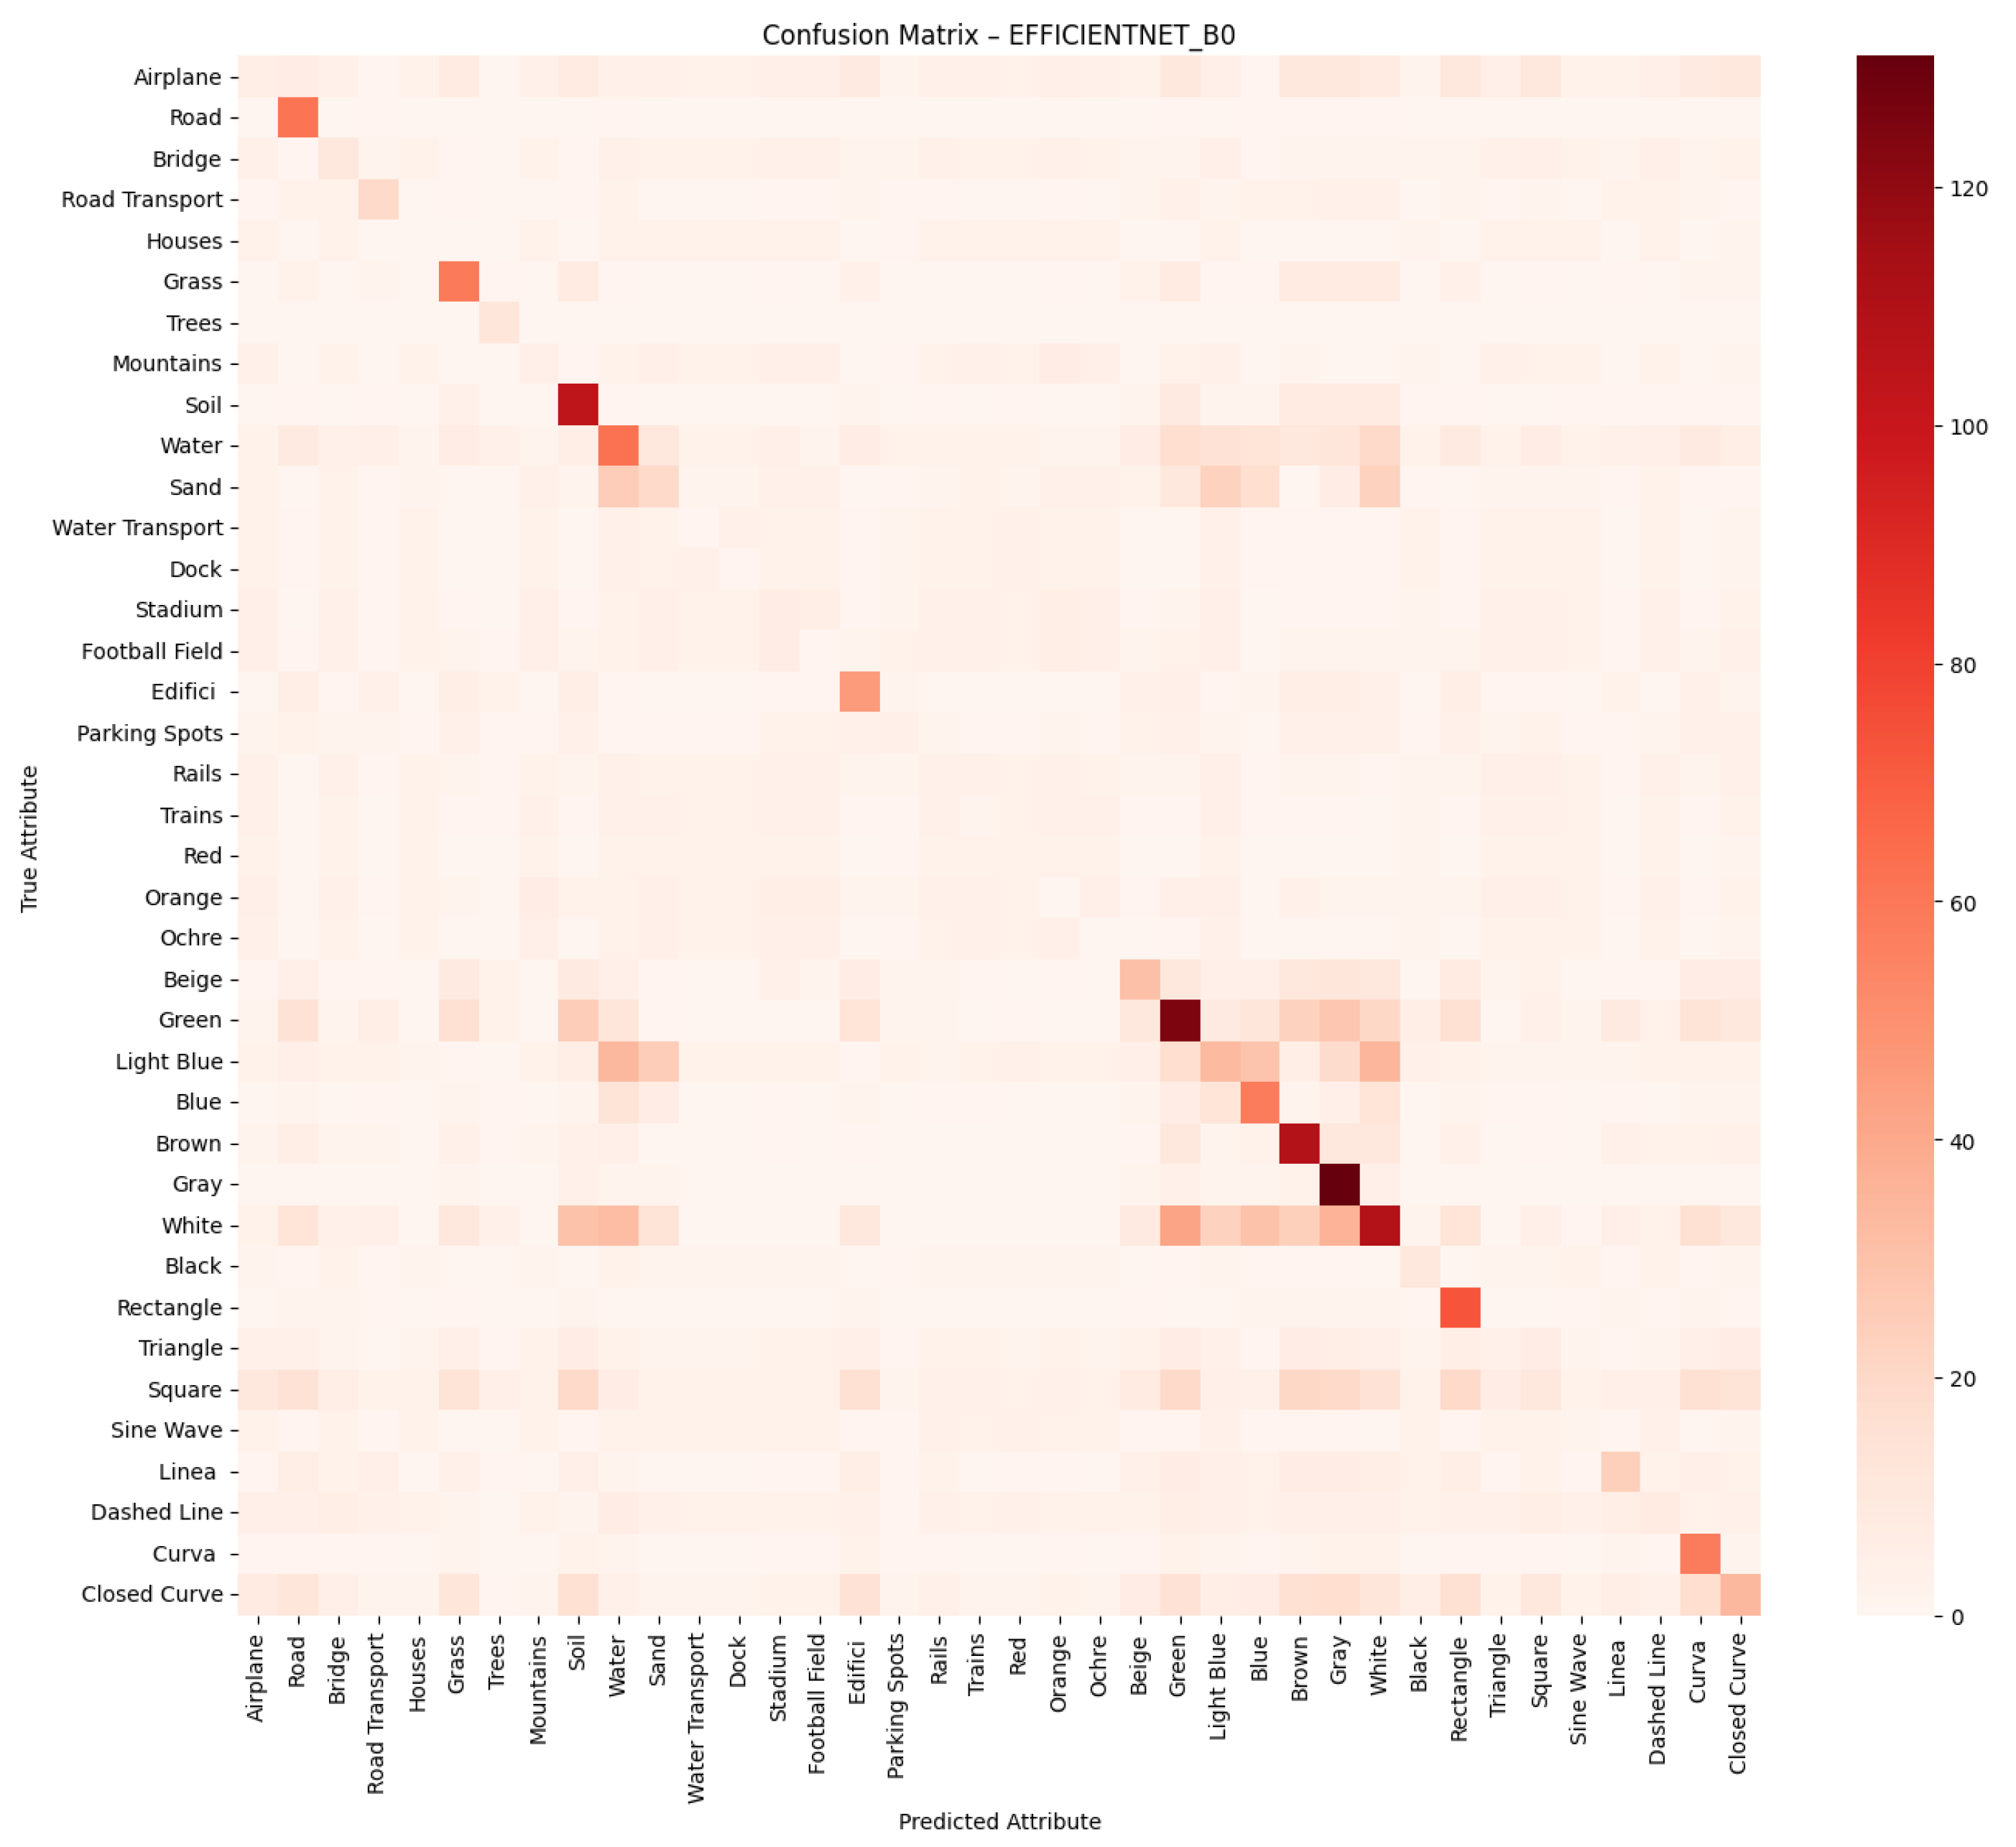
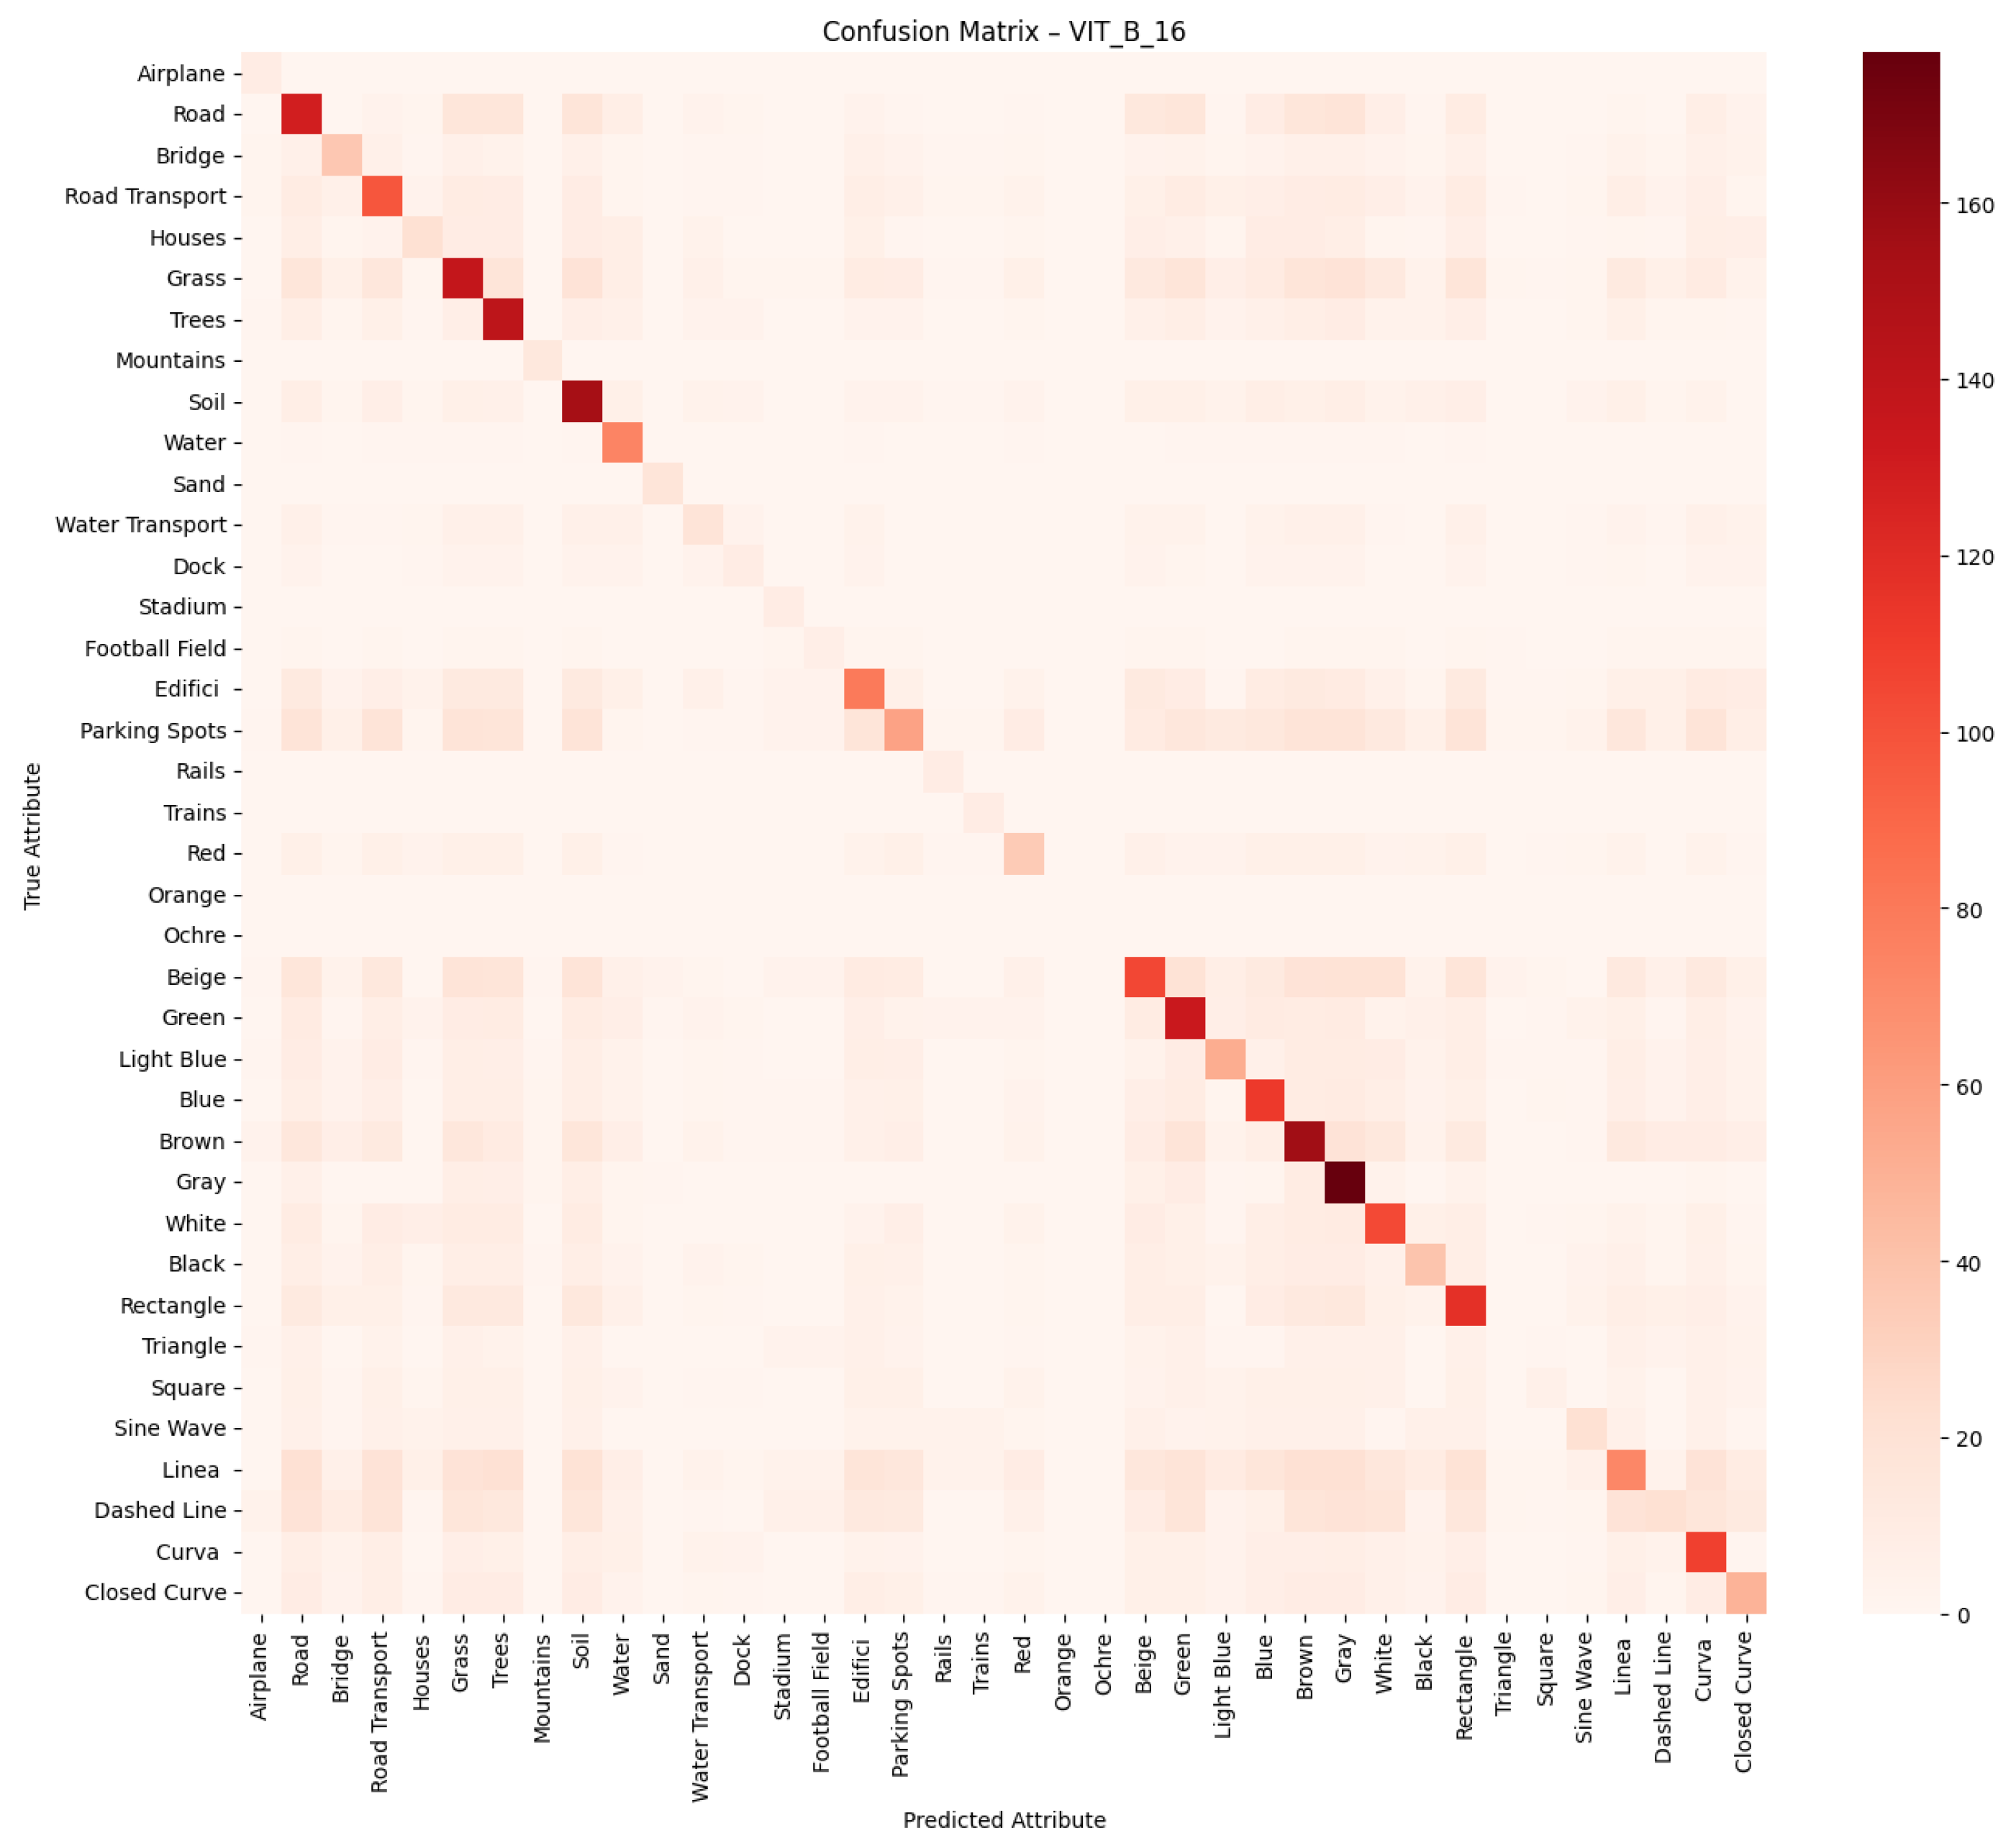
We employ standard multi-label classification metrics to evaluate the performance of the proposed models, including precision, recall, F1-score, and macro F1-score. These metrics are widely used in the literature to assess multi-label classification performance, particularly in tasks involving attribute prediction across multiple semantic categories. In addition, we generate confusion matrices for each network to visualise the distribution of true positives, false positives, true negatives and false negatives, providing a deeper insight into the classification errors per attribute.
Predicting attributes rather than scene classes enables a more granular and interpretable understanding of remote sensing images, especially when multiple objects or features exist within the same image. Lampert et al. [13] supported this idea when they introduced attribute-based recognition for ZSL, demonstrating that attributes can serve as a meaningful intermediate representation for recognising novel categories. Xian et al. [14] also demonstrated that semantic features facilitate knowledge transfer between familiar and unfamiliar classes, which is crucial in scenarios with limited labelled data. While this paper does not include a full zero-shot experiment, our attribute-based predictions lay the groundwork for future zero-shot or interpretable classification tasks where traditional class labels are inadequate for nuanced scene analysis.

4. Results

In this section, we evaluate and compare the performance of four deep learning architectures, such as ResNet18 [16], VGG16 [17], InceptionV3 [18], EfficientNet [19] and ViT-B/16 [20], for the multi-attribute classification task. The performance of the models is assessed using the precision, recall, and F1-score metrics for each attribute individually, as well as the macro F1-score, which summarises the overall performance of each model. As reported in Table 5, EfficientNet-B0 achieved the highest macro F1-score (0.7608), outperforming the other models. It was slightly ahead of ViT-B/16 (0.7594), InceptionV3 (0.7465) and VGG16 (0.7458). These results highlight the strong balance that EfficientNet-B0 strikes between model complexity and classification accuracy in the context of remote sensing attribute prediction.
Table 6, Table 7, Table 8, Table 9 and Table 10 present the detailed results per attribute. These results reveal significant trends across the five models that were evaluated. ResNet18 (Table 6) demonstrates consistent performance for common attributes such as Soil and Gray, achieving F1-scores of 0.96 for both. However, its performance drops substantially for rare attributes, such as ‘Triangle’ and ‘Ochre’, for which it receives an F1-score of 0.00. This pattern highlights the model’s limitations in handling minority classes, a common challenge across the tested architectures.
As shown in Table 7, VGG16 achieves slightly improved recall for some under-represented attributes, though it also underperforms on rare classes. For example, the F1-score for ‘Triangle’ is 0.07 and remains at 0.00 for ‘Ochre’, which reinforces the model’s sensitivity to class imbalance. Strong attributes such as Soil (F1 = 0.96) and Gray (F1 = 0.95) stand out again with high scores.
Similar trends are evident in InceptionV3 (Table 8). It excels in identifying well-represented attributes, such as Soil (F1 = 0.97) and Gray (F1 = 0.95), but struggles with Orange (F1 = 0.17) and Triangle (F1 = 0.00). These results confirm the difficulty of learning generalisable features for low-frequency attributes.
EfficientNet-B0 (Table 9) achieves competitive results across the board and the highest overall macro F1-score (0.7608). It demonstrates robust predictive capabilities for common attributes such as Soil (F1 = 0.98), Brown (F1 = 0.93), and Gray (F1 = 0.96). However, it still fails to achieve meaningful performance on attributes such as ‘Orange’ and ‘Ochre’ (F1 = 0.00). Nevertheless, its robustness on both object-based and geometric attributes, such as ‘Curve’ (F1 = 0.91) and ‘Rectangle’ (F1 = 0.91), underscores its strong representation capabilities. Finally, ViT-B/16 (Table 10) exhibits strong performance across most attributes, including Trees (F1 = 0.96), Soil (F1 = 0.97) and Gray (F1 = 0.96). It also achieves slightly better scores on shape-based attributes such as ‘Line’ and ‘Curve’, suggesting that its attention-based mechanisms offer advantages in capturing spatial dependencies.
Figure 2, Figure 3, Figure 4, Figure 5 and Figure 6 illustrate the distribution of precision, recall, and F1-scores per attribute for ResNet18, VGG16, InceptionV3, EfficientNet-B0, and ViT-B/16, respectively. These graphs clearly show that high-frequency attributes in the dataset (such as Grass, Soil, Trees) tend to achieve higher performance in all models, whereas rare classes (such as Triangle, Orange, and Ochre) are poorly predicted.
Figure 7 confirms the unbalanced nature of the dataset by showing the occurrence of each attribute. Attributes such as Grey, Soil and Brown are very common, whereas Ochre, Football pitch and Sand are very rare. This imbalance significantly affects the ability of the models to learn reliable representations for rare classes.
These findings show that while all models perform well on common attributes, dealing with rare attributes remains a challenge, and the ViT-B/16 model appears to be more robust across different attribute categories.
Figure 8 and Figure 9 show the training accuracy and loss curves for all the models that were tested. As shown in Figure 8, all models exhibit a steep increase in training accuracy during the initial epochs, reaching over 90% within the first 10 epochs. ViT-B/16 and InceptionV3 converge the fastest, attaining near-perfect training accuracy by the 30th epoch. VGG16 and ResNet18 also perform well, while EfficientNet-B0, though slower to converge, improves consistently and ultimately achieves a comparable final accuracy. Figure 8 shows that all models demonstrate a steady reduction in training loss, indicating stable learning behaviour. VGG16 and ViT-B/16 achieve the lowest final loss values, reflecting their efficiency in optimising the learning objective. InceptionV3 also maintains low loss, while EfficientNet-B0 shows higher loss across epochs, suggesting over-regularisation or underfitting with the current training settings. Nevertheless, EfficientNet-B0 performs competitively in terms of accuracy. These results highlight the impact of architectural design on convergence speed and optimisation stability in multi-label attribute classification tasks in remote sensing imagery. Although ViT-B/16 achieves the highest training accuracy (Figure 8), EfficientNet-B0 obtains the best macro F1-score on the test set (Table 5). This suggests that EfficientNet-B0 is better at generalising to unseen data in the multi-attribute classification setting, likely due to a better trade-off between model capacity and regularisation. The superior test performance in terms of F1-score indicates that EfficientNet-B0 captures the presence of multiple co-occurring attributes more consistently, despite a lower training accuracy.
To analyse the performance of the models further at the attribute level, we generate multi-label confusion matrices for each architecture as shown in Figure 10, Figure 11, Figure 12, Figure 13 and Figure 14. Each matrix provides a view of the prediction patterns for all 38 semantic attributes, with both axes representing the full set. The diagonal elements correspond to true positives (i.e., correct attribute predictions), while off-diagonal values reflect confusion between attributes. All models exhibit strong diagonal dominance, particularly for well-represented and visually distinctive attributes such as Soil, Grey, Trees and Road. However, there is more frequent confusion among attributes with overlapping visual characteristics (e.g., green vs. grass, and blue vs. light blue) and among low-frequency classes such as orange, ochre, and triangle. The ViT-B/16 and InceptionV3 models show slightly sharper diagonal profiles, indicating better discriminative capability across most classes. These matrices complement the per-attribute classification metrics, providing a visual representation of which semantic features current architectures struggle to separate. This highlights potential avenues for improving attribute-level disentanglement.
As detailed in Section 3.5, we use agreement metrics to evaluate the reliability of the annotations. These are applied at the attribute level to the test set, using predictions from the model with the best performance (EfficientNetB0). The results show substantial agreement, with most attributes achieving Cohen’s kappa scores above 0.6 and Kendall’s tau values above 0.7. Furthermore, the average ratio of opposite classifications remains below 3%. These results confirm the robustness of the annotation process, validating the semantic coherence and machine learnability of the defined attributes in remote sensing imagery.

5. Discussion

The results confirm the feasibility and effectiveness of multi-attribute classification in the RS domain. The relatively high macro F1-scores achieved by all the deep learning architectures evaluated, including convolutional models (ResNet18, VGG16, InceptionV3 and EfficientNet-B0), demonstrate that the WHU-RS19 ABZSL dataset provides rich image-level supervision that can support fine-grained semantic learning. Notably, EfficientNet-B0 slightly outperforms the other models in terms of the macro F1-score, highlighting its strong capacity for balancing accuracy and parameter efficiency. From an application perspective, accurately predicting image-level attributes enables a more granular understanding of scenes, which is essential for tasks such as urban planning, disaster response and environmental monitoring. For example, identifying the co-occurrence of roads, parking spots, and buildings within an image provides a more nuanced and actionable interpretation of the scene than relying on a single class label. Furthermore, attribute-based classification is well aligned with emerging trends in RS, such as XAI and ZSL. In XAI, for example, semantic attributes can enhance interpretability by providing human-understandable explanations for model predictions, which is especially important in critical applications such as crisis response or military analysis. In ZSL, attributes act as an intermediate semantic representation that enables models to infer previously unseen classes based on descriptive knowledge, a particular advantage in RS, where class coverage is often limited. However, the experimental analysis also reveals persistent challenges. Attributes with low visual distinctiveness, infrequent occurrence (e.g., orange and triangle) or high intra-class variability consistently show lower F1-scores. These limitations reflect the complex nature of RS data, where class imbalance and visual ambiguity are common. Addressing these issues will require future work on targeted data augmentation, few-shot or zero-shot learning, and multimodal strategies that incorporate textual or auxiliary metadata. By offering attribute-based, multi-label supervision, WHU-RS19 ABZSL dataset enables the development of more flexible, generalisable and interpretable machine learning models and paves the way for advancing semantic understanding in remote sensing and related AI domains.
Table 11 presents qualitative examples of multi-attribute predictions. The model demonstrates strong generalisation across diverse scenes, accurately identifying multiple co-occurring attributes. In certain cases, false positives are also observed, often linked to visual ambiguity or overlapping features in aerial imagery.
Despite the strengths of the WHU-RS19 ABZSL dataset in enabling attribute-based learning and semantic-level supervision, there are still some limitations. Firstly, although expert annotators were employed and a multi-stage validation pipeline was implemented, semantic attribute annotation is still subject to interpretation, particularly when it comes to visually ambiguous elements or abstract features such as geometric patterns. Secondly, the dataset exhibits some attribute imbalance, with certain labels (e.g., ‘Road’ or ‘Green’) appearing far more frequently than others (e.g., ‘Ochre’ or ‘Football Pitch’), which could impact the model’s ability to generalise to under-represented features. Thirdly, the dataset is based on a single pre-existing benchmark (WHU-RS19), which introduces domain-specific biases in terms of geographic and scene type coverage.

6. Conclusions and Future Works

This paper introduced WHU-RS19 ABZSL, a new RS dataset that extends the well-established WHU-RS19 benchmark with 38 expert-annotated, image-level semantic attributes. These attributes span three interpretable categories—objects, geometric patterns, and dominant colours—designed to support research in multi-label classification, explainable AI, and attribute-based zero-shot learning. Through a rigorous annotation protocol and structured attribute taxonomy, the dataset addresses important gaps in semantic granularity and human-centric labelling often absent in existing RS resources. We evaluated several deep learning models—ResNet-18, VGG-16, InceptionV3, EfficientNet-B0, and ViT-B/16—on the multi-label classification task. The ViT-B/16 architecture achieved the best overall performance with a macro F1-score of 0.7594, outperforming traditional convolutional baselines such as ResNet-18 (0.7385) and VGG-16 (0.7241). These results validate the usefulness of WHU-RS19 ABZSL as a fine-grained, interpretable benchmark for future work in remote sensing and vision language learning. In future research, we plan to extend the dataset with textual descriptions and conduct attribute-based ZSL experiments.
The WHU-RS19 ABZSL dataset paves the way for advancements in semantic learning in remote sensing (RS), but there are still several areas of research that could be explored. One key area is the formal integration of attribute-based zero-shot learning (ZSL) benchmarks. This involves evaluating different paradigms, such as direct attribute prediction and label-embedding strategies, to determine the most effective approaches for generalising to unseen classes. Future experiments will include cross-dataset evaluations using external RS datasets such as RSICD or SATLASPRETRAIN to assess model robustness and generalisability. These comparisons will clarify how semantic attribute representations transfer across domains with different scene compositions, resolutions and modalities. Another important focus will be addressing class imbalance. While the current version reflects natural scene frequency, future work will explore class weighting, focal loss and data augmentation to improve learning performance on under-represented attributes without compromising interpretability. The attribute taxonomy itself may be expanded to include additional semantic dimensions, such as texture patterns, vegetation indices, or topographic features. These extensions would support a broader range of applications, from ecological monitoring to urban analytics. We also intend to conduct ablation studies on the three main attribute categories, objects, geometric patterns, and dominant colours, to determine their respective contributions to downstream performance. This would provide greater insight into which semantic cues are most influential in RS classification. We plan to improve annotation consistency in future by implementing more structured expert consensus protocols and expanding the validation process. We also intend to address class imbalance by incorporating advanced loss functions and sampling strategies that are specifically designed for under-represented attributes.

Author Contributions

Conceptualisation, M.B., M.P. and R.P.; methodology, M.P.; validation, M.B., M.P. and R.P.; formal analysis, R.P.; investigation, M.B., M.P. and R.P.; data curation, M.B., M.P. and R.P.; writing—original draft preparation, M.B., M.P. and R.P.; writing—review and editing, M.B., M.P. and R.P.; visualisation, M.B., M.P. and R.P.; supervision, M.B., M.P. and R.P. All authors have read and agreed to the published version of the manuscript.

Funding

This research received no external funding.

Institutional Review Board Statement

Not applicable.

Informed Consent Statement

Not applicable.

Data Availability Statement

The original contributions presented in the study are included in the article, further inquiries can be directed to the corresponding author.

Conflicts of Interest

The authors declare no conflicts of interest.

References

  1. Dritsas, E.; Trigka, M. Remote Sensing and Geospatial Analysis in the Big Data Era: A Survey. Remote Sens. 2025, 17, 550. [Google Scholar] [CrossRef]
  2. Dutta, J.; Medhi, S.; Gogoi, M.; Borgohain, L.; Maboud, N.G.A.; Muhameed, H.M. Application of Remote Sensing and GIS in Environmental Monitoring and Management. In Remote Sensing and GIS Techniques in Hydrology; IGI Global: Hershey, PA, USA, 2025; pp. 1–34. [Google Scholar]
  3. Babbar, H.; Rani, S.; Soni, M.; Keshta, I.; Prasad, K.; Shabaz, M. Integrating remote sensing and geospatial AI-enhanced ISAC models for advanced localization and environmental monitoring. Environ. Earth Sci. 2025, 84, 118. [Google Scholar] [CrossRef]
  4. Ma, L.; Liu, Y.; Zhang, X.; Ye, Y.; Yin, G.; Johnson, B.A. Deep learning in remote sensing applications: A meta-analysis and review. ISPRS J. Photogramm. Remote Sens. 2019, 152, 166–177. [Google Scholar] [CrossRef]
  5. Weiss, M.; Jacob, F.; Duveiller, G. Remote Sensing for Agricultural Applications: A Meta-Review. Remote Sens. Environ. 2020, 236, 111402. [Google Scholar] [CrossRef]
  6. Yao, H.; Qin, R.; Chen, X. Unmanned Aerial Vehicle for Remote Sensing Applications—A Review. Remote Sens. 2019, 11, 1443. [Google Scholar] [CrossRef]
  7. Chawla, I.; Karthikeyan, L.; Mishra, A.K. A Review of Remote Sensing Applications for Water Security: Quantity, Quality, and Extremes. J. Hydrol. 2020, 585, 124826. [Google Scholar] [CrossRef]
  8. Wu, T.; Sha, T.; Yao, X.; Hu, J.; Ma, Y.; Zhang, J. Improvement of the YOLO Series for Detecting Tower Cranes Based on High-Resolution Remote Sensing Imagery. J. Geovis. Spat. Anal. 2025, 9, 8. [Google Scholar] [CrossRef]
  9. Hu, H.; Cai, L.; Kang, R.; Wu, Y.; Wang, C. Efficient and Lightweight Semantic Segmentation Network for Land Cover Point Cloud with Local-Global Feature Fusion. IEEE Trans. Geosci. Remote Sens. 2025, 63, 4408113. [Google Scholar] [CrossRef]
  10. Su, Y.; Ma, P.; Wang, W.; Wang, S.; Wu, Y.; Li, Y.; Jing, P. AMDANet: Augmented Multi-scale Difference Aggregation Network for Image Change Detection. IEEE Trans. Geosci. Remote Sens. 2025, 63, 5616012. [Google Scholar] [CrossRef]
  11. Peng, D.; Liu, X.; Zhang, Y.; Guan, H.; Li, Y.; Bruzzone, L. Deep learning change detection techniques for optical remote sensing imagery: Status, perspectives and challenges. Int. J. Appl. Earth Obs. Geoinf. 2025, 136, 104282. [Google Scholar] [CrossRef]
  12. Wang, L.; Zhang, M.; Gao, X.; Shi, W. Advances and challenges in deep learning-based change detection for remote sensing images: A review through various learning paradigms. Remote Sens. 2024, 16, 804. [Google Scholar] [CrossRef]
  13. Lampert, C.H.; Nickisch, H.; Harmeling, S. Learning to Detect Unseen Object Classes by Between-Class Attribute Transfer. In Proceedings of the IEEE Conference on Computer Vision and Pattern Recognition, Miami, FL, USA, 20–25 June 2009; pp. 951–958. [Google Scholar] [CrossRef]
  14. Xian, Y.; Lampert, C.H.; Schiele, B.; Akata, Z. Zero-Shot Learning—A Comprehensive Evaluation of the Good, the Bad and the Ugly. IEEE Trans. Pattern Anal. Mach. Intell. 2019, 41, 2251–2265. [Google Scholar] [CrossRef]
  15. Xia, G.S.; Yang, W.; Delon, J.; Gousseau, Y.; Sun, H.; Maître, H. Structural High-Resolution Satellite Image Indexing. In Proceedings of the ISPRS Symposium: 100 Years ISPRS—Advancing Remote Sensing Science, Vienna, Austria, 5–7 July 2010. [Google Scholar]
  16. He, K.; Zhang, X.; Ren, S.; Sun, J. Deep Residual Learning for Image Recognition. In Proceedings of the IEEE Conference on Computer Vision and Pattern Recognition, Las Vegas, NV, USA, 27–30 June 2016; pp. 770–778. [Google Scholar] [CrossRef]
  17. Simonyan, K.; Zisserman, A. Very deep convolutional networks for large-scale image recognition. arXiv 2014, arXiv:1409.1556. [Google Scholar] [CrossRef]
  18. Szegedy, C.; Vanhoucke, V.; Ioffe, S.; Shlens, J.; Wojna, Z. Rethinking the Inception Architecture for Computer Vision. In Proceedings of the IEEE Conference on Computer Vision and Pattern Recognition, Las Vegas, NV, USA, 27–30 June 2016; pp. 2818–2826. [Google Scholar] [CrossRef]
  19. Tan, M.; Le, Q.V. EfficientNet: Rethinking Model Scaling for Convolutional Neural Networks. arXiv 2019, arXiv:1905.11946. [Google Scholar] [CrossRef]
  20. Dosovitskiy, A. An Image Is Worth 16×16 Words: Transformers for Image Recognition at Scale. arXiv 2020, arXiv:2010.11929. [Google Scholar] [CrossRef]
  21. Petrovska, B.; Zdravevski, E.; Lameski, P.; Corizzo, R.; Štajduhar, I.; Lerga, J. Deep Learning for Feature Extraction in Remote Sensing: A Case-Study of Aerial Scene Classification. Sensors 2020, 20, 3906. [Google Scholar] [CrossRef] [PubMed]
  22. Sun, S.; Dustdar, S.; Ranjan, R.; Morgan, G.; Dong, Y.; Wang, L. Remote Sensing Image Interpretation with Semantic Graph-Based Methods: A Survey. IEEE J. Sel. Top. Appl. Earth Obs. Remote Sens. 2022, 15, 4544–4558. [Google Scholar] [CrossRef]
  23. Du, R.; Tang, X.; Ma, J.; Zhang, X.; Liu, F.; Jiao, L. Semantic-assisted Feature Integration Network for Multi-label Remote Sensing Scene Classification. IEEE Trans. Geosci. Remote Sens. 2025, 63, 5603015. [Google Scholar] [CrossRef]
  24. Yang, Y.; Newsam, S. Bag-of-Visual-Words and Spatial Extensions for Land-Use Classification. In Proceedings of the 18th SIGSPATIAL International Conference on Advances in Geographic Information Systems, San Jose, CA, USA, 3–5 November 2010; pp. 270–279. [Google Scholar] [CrossRef]
  25. Sumbul, G.; Charfuelan, M.; Demir, B.; Markl, V. Bigearthnet: A Large-Scale Benchmark Archive for Remote Sensing Image Understanding. In Proceedings of the 2019 IEEE International Geoscience and Remote Sensing Symposium (IGARSS), Yokohama, Japan, 28 July–2 August 2019; pp. 5901–5904. [Google Scholar] [CrossRef]
  26. Xia, G.S.; Hu, J.; Hu, F.; Shi, B.; Bai, X.; Zhong, Y.; Zhang, L.; Lu, X. AID: A benchmark data set for performance evaluation of aerial scene classification. IEEE Trans. Geosci. Remote Sens. 2017, 55, 3965–3981. [Google Scholar] [CrossRef]
  27. Long, Y.; Xia, G.S.; Li, S.; Yang, W.; Yang, M.Y.; Zhu, X.X.; Zhang, L.; Li, D. On creating benchmark dataset for aerial image interpretation: Reviews, guidances, and million-aid. IEEE J. Sel. Top. Appl. Earth Obs. Remote Sens. 2021, 14, 4205–4230. [Google Scholar] [CrossRef]
  28. Cheng, G.; Han, J.; Lu, X. Remote Sensing Image Scene Classification: Benchmark and State of the Art. Proc. IEEE 2017, 9, 1865–1883. [Google Scholar] [CrossRef]
  29. Christie, G.; Fendley, N.; Wilson, J.; Mukherjee, R. Functional map of the world. In Proceedings of the IEEE Conference on Computer Vision and Pattern Recognition, Salt Lake City, UT, USA, 18–23 June 2018; pp. 6172–6180. [Google Scholar] [CrossRef]
  30. Xia, G.S.; Bai, X.; Ding, J.; Zhu, Z.; Belongie, S.; Luo, J.; Datcu, M.; Pelillo, M.; Zhang, L. DOTA: A Large-Scale Dataset for Object Detection in Aerial Images. In Proceedings of the IEEE Conference on Computer Vision and Pattern Recognition (CVPR), Salt Lake City, UT, USA, 18–22 June 2018; pp. 3974–3983. [Google Scholar] [CrossRef]
  31. Zamir, S.W.; Arora, A.; Gupta, A.; Khan, S.; Sun, G.; Khan, F.S.; Zhu, F.; Shao, L.; Xia, G.S.; Bai, X. iSAID: A Large-Scale Dataset for Instance Segmentation in Aerial Images. In Proceedings of the IEEE/CVF Conference on Computer Vision and Pattern Recognition Workshops (CVPRW), Long Beach, CA, USA, 16–17 June 2019; pp. 28–37. [Google Scholar] [CrossRef]
  32. Paolo, F.; Lin, T.t.T.; Gupta, R.; Goodman, B.; Patel, N.; Kuster, D.; Kroodsma, D.; Dunnmon, J. xView3-SAR: Detecting Dark Fishing Activity Using Synthetic Aperture Radar Imagery. Adv. Neural Inf. Process. Syst. 2022, 35, 37604–37616. [Google Scholar] [CrossRef]
  33. Garnot, V.S.F.; Landrieu, L.; Chehata, N. Multi-modal temporal attention models for crop mapping from satellite time series. ISPRS J. Photogramm. Remote Sens. 2022, 187, 294–305. [Google Scholar] [CrossRef]
  34. Hänsch, R.; Persello, C.; Vivone, G.; Navarro, J.C.; Boulch, A.; Lefevre, S.; Saux, B. The 2022 IEEE GRSS Data Fusion Contest: Semisupervised Learning [Technical Committees]. IEEE Geosci. Remote Sens. Mag. 2022, 10, 334–337. [Google Scholar] [CrossRef]
  35. Bastani, F.; Wolters, P.; Gupta, R.; Ferdinando, J.; Kembhavi, A. SatlasPretrain: A Large-Scale Dataset for Remote Sensing Image Understanding. In Proceedings of the IEEE/CVF International Conference on Computer Vision, Paris, France, 1–6 October 2023; pp. 16772–16782. [Google Scholar]
  36. Cheng, G.; Han, J.; Zhou, P.; Guo, L. Multi-class Geospatial Object Detection and Geographic Image Classification Based on Collection of Part Detectors. ISPRS J. Photogramm. Remote Sens. 2014, 98, 119–132. [Google Scholar] [CrossRef]
  37. Zhang, Y.; Yuan, Y.; Feng, Y.; Lu, X. Hierarchical and Robust Convolutional Neural Network for Very High-Resolution Remote Sensing Object Detection. IEEE Trans. Geosci. Remote Sens. 2019, 57, 5535–5548. [Google Scholar] [CrossRef]
  38. Li, K.; Wan, G.; Cheng, G.; Meng, L.; Han, J. Object Detection in Optical Remote Sensing Images: A Survey and a New Benchmark. ISPRS J. Photogramm. Remote Sens. 2020, 159, 296–307. [Google Scholar] [CrossRef]
  39. Xiao, Z.; Liu, Q.; Tang, G.; Zhai, X. Elliptic Fourier Transformation-Based Histograms of Oriented Gradients for Rotationally Invariant Object Detection in Remote-Sensing Images. Int. J. Remote Sens. 2015, 36, 618–644. [Google Scholar] [CrossRef]
  40. Zhu, H.; Chen, X.; Dai, W.; Fu, K.; Ye, Q.; Jiao, J. Orientation Robust Object Detection in Aerial Images Using Deep Convolutional Neural Network. In Proceedings of the 2015 IEEE International Conference on Image Processing (ICIP), Quebec City, QC, Canada, 27–30 September 2015; pp. 3735–3739. [Google Scholar] [CrossRef]
  41. Mundhenk, T.N.; Konjevod, G.; Sakla, W.A.; Boakye, K. A Large Contextual Dataset for Classification, Detection and Counting of Cars with Deep Learning. In Proceedings of the Computer Vision–ECCV 2016: 14th European Conference, Amsterdam, The Netherlands, 11–14 October 2016; Proceedings, Part III 14. Springer: Berlin/Heidelberg, Germany, 2016; pp. 785–800. [Google Scholar] [CrossRef]
  42. Zou, Z.; Shi, Z. Random Access Memories: A New Paradigm for Target Detection in High Resolution Aerial Remote Sensing Images. IEEE Trans. Image Process. 2017, 27, 1100–1111. [Google Scholar] [CrossRef]
  43. Roscher, R.; Volpi, M.; Mallet, C.; Drees, L.; Wegner, J.D. SemCity Toulouse: A benchmark for building instance segmentation in satellite images. ISPRS Ann. Photogramm. Remote Sens. Spat. Inf. Sci. 2020, 5, 109–116. [Google Scholar] [CrossRef]
  44. Rottensteiner, F.; Sohn, G.; Gerke, M.; Wegner, J.D.; Breitkopf, U.; Jung, J. Results of the ISPRS benchmark on urban object detection and 3D building reconstruction. ISPRS J. Photogramm. Remote Sens. 2014, 93, 256–271. [Google Scholar] [CrossRef]
  45. Maggiori, E.; Tarabalka, Y.; Charpiat, G.; Alliez, P. Can semantic labeling methods generalize to any city? The INRIA aerial image labeling benchmark. In Proceedings of the 2017 IEEE International Geoscience and Remote Sensing Symposium (IGARSS), Fort Worth, TX, USA, 23–28 July 2017; pp. 3226–3229. [Google Scholar] [CrossRef]
  46. Demir, I.; Koperski, K.; Lindenbaum, D.; Pang, G.; Huang, J.; Basu, S.; Hughes, F.; Tuia, D.; Raskar, R. DeepGlobe 2018: A Challenge to Parse the Earth through Satellite Images. In Proceedings of the IEEE Conference on Computer Vision and Pattern Recognition Workshops, Salt Lake City, UT, USA, 18–23 June 2018; pp. 172–181. [Google Scholar] [CrossRef]
  47. Qu, B.; Li, X.; Tao, D.; Lu, X. Deep Semantic Understanding of High Resolution Remote Sensing Image. In Proceedings of the 2016 International Conference on Computer, Information and Telecommunication Systems (CITS), Kunming, China, 6–8 July 2016; pp. 1–5. [Google Scholar]
  48. Zhang, F.; Du, B.; Zhang, L. Saliency-Guided Unsupervised Feature Learning for Scene Classification. IEEE Trans. Geosci. Remote Sens. 2014, 53, 2175–2184. [Google Scholar] [CrossRef]
  49. Lu, X.; Wang, B.; Zheng, X.; Li, X. Exploring Models and Data for Remote Sensing Image Caption Generation. IEEE Trans. Geosci. Remote Sens. 2017, 56, 2183–2195. [Google Scholar] [CrossRef]
  50. Cheng, Q.; Huang, H.; Xu, Y.; Zhou, Y.; Li, H.; Wang, Z. NWPU-Captions Dataset and MLCA-Net for Remote Sensing Image Captioning. IEEE Trans. Geosci. Remote Sens. 2022, 60, 5629419. [Google Scholar] [CrossRef]
  51. Zhang, Z.; Zhao, T.; Guo, Y.; Yin, J. RS5M: A Large Scale Vision-Language Dataset for Remote Sensing Vision-Language Foundation Model. arXiv 2023, arXiv:2306.11300. [Google Scholar]
  52. Schuhmann, C.; Vencu, R.; Beaumont, R.; Kaczmarczyk, R.; Mullis, C.; Katta, A.; Coombes, T.; Jitsev, J.; Komatsuzaki, A. Laion-400m: Open dataset of clip-filtered 400 million image-text pairs. arXiv 2021, arXiv:2111.02114. [Google Scholar]
  53. Sharma, P.; Ding, N.; Goodman, S.; Soricut, R. Conceptual captions: A cleaned, hypernymed, image alt-text dataset for automatic image captioning. In Proceedings of the 56th Annual Meeting of the Association for Computational Linguistics (Volume 1: Long Papers), Melbourne, Australia, 15–20 July 2018; pp. 2556–2565. [Google Scholar] [CrossRef]
  54. Li, J.; Li, D.; Savarese, S.; Hoi, S. Blip-2: Bootstrapping language-image pre-training with frozen image encoders and large language models. In Proceedings of the International Conference on Machine Learning, PMLR, Edmonton, AB, Canada, 30 June–3 July 2023; pp. 19730–19742. [Google Scholar] [CrossRef]
  55. Sumbul, G.; De Wall, A.; Kreuziger, T.; Marcelino, F.; Costa, H.; Benevides, P.; Caetano, M.; Demir, B.; Markl, V. BigEarthNet-MM: A large-scale, multimodal, multilabel benchmark archive for remote sensing image classification and retrieval [software and data sets]. IEEE Geosci. Remote Sens. Mag. 2021, 9, 174–180. [Google Scholar] [CrossRef]
  56. Zhang, Z.; Zhao, T.; Guo, Y.; Yin, J. RS5M and GeoRSCLIP: A Large Scale Vision-Language Dataset and a Large Vision-Language Model for Remote Sensing. IEEE Trans. Geosci. Remote Sens. 2024, 62, 5642123. [Google Scholar] [CrossRef]
  57. Hu, Y.; Yuan, J.; Wen, C.; Lu, X.; Liu, Y.; Li, X. RSGPT: A Remote Sensing Vision Language Model and Benchmark. ISPRS J. Photogramm. Remote Sens. 2025, 224, 272–286. [Google Scholar] [CrossRef]
  58. Cohen, J. A coefficient of agreement for nominal scales. Educ. Psychol. Meas. 1960, 20, 37–46. [Google Scholar] [CrossRef]
  59. Kirilenko, A.P.; Stepchenkova, S.O.; Kim, H.; Li, X. Automated sentiment analysis in tourism: Comparison of approaches. J. Travel Res. 2018, 57, 1012–1025. [Google Scholar] [CrossRef]
  60. Deng, J.; Dong, W.; Socher, R.; Li, L.J.; Li, K.; Fei-Fei, L. ImageNet: A Large-Scale Hierarchical Image Database. In Proceedings of the 2009 IEEE Conference on Computer Vision and Pattern Recognition (CVPR), Miami, FL, USA, 20–25 June 2009; pp. 248–255. [Google Scholar] [CrossRef]
Figure 1. Examples of different urban and infrastructure scenes captured by satellite imagery. The images represent different environments, illustrating the complexity and variability found in RS datasets. (a) Satellite view of a busy industrial port area, with several docked vessels and cargo operations visible. (b) Aerial view of a port with densely packed small boats and yachts, surrounded by residential areas. (c) A high-resolution satellite image of an organised port with a large number of ships anchored. (d) Satellite image of an airport showing multiple aircraft parked near terminals and a marked runway infrastructure. (e) A large car park with various vehicles distributed throughout and empty parking spaces highlighted. (f) Urban commercial district with high-rise buildings and a marked point of interest within the cityscape.
Remotesensing 17 02384 g001
Figure 2. Metrics per attribute for ResNet18.
Remotesensing 17 02384 g002
Figure 3. Metrics per attribute for VGG16.
Remotesensing 17 02384 g003
Figure 4. Metrics per attribute for InceptionV3.
Remotesensing 17 02384 g004
Figure 5. Metrics per attribute for EfficientNet-B0.
Remotesensing 17 02384 g005
Figure 6. Metrics per attribute for ViT-B/16.
Remotesensing 17 02384 g006
Figure 7. Occurrences of attributes in the dataset.
Remotesensing 17 02384 g007
Figure 8. Training accuracy comparison among the different models.
Remotesensing 17 02384 g008
Figure 9. Training loss comparison among the different models.
Remotesensing 17 02384 g009
Figure 10. Confusion matrix for ResNet18.
Remotesensing 17 02384 g010
Figure 11. Confusion matrix for VGG16.
Remotesensing 17 02384 g011
Figure 12. Confusion matrix for InceptionV3.
Remotesensing 17 02384 g012
Figure 13. Confusion matrix for EfficientNet-B0.
Remotesensing 17 02384 g013
Figure 14. Confusion matrix for ViT-B/16.
Remotesensing 17 02384 g014
Table 1. Comparison of WHU-RS19 ABZSL with other semantic or attribute-based RS datasets.
RS DatasetLevelManualTasksAttributes
xView3 [32]InstanceMixedDetectionVessel class, length
SATLAS [35]Image + PixelAutoSegmentation, Pretrain137 categories
BigEarthNet-MM [55]PatchMixedMulti-labelLand cover tags
RS5M [51]ImageAutoCaptioningText (weak)
RSICaps [57]ImageYesCaptioningText (human)
AwA2 [14]ClassYesZSLFixed class vectors
WHU-RS19 ABZSLImageYesZSL, XAIObjects, Geometry, Colour
Table 2. Number of images per category and corresponding train/test split in the WHU-RS19 ABZSL dataset.
CategoryTotalTrainTest
Airport523715
Beach543816
Bridge523616
Commercial523715
Desert543816
Farmland523715
Football Field543816
Forest523715
Industrial523715
Meadow523715
Mountain523715
Park543816
Parking543816
Pond523715
Port513615
Railway Station513615
Residential543816
River543816
Viaduct523715
Total1005702303
Table 3. Attribute refinement: from original set to final macro-categories.
Original AttributeFinal StatusJustification
RoadRetainedCommon in urban and transport scenes
BridgeRetainedHigh relevance for infrastructure understanding
BoatMerged (into Water Vehicles)Merged for generalisation
AirplaneMerged (into Aircraft)Low frequency, merged into class
PlaygroundRemovedToo rare and inconsistent across scenes
RedRetainedHigh visual salience in urban settings
PinkRemovedRare and visually ambiguous
PolygonRetainedStructurally relevant pattern
Zebra CrossingRemovedToo fine-grained for image resolution
Parking SlotMerged (into Infrastructure)Semantic overlap, infrequent
Table 4. Model architectures and training hyperparameters.
ModelInput SizeOptimiserLearning RateBatch Size
ResNet-18224 × 224Adam 1 × 10 4 32
VGG-16224 × 224Adam 1 × 10 4 32
InceptionV3299 × 299Adam 1 × 10 4 32
EfficientNet-B0224 × 224Adam 1 × 10 4 32
ViT-B/16224 × 224Adam 1 × 10 4 32
Table 5. Comparison of macro F1-scores among different models.
ModelMacro F1-Score
ResNet180.7385
VGG160.7458
InceptionV30.7465
EfficientNet-B00.7608
ViT-B/160.7594
Table 6. Classification report for ResNet18.
AttributePrecisionRecallF1-Score
Airplane1.000.800.89
Road0.890.930.91
Bridge0.940.620.75
Road Transport0.900.960.93
Houses0.840.480.62
Grass0.890.980.93
Trees0.950.950.95
Mountains0.930.930.93
Soil0.940.970.96
Water0.960.850.90
Sand1.000.850.92
Water Transport1.000.460.63
Dock0.900.690.78
Stadium1.000.900.95
Football Field0.670.570.62
Buildings0.880.860.87
Parking Spots0.760.910.83
Rails1.000.530.70
Trains1.000.500.67
Red0.720.530.61
Orange0.000.000.00
Ochre0.000.000.00
Beige0.860.850.85
Green0.870.860.87
Light Blue0.770.690.73
Blue0.920.920.92
Brown0.890.970.93
Gray0.950.960.96
White0.870.820.84
Black0.820.690.75
Rectangle0.930.900.92
Triangle0.000.000.00
Square0.500.280.36
Sine Wave0.790.610.69
Line0.790.890.84
Dashed Line0.650.290.40
Curve0.920.870.89
Closed Curve0.870.730.79
Table 7. Classification report for VGG16.
AttributePrecisionRecallF1-Score
Airplane1.000.700.82
Road0.900.960.93
Bridge0.720.810.76
Road Transport0.880.950.91
Houses0.590.670.63
Grass0.880.960.92
Trees0.930.980.95
Mountains0.930.930.93
Soil0.940.990.96
Water0.860.860.86
Sand1.000.850.92
Water Transport0.610.680.64
Dock0.480.770.59
Stadium1.000.900.95
Football Field0.750.860.80
Buildings0.840.920.88
Parking Spots0.740.930.82
Rails0.610.730.67
Trains0.730.790.76
Red0.560.660.60
Orange0.400.200.27
Ochre0.000.000.00
Beige0.780.840.81
Green0.910.840.87
Light Blue0.680.780.73
Blue0.870.880.87
Brown0.880.960.92
Gray0.950.960.95
White0.920.840.88
Black0.810.720.77
Rectangle0.900.880.89
Triangle0.140.050.07
Square0.290.310.30
Sine Wave0.610.640.62
Line0.800.790.80
Dashed Line0.570.530.55
Curve0.940.920.93
Closed Curve0.770.820.80
Table 8. Classification report for InceptionV3.
AttributePrecisionRecallF1-Score
Airplane1.000.800.89
Road0.900.960.93
Bridge0.780.790.78
Road Transport0.880.950.91
Houses0.710.360.48
Grass0.890.960.92
Trees0.930.950.94
Mountains0.930.930.93
Soil0.960.990.97
Water0.920.930.93
Sand1.000.850.92
Water Transport0.930.500.65
Dock0.880.540.67
Stadium1.000.900.95
Football Field0.781.000.88
Buildings0.900.900.90
Parking Spots0.770.820.79
Rails1.000.530.70
Trains1.000.570.73
Red0.700.580.64
Orange0.500.100.17
Ochre0.000.000.00
Beige0.880.830.85
Green0.930.870.90
Light Blue0.780.690.73
Blue0.940.820.88
Brown0.890.980.93
Gray0.920.980.95
White0.860.880.87
Black0.830.560.67
Rectangle0.930.860.89
Triangle0.000.000.00
Square0.570.280.37
Sine Wave0.810.470.60
Line0.770.700.73
Dashed Line0.650.530.58
Curve0.910.910.91
Closed Curve0.830.810.82
Table 9. Classification report for EfficientNet-B0.
AttributePrecisionRecallF1-Score
Airplane1.000.900.95
Road0.930.940.94
Bridge0.830.730.78
Road Transport0.880.980.93
Houses0.690.610.65
Grass0.900.970.93
Trees0.950.940.95
Mountains1.000.930.97
Soil0.970.990.98
Water0.980.940.96
Sand1.000.850.92
Water Transport0.730.570.64
Dock0.820.690.75
Stadium0.900.900.90
Football Field0.781.000.88
Buildings0.920.870.89
Parking Spots0.770.870.81
Rails1.000.670.80
Trains1.000.710.83
Red0.630.620.63
Orange0.000.000.00
Ochre0.000.000.00
Beige0.800.830.81
Green0.930.860.90
Light Blue0.780.580.67
Blue0.900.870.89
Brown0.890.970.93
Gray0.970.940.96
White0.890.820.86
Black0.860.690.76
Rectangle0.900.930.91
Triangle0.100.050.07
Square0.470.280.35
Sine Wave0.700.580.64
Line0.760.820.78
Dashed Line0.570.740.64
Curve0.920.910.91
Closed Curve0.850.820.84
Table 10. Classification report for ViT-B/16.
AttributePrecisionRecallF1-Score
Airplane1.000.900.95
Road0.880.960.92
Bridge0.920.690.79
Road Transport0.880.960.92
Houses0.650.610.62
Grass0.880.990.93
Trees0.950.960.96
Mountains0.930.930.93
Soil0.960.990.97
Water0.970.860.91
Sand1.000.800.89
Water Transport0.760.570.65
Dock0.690.690.69
Stadium1.000.900.95
Football Field0.781.000.88
Buildings0.900.900.90
Parking Spots0.760.870.81
Rails1.000.600.75
Trains1.000.640.78
Red0.730.620.67
Orange0.000.000.00
Ochre0.000.000.00
Beige0.820.870.84
Green0.920.890.91
Light Blue0.850.600.70
Blue0.940.880.91
Brown0.870.980.92
Gray0.950.970.96
White0.900.870.89
Black0.840.690.76
Rectangle0.880.940.91
Triangle0.330.050.09
Square0.430.210.28
Sine Wave0.740.560.63
Line0.780.840.81
Dashed Line0.660.550.60
Curve0.940.930.94
Closed Curve0.840.840.84
Table 11. Qualitative examples of attribute classification on remote sensing images using EfficientNet-B0.
ImagePredicted AttributesPredicted Count
Remotesensing 17 02384 i001Mountains, Green, Brown, Gray, White5
Remotesensing 17 02384 i002Road, Grass, Trees, Soil, Green, Brown, Gray, Rectangle8
Remotesensing 17 02384 i003Road, Road Transport, Grass, Trees, Soil, Water, Water Transport, Beige, Green, Blue, Brown, Gray, Sine Wave, Line, Curve, Closed Curve16
Remotesensing 17 02384 i004Road, Bridge, Road Transport, Houses, Grass, Trees, Soil, Water, Buildings, Parking Spots, Rails, Trains, Red, Beige, Green, Blue, Brown, Gray, Black, Rectangle, Sine Wave, Line, Curve23
Remotesensing 17 02384 i005Road, Road Transport, Grass, Trees, Soil, Water, Buildings, Parking Spots, Rails, Trains, Beige, Green, Brown, Gray, White, Rectangle, Square, Line, Curve, Closed Curve20
Disclaimer/Publisher’s Note: The statements, opinions and data contained in all publications are solely those of the individual author(s) and contributor(s) and not of MDPI and/or the editor(s). MDPI and/or the editor(s) disclaim responsibility for any injury to people or property resulting from any ideas, methods, instructions or products referred to in the content.

