Abstract
The monsoon is regarded as a key system influencing tropical cyclone (TC) activity over the Western North Pacific (WNP). However, the relationship between WNP TC frequency (TCF) and the monsoon across different timescales remains incompletely understood. This study explores the interannual-scale relationship between WNP TCF and the WNP summer monsoon over the period 1982–2020. We found that the interannual variation in basin-scale TCF is dominated by dynamic factors, particularly lower troposphere vorticity and middle troposphere ascending motion, which are driven by the WNP summer monsoon. Enhanced monsoonal precipitation over the WNP intensifies convective heating, which acts as a diabatic heat source and triggers a Rossby wave response to the west. This response generates anomalous lower troposphere cyclonic circulation and ascending motion in the main TC development region. In turn, the strengthened WNP summer monsoon circulation further amplifies precipitation, establishing positive feedback between atmospheric circulation and convection. This mechanism establishes dynamic conditions favorable for TC genesis, thereby dominating the basin-scale interannual variation in TCF.
1. Introduction
The Western North Pacific (WNP) is the most conducive basin for tropical cyclone (TC) genesis among all ocean basins [1,2,3]. The WNP provides favorable conditions for TC genesis due to its high sea surface and subsurface temperatures that fulfill the thermodynamic requirements for genesis year-round. During boreal summer and autumn, the WNP is also strongly influenced by the summer monsoon system, which creates a large-scale lower troposphere cyclonic circulation, middle troposphere ascending motion, and convection. These combined conditions create a conducive large-scale environment and initiate the disturbances that lead to TC formation [4,5,6,7,8].
Prior studies have analyzed the contributing factors for the interannual variability of TCs in the WNP [9,10,11], with particular emphasis on the impacts of sea surface temperature (SST). Chan [12] examined the temporal variability of basin-scale TCF over the WNP and identified a dominant interannual variability of 3–3.5 years, which was mainly linked to the Southern Oscillation. It has been demonstrated that the El Niño–Southern Oscillation (ENSO) modulates the genesis position of TCs in the WNP, which shifts southeastward (northwestward) during El Niño (La Niña) years [9,13,14,15,16,17]. El Niño is classified into Central and Eastern Pacific types based on the SST warming location, with each type exerting distinct influences on TC activity [18,19]. TCs show a higher frequency of eastward occurrence in Eastern Pacific El Niño years than during central Pacific events [20,21,22]. Although ENSO effectively influences the TC genesis location, its impact on the overall basin-scale TC frequency remains relatively limited [13,14].
The North Pacific Meridional Mode (PMM) is characterized by warm SSTs extending from the central equatorial Pacific to Baja California [23,24]. Studies have shown that the warm PMM SST can excite anomalous lower (upper) troposphere cyclonic (anticyclonic) circulation over the WNP, resulting in increased lower troposphere vorticity, which facilitates TC genesis [25,26]. By focusing on the interannual timescale, Wu et al. [27] suggested that ENSO can affect the relationship between WNP TCF and PMM. The PMM can also modulate TCF by altering the activity of the tropical waves. Yu et al. [28] showed that positive phases of the PMM facilitate the transfer of barotropic energy from the mean flow into eddy kinetic energy, which fuels the tropical waves and provides more energy for TC genesis.
Anomalous tropical Indian Ocean SST also affects the interannual variability of the WNP TCF. Warming SST in the tropical Eastern Indian Ocean can excite an equatorial Kelvin wave response that ultimately induces an anomalous lower troposphere anticyclone circulation over the WNP, thereby significantly suppressing TC formation [29,30,31]. Gao et al. [32] revealed a robust interannual correlation between Indian Ocean SST and rapidly intensifying TCs over the WNP. However, the association between the Indian Ocean SST anomalies and WNP TCF varies over time, likely due to the synergistic impacts of Indian Ocean SST and different types of ENSO. A strong negative Indian Ocean Dipole coupled with Eastern Pacific warming leads to an increase in tropical cyclones in the WNP [31,33,34].
The above-mentioned studies suggest that the remote SSTs modulate TCs over some specific regions of the WNP through changes in atmospheric circulation. As in the WNP, the oceanic monsoon is the key circulation system, which has been demonstrated to be vital for TC formation. Previous studies have shown that the changes in TC genesis location are associated with the monsoon trough [35,36,37]. Within the monsoon trough, the convergence of trade winds and westerly monsoons accompanies ascending motion and strong convective activity, providing favorable environmental conditions that facilitate TC formation. The zonal displacement of the monsoon trough influences TCF on a regional scale, while the basin-scale TCF in the WNP is less affected [4,5,38,39,40,41]. Moreover, the intensity and eastward expansion of the monsoon trough have been demonstrated to affect the TCF over the Southeastern WNP [39,42].
The monsoon trough is an integral component of the WNP summer monsoon. The role of circulation in the WNP monsoon based on the variability of TCF has been studied on a regional scale from June to August [43,44]. Choi et al. [43] found that a high WNP monsoon circulation index is related to the increased probability of TC genesis over the Southeastern WNP, whereas a negative index is associated with more TC genesis over the Northwestern WNP. Zhao et al. [44] found that the positive correlation between the WNP monsoon and TCF on interannual timescales is dominated by the TCs in the monsoon trough, which affects regional rather than basin-wide TCF. And there is a clear interdecadal change in the monsoon–TCF relationship, suggesting that this relationship may differ between decadal and interannual timescales. Additionally, most of the above-mentioned studies reveal the changes in TCF over the regional scale of WNP. The determining factors for the interannual variation in the main development region of TCF are still inclusive.
Motivated by the above studies, this work will examine environmental factors affecting the basin-scale TCF in the WNP and identify the linkage between the basin-scale TCF and WNP monsoon on the interannual timescale. Numerical simulations will be used to verify the impact of WNP monsoon rainfall on the key environmental factors. The remainder of this study is organized as follows: Section 2 introduces the datasets and methods. In Section 3, we demonstrate the close association between the WNP monsoon and basin-scale TCF on the interannual timescale and examine the key role of monsoon rainfall in modulating TC-related environmental factors. Section 4 presents a summary of the main findings.
2. Datasets and Methods
2.1. Datasets
In this work, we only analyzed TCs with maximum sustained wind speeds reaching or exceeding 34 knots. TC intensity estimation is mainly based on the Dvorak technique, which derives intensity estimates from cloud patterns observed by enhanced IR and/or visible satellite imagery. The estimated intensity code is converted to the wind speed [45]. The observed TC data are from NOAA IBTrACS v4 for the period 1980–2022 [46]. The datasets include the position (latitude and longitude) of TC centers, along with their maximum wind speeds and minimum central pressure every 6 h. The genesis point is identified as the position where the maximum surface wind speed exceeds 34 knots for the first time. The study focuses on the period from July to October, which refers to the peak TC season in the main development region ([10°N–25°N, 110°E–160°E]). To better measure the oceanic monsoon rainfall, we used three rainfall datasets: the Tropical Rainfall Measuring Mission (TRMM), Global Precipitation Measurement (GPM), and Global Precipitation Climatology Project (GPCP). As a major satellite mission, TRMM monitored rainfall patterns across the low-latitude belts, including both tropical and subtropical zones. The precipitation radar of TRMM measured precipitation in the atmospheric column. The qualification of rainfall intensity in the TRMM was assessed through the measured microwave energy emitted from the Earth and the atmosphere [47,48]. The precipitation data from TRMM covers the period of 1997–2015 at an approximate grid size of 0.25° × 0.25°. GPM data were used to extend the temporal coverage from 2016 to 2022. GPM retrieves precipitation data using both dual-frequency radar and microwave imaging instruments. To build up a relatively long temporal coverage of satellite-observed precipitation, we merged TRMM and GPM data. The GPCP precipitation combined satellite-based rainfall estimates over global oceans and sounding observation and gauge station data over global land [49,50]. We use the data from 1980 to 2022 on a 2.5° × 2.5° spatial grid. SST data from the Hadley Centre’s Sea Ice and SST dataset (HadISST v1) were used in this study [51]. They use a horizontal resolution of 1° × 1°. Reanalysis data were obtained from the European Centre for Medium-Range Weather Forecasts fifth-generation global reanalysis (ERA5) dataset, with a resolution of 0.25° × 0.25° [52]. Atmospheric variables included zonal wind, meridional wind, vertical velocity, precipitation, etc.
To obtain the interannual component, we first calculated the 5-year running mean and then subtracted it from the original data. This procedure was applied to all datasets. A sensitive test using the 7-year running mean yielded similar results.
2.2. Methods
The TC genesis potential index (GPI) provides an empirical estimate of TC activities according to large-scale environmental fields. Dynamic GPI (DGPI) can well represent the observed interannual variation in TC frequency [53]. It is expressed as follows:
where is the vertical wind shear between 850 and 200 hPa; is the meridional gradient of zonal wind at 500 hPa; is the 500 hPa vertical pressure velocity; and is the absolute vorticity at 850 hPa. To assess the contribution of individual components to the change in DGPI, their respective contributions are quantified using the following formula:
Using Equation (2), the impact of each term on the DGPI change is calculated (e.g., , , , ).
According to Wang and Fan [54], the Western North Pacific monsoon index (WNPMI) is formulated as follows:
where U850 refers to the zonal wind at 850 hPa. A positive value of U850 in the box of [5°N–15°N, 100°E−130°E] combined with a negative value of U850 in the box of [20°N−30°N, 110°E−140°E] results in a positive WNPMI, indicating a strengthened monsoon rainfall. The monsoon rainfall index is defined as the precipitation averaged over the main development region.
The linear baroclinic model (LBM) is a simplified atmospheric model without detailed physical processes [55]. It is used to examine how atmospheric circulation is influenced by artificial atmospheric diabatic heating. This model is configured at a T42 horizontal resolution, scaling to the resolution of ~2.8°. It has 20 vertical layers. The mean atmospheric circulation for the climatology of July–October during 1982–2020 is specified as the model’s basic state. The LBM experiment ran for 50 days, with atmospheric circulation responses to heating analyzed using data from the final 30 days.
3. Results
3.1. Close Association Between TCF and WNP Monsoon
Figure 1 illustrates the climatological distributions of the TCF, low-troposphere circulation, precipitation, and interannual variations in precipitation during JASO for the period of 1982–2020. The pattern of TCF reveals a high frequency of genesis events occurring across the main development region. And the TC genesis peaked along the climatological WNP monsoon trough (Figure 1b), which is characterized by intense convective activity and abundant precipitation. The monsoon circulation provides critical dynamic conditions for TC genesis, including lower troposphere positive relative vorticity and convergence environment, a wet middle-level atmosphere, and upper-level divergence [4,5,56]. The distribution of precipitation variation further reveals that the region with more TCs also exhibits significant interannual variation in rainfall. This may suggest a potential link between TCF and variability in monsoon rainfall (Figure 1c). Therefore, in the following sections, we focus on TCF in the main development region to investigate the interannual relationship between the WNP monsoon and tropical cyclone activity.
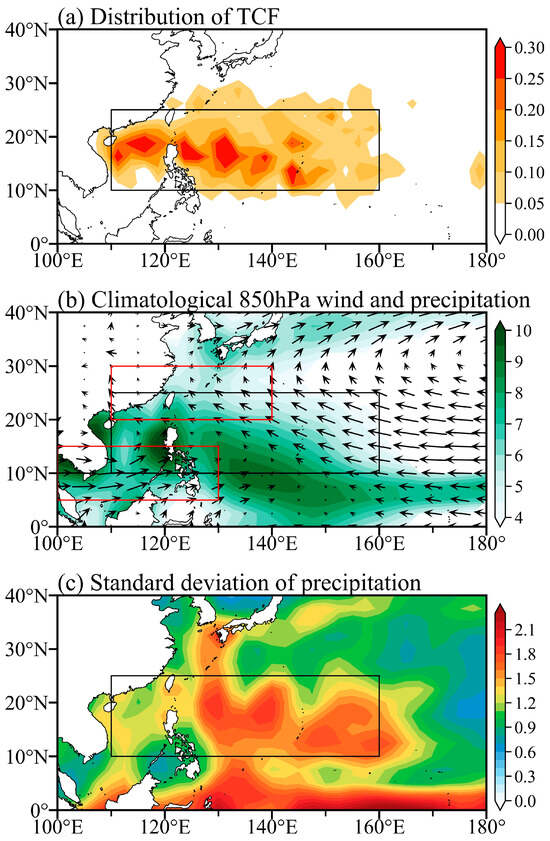
Figure 1.
Climatological mean states averaged from 1982 to 2020 from July to October. (a) TCF density distribution on a 2.5° × 2.5° grid box; (b) 850 hPa winds (m s−1) and precipitation (shading, mm day−1); and (c) interannual variation (mm day−1, represented by standard deviation) of precipitation. The black boxes represent the main TC development region. The red boxes outline the areas that define the WNP monsoon index. The precipitation data are from GPCP.
To investigate the interannual relationship between basin-scale TCF and the WNP monsoon, we first computed the WNP monsoon index [54]. Analysis at the decadal timescale revealed a weak negative correlation between the WNPMI and TCF (Figure 2a). In contrast, on the interannual timescale, a significant (p < 0.05) positive correlation was observed, showing a correlation coefficient of 0.53. This highlights the pronounced interannual association between the WNP monsoon and TC frequency (Figure 2b).
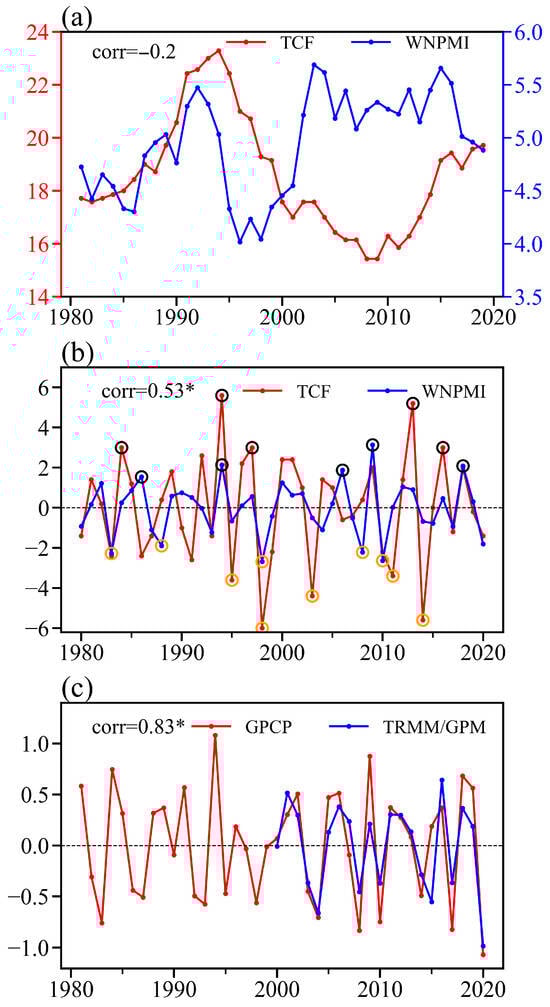
Figure 2.
(a) Decadal variation in TCF (red) and the WNP monsoon index (WNPMI, blue); (b) interannual variation in TCF (red) and WNPMI (blue); and (c) interannual variation in the GPCP (red) and TRMM/GPM (blue) precipitation. The black and yellow circles in (b) represent the years with TCF standard deviation values above +1 and below −1, respectively. * indicates statistical significance exceeding the 95% confidence level.
The monsoon index effectively captures the interannual variation in the WNP monsoon rainfall intensity during 1982–2020 from the GPCP dataset (r = 0.72, p < 0.05, Table 1). To verify the reliability of the GPCP dataset, we compared the interannual correlation between GPCP and the combination of TRMM and GPM precipitation over the main development region. Figure 2c shows that the two time series have exhibited similar interannual variations since 1998. This indicates that GPCP effectively captures the interannual variability of WNP monsoon rainfall, which is comparable to satellite observations. To ensure extended temporal coverage, GPCP data are utilized in the following analysis for the monsoon–TCF relationship.

Table 1.
Correlation coefficients among TCF, precipitation, WNPMI, and SST over the WNP. All variables within the TC main development region. * indicates statistical significance exceeding the 95% confidence level.
3.2. Key Environmental Factors Determine the Interannual Variation in Basin-Scale TCF
Large-scale seasonal mean environmental conditions are vital for WNP TC genesis [57,58,59]. We began by analyzing the environmental conditions, including SST, precipitation, 850 hPa vorticity and winds, middle troposphere vertical pressure velocity and relative humidity, and vertical wind shear, all of which influence TC formation over the WNP [57,58,59,60]. By regressing large-scale environmental fields onto the interannual time series of TCF, it indicates that only slight positive SST anomalies extend from the central equatorial Pacific to the vicinity of California (Figure 3a), resembling the pattern of the Pacific Meridional Mode [61,62,63]. However, most of the positive SST regions in the Eastern Central Pacific show insignificant correlations with basin-scale TCF, suggesting that the Pacific Meridional Mode is likely not the dominant factor driving the interannual variation in basin-scale TCF during 1982–2020. In the Western Pacific, TCF shows a significant negative correlation with local SST. This suggests that cooler SSTs do not necessarily lead to a decrease in TCF. The correlation coefficient between the TCF and SST over the main TC development region is −0.4 (p < 0.05, Table 1). This is notably different from other ocean basins, where active TC activities are often associated with a higher SST relative to the tropical average [64,65].
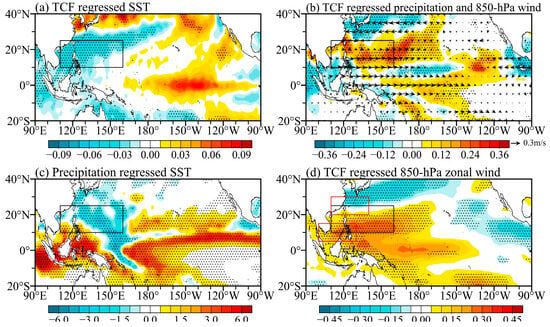
Figure 3.
Basin-scale TCF regressed (a) sea surface temperature (K) and (b) precipitation (mm day−1) patterns. (c) Point-to-point precipitation regressed SST. (d) Basin-scale TCF regressed 850 hPa zonal wind (m s−1).
Within the main TC development region, the increased TCF is associated with positive precipitation anomalies accompanied by enhanced lower troposphere cyclonic circulations (Figure 3b). It should be noted that the positive precipitation is not the response to SST changes because of the negative correlation between local SST and precipitation (Figure 3c). The area-averaged correlation coefficient is −0.4 (p < 0.05, Table 1). Therefore, the interannual variation in basin-scale TCF is more likely associated with seasonal mean monsoon rainfall and circulation rather than with SST and its related thermodynamic effects. This is further confirmed by the significant positive correlation (r = 0.53, p < 0.05) between the monsoon rainfall index and basin-scale TCF (Table 1). Note that the tropical zonal wind is positively correlated with the TCF, while an opposite correlation is found over the subtropics (Figure 3d). This opposite correlation between the two monsoon index-related boxes suggests that a strengthened WNP monsoon circulation is linked to enhanced TC activity (Figure 3d).
To further explore how large-scale environmental factors affect the interannual variation in basin-scale TCF, we first calculated the standard deviation of the interannual variation in WNP TCF. Based on this, we identified five years exceeding 1 standard deviation and five years below the −1 standard deviation as active TCF years and inactive TCF years, respectively (Figure 2b). The five active TCF years are 1984, 1994, 1997, 2013, and 2016, and the five inactive TCF years are 1995, 1998, 2003, 2011, and 2014 (Figure 2b). The composite differences in SST, precipitation, and dynamic conditions between the active and inactive TCF years are illustrated in Figure 4. In the main TC development region, SST exhibits negative anomalies (Figure 4a), while precipitation generally shows positive anomalies in the same areas (Figure 4b). At lower levels, the wind field displays anomalous cyclonic circulation and positive vorticity (Figure 4c). In the mid-troposphere, vertical pressure velocity anomalies are negative north of 10°N (Figure 4d), indicating a strong upward motion. Over the upper troposphere, a clear anticyclonic circulation is observed over the WNP, which is opposite to the lower troposphere circulation (Figure 4f). The nearly opposite-signed changes in lower and upper-level circulation align with the theoretical Rossby wave response to atmospheric heating [66]. In contrast to the dynamic factors favoring TC genesis, the cold SST anomalies and drier middle troposphere relative humidity are shown over the majority of the WNP, suggesting thermodynamic conditions have negative impacts on TC genesis on interannual timescales (Figure 4e). Therefore, we emphasize that changes in TCF are primarily influenced by dynamic processes.
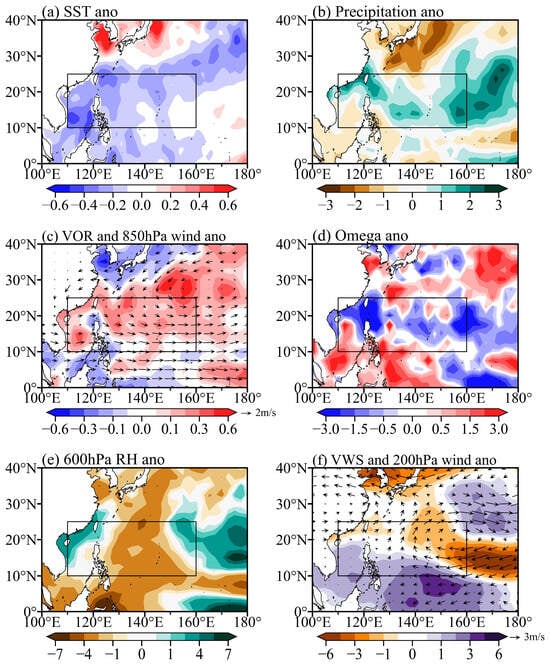
Figure 4.
Composite differences in environmental fields between the five active (>1 standard deviation) and five inactive (<−1 standard deviation) TC frequency years. Differences in (a) SST (K); (b) precipitation (mm day−1); (c) 850 hPa relative vorticity (10−5 s−1) and circulation (m s−1); (d) vertical pressure velocity (10−2 Pa s−1); (e) relative humidity at 600 hPa (%); and (f) 200 hPa circulation and vertical wind shear (m s−1) are shown.
The development of DGPI primarily focuses on the influence of atmospheric circulation on TC genesis [53]. To further identify the key dynamic factors driving TC genesis, we computed the difference in DGPI between years with active and inactive TCF. Figure 5a shows that the DGPI anomalies exhibit positive values in the main TC development region, particularly around the monsoon trough (Figure 5a). This indicates that more favorable large-scale dynamical environmental conditions exist in years with higher TC genesis numbers. The relative importance of individual factors is diagnosed using Equation (2). As shown in Figure 5b, the lower troposphere vorticity contributes the most to this, followed by vertical motion and the meridional gradient of 500 hPa zonal wind, whereas the influence of VWS is comparatively weak. These four components together account for over 75% of the DGPI change.
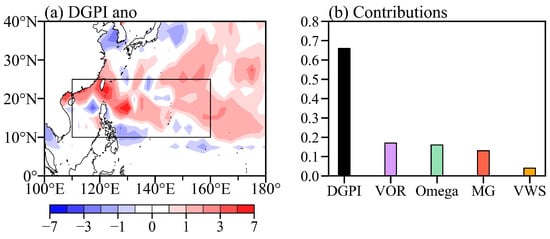
Figure 5.
(a) DGPI anomalies between the five high- and low-TCF years and (b) regional-averaged DGPI and the contribution from individual factors.
Figure 6 shows the spatial pattern of the contributions from individual terms. The contribution from low-level vorticity has a positive sign in nearly the entire main TC development region, which is in alignment with the basin-wide increase in TCF (Figure 6a). The middle-level vertical motion positively contributes to the increase in TCF over the central and eastern parts of the main TC development region (Figure 6b). The positive contribution from the meridional gradient of the 500 hPa zonal wind is mainly located along the monsoon trough, while there is a negative contribution east of 140°E (Figure 6c). The vertical wind shear demonstrates a dipole pattern (Figure 6d), suggesting its effective role in changing the TC genesis location but its lower significance for basin-wide TCF changes [9,13,14,15].
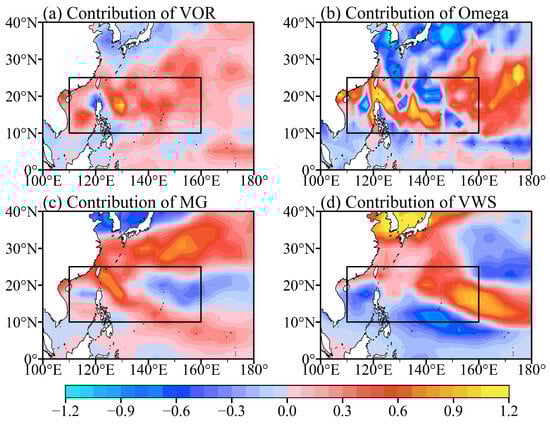
Figure 6.
Spatial patterns of the contributions from (a) 850 hPa relative vorticity (VOR); (b) 500 hPa vertical pressure velocity (Omega); (c) the 500 hPa meridional gradient of the zonal wind (MG), and (d) vertical wind shear (VWS) to DGPI changes. The results of active TCF years without inactive TCF years are shown.
3.3. Dominance of WNP Monsoon on TC Environmental Factors and Frequency
How does the WNP monsoon drive the TCF and related environmental factors? To explore this, we computed the standard deviation of the WNP monsoon index. Five years with values greater than +1 standard deviation, which were classified as high WNPMI years, and five years with values less than −1 standard deviation, which were classified as low WNPMI years, were selected to perform a composite difference analysis (Figure 2b). The high WNPMI years were 1986, 1994, 2006, 2009, and 2018, and the low WNPMI years were 1983, 1988, 1998, 2008, and 2010 (Figure 2b). In the high WNPMI years, an average of 20.2 TCs formed in the peak season, while in the low WNPMI years, this number dropped to 15.4 events, yielding a difference of 4.8 TCs. This translates to about one-quarter of the climatological events from 1982 to 2020 (18.2 events) and two-thirds of the standard deviation of the interannual variation (6.8 events). Figure 7 shows the differences in SST and key TC environmental factors. There are negative SSTs west of 160°E, which are associated with the positive precipitation east of the Philippine Sea (Figure 7a,b). It indicates that the changes in SST are in response to an increase in precipitation and cloudiness, which is consistent with the findings of Wang et al. [67]. As shown in Figure 7c, enhanced westerly winds over the low latitudes of the WNP and enhanced easterly winds over the subtropical WNP increase the basin-wide cyclonic vorticity, facilitating TC genesis. The increases in vertical motion are mainly located south of 20°N, which is in alignment with the precipitation (Figure 7b,f). Changes in vertical wind shear display a clear spatial pattern, with enhanced shear over the Southwestern WNP and reduced shear across the Northwestern WNP. Notably, during strong monsoon years, the mid-troposphere over much of the WNP exhibits an anomalously low relative humidity (Figure 7e). This pattern is consistent with the composite analysis of high and low TCF years, reinforcing the notion that thermodynamic factors play an opposite role in driving the interannual variation in WNP TCF (Figure 7a,e). In addition, the WNP monsoon plays a critical role in modulating large-scale dynamical environmental conditions conducive to TC genesis.
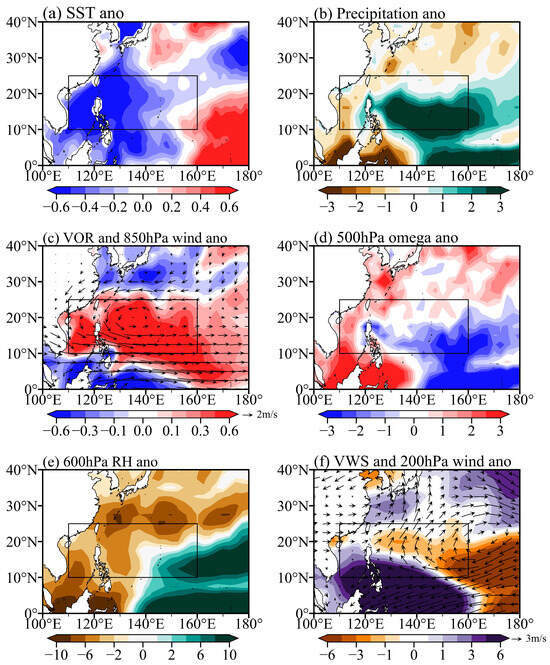
Figure 7.
Composite differences in (a) SST (K); (b) precipitation (mm day−1); (c) 850 hPa vorticity (10−5 s−1) and circulation (m s−1); (d) 500 hPa vertical pressure velocity (10−2 Pa s−1); (e) 600 hPa relative humidity (%); and (f) 200 hPa circulation and vertical wind shear (m s−1) between the active WNP monsoon years and the inactive WNP monsoon years.
How does enhanced WNP monsoon precipitation influence the large-scale circulation and thereby shape the dynamic environmental conditions favorable for TC genesis? To verify this, we conducted an atmospheric forcing experiment using the linear baroclinic model. Figure 8 shows the experimental design. In this experiment, the prescribed diabatic heating was located over [10°N–20°N, 120°E–160°E], where more precipitation occurs during the strong monsoon years (Figure 8a). The maximum heating rate is set to 2 K day−1 and centered at 300 hPa. The heating is decayed upward and downward (Figure 8b). The mean tropical circulation is derived from the climatological boreal summer winds (Figure 8c).
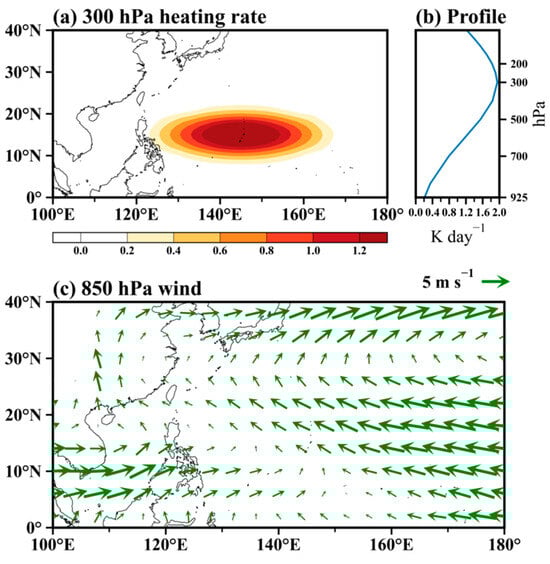
Figure 8.
Experimental design of linear baroclinic experiment. (a) Spatial pattern of heating at 300 hPa (K day−1); (b) vertical profile of prescribed atmospheric heating; and (c) climatological 850 hPa circulations used as basic state.
After the model simulation reaches a stable state, the response of atmospheric circulation reveals low-level cyclonic circulation west of the heating center in the WNP region (Figure 9a). East of the heating center, anomalous easterly winds prevail in the lower troposphere. Over the upper troposphere, the circulation response is dominated by an anticyclonic circulation and westerly wind located east of 160°E (Figure 9c). The divergence of the upper troposphere and convergence of the lower troposphere circulation promotes an ascending motion in the atmospheric column (Figure 9b). This baroclinic atmospheric circulation structure is a typical pattern of the Gill-type Rossby response [66].
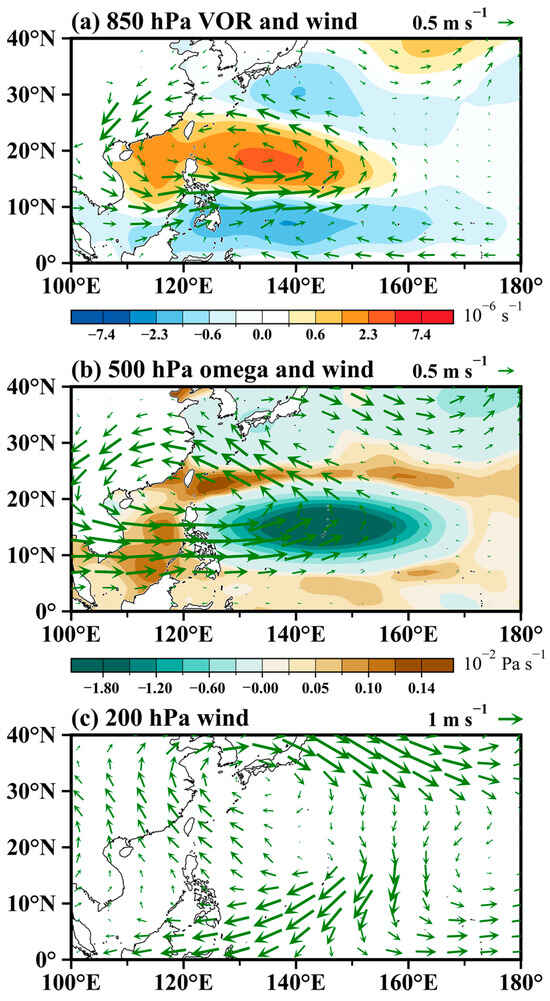
Figure 9.
The steady response of (a) 850 hPa wind (m s−1) and relative vorticity (10−6 s−1), (b) 500 hPa wind (m s−1) and omega (10−2 Pa s−1), and (c) 200 hPa wind (m s−1) to specified atmospheric heating.
Atmospheric heating-induced changes in environmental conditions favor TC genesis. The enhanced cyclonic circulation in the lower troposphere increases relative vorticity (Figure 9a), which is a key dynamic factor contributing to the interannual variation in TCF (Figure 5 and Figure 6). At 500 hPa, horizontal wind anomalies are characterized by westerlies over low latitudes and easterlies over the subtropics, resulting in the enhanced meridional shear of the zonal wind—another favorable condition for TC genesis (Figure 9b). Additionally, the ascending motion at 500 hPa supports the development of convection (Figure 9b). Thus, the change in atmospheric circulation could further enhance moisture convergence and monsoon rainfall. This positive precipitation-circulation feedback establishes favorable dynamic conditions, which facilitates the TC genesis. Moreover, the simulated response of atmospheric circulations closely resembles the differences in large-scale environmental fields associated with the interannual variation in the WNP monsoon, as well as that from the interannual variation in the basin-scale TCF (Figure 4 and Figure 7), further confirming that the heat forced from monsoonal precipitation over the WNP can dynamically influence the basin-scale TCF on the interannual timescale.
4. Conclusions
The WNP experiences the highest frequency of TC genesis worldwide, exhibiting substantial interannual variability [12]. Most studies have revealed the influence of interannual air–sea-coupled modes on regional-scale TC frequency [13,14,15,16,17], but our understanding on a basin scale remains inconclusive. This study explores the relationship between the interannual variations in basin-scale WNP TC frequency and its summer monsoon precipitation from 1982 to 2020. Results show that there is a significant positive correlation between basin-scale TC frequency and WNP monsoon circulation, as well as monsoon rainfall. In contrast, the interannual variation in basin-scale TCF is less affected by SSTs over the central and Eastern Pacific, revealing the relatively weaker roles of ENSO and the Pacific Meridional Mode. Nevertheless, ENSO effectively modulates regional-scale TC frequency by altering lower tropospheric vorticity, middle tropospheric humidity, and vertical wind shear over the Southeastern and Northwestern WNP. For instance, more TCs occur over the Southeastern WNP during El Niño years, while fewer occur during La Niña years [20,21].
The interannual variation in basin-scale TC frequency is predominantly driven by dynamic rather than thermodynamic factors. Comparing environmental conditions between active and inactive TC years over the WNP reveals that interannual variations in TC frequency are primarily controlled by large-scale dynamic factors, with low-level cyclonic vorticity and mid-level upward motion playing central roles. Active TC years are typically characterized by a significant anomalous lower troposphere cyclonic circulation and enhanced vertical ascent, providing favorable dynamic conditions for TC genesis. However, the SST and relative humidity are lower in the TC-active years, suggesting the thermodynamic effects would partially reduce the impacts from dynamic conditions. These findings are further supported by the diagnostic analysis of the DGPI.
The WNP monsoon is effectively modulating atmospheric circulation, forming favorable large-scale dynamic conditions for TC genesis. During active WNP monsoon years, abundant monsoon rainfall induces a Rossby wave response across the main TC development region. It enhances the lower troposphere cyclonic circulation and generates anticyclonic circulation over the upper troposphere. This baroclinic vertical circulation change promotes the middle-level ascending motion. Moreover, the atmospheric heating-induced circulation change triggered by monsoon precipitation further strengthens the low-level circulation convergence and convection, leading to more precipitation. Positive feedback processes further promote TC genesis over the WNP. The linear baroclinic model experiment confirmed the above physical mechanisms. In contrast, there are lower SST and middle-level relative levels of humidity in the active WNP monsoon years. Therefore, monsoonal precipitation-induced atmospheric heating effectively shapes the dynamic conditions needed for TC genesis.
The WNP lower troposphere circulation is also potentially affected by remote SST forcings via atmospheric teleconnections. The warming of the SST over the Indian Ocean can trigger an equatorial Kelvin wave that leads to the development of anomalous anticyclonic circulation over the WNP [29,30,31]. The SST anomaly over the tropical Atlantic Ocean could affect the WNP circulation through air–sea interactions over the Eastern Pacific Ocean and/or over the Indian Ocean [68,69]. They could cause possible impacts from decadal modes and intraseasonal oscillation on the interannual variation in WNP circulation [70,71].
It is of interest to note that the close monsoon–TC relationship is only robust on the interannual timescale. The weaker relationship on the decadal timescale may be due to the fact that the relationship between the SST, precipitation, and atmospheric circulation is different from that on the interannual timescale. These detailed mechanisms deserve further investigation.
Author Contributions
Conceptualization, J.C.; analysis, X.L. and B.W.; methodology, J.C. and J.F.; writing, X.L., J.C., B.W. and J.F. All authors have read and agreed to the published version of the manuscript.
Funding
This research was jointly funded by the Natural Science Foundation of China (42375034) and the Natural Science Foundation of China of Jiangsu Province (BK20220108).
Data Availability Statement
The original contributions presented in the study are included in the article, further inquiries can be directed to the corresponding author.
Conflicts of Interest
The authors declare no conflicts of interest.
References
- Pielke, R.A., Jr.; Landsea, C.; Mayfield, M.; Layer, J.; Pasch, R. Hurricanes and Global Warming. Bull. Am. Meteorol. Soc. 2005, 86, 1571–1576. [Google Scholar] [CrossRef]
- Knutson, T.R.; McBride, J.L.; Chan, J.; Emanuel, K.; Holland, G.; Landsea, C.; Held, I.; Kossin, J.P.; Srivastava, A.K.; Sugi, M. Tropical Cyclones and Climate Change. Nat. Geosci. 2010, 3, 157–163. [Google Scholar] [CrossRef]
- Klotzbach, P.J.; Wood, K.M.; Schreck, C.J., III; Bowen, S.G.; Patricola, C.M.; Bell, M.M. Trends in Global Tropical Cyclone Activity: 1990–2021. Geophys. Res. Lett. 2022, 49, e2021GL095774. [Google Scholar] [CrossRef]
- Briegel, L.M.; Frank, W.M. Large-Scale Influences on Tropical Cyclogenesis in the Western North Pacific. Mon. Weather Rev. 1997, 125, 1397–1413. [Google Scholar] [CrossRef]
- Ritchie, E.A.; Holland, G.J. Large-Scale Patterns Associated with Tropical Cyclogenesis in the Western Pacific. Mon. Weather Rev. 1999, 127, 2027–2043. [Google Scholar] [CrossRef]
- Cao, X.; Li, T.; Peng, M.; Chen, W.; Chen, G. Effects of Monsoon Trough Interannual Variation on Tropical Cyclogenesis over the Western North Pacific. Geophys. Res. Lett. 2014, 41, 4332–4339. [Google Scholar] [CrossRef]
- Wu, L.; Wen, Z.; Wu, R. Influence of the Monsoon Trough on Westward-Propagating Tropical Waves over the Western North Pacific. Part I: Observations. J. Clim. 2015, 28, 7108–7127. [Google Scholar] [CrossRef]
- Wu, L.; Wen, Z.; Wu, R. Influence of the Monsoon Trough on Westward-Propagating Tropical Waves over the Western North Pacific. Part II: Energetics and Numerical Experiments. J. Clim. 2015, 28, 9332–9349. [Google Scholar] [CrossRef]
- Landsea, C.W. El Niño/Southern Oscillation and the Seasonal Predictability of Tropical Cyclones. In El Niño and the Southern Oscillation: Multiscale Variability and Global and Regional Impacts; Diaz, H.F., Markgraf, V., Eds.; Cambridge University Press: Cambridge, UK, 2000; pp. 149–182. ISBN 978-0-511-57312-5. [Google Scholar]
- Chen, T.-C.; Weng, S.-P.; Yamazaki, N.; Kiehne, S. Interannual Variation in the Tropical Cyclone Formation over the Western North Pacific. Mon. Weather Rev. 1998, 126, 1080–1090. [Google Scholar] [CrossRef]
- Chen, T.-C.; Wang, S.-Y.; Yen, M.-C. Interannual Variation of the Tropical Cyclone Activity over the Western North Pacific. J. Clim. 2006, 19, 5709–5720. [Google Scholar] [CrossRef]
- Chan, J.C.L. Tropical Cyclone Activity in the Northwest Pacific in Relation to the El Niño/Southern Oscillation Phenomenon. Mon. Weather Rev. 1985, 113, 599–606. [Google Scholar] [CrossRef]
- Lander, M.A. An Exploratory Analysis of the Relationship between Tropical Storm Formation in the Western North Pacific and ENSO. Mon. Weather Rev. 1994, 122, 636–651. [Google Scholar] [CrossRef]
- Wang, B.; Chan, J.C.L. How Strong ENSO Events Affect Tropical Storm Activity over the Western North Pacific. J. Clim. 2002, 15, 1643–1658. [Google Scholar] [CrossRef]
- Camargo, S.J.; Sobel, A.H. Western North Pacific Tropical Cyclone Intensity and ENSO. J. Clim. 2005, 18, 2996–3006. [Google Scholar] [CrossRef]
- Zhao, H.; Wu, L.; Zhou, W. Interannual Changes of Tropical Cyclone Intensity in the Western North Pacific. J. Meteorol. Soc. Jpn. 2011, 89, 243–253. [Google Scholar] [CrossRef]
- Wang, C.; Li, C.; Mu, M.; Duan, W. Seasonal Modulations of Different Impacts of Two Types of ENSO Events on Tropical Cyclone Activity in the Western North Pacific. Clim. Dyn. 2013, 40, 2887–2902. [Google Scholar] [CrossRef]
- Kao, H.-Y.; Yu, J.-Y. Contrasting Eastern-Pacific and Central-Pacific Types of ENSO. J. Clim. 2009, 22, 615–632. [Google Scholar] [CrossRef]
- Kug, J.-S.; Jin, F.-F.; An, S.-I. Two Types of El Niño Events: Cold Tongue El Niño and Warm Pool El Niño. J. Clim. 2009, 22, 1499–1515. [Google Scholar] [CrossRef]
- Chen, G.; Tam, C.-Y. Different Impacts of Two Kinds of Pacific Ocean Warming on Tropical Cyclone Frequency over the Western North Pacific. Geophys. Res. Lett. 2010, 37, L01803. [Google Scholar] [CrossRef]
- Kim, H.-M.; Webster, P.J.; Curry, J.A. Modulation of North Pacific Tropical Cyclone Activity by Three Phases of ENSO. J. Clim. 2011, 24, 1839–1849. [Google Scholar] [CrossRef]
- Ha, K.-J.; Yoon, S.-J.; Yun, K.-S.; Kug, J.-S.; Jang, Y.-S.; Chan, J.C.L. Dependency of Typhoon Intensity and Genesis Locations on El Niño Phase and SST Shift over the Western North Pacific. Theor. Appl. Climatol. 2012, 109, 383–395. [Google Scholar] [CrossRef]
- Chiang, J.C.H.; Vimont, D.J. Analogous Pacific and Atlantic Meridional Modes of Tropical Atmosphere–Ocean Variability. J. Clim. 2004, 17, 4143–4158. [Google Scholar] [CrossRef]
- Chang, P.; Zhang, L.; Saravanan, R.; Vimont, D.J.; Chiang, J.C.H.; Ji, L.; Seidel, H.; Tippett, M.K. Pacific Meridional Mode and El Niño-Southern Oscillation. Geophys. Res. Lett. 2007, 34, L16608. [Google Scholar] [CrossRef]
- Zhang, W.; Vecchi, G.A.; Murakami, H.; Villarini, G.; Jia, L. The Pacific Meridional Mode and the Occurrence of Tropical Cyclones in the Western North Pacific. J. Clim. 2016, 29, 381–398. [Google Scholar] [CrossRef]
- Gao, S.; Zhu, L.; Zhang, W.; Chen, Z. Strong Modulation of the Pacific Meridional Mode on the Occurrence of Intense Tropical Cyclones over the Western North Pacific. J. Clim. 2018, 31, 7739–7749. [Google Scholar] [CrossRef]
- Wu, B.; Zhou, T.; Li, T. Atmospheric Dynamic and Thermodynamic Processes Driving the Western North Pacific Anomalous Anticyclone during El Niño. Part I: Maintenance Mechanisms. J. Clim. 2017, 30, 9621–9635. [Google Scholar] [CrossRef]
- Yu, R.; Gao, S.; Sun, L.; Chen, G.; Shen, X. Multiscale Mechanisms for the Modulation of the Pacific Meridional Mode on Tropical Cyclone Genesis over the Western North Pacific: A Comparison between 2004 and 2011. Clim. Dyn. 2023, 60, 3241–3259. [Google Scholar] [CrossRef]
- Xie, S.-P.; Hu, K.; Hafner, J.; Tokinaga, H.; Du, Y.; Huang, G.; Sampe, T. Indian Ocean Capacitor Effect on Indo–Western Pacific Climate during the Summer Following El Niño. J. Clim. 2009, 22, 730–747. [Google Scholar] [CrossRef]
- Zhan, R.; Wang, Y.; Lei, X. Contributions of ENSO and East Indian Ocean SSTA to the Interannual Variability of Northwest Pacific Tropical Cyclone Frequency. J. Clim. 2011, 24, 509–521. [Google Scholar] [CrossRef]
- Zhan, R.; Wang, Y.; Tao, L. Intensified Impact of East Indian Ocean SST Anomaly on Tropical Cyclone Genesis Frequency over the Western North Pacific. J. Clim. 2014, 27, 8724–8739. [Google Scholar] [CrossRef]
- Gao, J.; Zhao, H.; Klotzbach, P.J.; Wang, C.; Raga, G.B.; Chen, S. Possible Influence of Tropical Indian Ocean Sea Surface Temperature on the Proportion of Rapidly Intensifying Western North Pacific Tropical Cyclones during the Extended Boreal Summer. J. Clim. 2020, 33, 9129–9143. [Google Scholar] [CrossRef]
- Tao, L.; Wu, L.; Wang, Y.; Yang, J. Influence of Tropical Indian Ocean Warming and ENSO on Tropical Cyclone Activity over the Western North Pacific. J. Meteorol. Soc. Jpn. 2012, 90, 127–144. [Google Scholar] [CrossRef]
- Liu, Y.; Huang, P.; Chen, G. Impacts of the Combined Modes of the Tropical Indo-Pacific Sea Surface Temperature Anomalies on the Tropical Cyclone Genesis over the Western North Pacific. Int. J. Climatol. 2019, 39, 2108–2119. [Google Scholar] [CrossRef]
- Briegel, L.M. The Structure and Variability of the ITCZ of the Western North Pacific; The Pennsylvania State University: University Park, PA, USA, 2002. [Google Scholar]
- Chan, S.C.; Evans, J.L. Comparison of the Structure of the ITCZ in the West Pacific during the Boreal Summers of 1989–93 Using AMIP Simulations and ECMWF Reanalysis. J. Clim. 2002, 15, 3549–3568. [Google Scholar] [CrossRef]
- Tomita, T.; Yoshikane, T.; Yasunari, T. Biennial and Lower-Frequency Variability Observed in the Early Summer Climate in the Western North Pacific. J. Clim. 2004, 17, 4254–4266. [Google Scholar] [CrossRef]
- Chen, T.-C.; Wang, S.-Y.; Yen, M.-C.; Gallus, W.A., Jr. Role of the Monsoon Gyre in the Interannual Variation of Tropical Cyclone Formation over the Western North Pacific. Weather Forecast. 2004, 19, 776–785. [Google Scholar] [CrossRef][Green Version]
- Wu, L.; Wen, Z.; Huang, R.; Wu, R. Possible Linkage between the Monsoon Trough Variability and the Tropical Cyclone Activity over the Western North Pacific. Mon. Weather Rev. 2012, 140, 140–150. [Google Scholar] [CrossRef]
- Feng, T.; Chen, G.-H.; Huang, R.-H.; Shen, X.-Y. Large-Scale Circulation Patterns Favourable to Tropical Cyclogenesis over the Western North Pacific and Associated Barotropic Energy Conversions. Int. J. Climatol. 2014, 34, 216–227. [Google Scholar] [CrossRef]
- Gou, Y.; Wang, C.; Wu, Y.; Wu, L. Emergent Constraint on Projection of the North Pacific Monsoon Trough and Its Implications for Typhoon Activity Using CMIP6 Models. J. Geophys. Res. Atmos. 2024, 129, e2023JD040471. [Google Scholar] [CrossRef]
- Zhang, J.; Zhan, R.; Wen, M. Influence of Monsoon Trough Length on Interannual Variability of Northwest Pacific Multiple Tropical Cyclone Events. Atmos. Res. 2023, 295, 107034. [Google Scholar] [CrossRef]
- Choi, J.-W.; Kim, B.-J.; Zhang, R.; Park, K.-J.; Kim, J.-Y.; Cha, Y.; Nam, J.-C. Possible Relation of the Western North Pacific Monsoon to the Tropical Cyclone Activity over Western North Pacific. Int. J. Climatol. 2016, 36, 3334–3345. [Google Scholar] [CrossRef]
- Zhao, W.; Chen, S.; Chen, W.; Yao, S.; Nath, D.; Yu, B. Interannual Variations of the Rainy Season Withdrawal of the Monsoon Transitional Zone in China. Clim. Dyn. 2019, 53, 2031–2046. [Google Scholar] [CrossRef]
- Velden, C.; Harper, B.; Wells, F.; Beven, J.L., II; Zehr, R.; Olander, T.; Mayfield, M.; Guard, C.C.; Lander, M.; Edson, R.; et al. The Dvorak Tropical Cyclone Intensity Estimation Technique: A Satellite-Based Method That Has Endured for over 30 Years. Bull. Am. Meteorol. Soc. 2006, 87, 1195–1210. [Google Scholar] [CrossRef]
- Knapp, K.R.; Kruk, M.C.; Levinson, D.H.; Diamond, H.J.; Neumann, C.J. The International Best Track Archive for Climate Stewardship (IBTrACS). Bull. Am. Meteorol. Soc. 2010, 91, 363–376. [Google Scholar] [CrossRef]
- Kummerow, C.; Barnes, W.; Kozu, T.; Shiue, J.; Simpson, J. The Tropical Rainfall Measuring Mission (TRMM) Sensor Package. J. Atmos. Ocean. Technol. 1998, 15, 809–817. [Google Scholar] [CrossRef]
- Kummerow, C.; Simpson, J.; Thiele, O.; Barnes, W.; Chang, A.T.C.; Stocker, E.; Adler, R.F.; Hou, A.; Kakar, R.; Wentz, F.; et al. The Status of the Tropical Rainfall Measuring Mission (TRMM) after Two Years in Orbit. J. Appl. Meteorol. 2000, 39, 1965–1982. [Google Scholar] [CrossRef]
- Skofronick-Jackson, G.; Kirschbaum, D.; Petersen, W.; Huffman, G.; Kidd, C.; Stocker, E.; Kakar, R. The Global Precipitation Measurement (GPM) Mission’s Scientific Achievements and Societal Contributions: Reviewing Four Years of Advanced Rain and Snow Observations. Q. J. R. Meteorol. Soc. 2018, 144, 27–48. [Google Scholar] [CrossRef]
- Hou, A.Y.; Kakar, R.K.; Neeck, S.; Azarbarzin, A.A.; Kummerow, C.D.; Kojima, M.; Oki, R.; Nakamura, K.; Iguchi, T. The Global Precipitation Measurement Mission. Bull. Am. Meteorol. Soc. 2014, 95, 701–722. [Google Scholar] [CrossRef]
- Rayner, N.A.; Parker, D.E.; Horton, E.B.; Folland, C.K.; Alexander, L.V.; Rowell, D.P.; Kent, E.C.; Kaplan, A. Global Analyses of Sea Surface Temperature, Sea Ice, and Night Marine Air Temperature since the Late Nineteenth Century. J. Geophys. Res. 2003, 108, 4407. [Google Scholar] [CrossRef]
- Hersbach, H.; Bell, B.; Berrisford, P.; Hirahara, S.; Horányi, A.; Muñoz-Sabater, J.; Nicolas, J.; Peubey, C.; Radu, R.; Schepers, D.; et al. The ERA5 Global Reanalysis. Q. J. R. Meteorol. Soc. 2020, 146, 1999–2049. [Google Scholar] [CrossRef]
- Wang, B.; Murakami, H. Dynamic Genesis Potential Index for Diagnosing Present-Day and Future Global Tropical Cyclone Genesis. Environ. Res. Lett. 2020, 15, 114008. [Google Scholar] [CrossRef]
- Wang, B.; Fan, Z. Choice of South Asian Summer Monsoon Indices. Bull. Am. Meteorol. Soc. 1999, 80, 629–638. [Google Scholar] [CrossRef]
- Watanabe, M.; Kimoto, M. Atmosphere-Ocean Thermal Coupling in the North Atlantic: A Positive Feedback. Q. J. R. Meteorol. Soc. 2000, 126, 3343–3369. [Google Scholar]
- Gray, W.M. Tropical Cyclone Genesis; Deptartment of Atmospheric Science, Colorado State University: Fort Collins, CO, USA, 1975. [Google Scholar]
- Cheung, K.K.W. Large-Scale Environmental Parameters Associated with Tropical Cyclone Formations in the Western North Pacific. J. Clim. 2004, 17, 466–484. [Google Scholar] [CrossRef]
- Choi, W.; Ho, C.-H.; Kim, H.-S. Influence of Large-Scale Environments on Tropical Cyclone Activity over the Western North Pacific: A Case Study for 2009. J. Clim. Chang. Res. 2010, 1, 133–145. [Google Scholar]
- Gray, W.M. The Formation of Tropical Cyclones. Meteorl. Atmos. Phys. 1998, 67, 37–69. [Google Scholar] [CrossRef]
- Sobel, A.H.; Camargo, S.J. Influence of Western North Pacific Tropical Cyclones on Their Large-Scale Environment. J. Atmos. Sci. 2005, 62, 3396–3407. [Google Scholar] [CrossRef]
- Wu, Q.; Zhao, J.; Zhan, R.; Gao, J. Revisiting the Interannual Impact of the Pacific Meridional Mode on Tropical Cyclone Genesis Frequency in the Western North Pacific. Clim. Dyn. 2021, 56, 1003–1015. [Google Scholar] [CrossRef]
- Fu, M.; Wang, C.; Wu, L.; Zhao, H. Season-dependent Modulation of Pacific Meridional Mode on Tropical Cyclone Genesis over the Western North Pacific. J. Geophys. Res. 2023, 128, e2022JD037575. [Google Scholar] [CrossRef]
- Song, J.; Klotzbach, P.J.; Wang, Y.-F.; Duan, Y. Asymmetric Influence of the Pacific Meridional Mode on Tropical Cyclone Formation over the Western North Pacific. Int. J. Climatol. 2023, 43, 6578–6589. [Google Scholar] [CrossRef]
- Vecchi, G.A.; Soden, B.J. Effect of Remote Sea Surface Temperature Change on Tropical Cyclone Potential Intensity. Nature 2007, 450, 1066–1070. [Google Scholar] [CrossRef] [PubMed]
- Vecchi, G.A.; Knutson, T.R. On Estimates of Historical North Atlantic Tropical Cyclone Activity. J. Clim. 2008, 21, 3580–3600. [Google Scholar] [CrossRef]
- Gill, A.E. Some Simple Solutions for Heat-Induced Tropical Circulation. Q. J. R. Meteorol. Soc. 1980, 106, 447–462. [Google Scholar] [CrossRef]
- Wang, B.; Ding, Q.; Fu, X.; Kang, I.-S.; Jin, K.; Shukla, J.; Doblas-Reyes, F. Fundamental Challenge in Simulation and Prediction of Summer Monsoon Rainfall. Geophys. Res. Lett. 2005, 32, L15711. [Google Scholar] [CrossRef]
- Huo, L.; Guo, P.; Hameed, S.; Jin, D. The role of tropical Atlantic SST anomalies in modulating western North Pacific tropical cyclone genesis. Geophys. Res. Lett. 2015, 42, 2378–2384. [Google Scholar] [CrossRef]
- Yu, J.; Li, T.; Tan, Z.; Zhu, Z. Effects of tropical North Atlantic SST on tropical cyclone genesis in the western North Pacific. Clim. Dyn. 2016, 46, 865–877. [Google Scholar] [CrossRef]
- Zhao, H.; Wang, C. Interdecadal modulation on the relationship between ENSO and typhoon activity during the late season in the western North Pacific. Clim Dyn 2016, 47, 315–328. [Google Scholar] [CrossRef]
- Zhang, S.; Zhao, H.; Klotzbach, P.J.; Jiang, X.; Chen, G.; Chen, S. Interannual Variability in the Boreal Summer Intraseasonal Oscillation Modulates the Meridional Migration of Western North Pacific Tropical Cyclone Genesis. J. Clim. 2023, 36, 4543–4558. [Google Scholar] [CrossRef]


Disclaimer/Publisher’s Note: The statements, opinions and data contained in all publications are solely those of the individual author(s) and contributor(s) and not of MDPI and/or the editor(s). MDPI and/or the editor(s) disclaim responsibility for any injury to people or property resulting from any ideas, methods, instructions or products referred to in the content. |
© 2025 by the authors. Licensee MDPI, Basel, Switzerland. This article is an open access article distributed under the terms and conditions of the Creative Commons Attribution (CC BY) license (https://creativecommons.org/licenses/by/4.0/).