
Assessment of Glacier Transformation in China over the Past 40 Years Using a China-Specific Glacier Classification System


Abstract

1. Introduction
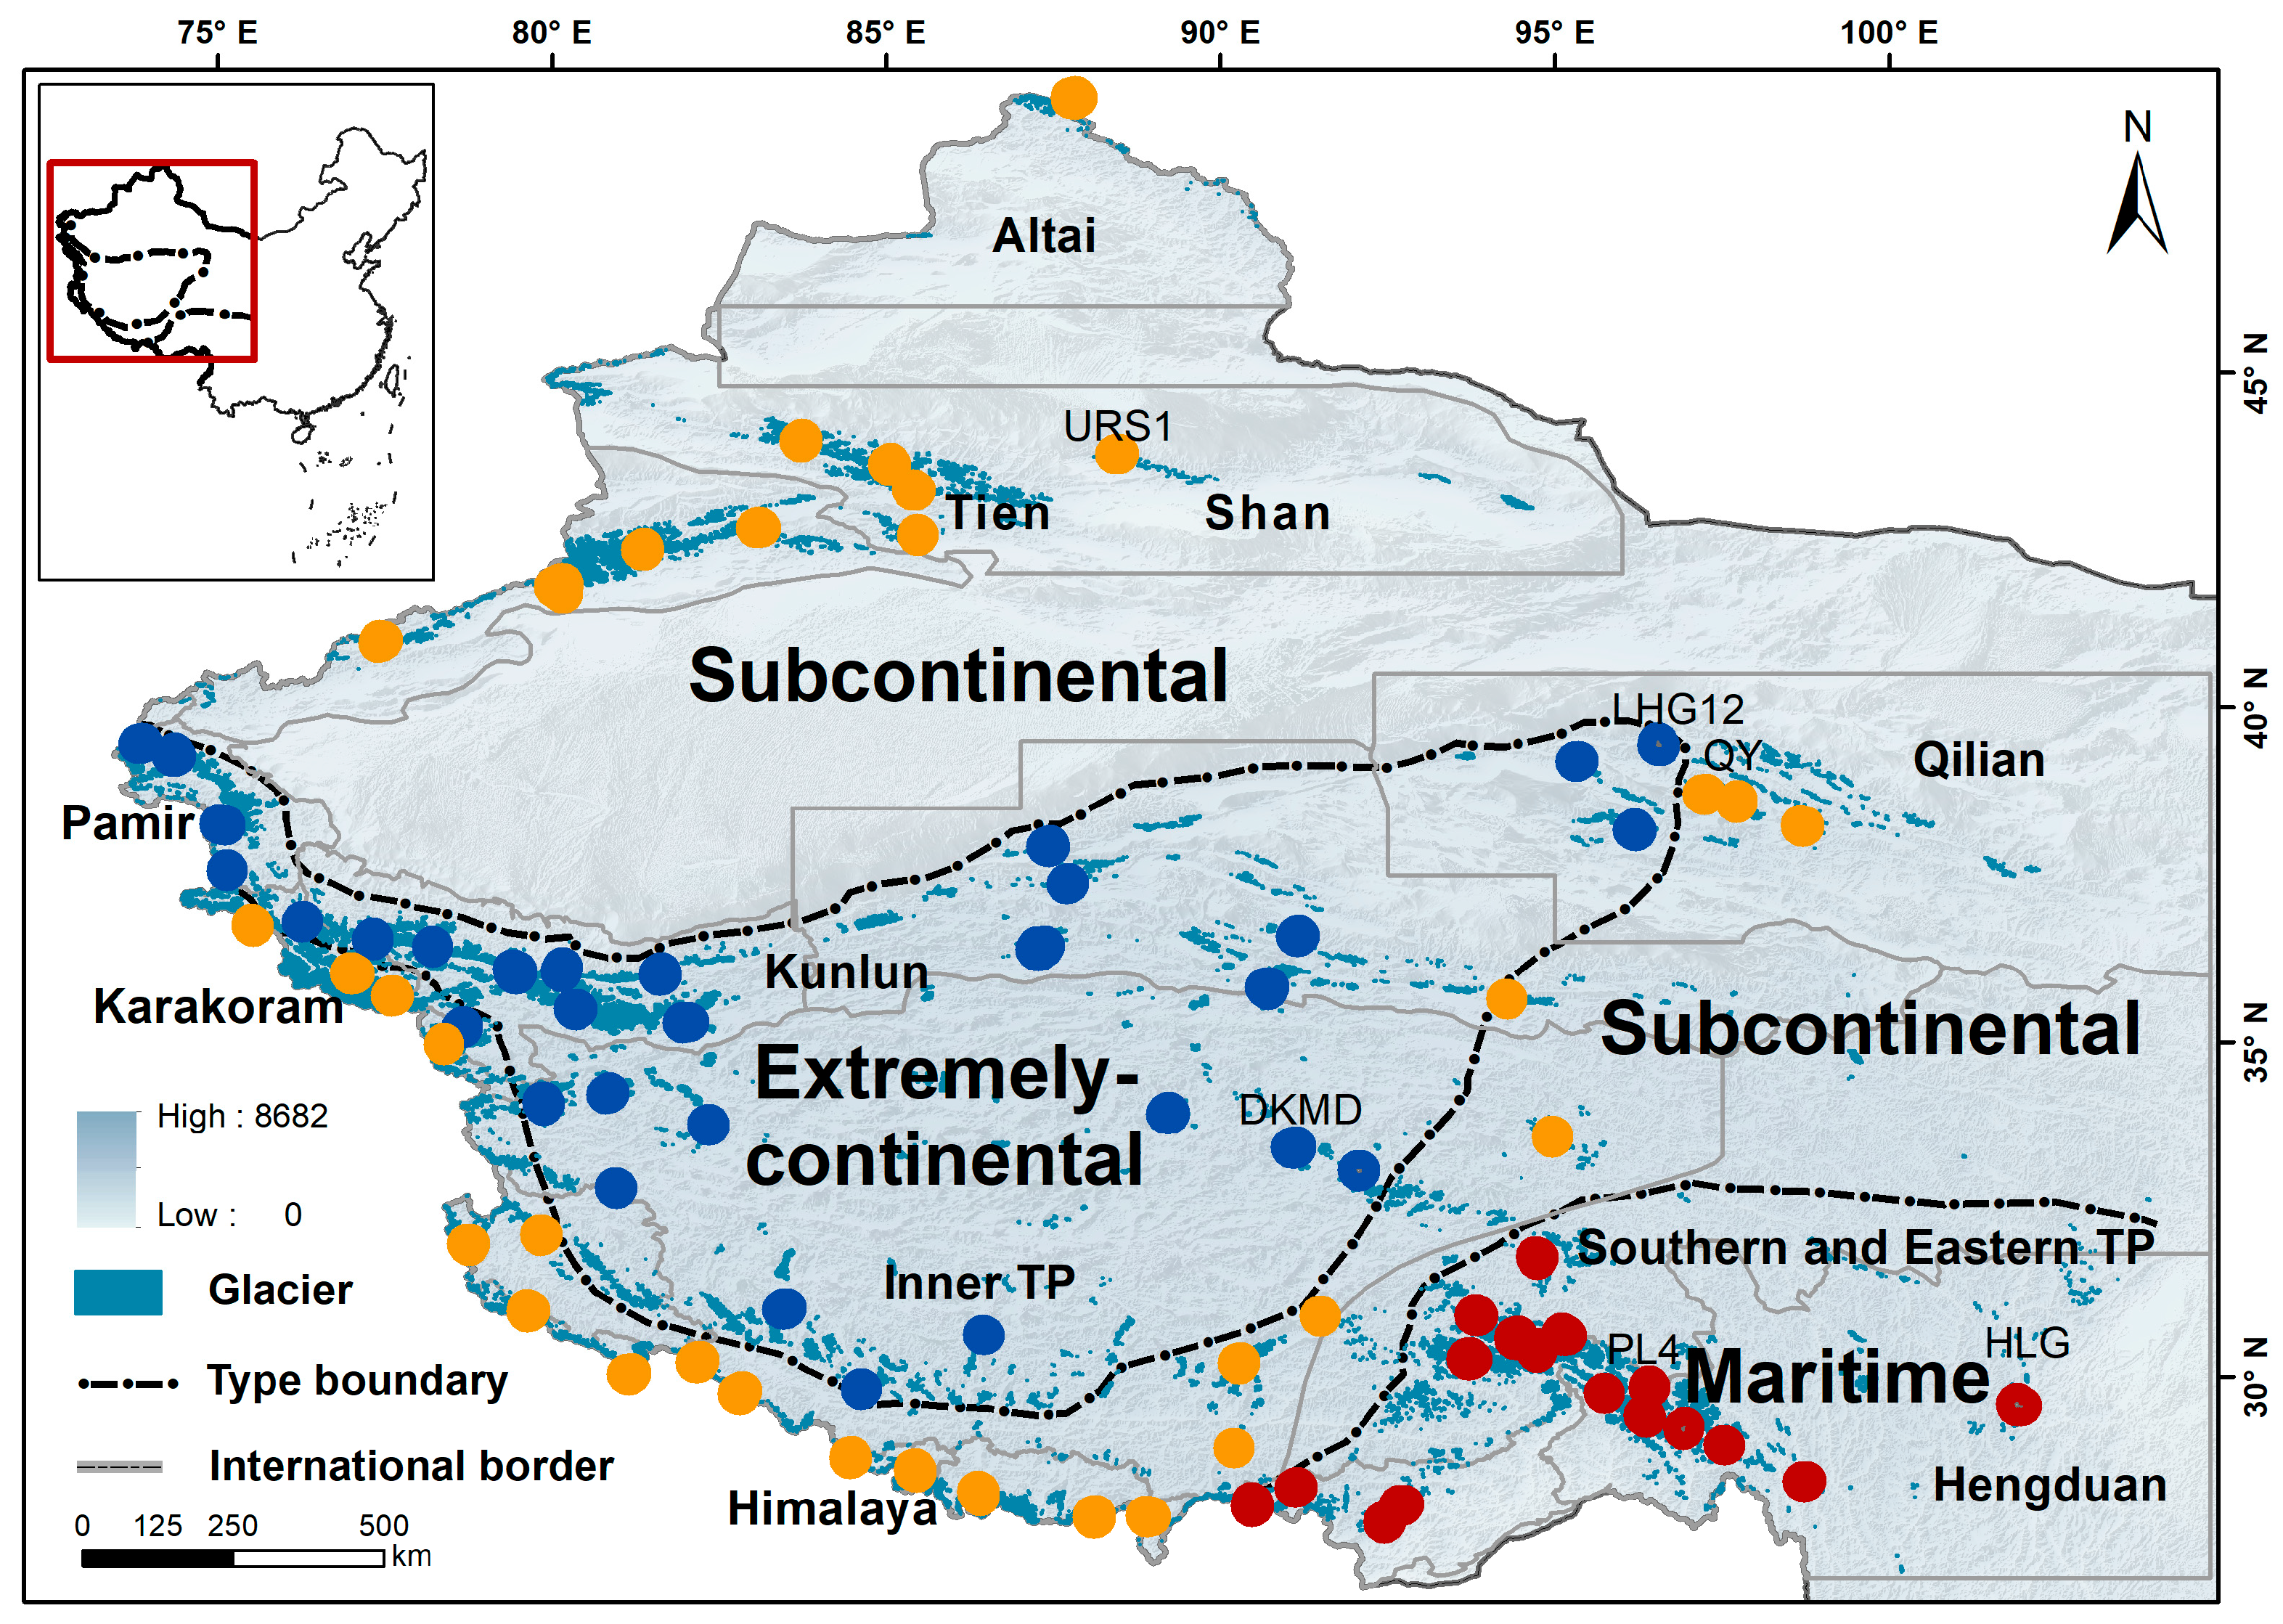
2. Study Glaciers
3. Data and Methods
3.1. Shi–Xie Classification Method
3.2. Glacier Outlines
3.3. DEMs
3.4. ELAs
3.5. Meteorological Data at ELA
3.6. Near-Surface Ice Temperature
3.7. Glacier Surface Velocities
4. Results
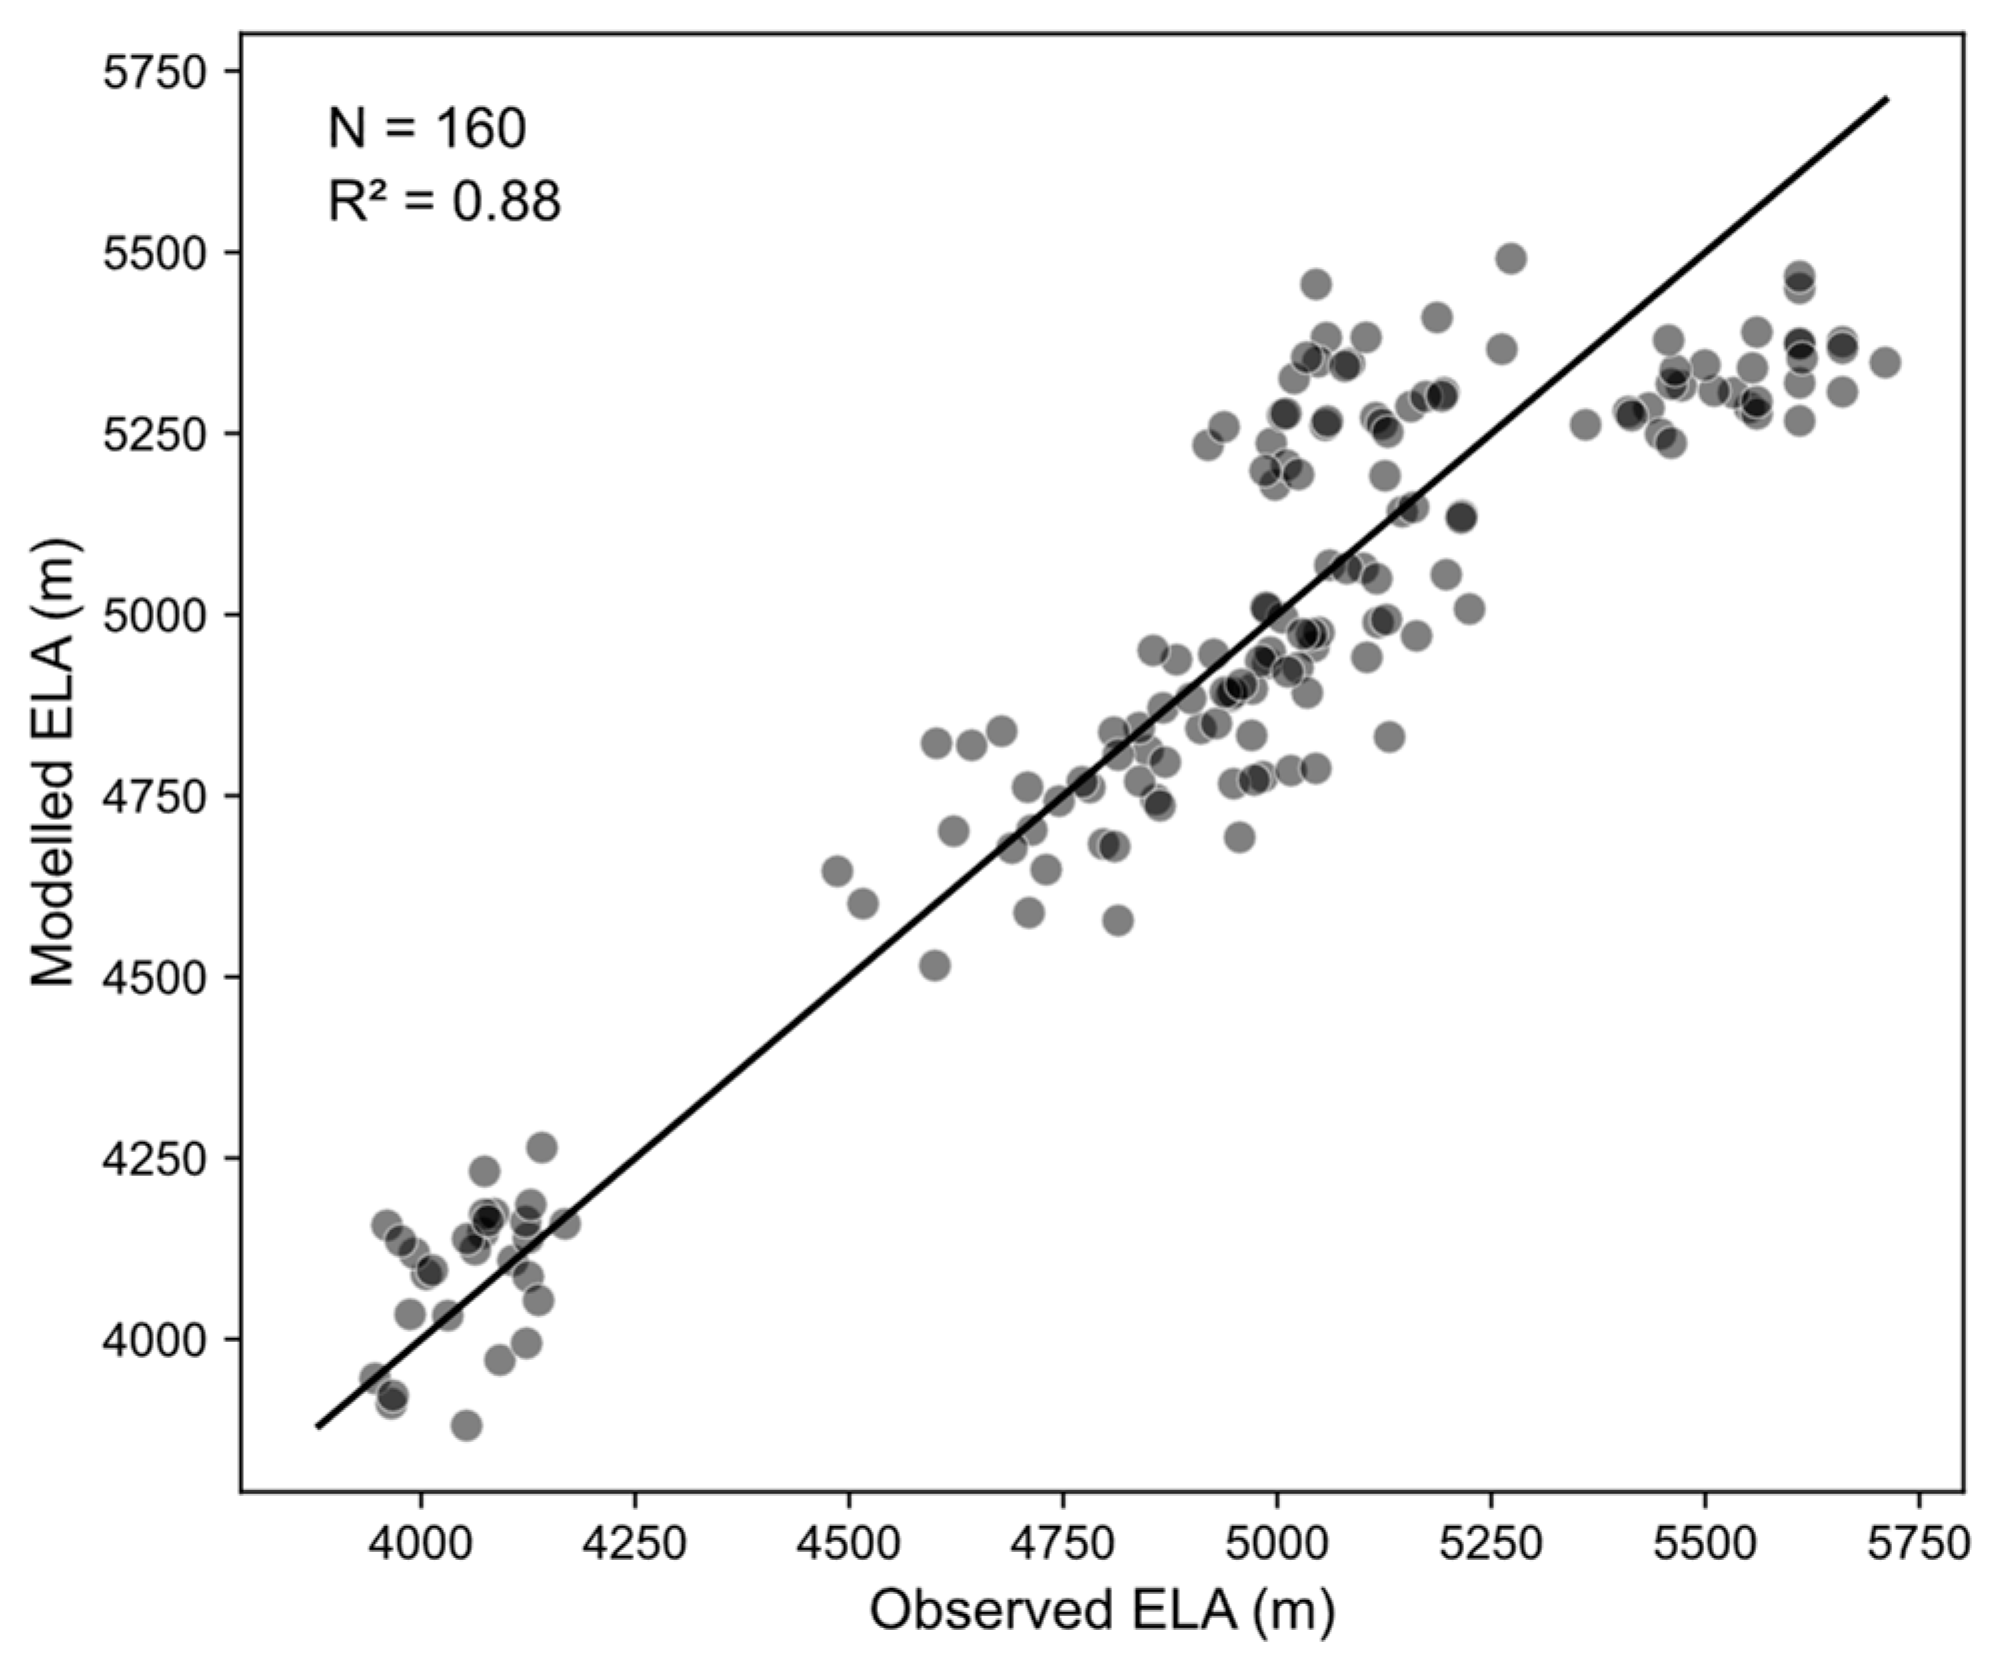
4.1. Calibration and Validation
4.2. Spatio-Temporal Distribution of ELAs and Glacier Criteria
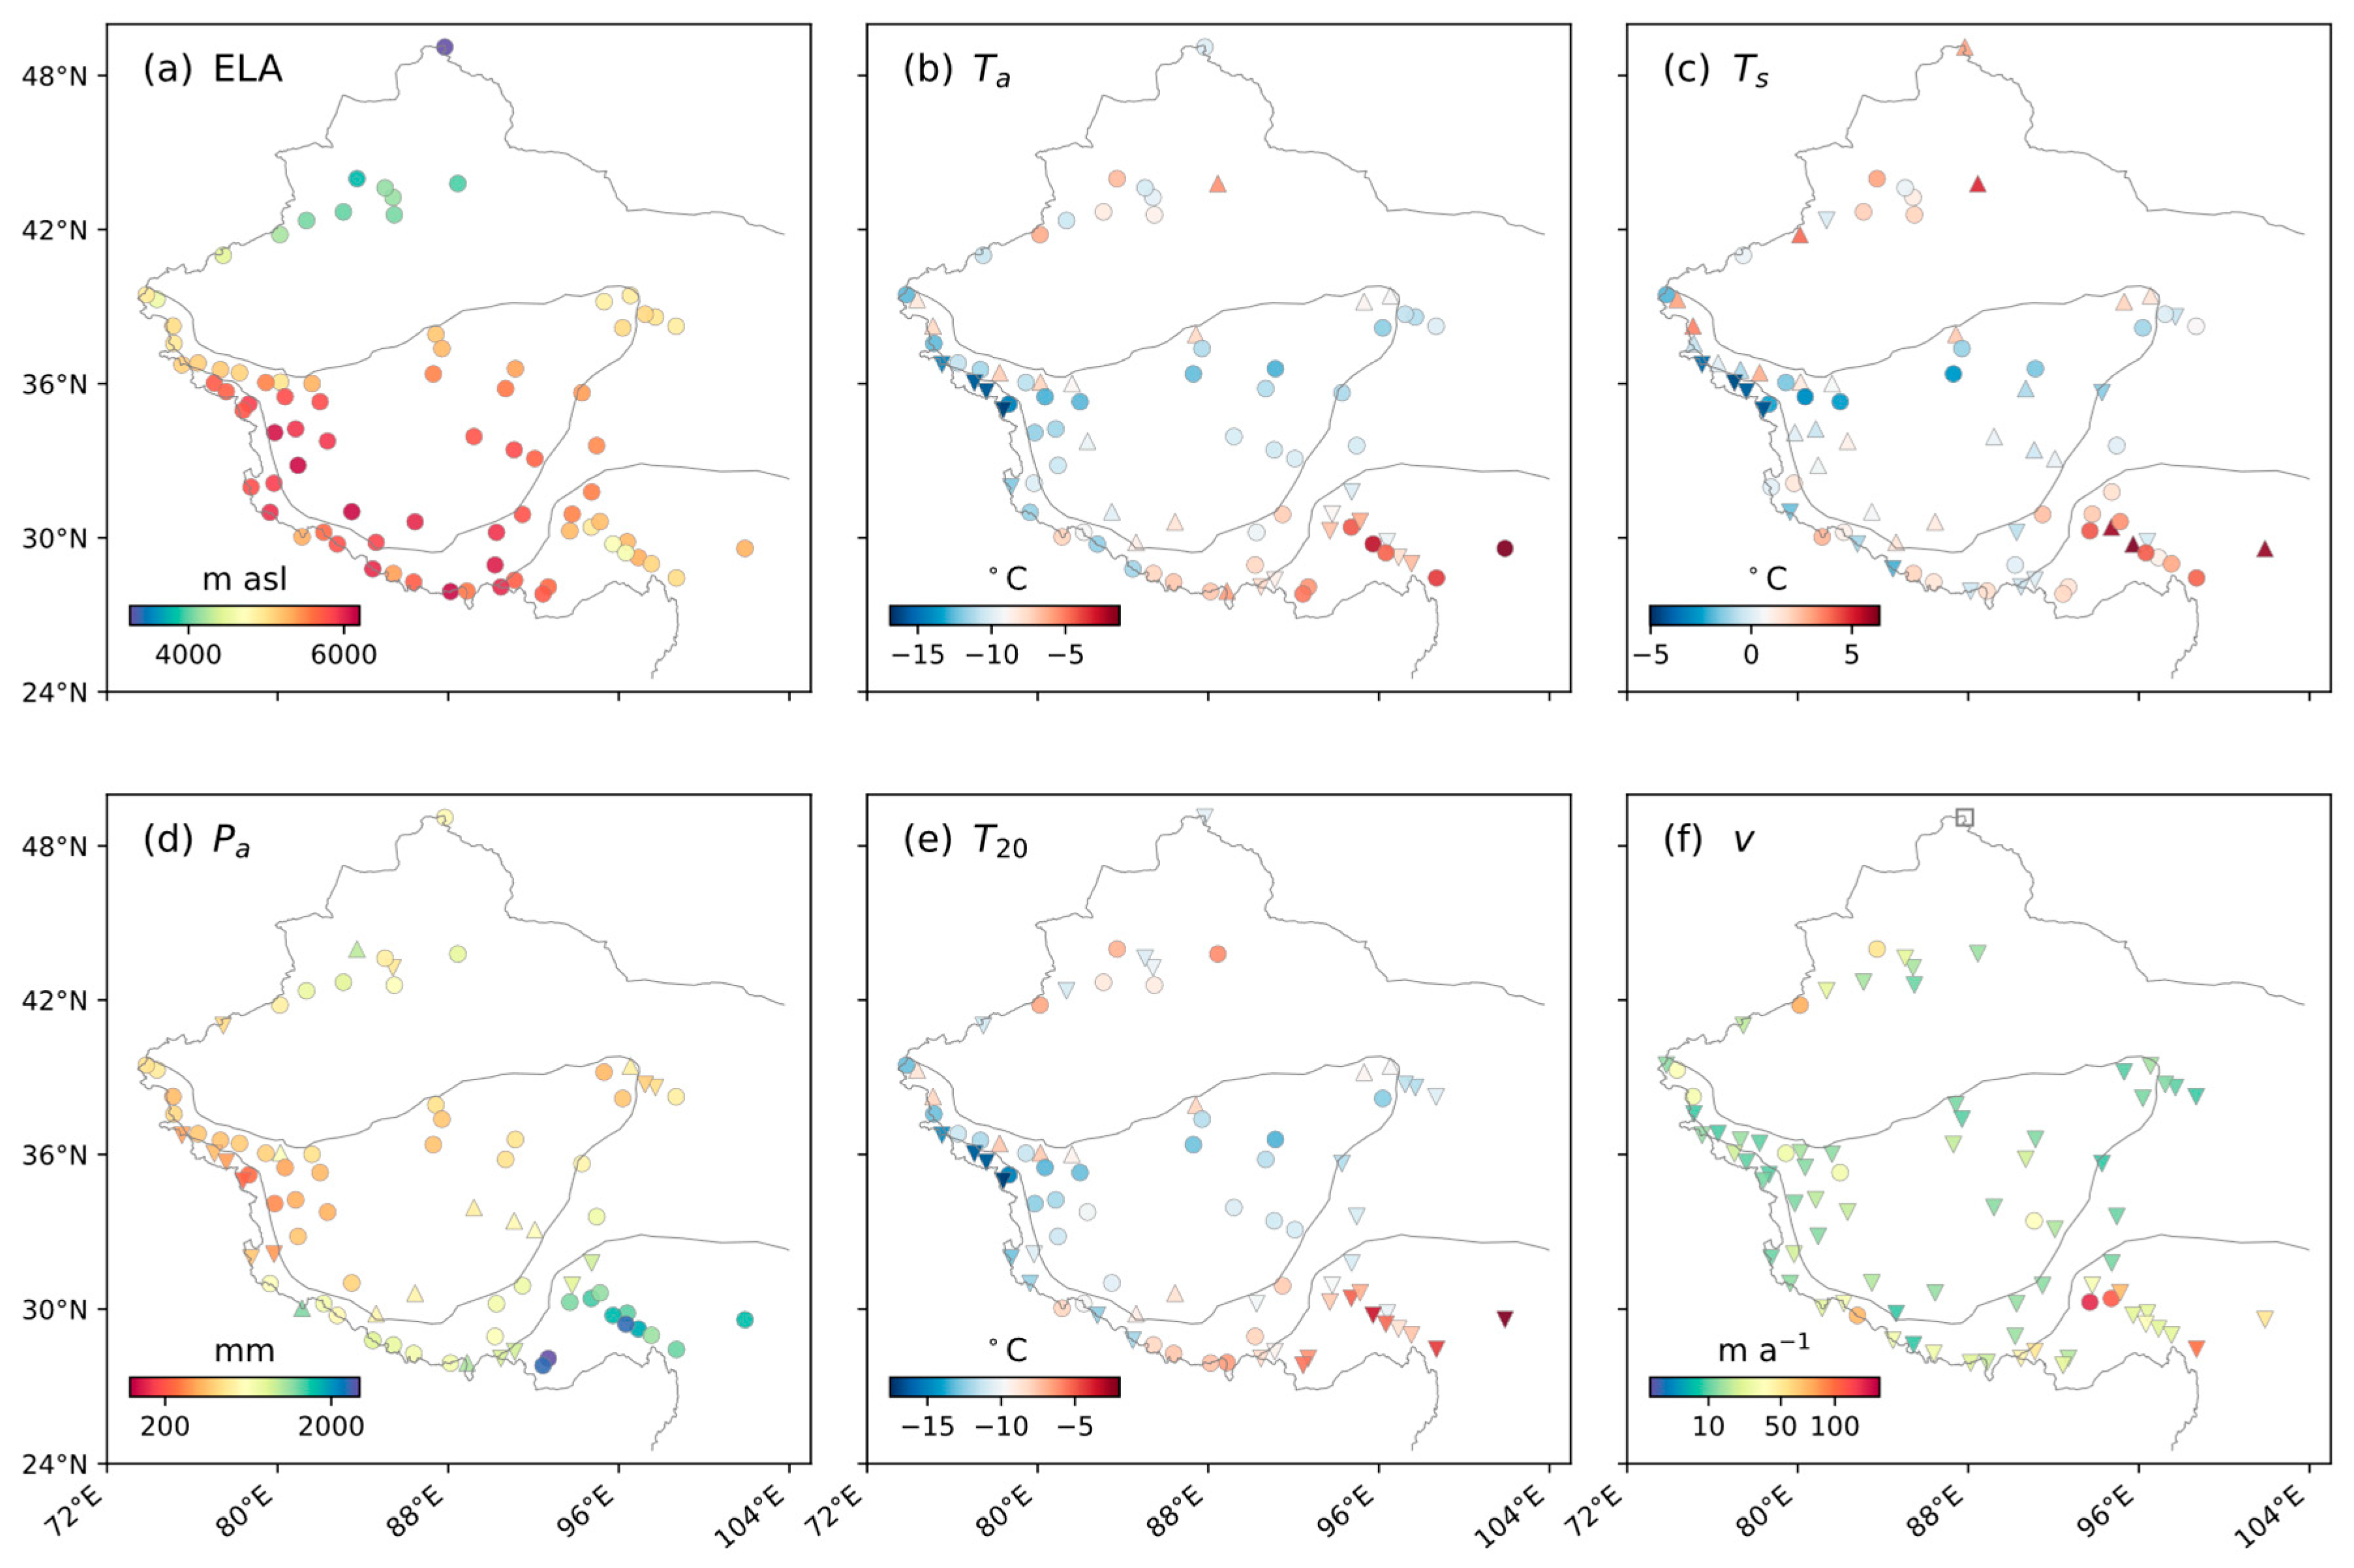
4.2.1. Distribution over the Period 1982–2000
- ELA
- 2.
- Annual mean temperature at ELA (Ta)
- 3.
- Summer mean temperature at ELA (Ts)
- 4.
- Annual precipitation at ELA (Pa)
- 5.
- Annual mean 20 m ice temperature (T20)
- 6.
- Maximum glacier surface velocity (v)
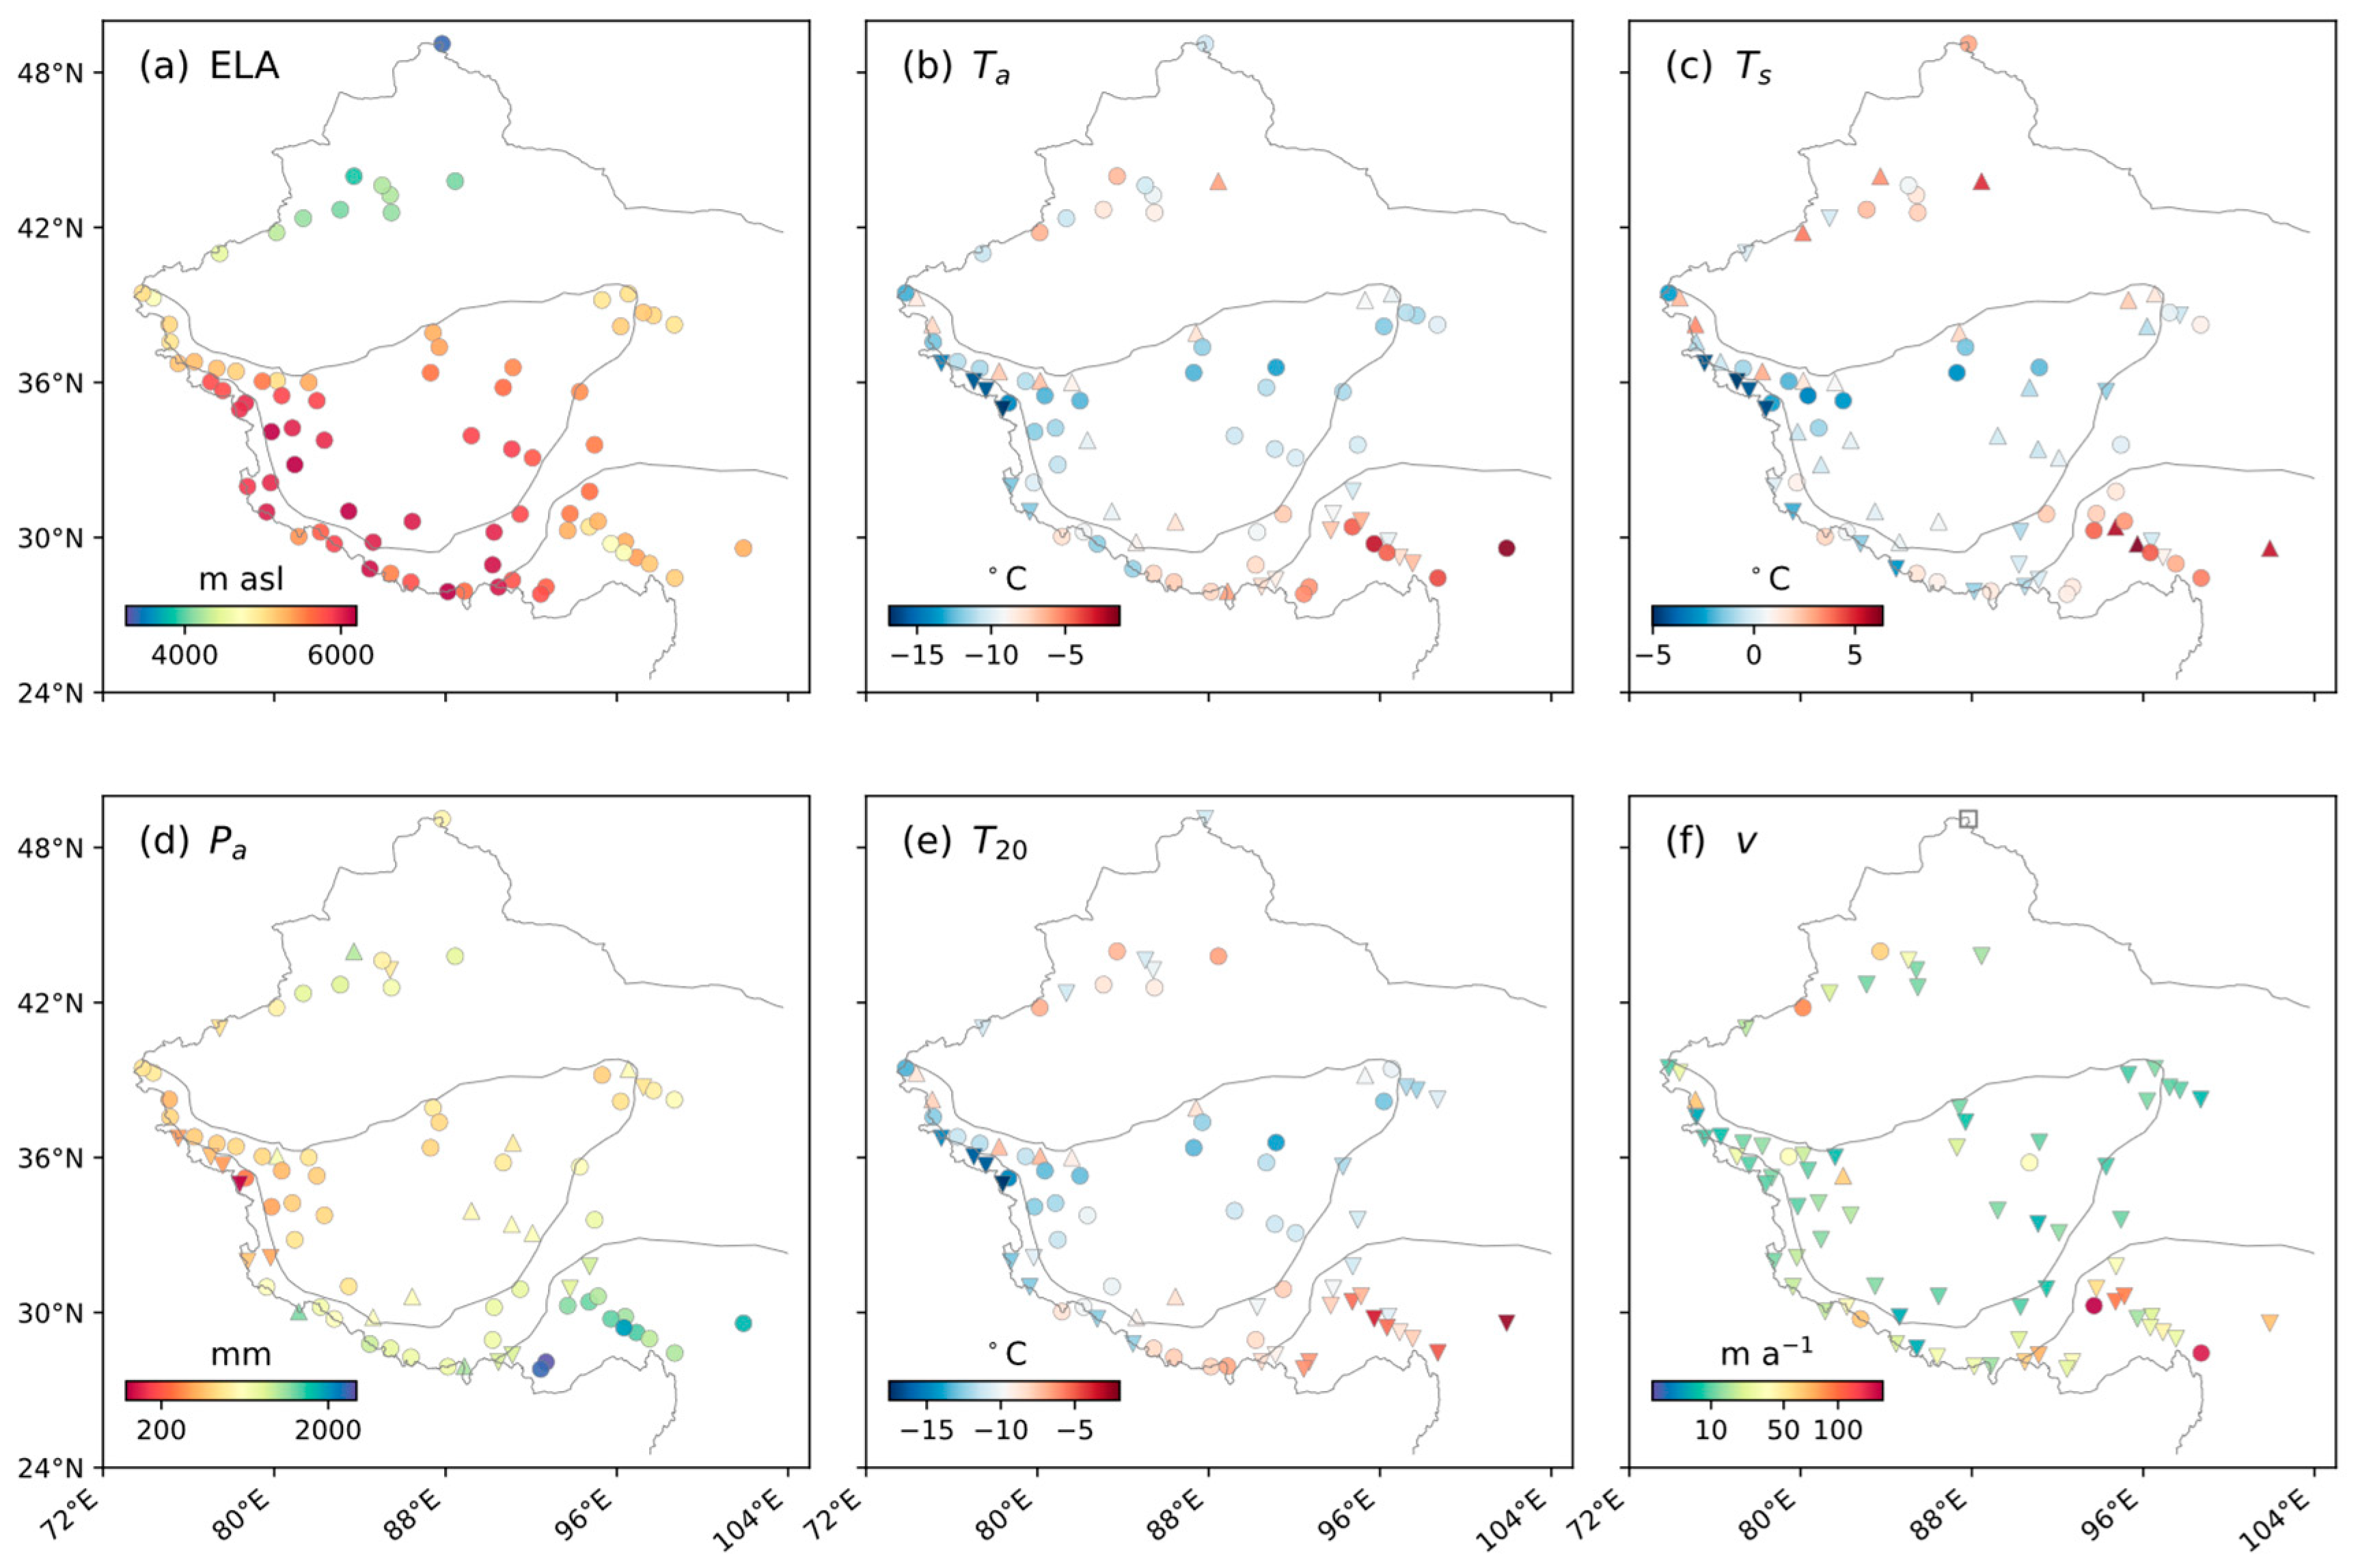
4.2.2. Distribution over the Period 2001–2019
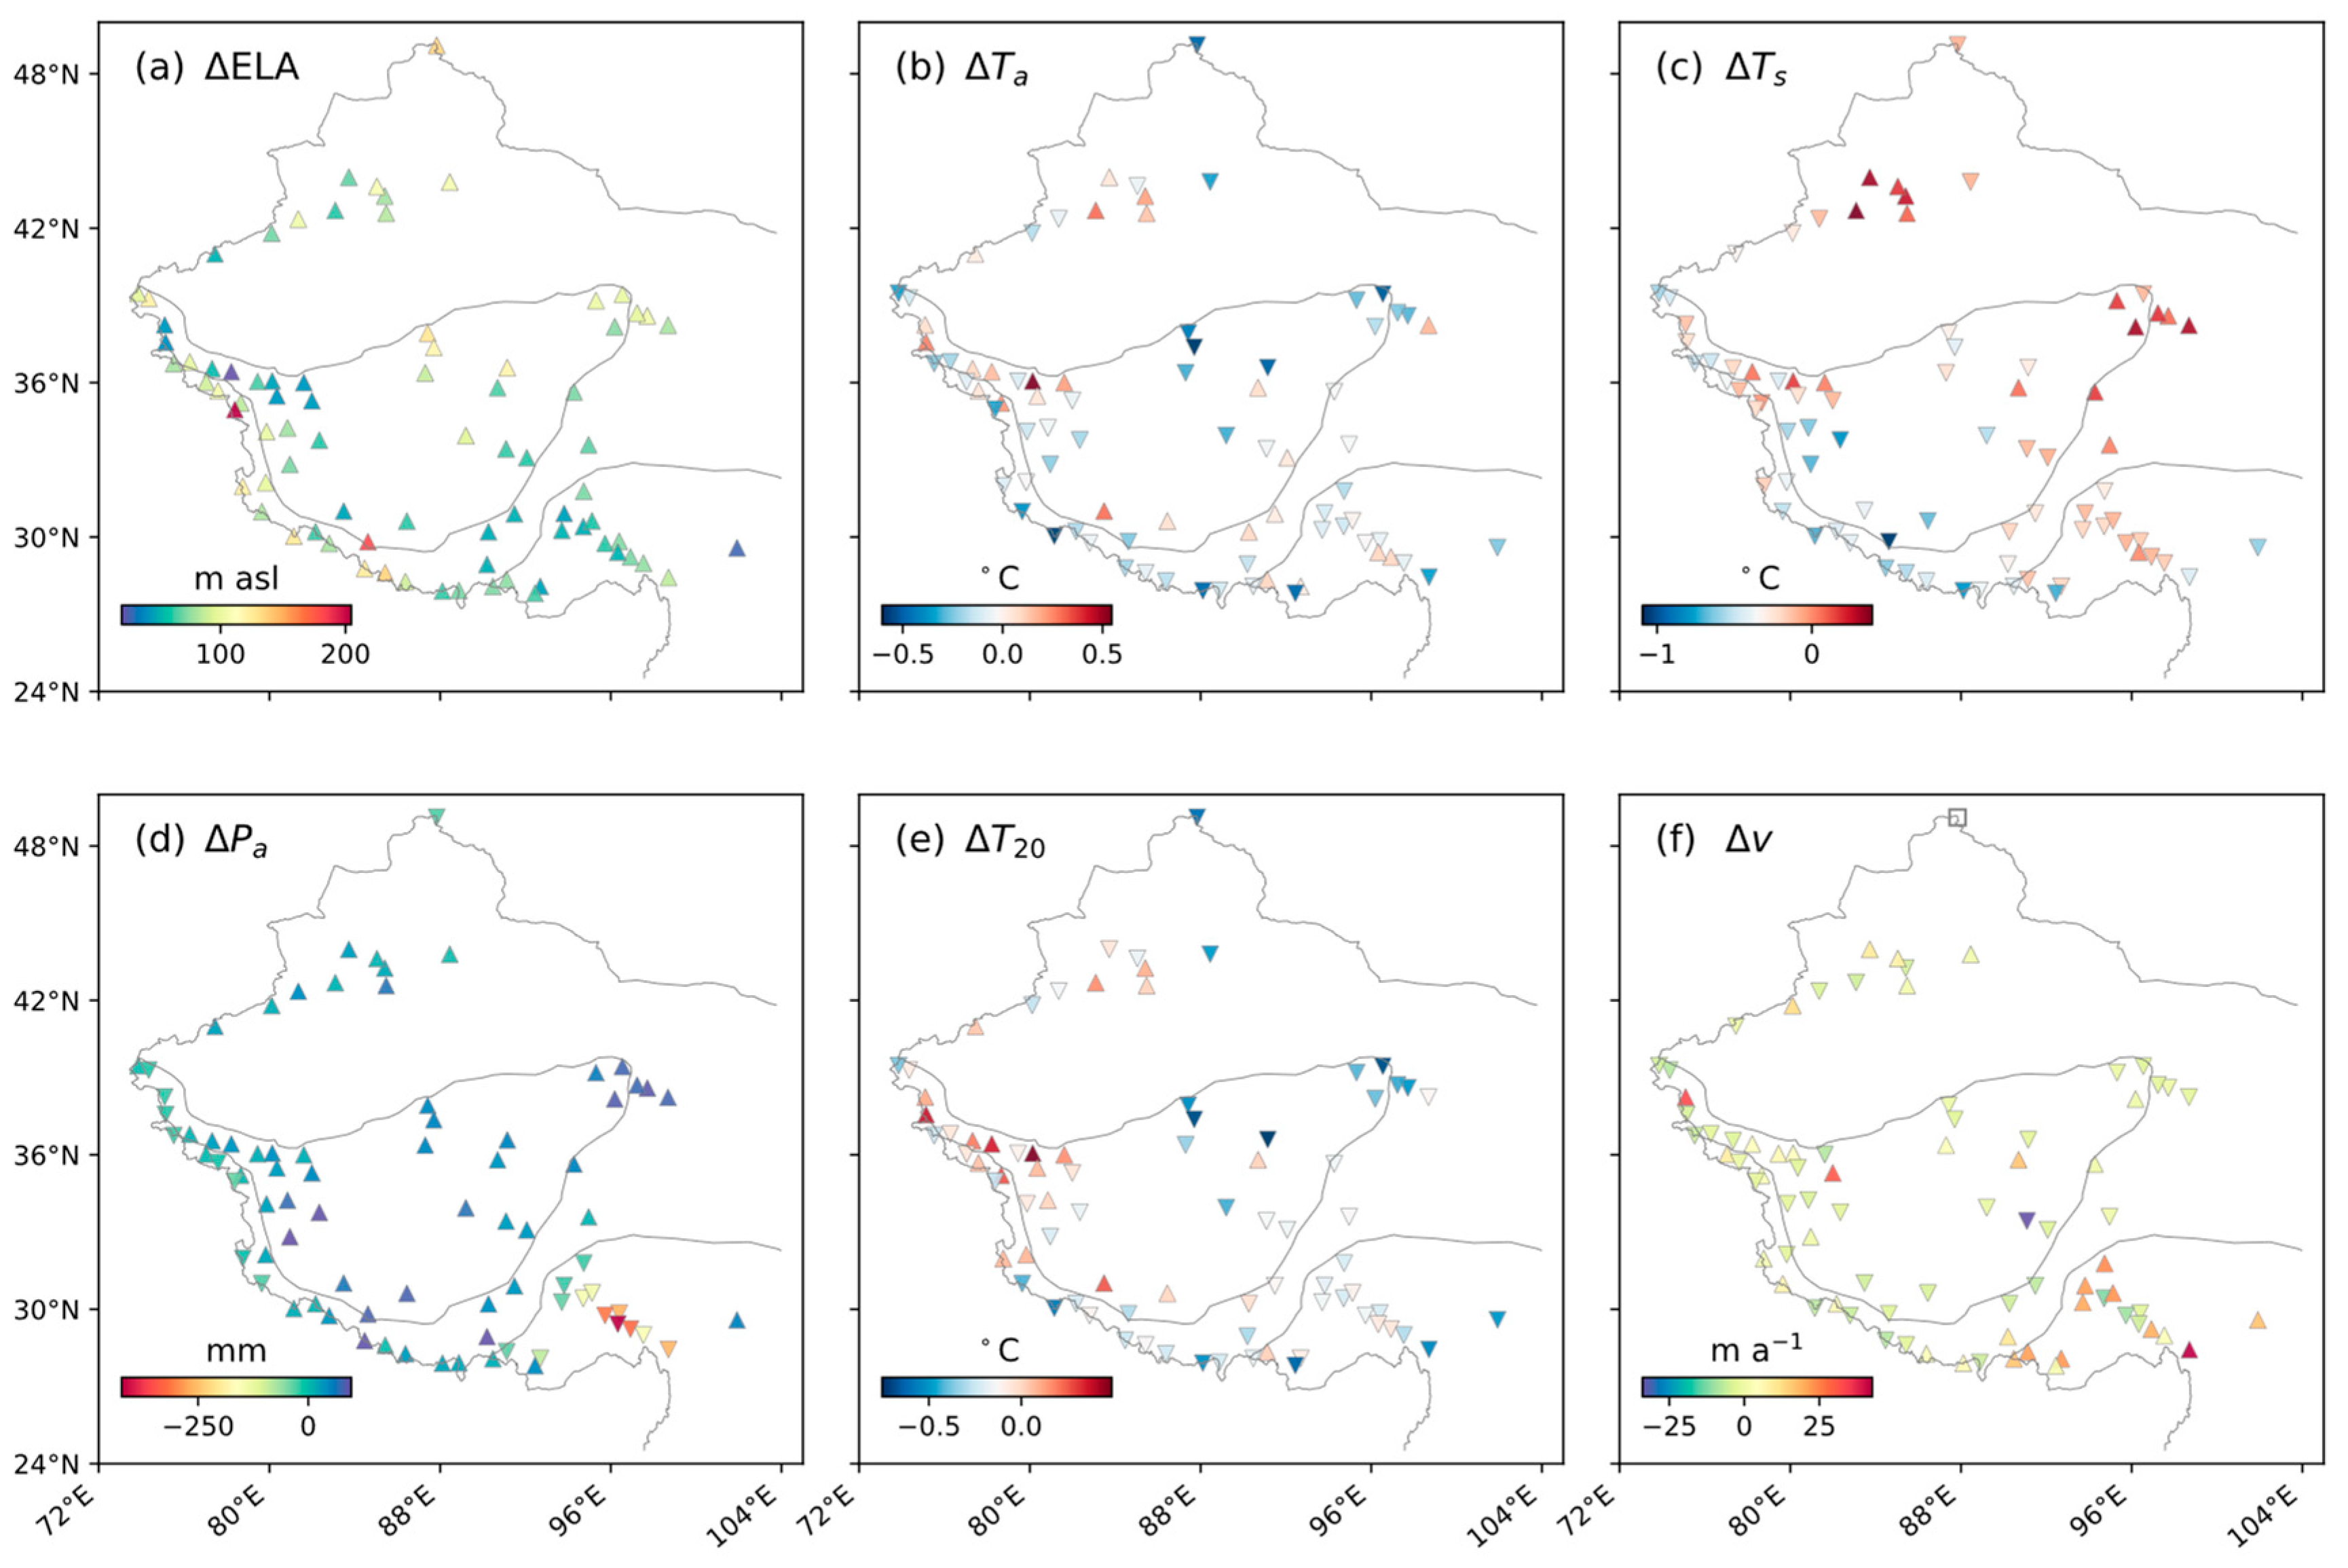
4.2.3. Changes Between the Two Periods
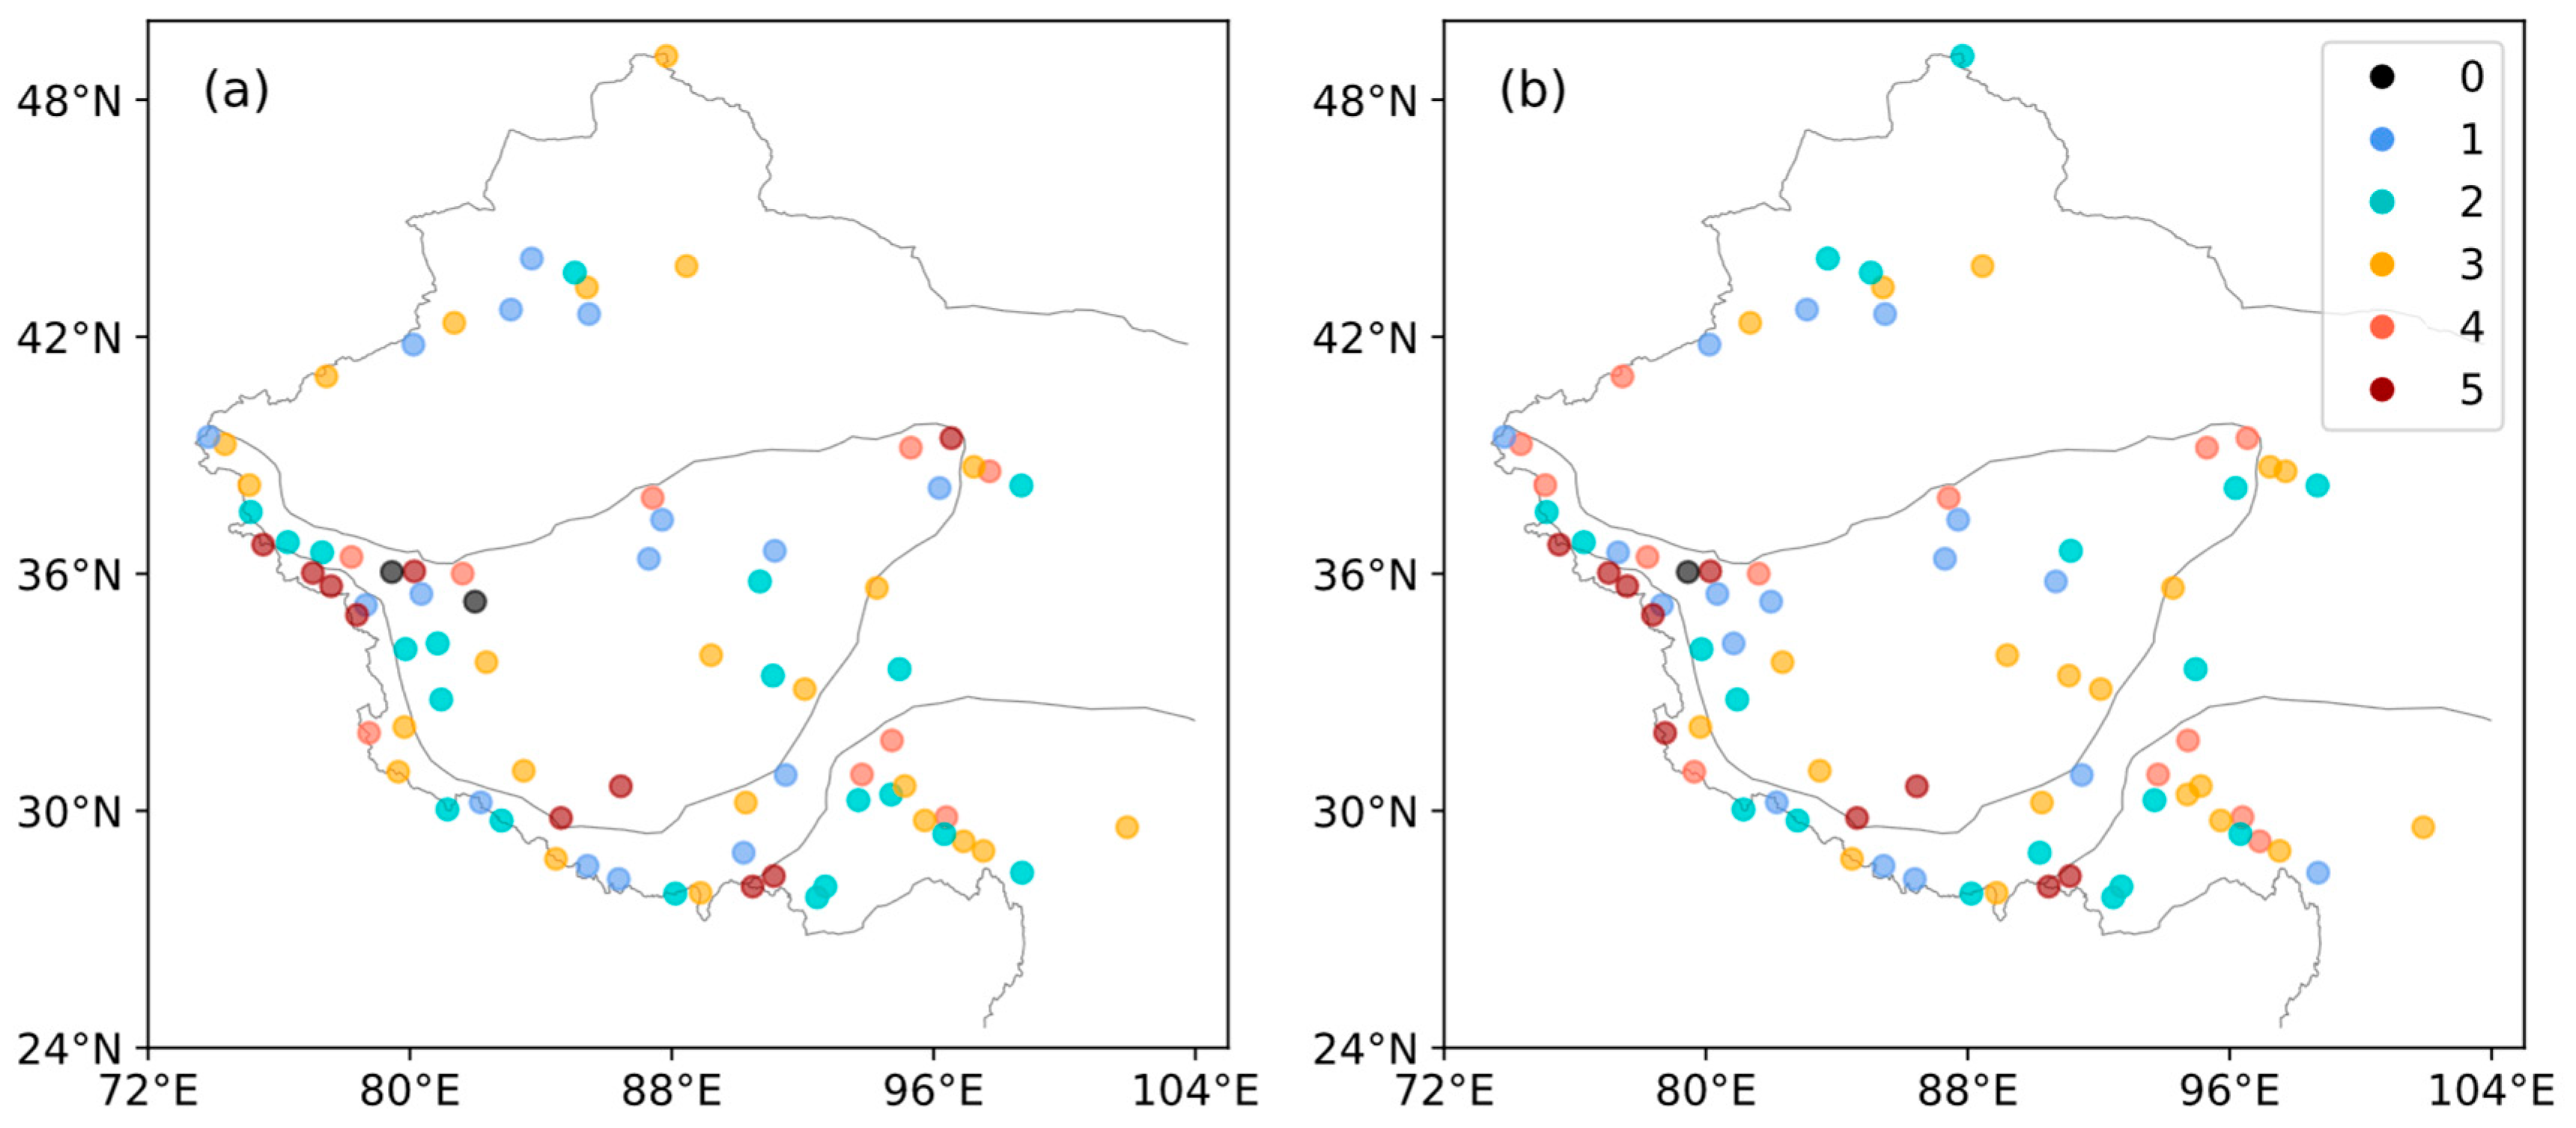
4.3. Threshold-Based Transformation in Glacier Types
5. Discussion
5.1. Drivers of Glacier Criteria Changes
5.2. Limitations
6. Conclusions
Supplementary Materials
Author Contributions
Funding
Data Availability Statement
Acknowledgments
Conflicts of Interest
References
- Guo, W.; Liu, S.; Xu, J.; Wu, L.; Shangguan, D.; Yao, X.; Wei, J.; Bao, W.; Yu, P.; Liu, Q.; et al. The second Chinese glacier inventory: Data, methods and results. J. Glaciol. 2015, 61, 357–372. [Google Scholar] [CrossRef]
- Kang, E.; Liu, C.; Xie, Z.; Li, X.; Shen, Y. Assessment of glacier water resources based on the Glacier Inventory of China. Ann. Glaciol. 2009, 50, 104–110. [Google Scholar] [CrossRef]
- Xiao, C.; Wang, S.; Qin, D. A preliminary study of cryosphere service function and value evaluation. Adv. Clim. Change Res. 2015, 6, 181–187. [Google Scholar] [CrossRef]
- Yao, T.; Thompson, L.; Yang, W.; Yu, W.; Gao, Y.; Guo, X.; Yang, X.; Duan, K.; Zhao, H.; Xu, B.; et al. Different glacier status with atmospheric circulations in Tibetan Plateau and surroundings. Nat. Clim. Change 2012, 2, 663–667. [Google Scholar] [CrossRef]
- Wang, N.; Yao, T.; Xu, B.; Chen, A.A.; Wang, W. Spatiotemporal pattern, trend, and influence of glacier change in Tibetan Plateau and surroundings under global warming. Bull. Chin. Acad. Sci. 2019, 34, 1220–1232. [Google Scholar] [CrossRef]
- Shean, D.E.; Bhushan, S.; Montesano, P.; Rounce, D.R.; Arendt, A.; Osmanoglu, B. A Systematic, Regional Assessment of High Mountain Asia Glacier Mass Balance. Front. Earth Sci. 2020, 7, 363. [Google Scholar] [CrossRef]
- Hugonnet, R.; McNabb, R.; Berthier, E.; Menounos, B.; Nuth, C.; Girod, L.; Farinotti, D.; Huss, M.; Dussaillant, I.; Brun, F.; et al. Accelerated global glacier mass loss in the early twenty-first century. Nature 2021, 592, 726–731. [Google Scholar] [CrossRef]
- Dehecq, A.; Gourmelen, N.; Gardner, A.S.; Brun, F.; Goldberg, D.; Nienow, P.W.; Berthier, E.; Vincent, C.; Wagnon, P.; Trouvé, E. Twenty-first century glacier slowdown driven by mass loss in High Mountain Asia. Nat. Geosci. 2019, 12, 22–27. [Google Scholar] [CrossRef]
- Deng, G.; Tang, Z.; Hu, G.; Wang, J.; Sang, G.; Li, J. Spatiotemporal Dynamics of Snowline Altitude and Their Responses to Climate Change in the Tienshan Mountains, Central Asia, during 2001–2019. Sustainability 2021, 13, 3992. [Google Scholar] [CrossRef]
- Wang, J.; Tang, Z.; Deng, G.; Hu, G.; You, Y.; Zhao, Y. Landsat Satellites Observed Dynamics of Snowline Altitude at the End of the Melting Season, Himalayas, 1991–2022. Remote Sens. 2023, 15, 2534. [Google Scholar] [CrossRef]
- Deng, G.; Tang, Z.; Dong, C.; Shao, D.; Wang, X. Development and Evaluation of a Cloud-Gap-Filled MODIS Normalized Difference Snow Index Product over High Mountain Asia. Remote Sens. 2024, 16, 192. [Google Scholar] [CrossRef]
- Kääb, A.; Leinss, S.; Gilbert, A.; Bühler, Y.; Gascoin, S.; Evans, S.G.; Bartelt, P.; Berthier, E.; Brun, F.; Chao, W.-A.; et al. Massive collapse of two glaciers in western Tibet in 2016 after surge-like instability. Nat. Geosci. 2018, 11, 114–120. [Google Scholar] [CrossRef]
- Yao, T.; Yu, W.; Wu, G.; Xu, B.; Yang, W.; Zhao, H.; Wang, W.; Li, S.; Wang, N.; Li, Z.; et al. Glacier anomalies and relevant disaster risks on the Tibetan Plateau and surroundings. Sci. Bull. 2019, 64, 2770–2782. [Google Scholar] [CrossRef]
- An, B.; Wang, W.; Yang, W.; Wu, G.; Guo, Y.; Zhu, H.; Gao, Y.; Bai, L.; Zhang, F.; Zeng, C.; et al. Process, mechanisms, and early warning of glacier collapse-induced river blocking disasters in the Yarlung Tsangpo Grand Canyon, southeastern Tibetan Plateau. Sci. Total Environ. 2022, 816, 151652. [Google Scholar] [CrossRef]
- Zheng, G.; Allen, S.K.; Bao, A.; Ballesteros-Cánovas, J.A.; Huss, M.; Zhang, G.; Li, J.; Yuan, Y.; Jiang, L.; Yu, T.; et al. Increasing risk of glacial lake outburst floods from future Third Pole deglaciation. Nat. Clim. Change 2021, 11, 411–417. [Google Scholar] [CrossRef]
- Zhang, T.; Wang, W.; An, B.; Wei, L. Enhanced glacial lake activity threatens numerous communities and infrastructure in the Third Pole. Nat. Commun. 2023, 14, 8250. [Google Scholar] [CrossRef]
- Zhang, G.; Carrivick, J.L.; Emmer, A.; Shugar, D.H.; Veh, G.; Wang, X.; Labedz, C.; Mergili, M.; Mölg, N.; Huss, M.; et al. Characteristics and changes of glacial lakes and outburst floods. Nat. Rev. Earth Environ. 2024, 5, 447–462. [Google Scholar] [CrossRef]
- Su, B.; Xiao, C.; Chen, D.; Huang, Y.; Che, Y.; Zhao, H.; Zou, M.; Guo, R.; Wang, X.; Li, X.; et al. Glacier change in China over past decades: Spatiotemporal patterns and influencing factors. Earth-Sci. Rev. 2022, 226, 103926. [Google Scholar] [CrossRef]
- Hagg, W. Glaciology and Glacial Geomorphology; Springer: Berlin/Heidelberg, Germany, 2022. [Google Scholar]
- Shi, Y.; Xie, Z. Fundamental characteristics of modern glaciers in China. Acta Geogr. Sin. 1964, 30, 183–213. [Google Scholar] [CrossRef]
- Lai, Z.; Huang, M. The fuzzy cluster analysis of glaciers in China. Sci. Bull. 1988, 33, 1250–1253. [Google Scholar] [CrossRef]
- Shi, Y.; Liu, S. Estimation on the response of glaciers in China to the global warming in the 21st century. Sci. Bull. 2000, 45, 434–438. [Google Scholar] [CrossRef]
- Qin, D.; Yao, T.; Ding, Y.; Ren, J. Introduction to Cryospheric Science; Springer: Singapore, 2021. [Google Scholar]
- Wu, G.; Shen, Y. Glaciers tourism resources in China and their development. J. Glaciol. Geocryol. 2007, 29, 664–667. [Google Scholar] [CrossRef]
- Li, Z.; Wang, F.; Li, H.; Xu, C.; Wang, P.; Zhou, P.; Yue, X. Science and Long-term Monitoring of Continental-type Glaciers in Arid Region in China. Bull. Chin. Acad. Sci. 2018, 33, 1381–1390. [Google Scholar] [CrossRef]
- Ohno, H.; Ohata, T.; Higuchi, K. The influence of humidity on the ablation of continental-type glaciers. Ann. Glaciol. 1992, 16, 107–114. [Google Scholar] [CrossRef]
- Fujita, K.; Ageta, Y.; Jianchen, P.; Tandong, Y. Mass balance of Xiao Dongkemadi glacier on the central Tibetan Plateau from 1989 to 1995. Ann. Glaciol. 2000, 31, 159–163. [Google Scholar] [CrossRef]
- Bolch, T.; Yao, T.; Kang, S.; Buchroithner, M.F.; Scherer, D.; Maussion, F.; Huintjes, E.; Schneider, C. A glacier inventory for the western Nyainqentanglha Range and the Nam Co Basin, Tibet, and glacier changes 1976–2009. Cryosphere 2010, 4, 419–433. [Google Scholar] [CrossRef]
- Shi, Y. Concise Glacier Inventory of China; Shanghai Popular Science Press: Shanghai, China, 2005. [Google Scholar]
- Maussion, F.; Butenko, A.; Champollion, N.; Dusch, M.; Eis, J.; Fourteau, K.; Gregor, P.; Jarosch, A.H.; Landmann, J.; Oesterle, F.; et al. The Open Global Glacier Model (OGGM) v1.1. Geosci. Model Dev. 2019, 12, 909–931. [Google Scholar] [CrossRef]
- Becker, J.J.; Sandwell, D.T.; Smith, W.H.F.; Braud, J.; Binder, B.; Depner, J.; Fabre, D.; Factor, J.; Ingalls, S.; Kim, S.H.; et al. Global Bathymetry and Elevation Data at 30 Arc Seconds Resolution: SRTM30_PLUS. Mar. Geod. 2009, 32, 355–371. [Google Scholar] [CrossRef]
- Lange, S.; Menz, C.; Gleixner, S.; Cucchi, M.; Weedon, G.P.; Amici, A.; Bellouin, N.; Schmied, H.M.; Hersbach, H.; Buontempo, C.; et al. WFDE5 Over Land Merged with ERA5 over the Ocean (W5E5 v2.0); ISIMIP Repository: Potsdam, Germany, 2021. [Google Scholar]
- Cucchi, M.; Weedon, G.P.; Amici, A.; Bellouin, N.; Lange, S.; Müller Schmied, H.; Hersbach, H.; Buontempo, C. WFDE5: Bias-adjusted ERA5 reanalysis data for impact studies. Earth Syst. Sci. Data 2020, 12, 2097–2120. [Google Scholar] [CrossRef]
- Huss, M.; Hock, R. A new model for global glacier change and sea-level rise. Front. Earth Sci. 2015, 3, 54. [Google Scholar] [CrossRef]
- Lehner, B.; Grill, G. Global river hydrography and network routing: Baseline data and new approaches to study the world’s large river systems. Hydrol. Process. 2013, 27, 2171–2186. [Google Scholar] [CrossRef]
- Jiang, Y.; Yang, K.; Yang, H.; Lu, H.; Chen, Y.; Zhou, X.; Sun, J.; Yang, Y.; Wang, Y. Characterizing basin-scale precipitation gradients in the Third Pole region using a high-resolution atmospheric simulation-based dataset. Hydrol. Earth Syst. Sci. 2022, 26, 4587–4601. [Google Scholar] [CrossRef]
- Jing, Z.; Zhou, Z.; Liu, L. Progress of the research on glacier velocities in China. J. Glaciol. Geocryol. 2010, 32, 749–754. [Google Scholar] [CrossRef]
- Gardner, A.S.; Fahnestock, M.A.; Scambos, T.A. ITS_LIVE Regional Glacier and Ice Sheet Surface Velocities: Version 1; National Snow and Ice Data Center: Boulder, CO, USA, 2019. [Google Scholar] [CrossRef]
- Friedl, P.; Seehaus, T.; Braun, M. Global time series and temporal mosaics of glacier surface velocities derived from Sentinel-1 data. Earth Syst. Sci. Data 2021, 13, 4653–4675. [Google Scholar] [CrossRef]
- Millan, R.; Mouginot, J.; Rabatel, A.; Morlighem, M. Ice velocity and thickness of the world’s glaciers. Nat. Geosci. 2022, 15, 124–129. [Google Scholar] [CrossRef]
- Kienholz, C.; Rich, J.L.; Arendt, A.A.; Hock, R. A new method for deriving glacier centerlines applied to glaciers in Alaska and northwest Canada. Cryosphere 2014, 8, 503–519. [Google Scholar] [CrossRef]
- Duan, K.; Yao, T.; Wang, N.; Shi, P.; Meng, Y. Changes in equilibrium-line altitude and implications for glacier evolution in the Asian high mountains in the 21st century. Sci. China Earth Sci. 2022, 65, 1308–1316. [Google Scholar] [CrossRef]
- Yao, T.; Bolch, T.; Chen, D.; Gao, J.; Immerzeel, W.; Piao, S.; Su, F.; Thompson, L.; Wada, Y.; Wang, L.; et al. The imbalance of the Asian water tower. Nat. Rev. Earth Environ. 2022, 3, 618–632. [Google Scholar] [CrossRef]
- Tang, Z.; Wang, X.; Deng, G.; Wang, X.; Jiang, Z.; Sang, G. Spatiotemporal variation of snowline altitude at the end of melting season across High Mountain Asia, using MODIS snow cover product. Adv. Space Res. 2020, 66, 2629–2645. [Google Scholar] [CrossRef]
- Wang, R.; Liu, S.; Shangguan, D.; Radić, V.; Zhang, Y. Spatial heterogeneity in glacier mass-balance sensitivity across High Mountain Asia. Water 2019, 11, 776. [Google Scholar] [CrossRef]
- Jouberton, A.; Shaw, T.E.; Miles, E.; McCarthy, M.; Fugger, S.; Ren, S.; Dehecq, A.; Yang, W.; Pellicciotti, F. Warming-induced monsoon precipitation phase change intensifies glacier mass loss in the southeastern Tibetan Plateau. Proc. Natl. Acad. Sci. USA 2022, 119, e2109796119. [Google Scholar] [CrossRef] [PubMed]
- Arndt, A.; Schneider, C. Spatial pattern of glacier mass balance sensitivity to atmospheric forcing in High Mountain Asia. J. Glaciol. 2023, 69, 1616–1633. [Google Scholar] [CrossRef]
- Rounce, D.R.; Hock, R.; Shean, D.E. Glacier mass change in High Mountain Asia through 2100 using the open-source python glacier evolution model (PyGEM). Front. Earth Sci. 2020, 7, 331. [Google Scholar] [CrossRef]
- Huang, L.; Chen, J.; Yang, K.; Yang, Y.; Huang, W.; Zhang, X.; Chen, F. The northern boundary of the Asian summer monsoon and division of westerlies and monsoon regimes over the Tibetan Plateau in present-day. Sci. China Earth Sci. 2023, 66, 882–893. [Google Scholar] [CrossRef]
- Yu, Y.; You, Q.; Zhang, Y.; Jin, Z.; Kang, S.; Zhai, P. Integrated warm-wet trends over the Tibetan Plateau in recent decades. J. Hydrol. 2024, 639, 131599. [Google Scholar] [CrossRef]
- Johnson, E.; Rupper, S. An examination of physical processes that trigger the albedo-feedback on glacier surfaces and implications for regional glacier mass balance across high mountain Asia. Front. Earth Sci. 2020, 8, 129. [Google Scholar] [CrossRef]
- Huang, M.; Shi, Y. Progress in the study on basic features of glaciers in China in the last thirty years. J. Glaciol. Geocryol. 1988, 10, 228–237. [Google Scholar] [CrossRef]
- Paul, F.; Bolch, T.; Kääb, A.; Nagler, T.; Nuth, C.; Scharrer, K.; Shepherd, A.; Strozzi, T.; Ticconi, F.; Bhambri, R.; et al. The glaciers climate change initiative: Methods for creating glacier area, elevation change and velocity products. Remote Sens. Environ. 2015, 162, 408–426. [Google Scholar] [CrossRef]
- Cuffey, K.M.; Paterson, W.S.B. The Physics of Glaciers; Academic Press: Cambridge, MA, USA, 2010. [Google Scholar]
- Nanni, U.; Scherler, D.; Ayoub, F.; Millan, R.; Herman, F.; Avouac, J.-P. Climatic control on seasonal variations in mountain glacier surface velocity. Cryosphere 2023, 17, 1567–1583. [Google Scholar] [CrossRef]
- Wallis, B.J.; Hogg, A.E.; Wessem, J.M.V.; Davison, B.J.; Broeke, M.R.V.D. Widespread seasonal speed-up of west Antarctic Peninsula glaciers from 2014 to 2021. Nat. Geosci. 2023, 16, 231–237. [Google Scholar] [CrossRef]
- Wu, J.; Sun, W.; Huai, B.; Ding, M.; Wang, L.; Wang, Y.; Zhang, J.; Du, W.; Chen, J.; Qin, X. Mass Balance Reconstruction for Laohugou Glacier No. 12 from 1980 to 2020, Western Qilian, China. Remote Sens. 2022, 14, 5424. [Google Scholar] [CrossRef]
- Loibl, D.; Richter, N.; Grünberg, I. Remote Sensing-Derived Time Series of Transient Snowline Altitudes for High Mountain Asia, 1986–2021. arXiv 2022, arXiv:10.31223/X5WH2D. [Google Scholar]
- Wanhua, Y.; Feiteng, W.; Zhongqin, L.; Hui, Z.H.; Chunhai, X.U.; Baojuan, H.U. Temporal and Spatial Distributions of the Equilibrium Line Altitudes of the Monitoring Glaciers in High Asia. J. Glaciol. Geocryol. 2016, 38, 1459–1469. [Google Scholar]
- Wang, N.; He, J.; Pu, J.; Jiang, X.; Jing, Z. Variations in Equilibrium Line Altitude of the Qiyi Glacier, Qilian, over the Past 50 Years. Chin. Sci. Bull. 2010, 55, 3810–3817. [Google Scholar] [CrossRef]
- Dong, Z.; Qin, D.; Ren, J.; Li, K.; Li, Z. Variations in the Equilibrium Line Altitude of Urumqi Glacier No. 1, Tianshan Mountains, over the Past 50 Years. Chin. Sci. Bull. 2012, 57, 4776–4783. [Google Scholar] [CrossRef]
- Zhang, Y.; Hirabayashi, Y.; Liu, S. Catchment-Scale Reconstruction of Glacier Mass Balance Using Observations and Global Climate Data: Case Study of the Hailuogou Catchment, South-Eastern Tibetan Plateau. J. Hydrol. 2012, 445, 146–160. [Google Scholar] [CrossRef]


| Type | Ta (°C) | Ts (°C) | Pa (mm) | T20 (°C) | v (m a−1) |
|---|---|---|---|---|---|
| Extremely continental | <−10 | <−1 | 200–500 | <−10 | 30–50 |
| Subcontinental | −12~−6 | 0~3 | 500–1000 | −10~−1 | 50–100 |
| Maritime | >−6 | 1~5 | 1000–3000 | −1~0 | >100 |
| Glacier | Altitude | Time Period | ||
|---|---|---|---|---|
| LHG12 | 0.76 | 4.5%/100 m | 4500 m | 2010–2015 |
| DKMD | 0.82 | 1.4%/100 m | 4600 m | 2008–2010 |
| QY | 0.61 | 2.4%/100 m | 4870 m | 2008–2012 |
| URS1 | 0.60 | 4.1%/100 m | 3700 m | 2002–2004 |
| PL4 | 1.15 | −1.9%/100 m | 4600 m | 2008–2018 |
| HLG | 0.79 | −3.4%/100 m | 3500 m | 1980 and 2000 |
Disclaimer/Publisher’s Note: The statements, opinions and data contained in all publications are solely those of the individual author(s) and contributor(s) and not of MDPI and/or the editor(s). MDPI and/or the editor(s) disclaim responsibility for any injury to people or property resulting from any ideas, methods, instructions or products referred to in the content. |
© 2025 by the authors. Licensee MDPI, Basel, Switzerland. This article is an open access article distributed under the terms and conditions of the Creative Commons Attribution (CC BY) license (https://creativecommons.org/licenses/by/4.0/).
Share and Cite
Li, T.; Wang, Y.; Huai, B.; An, H.; Wang, L.; Sun, W. Assessment of Glacier Transformation in China over the Past 40 Years Using a China-Specific Glacier Classification System. Remote Sens. 2025, 17, 2289. https://doi.org/10.3390/rs17132289
Li T, Wang Y, Huai B, An H, Wang L, Sun W. Assessment of Glacier Transformation in China over the Past 40 Years Using a China-Specific Glacier Classification System. Remote Sensing. 2025; 17(13):2289. https://doi.org/10.3390/rs17132289
Chicago/Turabian StyleLi, Tianya, Yuzhe Wang, Baojuan Huai, Hongmin An, Lei Wang, and Weijun Sun. 2025. "Assessment of Glacier Transformation in China over the Past 40 Years Using a China-Specific Glacier Classification System" Remote Sensing 17, no. 13: 2289. https://doi.org/10.3390/rs17132289
APA StyleLi, T., Wang, Y., Huai, B., An, H., Wang, L., & Sun, W. (2025). Assessment of Glacier Transformation in China over the Past 40 Years Using a China-Specific Glacier Classification System. Remote Sensing, 17(13), 2289. https://doi.org/10.3390/rs17132289