Article

Fault Movement and Uplift Mechanism of Mt. Gongga, Sichuan Province, Constrained by Co-Seismic Deformation Fields from GNSS Observations

1
College of Earth and Planetary Sciences, Chengdu University of Technology, Chengdu 610059, China
2
College of Geophysics, Chengdu University of Technology, Chengdu 610059, China
3
Chengdu Institute of the Tibetan Plateau Earthquake Research, Sichuan Earthquake Agency, Chengdu 610041, China
*
Author to whom correspondence should be addressed.
Remote Sens. 2025, 17(13), 2286; https://doi.org/10.3390/rs17132286
Submission received: 2 May 2025 / Revised: 19 June 2025 / Accepted: 1 July 2025 / Published: 3 July 2025

Abstract

On 5 September 2022, a Mw 6.6 earthquake occurred in Luding, Sichuan Province, China. The epicenter of this earthquake was located in the vicinity of Mt. Gongga. The China Earthquake Administration employed the Global Navigation Satellite System (GNSS) to conduct concurrent deformation field monitoring of the main fault associated with the Luding earthquake. The research area surrounding Mt. Gongga exhibits intricate structural and dynamic processes. However, previous studies have lacked a comprehensive three-dimensional analysis of the uplift mechanism of Mt. Gongga. This study utilizes GNSS data to constrain simulations and employs the FLAC3D numerical model to simulate the primary fault movement during the earthquake and the subsequent changes in the uplift of Mt. Gongga. These investigations are supported by seismic analysis, mechanical analysis, and inversion studies, facilitating the formulation of its uplift mechanism. The results indicate the following: (1) The seismic source analysis of the earthquake reveals a steep dip angle of the primary fault plane, with a predominant inclination toward the northeast. (2) Numerical simulations demonstrate a consistent correlation between the horizontal displacement pattern and the arcuate structure of the Sichuan–Yunnan block, promoting the counterclockwise uplift of Mt. Gongga. The vertical displacement pattern indicates that this earthquake accelerated the overall uplift of Mt. Gongga. (3) Mt. Gongga undergoes a multiple coupling uplift mechanism characterized by “clockwise uplift + rotational flexure + asthenospheric upwelling”. Seismic analysis, mechanical analysis and the results of numerical inversion serve as a useful basis for understanding the uplift of Mt. Gongga and for understanding high mountain uplift in orogen-foreland systems in general.

1. Introduction

The eastern margin of the Tibetan Plateau, located in the southwestern part of mainland China, reaches an average elevation of four thousand meters. It is currently the thickest, largest, and youngest major component of a plateau in the world. The tectonic deformation in this region belongs to one of the most active zones globally. It is primarily composed of several geologically active blocks and numerous deep-seated faults [1]. The epicenter of the Mw 6.6 Luding earthquake in Sichuan was near Moxi Town, where the southeastern segment of the Xianshuihe fault, a large-scale strike-slip fault, intersects with the southwestern segment of the Longmenshan fault, which exhibits both reverse and strike-slip characteristics. The earthquake occurred at the intersection of these two main faults, forming a “Y” shape, precisely beneath the main peak of Mt. Gongga, at the foothills of the mountain range (Figure 1). The eastern margin of the Tibetan Plateau in terms of tectonic landforms consists of three primary structural landforms and units: plain (in the eastern Tibetan Plateau), mountain (Mt. Gongga), and basin (western Sichuan Basin). They form a typical basin–mountain–plain structure. These landforms and units are products of the Indo-Asia collision, complementing each other in material, spatial interdependence, dynamic transformation, and evolutionary processes [2]. The tectonic activity of the Tibetan Plateau is exceptionally active, making it an ideal window and natural laboratory for studying continental dynamics. The adjacent seismic source area is characterized by the rugged and steep topography of Mt. Gongga, which exhibits unique characteristics such as block amalgamation, collisional orogenesis, large-scale strike-slip faults, plateau uplift, and the rise of surrounding orogenic belts [3]. These features provide valuable material for revealing the deep crustal structure and driving forces of the Tibetan Plateau. The exploration of the lateral tectonic effects and deep-seated movement mechanisms in the Tibetan Plateau has been a significant tool in understanding the deformation and evolutionary processes of continental collisions and the orogenic processes of the “basin–mountain–plain” system [4]. The recent seismic event of the Luding Mw 6.6 earthquake in the highest underground mountain range on the eastern edge of the Sichuan–Yunnan Block has captured considerable attention within the geological community.
Extensive research has been conducted on the eastern margin of the Tibetan Plateau, focusing on the following aspects: Geophysical investigations have revealed the widespread existence of a plastic rheological layer (characterized by low velocity, low strength, and high conductivity with partially molten material) in the middle and lower crust. This process is believed to play a crucial controlling role in the deformation of the Tibetan Plateau [6,7,8]. Geodetic measurements have been employed to study and demonstrate the lateral extension mechanisms of crustal materials and the controlling factors in the uplift deformation of the Tibetan Plateau [9,10,11,12,13,14]. In situ stress measurements and earthquake source mechanism analyses have provided insights into the dynamics of the region [15,16,17,18,19]. Numerical inversion simulations and sub-crustal flow models have been utilized to analyze the deformation characteristics and patterns of plateau extension [20]. InSAR data inversion has been used to examine Coulomb stress changes and interseismic slip rates [21,22]. Cross-fault leveling and baseline results have been analyzed to understand the characteristics of fault activity [23,24]. Regarding the uplift mechanism and characteristics of Mt. Gongga, numerous scholars from various fields, including geological mechanics, tectonics, geodesy, and geophysical exploration, have conducted extensive research domestically and internationally [25,26,27]. Recent research findings suggest the following: Three-dimensional thermomechanical numerical simulations have investigated the uplift mechanism in the Mt. Gongga region, suggesting that compression uplift and three-dimensional heterogeneous exhumation are the primary driving forces behind Mt. Gongga’s rapid uplift [28,29]. Three-dimensional geomechanical modeling of the uplift mechanism on the eastern margin of the Tibetan Plateau indicates that Mt. Gongga’s uplift is mainly caused by crustal shortening and thickening resulting from the lateral movement of the crust [30].
However, previous numerical simulations lacked true three-dimensional geological modeling, verification using measured and inverted data similar to GNSS, and comprehensive analysis of uplift from shallow to deep and from horizontal to vertical profiles. Therefore, there is an urgent need to integrate the vertical movement of ductile materials, the horizontal movement of rigid blocks, and the rotational movement of hard blocks in the middle and lower crust in the Mt. Gongga region. This three-dimensional comprehensive study, encompassing from top to bottom and from horizontal to vertical perspectives, will allow for an analysis of the orogenic mechanism involving multiple coupling effects. This study takes typical seismic events in the region as a starting point. By utilizing GNSS observations before and after earthquakes and applying numerical simulations with constraints and corrections, the seismic fault movement during the earthquake and the post-earthquake uplift changes in the Mt. Gongga region are analyzed using FLAC3D numerical modeling. The seismic analysis, mechanical analysis, and results of numerical inversion serve as the research support for formulating the uplift of Mt. Gongga but also deepens the understanding of the mechanisms behind high mountain uplift in the “basin–mountain–plain” system. Additionally, it provides scientific significance and practical value for major engineering projects such as the Sichuan–Tibet Railway.

2. Seismic Geologic Conditions in the Mt. Gongga Study Area

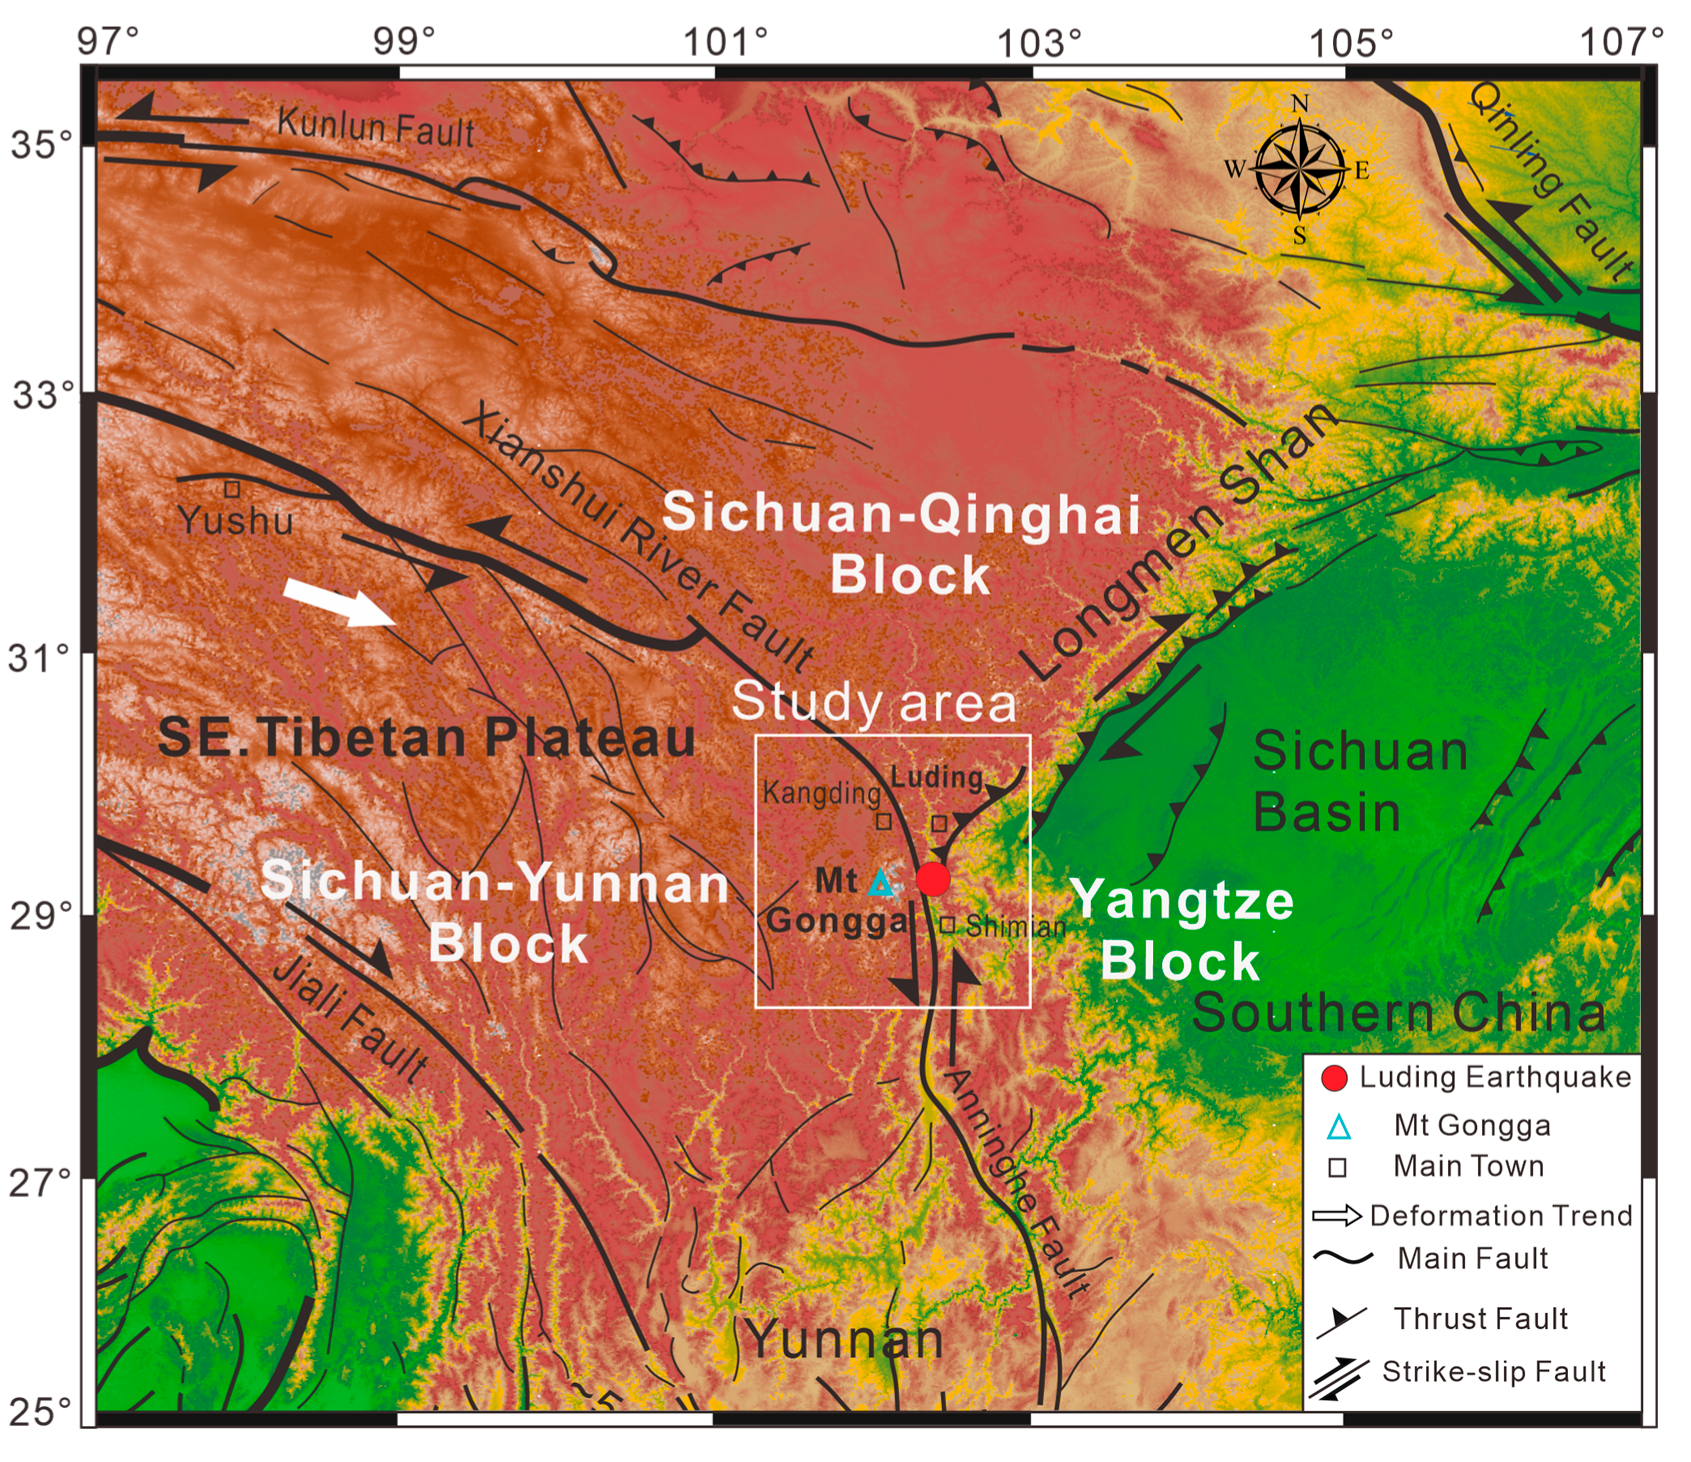
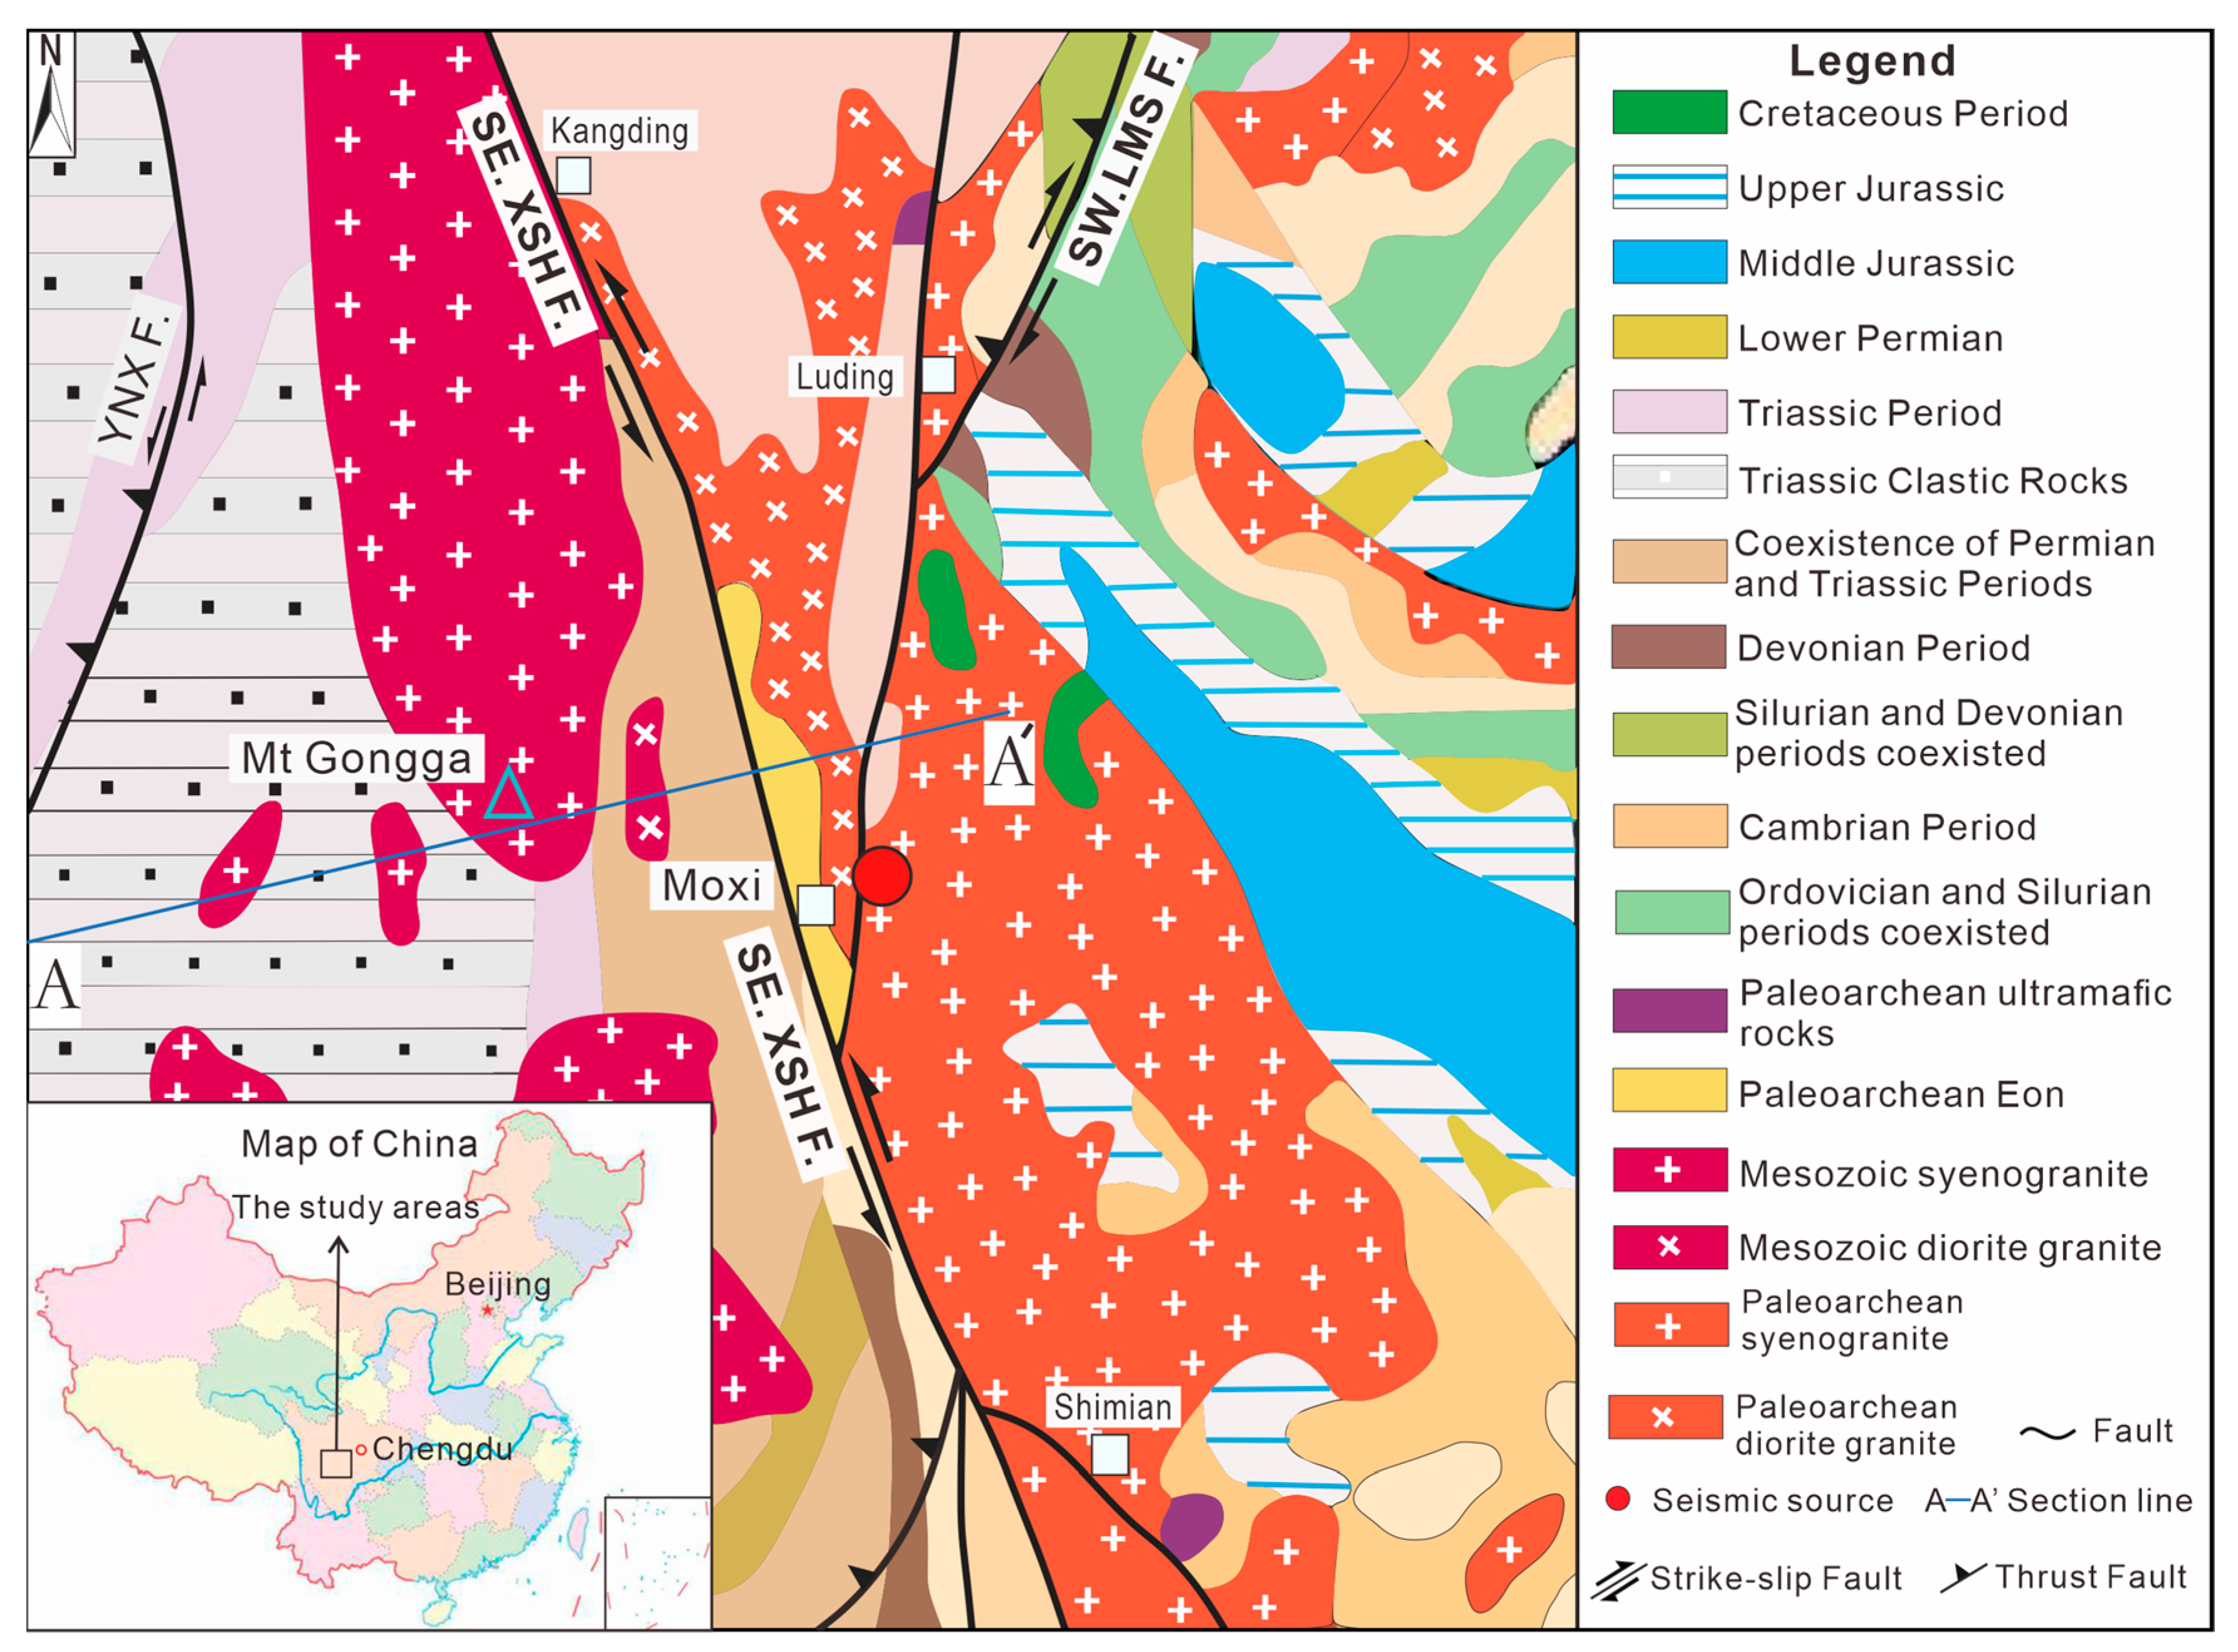
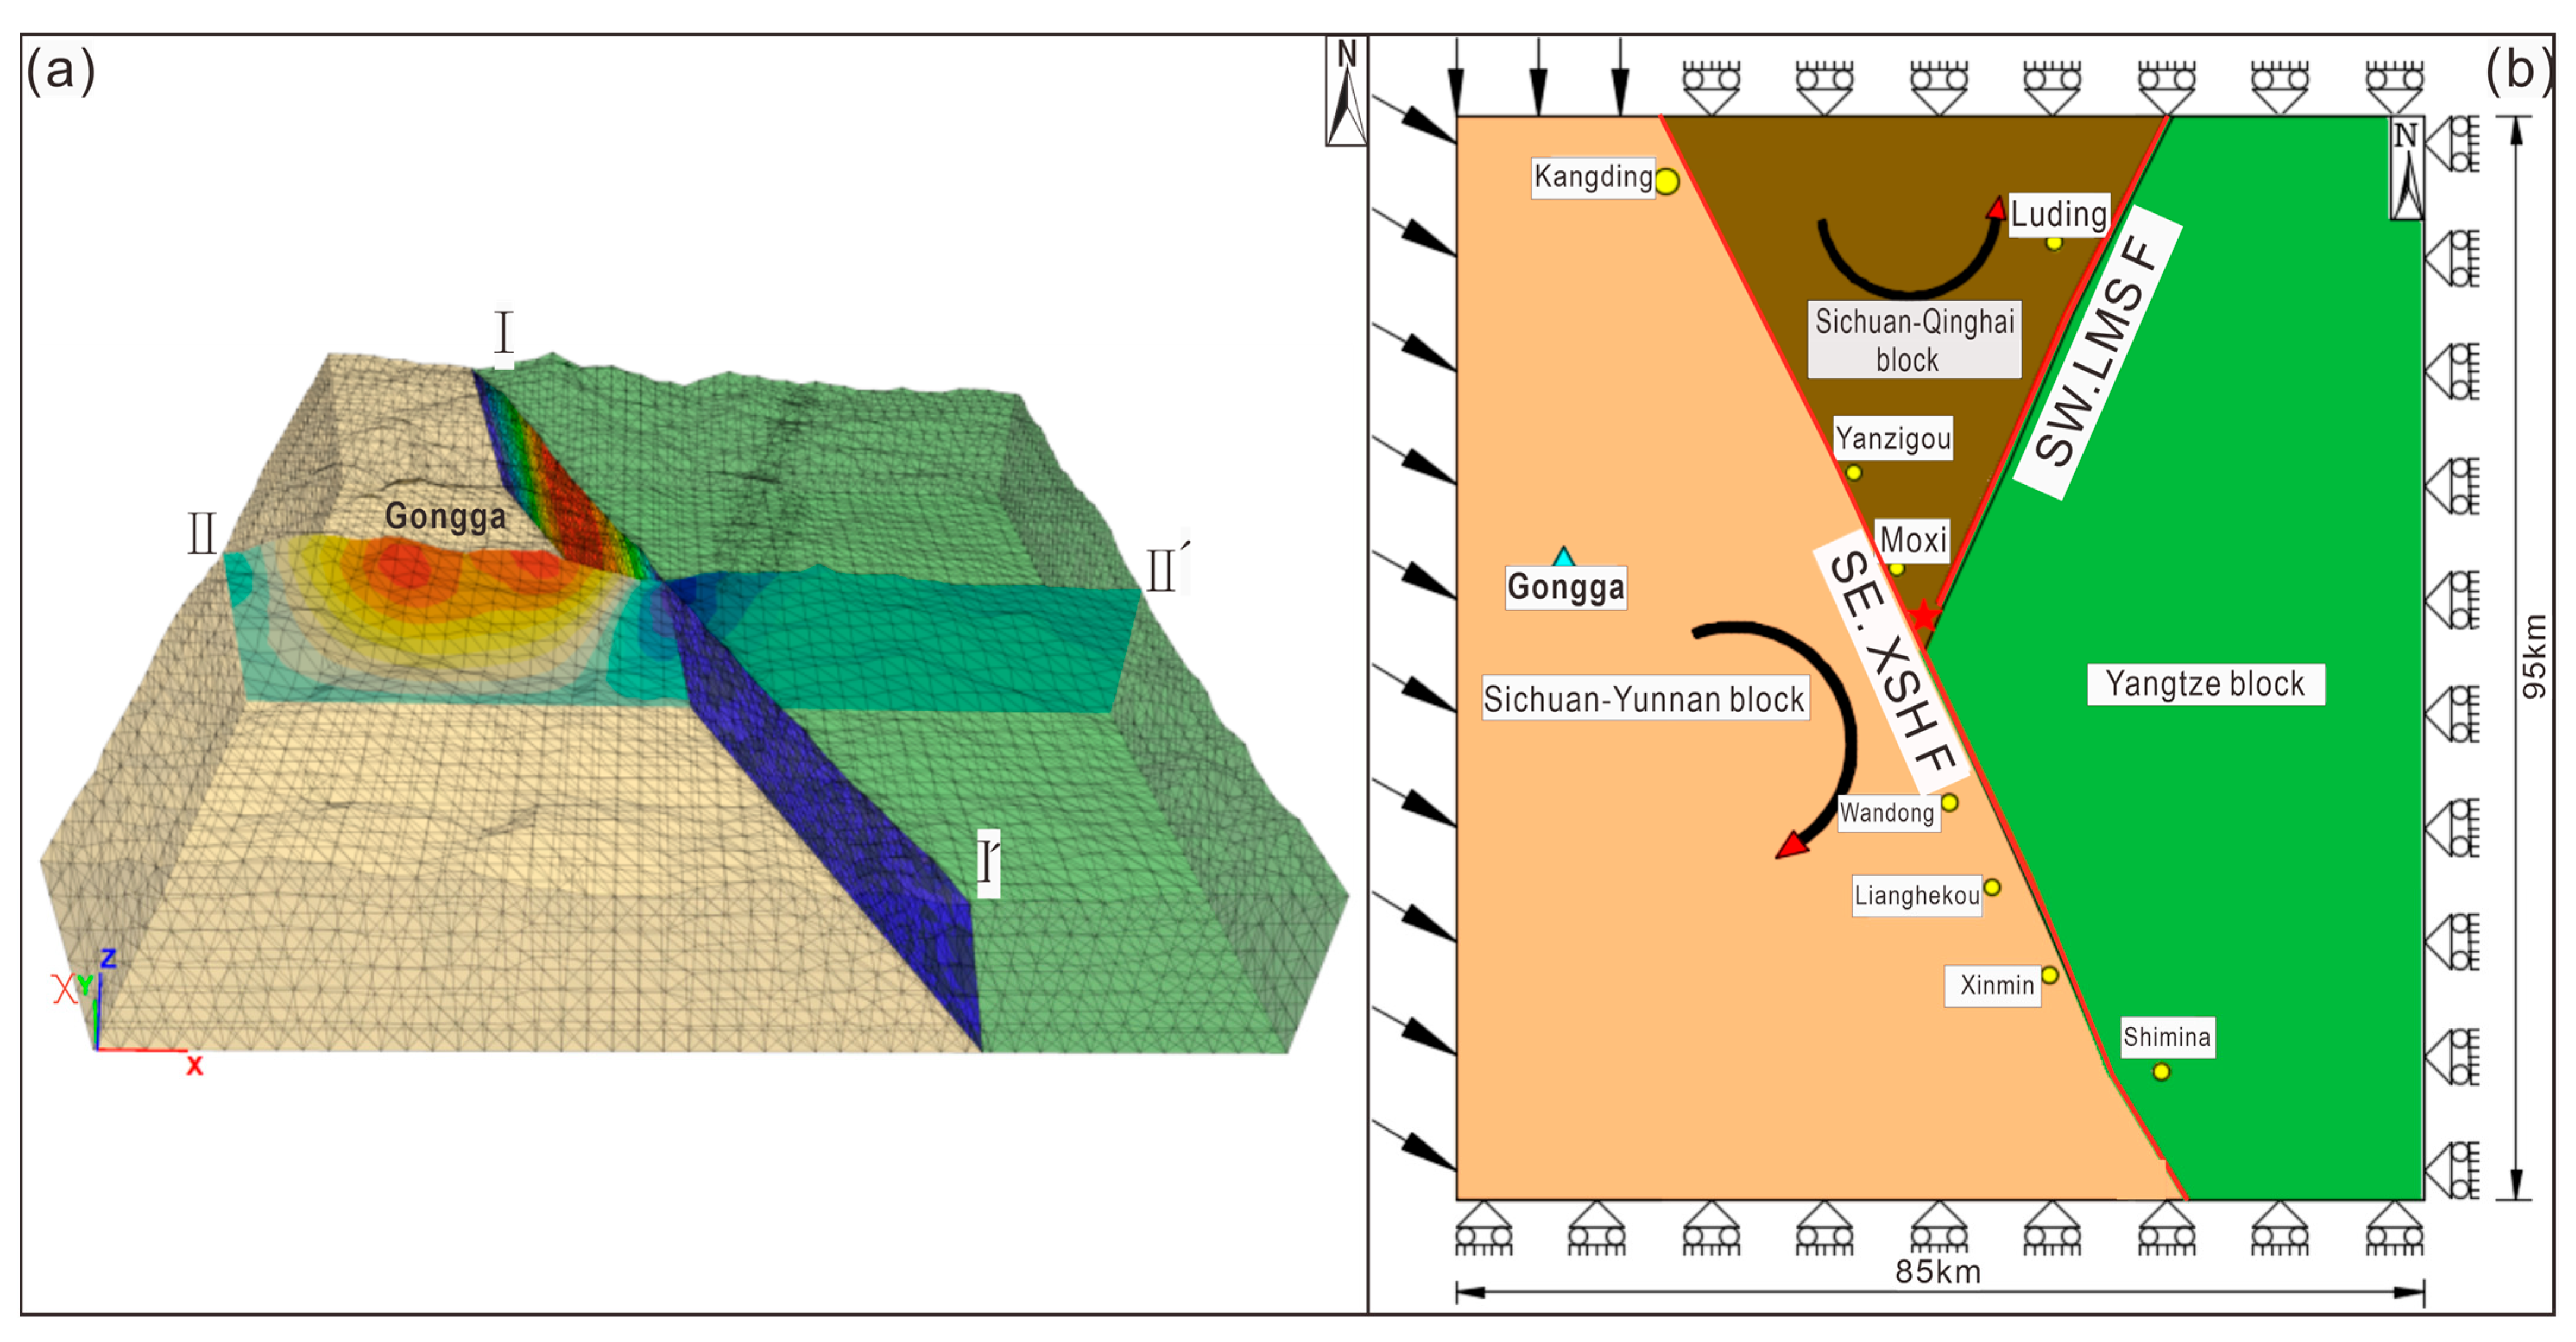
2.1. Regional Tectonic Background

The research area is located at the complex intersection of multiple tectonic zones, with a stratigraphic lithology of considerable complexity (Figure 2). The main peak mountain group of Mt. Gongga exhibits a predominantly SN-oriented belt-like distribution. The main peak group of Mt. Gongga consists of Triassic sandstone intermingled with a significant amount of granitic structures, forming a topographically arched mountain. In terms of fault structures, the region—controlled by the southwestern segment of the Longmenshan fault (SW.LMSF), the southeastern segment of the Xianshuihe fault (SE.XSHF), and the Yunongxi fault—exhibits a combination of high-angle strike-slip and thrust faults, oriented from east to west (Figure 3). The southwestern segment of the Longmenshan fault and the southeastern segment of the Xianshuihe fault form an “invertrned-triangle” pattern, while the southeastern segment of the Xianshuihe fault and the Yunongxi fault form a regular “triangle” arrangement within Mt. Gongga.
From west to east, these blocks are the Sichuan–Yunnan block, the Sichuan–Qinghai block, and the Yangtze block (Figure 1). The main regional faults consist of the southeastern segment of the Xianshuihe fault and the southwestern segment of the Longmenshan fault. The topography of the eastern margin of the Tibetan Plateau exhibits significant variations, with Mt. Gongga in the study area reaching an elevation of over seven thousand meters, making it the highest peak in the southwestern Mountain range. At lower elevations, there are modern glaciers, such as the Hailuogou Glacier, which descends to around one thousand meters above sea level (Figure 3). The eastern margin of the Tibetan Plateau, particularly the eastern edge of the Sichuan–Yunnan block, serves as a bottleneck for the escape of material from the plateau and is a core area of left-lateral movement. The southwestern side of the Sichuan–Yunnan block experiences continuous compression and pushing from the Indian Ocean plate, while the northwest side is influenced by the eastward or southeastward overflow of material from the plateau. The eastern side is obstructed by the rigid and cold Yangtze block [33]. The convergence of shallow-level force sources from these three directions, along with the possible upwelling of material from the deep crust beneath the plateau, results in a region with complex geological structures and frequent and intense seismic activity [34].

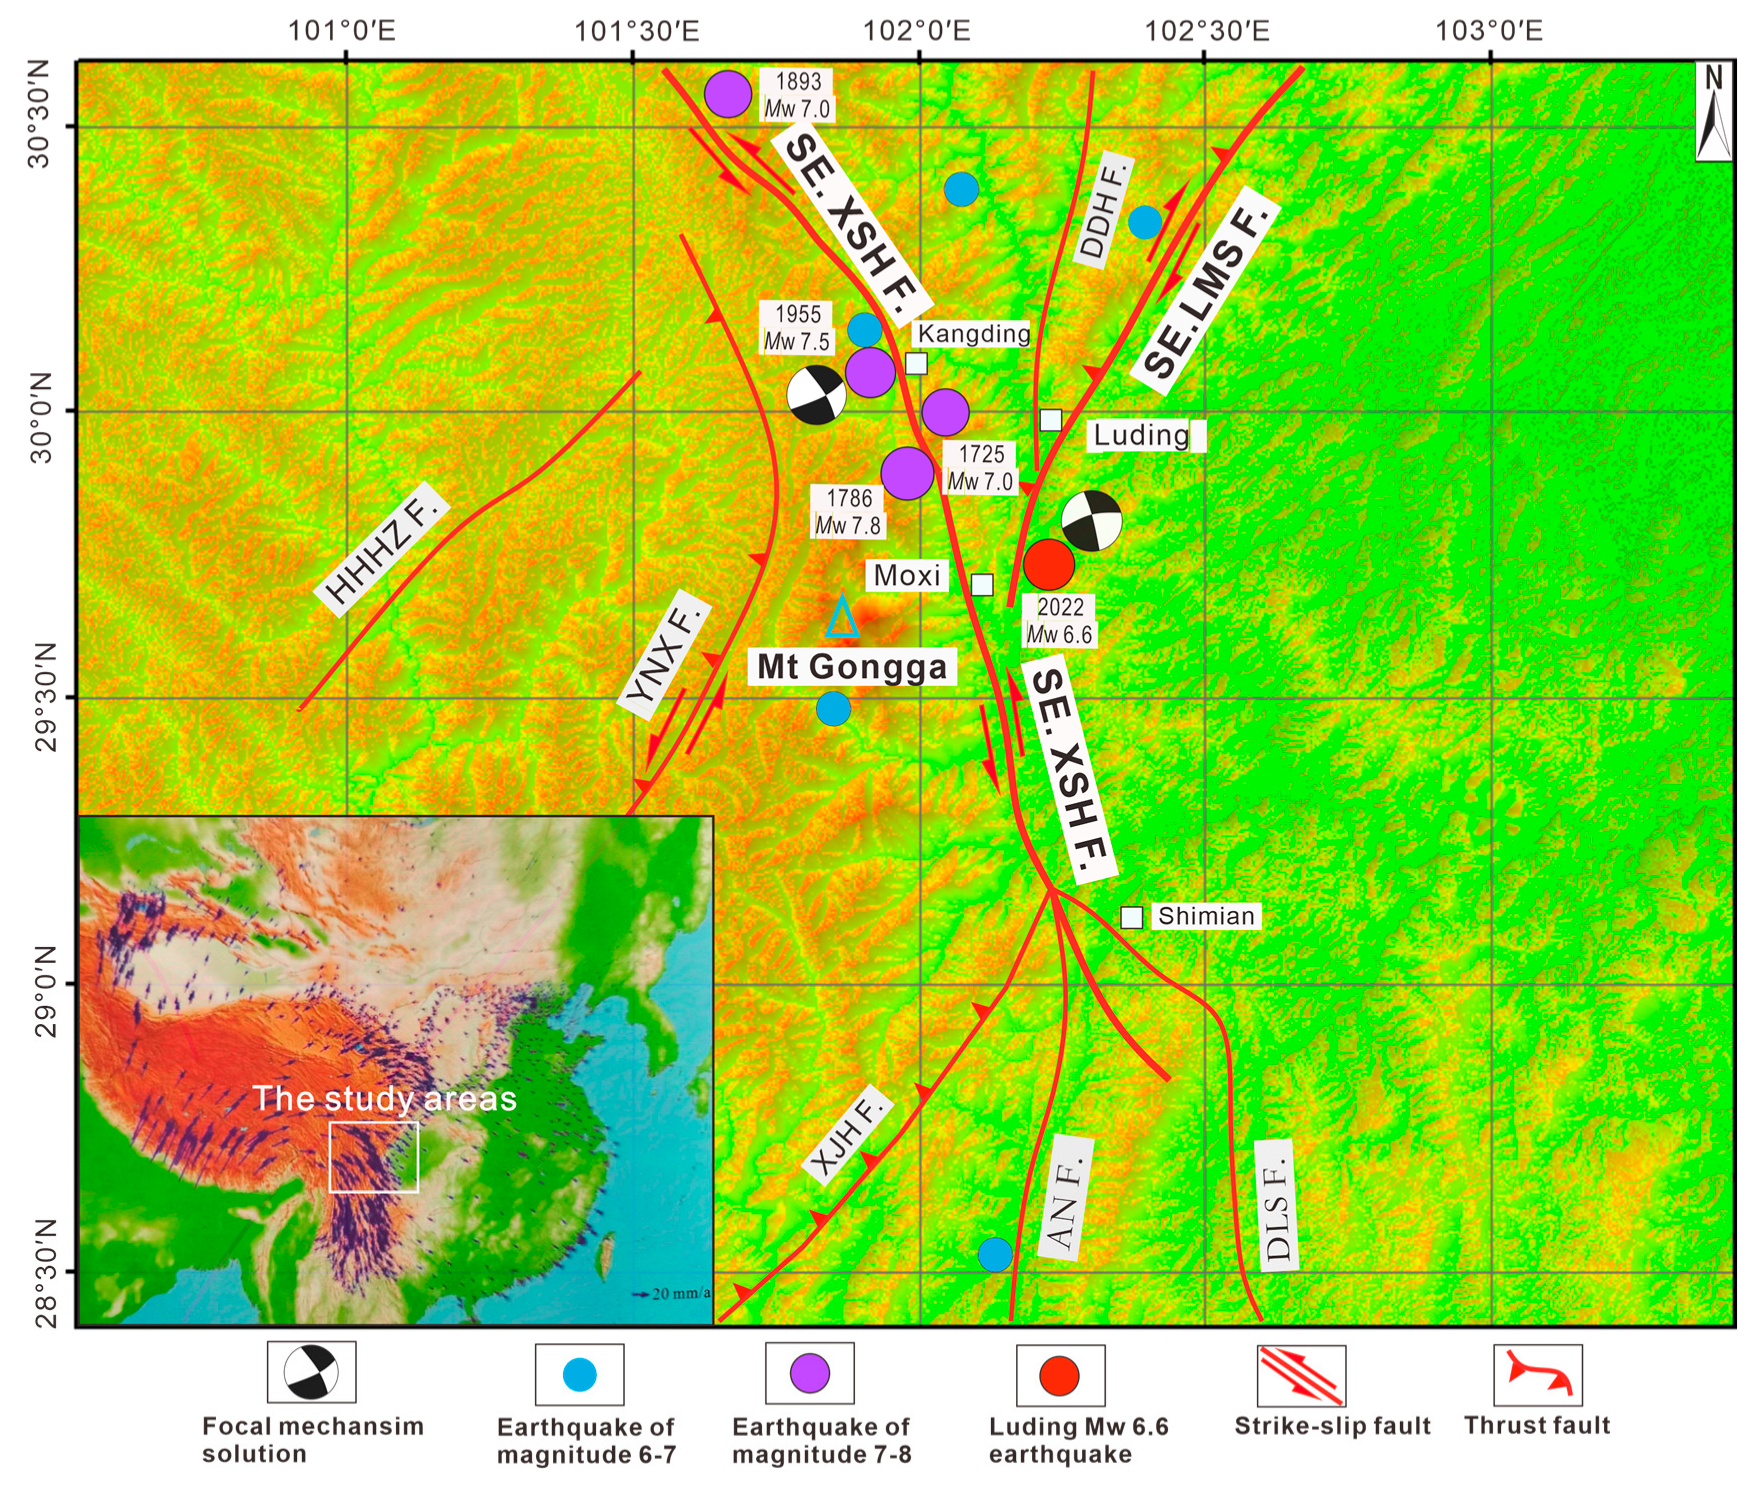
2.2. Seismic Tectonic

The southeastern segment of the Xianshuihe Fault (SE.XSHF), the southwestern segment of the Longmenshan Fault (SW.LMSF), and the Anninghe Fault form a typical “Y”-shaped fault structure system along the southeastern edge of the Tibetan Plateau. Notably, the area around Moxi Town in Luding County (on the southeastern segment of the Xianshuihe Fault), which lies at the junction of the “Y” shape, has experienced multiple moderate to strong earthquakes with magnitudes above Mw 6.0 (Figure 4). Historically, this segment has witnessed significant seismic events, including the 1786 Kangding South earthquake (Mw 7.8) and the 1955 Kangding earthquake (Mw 7.5) [4]. The earthquake on 5 September 2022, with a magnitude of M6.6, which occurred at the epicenter near Moxi Town on the southeastern segment of the Xianshuihe Fault, is the latest manifestation of large seismic activity in this region.
The tectonic system emphasizes the primary active tectonic features in the region and their genetic connections, facilitating a comprehensive and rational analysis of the fundamental pattern and kinematics of regional active tectonics, as well as aiding in the assessment of crustal deformation issues [35]. Since the Quaternary period in the eastern margin of the Tibetan Plateau and the Sichuan–Yunnan region, the crustal activity during the new tectonic phase has been primarily characterized by horizontal motion with minor vertical movements. The region is characterized by numerous fault zones with significant variations in scale and activity intensity (the Yunongxi fault, Daduhe fault, Hehehaizi fault, and Daliangshan fault exhibit relatively weaker scale and activity intensity, while the Xiaojinhe fault and Anninghe fault exhibit moderate scale and activity intensity). Among them, the southeastern segment of the Xianshuihe fault and the southwestern segment of the Longmenshan fault constitute the main controlling tectonic zone in the region. These faults have fragmented the crust into multiple independent blocks (Figure 4) and govern the overall crustal activity pattern in the area [36]. The southwestern segment of the Longmenshan fault is a large fault zone comprising a series of imbricate reverse faults. It trends N30–40° with a northwestward dip, inclined at an angle of 50–80°. It exhibits clear characteristics of reverse faulting and dextral strike-slip motion. The southeastern segment of the Xianshuihe fault is a major sinistral strike-slip fault zone. This fault trends N150–160° with a northeastward dip, inclined at an angle of 75–85°, and exhibits strong ductile shear strain characteristics [31,37]. The Yunongxi fault is a primarily strike-slip with minor thrusting fault, trending approximately N200° with a northwestward dip [32]. Furthermore, the southwestern segment of the Longmenshan fault is also part of the modern crustal movement along the eastern margin of the Tibetan Plateau, rotating clockwise around the eastern Himalayan structural knot. It forms a composite tectonic zone together with the southeastern segment of the Xianshuihe fault, constituting a typical “Y”-shaped active tectonic system.
In order to ascertain the geometric structural features of the seismic source associated with the Luding earthquake, which occurred in Sichuan Province, China, the Sichuan Earthquake Administration utilized high signal-to-noise ratio complete waveforms recorded by the regional broadband fixed stations of the seismic network. The complex faulting analysis procedure (CAP) was employed to calculate the seismic source mechanisms for the mainshock of magnitude Mw 6.6 on 5 September 2022, as well as its aftershocks with magnitudes greater than Mw 3.0. Additionally, Table 1 presents the seismic source mechanism solutions for the Luding Mw 6.6 mainshock derived through far-field waveform inversion by the United States Geological Survey (USGS) and the German Research Centre for Geosciences (GFZ) (Table 1). The corresponding results of the seismic source mechanism inversion released by the Institute of Geophysics, China Earthquake Administration (IGP) can be found at https://www.cea-igp.ac.cn/kydt/279807.html (accessed on 10 May 2023) (Institute of Geophysics, China Earthquake Administration). Based on the geometric parameters of the causative fault obtained by USGS, IGP, and GFZ, as well as the spatial distribution of aftershocks and seismic source mechanism solutions, we infer that the southern segment of the Xianshuihe fault exhibits a nearly vertical fault plane with a slight dominant NE dip.
Figure 4. Fault structures and stress environment in the seismic zone (inset in the bottom left corner adapted from Zhang [38]).
Remotesensing 17 02286 g004

3. Method and Date

3.1. Methodology

Based on the seismic parameters of the study area (the tectonic characteristics revealed by the source mechanism analysis of the Luding earthquake and its aftershocks, as shown in Figure 4 and Table 1), along with the stress field and dynamic environment, and incorporating GNSS observation data (regional motion vectors, derived from the China Earthquake Administration’s observations before and after the earthquake), we constrained the model boundary conditions and calibrated the simulation process. We inverted the seismic fault movement characteristics during the main rupture using the finite element interface technique and analyzed the displacement variations in the Mt. Gongga area pre- and post-earthquake. The following steps were taken:
The first step was the construction of the geological model. In this study, the geological model of the research area (Figure 5a) considered the following aspects: (1) Regarding the lateral forces at the boundaries, the southeastward extrusion of the eastern Tibetan Plateau on the Sichuan–Yunnan Block was taken into account. A southeastward lateral force was applied to the left boundary of the model, and a southward lateral force was applied to the northwest corner of the upper boundary. (2) Regarding the rotational effect, considering the channeling mechanism in the lower crust, as weak and hot material flows eastward within the Tibetan Plateau, it encounters resistance from the Sichuan Basin. This process generates two main channels in the northeastern and southeastern margins of the plateau. One channel flows southeastward along the Xianshuihe fault, while the other channel flows northeastward along the Longmenshan fault. Therefore, a counterclockwise couple force was applied to the bottom of the Sichuan–Yunnan Block model, and a clockwise couple force was applied to the bottom of the Sichuan–Qinghai Block model [39]. (3) Regarding the physical properties and structural characteristics of the lithosphere, factors such as boundary conditions and physical properties, as well as the tectonic features of the fault, were considered [40].
Furthermore, the utilization of simulation techniques is employed. In this study, the seismic motion characteristics of the main fault during an earthquake were numerically simulated using the Interface technology in the FLAC3D software (Version 6.0). FLAC3D is an internationally recognized numerical analysis software widely used in the field of geotechnical engineering. The Interface element, as a contact surface unit, is a thin element with a Coulomb shear constitutive model. It is capable of analyzing the sliding displacement on the contact surfaces under certain loading conditions and simulating the contact deformation of blocks (Figure 5b) [41].
Lastly, the formulation of the numerical model and boundary conditions is addressed. Building upon the previous research findings and considering the regional tectonics, stress field characteristics, and geological background of the dynamic mechanism, a true three-dimensional model was established using iterative exploration, adjustment, fitting, and analysis during the simulation process [42]. Regarding the boundary constraints and stress application, the southeastern direction was applied as a lateral force on the left boundary of the study area, and a southward force was applied to the northwest corner of the upper boundary. A counterclockwise rotation was imposed on the bottom of the Sichuan–Yunnan block, while a clockwise rotation was applied to the bottom of the Sichuan–Qinghai block, with the Yangtze block being constrained and fixed (Figure 6). The model thickness was set as constrained and fixed (Figure 6). The model thickness was set to 17 km based on the tectonic features and seismic focal depths. During the inversion process, the corresponding physical parameters were assigned based on the intrinsic characteristics of the regional blocks. The model consisted of approximately 140,000 calculation units and employed a true three-dimensional representation. Due to the computational complexity and analysis challenges, the secondary tectonic zones of the region were omitted, and the focus was placed on the main controlling tectonic zones, namely the southwestern segment of the Longmenshan fault (SW.LMSF) and the southeastern segment of the Xianshuihe fault (SE.XSHF). The strike of the main fault was determined based on regional tectonics (Figure 1 and Figure 4), while the dip angle was determined using previous research findings and field investigation data in the area. Due to limitations in the simulation inversion technique, simplifications were made in the representation of the fault zones in the three-dimensional computational model. The dip angle of the southwestern segment of the Longmenshan fault was set to 75° with a strike direction of NW, and the fault zone was simulated using solid units with specified width, thickness, and dip angle to model the tectonic activity. The southeastern segment of the Xianshuihe fault was assigned a dip angle of 81° with a strike direction of NE, and the fault zone was simulated using the Interface technology to model the sliding displacement of different blocks along the main fault plane during the earthquake. Through this inversion analysis, the displacement and deformation of the Mt. Gongga region pre- and post-earthquake, as well as the motion of the fault during the seismic event, were inferred.

3.2. Satellite Observation Data (GNSS)

Prior to the Luding Mw 6.6 earthquake, the China Earthquake Administration conducted monitoring and analysis, revealing significant interseismic displacement variations between GNSS stations on either side of the Xianshuihe fault (China Earthquake Administration, 2022, Pre-earthquake Deformation Field of the Luding Earthquake) in conjunction with the research findings of Li [43]. Monitoring of the pre-earthquake deformation field data can be found (Figure 7a). Prior to the earthquake, the regional displacement and deformation field generally showed that the southwestern Sichuan–Yunnan block (with displacement and deformation ranging from 10 to 15 mm/yr) had greater southeastward displacement compared to the stable Yangtze block to the east (with displacement and deformation around 5 mm/yr) and the Sichuan–Qinghai block to the north (with displacement and deformation ranging from 5 to 10 mm/yr). The epicenter of the Luding Mw 6.6 earthquake occurred at the boundary where a sudden change in displacement was observed.
Following the Luding Mw 6.6 earthquake, the China Earthquake Administration collected observation data data from continuous GNSS stations within the epicentral region (China Earthquake Administration, 2022, Post-earthquake Deformation Field of the Luding Earthquake) in conjunction with the research findings of Guo [44]. Post-earthquake deformation field monitoring and analysis show that to the left of the southeastern segment of the Xianshuihe Fault (Figure 7b), stations near Kangding (SYB1, LS22) in the northern part of the Sichuan–Yunnan block exhibit southeastward vector displacement. To the south of the Sichuan–Yunnan block, stations on the left side of Asbestos (SCJL, LS23, SYD9) show south-southwestward vector displacement. On the right side of the southeastern segment of the Xianshuihe Fault, stations located above Luding in the Sichuan-Qinghai block, such as LS10 and SCTQ near Ya’an, exhibit northeastward vector displacement. At Anshunchang station (SYD5) in Asbestos County, located 50 km southeast of the epicenter, the maximum displacement is 23 mm/yr in the northwest direction. Further south, the station in Asbestos (SCSM) shows a northwest-westward vector displacement of 20 mm/yr, while other vector displacements further from the epicenter are relatively smaller.
Figure 7. (a) Pre-earthquake measured displacement vector field. (b) Post-earthquake measured displacement vector field. (c) Pre-earthquake inversion displacement vector field. (d) Post-earthquake inversion displacement vector field. (e) Co-seismic displacements measured by GNSS. Black vectors represent the co-seismic offset (cited from Liu [45]); the blue and green points represent the locations of aftershock events).
Remotesensing 17 02286 g007

3.3. The Fitting Data Used in the Study

Based on the geological and numerical models, as well as the set parameters and boundary conditions mentioned earlier, this study utilizes the following data to constrain and calibrate the process of numerical inversion. The purpose is to validate the rationality and feasibility of the inversion simulation. Specifically, we incorporate the research findings on co-seismic deformation field obtained by the China Earthquake Administration regarding the pre-earthquake and post-earthquake GNSS deformation field of the Luding Mw 6.6 earthquake in 2022. Additionally, we utilize the GNSS observational data during the pre-earthquake and co-seismic stages of the Luding Mw 6.6 earthquake from Liu [45] and Wang [39] to further constrain and refine the numerical inversion. Moreover, we compare the results of the deformation field in the study area with the co-seismic vertical deformation field of the Luding Mw 6.6 earthquake obtained by Han [46] using Sentinel-1 (satellite radar imagery) and InSAR technology. Furthermore, we integrate the latest achievements by Zhang [47] and the seismic waveform data from the China Earthquake Administration (available at https://www.cea.gov.cn/cea/dzpd/dzzt/5683568/5683917/5684035/index.html (accessed on 22 September 2023)) regarding the shear displacement characteristics of the Xianshuihe fault surface. These achievements are used to fit the fault surface shear displacement during the seismic event simulated in this study. Through comparing the fitting results with the aforementioned data, the numerical inversion results of this study exhibit a high level of concordance. For a detailed account of the specific simulation fitting and comparison procedures, please refer to the results and analysis section in Section 4.

4. Results and Analysis

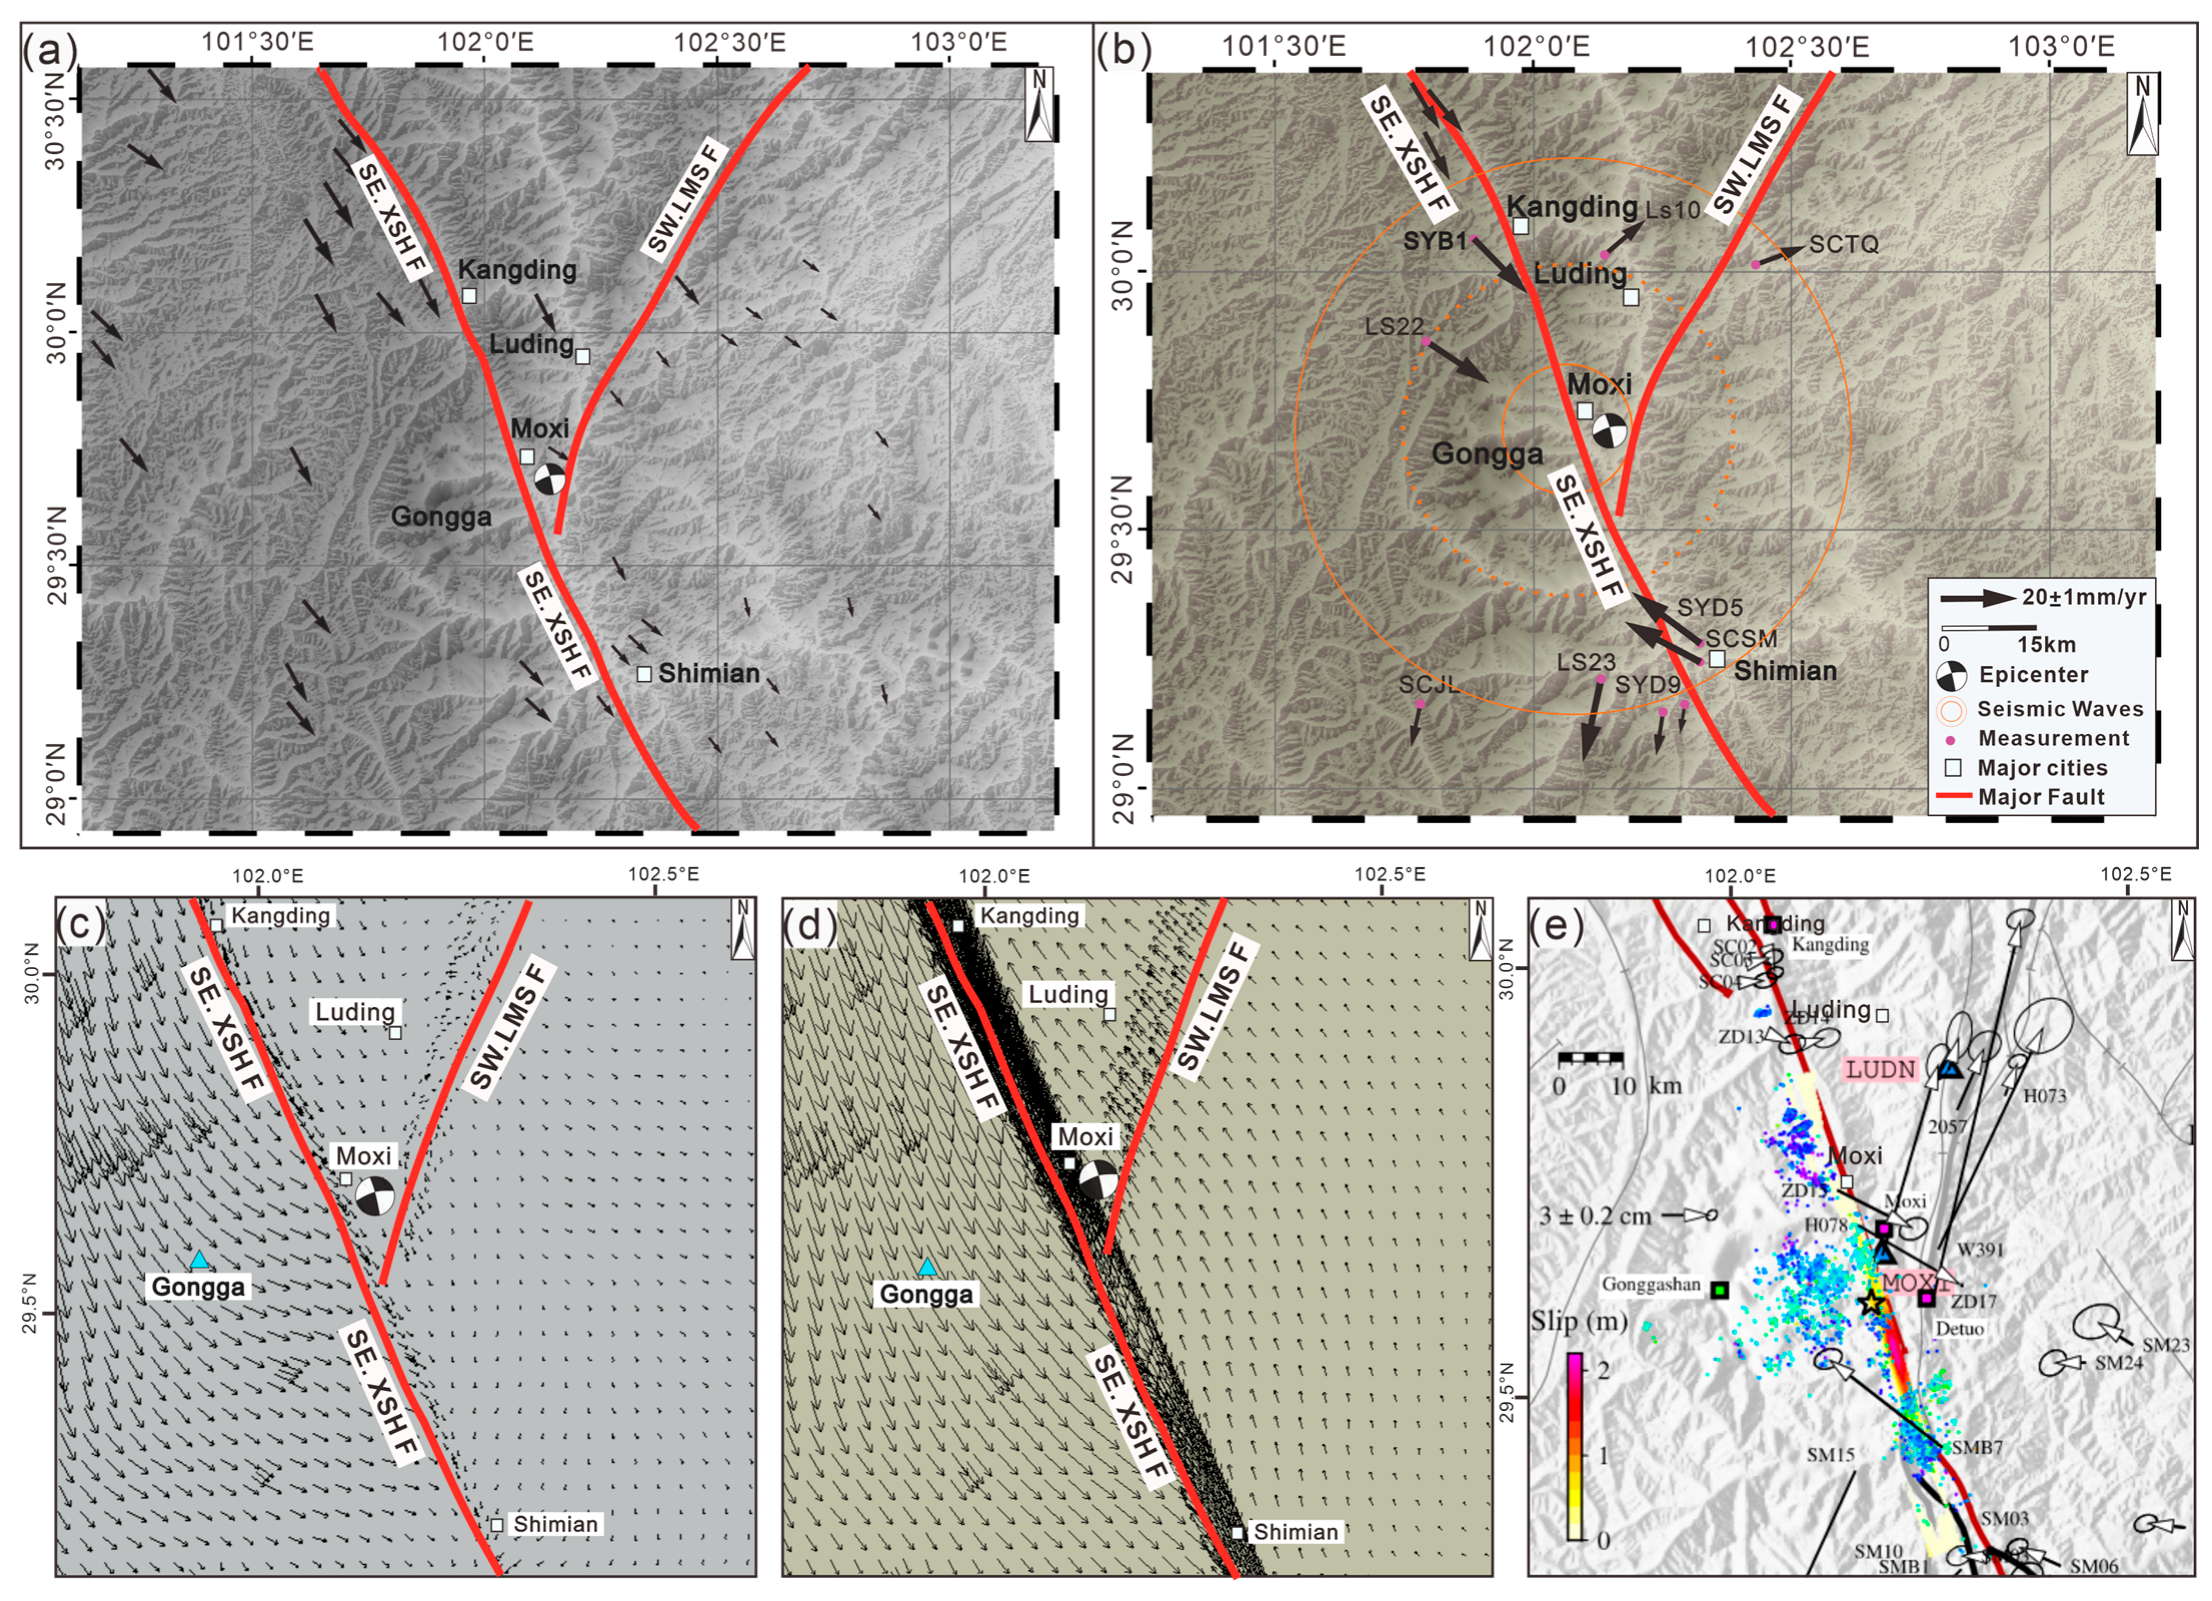
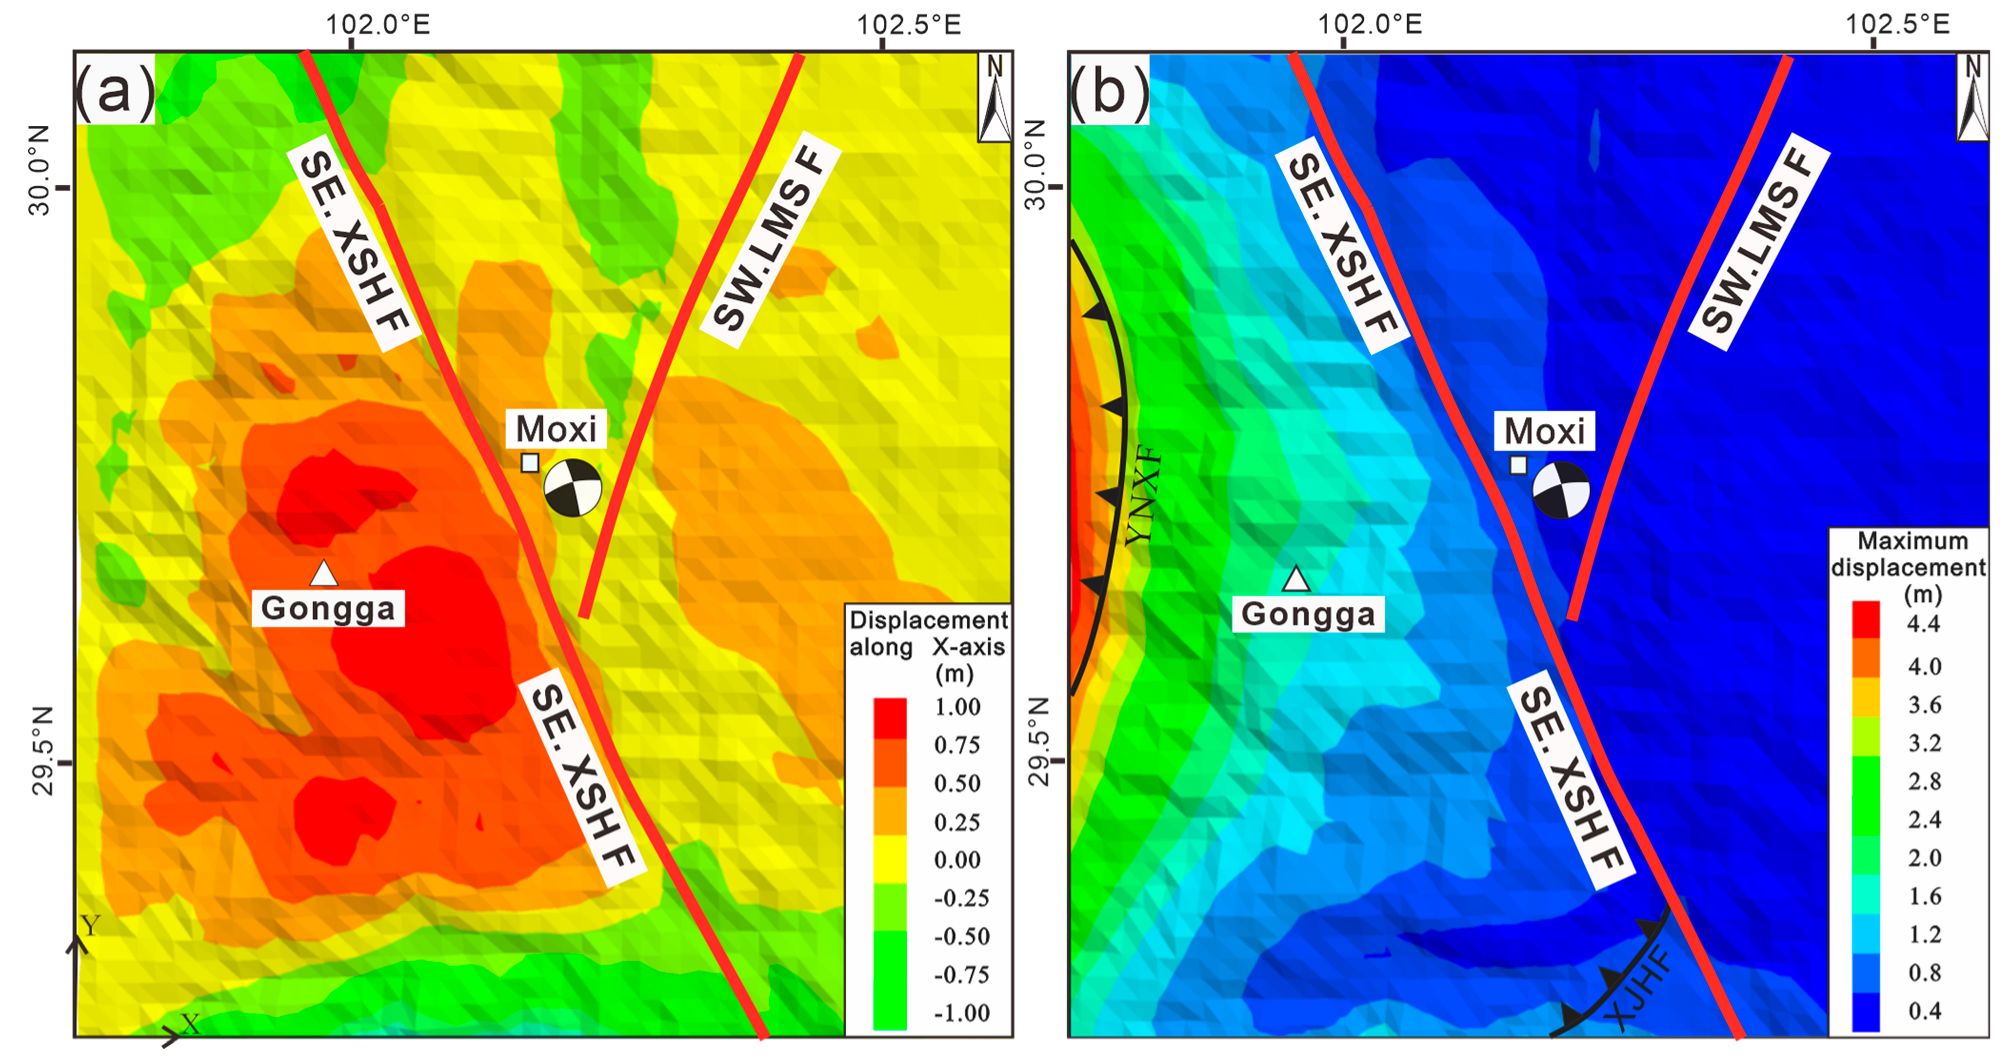
4.1. Characteristics of Pre- and Post-Earthquake Horizontal Displacement Vectors in the Mt. Gongga Region

The pre-earthquake inversion displacement vector field in the Luding Mw 6.6 earthquake study area (Figure 7c) was numerically reconstructed. A comparative analysis between the inverted displacement vector field and the measured displacement vector field by the China Earthquake Administration (Figure 7a) reveals the following: (1) Both the inverted and measured displacement vector fields indicate regional and segmented characteristics in the pre-earthquake displacement, with the displacement magnitudes being higher in the Sichuan–Yunnan block compared to the Sichuan–Qinghai block, and higher in the Sichuan–Qinghai block compared to the Yangtze block. The northern portion of the Sichuan–Yunnan block exhibits the maximum displacement, particularly in the northwestern area of the Mt. Gongga. (2) Both the inverted and measured displacement vector fields demonstrate that the vector direction of the Sichuan–Yunnan block changes from SSE to SE when moving from north to south, while the displacement direction in the Mt. Gongga region shows a range between N135° and 150°. The displacement direction of the Sichuan–Qinghai block is inclined to the southeast by 30°, whereas the northeastern side of the Yangtze block exhibits a displacement direction inclined to the southeast by 45°, and the southeastern side of the Yangtze block shows a displacement direction of SSE. (3) Both the inverted and measured displacement vector fields suggest significant displacement differences on both sides of the Xianshuihe Fault, with the dominant movement observed on the left side, indicating a characteristic of left-lateral strike-slip motion. Overall, the comparison between the inverted and measured displacement vector fields in the pre-earthquake phase demonstrates a high degree of agreement, confirming the rationality of the model parameters and boundary conditions set in the numerical simulation.
Additionally, the studies conducted by Liu [45] and Wang [39] on the pre-earthquake and co-seismic GNSS measurements (Figure 7e) in the Luding Mw 6.6 earthquake revealed that the stations near the Mt. Gongga in the Sichuan–Yunnan block (ZD15, H078) experienced a south-southeast displacement during the co-seismic phase, with station H078 recording a significant co-seismic displacement of up to 22 cm. The stations in the Sichuan–Qinghai block (ZD17, W391) showed a co-seismic displacement towards the north-northeast, while the stations in the Yangtze block (SM06, SM12, SM23, SM24) exhibited a distinct co-seismic displacement towards the northwest, albeit with relatively smaller displacement magnitudes. The numerical inversion of the post-earthquake horizontal displacement vector field in the Luding Mw 6.6 earthquake study area (Figure 7d) was conducted in this study. Comparative analysis with the aforementioned studies of displacement vector fields (Figure 7b,e) reveals the following: (1) The measured data from the left side of the Xianshuihe Fault (SYB1, LS22 in Figure 7b) exhibit a high degree of agreement right side of the fault (SYD5, SCSM in Figure 7b), and the measured data show a relatively higher agreement in terms of displacement direction but with somewhat lower simulated magnitudes. (2) The measured data from the stations near the Mt. Gongga in the Sichuan–Yunnan block (ZD15, H078 in Figure 7e) demonstrate a high degree of agreement with the corresponding simulated displacement direction. Considering the uncertainties in seismic events, the complexity of regional tectonics, and the inherent differences between the constructed models and actual geology, the comparison between the inverted and measured displacement vector fields after the earthquake indicates that, despite slight deviations in absolute displacement magnitudes and in some localized displacement directions, there is a generally good agreement in relative displacement magnitudes and in most areas’ displacement directions.
The horizontal displacement cloud map in the regional plane X-axis (Figure 8a) reveals that the area near the main peak of Mt. Gongga experienced the largest displacement prior to the earthquake. The contour lines of displacement indicate a higher region with a SSE direction deviation, corresponding to the orientation of the southeastern segment of the Xianshuihe fault zone (SE.XSHF). The maximum displacement cloud map in the regional plane shows significant displacement along the western boundary of the study area (Figure 8b). Notably, the contour lines of the Yunongxi fault (YNXF) and the Xiaojinhe fault (XJHF) exhibit an arcuate trend, demonstrating a high degree of consistency with the present arcuate tectonic system of the Sichuan–Yunnan block. The author believes that the observed phenomena can be attributed to two factors. First, the tectonic forces exerted on the Sichuan–Yunnan block primarily originate from the lateral forces at the left boundary and the northwest corner of the upper boundary. Secondly, the rotational motion of the crustal channel flow at the bottom of the Sichuan–Yunnan block contributes to the observed effects. The coupling of these two forces naturally leads to the formation of arcuate structural faults along the boundaries with significant internal displacement in the block. The generation of the arcuate structure of the Xiaojinhe fault (XJHF) within the Sichuan–Yunnan block impedes the SSE motion of the block, resulting in a right-lateral uplift of Mt. Gongga due to compression and reverse thrust along the north-south direction.

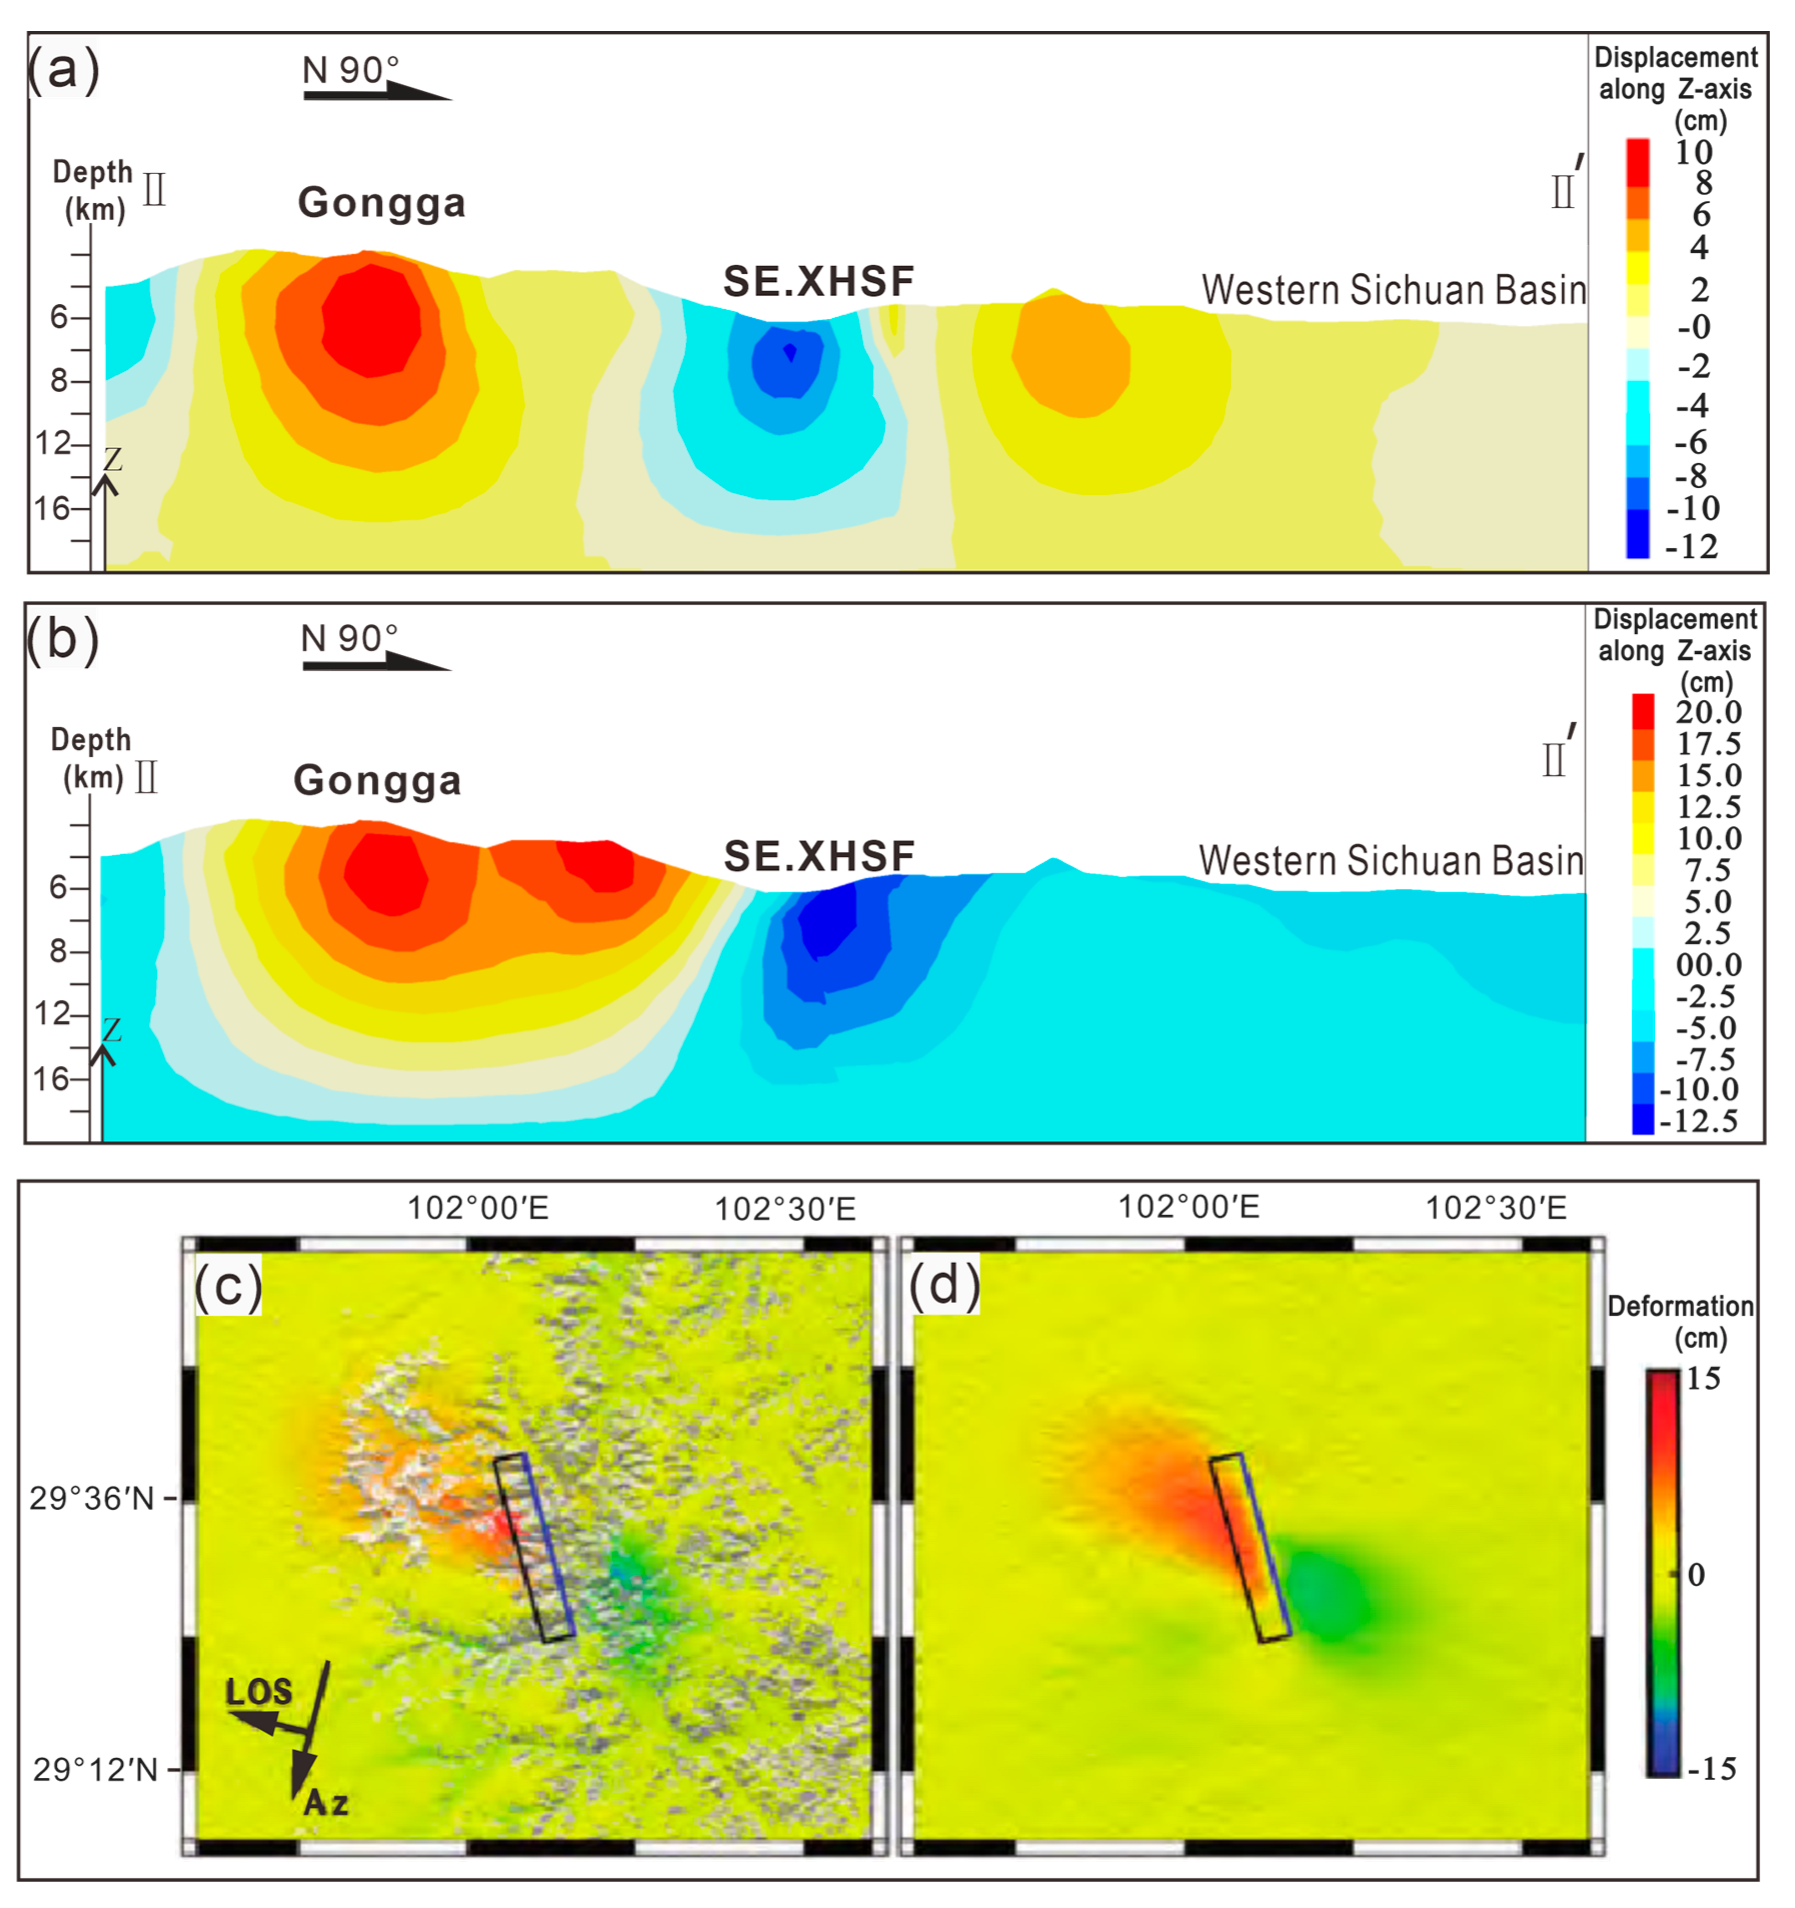
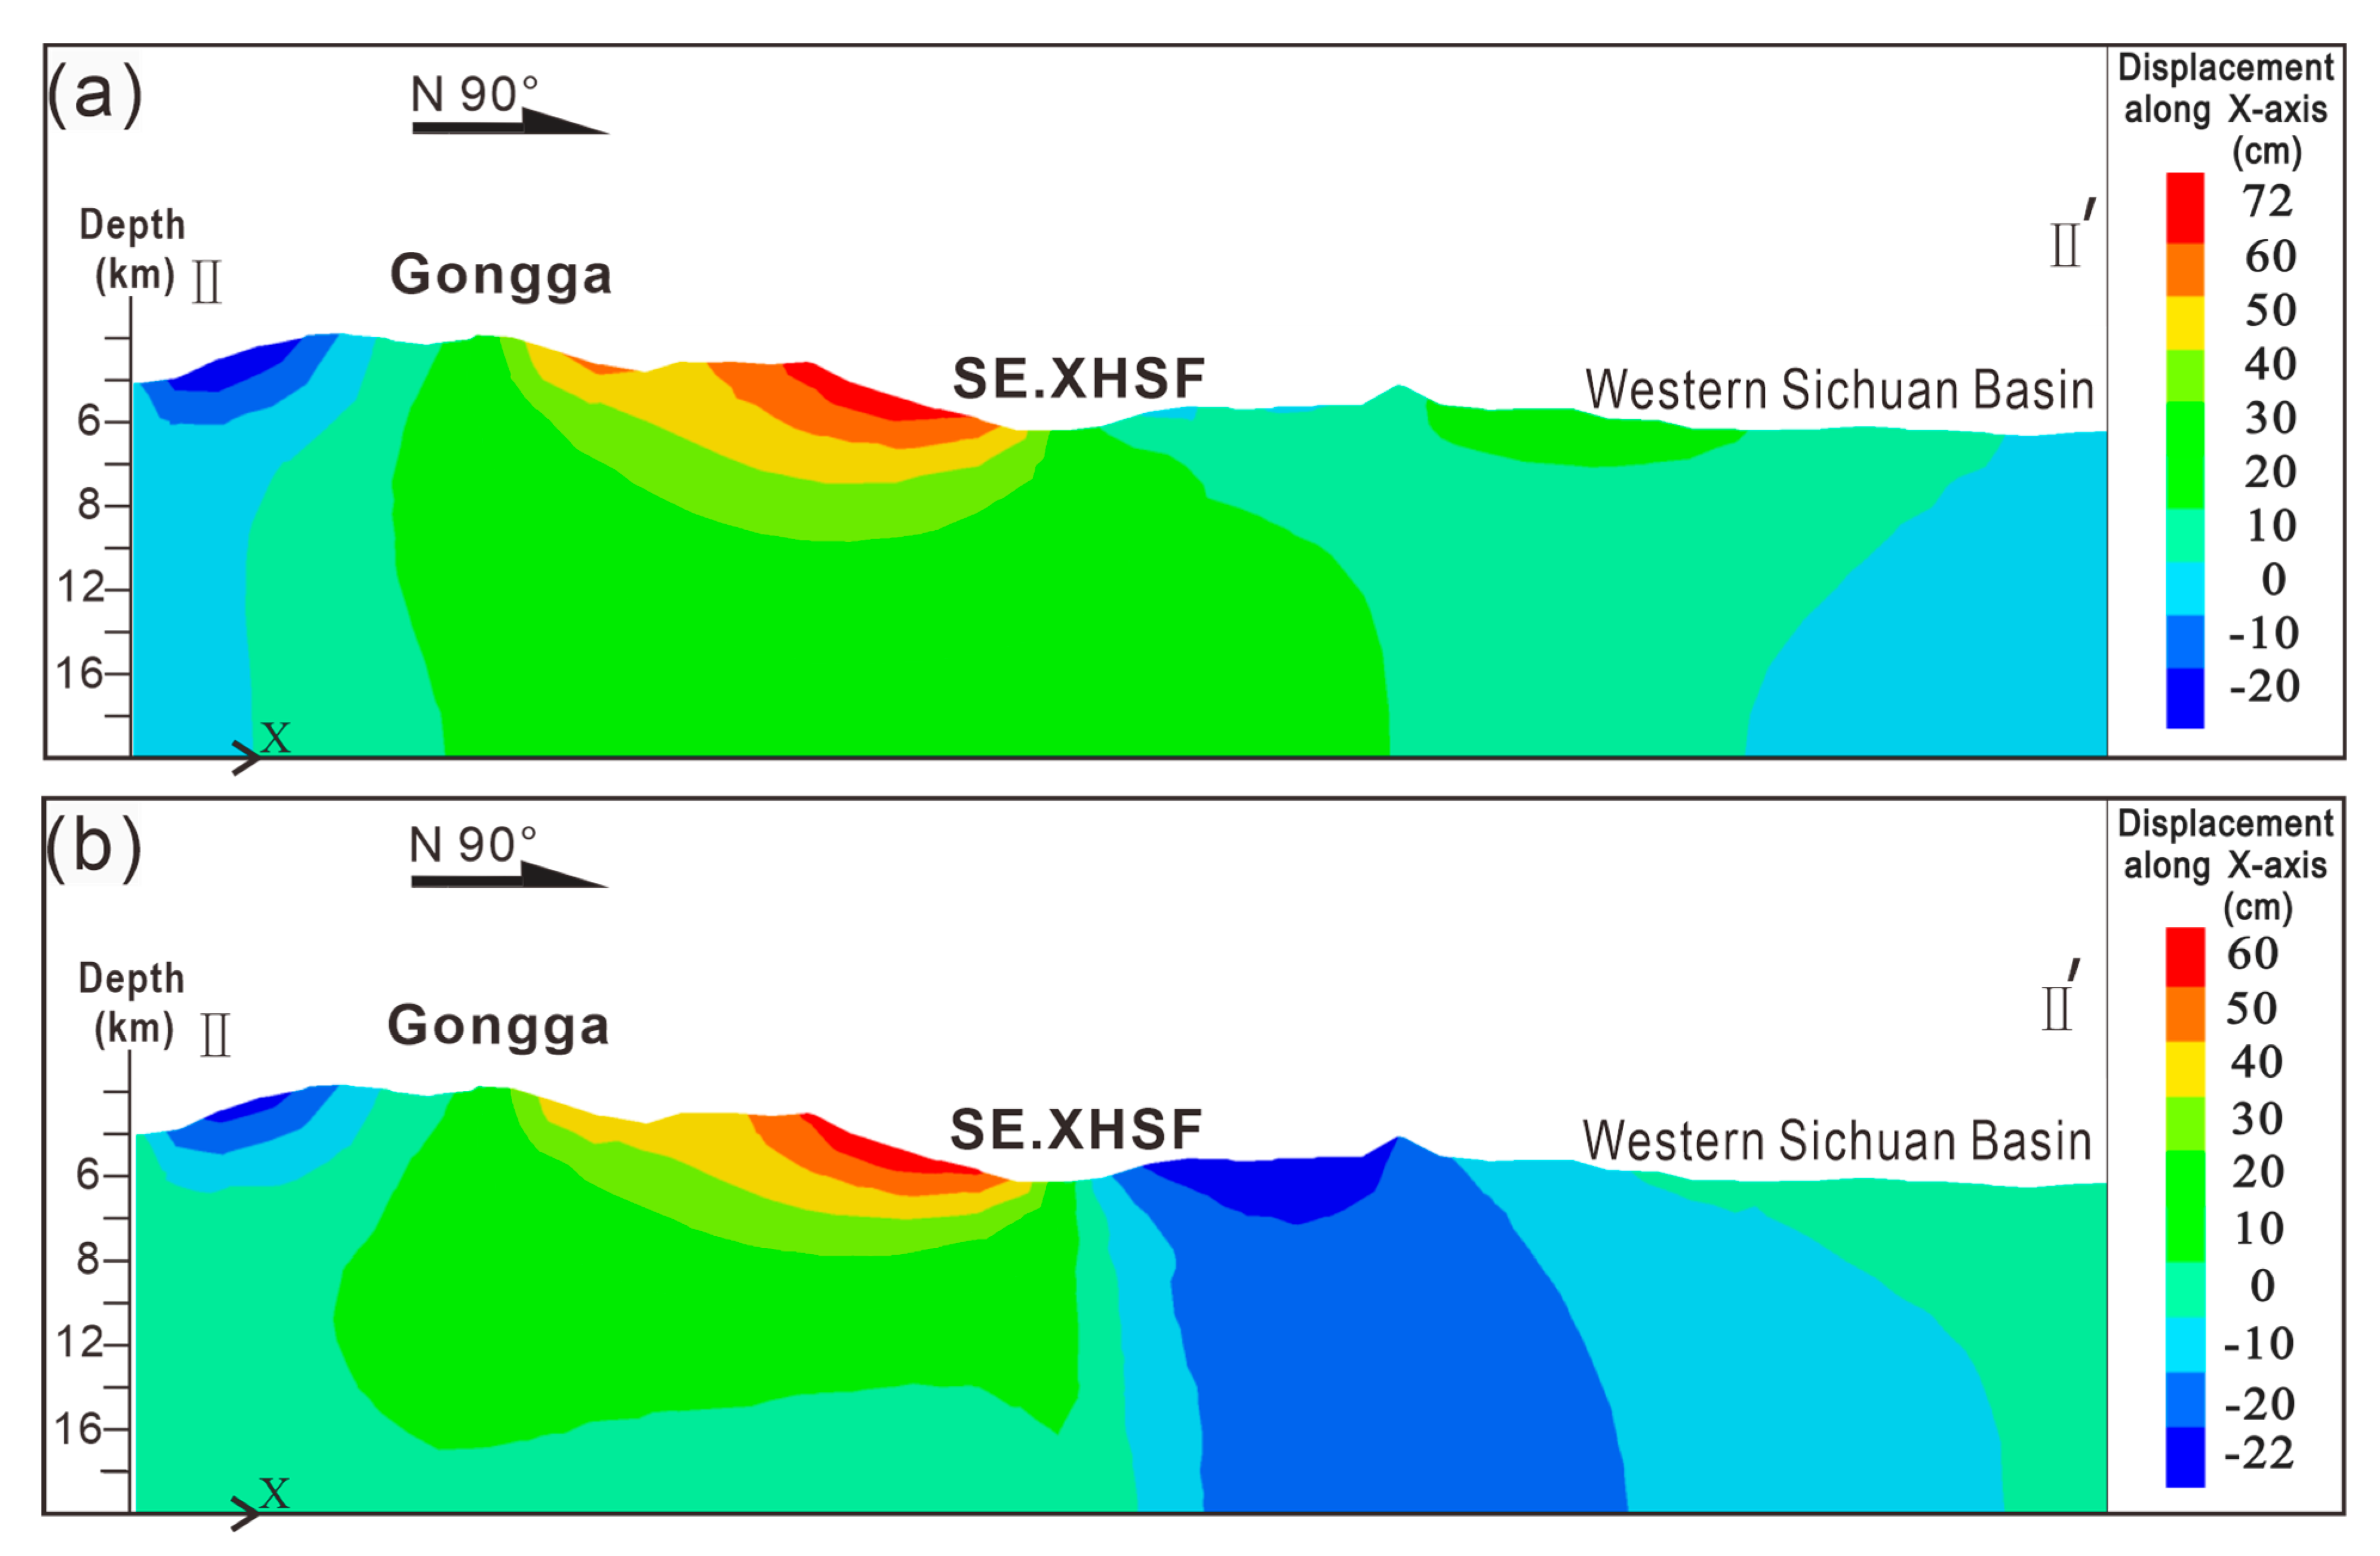
4.2. Pre-Earthquake and Post-Earthquake Uplift the Mt. Gongga Profile and Fault Movement During the Mainshock

The simulation results of the Z-axis displacement along the Mt. Gongga II-II’ profile prior to the earthquake (Figure 9a) indicate significant “convex” deformation in the vertical direction due to the compressional forces exerted on the Sichuan–Yunnan Block. On either side of the fault zone, there is notable “concave” deformation caused by the vertical adjustment of materials. Post-earthquake Z-axis displacement (Figure 9b) reveals the influence of predominantly strike-slip motion along the Xianshuihe fault with a minor thrust component. The western side near the fault experiences less deformation in the vertical direction, while significant vertical motion and deformation occur in the Mt. Gongga area. Furthermore, the deformation zone expands from the mountain top to the foothills, with the maximum uplift reaching 10.5 cm. On the eastern side away from the fault, there is relatively minor vertical deformation, while the maximum subsidence of approximately 10 cm occurs in the eastern region farther from the fault.
The aforementioned simulation results, indicating minor vertical displacement near the southeastern segment of the Xianshuihe fault, align with the characteristics of a fault mechanism with a small thrust component. They correspond to the fault plane solution of the Luding Mw 6.6 mainshock, which exhibits a small sliding angle and predominantly strike-slip motion. Additionally, the simulation results for the deformation in the areas away from the southeastern segment of the Xianshuihe fault are consistent with the co-seismic vertical deformation field obtained by Han [46] using Sentinel-1 (satellite radar imagery) and InSAR technology for the Luding Mw 6.6 earthquake (Figure 9c,d). The study findings reveal that the maximum subsidence occurs approximately 10 cm on the eastern side of the fault, while the area near the mountain top of Mt. Gongga on the western side experiences a maximum uplift of 12 cm. In summary, the Mt. Gongga profile is characterized by a “triangle” structure formed by two main fault zones. Under the compressional forces acting on the Sichuan–Yunnan Block on the western side, the block moves eastward and experiences compression, with the southeastern segment of the Xianshuihe fault impeded by the rigid Yangtze Block near its vicinity, resulting in compressional deformation. Prior to the Luding Mw 6.6 earthquake, there was significant vertical displacement at the top of the Mt. Gongga range, indicating a state of uplift within the mountain. After the earthquake, there was a noticeable increase in vertical displacement at the top of the range, accompanied by deformation spreading toward the eastern foothills of Mt. Gongga. Following the Mw 6.6 earthquake in Luding, this study is based on numerical simulations to elucidate the maximum uplift at the summit of Mt. Gongga, which reached an impressive magnitude of 105 mm. Building upon the findings of Han [46], who utilized Sentinel-1 and InSAR techniques to ascertain a maximum uplift of 120 mm at the summit of Mt. Gongga, Based on the long-term leveling observations conducted by Hao [48], the uplift rate of the main peak was determined to be no less than 5.8 mm/year. Therefore, we posit that the Luding Mw 6.6 earthquake has at least accelerated localized uplift in the Mt. Gongga region.
The pre-earthquake simulation study of the X-axis displacement along the WE-oriented II-II’ profile (Figure 10a) reveals that the Sichuan–Yunnan block is subjected to compressional tectonic squeezing due to the eastward lateral forces. The X-axis displacement gradually decreases from the eastern side of Mt. Gongga to the Sichuan Basin region. Meanwhile, Mt. Gongga exhibits steep topographic features, and the surface deformation of the mountain mass under the influence of gravity is clearly manifested by east-west deformation tendencies. The post-earthquake X-axis displacement (Figure 10b) indicates significant horizontal deformation in the eastern region near the southeastern segment of the Xianshuihe fault (shown as deep blue in Figure 10b), with the maximum deformation displacement in the negative X-axis direction (westward) ranging from approximately 10 to 25 cm. In the region from the eastern side of Mt. Gongga to the western side of the southeastern segment of the Xianshuihe fault, a westward displacement of 5 to 10 cm is observed compared to the pre-earthquake state. These observations align with the horizontal deformation field observed by the China Earthquake Administration using GNSS measurements for the Luding Mw 6.6 earthquake (Figure 7). The analysis of the aforementioned observations indicates two main reasons. First, during the earthquake, instantaneous slip and movement occurred along the main fault zone, and the physically resilient region on the eastern side of the zone led to post-earthquake westward displacement in the eastern region. Second, during the earthquake, the western region of the southeastern segment of the Xianshuihe fault on the relatively weak Sichuan–Yunnan block experienced significant left-lateral strike-slip motion, resulting in the transfer and decomposition of eastward displacement into SSE-oriented strike-slip and vertical deformation.
We have utilized the seismic waveform data of the Luding Mw 6.6 earthquake in China (https://www.cea.gov.cn/cea/dzpd/dzzt/5683568/5683917/5684035/index.html (accessed on 22 September 2023)) in conjunction with the research findings of Zhang [48], allowing us to obtain a comprehensive understanding of the rupture process of this earthquake (Figure 11a). The investigation reveals that the initial rupture occurred at a depth of 13 km beneath the Hailuogou region, and during the seismic event, it propagated bilaterally. Subsequently, the rupture predominantly extended in the SSE direction. The overall length of the rupture amounted to 40 km, closely aligning with the orientation of the southeastern segment of the Xianshuihe fault. The displacement reached 184 cm, with the overall vector direction indicating a predominant N160° strike-slip motion. Numerical simulations conducted in this study portray the co-seismic shear displacement on the fault plane during the earthquake (Figure 11b). It is evident that the greatest displacement occurred in Yanzigou, located to the right of Moxi, exhibiting a left-lateral shear displacement of 2.0 m. This value closely approximates the maximum slip of 1.84 m obtained from the fault plane analysis conducted by the China Earthquake Administration utilizing seismic waveforms (Figure 11a).

5. Discussion

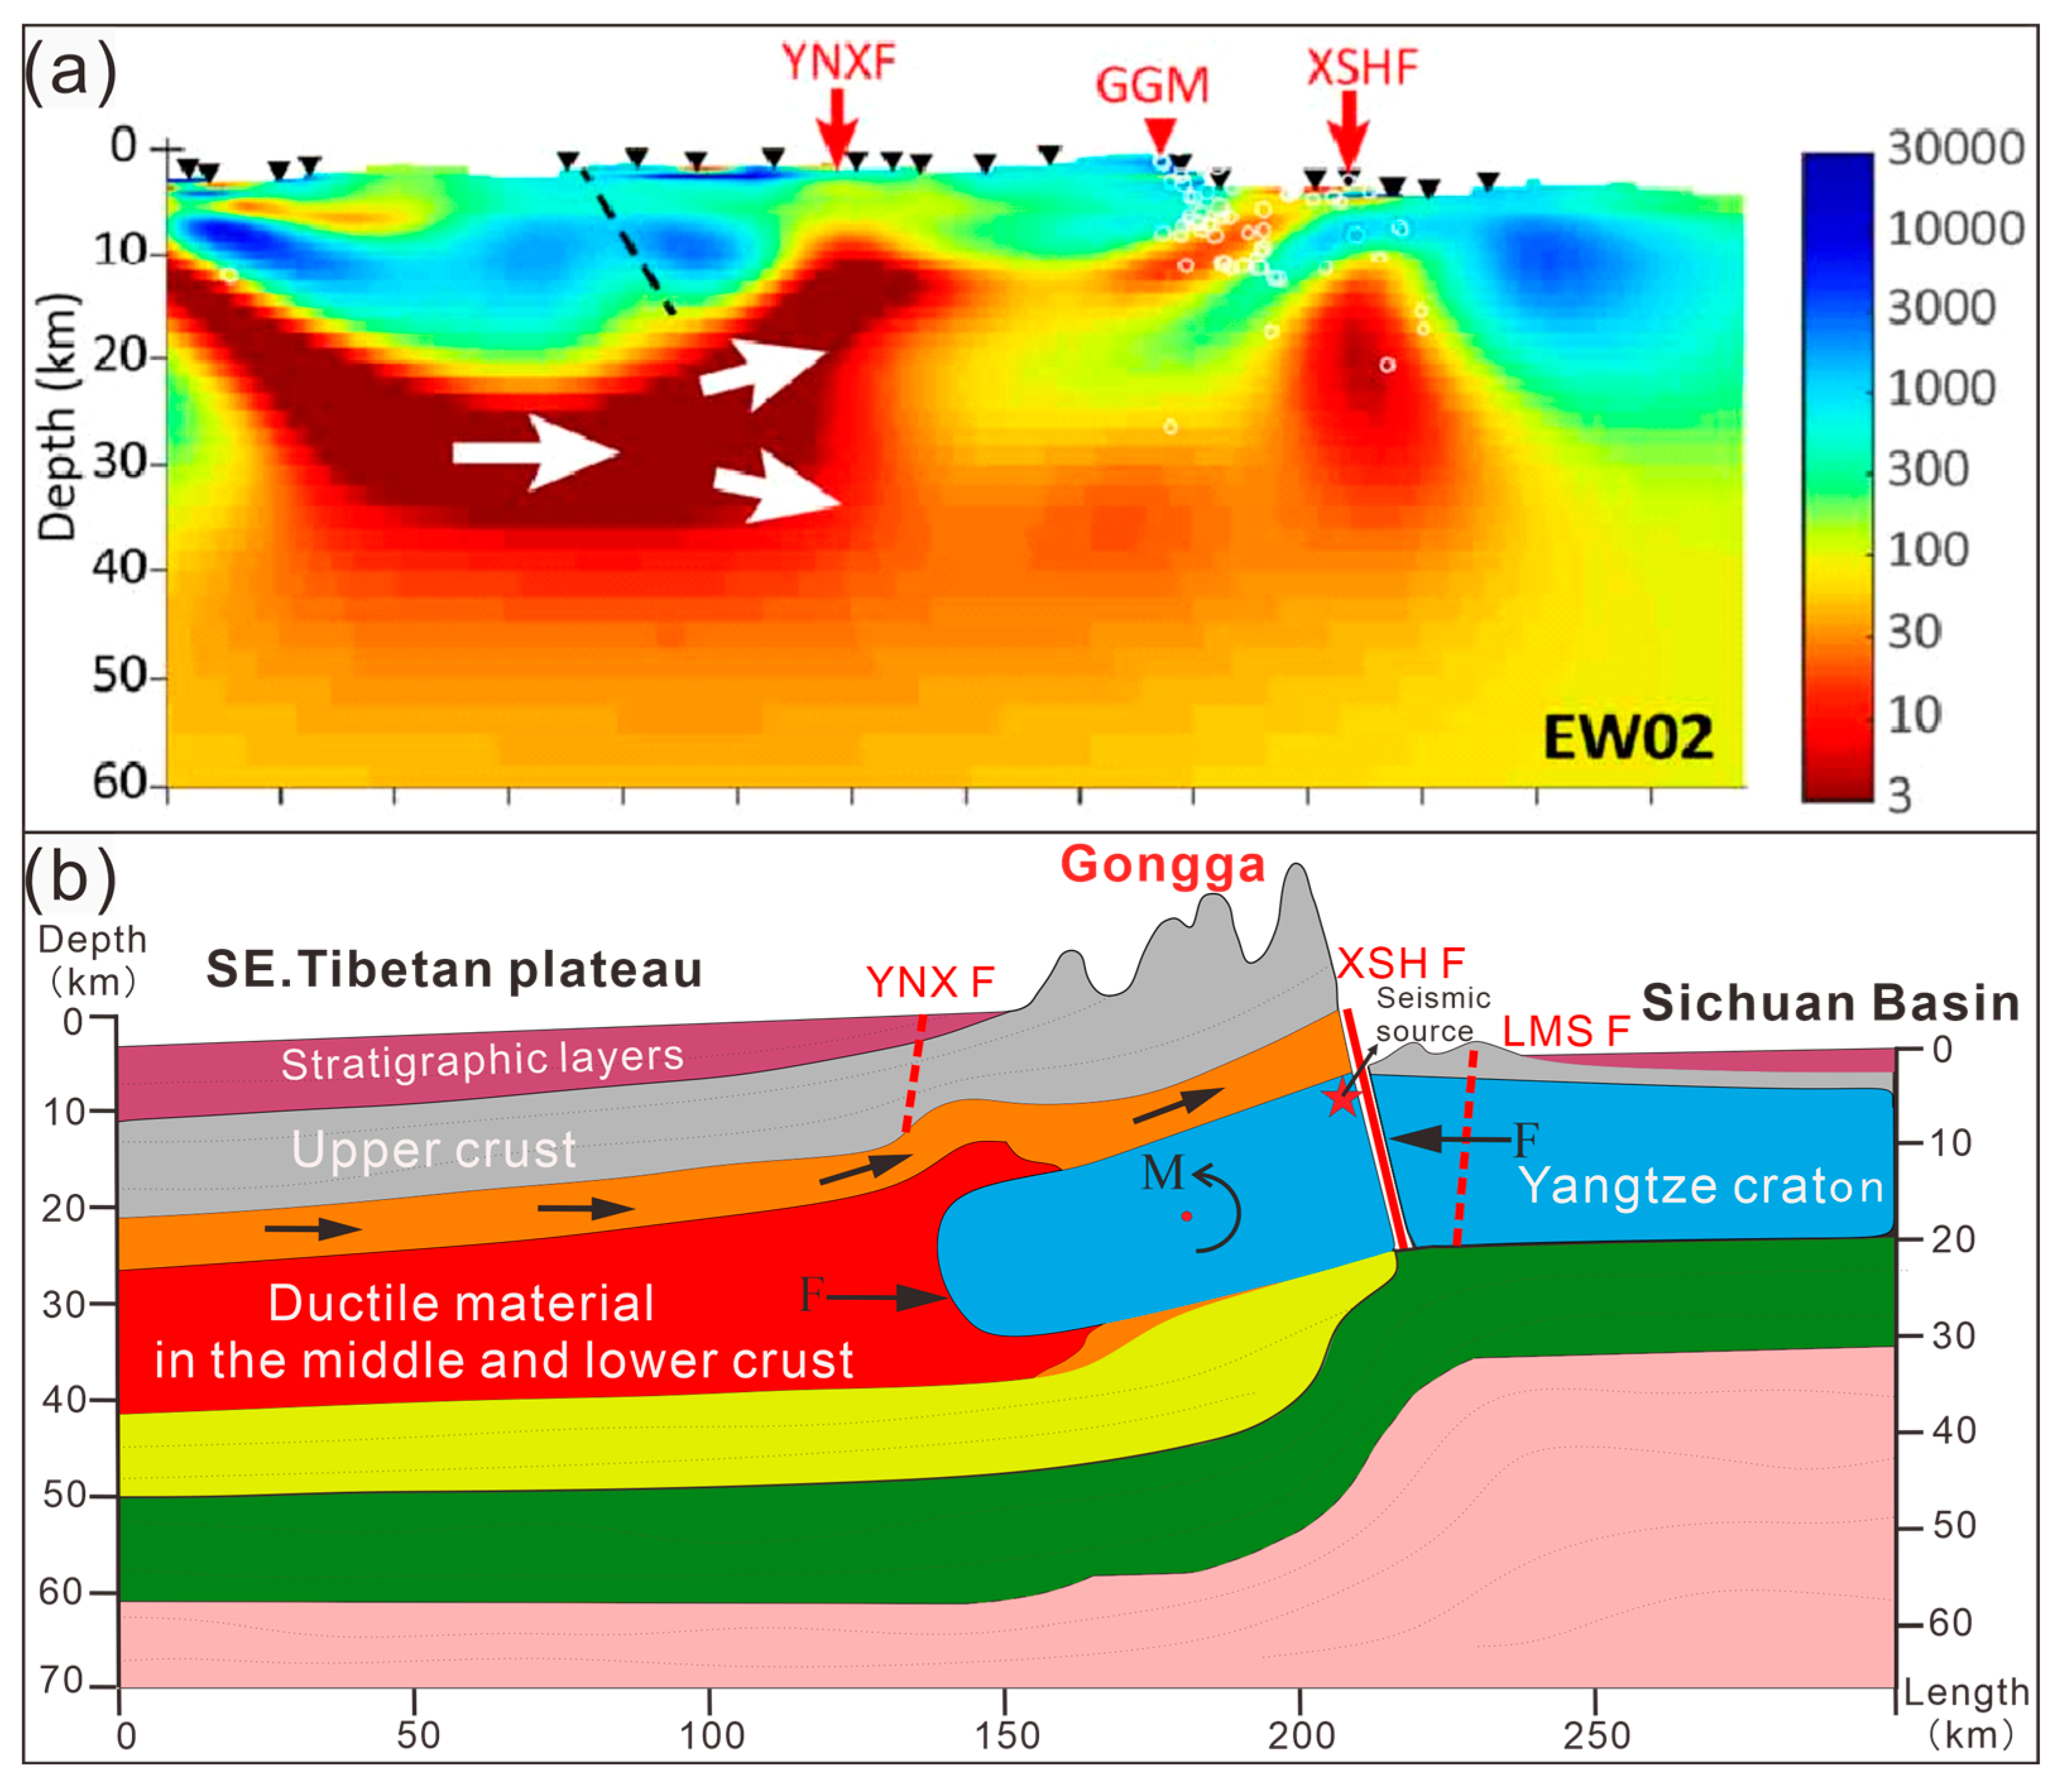
5.1. Discussion on the Deep Uplift Structure of Mt. Gongga

The southwestern region of China is influenced by the northward collision of the Indian Plate, resulting in the formation of the east-west arc-shaped “Himalayan” orogenic belt. This collision induces material transfer toward the east and southeast, driving the sinistral movement of the southeastern segment of the Xianshuihe fault and causing local discontinuities in the block motion, such as “Y” shapes or large bends. These geometric distortions contribute to the uplifted morphology along the eastern margin of the Qinghai–Tibet Plateau. The local region of Mt. Gongga has experienced rapid uplift since the Late Cenozoic, which can be categorized into three distinct mechanisms. First, the “flexural-shear compression” model emphasizes the influence of the transition from strike-slip to compressional tectonic movement. It suggests that the rapid uplift and high elevation of Mt. Gongga are the result of the strike-slip faults undergoing vertical compression from the east-west direction, leading to oblique upward movement and crustal shortening and thickening [49]. This viewpoint aligns with the predominant understanding of mountain formation. However, based on the electrical structure analysis [38] (Figure 12a), field survey data from the cross-sections of Mt. Gongga, and the geological-structural-mechanical analysis conducted in this study [31,34,37], it is inferred that the required shallow and deep “inverted-triangle” structural features necessary for this model are absent in the mountain, thus lacking the supporting negative mountain root capable of sustaining extremely high topography [7,50]. Consequently, this viewpoint faces challenges. Secondly, the exhumation-equilibrium model (tectonic aneurysm model) proposes a coupled uplift mechanism involving tectonics and thermal erosion. It suggests that the high conductivity of the deep crust in the Mt. Gongga region and the exposure of Late Cenozoic high-temperature-induced intense metamorphic rocks contribute to the uplift process. However, this contradicts previous findings indicating that the crust in Mt. Gongga is relatively resistant [28] and that the region mainly consists of Middle Jurassic intense metamorphic rocks based on previous field investigations [32]. Consequently, the uplift mechanism of this model remains contentious when compared to the results of regional field geological surveys. Third, the mid-lower crustal flow model, supported by two-dimensional numerical simulations and geophysical exploration techniques [51,52], argues that the primary controlling factors for the topography and landforms in the eastern margin of the Tibetan Plateau are the abundant plastic flow materials present in the mid-lower crust. The study of the orogenic process of the “basin–mountain–plain” system is not merely a description of the tectonic landforms but rather a quest for their origins, which aids in a profound understanding of the tectonic framework of the eastern margin of the Tibetan Plateau [40]. What is the causal connection between the clockwise rotation and strike-slip tectonic zones on the eastern margin of the Sichuan–Yunnan Block? How does the plateau uplift relate to deep crustal processes? The “triangle” figure structure observed in the cross-section of Mt. Gongga should have been suppressed, so what internal and external factors instead led to its significant uplift? The following discussion will address these questions.

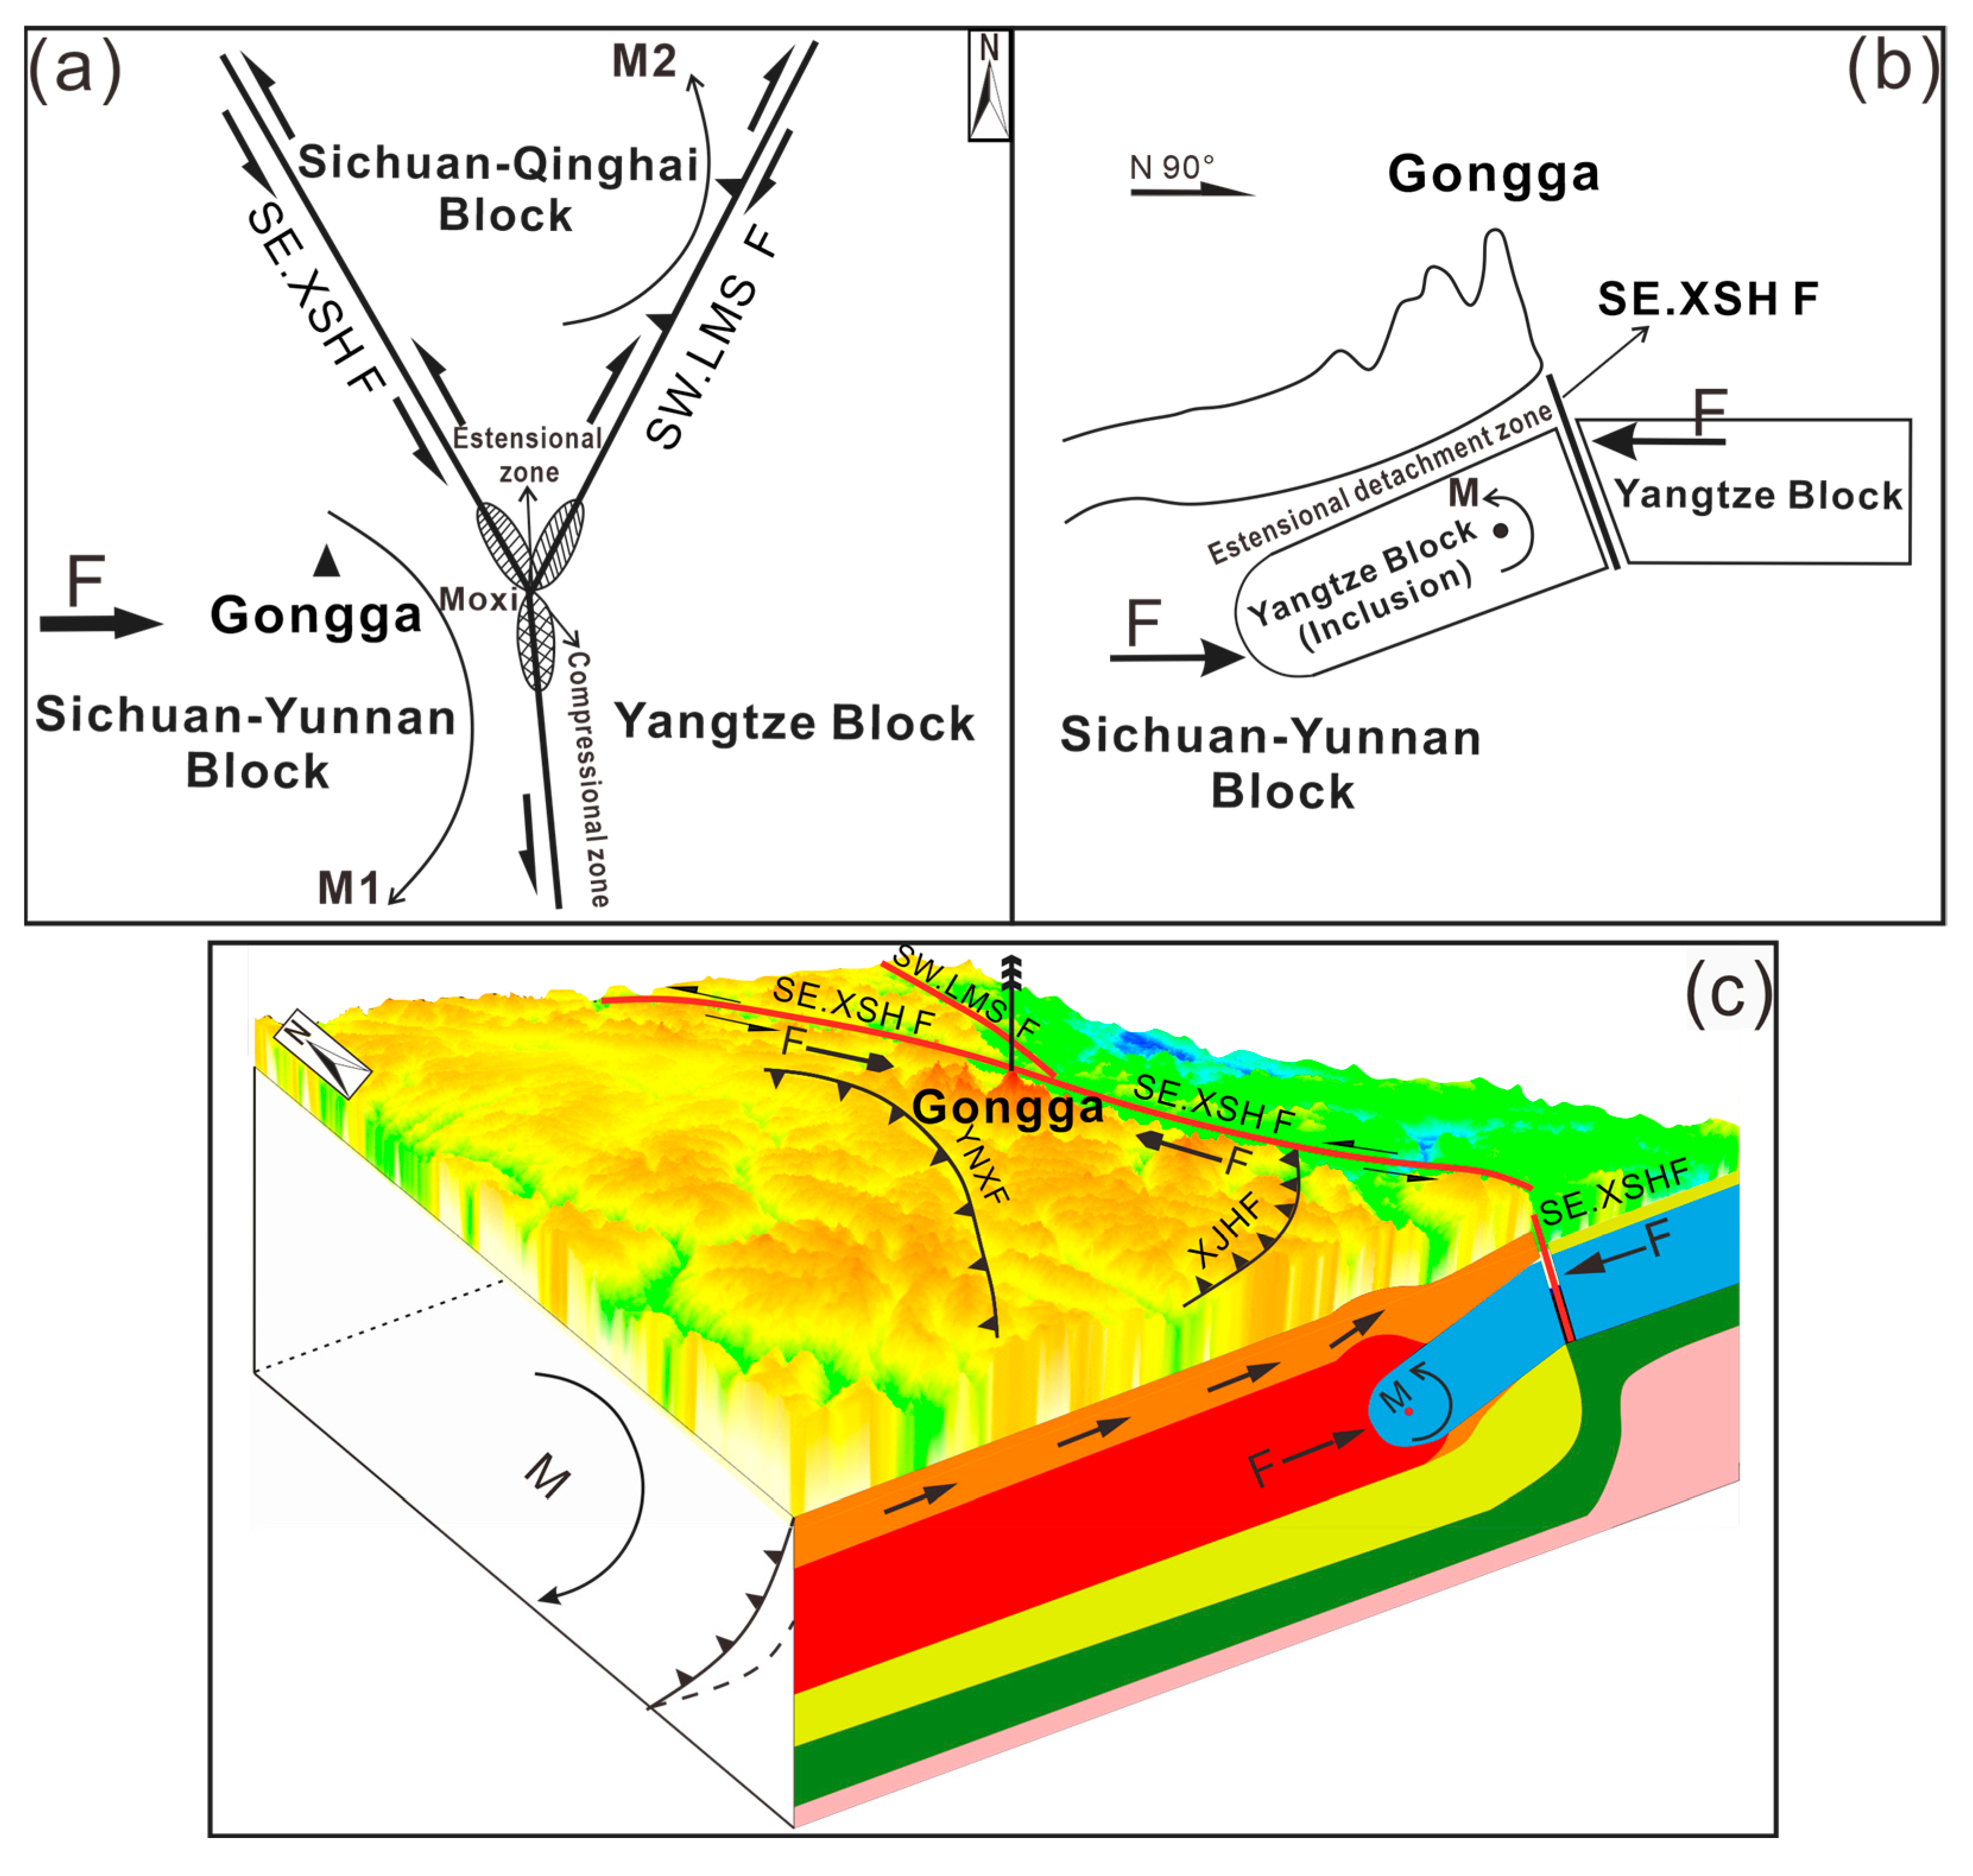
5.2. Analysis of the Uplift Mechanism in Mt. Gongga

From a horizontal analysis perspective (Figure 13a), studies on the activity of the Sichuan–Yunnan Block proposed an east-west “clockwise uplift” mechanism by Tapponnier [5] and Wang [39], which is consistent with Xu’s findings on the alignment of mantle anisotropy directions on the Tibetan Plateau [40], transitioning from EW-NE-SE-NNE-SSW. Based on the numerical simulation results, regional tectonics, and characteristics of crustal movement, the author suggests that significant changes occurred in the Sichuan–Yunnan Block during the sinistral strike-slip movement of the southeastern segment of the Xianshuihe fault, where the fault orientation shifted from SE in the northwestern segment to SSE in the southeastern segment (Figure 8a). During the SSE-directed movement of the Sichuan–Yunnan Block, it encountered strong resistance and exhibited combined sinistral strike-slip and thrusting along the Xiaojinhe Fault (Figure 8b and Figure 13c). The arc-shaped structure of the Xiaojinhe Fault is directly influenced by the regional maximum displacement contour. The resultant movement not only leads to the accumulation and thickening of crustal materials at the bend of the fault zone but also causes the Sichuan–Yunnan Block to undergo clockwise rotation and the right-lateral uplift of Mt. Gongga. This process reflects the transition from strike-slip to compressional mechanisms in tectonic movements, and the shallow anomalous uplift in the study area is a response to the north-south compression and oblique thrust.
From a vertical profile analysis (Figure 12b and Figure 13b), when the Tibetan Plateau experiences surface uplift, the internal deformation and rotation of blocks cannot be ignored [53,54]. The concept of “channel flow” has been proposed by previous researchers to describe the plastic deformation of the Tibetan crust, suggesting that channels represent plastic flow materials that can freely flow within a certain depth and thickness of the crust. Based on previous deep geophysical exploration results, this study suggests the existence of a flowing layer in the lower crust. The rigid Yangtze Block is embedded in the relatively soft eastern edge of the Sichuan–Yunnan Block, and during further collision, the subducting block undergoes sinking, deformation, and fragmentation. As a result, it becomes embedded in the fragmented Yangtze Block and undergoes counterclockwise rotation due to east-west compressive forces (F) in the EW direction, resulting in an uplifting and tilting effect at the bottom of Mt. Gongga. In addition, the flow of ductile material in the mid-lower crust generates upward movement under thermal dynamic conditions, leading to continuous stacking and thickening of the lithosphere in the lower part of Mt. Gongga. Based on the analysis of structural and material mechanics, the continuous structure of the mountain root, and profile measurements, the author concludes that the “triangle” figure structure observed in the EW profile of Mt. Gongga is minimally influenced by the east-west compression. In conjunction with the simulation results of this study (Figure 9), it is evident that there is significant vertical displacement at the top of Mt. Gongga prior to an earthquake, indicating a state of incubation for uplift. After the earthquake, there is a noticeable increase in vertical displacement at the top of the mountain. Therefore, it is believed that the dipping direction of the fault plane at the southeastern segment of the Xianshuihe fault is NE, which indirectly confirms the presence of weakened remnants of the Yangtze Block in the deep crust of Mt. Gongga, where a detachment fault structure exists.
In summary, this article aims to elucidate the anomalous uplift of Mt. Gongga. In planar terms, the uplift is attributed to the SE-SSE compressional and clockwise rotational forces exerted by the Sichuan–Yunnan block at the “Big Bend” region. From the cross-sectional aspect, it is influenced by the counterclockwise rotational motion of the embedded block in the W-E direction, along with the obliquely upward thermal-dynamic upwelling of the crustal asthenosphere. These phenomena collectively constitute the mountain-building mechanism of the integrated effects termed “clockwise uplift + rotational flexure + asthenospheric upwelling” as depicted (Figure 13c). According to the study by Xu [55], it is suggested that the southeastern region of the Sichuan–Yunnan block experiences hindered southeastward horizontal displacement at the “Big Bend” zone. The reduced left-lateral slip rate of the southern segment of the Xianshuihe Fault partially transforms into a pronounced uplift centered around the Mt. Gongga (with an uplift rate of approximately 3.2 mm/year). Combining this with the long-term observational results of Hao [48], who utilized leveling instruments to monitor the uplift of the main peak of Mt. Gongga (with an uplift rate of no less than 5.8 mm/year), a simple proportional calculation indicates that the “clockwise uplift” tectonic activity contributes to over 50% of the total tectonic mechanisms. Therefore, we preliminarily consider the compression-induced “clockwise uplift” as the primary controlling factor for the uplift of Mt. Gongga.

6. Conclusions

Although the approach proposed in this paper, which uses GNSS co-seismic deformation field constraints and Interface technology to simulate numerical models, provides a comprehensive multi-directional analysis of the Mt. Gongga uplift—from the shallow to deep layers, and from horizontal to vertical profiles—while also analyzing the fault movement and the impact of the Luding Mw 6.6 earthquake on the Mt. Gongga uplift, it holds great application potential. However, simulating earthquakes and studying the Mt. Gongga uplift in a geologically complex background remains a challenging task. In future work, we plan to construct a more refined and realistic seismic geological model, incorporating other parameters to improve the reliability of the inversion. Additionally, exploring mountain uplift requires referencing detailed and accurate geophysical deep detection data to better support analysis and research. The main conclusions of this study are as follows:
(1)
The seismic source analysis of the earthquake reveals a steep dip angle of the primary fault plane, with a predominant inclination toward the northeast.
(2)
Numerical simulations demonstrate a consistent correlation between the horizontal displacement pattern and the arcuate structure of the Sichuan–Yunnan block, promoting the counterclockwise uplift of Mt. Gongga. The vertical displacement pattern indicates that this earthquake accelerated the overall uplift of Mt. Gongga.
(3)
Mt. Gongga undergoes a multiple coupling uplift mechanism characterized by “clockwise uplift + rotational flexure + asthenospheric upwelling”.

Author Contributions

Conceptualization, Z.X. and Y.L.; methodology, Z.X.; software, Z.X.; validation, Z.X., G.Y. and S.L.; formal analysis, Y.L.; investigation, Z.X.; resources, G.Y. and S.Z.; data curation, Y.L.; writing—original draft preparation, Z.X.; writing—review and editing, S.Z. and S.L.; visualization, Z.X.; supervision, Y.L.; project administration, Y.L.; funding acquisition, Y.L. All authors have read and agreed to the published version of the manuscript.

Funding

This research was funded by the National Natural Science Foundation of China (grant number 42342027 and 42202132).

Data Availability Statement

The GNSS data presented in this study are openly available from the CEA at https://www.cea.gov.cn/cea/dzpd/dzzt/5683568/5683917/5684590/index.html (accessed on 15 September 2023). The Seismic Waveform data presented in this study are openly available from the CEA at https://www.cea.gov.cn/cea/dzpd/dzzt/5683568/5683917/5684035/index.html (accessed on 22 September 2023).

Acknowledgments

The authors extend our gratitude to the research teams at the China Earthquake Administration for providing the fundamental data and reference materials. The comments for improvement from the anonymous reviewers are gratefully acknowledged.

Conflicts of Interest

The authors declare no conflicts of interest.

References

  1. Coleman, M. Evidence for Tibetan plateau uplift before 14My ago from a new minimum ago for east-west extension. Nature 1995, 374, 49–52. [Google Scholar] [CrossRef]
  2. Pan, J.; Li, H.B.; Chevalier, M.L.; Bai, M. A newly discovered active fault on the Selaha-Kangding segment along the Xianshuiher fault belt: The South Mugecuo fault. Acta Geol. Sin. 2020, 94, 3178–3188. [Google Scholar]
  3. Lai, C.G.; Bozzoni, F.; Conca, D.; Famà, A.; Özcebe, A.G.; Zuccolo, E.; Meisina, C.; Bonì, R.; Bordoni, M.; Cosentini, R.M.; et al. Technical guidelines for the assessment of earthquake induced liquefaction hazard at urban scale. Bull. Earthq. Eng. 2021, 19, 4013–4057. [Google Scholar] [CrossRef]
  4. Li, Y.; Zhou, R.Z.; Yan, L.; Yan, Z.K.; Ding, H.R.; Shao, C.J. Tectonic Geomorphology and Surface Process of Longmen Shan; Science Press: Beijing, China, 2017; pp. 439–440. [Google Scholar]
  5. Tapponnier, P.; Zhiqin, X.; Roger, F.; Meyer, B.; Arnaud, N.; Wittlinger, G.; Jingsui, Y. Oblique Stepwise Rise and Growth of the Tibet Plateau. Science 2001, 294, 1671–1678. [Google Scholar] [CrossRef] [PubMed]
  6. Qiao, L.H.; Yao, H.J.; Lai, Y.C.; Huang, B.S.; Zhang, P. Crustal structure of southwest China and northern Vietnam from ambient noise tomography: Implication for the large-scale material transport model in SE Tibet. Tectonics 2018, 37, 492–1506. [Google Scholar] [CrossRef]
  7. Liu, Q.Y.; van der Hilst, R.D.; Li, Y.; Yao, H.J.; Chen, J.H.; Guo, B.; Qi, S.H.; Wang, J.; Huang, H.; Li, S.C. Eastward expansion of the Tibetan Plateau by crustal flow and strain partitioning across faults. Nat. Geosci. 2014, 7, 361. [Google Scholar] [CrossRef]
  8. Chen, M.H. Low wave speed zones in the crust beneath SE Tibet revealed by ambient noise adjoint tomography. Geophys. Res. Lett. 2014, 41, 334–340. [Google Scholar] [CrossRef]
  9. Hao, M.; Li, Y.; Zhuang, W. Crustal movement and strain distribution in east asia revealed by gps observations. Sci. Rep. 2019, 9, 16797. [Google Scholar] [CrossRef]
  10. Wang, M.; Shen, Z.K. Present-day crustal deformation of continental China derived from GPS and its tectonic implications. J. Geophys. Res. Solid Earth 2020, 125, e2019JB018774. [Google Scholar] [CrossRef]
  11. Zheng, G.; Wang, H.; Wright, T.J.; Lou, Y.; Zhang, R.; Zhang, W.; Shi, C.; Huang, J.; Wei, N. Crustal deformation in the india-eurasia collision zone from 25 years of gps measurements. J. Geophys. Res. Solid Earth 2017, 122, 9290–9312. [Google Scholar] [CrossRef]
  12. Liang, S.; Gan, W.; Shen, C.; Xiao, G.; Liu, J.; Chen, W.; Ding, X.; Zhou, D. Three-dimensional velocity field of present–day crustal motion of the tibetan plateau derived from gps measurements. J. Geophys. Res. Solid Earth 2013, 108, 5722–5732. [Google Scholar] [CrossRef]
  13. Zhang, P.-Z.; Shen, Z.; Wang, M.; Gan, W.; Bürgmann, R.; Molnar, P.; Wang, Q.; Niu, Z.; Sun, J.; Wu, J.; et al. Continuous deformation of the tibetan plateau from global positioning system data. Geology 2004, 32, 809–812. [Google Scholar] [CrossRef]
  14. Wang, Q.; Zhang, P.-Z.; Freymueller, J.T.; Bilham, R.; Larson, K.M.; Lai, X.; You, X.; Niu, Z.; Wu, J.; Li, Y.; et al. Present-day crustal deformation in china constrained by global positioning system measurements. Science 2001, 294, 574–577. [Google Scholar] [CrossRef]
  15. Li, X.R.; Hergert, T.; Henk, A.; Wang, D.; Zeng, Z.X. Subsurface structure and spatial segmentation of the Longmen Shan fault zone at the eastern margin of Tibetan Plateau: Evidence from focal mechanism solutions and stress field inversion. Tectonophysics 2019, 757, 10–23. [Google Scholar] [CrossRef]
  16. Lin, X.; Dreger, D.; Ge, H.; Xu, P.; Wu, M.; Chiang, A.; Zhao, G.; Yuan, H. Spatial and Temporal Variations in the Moment Tensor Solutions of the 2008 Wenchuan Earthquake Aftershocks and Their Tectonic Implications. Tectonics 2018, 37, 989–1005. [Google Scholar] [CrossRef]
  17. Yang, Y.; Liang, C.T.; Fan, L.H.; Su, J.R.; Hua, Q.A. Comprehensive Analysis on the Stress Field and Seismic Anisotropy in Eastern Tibet. Tectonophysics 2018, 37, 1648–1657. [Google Scholar] [CrossRef]
  18. Wu, M.; Zhang, C.Y.; Fan, T.Y. Stress state of the Baoxing segment of the southwestern Longmenshan Fault Zone before and after the Ms 7.0 Lushan earthquake. J. Asian Earth Sci. 2016, 121, 9–19. [Google Scholar] [CrossRef]
  19. Meng, W.; Chen, Q.; Zhao, Z.; Wu, M.; Qin, X.; Zhang, C. Characteristics and implications of the stress state in the Longmen Shan fault zone, eastern margin of the Tibetan Plateau. Tectonophysics 2015, 656, 1–19. [Google Scholar] [CrossRef]
  20. Roger, F.; Calassou, S.; Lancelot, J.; Malavieille, J.; Mattauer, M.; Zhiqin, X.; Ziwen, H.; Liwei, H. Miocene emplacement and deformation of the Konga Shan granite (Xianshui He fault zone, west Sichuan, China): Geodynamic implications. Earth Planet. Sci. Lett. 1995, 130, 201–216. [Google Scholar] [CrossRef]
  21. Song, X.; Shan, X.; Qu, C.; Han, Y.; Zhang, G.; Guo, L.; Zhang, G. The characteristics of post-earthquake surface deformation of the Wenchuan MS8.0 earthquake from InSAR. In Proceedings of the 2010 IEEE International Geoscience and Remote Sensing Symposium, Honolulu, HI, USA, 25–30 July 2010; pp. 1210–1213. [Google Scholar]
  22. Jiang, G.; Xu, X.; Chen, G.; Liu, Y.; Fukahata, Y.; Wang, H.; Yu, G.; Tan, X.; Xu, C. Geodetic imaging of potential seismogenic asperities on the Xianshuihe-Anninghe-Zemuhe fault system, southwest China, with a new 3-D viscoelastic interseismic coupling model. J. Geophys. Res. Solid Earth 2015, 120, 1855–1873. [Google Scholar] [CrossRef]
  23. Pritchard, M.E.; Simons, M.; Rosen, P.A.; Hensley, S.; WEbb, F.H. Co-seismic slip from the 1995 July 30 Mw= 8.1 Antofagasta, Chile, earthquake as constrained by InSAR and GPS observations. Geophys. J. Int. 2002, 150, 362–376. [Google Scholar] [CrossRef]
  24. Qu, C.; Zhang, G.; Shan, X.; Zhang, G.; Song, X.; Liu, Y. Coseismic deformation field derived from ENVISAT/ASAR data and fault slip inversion of Ms7.1 Yushu earthquake, China in 2010. In Proceedings of the 2012 IEEE International Geoscience and Remote Sensing Symposium, Munich, Germany, 22–27 July 2012; pp. 3879–3882. [Google Scholar]
  25. Zeitler, P.; Meltzer, A.S.; Koons, P.O.; Craw, D.; Hallet, B.; Chamberlain, C.P.; Kidd, W.F.; Park, S.K.; Seeber, L.; Bishop, M.; et al. Erosion, Himalayan geodynamics, and the geomorphology of metamorphism. GSA Today 2021, 11, 4–9. [Google Scholar] [CrossRef]
  26. Clark, M.; House, M.; Royden, L.; Whipple, K.; Burchfiel, B.; Zhang, X.; Tang, W. Late cenozoic uplift of southeastern Tibet. Geology 2005, 33, 525–528. [Google Scholar] [CrossRef]
  27. Wang, E.; Su, Z.; Xu, G. A case study on lateral extrusion occurred along some orogenic belts in China. Chin. J. Geol. 2009, 44, 1266–1288. [Google Scholar]
  28. Jiang, F.; Chen, X.B.; Unsworth, M.J.; Cai, J.T.; Han, B.; Wang, L.F.; Dong, Z.Y.; Tengfa, C.; Zhan, Y.; Zhao, G.Z.; et al. Mechanism for the uplift of Mt Gongga in the southeastern Tibetan Plateau constrained by 3D magnetotelluric data. Geophys. Res. Lett. 2022, 49, e2021GL097394. [Google Scholar] [CrossRef]
  29. Zhu, L.; Ji, L.; Jiang, F. Variations in locking along the east Kunlun fault, Tibetan Plateau, China, using GPS and leveling data. Pure Appl. Geophys. 2020, 177, 231–251. [Google Scholar] [CrossRef]
  30. Li, X.R. 3-D Numerical Modeling of Tectonic Stress Field in the Eastern Tibetan Plateau and the Seismic Hazard Assessment; China University of Geosciences: Wuhan, China, 2020; pp. 1–154. [Google Scholar]
  31. Xu, Z.Q. Mountain-Cutting Process in Songpan-Ganzi Orogenic Belt, 3rd ed.; Geological Publishing House: Beijing, China, 2008; pp. 154–196. [Google Scholar]
  32. Fan, W.J. The Geologca Tectonic Foundation of Minya Gongkar Clacial And Its Characteristc Claciac Landforms. J. Chengdu Univ. Sci. Technol. 1982, 3, 19–33. [Google Scholar]
  33. Wen, X.; Ma, S.; Xu, X.; He, Y. Historical pattern and behavior of earthquake ruptures along the eastern boundary of the Sichuan-Yunnan faulted-block, southwestern China. Phys. Earth Planet. Inter. 2008, 168, 16–36. [Google Scholar] [CrossRef]
  34. Zhang, P.Z. A review on active tectonics and deep crustal processes of the Western Sichuan region, eastern margin of the Tibetan Plateau. Tectonophysics 2013, 584, 7–22. [Google Scholar] [CrossRef]
  35. Wu, Z.; Long, C.; Fan, T.; Zhou, C.; Feng, H.; Yang, Z.; Tong, Y. The arc rotational-shear active tectonic system on the southeastern margin of Tibetan Plateau and its dynamic characteristics and mechanism. Geol. Bull. China 2015, 34, 1–31. [Google Scholar]
  36. Shen, Z.K.; Lü, J.; Wang, M.; Bürgmann, R. Contemporary crustal deformation around the southeast borderland of the TibetanPlateau. J. Geophys. Res. 2005, 110, B11409. [Google Scholar]
  37. Tang, T.; Wang, P.; Deng, H.; Liu, Y.P.; Tang, W.Q. Petrological records of major tectono-magmatic events since Oligocene in the southeastern segment of Xianshuihe fault zone in the eastern margin of Tibetan Plateau. Geol. Bull. China 2022, 41, 1121–1143. [Google Scholar]
  38. Zhang, P.Z.; Wen, X.Z.; Shen, Z.K.; Chen, J.H. Oblique high-angle listric-reverse faulting and associated straining processes: The Wenchuan earthquake of 12 May 2008, Sichuan, China. Annu. Rev. Earth Planet. Sci. 2010, 38, 353–382. [Google Scholar] [CrossRef]
  39. Wang, E.; Meng, K.; Su, Z.; Meng, Q.; Chu, J.J.; Chen, Z.; Wang, G.; Shi, X.; Liang, X. Block rotation: Tectonic response of the Sichuan basin to the southeastward growth of the Tibetan Plateau along the Xianshuihe-Xiaojiang fault. Tectonics 2014, 33, 686–717. [Google Scholar] [CrossRef]
  40. Xu, Z.Q.; Yang, J.S.; Li, H.B.; Ji, S.C.; Zhang, Z.M.; Liu, Y. On the Tectonics of the India-Asia Collision. Acta Geol. Sin. 2011, 85, 1–33. [Google Scholar]
  41. Chen, Y.M.; Xu, D.P. FLAC Foundation and Engineering Example, 3rd ed.; China Water Resources and Hydropower Press: Beijing, China, 2009; pp. 127–129. [Google Scholar]
  42. Li, T.B.; Xu, Z.; Wang, R.X. Inversion analysis of abrupt change characteristics of in–situ stress field in Wenchuan earthquake region based on seismic fault displacement. J. Eng. Geol. 2016, 24, 760–767. [Google Scholar]
  43. Li, Y.; Zhao, D.; Shan, X.; Gao, Z.; Huang, X.; Gong, W. Coseismic slip model of the 2022 Mw 6.7 Luding (Tibet) earthquake: Pre- and post-earthquake interactions with surrounding major faults. Geophys. Res. Lett. 2022, 49, e2022GL102043. [Google Scholar] [CrossRef]
  44. Guo, R.; Li, L.; Zhang, W.; Zhang, Y.; Tang, X.; Dai, K.; Li, Y.; Zhang, L.; Wang, J. Kinematic slip evolution during the 2022 Ms 6.8 Luding, China, Earthquake: Compatible with the preseismic locked patch. Geophys. Res. Lett. 2023, 50, e2023GL103164. [Google Scholar] [CrossRef]
  45. Liu, G.; Zhao, B.; Xu, R.; Qiao, X.; Liu, C.; Li, Y.; Lin, M.; Zhao, X.; Nie, Z.; Xiong, W.; et al. Gnss constrained rupture kinematics of the 2022 Mw 6.7 Luding, China, earthquake: Directivity pulse during the asymmetrical bilateral rupture. Seismol. Res. Lett. 2024, 95, 264–276. [Google Scholar] [CrossRef]
  46. Han, B.Q.; Liu, Z.J.; Chen, B.; Li, Z.; Yu, C.; Zhang, Y.; Peng, J. Coseismic Deformation and Slip Distribution of the 2022 Luding Mw 6.6 Earthquake Revealed by In SAR Observations; Geomatics and Information Science of Wuhan University: Wuhan, China, 2023; Volume 48, pp. 36–46. [Google Scholar]
  47. Zhang, L.; Zhou, Y.; Zhang, X.; Zhu, A.; Li, B.; Wang, S.; Liang, S.; Jiang, C.; Wu, J.; Li, Y.; et al. 2022 Mw 6.6 Luding, China, Earthquake: A Strong Continental Event Illuminating the Moxi Seismic Gap. Seismol. Res. Lett. 2023, 94, 2129–2142. [Google Scholar] [CrossRef]
  48. Hao, M.; Wang, Q.; Shen, Z.; Cui, D.; Ji, L.; Li, Y.; Qin, S. Present day crustal vertical movement inferred from precise leveling data in eastern margin of Tibetan plateau. Tectonophysics 2014, 632, 281–292. [Google Scholar] [CrossRef]
  49. Gui, G.H.; Xu, X.W.; Wen, X.Z.; Wang, Y.L. Kinem Atical Transformation And Slippartitioning of Northern Toeastern Active Boundary Belt of Sichuan-Yunnan block. Seismol. Geol. 2008, 30, 58–85. [Google Scholar]
  50. Lei, J.; Zhao, D. Teleseismic p-wave tomography and mantle dynamics beneath eastern Tibet. Geochem. Geophys. Geosyst. 2016, 17, 1861–1884. [Google Scholar] [CrossRef]
  51. Clark, M.K.; Royden, L.H. Topographic ooze: Building the eastern margin of Tibetan by lower crustal flow. Geology 2000, 28, 703–706. [Google Scholar] [CrossRef]
  52. Bai, D.; Unsworth, M.J.; Meju, M.A.; Ma, X.; Teng, J.; Kong, X.; Sun, Y.; Sun, J.; Wang, L.; Jiang, C.; et al. Crustal deformation of the eastern Tibetan plateau revealed by magnetotelluric imaging. Nat. Geosci. 2010, 3, 358–362. [Google Scholar] [CrossRef]
  53. Zhang, Z.Q.; McCaffrey, R.; Zhang, P.Z. Relative motion across the eastern Tibetan Plateau: Contributions from faulting, internal strain and rotation rates. Tectonophysics 2013, 584, 240–256. [Google Scholar] [CrossRef]
  54. Li, H.B.; Pan, J.W.; Sun, Z.M.; Si, J.; Pei, J.L.; Liu, D.L.; Chevalier, M.L.; Wang, H.; Lu, H.J.; Yong, Z.; et al. Continental tectonic deformation and seismic activity: A case study of the Tibetan Plateau. Acta Geol. Sin. 2021, 95, 194–213. [Google Scholar]
  55. Xu, X.W.; Wen, X.Z.; Zheng, R.Z.; Ma, W.T.; Song, F.M.; Yu, G.H. Pattern of latest tectonic motion and its dynamics for active blocks in Sichuan-Yunnan region. China Sci. China (Ser D) 2003, 46, 210–226. [Google Scholar] [CrossRef]
Figure 1. Tectonic activity background of the study area (Tectonic activity distribution according to Tapponnier [5]).
Remotesensing 17 02286 g001
Figure 2. Planar geological overview of the study area.
Remotesensing 17 02286 g002
Figure 3. Geological cross-section (A-A’) of Mt. Gongga area in the study region (adapted from Xu [31] and Fan [32], with revisions).
Remotesensing 17 02286 g003
Figure 5. (a) Geological model of the study area. (b) Components of the bordered interface constitutive model.
Remotesensing 17 02286 g005
Figure 6. (a) Numerical simulation of a true 3D grid model. (b) Planar geometry and boundary conditions.
Remotesensing 17 02286 g006
Figure 8. (a) Pre-earthquake horizontal X-axis displacement simulation map. (b) Isopleth map of maximum displacement in the region. Note: We constrained the model based on the dynamic and stress field environment of the seismic region, and calibrated the numerical simulation process using GNSS observation data. The finite element contact surface technique introduced in Section 3.1 (Methodology) was employed to invert the planar displacement variation in the Mt. Gongga region prior to the earthquake. This approach enhances our understanding of the impact of tectonic stress compression on horizontal surface deformation in the Mt. Gongga area.
Remotesensing 17 02286 g008
Figure 9. Mt. Gongga II-II’ profile Z-axis displacement simulation map: (a) pre-earthquake; (b) post-earthquake. (c) InSAR observation of vertical deformation field for the Luding Mw 6.6 earthquake. (d) Simulated deformation map for the Luding Mw 6.6 earthquake in 2022 (data cited from Han [46]).
Remotesensing 17 02286 g009
Figure 10. Mt. Gongga II-II’ profile X-axis displacement simulation map: (a) pre-earthquake; (b) post-earthquake. Note: Based on the finite element contact surface technique used in our numerical simulation, we inverted the variation in X-axis displacement along the Mt. Gongga II-II’ profile before and after the Luding earthquake. The aim is to illustrate the lateral compressive tectonic force exerted on Mt. Gongga from the west, as the Tibetan Plateau moves eastward, and to analyze the impact of the earthquake on the lateral displacement along the Mt. Gongga II-II’ profile before and after the event.
Remotesensing 17 02286 g010
Figure 11. (a) Distribution map of aftershocks along the fault slip and longitudinal, transverse profiles for the Luding Mw 6.6 earthquake (data from the China Earthquake Administration). (b) Shear displacement simulation map of the Xianshuihe main fault plane during the earthquake. Note: The left panel of Figure 11a shows the sliding displacement variation along the strike of the southeastern segment of the Xianshuihe Fault during the Luding earthquake. The right panel of Figure 11a represents the spatial distribution of aftershocks in the transverse direction perpendicular to the Xianshuihe Fault. The figure is adapted from Zhang [47]. Based on the numerical simulation of the Luding earthquake, we analyzed the fault slip variation along the Gongga I-I’ fault profile and obtained the fault shear displacement contour map (Figure 11b). This result was then compared and validated with the source fault plane results obtained by the China Earthquake Administration through seismic waveform data (Figure 11a). The shear displacement results from both approaches are consistent, thus supporting the rationality and feasibility of the inversion model used in this study.
Remotesensing 17 02286 g011
Figure 12. (a) Results of the electromagnetic sounding depth profile inversion in the Mt. Gongga region (data from Jiang [28]). (b) Schematic diagram of the inferred deep-seated uplift mechanism in the Mt. Gongga region.
Remotesensing 17 02286 g012
Figure 13. (a) Planar diagram of the mechanical analysis of the uplift mechanism in Mt. Gongga. (b) Profile diagram of the uplift mechanism. (c) Three-dimensional coupling diagram of the uplift mechanism in Mt. Gongga.
Remotesensing 17 02286 g013
Table 1. Focal mechanism solutions released by USGS, IPG, GFZ, and CENC for the mainshock of the Mw 6.6 Luding earthquake along with the seismic sequence of aftershocks with 7 events of Mw > 3.0 the Xianshuihe fault zone.
Seismic SequenceMagnitud
(Mw)
Seismic Depth (km)Fault Plane I/(°)Data SourceBeach
Volleyball
StrikeDipRake
6.641225473178USGSRemotesensing 17 02286 i001
6.7077666−79IPGRemotesensing 17 02286 i002
6.70774175−79GFZRemotesensing 17 02286 i003
4.0173686−158CENCRemotesensing 17 02286 i004
3.8912035−130CENCRemotesensing 17 02286 i005
3.81014647−93CENCRemotesensing 17 02286 i006
4.5924184163CENCRemotesensing 17 02286 i007
3.886167−178CENCRemotesensing 17 02286 i008
3.885979−175CENCRemotesensing 17 02286 i009
Disclaimer/Publisher’s Note: The statements, opinions and data contained in all publications are solely those of the individual author(s) and contributor(s) and not of MDPI and/or the editor(s). MDPI and/or the editor(s) disclaim responsibility for any injury to people or property resulting from any ideas, methods, instructions or products referred to in the content.

