Abstract
In this study, the relationship between radar reflectivity and rain rate (Z–R) was investigated. The analysis was conducted using data collected by the OTT Parsivel1 disdrometer during the periods 2012–2014 and 2019–2025 in Warsaw, Poland. As a first step, the parameters a and b of the power-law Z–R relationship were estimated separately for three precipitation types: rain, sleet (rain with snow), and snow. Subsequently, observational data from all 12 months of the annual cycle were used to derive Z–R relationships for 118 individual precipitation events. To date, only a few studies of this kind have been conducted in Poland. In the analysis limited to rain events, the estimated parameters (a = 265, b = 1.48) showed relatively minor deviations from the classical Z–R function for convective rainfall, Z = 300R1.4. However, the parameter a deviated more noticeably from the Z = 200R1.6 relationship proposed by Marshall and Palmer, which is commonly used to convert radar reflectivity into rainfall estimates, including in the Polish POLRAD radar system. The dataset used in this study included rainfall events of varying types, both stratiform and convective, which contributed to the averaging of Z–R parameters. The values for the parameter a in the Z–R relationship estimated for the other two categories of precipitation types, sleet and snow, were significantly higher than those determined for rain events alone. The a values calculated for individual events demonstrated considerable variability, ranging from 80 to 751, while the b values presented a more predictable range, from 1.10 to 1.77. The highest parameter a values were observed during the summer months: June, July, and August. The variability in the Z–R relationship for individual events assessed in this study indicates the need for further research under diverse meteorological conditions, particularly for stratiform and convective precipitation.
1. Introduction
Accurate knowledge of precipitation and its associated microphysics is essential for improving the accuracy of quantitative precipitation estimation (QPE) using weather radars [1], which enable the visualization of its spatial and temporal variability [2,3,4]. This, in turn, contributes to reducing uncertainty in hydrological simulations, enhances forecasting tools and early warning systems for floods, and supports effective water resource management [5,6,7]. Conventional radar measures the reflectivity Z of precipitation (e.g., clouds), which, based on a specific Z–R relationship, is converted into rain rate R or total precipitation [8]. The identification of an appropriate Z–R relationship, whose most commonly used form in radar meteorology is presented in Equation (3), is crucial for the practical application of weather radar in hydrology [9]. One of the primary causes of the high temporal and spatial variability in the Z–R relationship is the variability in the drop size distribution (DSD) [10]. Many researchers [9,11,12,13,14] have demonstrated that topography, atmospheric conditions, precipitation types, and other factors contribute to variations in the DSD, which in turn lead to changes in the Z–R relationship.
Most meteorological services, including the Institute of Meteorology and Water Management—National Research Institute (which operates the Polish POLRAD weather radar network), have upgraded their radar systems by implementing dual-polarization radar technology. Disdrometers can support the maintenance of high-quality parameters in dual-polarization radar systems [15]. These instruments not only have great potential for point precipitation monitoring but are also essential for improving the calibration of weather radars [16]. Based on the parameters measured by disdrometers, such as reflectivity and precipitation intensity, Z–R relationships can be derived [17,18,19,20,21]. Such relationships can be used to calibrate weather radars, despite the challenges associated with differences in measurement height (ground level vs. cloud base) and detection area (a few cm2 vs. several km2) between disdrometers and radar systems [22,23,24].
The use of disdrometer data for research purposes has become increasingly widespread worldwide, with optical Parsivel disdrometers being the most used, particularly for continuous measurements of the DSD at high temporal resolution [25,26,27,28,29,30]. Some disdrometers also provide information on the fall velocity of hydrometeors, making it possible to distinguish between various types of precipitation, such as rain, sleet, snow, and hail [31,32]. Detailed descriptions of the various types of disdrometers and the measurement principles used by the devices have been presented by Dunkerley [33] and Wang et al. [34].
In contrast, disdrometer-based research in Poland remains limited. Only a few scientific publications that demonstrate the usefulness of disdrometers for precipitation estimation can be found in the national literature [35,36,37,38,39,40]. However, to the authors’ knowledge, relationships between radar reflectivity and precipitation intensity based on disdrometer data have only been investigated in a limited number of research studies [9,41,42,43]. Selected results from these studies are discussed in further sections of this paper.
With the above context in mind, this paper presents the results of identifying Z–R relationships based on observational data on reflectivity and precipitation intensity, recorded during the periods 2012–2014 and 2019–2025, using an OTT Parsivel1 disdrometer located in Warsaw (central Poland). The disdrometer data were used to estimate the parameters a and b of the Z–R relationship (Equation (3)) separately for different precipitation types (rain, rain mixed with snow, and snow), as well as for 118 individual events over a selected 12-month period.
2. Materials and Methods
2.1. Disdrometer Data Processing and Characterization
The study used reflectivity and precipitation intensity data recorded by a first-generation OTT Parsivel1 laser disdrometer (OTT HydroMet GmbH, Kempten, Germany), located at the meteorological station of the Warsaw University of Life Sciences (Figure 1), in central Poland.
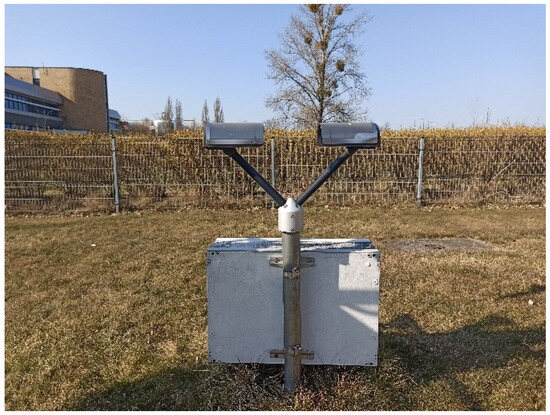
Figure 1.
The OTT Parsivel1 disdrometer installed at the meteorological station used in this study.
The Parsivel1 (PARticle SIze and VELocity) disdrometer, manufactured by OTT HydroMet GmbH, provides information on drop size distribution (i.e., the number and diameter of liquid and solid precipitation particles in 32 size classes) and fall velocity (also in 32 classes). Using this data, the disdrometer’s built-in software (https://distromet.com/) calculates various derived quantities, including radar reflectivity and precipitation intensity. These quantities can be expressed using the following equations, as presented by Xie et al. [1] among others:
where
- Z—radar reflectivity (mm6 m−3);
- R—rain rate (mm h−1);
- N(D)—number of drops (hydrometeors) of diameter D (mm) within a given size and fall velocity class;
- —fall velocity of hydrometeors (m s−1).
A detailed description of the OTT Parsivel disdrometers and the results of their performance in various field experiments have been provided in numerous papers [1,5,12,15,25,44,45,46,47,48,49]; therefore, this information will not be repeated in the present work.
However, it should be noted that in 2011, the OTT company introduced a new disdrometer model—Parsivel2, equipped with a next-generation optical device that ensures better laser beam uniformity. Consequently, the Parsivel1 disdrometer used in this study has certain well-known and documented limitations, such as underestimating the number of small drops, overestimating large drops, and difficulties in distinguishing precipitation types. These limitations were confirmed, among others, in the study by Tokay et al. [45], which showed that Parsivel2 provides a more accurate representation of drop size distribution and rainfall intensity, especially during heavy precipitation events. The Parsivel1 disdrometer tended to underestimate small drops and overestimate the proportion of large drops in the DSD.
The Z–R observational dataset, adopted for this study based on an analysis of data completeness and continuity, covers a total of 56 months between 2012 and 2014 (April to October) and between 2019 and 2025 (January to December), with the number of months varying by year. Some of these data, recorded in 2012–2014 and 2019–2020, were also used in the author’s previous studies [42,43]. The lack of measurement data between 2014 and 2019 was primarily due to the absence of data recording using the Parsivel1 disdrometer, and partly due to data incompleteness. All data included in the analysis were collected at the same location and with the same instruments, which allows them to be considered a consistent measurement dataset.
To ensure data quality, the lowest precipitation intensity values (considered as background noise) were filtered out of the dataset, along with unrealistically high values that may have resulted, among other things, from disdrometer testing conducted by the operating personnel. The sensor status code was not directly used in the filtering process. The data used in the study had a sensor status code of 0 or 1. For the estimation of the Z–R relationship parameters (Equation (3)), only data meeting the criterion of Rmin ≥ 0.01 mm h−1 were used. This threshold value was assumed to be one order of magnitude greater than the accuracy of precipitation intensity measurements using the Parsivel1 disdrometer, which is 0.001 mm h−1. Only one version of the R value was considered in the analysis, namely the “Intensity of precipitation” (mm h−1), as defined in the disdrometer software. The alternative variable, corresponding to the “Snow depth intensity”, was not taken into account.
The measurement data were classified into one of three main precipitation types: rain (liquid precipitation), sleet (mixed precipitation—rain with snow), and snow (solid precipitation). Hail events were not observed during the study period. The classification of the data into each of these categories was based on six subtypes of precipitation (excluding hail) described in the technical documentation of the OTT Parsivel1 disdrometer, each of which includes three precipitation intensity ranges assigned to corresponding weather codes from the National Weather Service (NWS) classification system. Table 1 presents the NWS codes used in this study in relation to the measurement data and the corresponding main precipitation types.

Table 1.
NWS-based precipitation types used in this study.
The number of Z–R data pairs at a 1 min temporal resolution, used to determine the Z–R relationships for different precipitation types, was 161,594 (prior to filtering out precipitation intensity values below the threshold Rmin, it was 879,192). The observational dataset was dominated by data classified as rainfall events, comprising 143,629 Z–R data pairs. Table 2 presents the basic statistical measures characterizing the entire Z–R dataset and its three subsets corresponding to different precipitation types. Reflectivity and precipitation intensity values, at a 1 min resolution, ranged from −10.00 to 61.83 dBZ and from 0.01 to 153.52 mm h−1, respectively.
Table 2.
Basic statistical measures for the analyzed datasets.
The observational dataset of reflectivity and precipitation intensity was also used to determine Z–R relationships for individual precipitation events, which were identified within a selected 12-month period. Based on an analysis of data completeness and continuity, the study included 118 precipitation events recorded between February and November 2023, as well as in December 2024 and January 2025. Data from January and December 2023 were not used in this study due to the low number of Z–R data in these months, resulting from periodic interruptions in data recording caused by technical issues. The dataset was subdivided into individual precipitation events based on a minimum interval without precipitation of 1 h. Events with a duration of less than 5 min were excluded from the analysis.
Subsequently, 10 events were selected for each month in the annual cycle, except for September, which included only 8 events due to the lack of other events. To ensure data comparability and a consistent number of events across the annual cycle, a rule was adopted whereby the number of analyzed precipitation events in each month does not exceed 10. In months with more available events, those with higher precipitation intensities were selected for analysis. Among the events included in the study, the maximum duration was 1857 min (approximately 31 h), while the average duration was 324 min.
2.2. Z–R Relationship
The relationship between radar reflectivity Z (mm6 m−3) and rain rate R (mm h−1) was developed using a function of the form proposed by Marshall et al. [50]:
The parameters a and b were determined empirically based on the logarithmic values of Z and R using regression analysis. As a result, Equation (3) takes a linear form [9]:
The following statistical measures were applied to evaluate the quality of the determined Z–R relationships: the root mean square error (RMSE) [18,29,51], the coefficient of determination (R2), and the correlation coefficient (R) [13]. RMSE values, which describe the goodness of fit of the linear model to the Z–R data, are expressed in the units of the estimated variable [52].
3. Results and Discussion
3.1. Z–R Relationships for Different Precipitation Types
Logarithmic values of reflectivity and precipitation intensity were used to estimate the parameters a and b of the Z–R relationship (Equations (3) and (4)), both for the entire dataset and separately for different precipitation groups (Table 3). For this study, the entire Z–R dataset was divided into three subsets, representing the main types of precipitation: rain, sleet (rain mixed with snow), and snow. The basic statistical measures characterizing the data for each precipitation group are presented in Table 2.
Table 3.
Z–R relationships and statistics describing their fit to the data subsets.
The results presented in this study are subject to various sources of uncertainty, primarily related to the measurement of radar reflectivity using a disdrometer and the estimation of parameters of the Z–R relationship. These uncertainties arise from limitations of the measuring instrument, the influence of atmospheric conditions, the type of precipitation, and other factors that lead to temporal and spatial variability in the drop size distribution.
To estimate the uncertainty in the parameters of the Z–R relationship for the entire dataset and subsets representing different precipitation types, 95% confidence intervals were determined for the parameters a and b (95% CIs). The calculations were based on the standard errors of the regression coefficient obtained from linear regression performed on a logarithmic scale (log10Z, log10R). The results are presented in Table 3. Figure 2, Figure 3 and Figure 4 show the Z–R relationships determined for the analyzed data subsets, along with their 95% confidence intervals (indicated as dashed lines in black), which are barely visible due to their narrow ranges.
The study also included measures of model fit, such as the coefficient of determination (R2) and the root mean square error (RMSE), which may also be treated as indirect indicators of the model uncertainty. The fitted linear models were characterized by high coefficients of determination, ranging from 0.86 to 0.93, indicating a good fit of the regression lines to the specified data. The RMSE values obtained for the logarithmic reflectivity Z (mm6 m−3) were relatively low, ranging from 0.30 to 0.39 (in each case, they were less than half the standard deviation).
Additionally, the uncertainty of the radar reflectivity measurements Z obtained from the disdrometer was assessed. For the full dataset, the mean value of Z was 17.52 dBZ, and the 95% confidence interval ranged from 17.20 to 17.31 dBZ. The large number of observations and the narrow confidence interval suggest that the measurement results are stable and reliable.
The values of the Z–R relationship parameters, determined from the entire measurement data, fall within the ranges summarized by Moszkowicz and Tuszyńska [8]: 16.6–730 for a and 1.16–2.87 for b, which were established based on 24 separate studies conducted in various locations around the world. The relationship Z = 276R1.46, obtained in this study, is consistent with results from many other investigations. For example, Baltas et al. [17], in their study conducted in the Athens area (Greece) using a Joss-Waldvogel RD-69 disdrometer, derived a general relationship of Z = 261R1.52. Caracciolo et al. [53] and Uijlenhoet et al. [54], based on studies conducted in Italy and the United States, respectively, proposed the relationships Z = 273R1.48 and Z = 277R1.48.
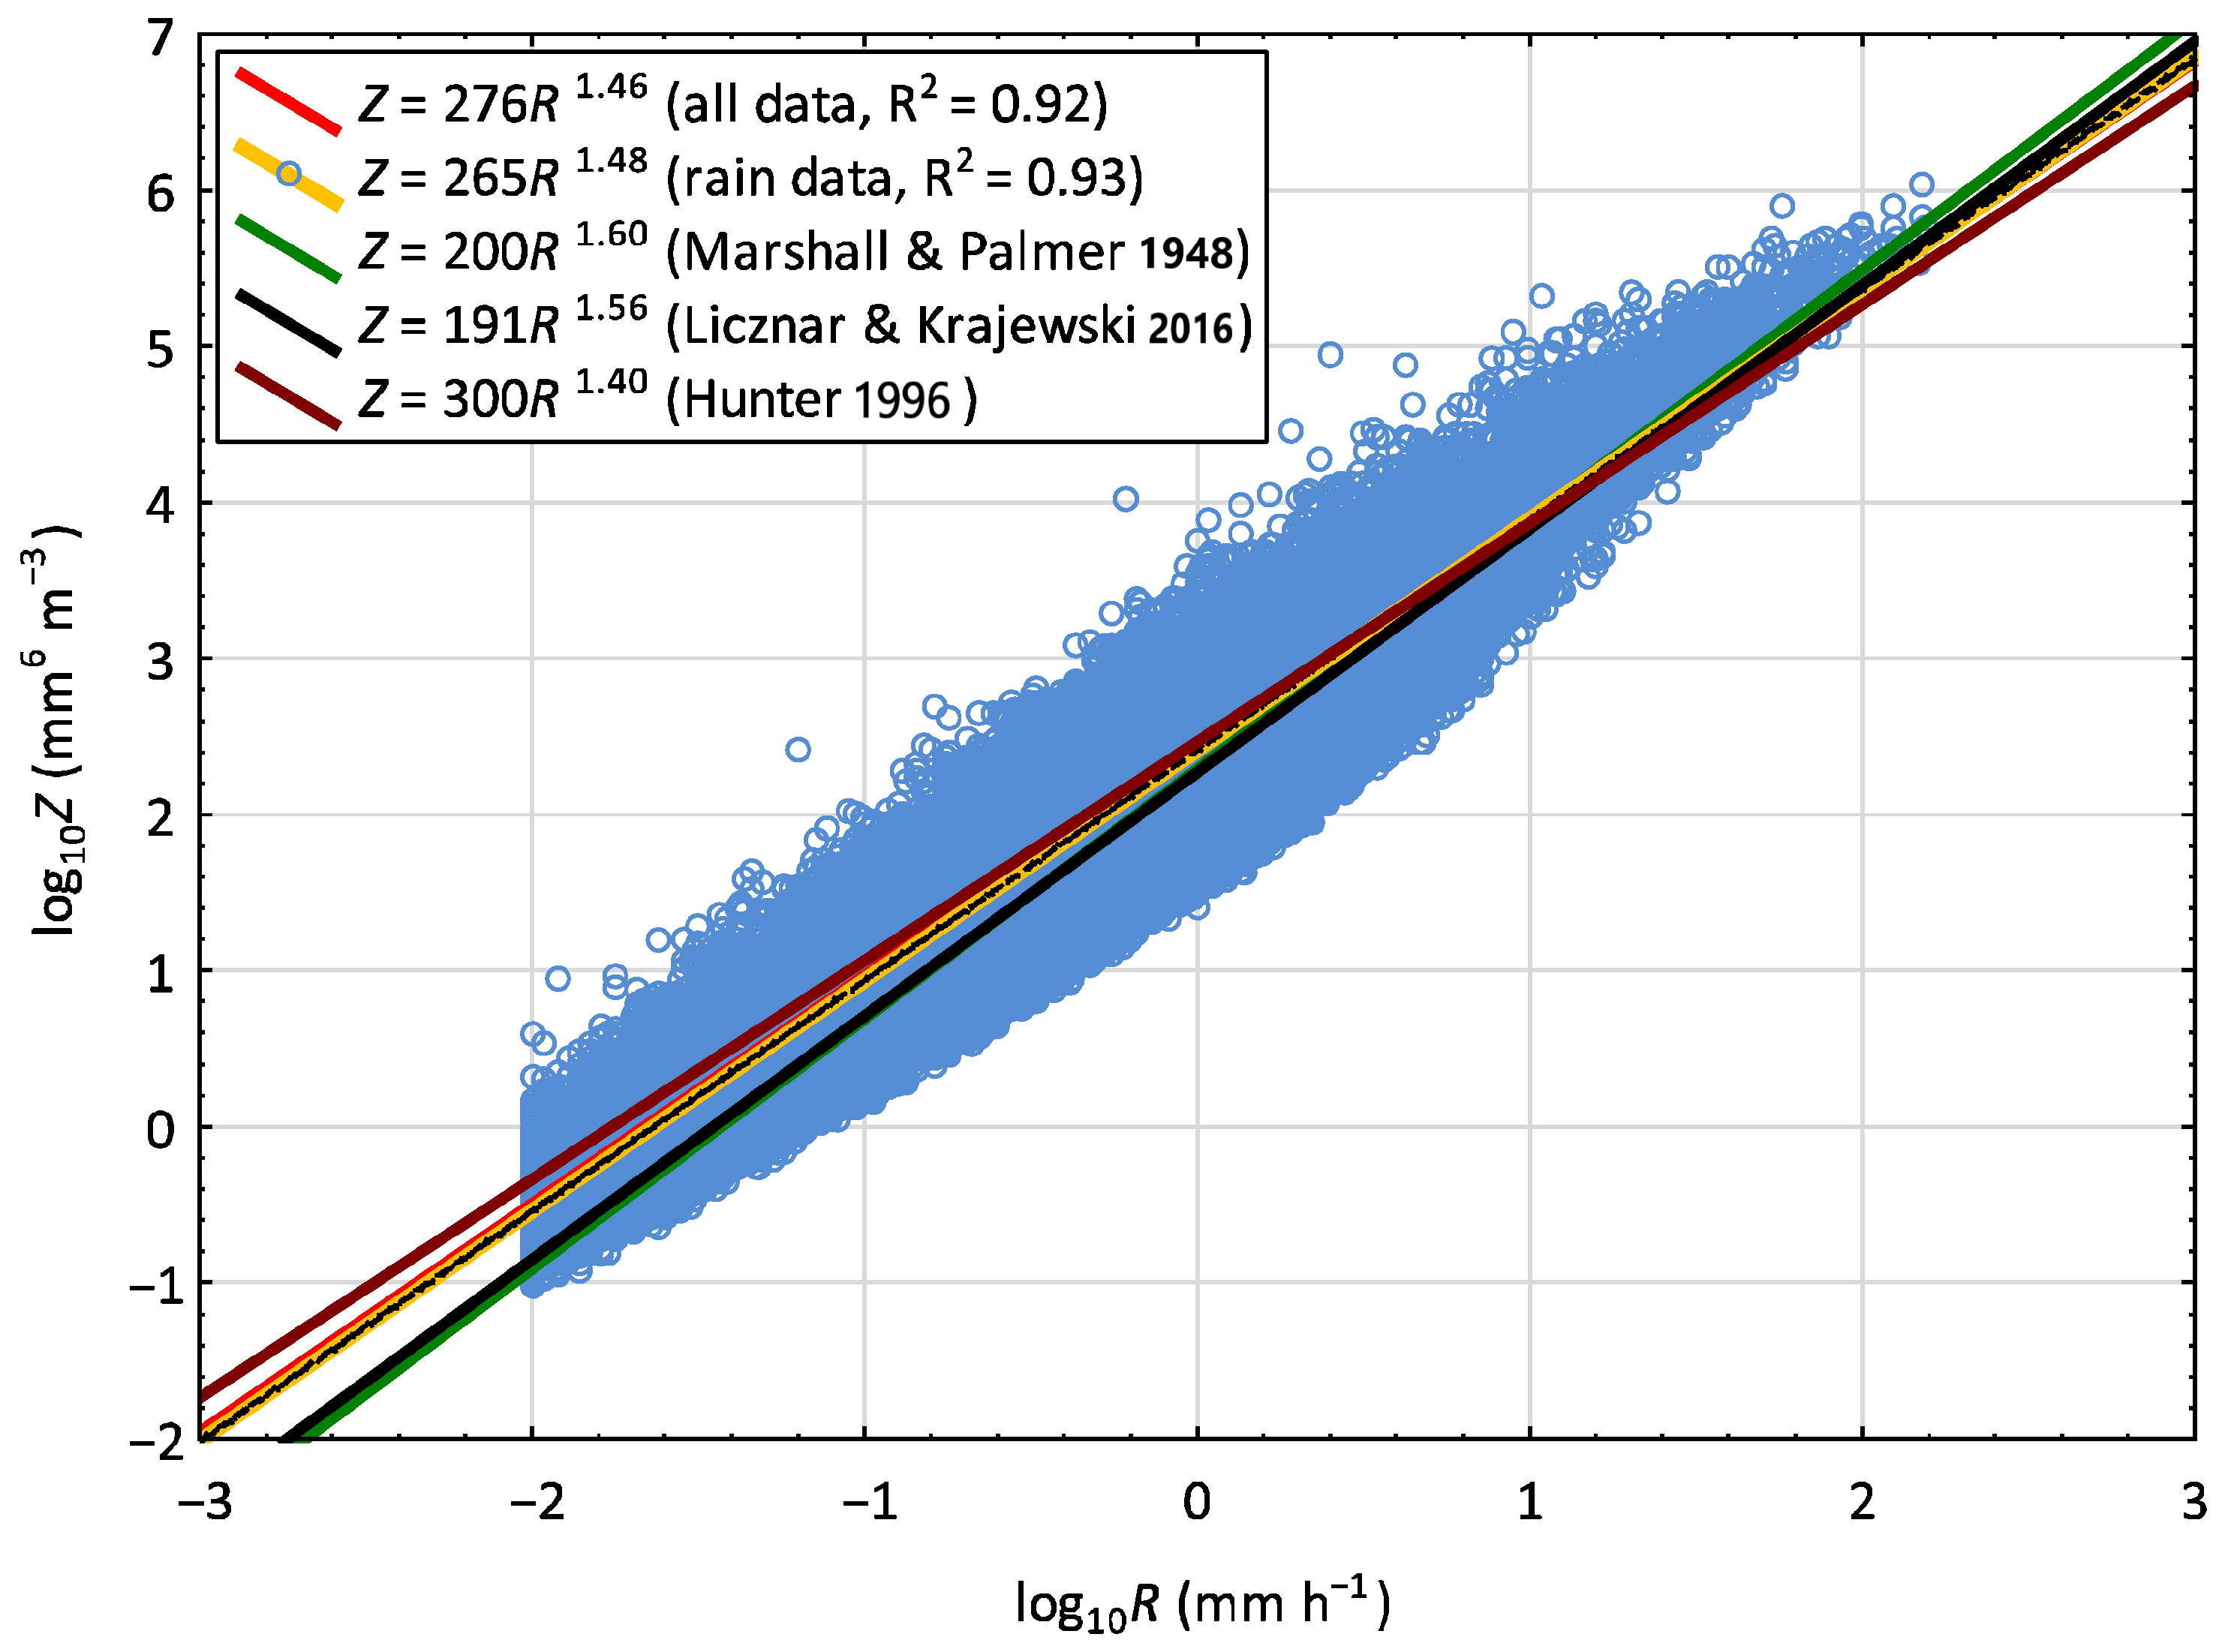
However, in the present study limited to rain events only, the determined Z–R relationship was Z = 265R1.48, with parameters very similar to both the Z–R relationship for the entire dataset (see Table 3 and Figure 2) and the one developed by the author in a previous study based on a significantly shorter observation period, Z = 285R1.47 [42]. The slight differences in parameter values are due to the predominance of rain-type precipitation in the measurement dataset, which accounts for 88.9% of all data.
In another study conducted in Warsaw, using data from the OTT Parsivel2 disdrometer recorded over approximately two years (from 13 December 2012 to 30 November 2014), Licznar and Krajewski [9] obtained the relationship Z = 191R1.56 (included in Figure 2 as a linear model). Similarly, Licznar and Siekanowicz-Grochowina [41], in a study conducted in Warsaw, obtained the Z–R relationship Z = 170R1.35. It should be noted that in this case, the authors used observational data from 2013 only, applying a minimum rain rate threshold of Rmin ≥ 0.004 mm h−1. Thus, the discrepancies observed in the values of the parameter a may be due, inter alia, to differences in dataset sizes and different observation periods used in the compared studies. The present study covered the longest observation period: 2012–2014 and 2019–2025.
The multiplier value a = 265 in the Z–R relationship for rainfall showed a deviation from the reference value in the classical relationship for convective rainfall, Z = 300R1.4, proposed by Hunter [55] and discussed in various studies [56,57,58,59]. In the case of the Warsaw study, the parameter a also deviated from the relationship established by Marshall and Palmer [60], Z = 200R1.6, which is commonly used to convert radar reflectivity into precipitation intensity in operational systems, including the Polish POLRAD radar network [8]. It should be noted that the Marshall–Palmer relationship is recommended for stratiform precipitation [57]. The dataset used in the present study included both stratiform and convective events, which led to the averaging of the Z–R relationship parameters.

Figure 2.
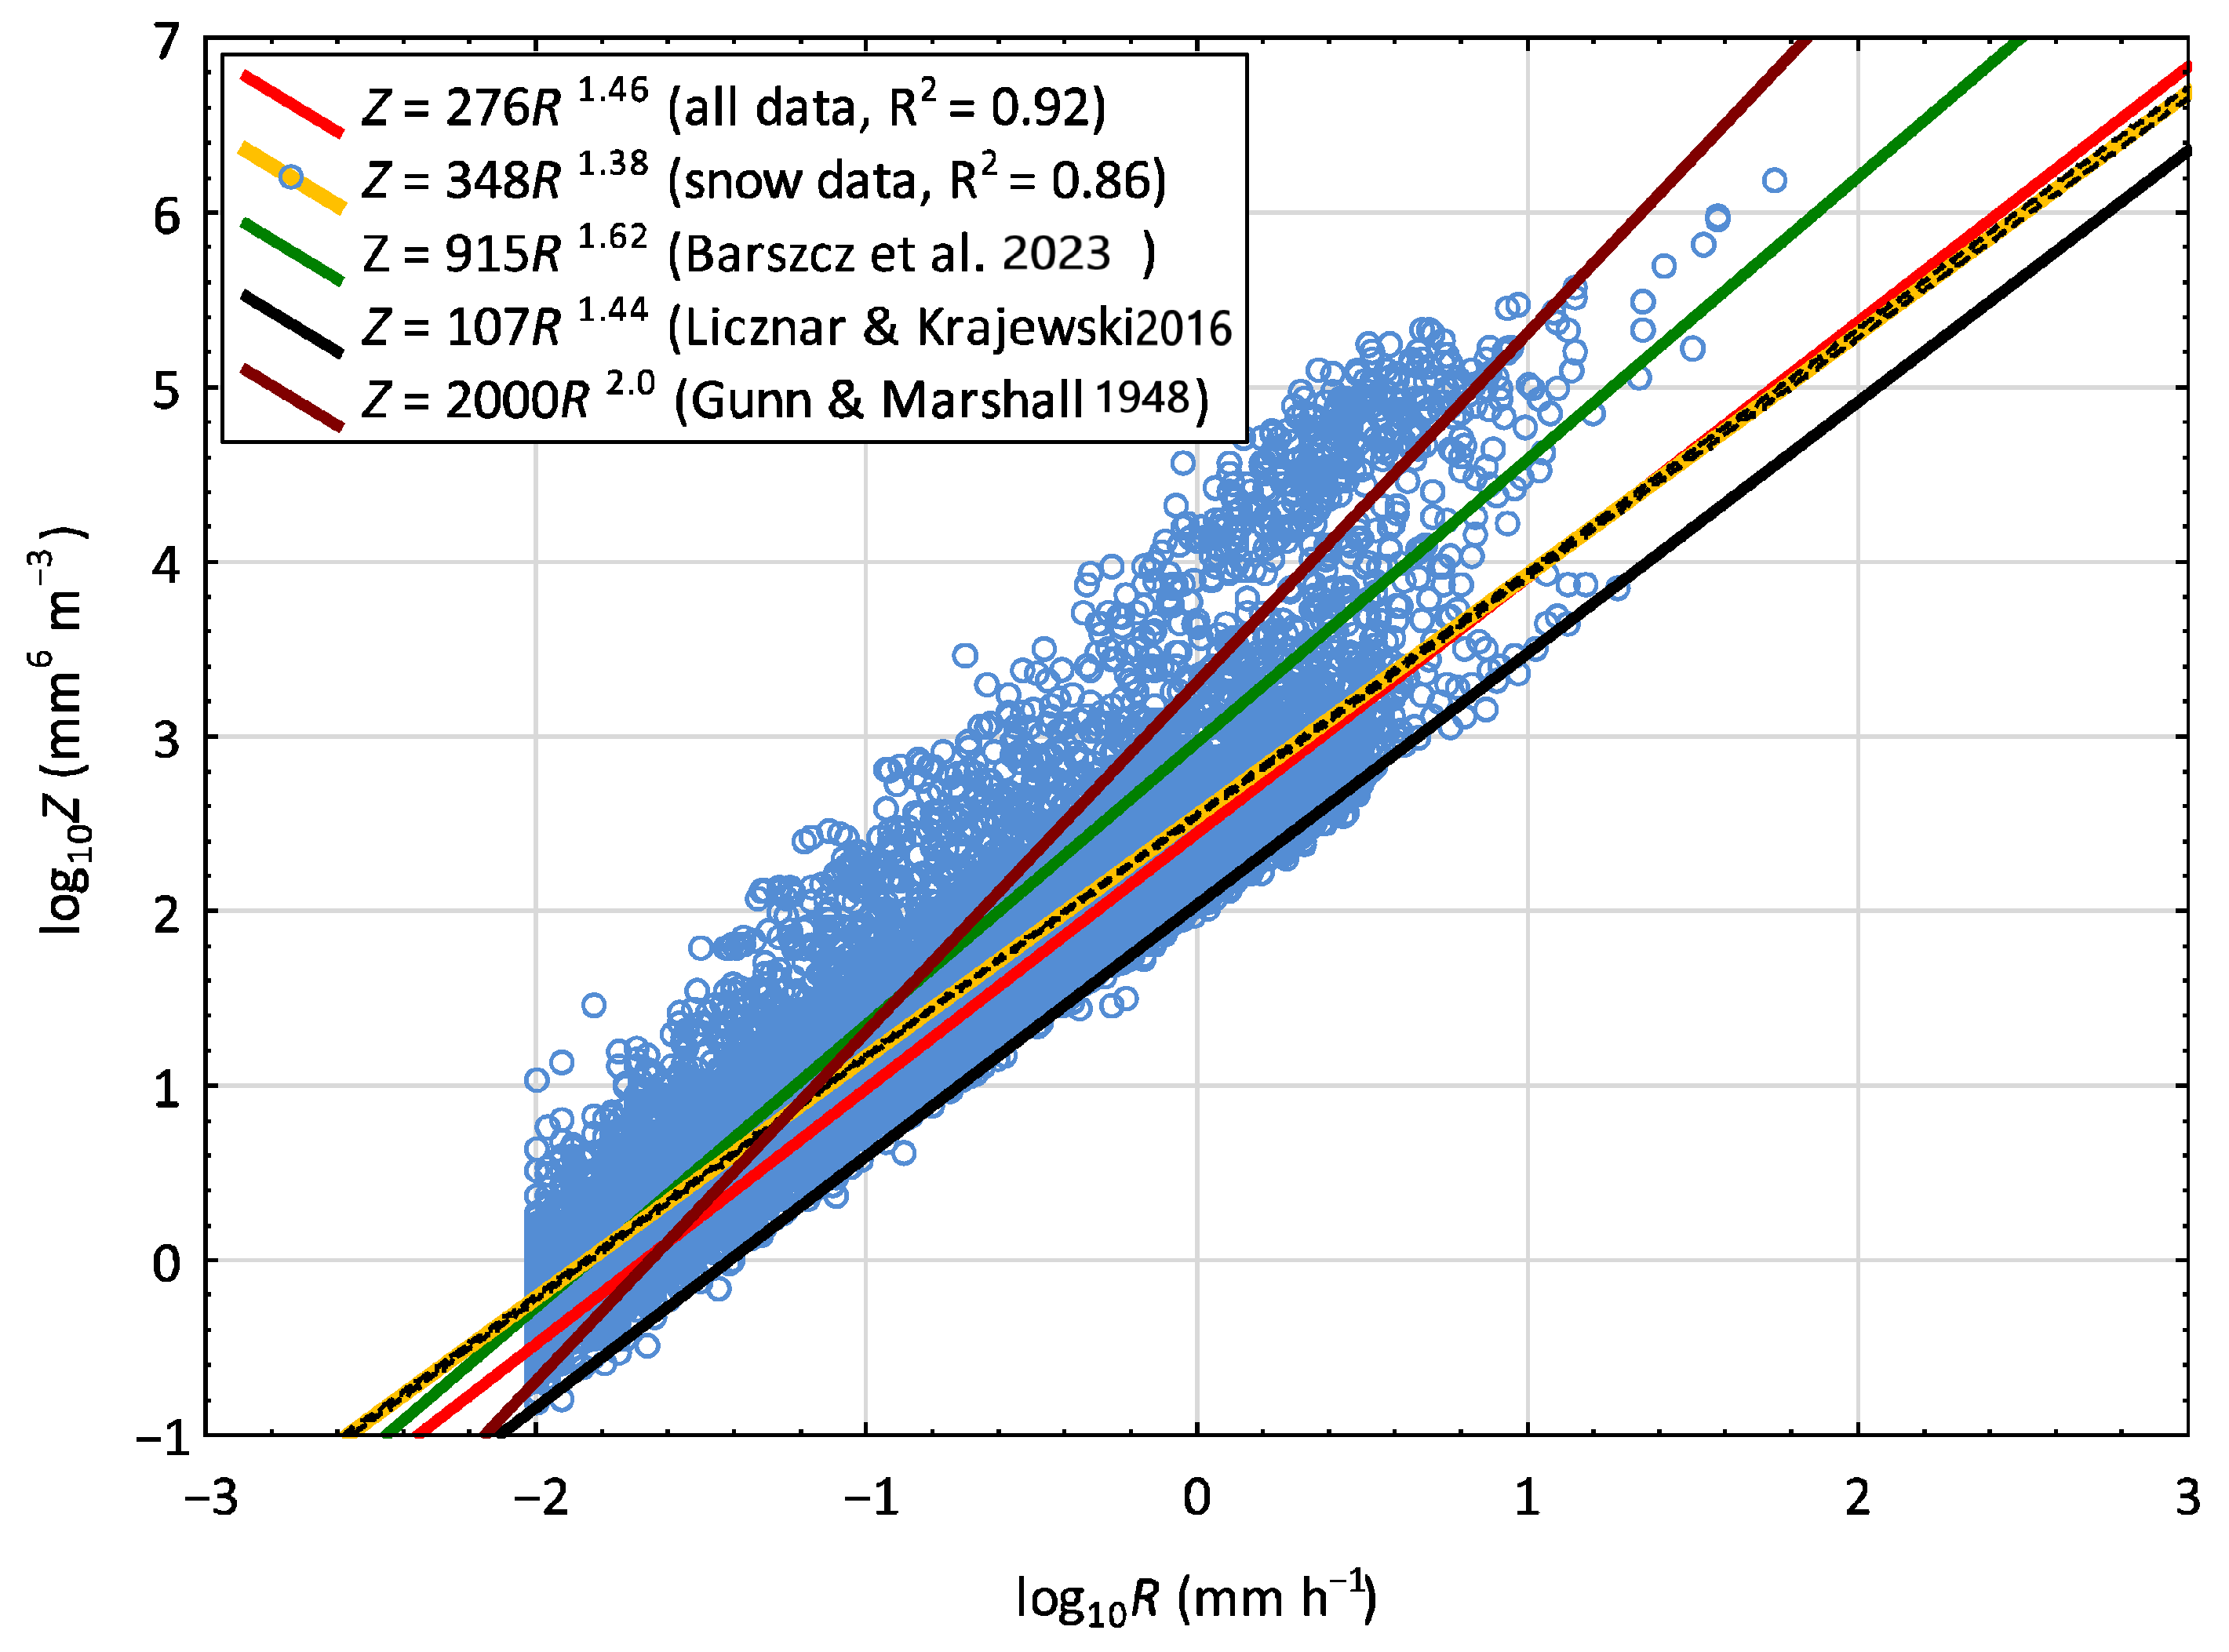
Z–R relationships for all data and for rain events only are indicated by the red and orange lines, respectively. Observational data of reflectivity and rainfall intensity are shown as blue points; lines in other colors represent Z–R relationships developed by other authors [9,55,60].
Figure 2.
Z–R relationships for all data and for rain events only are indicated by the red and orange lines, respectively. Observational data of reflectivity and rainfall intensity are shown as blue points; lines in other colors represent Z–R relationships developed by other authors [9,55,60].
Subsequently, the study involved determining the Z–R relationships based on two separate subsets of data, representing the next categories of precipitation types: sleet (rain with snow) and snow, which accounted for 1.9% and 9.2% of the total dataset, respectively. The values of the parameter a in the Z–R relationships for these precipitation types, a = 597 and a = 348 (Figure 3 and Figure 4), respectively, were significantly higher than the value obtained for the rain data alone (a = 265). In contrast, the values of the parameter b were close to those in the rain model (Table 3).
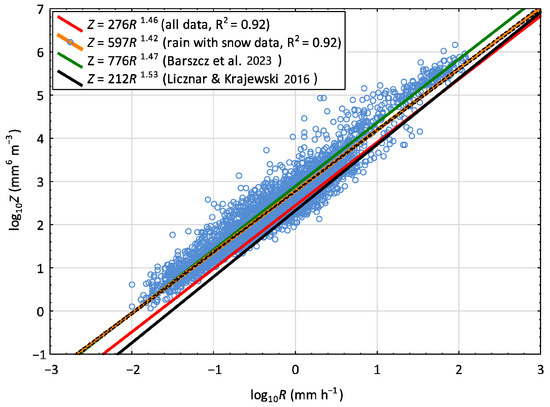
Figure 3.
The Z–R relationship for rain with snow is depicted by the orange line, while models determined for all data and those from other studies are shown as additional lines [9,42].
Figure 3.
The Z–R relationship for rain with snow is depicted by the orange line, while models determined for all data and those from other studies are shown as additional lines [9,42].
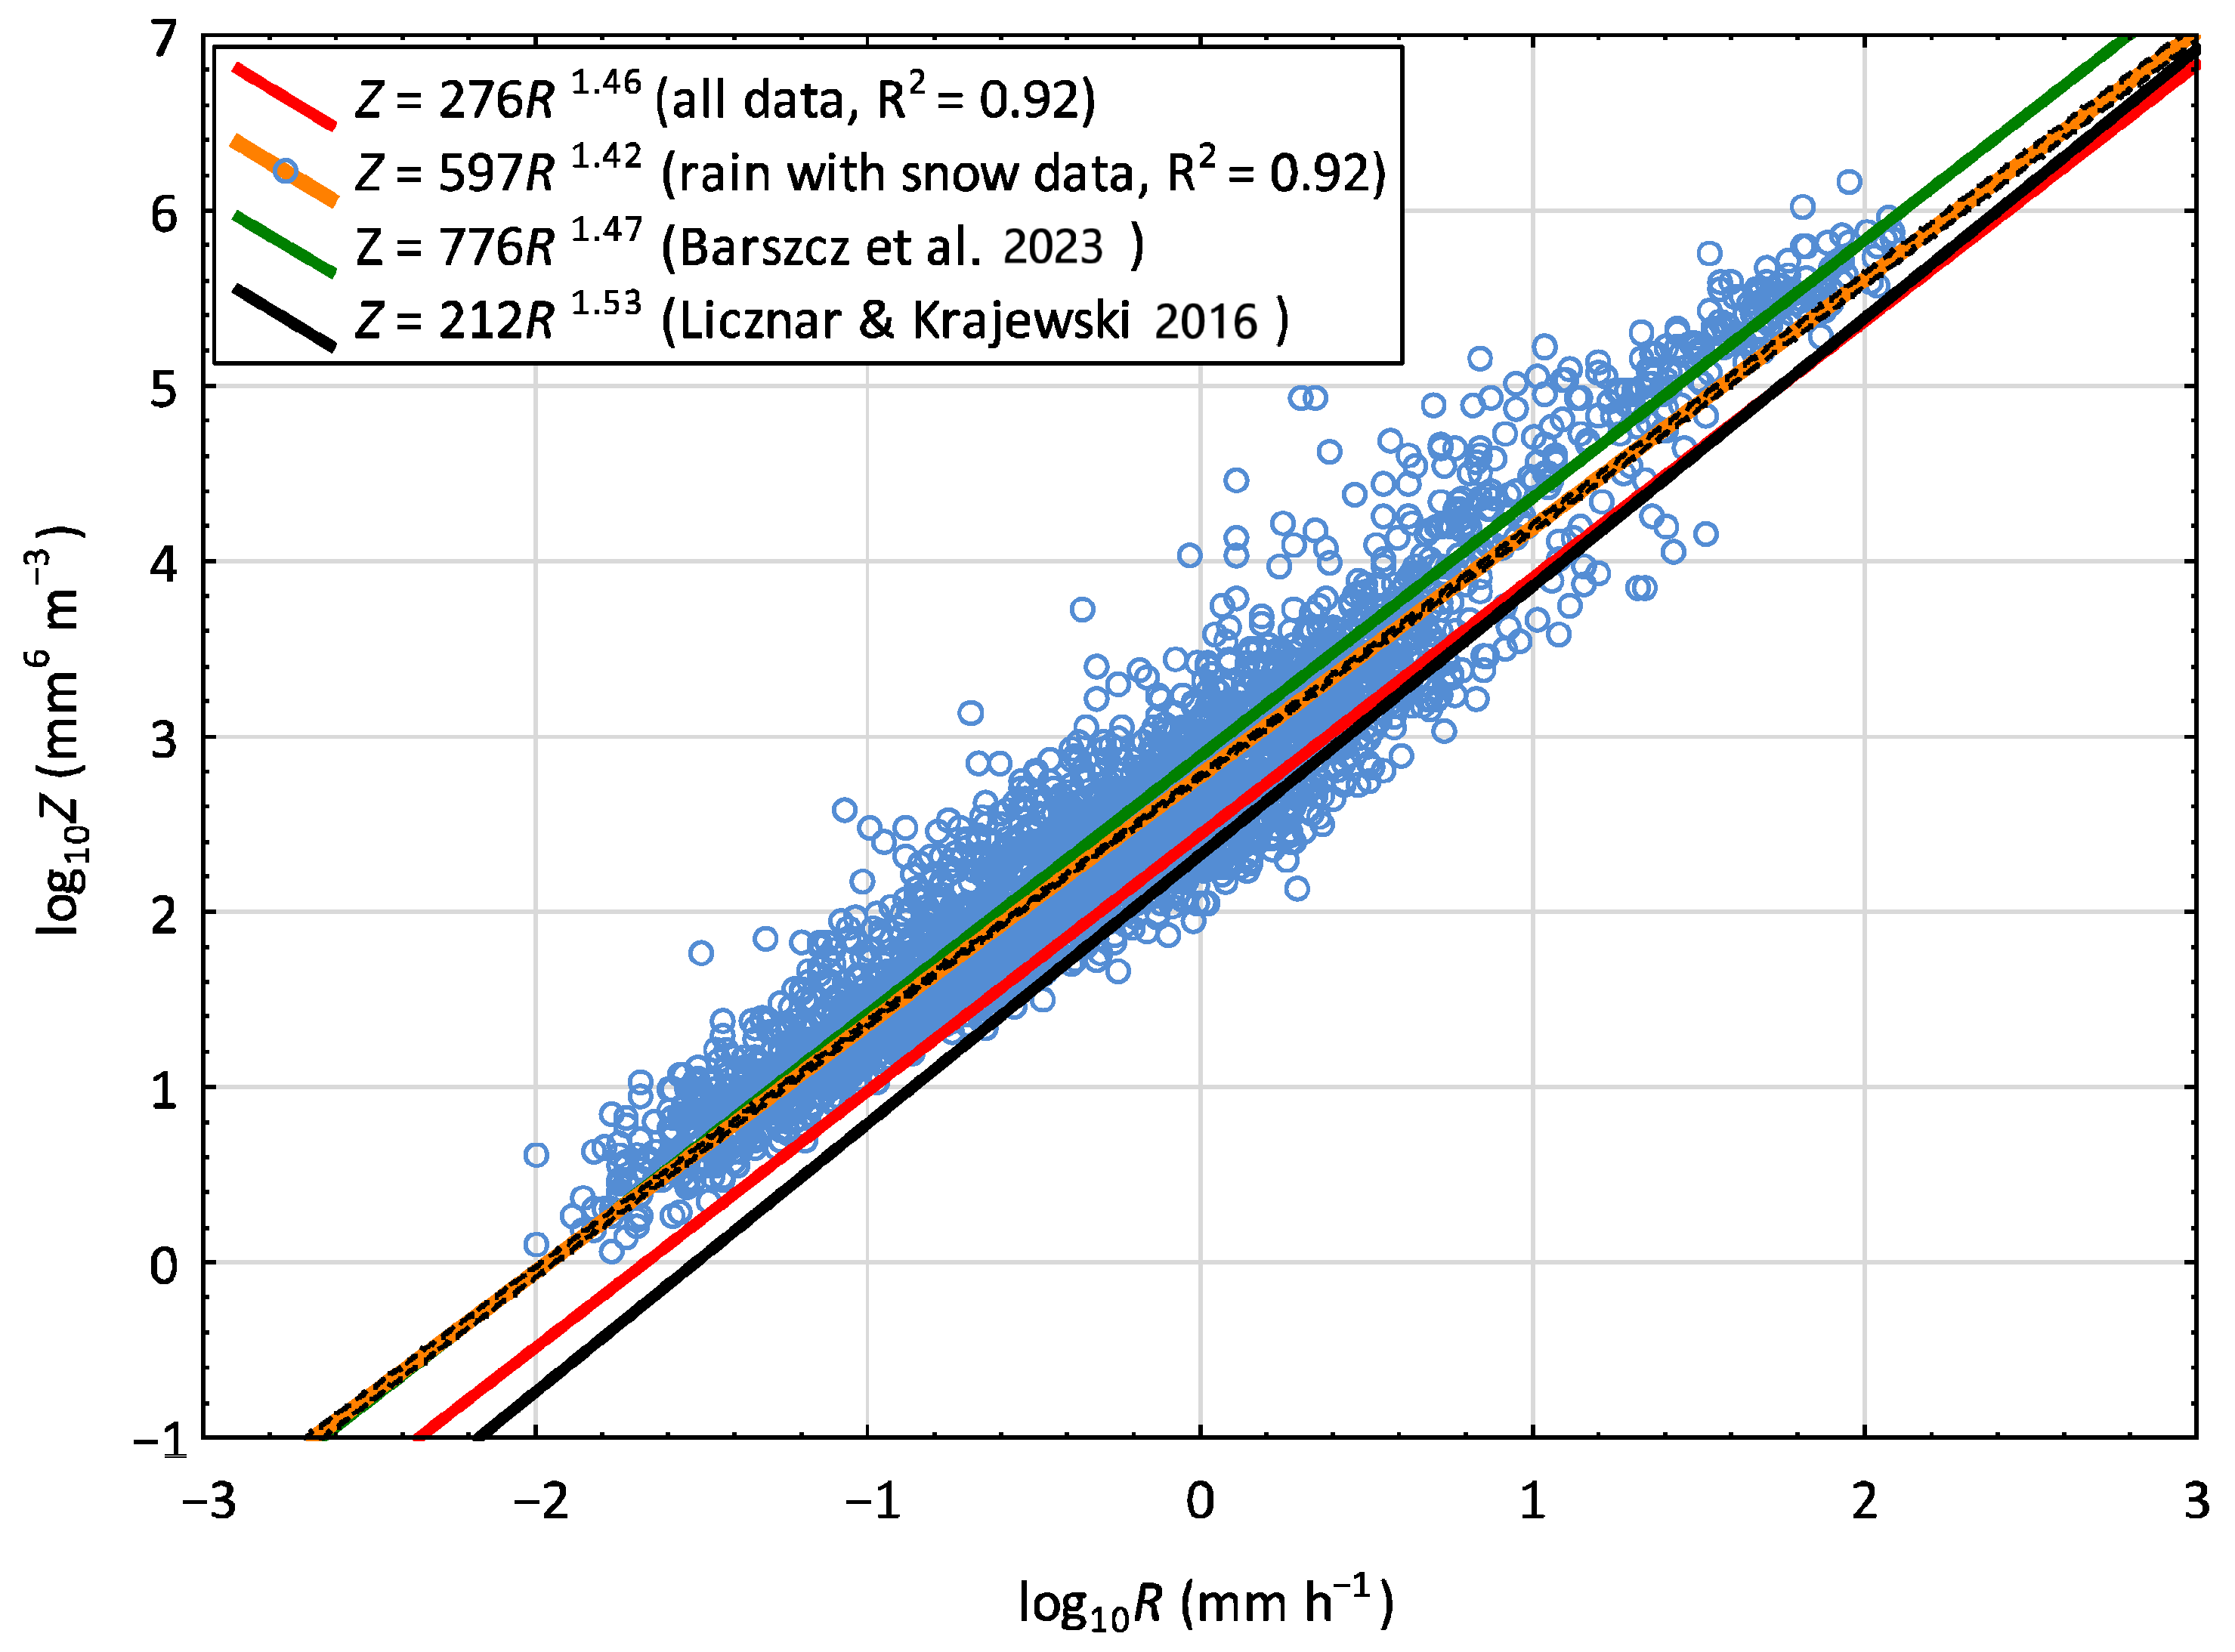
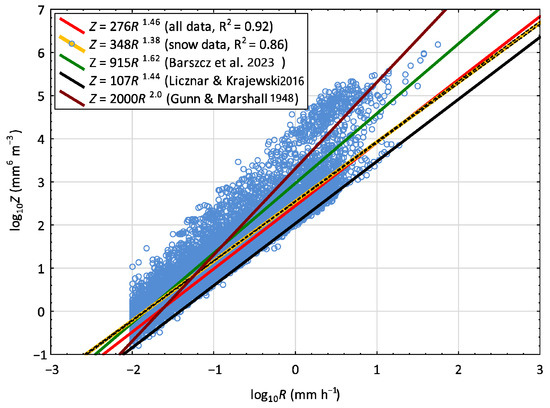
Figure 4.
The Z–R relationship for snow is represented by the orange line. For comparison, models developed in other studies are also shown [9,42,60].
Figure 4.
The Z–R relationship for snow is represented by the orange line. For comparison, models developed in other studies are also shown [9,42,60].
In turn, the values of the parameter a for the two precipitation types under discussion differed significantly from those reported in another study by the author—a = 776 for sleet and a = 914 for snow, as presented in [42]. It is important to note that in the previous study, the author used data from a shorter observation period (2012–2014 and 2019–2020). Moreover, the data included only months representing three seasons: spring, summer, and autumn.
In the case of the parameter a of the Z–R relationship, a significant deviation was also observed when compared to the results of another study conducted in Warsaw [9]. The authors of that study found values: a = 212 for sleet and a = 107 for snow. As reported in [8], the relationship Z = 2000R2.0 with parameters proposed by Gunn and Marshall [61] is quite commonly used in the process of generating radar imagery for snowfall. A comparison of the parameter values of this relationship with those determined in the present study based on snow data (Z = 348R1.38) revealed substantial discrepancies between the corresponding parameters.
It appears that no other data from Poland are available in the literature. Given the limited number of studies conducted in Central Europe, as well as the discrepancies in the parameter values (particularly the parameter a) of the Z–R relationship described in this paper based on studies by various authors, further research in this area is advisable.
3.2. Z–R Relationships for Individual Precipitation Events
According to the state of knowledge presented in the introduction, the relationship between radar reflectivity Z and precipitation intensity R depends on multiple factors, such as geographical location, precipitation type, and atmospheric conditions [59], which lead to considerable variability in the Z–R relationship across both time and space. To characterize its temporal variability, the parameters of the Z–R relationship (Equation (3)) were analyzed for 118 individual precipitation events recorded over a selected 12-month period in Warsaw using the Parsivel1 laser disdrometer. Information regarding the division of the dataset into individual events is provided in Section 2.1.
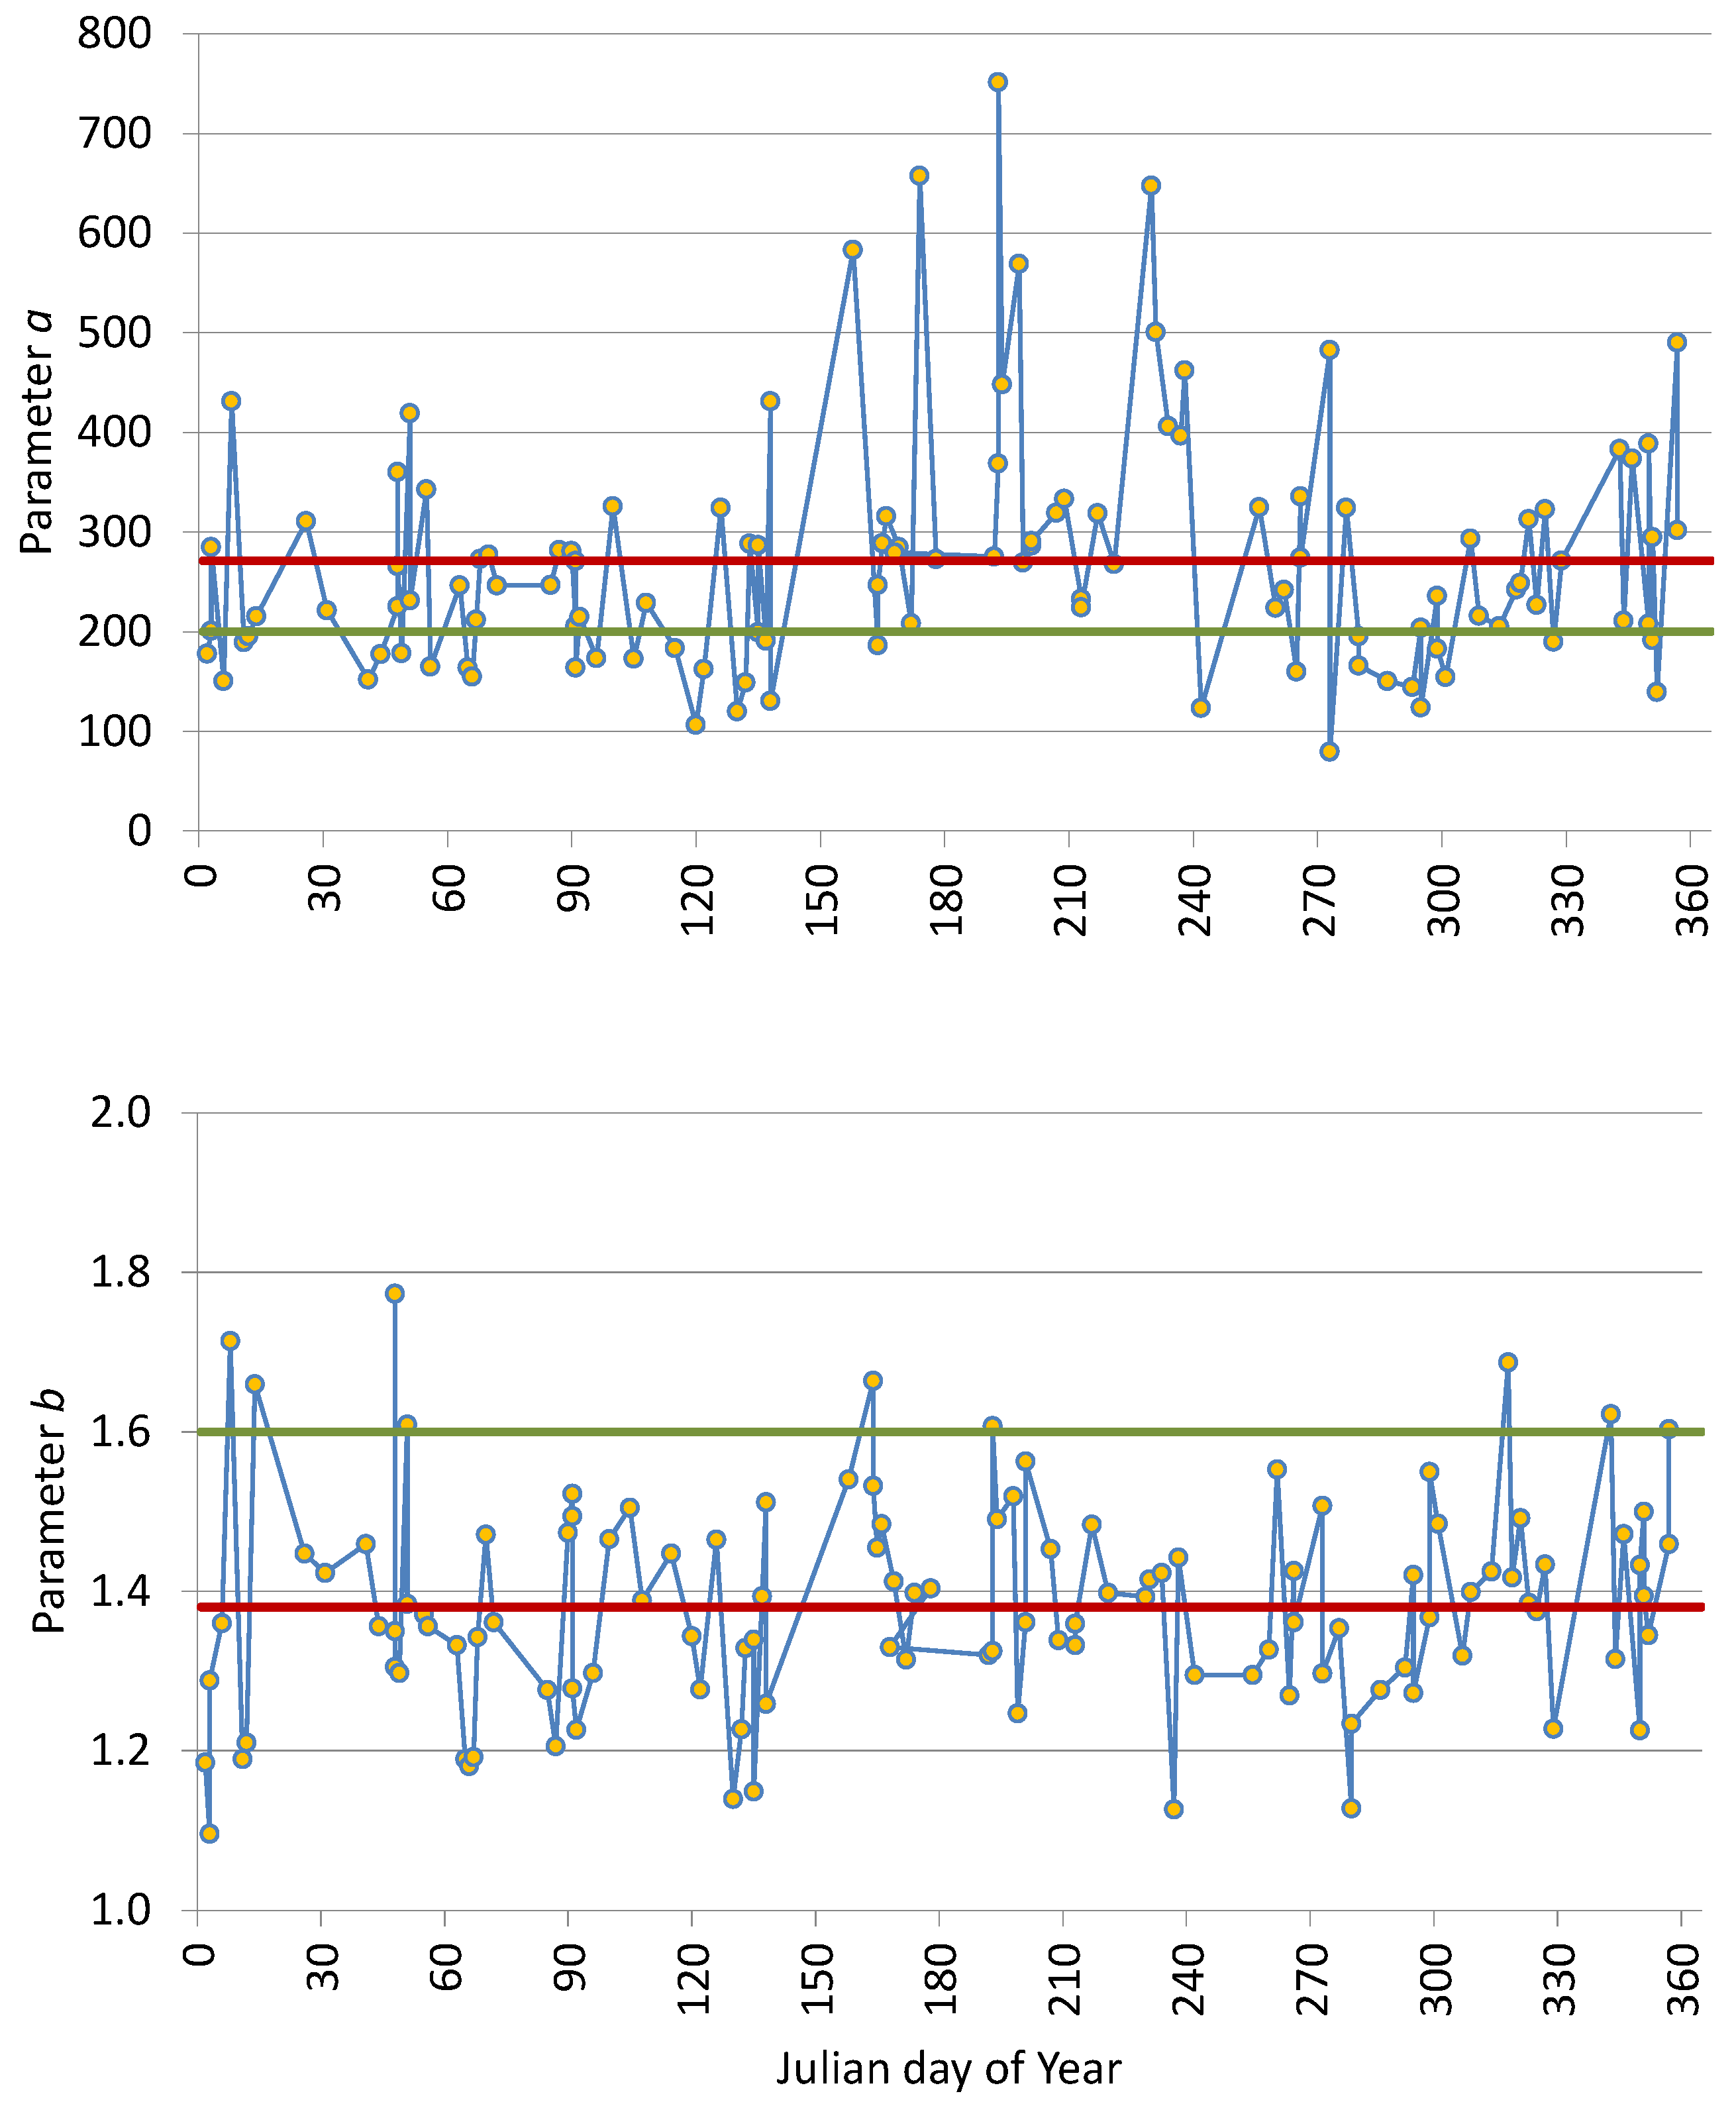
The values of the parameter a in the Z–R relationship were characterized by high variability for individual events, ranging from 79.64 to 751.22 (Table 4). The mean and median values of the parameter a, calculated from its unit values for all events, were 271 and 247, respectively. The resulting set of parameter a values for all events (N = 118) is shown in Figure 5, where the Julian day is used on the X-axis to provide a temporal reference. For comparative purposes, the figure also includes horizontal lines representing the average value of this parameter (a = 271) and that determined by Marshall and Palmer (a = 200), which is used in the process of generating radar images within the Polish POLRAD system. The parameter b, on the other hand, exhibited a more predictable range of values (Figure 5), which ranged from 1.10 to 1.77, with mean and median values of 1.38 and 1.37, respectively.
Table 4.
Monthly values of the parameters a and b of the Z–R relationship for individual events.
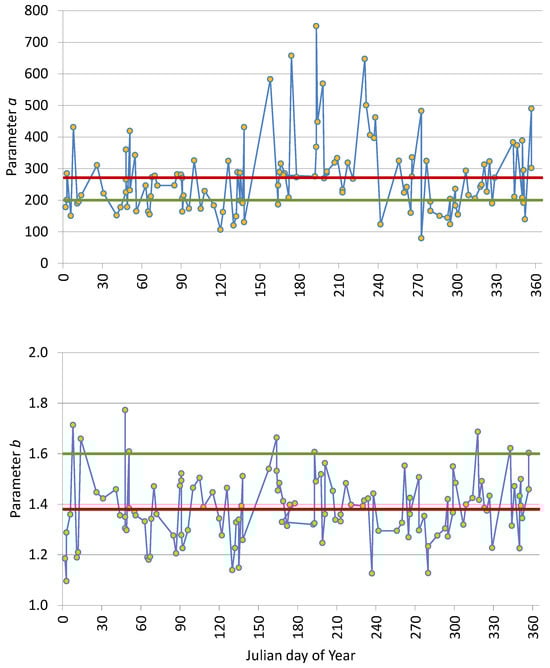
Figure 5.
Values of the parameters a and b of the Z–R relationship for individual precipitation events (points). Horizontal red and green lines represent the mean values estimated in this study and the reference values proposed by Marshall and Palmer, respectively.
The variability in the Z–R relationship between successive rainfall events is relatively well documented in the international literature. Baltas et al. [17] conducted a study using data for eleven heavy precipitation events (threshold values of intensity R > 5.0 mm h−1 and total precipitation p > 24 mm were assumed), recorded with a disdrometer located in Athens (Greece). They obtained values of the parameter a ranging from 217 to 455, while the parameter b ranged from 1.36 to 1.52. These results indicate that the ranges of variability for the parameters a and b of the Z–R relationship are narrower than those observed in the current study. This discrepancy can be attributed to the fact that in the case of the Warsaw study, low-intensity precipitation events meeting the criterion Rmin ≥ 0.01 mm h−1 were also used for the estimation of the Z–R relationship parameters. In contrast, another study conducted by Conti et al. [16], based on 170 events recorded in the urban area of Palermo (Italy), showed a relatively wider range of variability in the parameters a and b. Maximum values were approximately a = 3000 and b = 3.
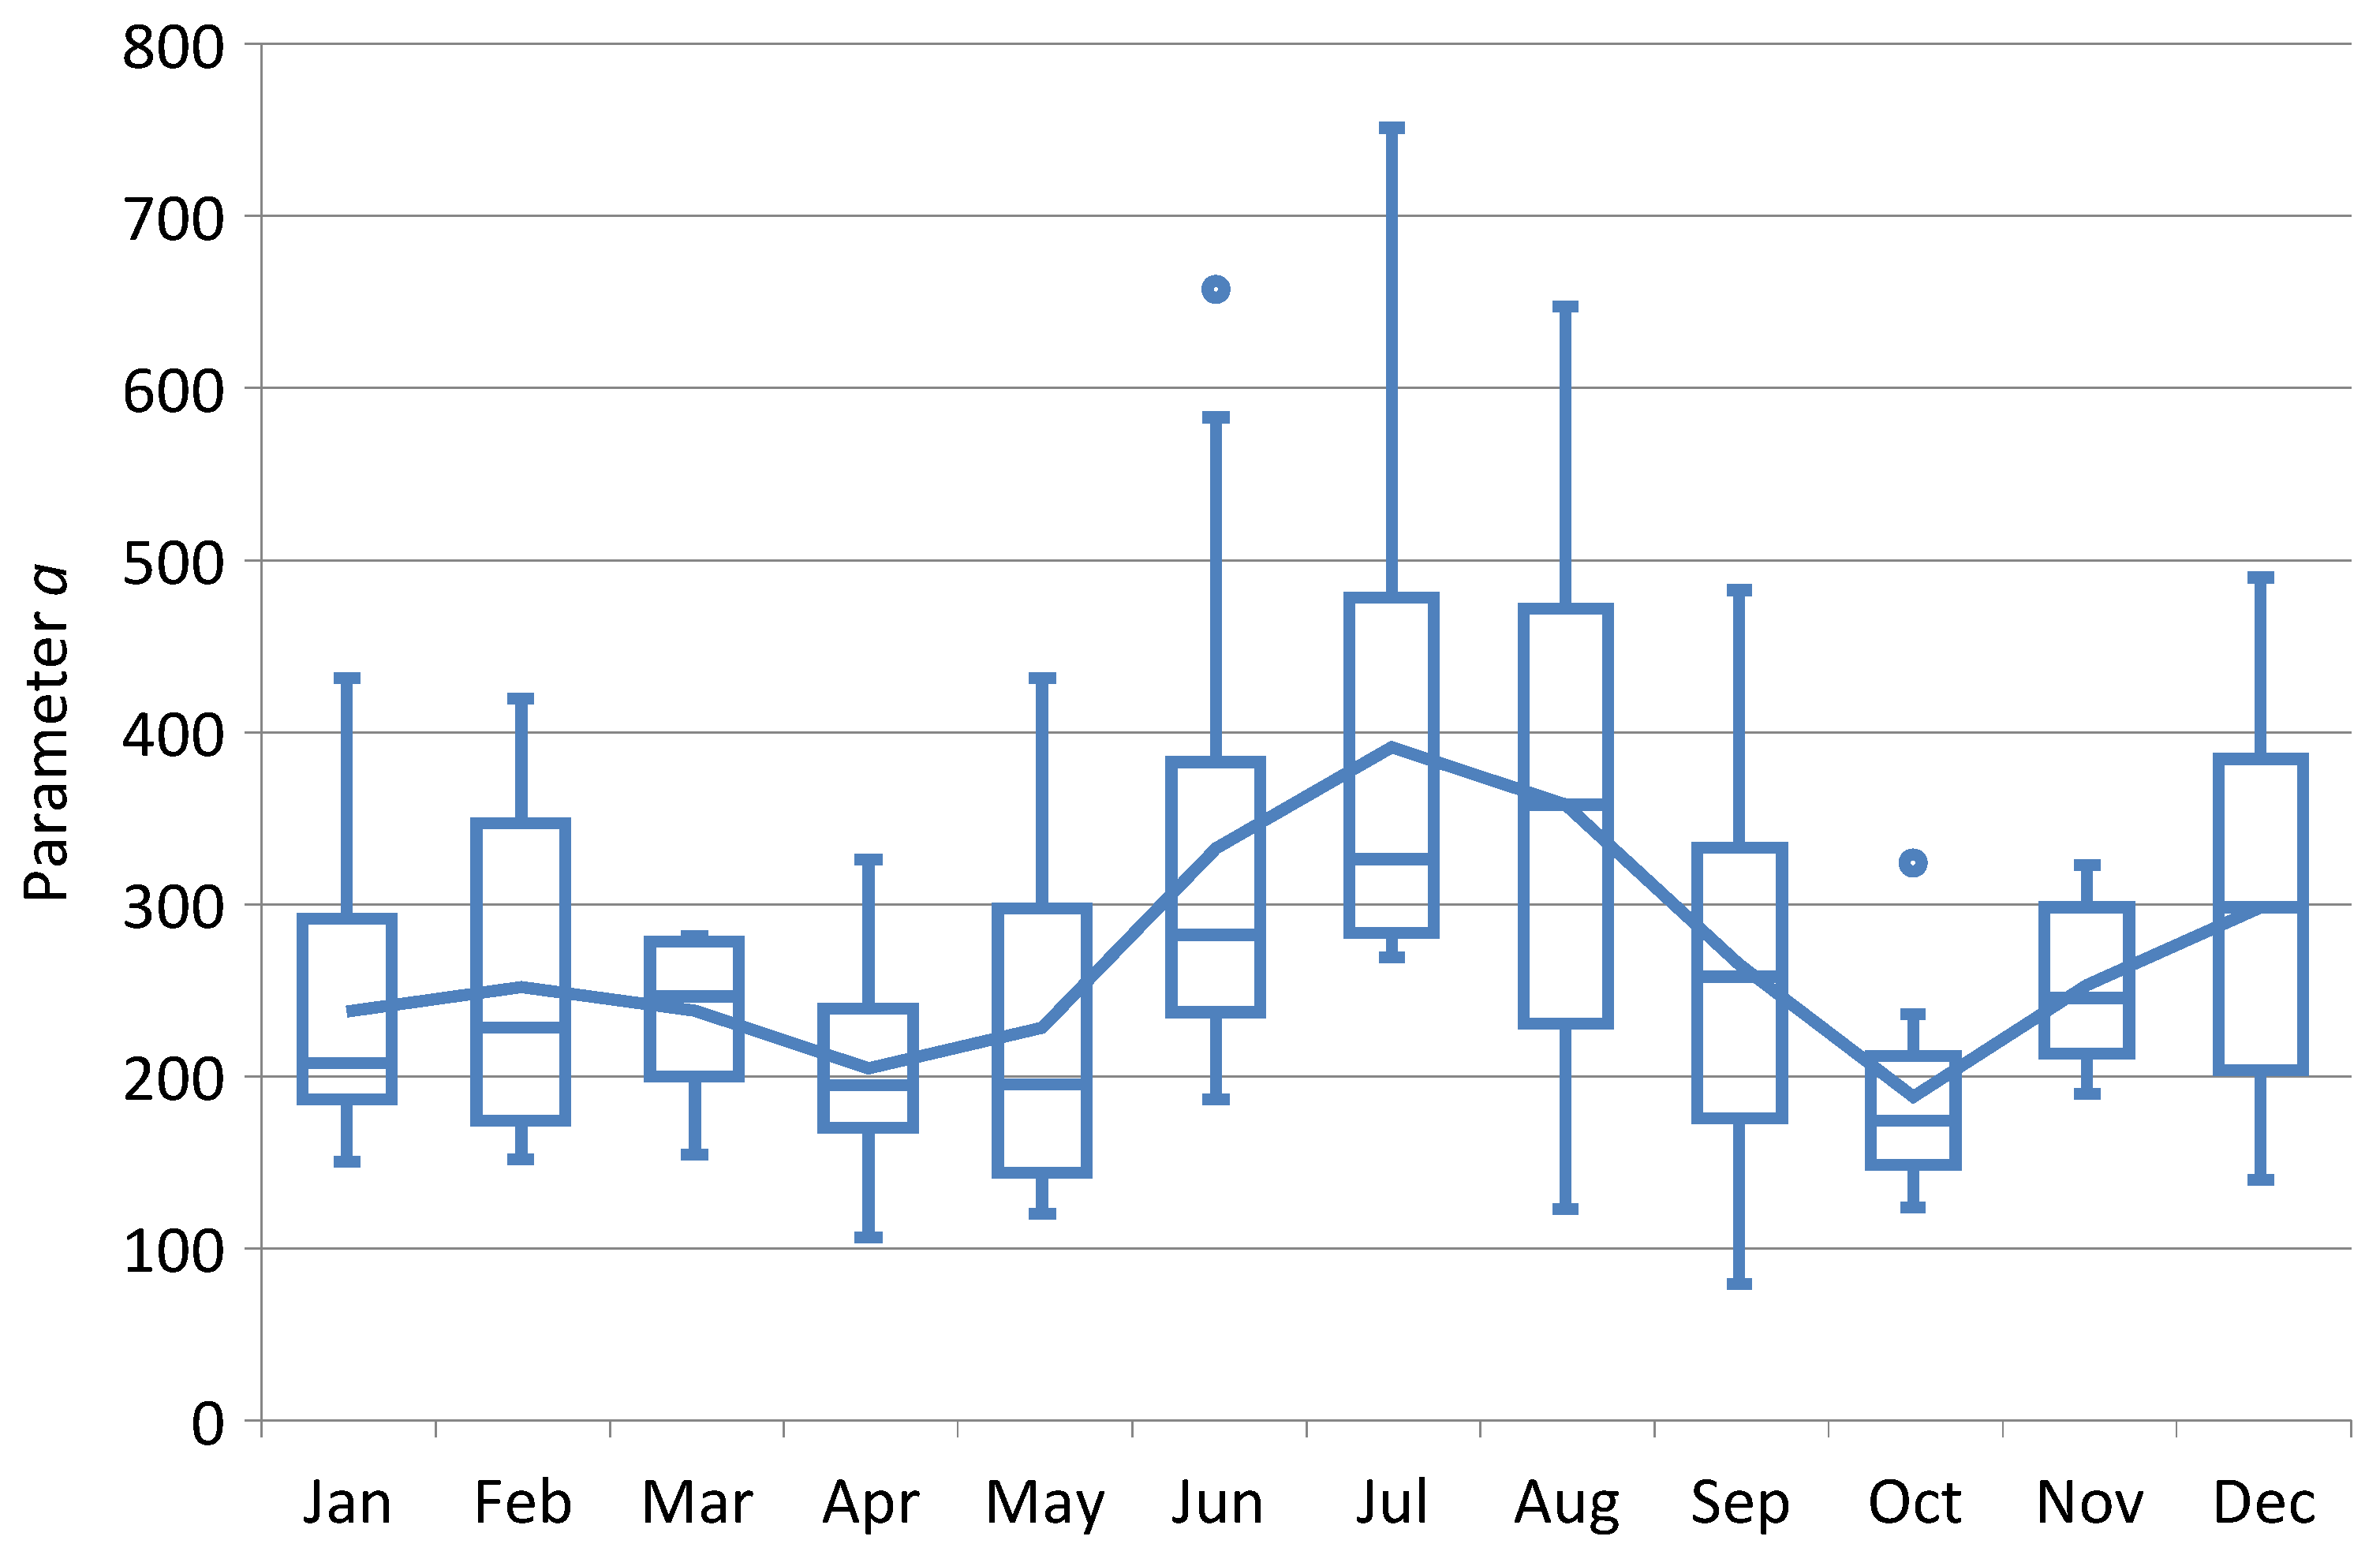
In this study, the values of the parameters a and b of the Z–R relationship for individual events were further grouped into sets for each month over an annual cycle, and basic statistical measures for each month were subsequently calculated (Table 4). The resulting datasets are presented in Figure 6. A wide range of variation in the values of the parameter a was observed across all twelve months. The largest individual values of the parameter a were recorded in June, July, and August. These months were also characterized by the highest mean and median values of the parameter a, which were calculated based on individual event values within each month. The occurrence of the highest values of the described parameter during the summer months is as expected, as this period is associated with frequent convective precipitation. When rainfall is more convective in nature, where hydrometeor sizes (also radar reflectivity values) are higher compared to the stratiform type, the coefficient a tends to achieve higher values [17]. In contrast, the distributions of the parameter b values showed no clear trend over the year, either in terms of mean or the range of variability.

Figure 6.
Monthly distributions of the parameter a of the Z–R relationship, showing the median, 25th and 75th percentiles, as well as the most extreme values.
Empirical observations by various researchers [24,54,62,63] have shown that values of the parameter a tend to increase in convective precipitation, while showing the opposite direction of change for stratiform (frontal) precipitation. The current study revealed a wide range of parameter a values for precipitation events, indicating the potential for further research into the temporal variability in this parameter in the context of varying meteorological conditions, such as those associated with stratiform and convective precipitation.
As mentioned earlier, there are many factors that influence the parameters of the Z–R relationship. Many researchers have attempted to express these parameters as functions of precipitation droplet size distributions or various meteorological conditions. However, providing a physical interpretation of the observed changes in the values of the parameters a and b remains very challenging [41]. According to Baltas et al. [17], the parameter a is determined by the shape of the overall droplet size distribution and by its sixth moment (radar reflectivity factor), and therefore, higher values of a are associated with higher values of radar reflectivity.
Based on this rationale, the present study sought to correlate the values of the parameter a for individual events (N = 118) with the mean, median, or maximum values of reflectivity Z (in units of dBZ), calculated at a 1 min resolution for relevant events. The highest correlation coefficient was obtained for the relationship between the parameter a and mean reflectivity.
The correlation presented in Figure 7 shows a general increasing trend—higher reflectivity values correspond to higher values of the parameter a. As demonstrated in this study, the a parameter of the Z–R relationship exhibits considerable variability, which contributed to a moderate coefficient of determination (R2 = 0.21), despite a statistically significant correlation (R = 0.46). These findings reflect the complexity of the physical interpretation of the parameter a and indicate the need for further research that accounts for diverse meteorological conditions (such as convective and stratiform precipitation) and the microstructure of precipitation.
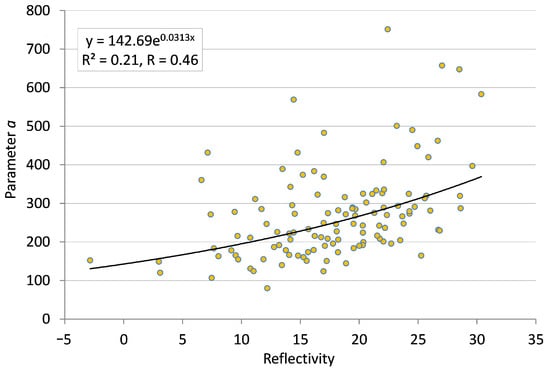
Figure 7.
The parameter a of the Z–R relationship plotted against mean reflectivity values for individual precipitation events.
4. Conclusions
In this study, the Z–R relationships (the parameters a and b in Equation (3)) were determined separately for different precipitation types (rain, rain with snow, and snow), and subsequently for each of the 118 individual events. The dataset used was recorded by the OTT Parsivel1 disdrometer in Warsaw, Poland, during the periods 2012–2014 and 2019–2025. Observational data for individual events were extracted from this dataset over a selected 12-month period that included all months of the annual cycle. The conducted research enabled the formulation of several conclusions:
- In a study including rain events only, a Z–R relationship of the form Z = 265R1.48 was obtained, with parameters very similar to those of the relationship derived for the entire dataset, Z = 276R1.46. The slight differences in their parameter values are due to the predominance of rain-type events (88.9%) in the dataset. The estimated values of the parameters a and b showed relatively small deviations from the corresponding values in the classical function for convective-type rainfall, Z = 300R1.4 [55]. However, the value of the parameter a obtained in this study for Warsaw differed from the Z–R relationship determined by Marshall and Palmer [60], Z = 200R1.6, which is used to convert radar reflectivity into total precipitation in, among others, the Polish POLRAD radar system. It should be noted that the Marshall–Palmer relationship is above all recommended for stratiform precipitation. The data used in the present study included rainfall of varying character, both stratiform and convective, which led to an averaging of Z–R relationship parameters. In the case of the parameter a, a significant deviation was also observed compared to the results obtained in the Warsaw area by other researchers: a = 170 [41] and a = 191 [9]. However, the data used in those studies covered relatively shorter observation periods.
- The values of the parameter a in the Z–R relationship for the other two types of precipitation, a = 597 for sleet (rain with snow) and a = 348 for snow, were significantly higher than the value determined for rain data alone. Moreover, they differed significantly from the corresponding values of the parameter a reported in previous studies conducted in the Warsaw area [9,42]. It should be noted that the observational data for the listed precipitation types together represented only 11.1% of the entire measurement dataset. Therefore, further research in this area is warranted, which will be conducted using a more extensive dataset.
- The differences observed in this study between the values of the parameter a for data representing three distinct groups of precipitation types indicate the need to include Z–R relationships tailored to specific precipitation types in the radar data processing procedure.
- The values of the parameter a in the Z–R relationship were characterized by high variability for the 118 individual events, ranging from 80 to 751. The mean and median values of this parameter were 271 and 247, respectively. In contrast, the values of the parameter b represented a more predictable range of values, from 1.10 to 1.77 (with a median of b = 1.37).
- The highest unit values of the parameter a, as well as its highest mean and median values, were recorded in June, July, and August. The occurrence of these maximum statistical values in the summer months is as expected, as this period is particularly associated with convective rainfall. The presented results for the parameter a highlight the need for further research into its temporal variability under different meteorological conditions, such as those associated with the occurrence of stratiform and convective precipitation.
- A moderate correlation (the correlation coefficient, R = 0.46) was found between the unit values of the parameter a in the Z–R relationship and the mean reflectivity for 118 individual rainfall events.
Author Contributions
Conceptualization, M.P.B.; methodology, M.P.B.; software, M.P.B.; validation, M.P.B.; formal analysis, M.P.B.; investigation, M.P.B.; resources, M.P.B.; visualization, M.P.B.; supervision, M.P.B.; writing—original draft preparation, M.P.B. and E.K.; writing—review and editing, M.P.B. and E.K. All authors have read and agreed to the published version of the manuscript.
Funding
This research received no external funding.
Data Availability Statement
The study used data from a Parsivel1 laser disdrometer owned by the Water Centre at the Warsaw University of Life Sciences (SGGW). The original contributions presented in this study are included in the article. Further inquiries can be directed to the corresponding author.
Conflicts of Interest
The authors declare no conflicts of interest.
References
- Xie, X.; Xiao, X.; He, J.; Garfias, P.S.; Li, T.; Yu, X.; Gu, S.; Guo, Y. In situ observations of rain rate and precipitation microphysics over the coastal area of south China: Perspectives for satellite validation. J. Hydrometeorol. 2024, 25, 1045–1059. [Google Scholar] [CrossRef]
- Atencia, A.; Mediero, L.; Llasat, M.C.; Garrote, L. Effect of radar rainfall time resolution on the predictive capability of distributed hydrologic model. Hydrol. Earth Syst. Sci. 2011, 15, 3809–3827. [Google Scholar] [CrossRef]
- Thorndahl, S.; Einfalt, T.; Willems, P.; Nielsen, J.E.; Veldhuis, M.-C.; Arnbjerg-Nielsce, K.; Rasmussen, M.R.; Molnar, P. Weather radar rainfall data in urban hydrology. Hydrol. Earth Syst. Sci. 2017, 21, 1359–1380. [Google Scholar] [CrossRef]
- Johannsen, L.L.; Zambon, N.; Strauss, P.; Dostal, T.; Neumann, M.; Zumr, D.; Cochrane, T.A.; Blöschl, G.; Klik, A. Comparison of three types of laser optical disdrometers under natural rainfall conditions. Hydrol. Sci. J. 2020, 65, 524–535. [Google Scholar] [CrossRef]
- Gualco, L.F.; Campozano, L.; Maisincho, L.; Robaina, L.; Muñoz, L.; Ruiz-Hernández, J.C.; Villacís, M.; Condom, T. Corrections of Precipitation Particle Size Distribution Measured by a Parsivel OTT2 Disdrometer under Windy Conditions in the Antisana Massif, Ecuador. Water 2021, 13, 2576. [Google Scholar] [CrossRef]
- Ro, Y.; Chang, K.-H.; Hwang, H.; Kim, M.; Cha, J.-W.; Lee, C. Comparative study of rainfall measurement by optical disdrometer, tipping-bucket rain gauge, and weighing precipitation gauge. Nat. Hazards 2024, 120, 2829–2845. [Google Scholar] [CrossRef]
- Seela, B.K.; Janapati, J.; Lin, P.-L.; Lan, C.H.; Huang, M.-Q. Evaluation of GPM DPR rain parameters with north Taiwan disdrometers. J. Hydrometeorol. 2024, 25, 47–64. [Google Scholar] [CrossRef]
- Moszkowicz, S.; Tuszyńska, I. Meteorologia Radarowa. Podręcznik Użytkownika Informacji Radarowej IMGW [Radar Meteorology. IMGW Radar Information USER Manual]; Instytut Meteorologii i Gospodarki Wodnej: Warszawa, Poland, 2006. (In Polish) [Google Scholar]
- Licznar, P.; Krajewski, W.F. Precipitation Type Specific Radar Reflectivity-rain Rate Relationship for Warsaw, Poland. Acta Geophys. 2016, 64, 1840–1857. [Google Scholar] [CrossRef]
- Chumchean, S.; Sharma, A.; Seed, A. Radar rainfall error variance and its impact on radar rainfall calibration. Phys. Chem. Earth 2003, 28, 27–39. [Google Scholar] [CrossRef]
- Lee, G.W.; Zawadzki, I. Radar calibration by gauge, disdrometer, and polarimetry: Theoretical limit caused by the variability of drop size distribution and application to fast scanning operational radar data. J. Hydrol. 2006, 328, 83–97. [Google Scholar] [CrossRef]
- Guyot, A.; Pudashine, J.; Protat, A.; Uijlenhoet, R.; Pauwels, V.R.N.; Seed, A.; Walker, J.P. Effect of disdrometer type on rain drop size distribution characterization: A new dataset for Southeastern Australia. Hydrol. Earth Syst. Sci. 2019, 23, 4737–4761. [Google Scholar] [CrossRef]
- Zeng, Y.; Yang, L.; Zhang, Z.; Tong, Z.; Li, J.; Liu, F.; Zhang, J.; Jiang, Y. Characteristics of Clouds and raindrop size distribution in Xinjiang, using cloud radar datasets and a disdrometer. Atmosphere 2020, 11, 1382. [Google Scholar] [CrossRef]
- Rosenfeld, D.; Ulbrich, C.W. Cloud microphysical properties, processes, and rain opportunities. Meteorol. Monogr. 2023, 30, 237–258. [Google Scholar] [CrossRef]
- Friedrich, K.; Higgins, S.; Masters, F.J.; Lopez, C.R. Articulating and stationary PARSIVEL disdrometer measurements in conditions with strong winds and heavy rainfall. J. Atmos. Ocean. Technol. 2013, 30, 2063–2080. [Google Scholar] [CrossRef]
- Conti, F.L.; Francipane, A.; Pumo, D.; Noto, L.V. Exploring single polarization X-band weather radar potentials for local meteorological and hydrological applications. J. Hydrol. 2015, 531, 508–522. [Google Scholar] [CrossRef]
- Baltas, E.A.; Panagos, D.S.; Mimikou, M.A. An approach for the Estimation of Hydrometeorological Variables Towars the Determination of Z–R Coefficients. Environ. Process. 2015, 2, 751–759. [Google Scholar] [CrossRef]
- Adirosi, E.; Roberto, N.; Montopoli, M.; Gorgucci, E.; Baldini, L. Influence of disdrometer type on weather radar algorithms from measured DSD: Application to Italian Climatology. Atmosphere 2018, 9, 360. [Google Scholar] [CrossRef]
- Angulo-Martínez, M.; Beguería, S.; Latorre, B.; Fernández-raga, M. Comparison of precipitation measurement by OTT Parsivel2 and Thies LPM optical disdrometers. Hydrol. Earth Syst. Sci. 2018, 22, 2811–2837. [Google Scholar] [CrossRef]
- Chen, P.; Wang, P.; Li, Z.; Yang, Y.; Jia, Y.; Yang, M.; Peng, J.; Li, H. Raindrop size distribution characteristics of heavy precipitation events based on a PWS100 disdrometer in the Alpine Mountains, Eastern Tianshan, China. Remote Sens. 2023, 15, 5068. [Google Scholar] [CrossRef]
- Xiao, W.; Zhang, Y.; Zheng, H.; Wu, Z.; Xie, Y.; Huang, Y. Microphysical characteristics of precipitation for four types of typical weather systems on Hainan Island. Remote Sens. 2024, 16, 4144. [Google Scholar] [CrossRef]
- Jameson, A.R.; Larsen, M.L.; Kostinski, A.B. Disdrometer network observations of finescale spatial-temporal clustering in rain. J. Atmos. Sci. 2015, 72, 1648–1666. [Google Scholar] [CrossRef]
- Gires, A.; Tchiguirinskaia, I.; Schertzer, D. Multifractal comparison of the outputs of two optical disdrometers. Hydrol. Sci. J. 2016, 61, 1641–1651. [Google Scholar] [CrossRef]
- Bournas, A.; Baltas, E. Determination of the Z–R Relationship through Spatial Analysis of X-Band Weather Radar and Rain Gauge Data. Hydrology 2022, 9, 137. [Google Scholar] [CrossRef]
- Ji, L.; Chen, H.; Li, L.; Chen, B.; Xiao, X.; Chen, M.; Zhang, G. Raindrop size distribution and rain characteristics observed by a Parsivel disdrometer in Beijing, Northern China. Remote Sens. 2019, 11, 1479. [Google Scholar] [CrossRef]
- Gatidis, C.; Schleiss, M.; Unal, C. A new power-law model for μ– Λ relationships in convective and stratiform rainfall. Atmos. Meas. Tech. 2024, 17, 235–245. [Google Scholar] [CrossRef]
- Peinó, E.; Bech, J.; Polls, F.; Udina, M.; Petracca, M.; Adirosi, E.; Gonzalez, S.; Boudevillain, B. Validation of GPM DPR rainfall and drop size distribution using disdrometer observations in the western mediterranean. Remote Sens. 2024, 16, 2594. [Google Scholar] [CrossRef]
- Schleiss, M. Number- and size-controlled rainfall regimes in the Netherlands: Physical reality or statistical mirage? Atmos. Meas. Tech. 2024, 17, 4789–4802. [Google Scholar] [CrossRef]
- Tang, Y.-S.; Chang, P.-L.; Chang, W.-Y.; Zhang, J.; Tang, L.; Lin, P.-F.; Chen, C.-R. A localized quantitative precipitation estimation for S-Band polarimetric radar in Taiwan. J. Hydrometeorol. 2024, 25, 1697–1712. [Google Scholar] [CrossRef]
- Bédard-Therrien, A.; Anctil, F.; Thériault, J.M.; Chalifour, O.; Payette, F.; Vidal, A.; Nadeau, D.F. Laveraging a radar-based disdrometer network to develop a probabilistic precipitation phase model in eastern Canada. Hydrol. Earth Syst. Sci. 2025, 29, 1135–1158. [Google Scholar] [CrossRef]
- Pickering, B.S.; Neely, R.R.; Harrison, D. The disdrometer verification network (DiVeN): A UK network of laser precipitation instruments. Atmos. Meas. Tech. 2019, 12, 5845–5861. [Google Scholar] [CrossRef]
- Angeloni, S.; Adirosi, E.; Sapienza, F.; Giannetti, F.; Francini, F. I wielu innych Enhanced estimation of rainfall from opportunistic microwave satellite signals. IEEE Trans. Geosci. Remote Sens. 2024, 62, 4101312. [Google Scholar] [CrossRef]
- Dunkerley, D. Recording rainfall intensity: Has an optimum method been found? Water 2023, 15, 3383. [Google Scholar] [CrossRef]
- Wang, X.; Shi, S.; Zhu, L.; Nie, Y.; Lai, G. Traditional and Novel methods of rainfall observation and measurement: A review. J. Hydrometeorol. 2023, 24, 2153–2176. [Google Scholar] [CrossRef]
- Licznar, P. Wstępne wyniki porównawczych testów polowych elektronicznego deszczomierza wagowego OTT Pluvio2 i disdrometru laserowego Parsivel [Preliminary results of comparative field test of the OTT Pluvio2 electronic weighing rain gauge and the Parsivel laser disdrometer]. Instal 2009, 7/8, 43–50. (In Polish) [Google Scholar]
- Szewrański, S. Rozbryzg Jako Forma Erozji Wodnej Gleb Lessowych [Splash as a Form of Water Erosion of Loess Soils]; Monografie 78; Wydawnictwo Uniwersytetu Przyrodniczego we Wrocławiu: Wrocław, Poland, 2009. (In Polish) [Google Scholar]
- Kamińska, J.; Machowczyk, A.; Szewrański, S. Zmienność parametrów rozkładu gamma wielkości kropel deszczu naturalnego dla różnych intensywności opadu [The variation of drop size gamma distribution parameters for different natural rainfall intensity]. Woda-Sr.-Obsz. Wiej. 2010, 10, 95–102. [Google Scholar]
- Burszta-Adamiak, E. Analysis of Stormwater Retention on Green Roofs. Arch. Environ. Prot. 2012, 38, 3–13. [Google Scholar] [CrossRef]
- Biniak-Pieróg, M.; Biel, G.; Szulczewski, W.; Żyromski, A. Evaluation of methods of comparative analysis of sums of atmospheric precipitation measured with the classical method and with a contact-less laser rain gauge. Ann. Wars. Univ. Life Sci.–SGGW Land Reclam. 2015, 47, 371–382. [Google Scholar] [CrossRef]
- Biniak-Pieróg, M. Monitoring of Atmospheric Precipitation and Soil Moisture as Basis for the Estimation of Effective Supply of Soil Profile with Water; Monografie 207; Wydawnictwo Uniwersytetu Przyrodniczego: Wrocław, Poland, 2017. [Google Scholar]
- Licznar, P.; Siekanowicz-Grochowina, K. Wykorzystanie disdrometru laserowego do kalibracji obrazów pochodzących z radarów opadowych na przykładzie Warszawy [The use of laser disdrometer for calibration of images from precipitation radars on the example of Warsaw]. Ochr. Sr. 2015, 37, 11–16. [Google Scholar]
- Barszcz, M.; Stańczyk, T.; Brandyk, A. Zależności między wartościami odbiciowości i intensywności opadów z disdrometru laserowego–dla radarowego szacowania wielkości opadów [The Z–R relationships for different types of precipitation as a tool for radar-based precipitation estimation]. Przegląd Geogr. 2023, 95, 149–162. (In Polish) [Google Scholar] [CrossRef]
- Barszcz, M. Zmienność zależności Z–R w okresach miesięcznych–dla zwiększenia dokładności szacowania wielkości opadów za pomocą radarów meteorologicznych [Variability of the Z–R relationship in monthly periods–to increase the accuracy of estimating the amount of precipitation using meteorological radars]. Przegląd Geogr. 2024, 96, 447–458. (In Polish) [Google Scholar] [CrossRef]
- Krajewski, W.F.; Kruger, A.; Caracciolo, C.; Golé, P.; Barthes, L.; Creutin, J.-D.; Delahaye, J.-Y.; Nikolopoulos, E.I.; Ogden, F.; Vinson, J.-P. DEVEX-Disdrometer Evaluation Experiment: Basic results and implications for hydrologic studies. Adv. Water Resour. 2006, 29, 311–325. [Google Scholar] [CrossRef]
- Tokay, A.; Wolff, D.B.; Petersen, W.A. Evaluation of the new version of the laser-optical disdrometer, OTT Parsivel2. J. Atmos. Ocean. Technol. 2014, 31, 1276–1288. [Google Scholar] [CrossRef]
- Raupach, T.H.; Berne, A. Correction of raindrop size distribution measured by Parsivel disdrometer, using a two-dimensional video disdrometer as a reference. Atmos. Meas. Tech. 2015, 8, 343–365. [Google Scholar] [CrossRef]
- Park, S.-G.; Kim, H.-L.; Ham, Y.-W.; Jung, S.-H. Comparative evaluation of the OTT PARSIVEL using a collocated two-dimensional video disdrometer. J. Atmos. Ocean. Technol. 2017, 34, 2059–2082. [Google Scholar] [CrossRef]
- Jwa, M.; Jin, H.-G.; Lee, J.; Moon, S.; Baik, J.-J. Characteristics of Raindrop Size Distribution in Seoul, South Korea According to Rain and Weather Types. Asia-Pac. J. Atmos. Sci. 2020, 57, 605–617. [Google Scholar] [CrossRef]
- Adirosi, E.; Porcù, F.; Montopoli, M.; Baldini, L.; Bracci, A.; Capozii, V.; Annella, C.; Budillon, G.; Bucchignani, E.; Zollo, A.L.; et al. Database of the Italian disdrometer network. Earth Syst. Sci. Data 2023, 15, 2417–2429. [Google Scholar] [CrossRef]
- Marshall, J.S.; Langille, R.C.; Palmer, W.M.K. Measurement of rainfall by radar. J. Meteorol. 1947, 4, 186–192. [Google Scholar] [CrossRef]
- Peleg, N.; Marra, F.; Fatichi, S.; Paschalis, A.; Molnar, P.; Burlando, P. Spatial variability of extreme rainfall at radar subpixel scale. J. Hydrol. 2018, 556, 922–933. [Google Scholar] [CrossRef]
- Moriasi, D.N.; Arnold, J.G.; Van Liew, M.W.; Bingner, R.L.; Harmel, R.D.; Veith, T.L. Model evaluation guidelines for systematic quantification of accuracy in watershed simulations. Trans. ASABE 2007, 50, 885–900. [Google Scholar] [CrossRef]
- Caracciolo, C.; Porcu, F.; Prodi, F. Precipitation classification at mid-latitudes in terms of drop size distribution parameters. Adv. Geosci. 2008, 16, 11–17. [Google Scholar] [CrossRef]
- Uijlenhoet, R.; Steiner, M.; Smith, J.A. Variability of raindrop size distributions in a squall line and implications for radar rainfall estimation. J. Hydrometeorol. 2003, 4, 43–61. [Google Scholar] [CrossRef]
- Hunter, S. WSR-88D radar rainfall estimation: Capabilities, limitations, and potential improvements. Natl. Weather Dig. 1996, 20, 26–36. [Google Scholar]
- Fulton, R.A.; Breidenbach, J.P.; Seo, D.-J.; Miller, D.A.; O’Bannon, T. The WSR-88D rainfall algorithm. Weather. Forecast. 1997, 13, 377–395. [Google Scholar] [CrossRef]
- Delrieu, G.; Bonnifait, L.; Kirstetter, P.-E.; Boudevillain, B. Dependence of radar quantitative precipitation estimation error on the rain intensity in the Cévennes region, France. Hydrol. Sci. J. 2014, 59, 1308–1319. [Google Scholar] [CrossRef]
- Amengual, A. Hydrometeorological analysis of the 12 and 13 September 2019 widespread flash flooding in eastern Spain. Nat. Hazards Earth Syst. Sci. 2022, 22, 1159–1179. [Google Scholar] [CrossRef]
- Jiang, Y.; Yang, L.; Zeng, Y.; Tong, Z.; Li, J.; Liu, F.; Zhang, J.; Liu, J. Comparison of summer raindrop size distribution characteristics in the western and central Tianshan Mountains of China. Meteorol. Appl. 2022, 29, e2067. [Google Scholar] [CrossRef]
- Marshall, J.S.; Palmer, W.M.K. The distribution of raindrops with size. J. Meteorol. 1948, 5, 165–166. [Google Scholar] [CrossRef]
- Gunn, K.L.S.; Marshall, J.S. The distribution with size of aggregate snowflakes. J. Meteorol. 1958, 15, 452–461. [Google Scholar] [CrossRef]
- Uijlenhoet, R.; Sempere Torres, D. Measurement and parameterization of rainfall microstructure. J. Hydrol. 2006, 328, 1–7. [Google Scholar] [CrossRef]
- Villarini, G.; Krajewski, W.F. Review of the different sources of uncertainty in single polarization radar-based estimates of rainfall. Surv. Geophys. 2010, 31, 107–129. [Google Scholar] [CrossRef]


Disclaimer/Publisher’s Note: The statements, opinions and data contained in all publications are solely those of the individual author(s) and contributor(s) and not of MDPI and/or the editor(s). MDPI and/or the editor(s) disclaim responsibility for any injury to people or property resulting from any ideas, methods, instructions or products referred to in the content. |
© 2025 by the authors. Licensee MDPI, Basel, Switzerland. This article is an open access article distributed under the terms and conditions of the Creative Commons Attribution (CC BY) license (https://creativecommons.org/licenses/by/4.0/).