1. Introduction
Urban expansion, encompassing both the physical growth of built-up areas and the increasing anthropogenic dispersion of population, is widely studied due to its profound ecological and socio-environmental impacts. Environmentally, expansion of built-up land disrupts essential biological processes [
1,
2] and degrades urban environments [
3,
4]. Socially, over-expansion can lead to considerable housing vacancy [
5,
6] while demographic oversaturation depletes urban sustainability [
7,
8]. Therefore, a comprehensive understanding of urban expansion patterns and the balance with population is essential for regional sustainable development.
Spatiotemporal characteristics are critical in urbanization research, as the location of urban land change reflects transformation in urban spatial structure, which is intrinsically related to key morphological indicators such as land-use efficiency and compactness [
9,
10,
11,
12], both of which affect urban energy consumption with significant sustainability implications [
13,
14,
15]. Moreover, temporal information facilitates recognition of urban revolution patterns and enables a more robust identification of driving factors through temporal correlation analysis [
16].
Numerous methods have been developed to extract spatiotemporal characteristics of urban land expansion. Spatially, the type of urban growth is decided based on land cover percentages within moving windows [
17], an approach known to be sensitive to window size selection. The boundary sharing rate (BSR) was introduced [
18] to distinguish between infilling, edge-expansion, and outlying growth. The land expansion index (LEI) was designed utilizing buffer zone analysis [
19], and subsequent studies have incorporated vertical information [
20]. New indices considering centrality and aggregation of land patches were utilized to characterize urban expansion structure and form [
21]. Temporally, the multi-order landscape expansion index (MLEI) is proposed for the analysis of urban expansion dynamics based on multi-temporal data. Temporal effect is also utilized on the basis of geographic weighted regression to deal with both spatial and temporal heterogeneity and influence of non-stationary factors [
22].
While existing studies have significantly advanced our understanding of urban expansion patterns, current methods primarily focus on quantifying individual urban patches and lack the capacity to assess their correlations and balance with other urban elements. Urban expansion inherently includes the physical extension of built-up land and the spatial concentration of population [
23], necessitating an approach that can comprehensively evaluate sustainability across spatial, temporal, and quantitative dimensions. Buffer zone analysis, a fundamental and widely applied technique in geospatial research [
24], provides a robust framework for such assessments. By generating concentric rings around urban centers at fixed intervals, this method enables systematic examination of land-use change patterns. Its strength lies in capturing both spatial consistency and distance-decay effects in urban development processes [
25,
26,
27], making it particularly valuable for analyzing the multidimensional aspects of urban growth.
Recent global analyses have revealed significant differences in growth rate between urban land and population [
28,
29,
30]. China, in particular, has undergone unprecedented urban expansion in recent decades [
31]. Marked socioeconomic development and environmental conditions have resulted in significant spatial mismatches between urban growth and population concentration [
32,
33]. This issue is especially pronounced in Guangdong province, where regional inequalities exist between the Pearl River Delta and other areas. Therefore, a scientific reference regarding urban-population consistency is urgently required for rational urban planning and sustainable regional development.
Data accuracy is vital for investigating urban-population consistency; census data are acknowledged for their authenticity in population quantity, yet the limitation in spatiotemporal resolution restricts their broader applications. Data from numeral sources are utilized to characterize fine-scale population distribution, including nighttime light (NTL), building footprints, and mobile phone-based data. Due to the finer resolution and strong correlation with social activity characteristics [
34], NTL data has been effectively employed to map population dynamics across diverse regions and scales [
35,
36,
37,
38].
This study aims to comprehensively demonstrate the spatiotemporal alignment between urban land and population in Guangdong Province, China, from 1995 to 2019 at 5-year intervals. Utilizing global settlement data and population maps derived from NTL data, we employ buffer zone analysis to (1) classify urban expansion based on directional patterns, and (2) analyze the mismatch between urban growth and population dynamics in quantitative, spatial, and temporal dimensions. Our analysis of urban-population consistency in Guangdong’s unequal regional context reveals new urbanization perspectives, providing actionable insights for sustainable development strategies.
2. Study Area and Datasets
2.1. Study Area
Guangdong Province, situated along China’s southern coastline, is the nation’s most populous province with 127.06 million residents in 2023 [
39] and a leading economic hub renowned for its manufacturing and commercial sectors. The province comprises 21 prefecture-level cities exhibiting substantial developmental disparities. Following Guangdong’s 2019 coordinated development strategy named “One Core, One Belt, One District” [
40], we categorize these prefectures into three distinct subzones based on economic status and municipal functions: (1) Core subzone: the most economically advanced region, containing 9 prefectures around the Pearl River Delta, serving as Guangdong’s economic and technological center. (2) Belt subzone: seven coastal prefectures spanning Guangdong’s southern and eastern coastline, serving as a crucial coastal economic belt with advantages in commercial and industrial activities, including port logistics and manufacturing. (3) District subzone: five less-developed prefectures primarily located in the northern part of Guangdong, with a greater emphasis on ecological conservation and resource provision. The significant regional heterogeneity among these prefectures makes Guangdong an ideal case study for examining the complex dynamics between urban expansion and population distribution. The geographic location and subzone division of Guangdong province are presented in
Figure 1.
2.2. Datasets
2.2.1. Settlements Data
Diurnal satellite images offer higher radiometric resolution and contexture information when depicting dynamics of urban expansion, with a focus on change of resident-related urban land, two components of World Settlement Footprint (WSF) suite [
41], which is a global settlement dataset built upon Landsat and Sentinel satellite images, are employed to examine the spatiotemporal dynamics of habitable urban land in Guangdong over study period.
WSF-Evolution is a raster layer dataset that documents the annual global settlements expansion from 1985 to 2015 at 30 m resolution. The distribution of the settlements is identified by applying morphological filtering on spectral indices extracted from Landsat satellites and classified using a machine learning technique. Each pixel of WSF-Evolution is assigned a four-digit value indicating the earliest detection year of the corresponding settlement, enabling the temporal analysis of urban expansion patterns.
- 2.
WSF2019:
WSF2019 outlines the global settlements distribution in 2019 at 10 m resolution using the complementary spectral information from Sentinel satellites.
2.2.2. Nighttime Light Imagery
Distribution of population is difficult to obtain as settlement land from diurnal satellite images, however, the utilization of electricity provides the chance for population spatialization [
42]. To establish a continuous NTL time series over the study period, NTL images from DMSP-OLS and VIIRS-DNB are integrated and processed.
DMSP-OLS (Defense Meteorological Satellite Program—Operational Linescan System) NTL images were collected by the U.S. Air Force from 1992 to 2013 from a weather forecasting project, which is composed of six satellites, coded F10, F12, F14, F15, F16, and F18, respectively. The onboard OLS enables the satellites to effectively capture low-intensity ground radiance during nighttime. DMSP-OLS has a global coverage from −65° to 75° in latitude and a spatial resolution resampled to 30-arcseconds with 6-bit quantification digital values that range from 0 to 63. We employ the annual stable light product of DMSP-OLS Version 4, which is available on Google Earth Engine (GEE) [
43]. The necessary calibration for quality control of DMSP images was accomplished by the Earth Observation Group (EOG) from Colorado School of Mines.
VIIRS-DNB (Visible Infrared Imaging Radiometer Suite—Day/Night Band) images, launched aboard the Suomi NPP satellite, offer significant advancements over DMSP-OLS with a spatial resolution of 15-arcseconds and a wider dynamic range with seven orders of magnitude. The VIIRS-DNB Composite Version 1 is also available on GEE, with necessary preprocessing accomplished by EOG. The VIIRS images were additionally filtered to exclude data impacted by stray light, lightning, lunar illumination, and cloud cover.
2.2.3. Supplementary Datasets
Official census records from 1990 to 2019 and prefectural-level administrative boundaries for Guangdong are employed as supplementary data; the global impervious surface layer (GISA) [
44] is utilized for visualization and determination of urban centers.
3. Methodology
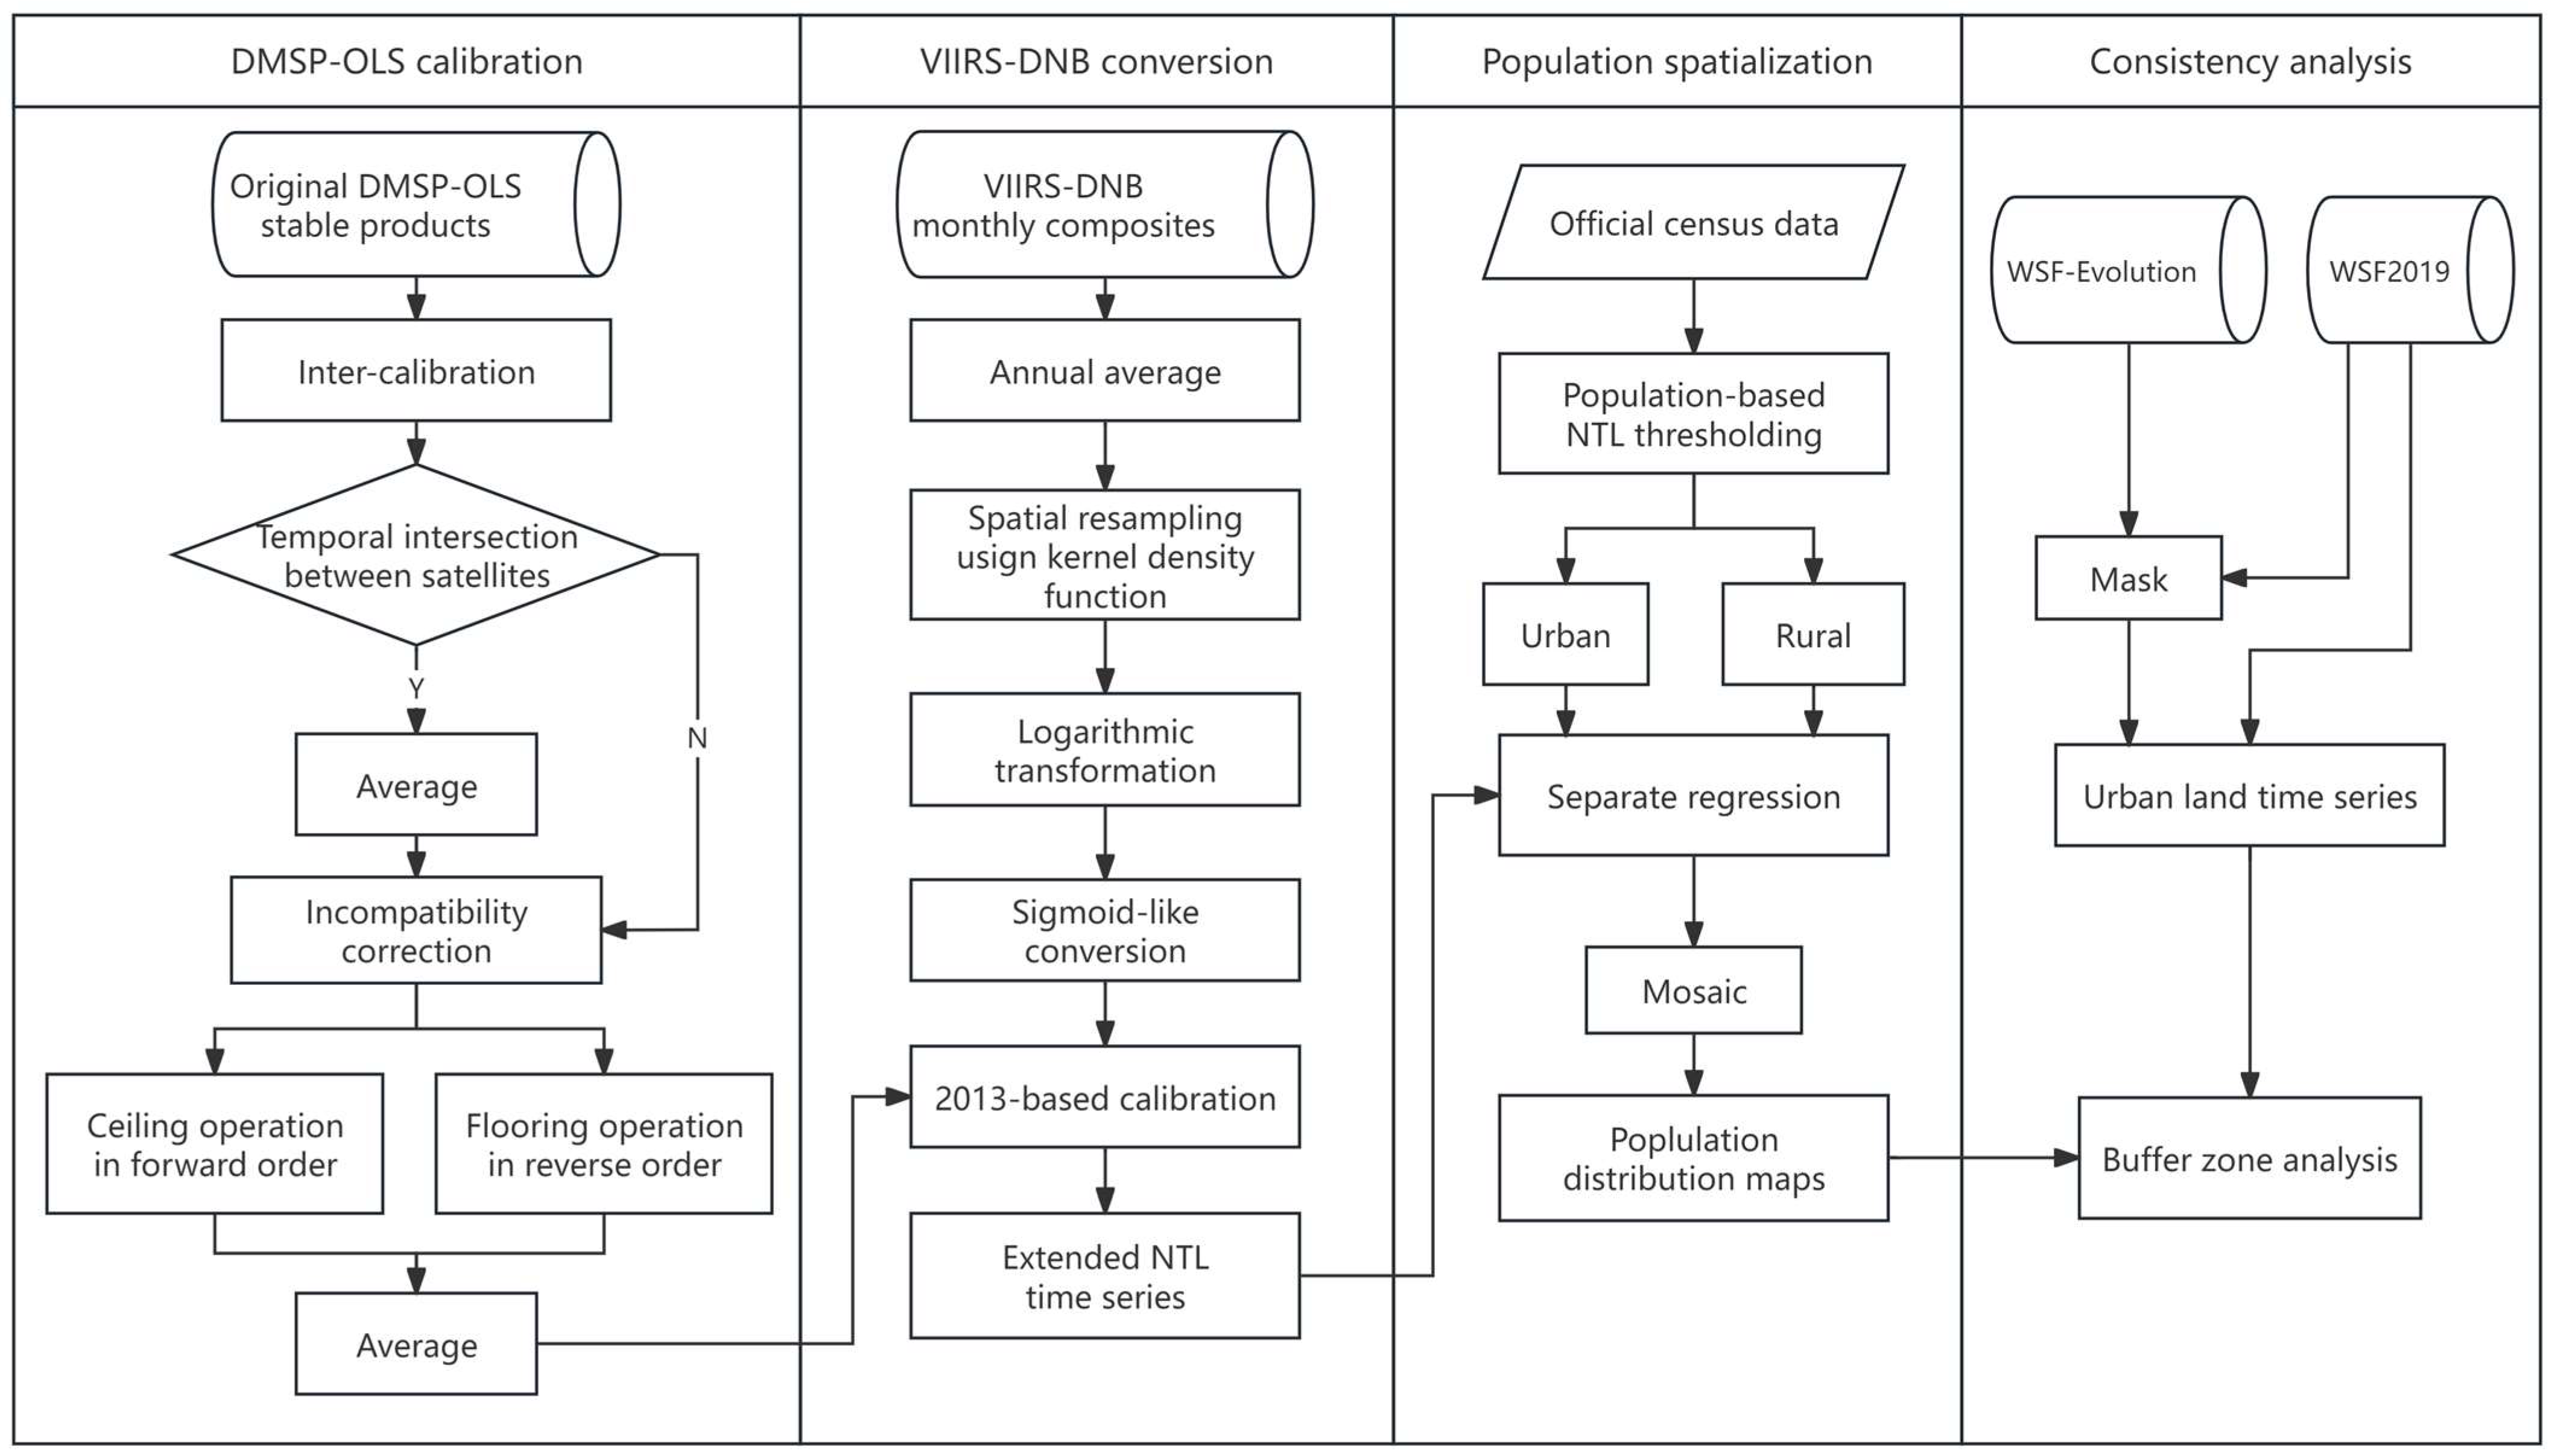
The methodology of this work mainly consisted of three parts: (1) the construction of extended NTL time series. (2) NTL-based population spatialization, and (3) consistency analysis using buffer zone. The first step includes calibration of DMSP-OLS images and transformation of VIIRS-DNB images, and the second step includes population-based NTL thresholding and separate population mapping. The detailed procedure of the methodology is summarized in
Figure 2.
3.1. Construction of Consistent NTL Time Series
To enable population spatialization using NTL data, we processed DMSP and VIIRS datasets to create a consistent time series with comparable intensity values. Particularly, images before 2015 were obtained from DMSP datasets and images after 2015 were acquired from VIIRS datasets. The extended NTL series was generated through two key steps: (1) calibration of DMSP images, and (2) DMSP-like transformation of VIIRS images. Calibration methodology for the two datasets was, respectively, based on the framework of [
45,
46], where a detailed calibration process can be referred to. Specifically, radiance adjustment using vegetation index was not performed because we found the adjustment compressed the range of pixels’ digital number (DN), making NTL classification threshold inaccurate. Following calibration of both NTL datasets, the two adjusted datasets with identical spatial resolution and value distributions were integrated to generate a consistent, DMSP-like NTL time series for subsequent population spatialization.
3.2. Separate Population Spatialization
NTL data have become a vital tool for fine-scale population spatialization, owing to their strong correlation with human activity and comprehensive spatiotemporal coverage. While numerous gridded population datasets have been created using NTL imagery and ancillary data across multiple scales [
47], research emphasized persistent limitations in distribution accuracy—particularly in rural areas [
37,
48,
49]. These discrepancies arise from variations in anthropogenic activity, insufficient proxy representation, and the absence of rural-specific modeling approaches. Such uncertainties substantially reduce data reliability in areas with pronounced rural-urban disparities. To enhance population estimation accuracy in unevenly developed regions, we applied two key assumptions from [
48] that assume the following: (1) a province’s urbanization level positively correlates with its urban population, and (2) urban population estimates are more reliable than rural ones. Leveraging region-specific census data, we developed an inverse mapping relationship between urban population and urban land area using the Ratio of Urban to Total Population (RUTP). This ratio links classification thresholds to maximum DN values—for example, if urban residents represent 60% of the total population, the threshold becomes 63 × 0.6 ≈ 38, with pixels exceeding this value classified as urban. The threshold was initialized using 1995 census data and dynamically adjusted for subsequent years by incorporating annual RUTP increments multiplied by the elapsed time. This adaptive approach, which mirrors urban land change dynamics, proves equally effective for rural areas. Following annual threshold determination, urban and rural zones were systematically delineated.
For urban and rural areas in each study year, the total DN value in each study year is aggregated for both areas using extended NTL time series, then a series of regression functions of DN against census population are conducted with Equation (1):
where
Pop and
DN are the total population from the census record and the aggregated
DN value in each area, respectively.
is the regression function, where the indices
and
, respectively, denote spatial and temporal range, with
represents the area classification (0 for rural, 1 for urban), while
represents the study year. Population density at the pixel level was derived by applying year-specific regression functions to DN values, followed by mosaicking to generate a seamless provincial-scale population map for Guangdong. This method preserves spatial consistency while accurately capturing urban–rural population distribution patterns.
3.3. Growth Dynamics Estimation
The analysis of settlement expansion and population growth dynamics was conducted using a systematic spatial framework. Settlement growth was identified through temporal filtering of pixel values, with WSF-Evolution data refined using higher-resolution WSF2019 masks to enhance accuracy. Population distribution patterns were examined within a series of concentric buffer zones generated around each prefecture’s urban center, all processing implemented on the Google Earth Engine (GEE) platform. After obtaining the distribution of settlement and concentration of population on the pixel level, their growth dynamics in different directions over the study period can be analyzed using buffer zone analysis. The concentric rings are built from the urban center with an interval of 1 km and a radius of 40 km for each Guangdong prefecture. Specifically, the 40 km radius was selected based on both the literature review and empirical evidence. For the radius selection, ref. [
50] estimated that the radius of Guangzhou’s main urban area reached 39.6 km. Similarly, ref. [
51] calculated a 37.11 km urban radius for the Guangzhou–Foshan agglomeration. This value is theoretically applicable to either city, given the proximity of the two urbans’ centers. Our empirical observations further confirm that a 40 km radius effectively covers the majority of urban land, while smaller radii would exclude peri-urban zones. The 1 km interval selection was informed by both global urban analysis standards [
52,
53] and regional characteristics, particularly Guangzhou’s documented 1 km/year expansion rate during 1990–2009 [
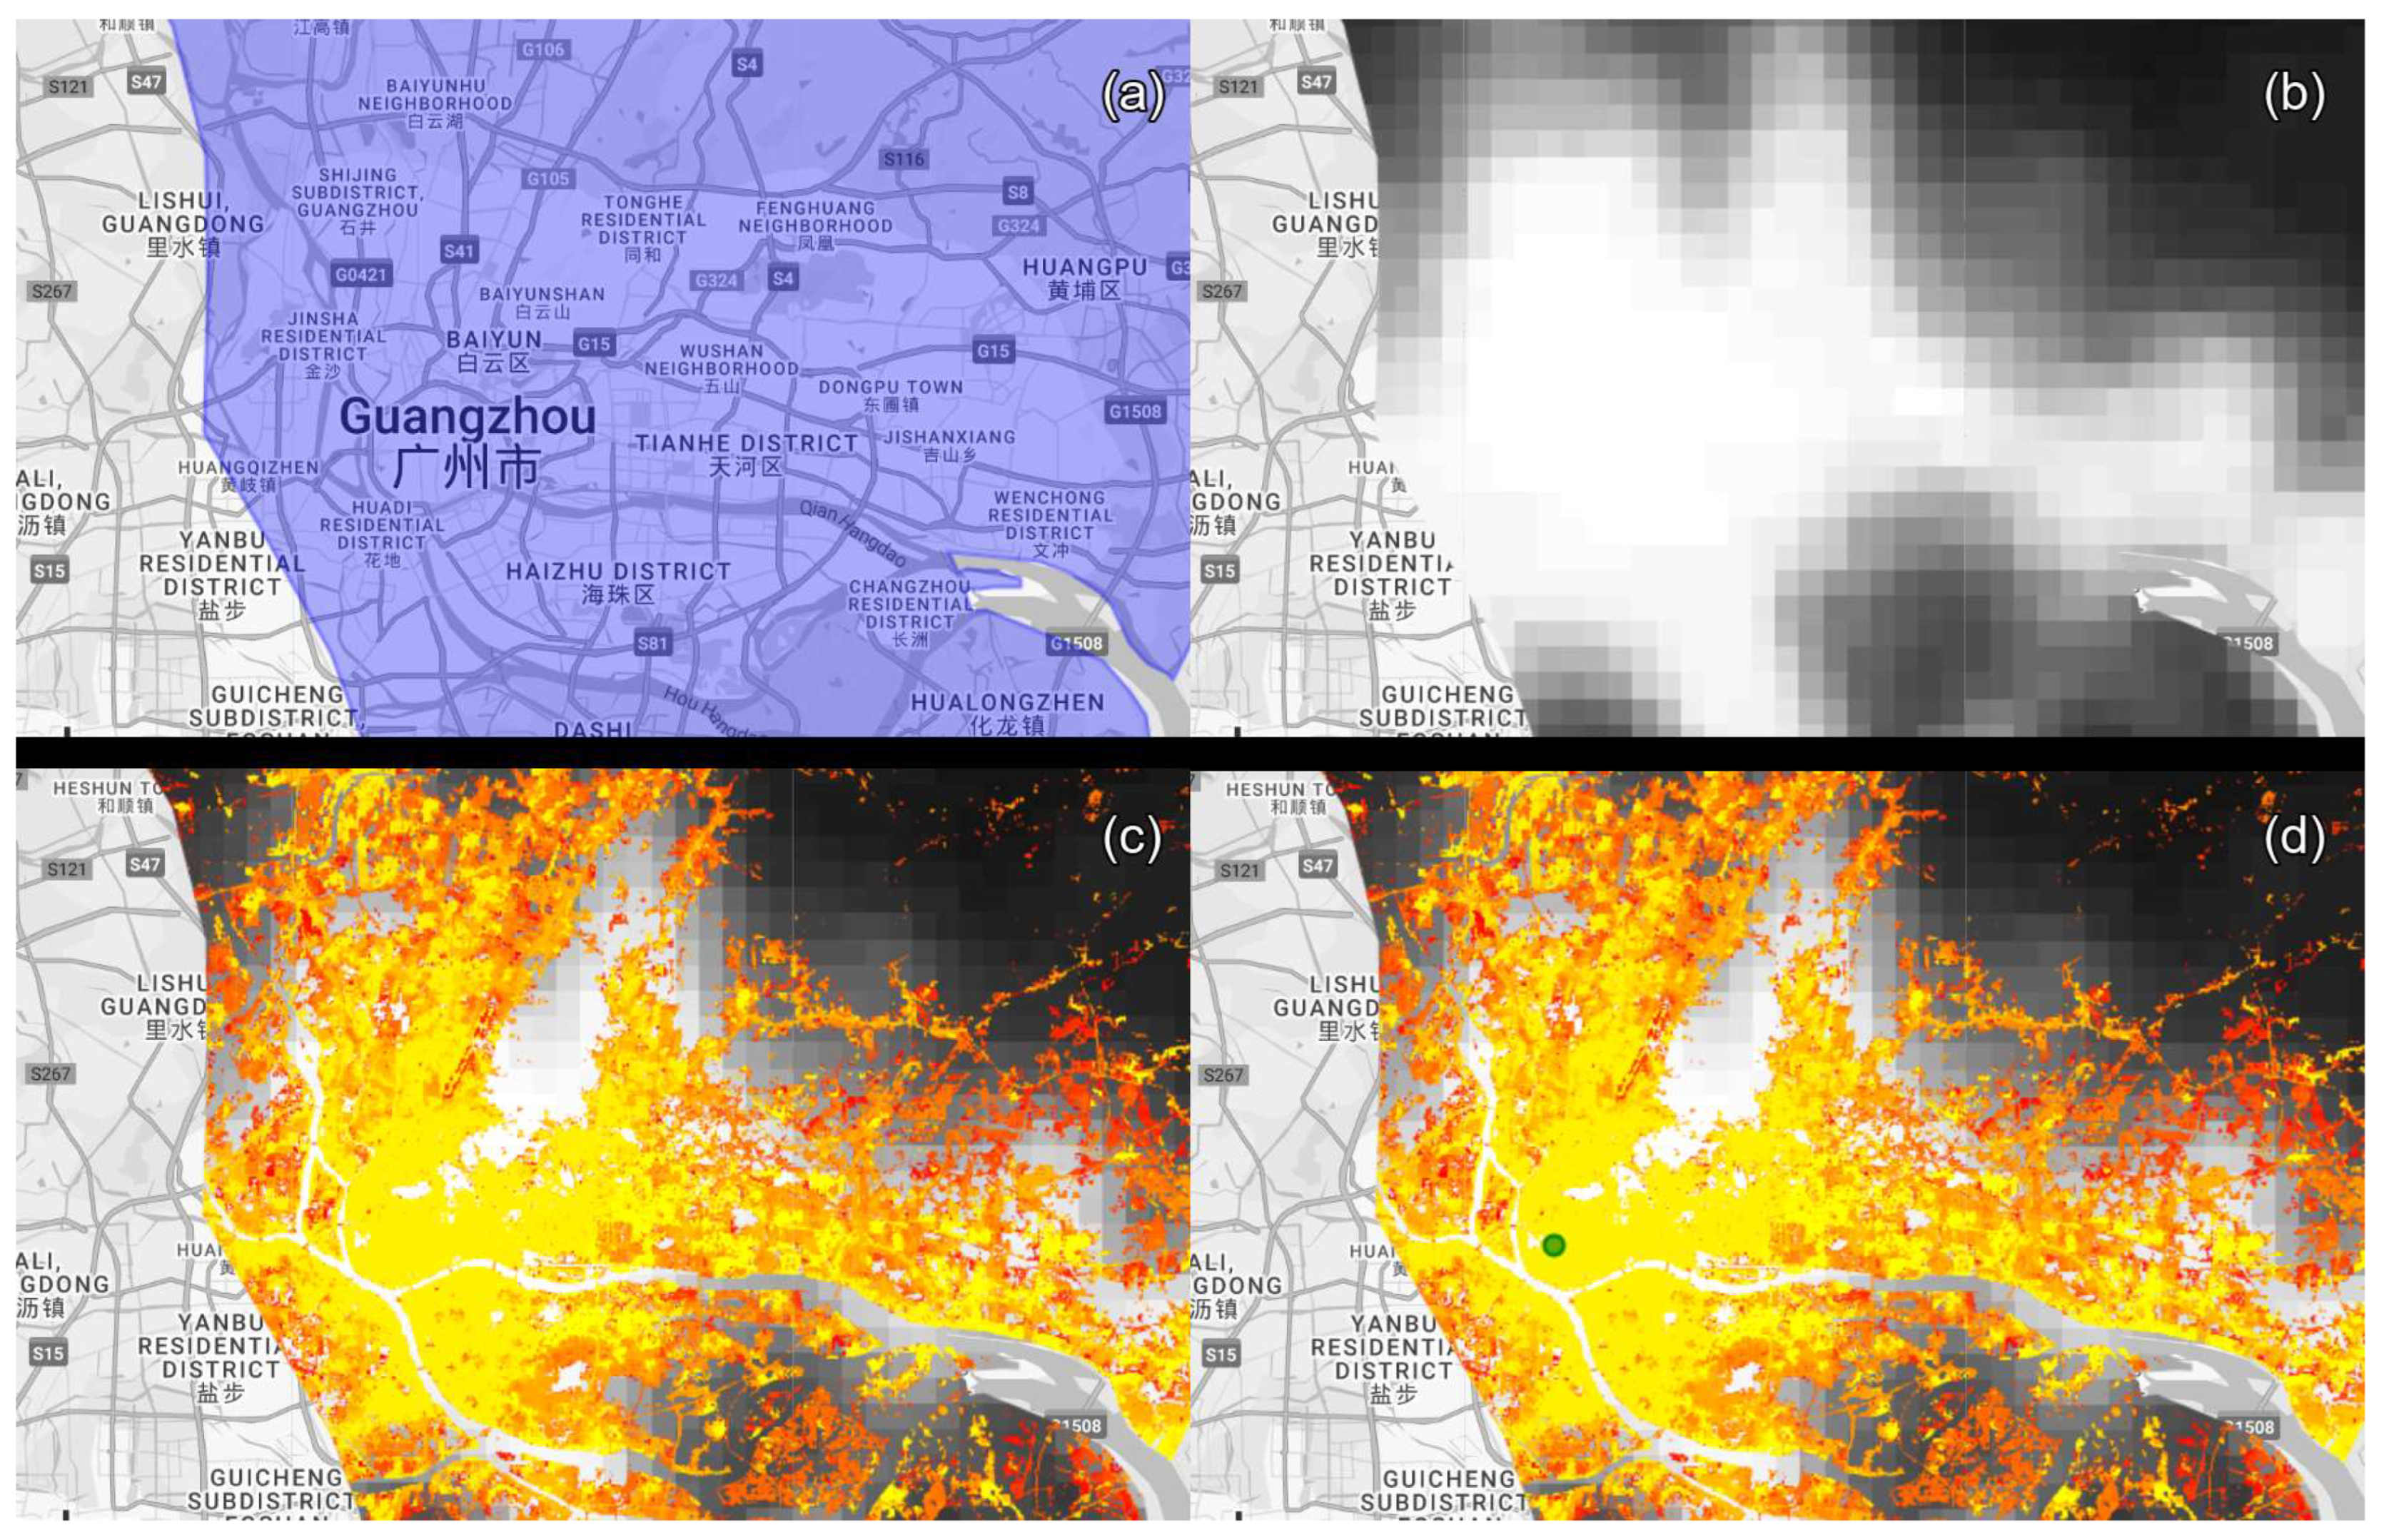
54]. This granularity maintains compatibility with the spatial resolution of DMSP-NTL data while preserving necessary detail for urban growth analysis. Urban centers are manually selected with the highest NTL intensity and earliest construction year by visualizing the NTL image and GISA layer.
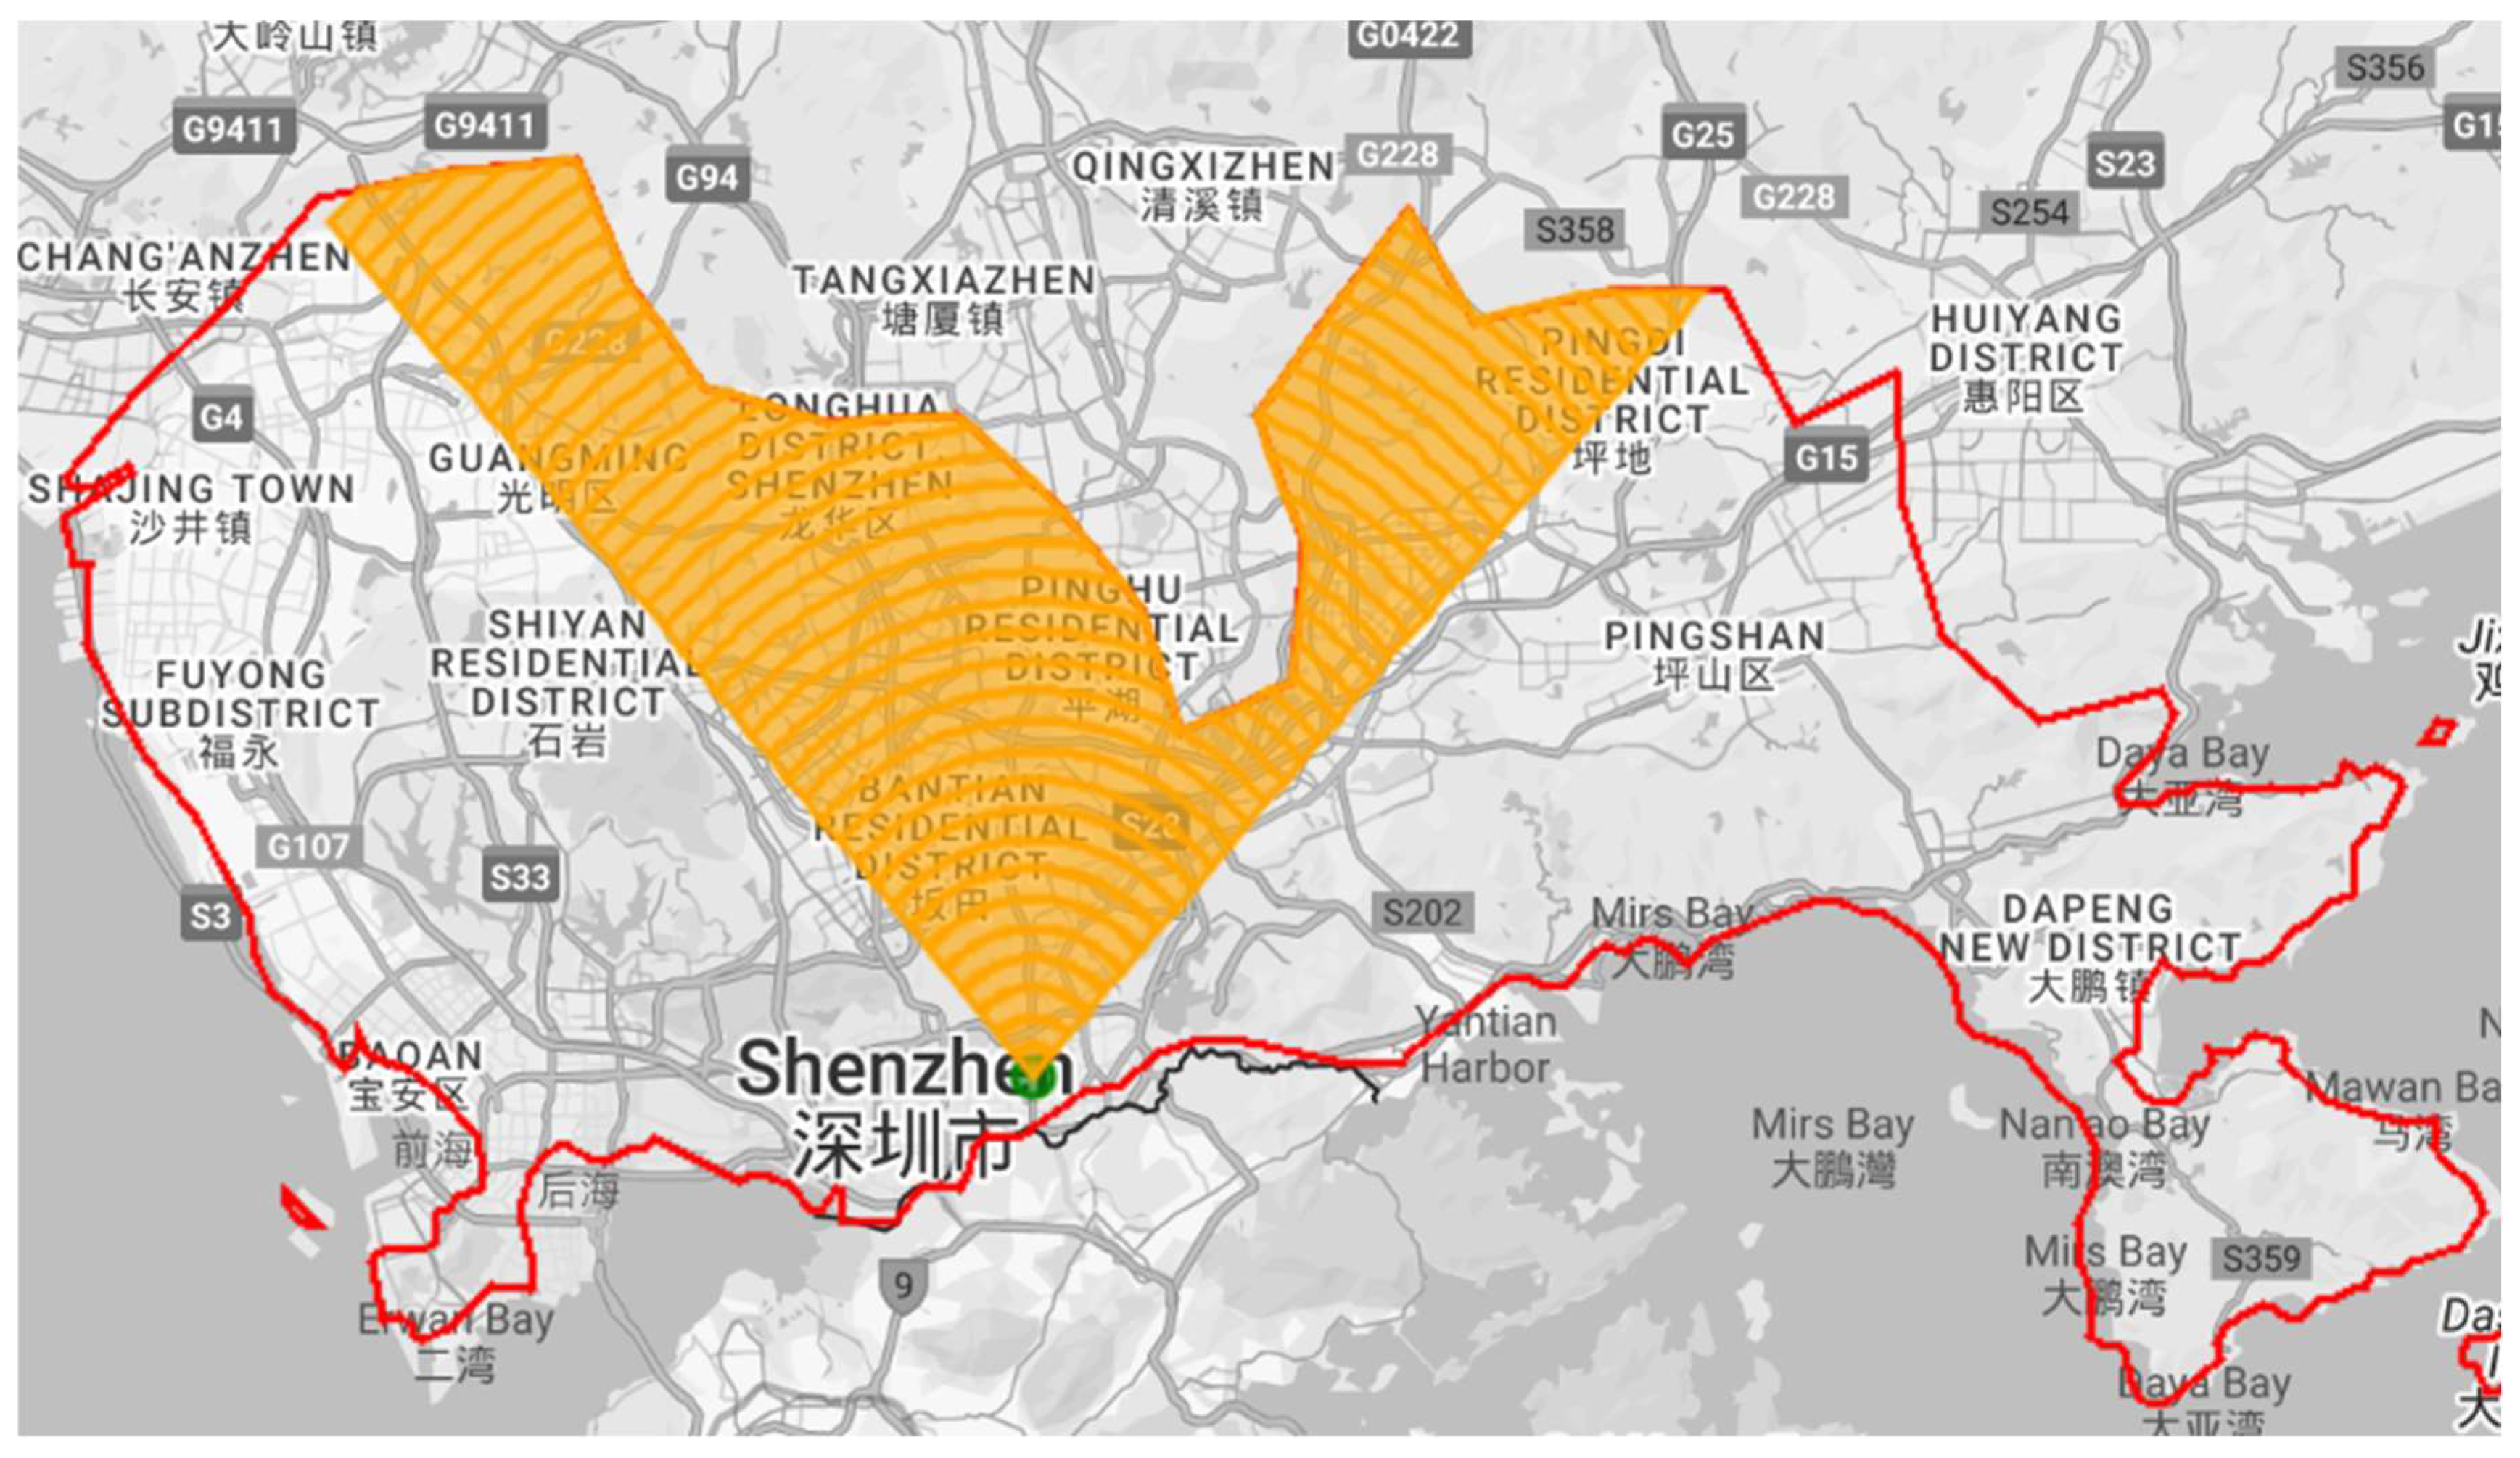
Figure 3 demonstrates the procedure of center selection for Guangzhou. The selection of an urban center for another prefecture follows the same method. The buffer zones were further segmented into four cardinal sectors (north, south, east, west) to examine directional spatial development patterns. Administrative boundaries and water bodies were systematically excluded during analysis to ensure geographic relevance, with all spatial operations performed on GEE. An example of rings to the north from the clip of the GEE interface is presented in
Figure 4.
Following the determination of buffer parameter settings, concentric rings are created, by filtering the pixel value of settlement data and choosing the corresponding population map for a specific year, the total quantity of population and settlement over the study period can be acquired through aggregation within a defined spatial extent. Then, the growth dynamics of urban and population within each ring are available and we define the periodic growth rate in Equation (2):
where
refers to the expansion rate for variables in region
during each 5-year interval,
can be urban or rural areas of each prefecture. For population,
and
, respectively, represent the sum of pixel values within the study region in the current and next temporal stage. For settlements,
and
, respectively, represent the number of valid pixels in the current and next temporal stage. Using
, the pattern of growth between settlements and population can be compared.
4. Results
4.1. Consistent NTL Time Series for Population Spatialization
As presented by
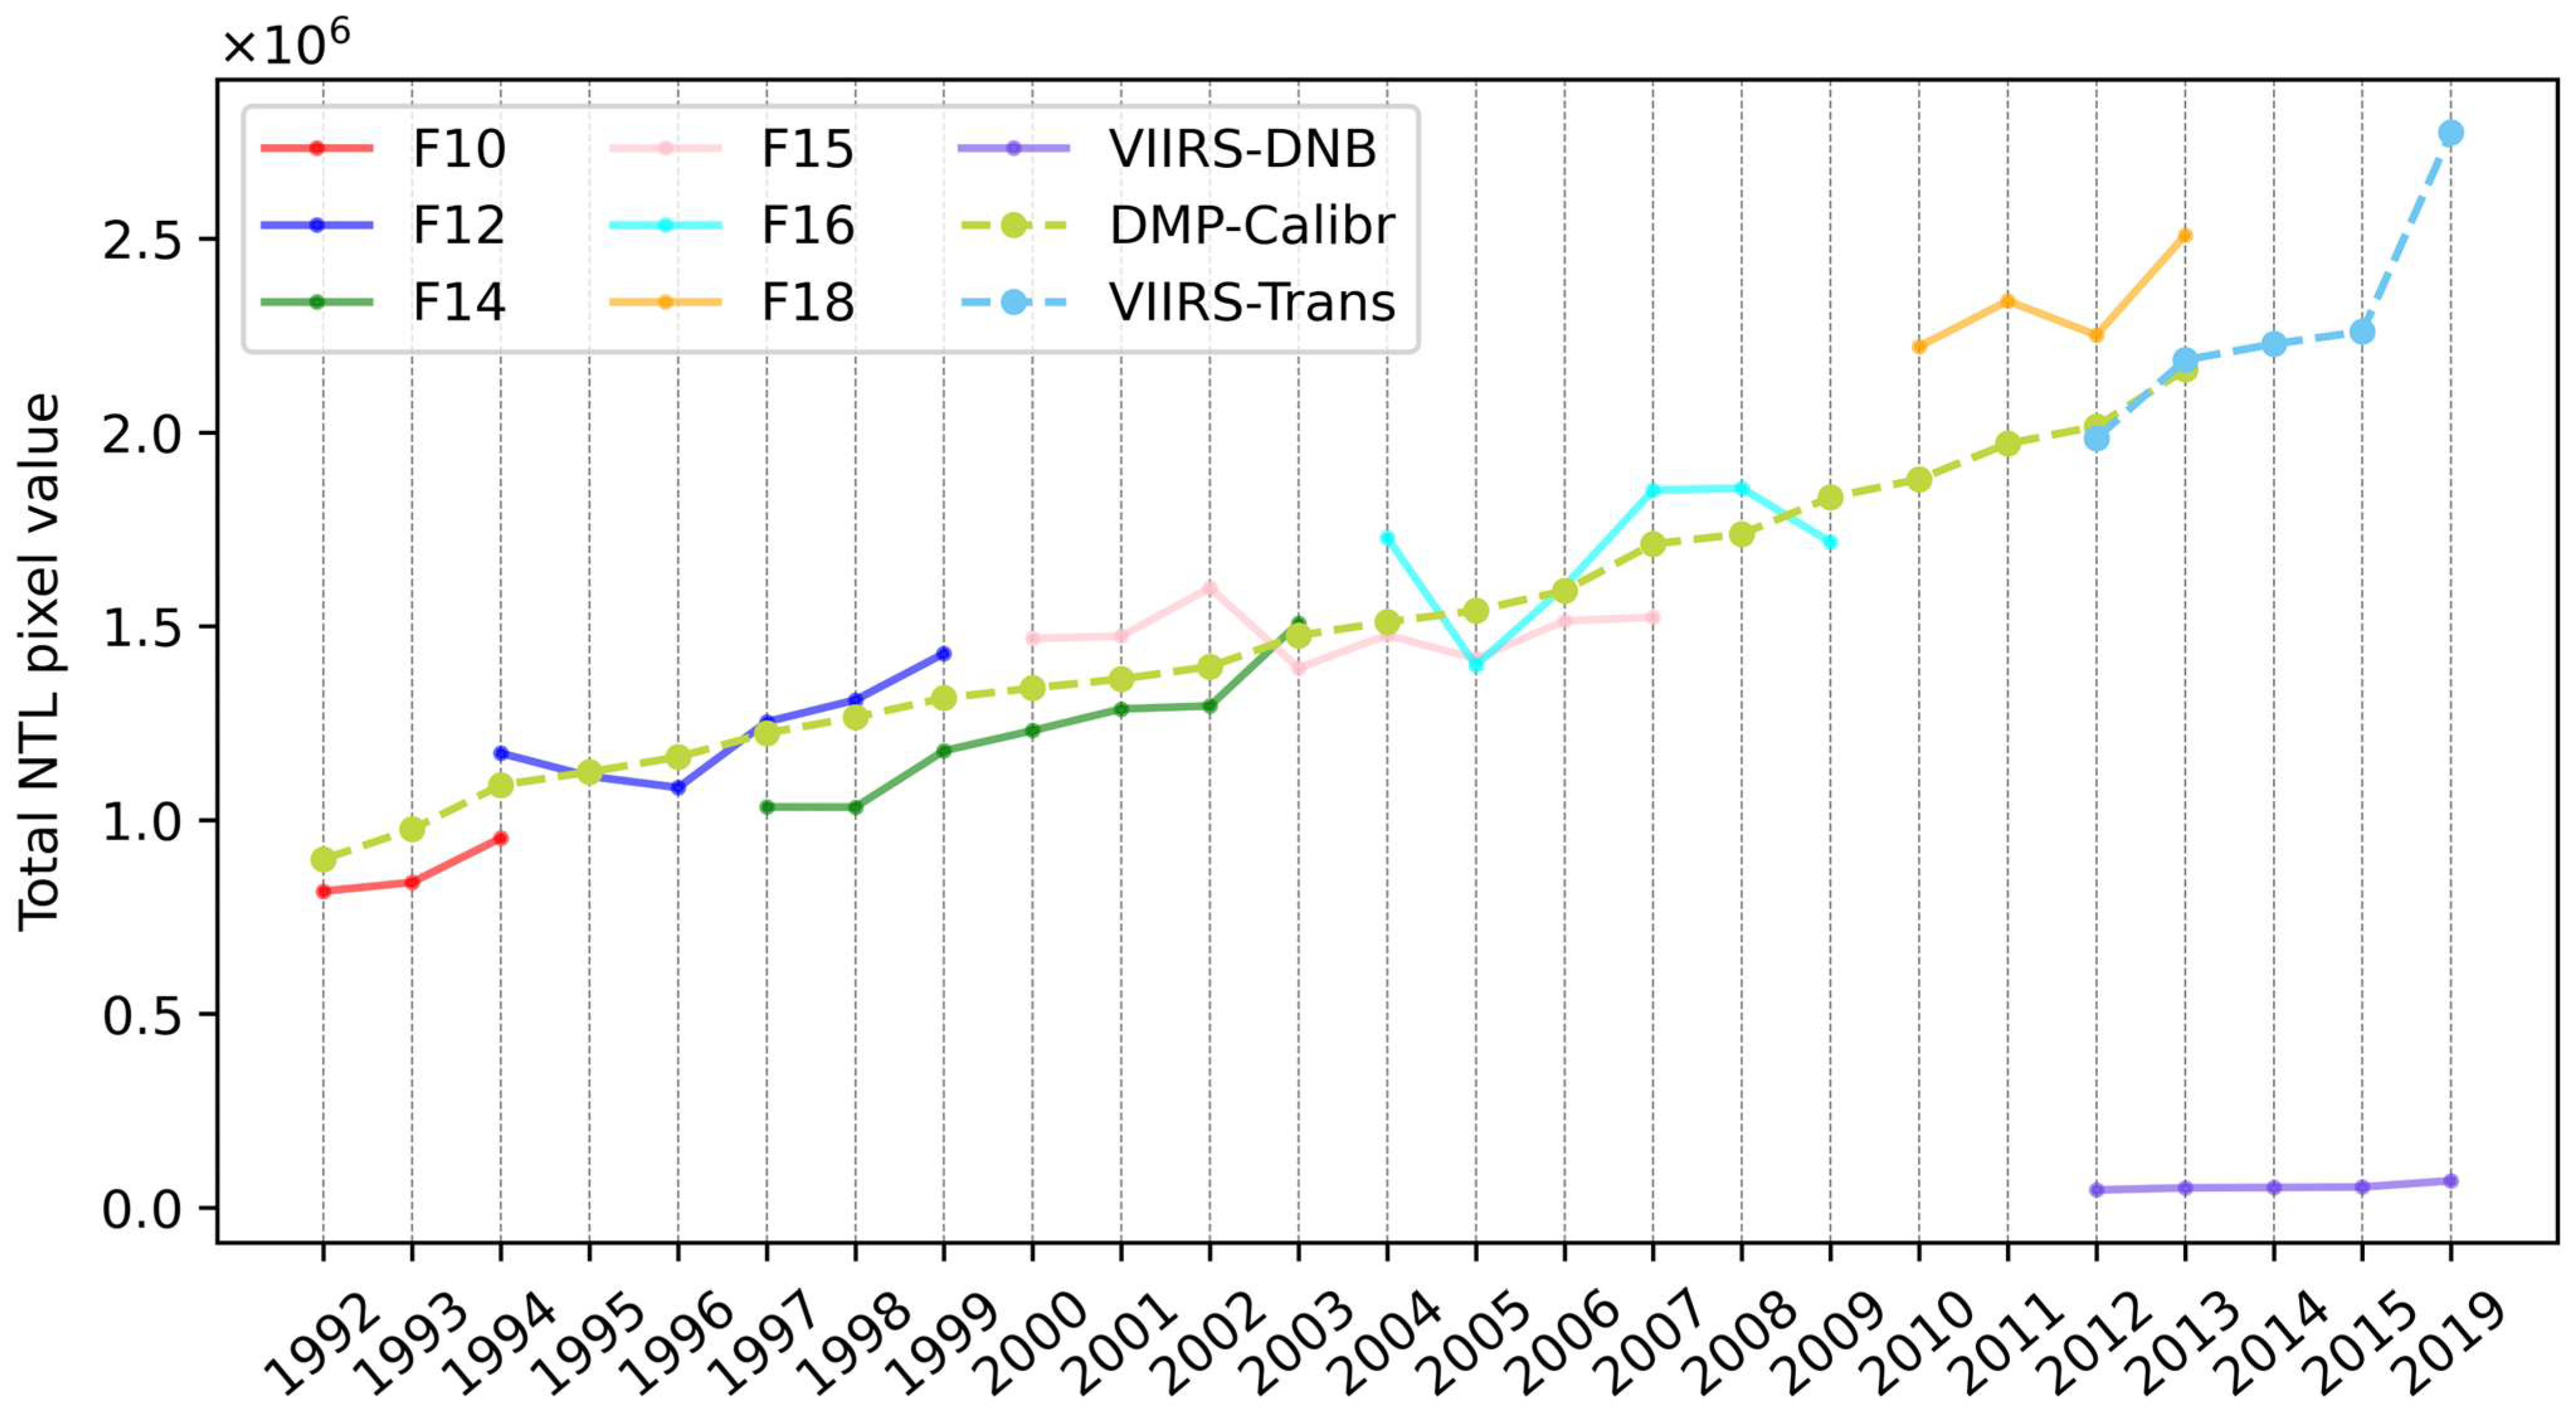
Figure 5, major drawbacks of original NTL images can be observed: (1) Inconsistency between and instability within DMSP satellites. The former can be found from the discontinuity between solid lines of DMSP’s satellites and the latter is displayed by fluctuation of lines, especially F15 and F16. (2) Temporal incompatibility. Notable difference in total DN value exists between images taken by different satellites during the same year, as presented by the distance between lines with intersection over the x-axis. (3) Incomparability between images from different sensors, as displayed by the total pixel value of the original VIIRS images.
After calibration and transformation, the total pixel value of NTL images before and after calibration is, respectively, shown in solid and dashed lines. Compared with the discontinuity of the DN sum from original images, the trend of the DN sum from calibrated time series shows a consistent and logical increase. The natural connection between two dashed lines indicates that images from different datasets are now compatible. Specifically, using the methodology proposed in [
55], calibration coefficients for some DMSP-OLS images are optimized with better calibration effects, updated coefficients with corresponding evaluation indicators are listed in
Table 1 in black, while kept coefficients are in blue. Coefficients for the transformation of VIIRS images are listed in
Table 2.
In addition to addressing intra-dataset inconsistencies, we further validated our provincial-scale NTL calibration using an established harmonized NTL dataset with a global perspective [
56], to verify the generalization ability of our proposed method beyond Guangdong province. Two correlation indices, the coefficients of determination (
) and root mean square error (RMSE), are calculated for both our consistent NTL time series and harmonized global NTL dataset before 2015, using the original DMSP images as the calibration standard. As listed in
Table 3, the employed dataset showed higher
and lower RMSE for image F121995, F152000, and F182010, and our NTL time series shows the same statistical advantage for image F142000, F152005, and F162005. The contrast displays a comparable calibration result with global NTL harmonization from 1995 to 2010.
Given that VIIRS image DN distributions were transformed to match DMSP patterns, direct comparisons between original VIIRS composites and calibrated images are methodologically unsound. To effectively execute validation, we presume the reference dataset images as ground truth and consider our NTL time series as calibrated derivatives. Correlation analysis of corresponding image pairs in
Table 4 reveals the determination coefficients over 93% for both study years, with particularly strong agreement in 2015 (0.96). This consistent high correlation with benchmark data throughout the study period confirms the validity of our NTL time series and the generalization of the analysis framework worldwide.
4.2. Population Spatialization Based on Consistent NTL Time Series
The population spatialization for Guangdong was generated by applying our separate mapping strategy across all study years. As NTL data is often criticized for being unable to fully characterize population distribution, our validation against census records confirms the result’s reliability. As shown in
Table 5, strong agreement is demonstrated during intermediate study periods (2000–2010), with both areas achieving accuracy over 95% relative to census data. This performance demonstrates the effectiveness of our approach for local-scale population mapping.
In addition to regional-scale validation, we conducted a provincial-scale comparison to evaluate the performance of our separate mapping strategy and its consistency with widely used population datasets, including the Gridded Population of World Version 4.11 (GPW-v4), the Global Human Settlement Layer (GHSL), LandScan, and WorldPop. Key results listed in
Table 6 reveal that the result of direct mapping is less accurate than the employed separate mapping strategy, yet it performs better than LandScan and WorldPop. The high quantity consistency with census data achieved by our result confirms its comparability with a well-established dataset benchmark at the provincial scale. Discrepancies among reference datasets likely reflect differences in their underlying modeling frameworks. The consistent accuracy across local and provincial scales validates the reliability of our population spatialization.
The coefficients for linear regression between total DN value and the sum of population at different scales in each year are in
Table 7.
4.3. Growth Dynamics in Different Directions at Buffer Zone Scale
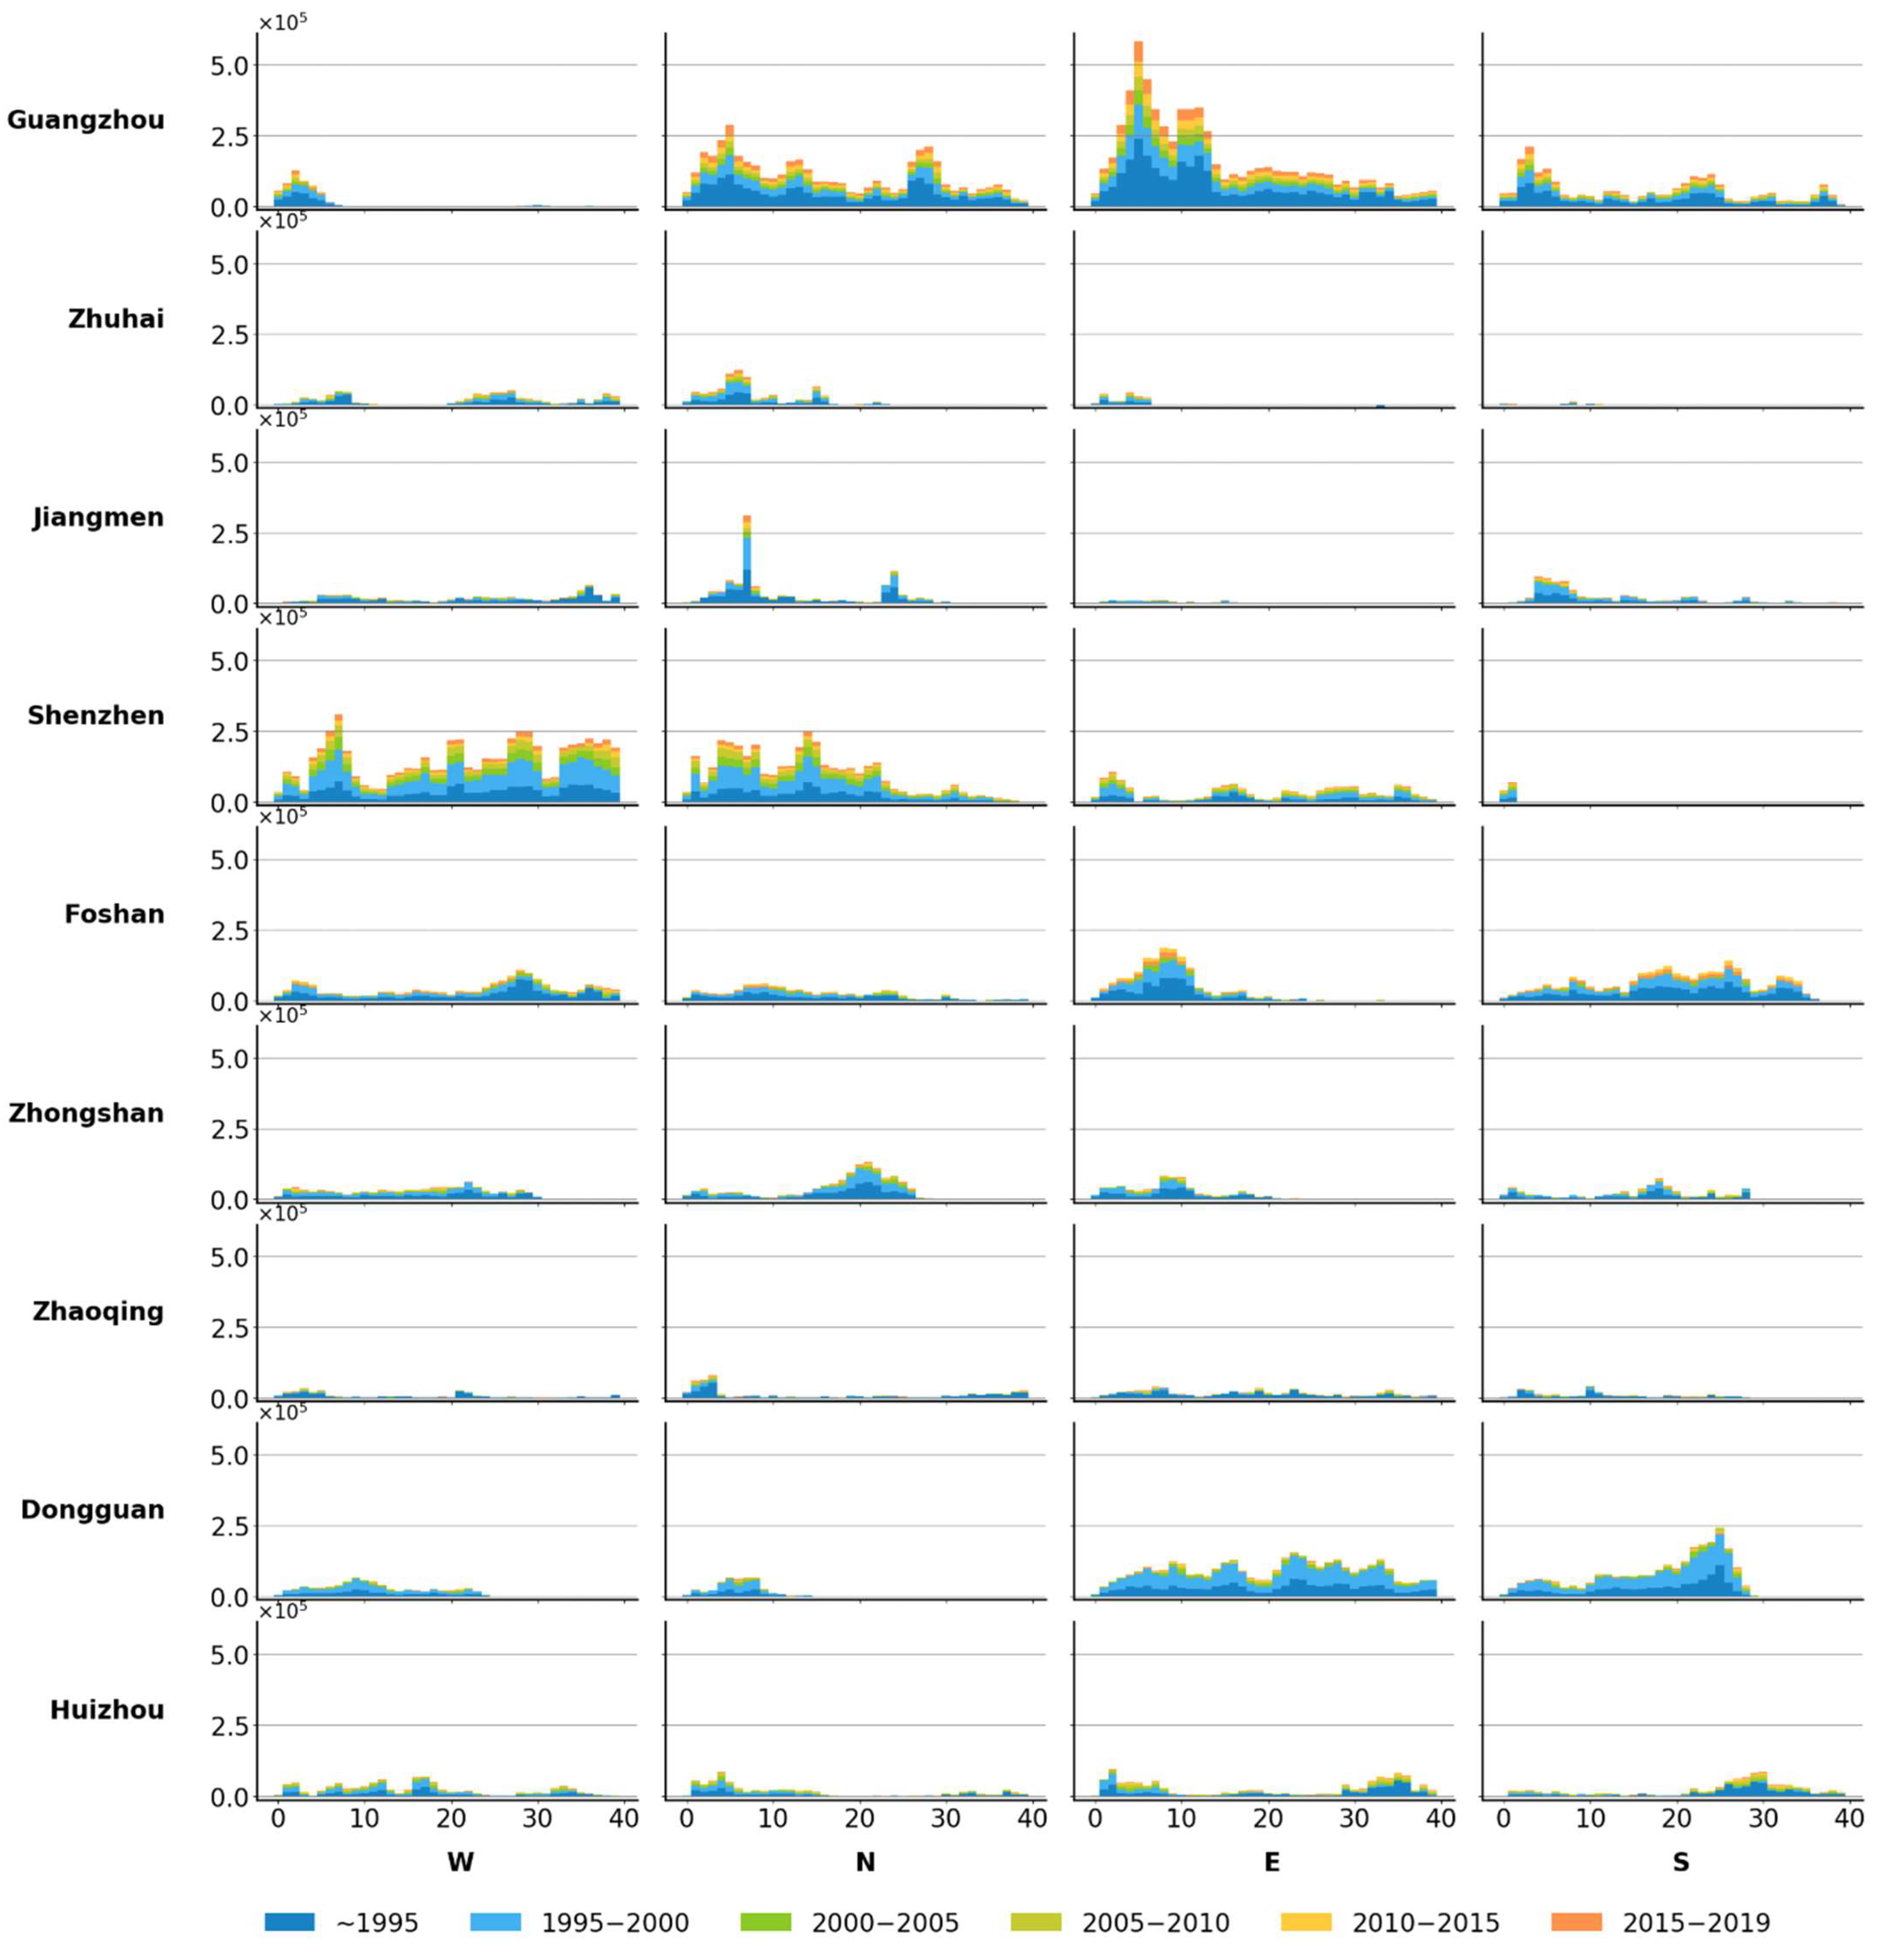
Figure 6,
Figure 7 and
Figure 8 demonstrate the dynamics of settlement expansion during each temporal stage in different directions. Each figure illustrates expansion dynamics of a subzone with
subplots representing four directions of
prefectures, marked by ‘W’, ‘N’, ‘E’, and ‘S’ in representation of west, north, east, and south, respectively. In each subplot, the y-axis represents the cumulative settlement increment and the x-axis represents the number of concentric rings where expansion occurred. As the ring number denotes distance to urban center at 1 km interval, the expansion pattern of settlements in every direction can be determined by distribution of evident growth on x-axis, for example, the growth concentrated in left-side of x-axis indicates expansion primarily clustered around urban center, growth concentrated in right-side of x-axis indicates expansion mainly occurred in urban fringe, and an even distribution indicates expansion is scattered within urban land, the above expansion pattern are commonly interpreted as infilling, edge expansion and dispersion, respectively.
The dynamics of settlement expansion of the Core subzone are depicted in
Figure 6. For this subzone, Guangzhou, Zhuhai, and Jiangmen show the infilling expansion pattern, growth of settlement is primarily concentrated within 15 km of the urban center. Settlement expansion is evenly distributed across the buffer radius in Shenzhen, Foshan, Zhongshan, and Zhaoqing, demonstrating the dispersion pattern. Settlements in Dongguan and Huizhou show a pattern of edge expansion, with settlement growth mainly occurring in eastern and southern directions, away from the urban center; however, minor expansion also appeared near the urban center in those two prefectures. Quantitatively, Guangzhou, Shenzhen, Foshan, and Dongguan exhibited the largest magnitude of total settlement growth in this subzone. Temporally, settlement increment in Guangzhou is stable in each temporal stage, indicating a stable and robust urban expansion. The same pattern is observed in Foshan, Shenzhen, and Huizhou, but their magnitude after 2005 is relatively minor. For the rest of the prefectures, settlement growth gradually decreased after 2000.
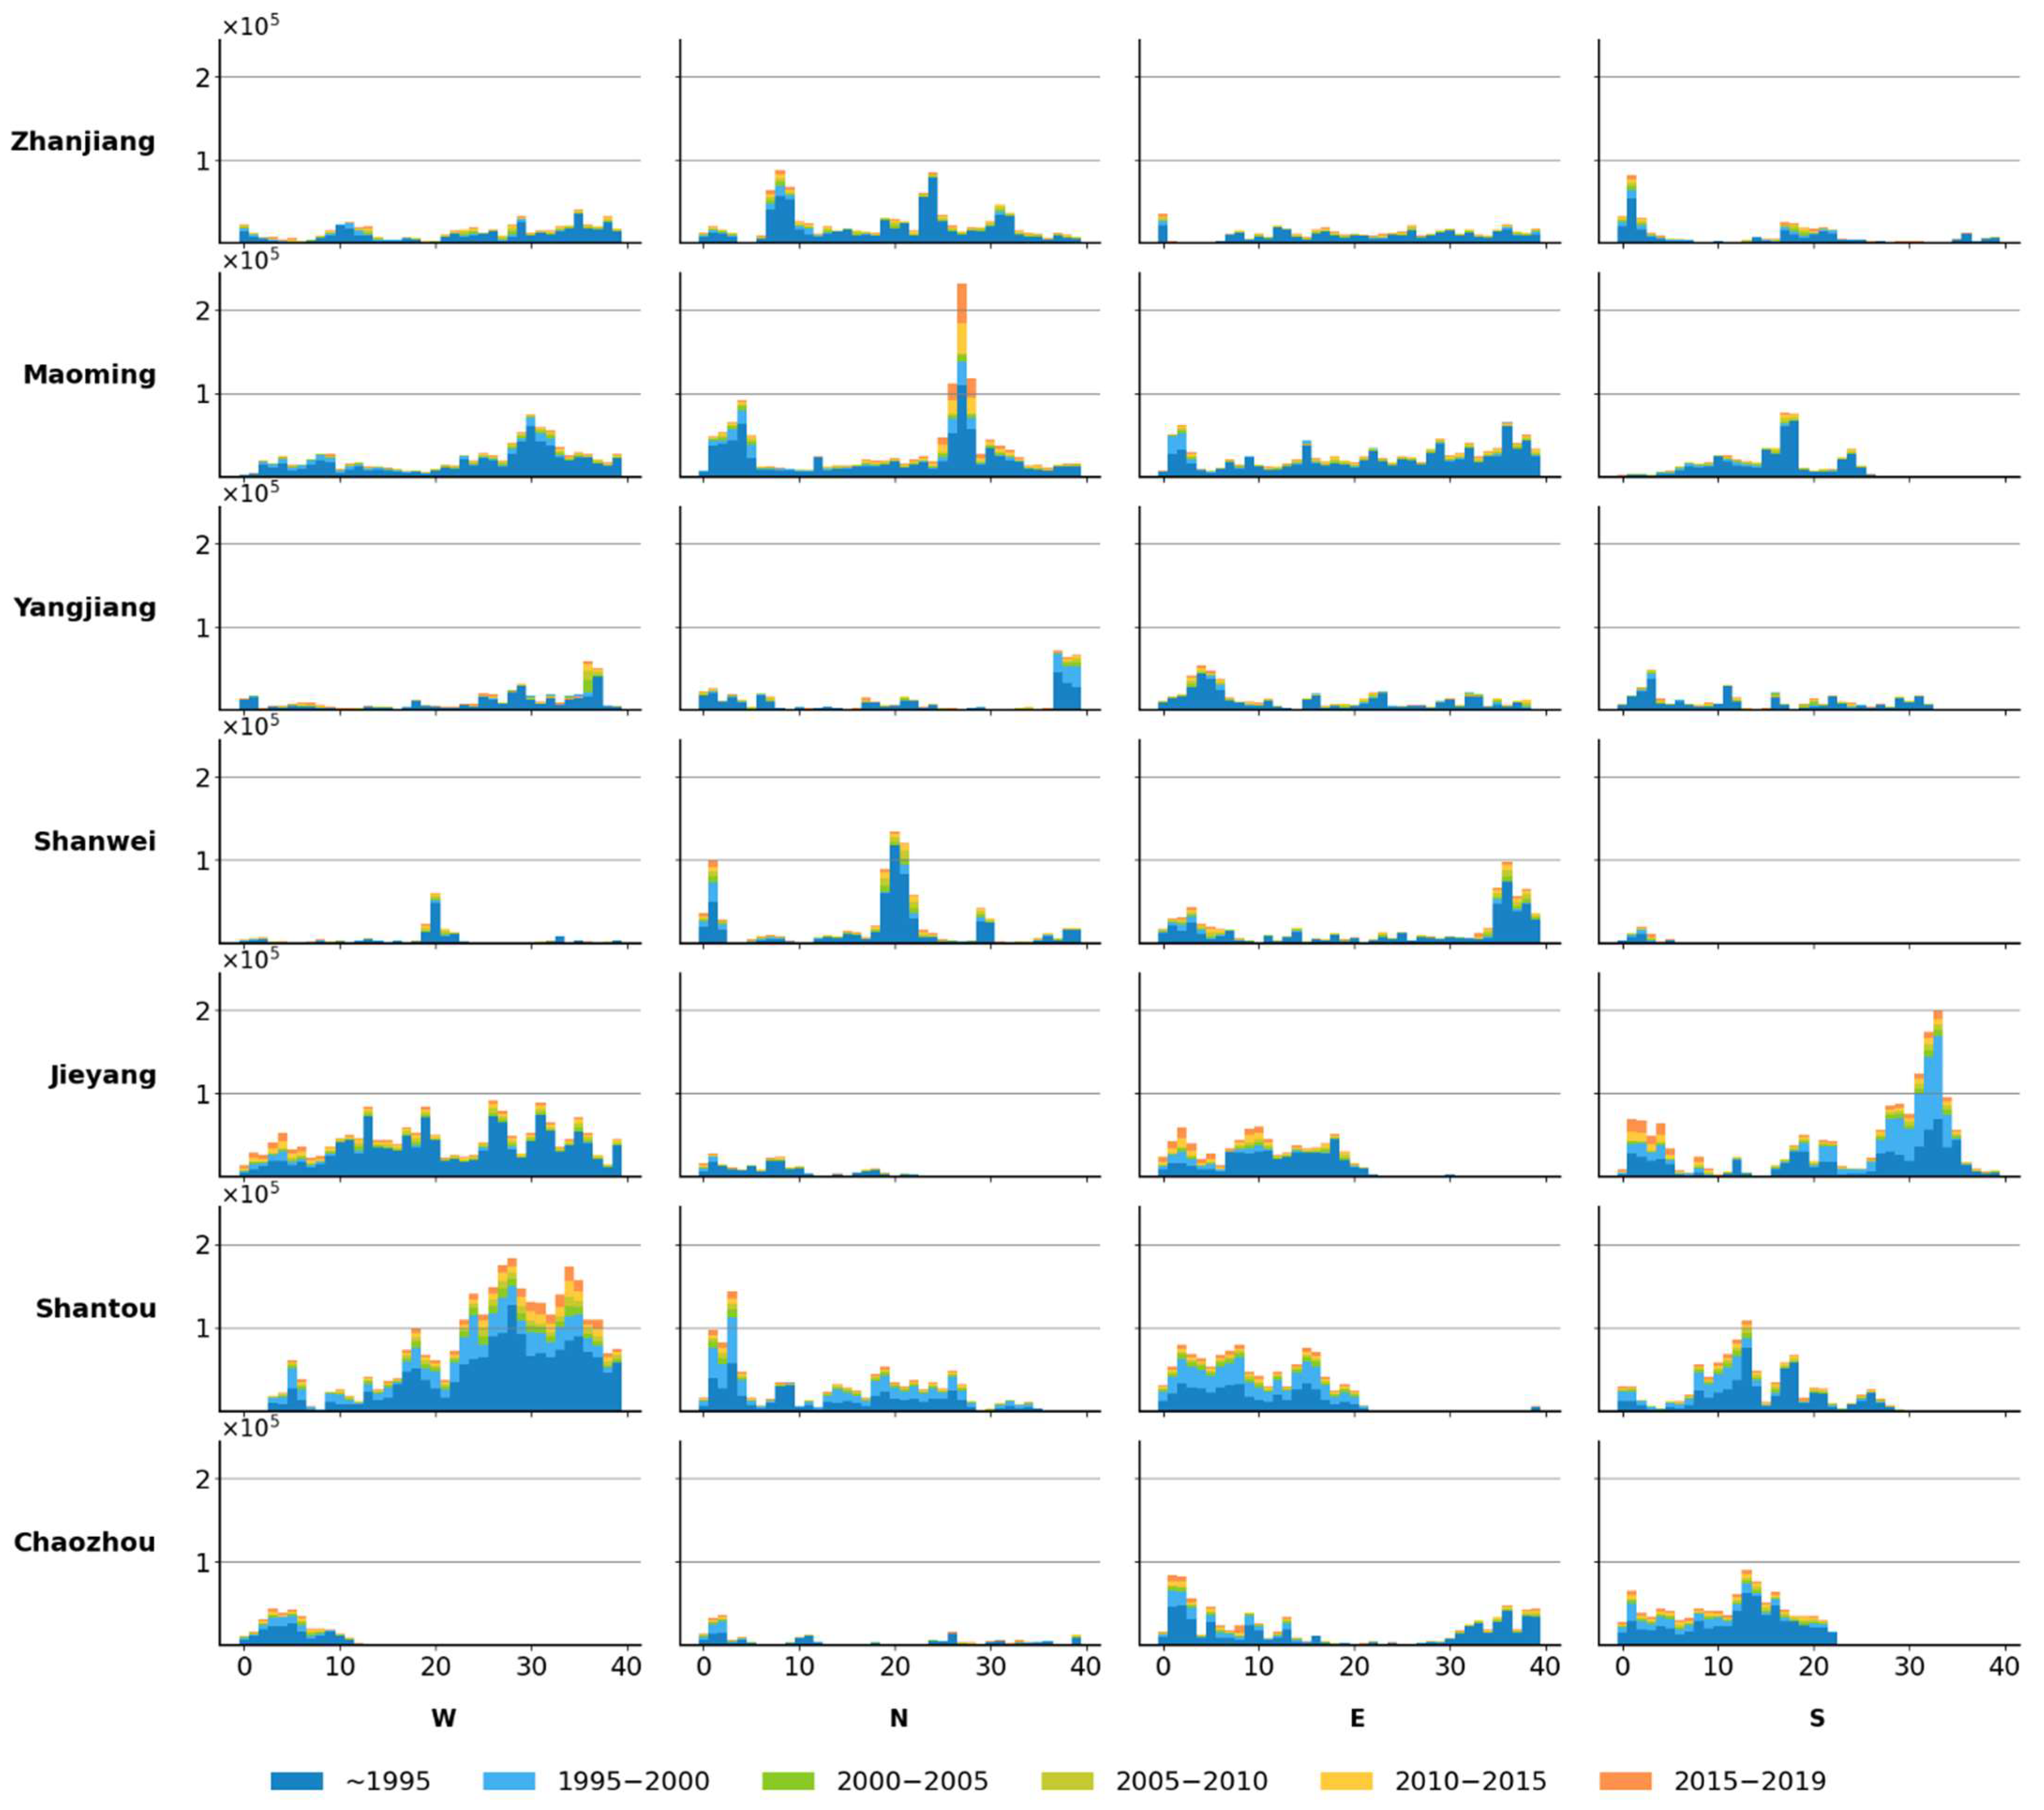
Figure 7 shows the dynamics of settlement expansion in the Belt subzone. As most urban centers are located along coastal line, many positions with settlement expansion are spaced by the sea from the urban center, leading to an inconsecutive distribution on the x-axis, thus, different from other subzones, dispersion becomes the major expansion type. Quantitatively, the expansion magnitude is lower than the Core subzone. Jieyang and Shantou have the largest increment, particularly, expansion in Jieyang mainly took place in the southern direction, while expansion in Shantou occurred in four directions. Temporally, except for the stable settlement expansion in southern Jieyang and western Shantou, expansion in other prefectures is stable yet minor, indicating a steady expansion with a small increment in this subzone.
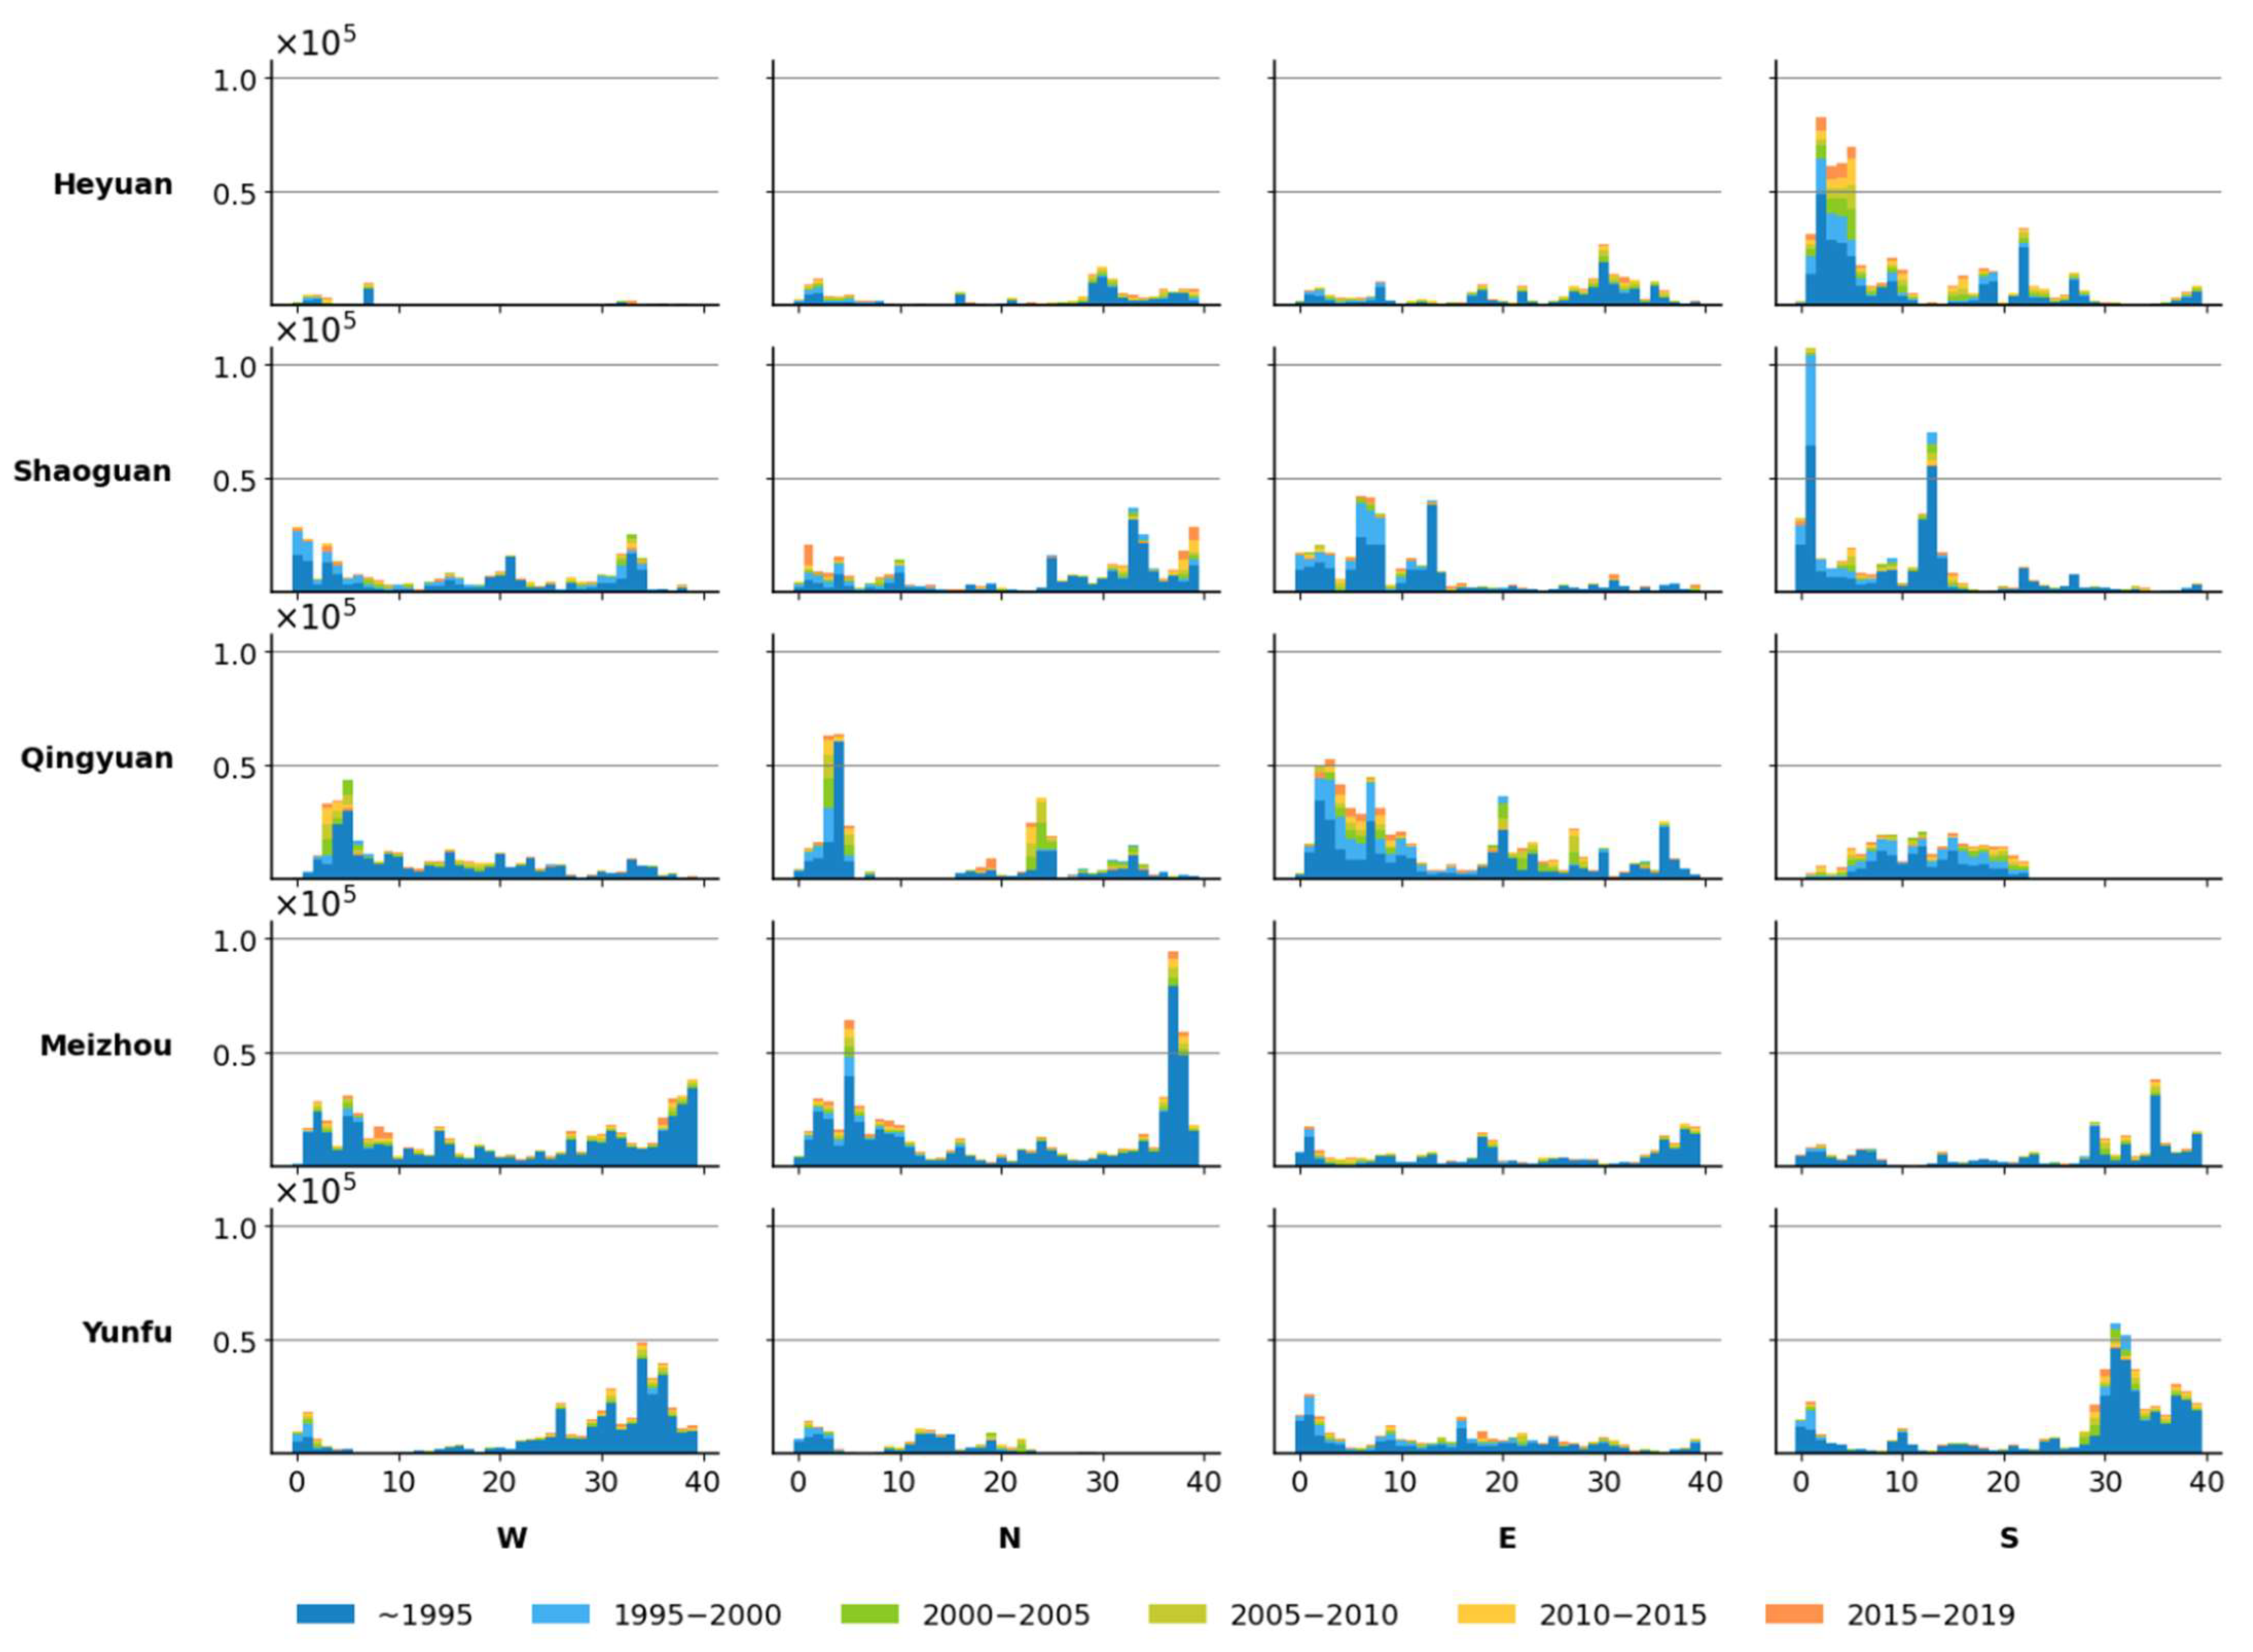
Figure 8 shows the dynamics of settlements expansion in the District subzone. Based on the distribution of expansion with distance to the urban center, expansion type in this subzone followed the same pattern as the Core subzone. Expansion types in Heyuan and Shaoguan belong to the Infilling, Qingyuan has the dispersion expansion across buffer rings, Meizohu and Yunfu have an obvious edge expansion, but the infilling also occurred in western and northern directions. Quantitatively, the magnitude of expansion in all prefectures is lower than the other two subzones; settlement expansion in eastern and southern directions takes up the majority proportion in most prefectures except Meizhou, indicating the geographical tendency of urban expansion in recent years. Temporally, a considerable magnitude of expansion can be found in Heyuan and Qingyuan post-2000, a phenomenon uncommon in Guangdong province, indicating urban construction exceeding population growth has been ongoing in this subzone since 2000.
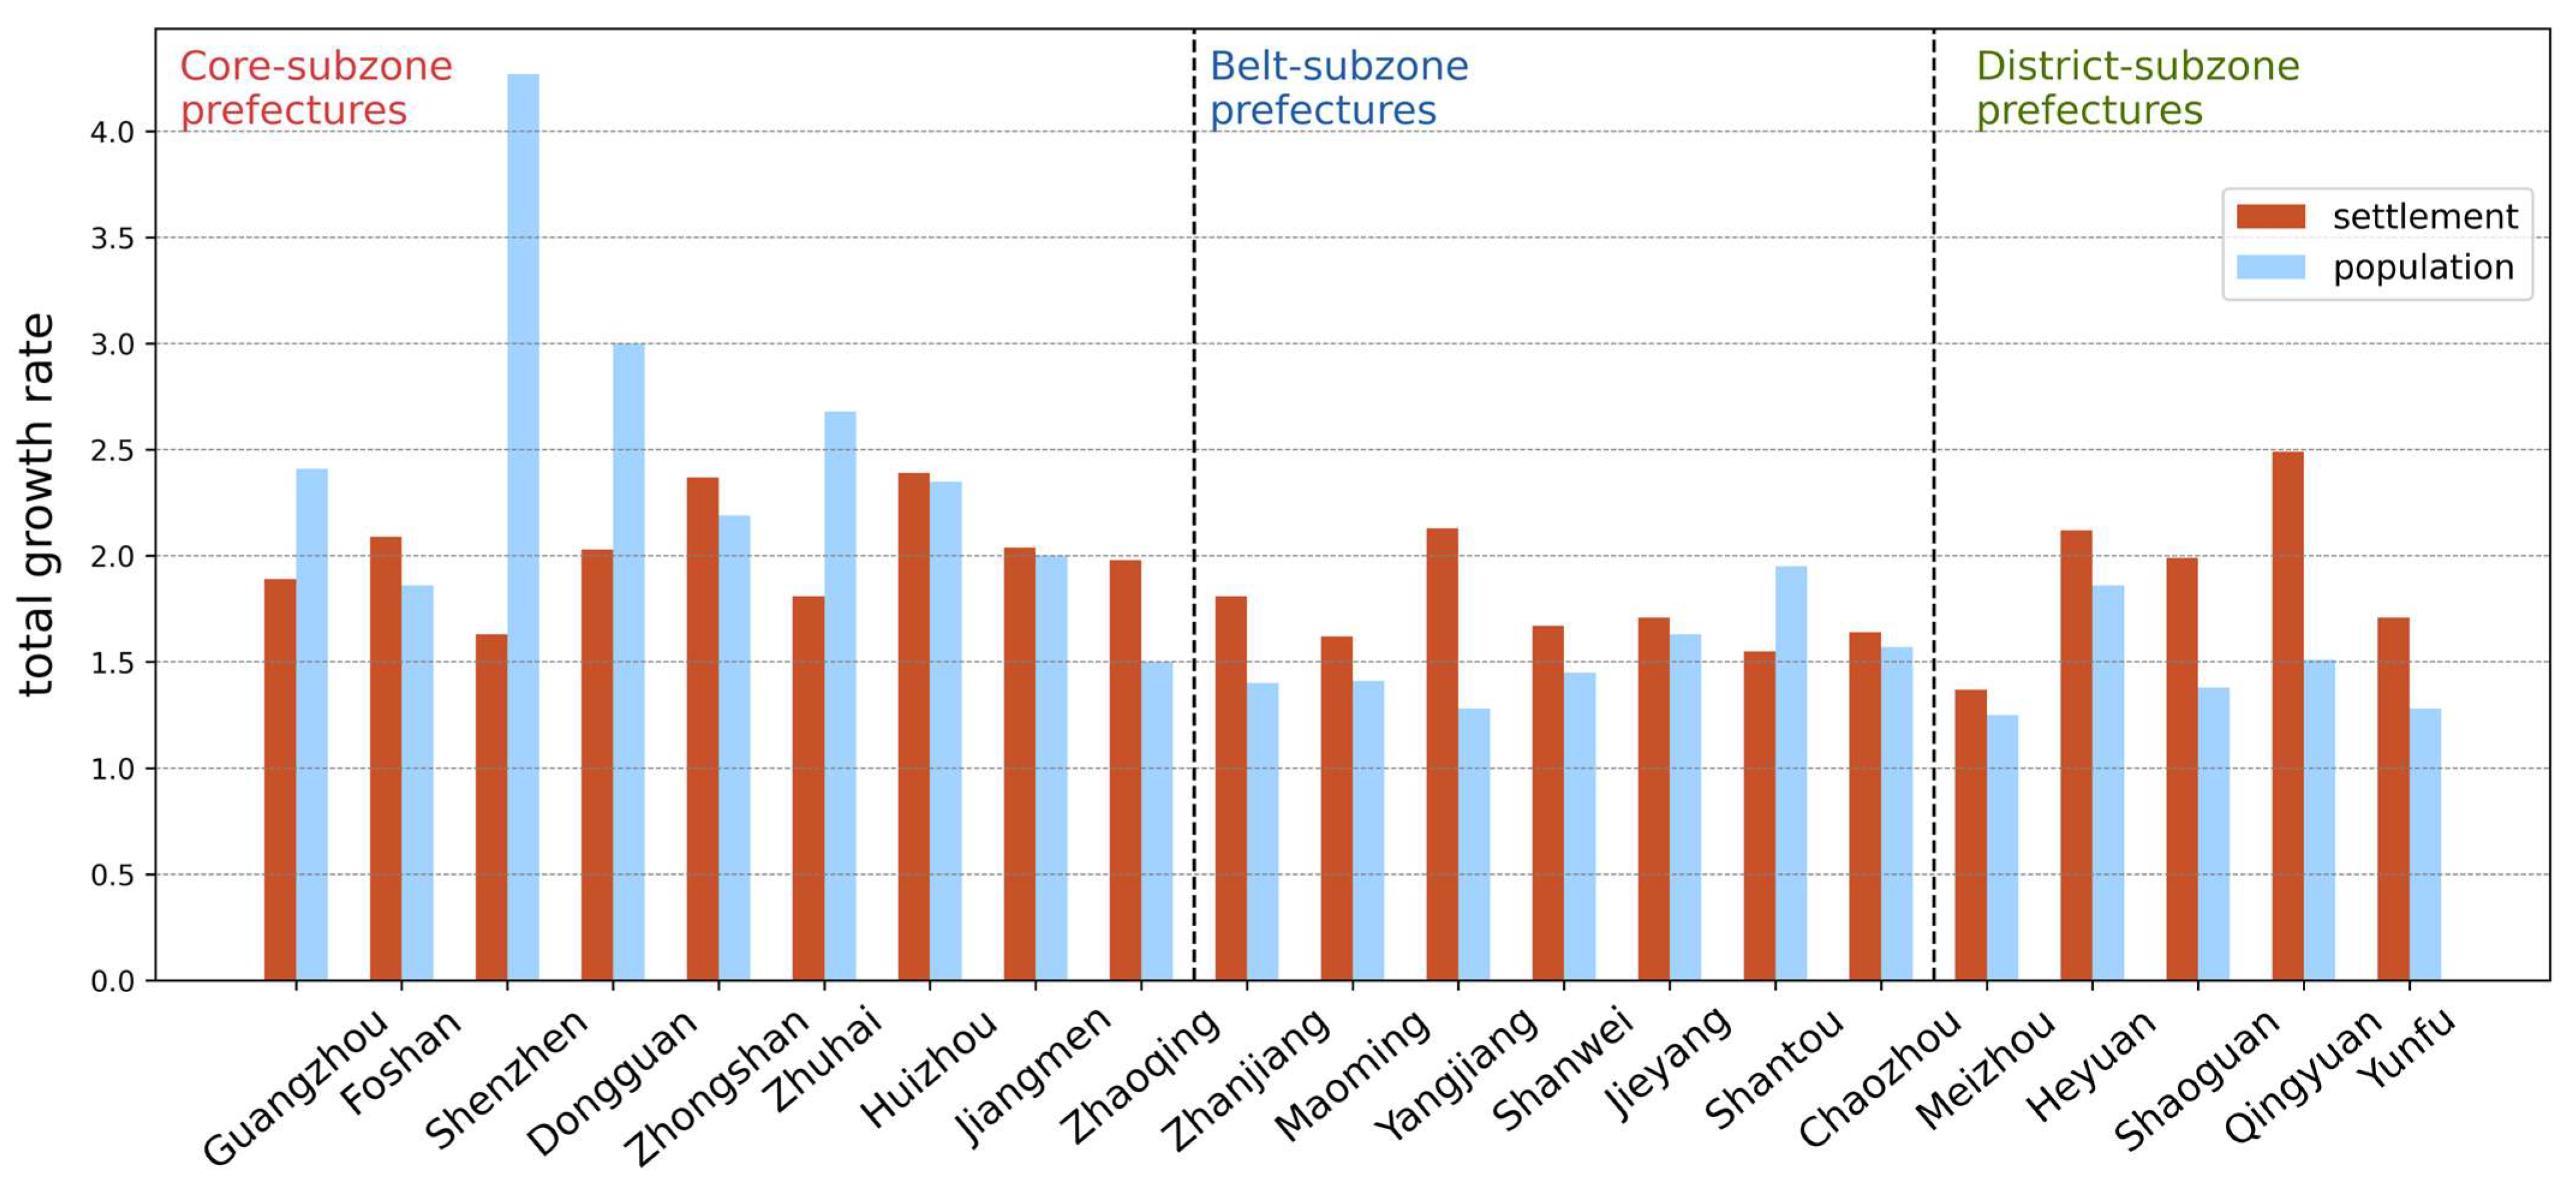
4.4. Total Growth at Administrative Scale
Figure 9 demonstrates the total growth rate of settlement and population during the study period for each prefecture. A noticeable difference exists between the two variables. For the Core subzone, the faster growth of population over that of settlements is observed in Guangzhou, Shenzhen, Dongguan, and Zhuhai, all of which have a higher urbanization degree and decent economic condition. Considering the fast urbanization process in China over the past decades, this trend is most likely attributed to sustained population inflow driven by economic opportunities and limited urban expansion. For the Belt subzone, while having a similar growth rate of settlements, the growth rate of population is lower than the Core subzone, a mark of demographic difference. Specifically, Shantou is the only prefecture outside the Core subzone with a higher population growth rate. For the District subzone group, despite the subzone’s economically and demographically constrained condition, settlement growth rates remain remarkably high. Especially in Heyuan, Shaoguan, and Qingyuan. Overall, except Guangzhou, Shenzhen, Dongguan, Zhuhai, and Shantou, the growth rate of urban land prevails over that of population in the majority of Guangdong province.
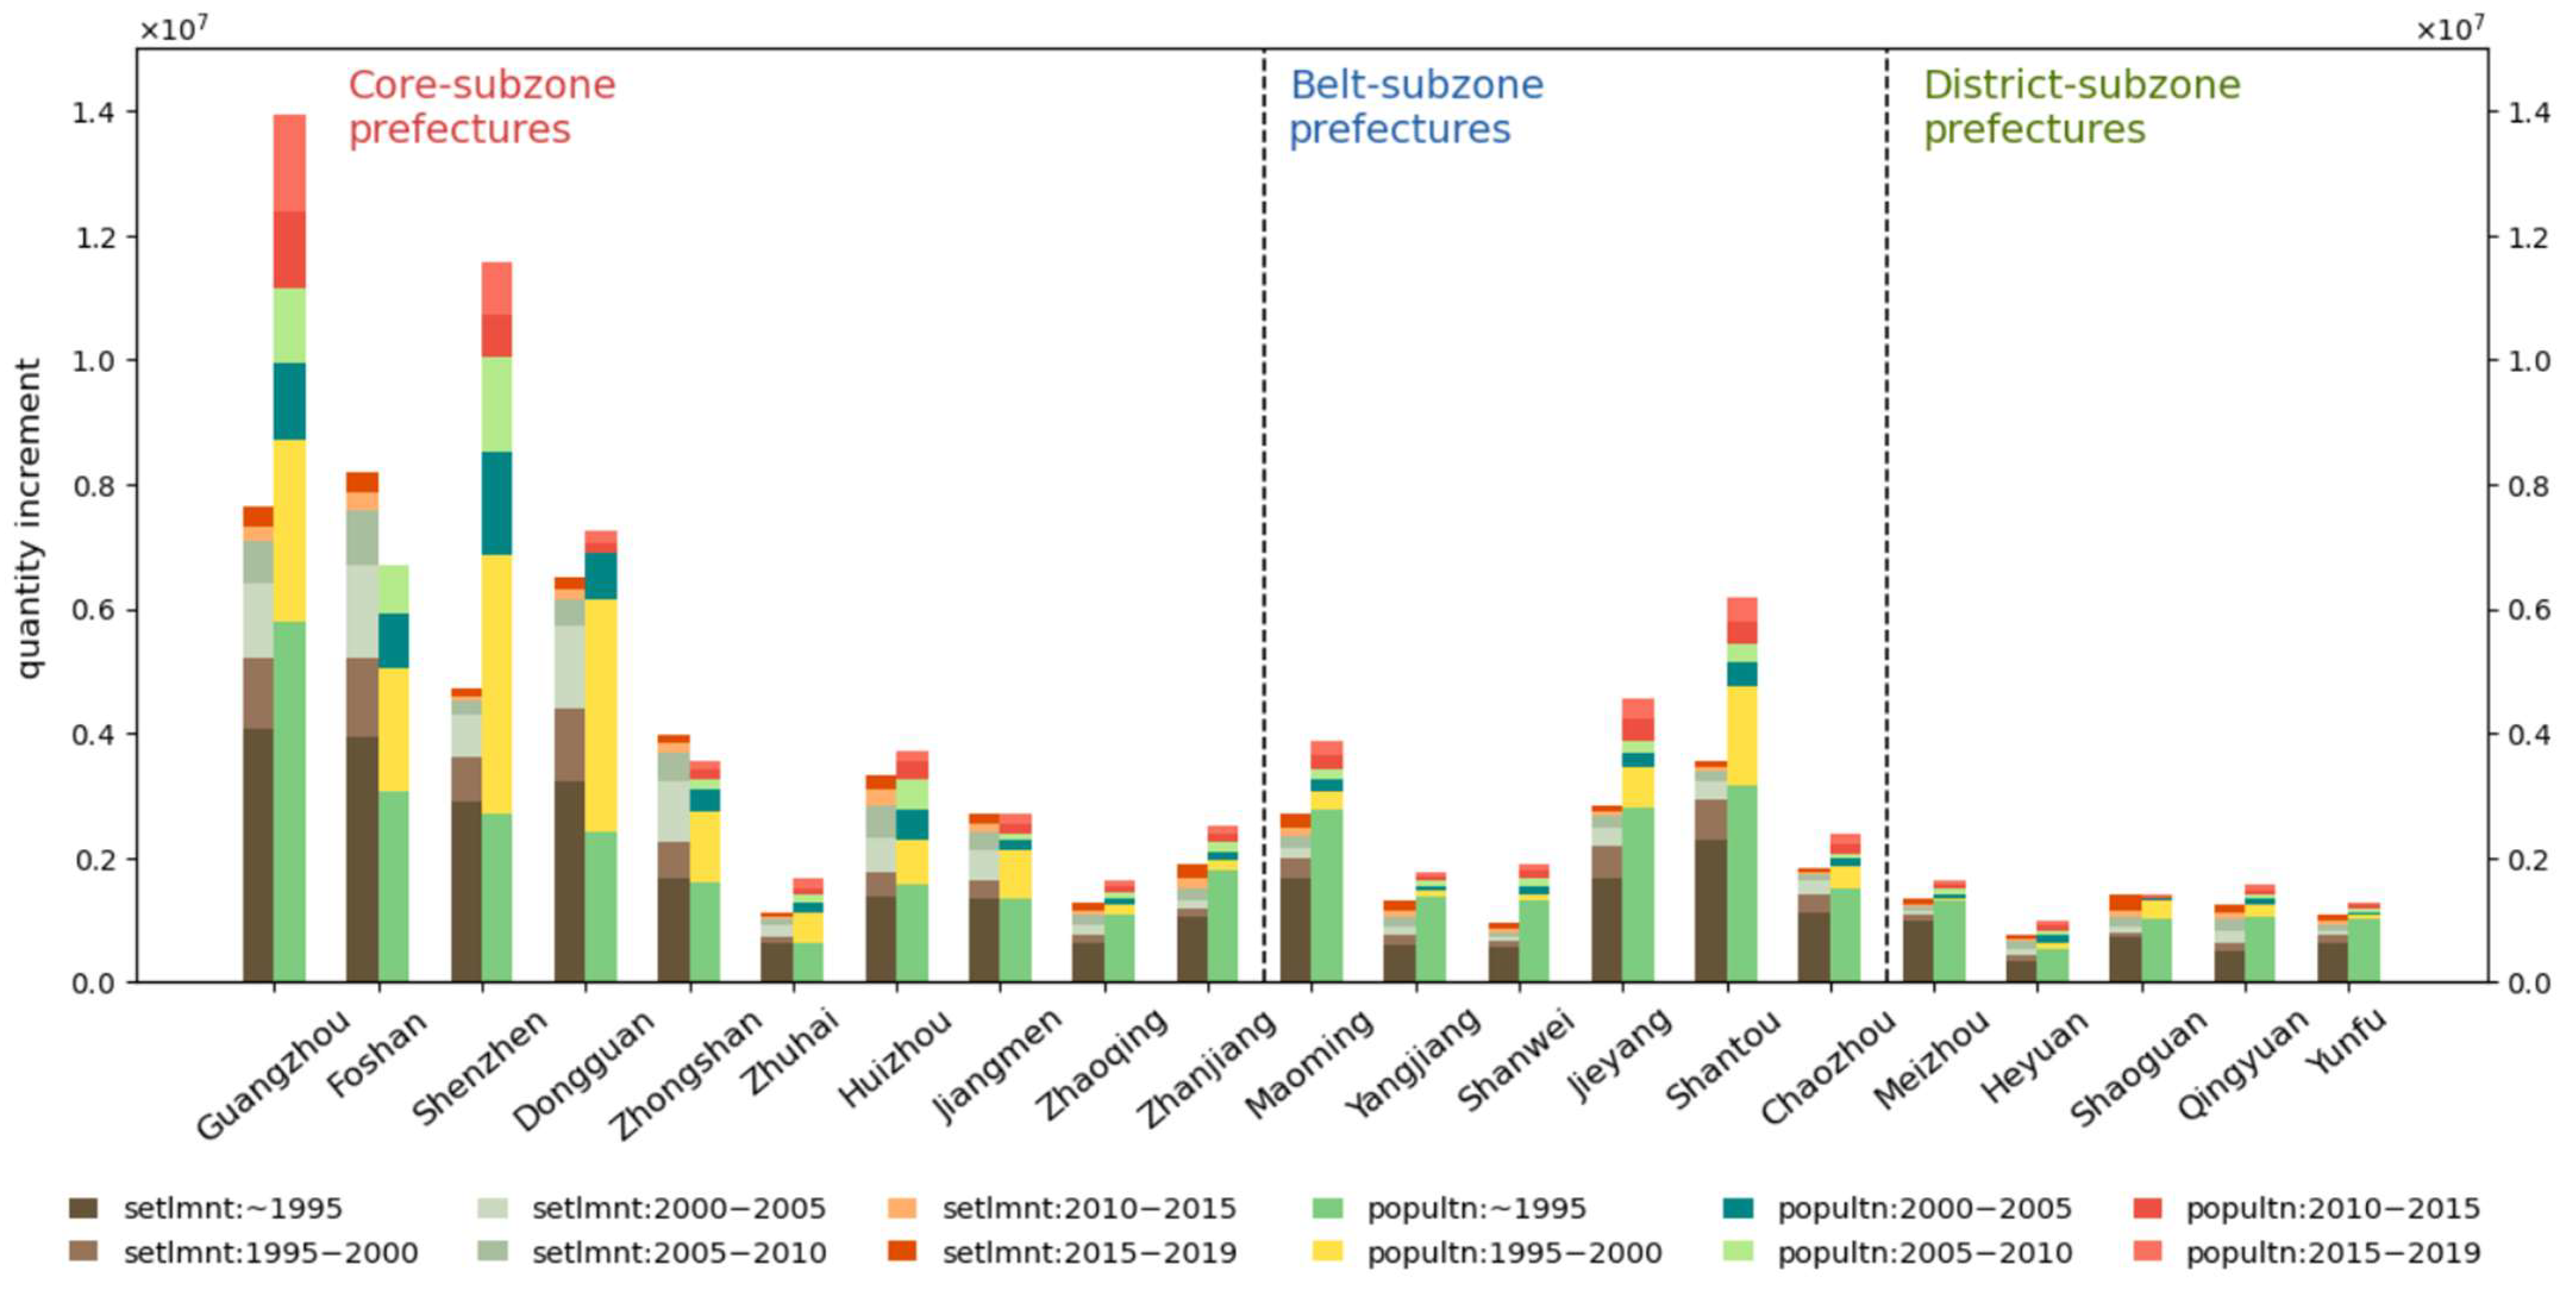
Growth rate highlights the relativity of growth and can be affected by base number, e.g., growth rate can be large when the original quantity is small and vice versa; thus, growth dynamics of settlement and population are compared in absolute quantity for a more explicit contrast. As demonstrated by
Figure 10, the most obvious pattern is that most prefectures have a larger total quantity for population than settlements, showing a converse quantitative trend against
Figure 9. However, for Foshan and Zhongshan, the growth rate of settlement is still larger. Temporally, for most prefectures, the greatest population increase happened between 1995 and 2000, followed by a deceleration. The settlements, however, experienced greater expansion after 2000 in the Core subzone, such as Foshan, Dongguan, and Zhongshan. In the District subzone, the temporal increment after 2000 is greater than that during 1995 to 2000, while in the Belt subzone, urban expansion increments are similar between 1995 and 2000, and 2000 and 2005, followed by a gradual decrease.
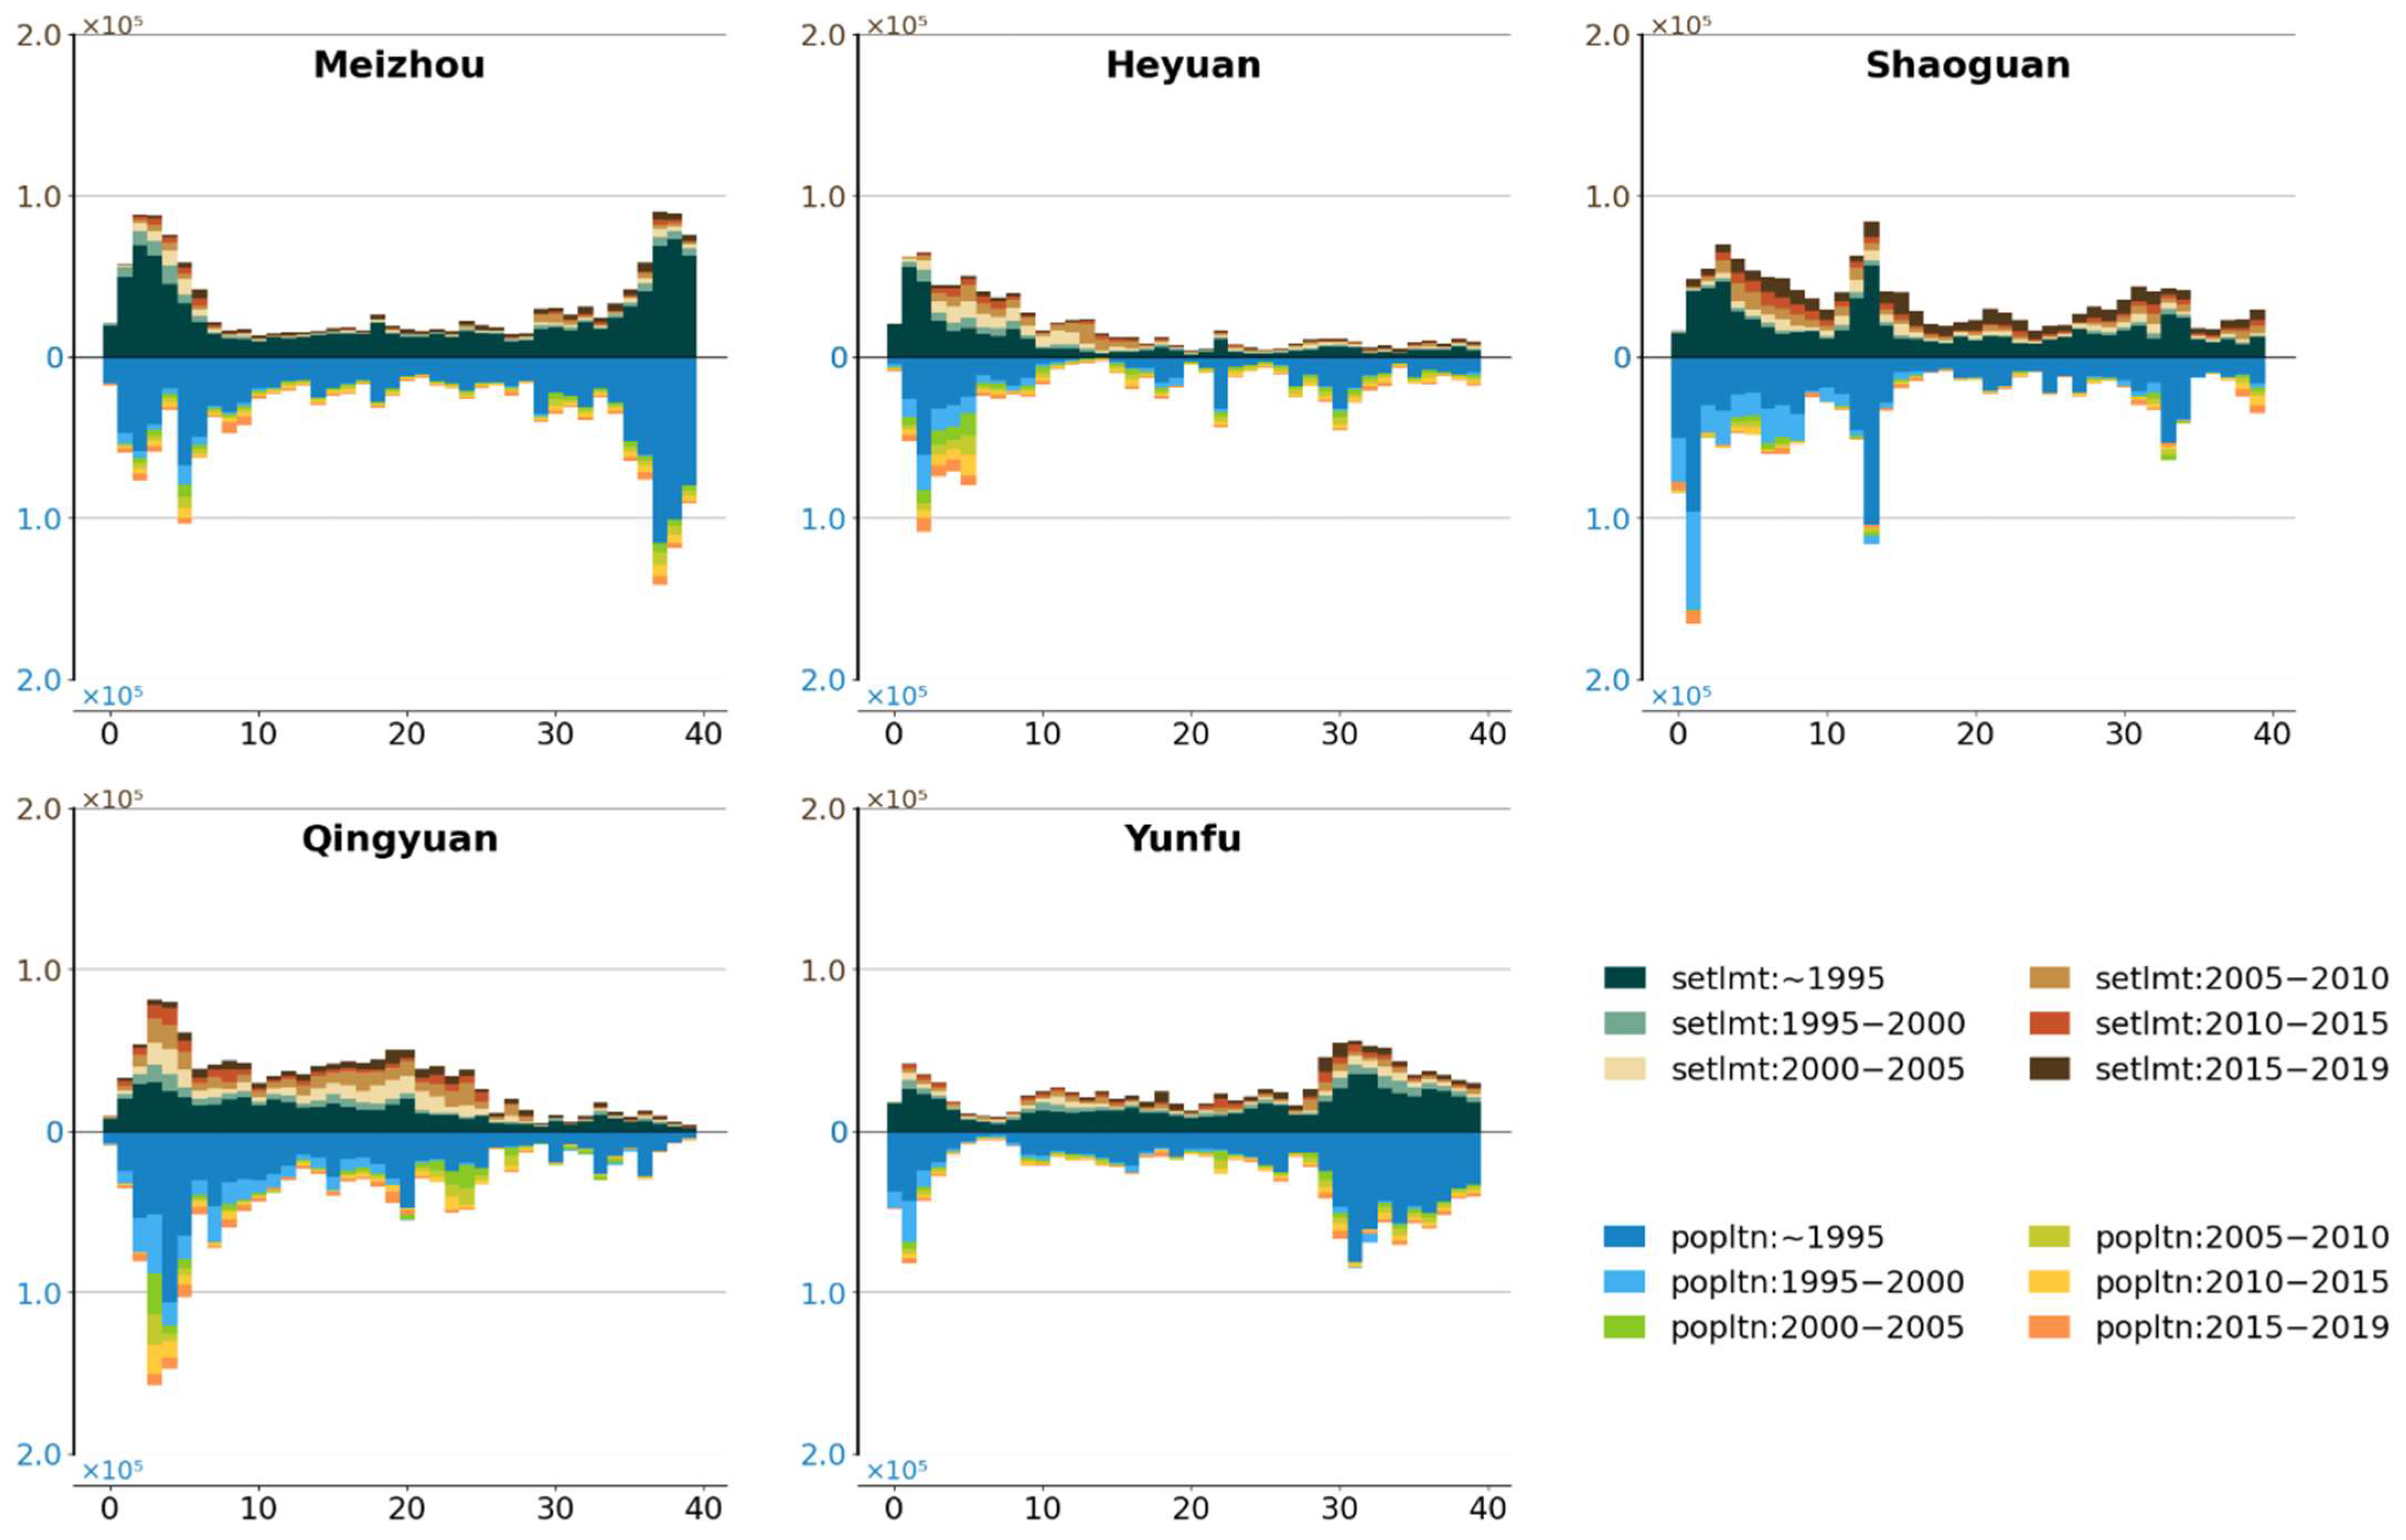
4.5. Consistency Between Settlement and Population at Buffer Zone Scale
Total growth rate and temporal increment revealed distinct growth pattern between urban land and population at provincial scale; however, to obtain deeper comprehension on urbanization consistency, it is vital to find out the specific spatial range and temporal stage with growth mismatch, thus, the incremental dynamics of both variables were compared at buffer zone scale through a symmetrical display on x-axis to intuitively exhibit their spatiotemporal alignment.
Figure 11 demonstrates a mismatch in urban growth and population dynamics of the Core subzone. In whole, an evident mismatch in quantity can be found in Guangzhou and Shenzhen. Spatially, population-dominant land can be found concentrated within a radius of 10 km around the urban center of most prefectures, especially Guangzhou, Zhuhai, Huizhou, and Jiangmen. Temporally, population increment is greater than settlement during 1995 to 2000, while in the next 5-year span, growth of settlement turned to be the greater than population, e.g., Guangzhou, Foshan, Dongguan, and Zhongshan, the temporal mismatch implies the awareness of urban planning to improve accommodation capacity after the surge of population.
Figure 12 demonstrates the mismatch in the Belt subzone. Overall, the quantity mismatch is observed in a few prefectures, such as Jieyang and Shantou. Spatially, prefectures in the first row, which are located in the west wing of Guangdong, have less growth for settlement and population after 1995 compared to the rest of the prefectures that are located in the east wing, except for population growth in Maoming after 2010. Temporally, the increment of population is larger than urban land after 1995 in Jieyang and Shantou, where the most evident mismatch took place, yet in the western wing, the increment of settlement is greater after 2005, especially in Zhanjiang and Yangjiang.
Figure 13 demonstrates the mismatch in the District subzone. Overall, the quantity mismatch between population and settlement is limited. Evident mismatch occurred within a range of 10 km away from the urban center across the subzone, while as the distance extends, settlements exhibit significantly faster increase after 2000, especially in Heyuan, Shaoguan, and Qingyuan. The faster growth of population only occurred in the central regions of Heyuan and Qingyuan from 1995 to 2015. This faster increase of settlement over population implies as population growth slows due to migration, the faster urban land expansion may result in extensive housing vacancy and low land use efficiency.
5. Discussion
This study examines the spatiotemporal alignment between urban land expansion and population dynamics in Guangdong, China, within the framework of global urbanization and Sustainable Development Goals (SDGs). While previous research has separately investigated urban land change and demographic shifts [
57,
58,
59,
60], our work provides a comprehensive analysis of their coupled relationship through detailed spatiotemporal comparisons.
Using buffer zone analysis with 5-year intervals (1995–2019), we reveal distinct development patterns across Guangdong’s three subzones that reflect regional economic disparities. The Core subzone, functioning as Guangdong’s industrial and manufacturing hub, exhibited the most rapid urban growth through infilling and edge-expansion patterns, with urban land expansion consistently outpacing population growth post-2000. This suggests capital-driven development preceded demographic changes. In contrast, the Belt subzone showed moderate, dispersed growth aligned with its export-oriented coastal economy, while the District subzone demonstrated limited infilling and edge expansion with evidence of settlement overfill—likely constrained by ecological priorities and weaker economic foundations. At the provincial scale, 76% of prefectures followed China’s characteristic urbanization pattern of urban expansion exceeding population growth [
61,
62,
63]. Only five prefectures exhibited faster population growth, attributed to sustained population influxes drawn by advanced urbanization and robust economic growth. To achieve balanced urban-population growth at the provincial scale, policymakers must address both unilateral migration patterns and uncontrolled urban sprawl through policy interventions. At a finer scale, population-dominated growth was mainly concentrated within 10 km around urban centers across Guangdong, consistent with findings in the Yangtze River Delta [
57]. The population concentration in urban centers suggests that improvement in public transportation can increase the commuting capacity of the urban zone.
Despite the valuable insights gained into the urbanization mismatch using NTL, limitations still exist. First, light saturation in bright city cores, especially for DMSP, distorts radiance values, masking intra-urban density variations. Second, NTL data struggle to capture populations in rural and peri-urban regions due to insufficient light coverage, resulting in systematic underestimation where artificial lighting is sparse or absent. This bias is exacerbated in developing regions where electrification rates may be low. Third, environmental factors like cloud cover, lunar illumination, and seasonal changes like vegetation, introduce temporal inconsistencies, requiring extensive preprocessing. Although calibration and fusion with ancillary data can mitigate some issues, these inherent constraints highlight the need for multi-source validation and context-specific adjustments, and ground-truth demographic data for validation remains essential.
6. Conclusions
This study investigated urban land expansion and its spatiotemporal consistency with population distribution in Guangdong Province, China, from 1995 to 2019. Utilizing global settlement layers and population distribution maps derived from nighttime light (NTL) data, we evaluated the growth of habitable urban land and population, and analyzed their spatiotemporal consistency using buffer zone analysis at 5-year intervals. A key methodological innovation was the use of separate urban–rural mapping approaches to minimize discrepancies in population spatialization compared to traditional census data.
Our analysis of Guangdong’s three subzones—Core, Belt, and District—revealed distinct patterns of urban land expansion influenced by development policies and economic conditions. Overall, the Core and District subzones exhibited infilling and edge expansion, while the Belt subzone showed dispersed growth. Notably, only 5 out of 21 prefectures exhibited faster population growth than urban expansion, likely due to sustained migration driven by economic opportunities and advanced urbanization. Quantitatively, both urban expansion and population growth followed a Core, Belt, District order. Spatially, population-dominated areas were primarily clustered within 10 km of most prefectures’ centers, while the District subzone extensively displayed overfilled settlements, indicating low efficient land use. Temporally, urban growth relative to population in the Core subzone turned from slower pre-2000 to faster post-2000, followed by gradual deceleration, while the Belt subzone maintained balanced growth throughout the study period, the District subzone sustained faster urban growth from 2000 to 2019. These findings provide valuable insights into the complex dynamics of urban land expansion and its relationship with population distribution.
The study highlights significant spatial, temporal, and quantitative discrepancies between these two key indicators of urbanization across Guangdong Province. These discrepancies underscore the importance of considering both urban land expansion and population distribution in the formulation of sustainable urban development strategies and policies. Furthermore, the enhanced methodology developed for population spatialization in this study, which minimizes discrepancies with census data by employing separate urban-rural mapping approaches, can be readily applied to other rapidly developing regions grappling with similar regional imbalances.
7. Future Works
Urbanization processes reduce environmental stability and create social imbalances through uneven demographic distribution, making a thorough understanding of urban growth patterns and their potential mismatch with population dynamics crucial for sustainable regional planning. Using Guangdong, China as a case study, we integrate NTL-based population spatialization with global settlement layers to categorize urban growth patterns across subzones and examine spatiotemporal settlement-population relationships at multiple scales. Validation against census records and benchmark datasets confirms our method’s reliability and generalizability. Our satellite-based framework provides a comprehensive, multidimensional (spatial, temporal, and quantitative) assessment of urban-population mismatches, offering precise references for sustainable development planning.
While advancing current understanding, this study has several limitations that suggest directions for improvement. First, data timeliness is constrained by settlement datasets that lag behind current development conditions. Although newer products like Global Built-up Surface (GBS) offer extended temporal coverage (1975–2030), their post-2020 extrapolated data raises reliability concerns. Higher-authenticity alternatives include ESA WorldCover and Google Dynamic World, though their varying spatial resolutions require harmonization.
Second, while census validation confirms strong NTL-population linear correlations in our study area, local conditions can create nonlinear relationships. Enhanced accuracy could be achieved through the following: (1) integrating supplementary geospatial data (land cover, building footprints, POIs) to better represent population distribution heterogeneity, and (2) employing advanced modeling techniques. Machine learning approaches like random forest and XGBoost improve variable interpretation [
64,
65], while neural networks excel at processing high-dimensional data and capturing complex nonlinear patterns with inherent noise resistance [
66]. In the future, more attention will be paid to the adaptation of supplementary data and complex techniques to provide more detailed population support for the achievement of SDGs.
Third, while buffer zone analysis has been extensively used in urbanization studies, the criterion for radius and ring interval selection lacks consensus, and the sensitivity of results to different parameter selection is scantily discussed. Most research chooses 1 km as an interval for simplicity and determines ring numbers based on the reach of the study region. Ref. [
67] leveraged a smaller buffer interval in accordance with the resolution of land use data, coinciding with our parameter selection policy. Refs. [
68,
69] chose different intervals for Shanghai and eight satellite cities; however, the impacts of different parameters are not analyzed. Future works can test the effect of different parameters on results with the above factors considered.
Like Guangzhou, many regions in the world are experiencing inconsistent urbanization; our methodology can be applied to provide scientific guidance for scientific urbanization planning and achieving sustainable regional development. The reliability of our framework can be validated by local census data or land-use survey information, ensuring agreement with realistic conditions.
Author Contributions
Conceptualization, F.Z. and Q.Z.; methodology, F.Z. and C.D.; software, F.Z. and C.D.; validation, F.Z. and Q.Z.; formal analysis, F.Z.; investigation, F.Z., Q.Z. and C.D.; resources, F.Z. and C.D.; data curation, F.Z.; writing—original draft preparation, F.Z.; writing—review and editing, Q.Z.; visualization, F.Z. and C.D.; supervision, Q.Z.; project administration, Q.Z.; funding acquisition, Q.Z. All authors have read and agreed to the published version of the manuscript.
Funding
This research was funded by the Shenzhen Science and Technology Program, grant number (Grant No. ZDSYS20210623091808026). The funder is the corresponding author, Qingling Zhang. The APC was funded by the same funding project.
Data Availability Statement
Acknowledgments
Special thanks to Di Liu, an alumnus, postdoc at the University of Oklahoma, for his valuable insights, which greatly facilitated this research. We are also grateful for all the experts who provided us with guidance and information.
Conflicts of Interest
The authors declare no conflicts of interest.
References
- Wang, X.; Zhang, S.; Zhao, X.; Shi, S.; Xu, L. Exploring the Relationship between the Eco-Environmental Quality and Urbanization by Utilizing Sentinel and Landsat Data: A Case Study of the Yellow River Basin. Remote Sens. 2023, 15, 743. [Google Scholar] [CrossRef]
- Xu, D.; Yang, F.; Yu, L.; Zhou, Y.; Li, H.; Ma, J.; Huang, J.; Wei, J.; Xu, Y.; Zhang, C.; et al. Quantization of the Coupling Mechanism between Eco-Environmental Quality and Urbanization from Multisource Remote Sensing Data. J. Clean. Prod. 2021, 321, 128948. [Google Scholar] [CrossRef]
- Li, L.; Zhan, W.; Hu, L.; Chakraborty, T.; Wang, Z.; Fu, P.; Wang, D.; Liao, W.; Huang, F.; Fu, H.; et al. Divergent Urbanization-Induced Impacts on Global Surface Urban Heat Island Trends since 1980s. Remote Sens. Environ. 2023, 295, 113650. [Google Scholar] [CrossRef]
- Liu, H.; Huang, B.; Zhan, Q.; Gao, S.; Li, R.; Fan, Z. The Influence of Urban Form on Surface Urban Heat Island and Its Planning Implications: Evidence from 1288 Urban Clusters in China. Sustain. Cities Soc. 2021, 71, 102987. [Google Scholar] [CrossRef]
- Wegmann, J. Residences without Residents: Assessing the Geography of Ghost Dwellings in Big U.S. Cities. J. Urban Aff. 2020, 42, 1103–1124. [Google Scholar] [CrossRef]
- Jin, X.; Long, Y.; Sun, W.; Lu, Y.; Yang, X.; Tang, J. Evaluating Cities’ Vitality and Identifying Ghost Cities in China with Emerging Geographical Data. Cities 2017, 63, 98–109. [Google Scholar] [CrossRef]
- Maja, M.M.; Ayano, S.F. The Impact of Population Growth on Natural Resources and Farmers’ Capacity to Adapt to Climate Change in Low-Income Countries. Earth Syst. Environ. 2021, 5, 271–283. [Google Scholar] [CrossRef]
- Khan, I.; Hou, F.; Le, H.P. The Impact of Natural Resources, Energy Consumption, and Population Growth on Environmental Quality: Fresh Evidence from the United States of America. Sci. Total Environ. 2021, 754, 142222. [Google Scholar] [CrossRef]
- Santillan, J.R.; Heipke, C. Assessing Patterns and Trends in Urbanization and Land Use Efficiency Across the Philippines: A Comprehensive Analysis Using Global Earth Observation Data and SDG 11.3.1 Indicators. PFG–J. Photogramm. Remote Sens. Geoinf. Sci. 2024, 92, 569–592. [Google Scholar] [CrossRef]
- Koroso, N.H.; Lengoiboni, M.; Zevenbergen, J.A. Urbanization and Urban Land Use Efficiency: Evidence from Regional and Addis Ababa Satellite Cities, Ethiopia. Habitat. Int. 2021, 117, 102437. [Google Scholar] [CrossRef]
- Ren, W.; Wei, L.; Lu, X.; Xu, J.; Qin, Y. Spatio–Temporal Dynamic Characteristics and Driving Mechanisms of Urban Compactness in Central China. Urban Sci. 2024, 8, 40. [Google Scholar] [CrossRef]
- Jia, M.; Zhang, H.; Yang, Z. Compactness or Sprawl: Multi-Dimensional Approach to Understanding the Urban Growth Patterns in Beijing-Tianjin-Hebei Region, China. Ecol. Indic. 2022, 138, 108816. [Google Scholar] [CrossRef]
- Wang, Y.; Pan, W.; Liao, Z. Impact of Urban Morphology on High-Density Commercial Block Energy Consumption in Severe Cold Regions. Sustainability 2024, 16, 5795. [Google Scholar] [CrossRef]
- Li, Y.; Wang, D.; Li, S.; Gao, W. Impact Analysis of Urban Morphology on Residential District Heat Energy Demand and Microclimate Based on Field Measurement Data. Sustainability 2021, 13, 2070. [Google Scholar] [CrossRef]
- Zhu, S.; Li, Y.; Wei, S.; Wang, C.; Zhang, X.; Jin, X.; Zhou, X.; Shi, X. The Impact of Urban Vegetation Morphology on Urban Building Energy Consumption during Summer and Winter Seasons in Nanjing, China. Landsc. Urban Plan. 2022, 228, 104576. [Google Scholar] [CrossRef]
- Zhang, M.; Du, H.; Zhou, G.; Mao, F.; Li, X.; Zhou, L.; Zhu, D.; Xu, Y.; Huang, Z. Spatiotemporal Patterns and Driving Force of Urbanization and Its Impact on Urban Ecology. Remote Sens. 2022, 14, 1160. [Google Scholar] [CrossRef]
- Hoffhine Wilson, E.; Hurd, J.D.; Civco, D.L.; Prisloe, M.P.; Arnold, C. Development of a Geospatial Model to Quantify, Describe and Map Urban Growth. Remote Sens. Environ. 2003, 86, 275–285. [Google Scholar] [CrossRef]
- Xu, C.; Liu, M.; Zhang, C.; An, S.; Yu, W.; Chen, J.M. The Spatiotemporal Dynamics of Rapid Urban Growth in the Nanjing Metropolitan Region of China. Landsc. Ecol. 2007, 22, 925–937. [Google Scholar] [CrossRef]
- Liu, X.; Li, X.; Chen, Y.; Tan, Z.; Li, S.; Ai, B. A New Landscape Index for Quantifying Urban Expansion Using Multi-Temporal Remotely Sensed Data. Landsc. Ecol. 2010, 25, 671–682. [Google Scholar] [CrossRef]
- Rao, Y.; Zhou, J.; Zhou, M.; He, Q.; Wu, J. Comparisons of Three-Dimensional Urban Forms in Different Urban Expansion Types: 58 Sample Cities in China. Growth Change 2020, 51, 1766–1783. [Google Scholar] [CrossRef]
- Liu, J.; Jiao, L.; Zhang, B.; Xu, G.; Yang, L.; Dong, T.; Xu, Z.; Zhong, J.; Zhou, Z. New Indices to Capture the Evolution Characteristics of Urban Expansion Structure and Form. Ecol. Indic. 2021, 122, 107302. [Google Scholar] [CrossRef]
- Wu, R.; Li, Z.; Wang, S. The Varying Driving Forces of Urban Land Expansion in China: Insights from a Spatial-Temporal Analysis. Sci. Total Environ. 2021, 766, 142591. [Google Scholar] [CrossRef]
- Du, P.; Hou, X.; Xu, H. Dynamic Expansion of Urban Land in China’s Coastal Zone since 2000. Remote Sens. 2022, 14, 916. [Google Scholar] [CrossRef]
- Jiao, L. Urban Land Density Function: A New Method to Characterize Urban Expansion. Landsc. Urban Plan. 2015, 139, 26–39. [Google Scholar] [CrossRef]
- Seto, K.C.; Fragkias, M. Quantifying Spatiotemporal Patterns of Urban Land-Use Change in Four Cities of China with Time Series Landscape Metrics. Landsc. Ecol. 2005, 20, 871–888. [Google Scholar] [CrossRef]
- Wu, S.; Sumari, N.S.; Dong, T.; Xu, G.; Liu, Y. Characterizing Urban Expansion Combining Concentric-Ring and Grid-Based Analysis for Latin American Cities. Land 2021, 10, 444. [Google Scholar] [CrossRef]
- Xu, G.; Dong, T.; Cobbinah, P.B.; Jiao, L.; Sumari, N.S.; Chai, B.; Liu, Y. Urban Expansion and Form Changes across African Cities with a Global Outlook: Spatiotemporal Analysis of Urban Land Densities. J. Clean. Prod. 2019, 224, 802–810. [Google Scholar] [CrossRef]
- Angel, S.; Parent, J.; Civco, D.L.; Blei, A.; Potere, D. The Dimensions of Global Urban Expansion: Estimates and Projections for All Countries, 2000–2050. Prog. Plan. 2011, 75, 53–107. [Google Scholar] [CrossRef]
- Seto, K.C.; Fragkias, M.; Güneralp, B.; Reilly, M.K. A Meta-Analysis of Global Urban Land Expansion. PLoS ONE 2011, 6, e23777. [Google Scholar] [CrossRef]
- Seto, K.C.; Güneralp, B.; Hutyra, L.R. Global Forecasts of Urban Expansion to 2030 and Direct Impacts on Biodiversity and Carbon Pools. Proc. Natl. Acad. Sci. USA 2012, 109, 16083–16088. [Google Scholar] [CrossRef]
- Liu, F.; Zhang, Z.; Shi, L.; Zhao, X.; Xu, J.; Yi, L.; Liu, B.; Wen, Q.; Hu, S.; Wang, X.; et al. Urban Expansion in China and Its Spatial-Temporal Differences over the Past Four Decades. J. Geogr. Sci. 2016, 26, 1477–1496. [Google Scholar] [CrossRef]
- Zhong, S.; Wang, M.; Zhu, Y.; Chen, Z.; Huang, X. Urban Expansion and the Urban–Rural Income Gap: Empirical Evidence from China. Cities 2022, 129, 103831. [Google Scholar] [CrossRef]
- Wang, S.; Li, G.; Fang, C. Urbanization, Economic Growth, Energy Consumption, and CO2 Emissions: Empirical Evidence from Countries with Different Income Levels. Renew. Sustain. Energy Rev. 2018, 81, 2144–2159. [Google Scholar] [CrossRef]
- Zhuo, L.; Ichinose, T.; Zheng, J.; Chen, J.; Shi, P.J.; Li, X. Modelling the Population Density of China at the Pixel Level Based on DMSP/OLS Non-radiance-calibrated Night-time Light Images. Int. J. Remote Sens. 2009, 30, 1003–1018. [Google Scholar] [CrossRef]
- Levin, N.; Duke, Y. High Spatial Resolution Night-Time Light Images for Demographic and Socio-Economic Studies. Remote Sens. Environ. 2012, 119, 1–10. [Google Scholar] [CrossRef]
- Zhao, F.; Song, L.; Peng, Z.; Yang, J.; Luan, G.; Chu, C.; Ding, J.; Feng, S.; Jing, Y.; Xie, Z. Night-Time Light Remote Sensing Mapping: Construction and Analysis of Ethnic Minority Development Index. Remote Sens. 2021, 13, 2129. [Google Scholar] [CrossRef]
- Lu, D.; Wang, Y.; Yang, Q.; Su, K.; Zhang, H.; Li, Y. Modeling Spatiotemporal Population Changes by Integrating DMSP-OLS and NPP-VIIRS Nighttime Light Data in Chongqing, China. Remote Sens. 2021, 13, 284. [Google Scholar] [CrossRef]
- Amaral, S.; Monteiro, A.M.V.; Camara, G.; Quintanilha, J.A. DMSP/OLS Night-time Light Imagery for Urban Population Estimates in the Brazilian Amazon. Int. J. Remote Sens. 2006, 27, 855–870. [Google Scholar] [CrossRef]
- China Statistical Yearbook 2024. Available online: https://www.stats.gov.cn/sj/ndsj/2024/indexeh.htm (accessed on 27 April 2025).
- Huang, L.; Du, J. Research on Zhanjiang’s Marine Economic Development Strategy Under the Strategic Background of “One Core, One Belt and One Zone”. Haiyang Kaifa Yu Guanli 2023, 40, 107–112. [Google Scholar]
- Marconcini, M.; Metz-Marconcini, A.; Esch, T.; Gorelick, N. Understanding Current Trends in Global Urbanisation—The World Settlement Footprint Suite. GI_Forum 2021, 9, 33–38. [Google Scholar] [CrossRef]
- Sutton, P. Modeling Population Density with Night-Time Satellite Imagery and GIS. Comput. Environ. Urban Syst. 1997, 21, 227–244. [Google Scholar] [CrossRef]
- Gorelick, N.; Hancher, M.; Dixon, M.; Ilyushchenko, S.; Thau, D.; Moore, R. Google Earth Engine: Planetary-Scale Geospatial Analysis for Everyone. Remote Sens. Environ. 2017, 202, 18–27. [Google Scholar] [CrossRef]
- Huang, X.; Li, J.; Yang, J.; Zhang, Z.; Li, D.; Liu, X. 30 m Global Impervious Surface Area Dynamics and Urban Expansion Pattern Observed by Landsat Satellites: From 1972 to 2019. Sci. China Earth Sci. 2021, 64, 1922–1933. [Google Scholar] [CrossRef]
- Yu, S.; Zhang, Z.; Liu, F. Monitoring Population Evolution in China Using Time-Series DMSP/OLS Nightlight Imagery. Remote Sens. 2018, 10, 194. [Google Scholar] [CrossRef]
- Zhao, M.; Zhou, Y.; Li, X.; Zhou, C.; Cheng, W.; Li, M.; Huang, K. Building a Series of Consistent Night-Time Light Data (1992–2018) in Southeast Asia by Integrating DMSP-OLS and NPP-VIIRS. IEEE Trans. Geosci. Remote Sens. 2020, 58, 1843–1856. [Google Scholar] [CrossRef]
- Zheng, Q.; Seto, K.C.; Zhou, Y.; You, S.; Weng, Q. Nighttime Light Remote Sensing for Urban Applications: Progress, Challenges, and Prospects. ISPRS J. Photogramm. Remote Sens. 2023, 202, 125–141. [Google Scholar] [CrossRef]
- Aubrecht, C.; Gunasekera, R.; Ungar, J.; Ishizawa, O. Consistent yet Adaptive Global Geospatial Identification of Urban–Rural Patterns: The iURBAN Model. Remote Sens. Environ. 2016, 187, 230–240. [Google Scholar] [CrossRef]
- Li, X.; Zhou, W. Dasymetric Mapping of Urban Population in China Based on Radiance Corrected DMSP-OLS Nighttime Light and Land Cover Data. Sci. Total Environ. 2018, 643, 1248–1256. [Google Scholar] [CrossRef]
- Xu, J.; Zhao, Y.; Sun, C.; Liang, H.; Yang, J.; Zhong, K.; Li, Y.; Liu, X. Exploring the Variation Trend of Urban Expansion, Land Surface Temperature, and Ecological Quality and Their Interrelationships in Guangzhou, China, from 1987 to 2019. Remote Sens. 2021, 13, 1019. [Google Scholar] [CrossRef]
- Ban, P.; Zhan, W.; Yuan, Q.; Li, X. Delineating the Urban Areas of a Cross-Boundary City with Open-Access Data: Guangzhou–Foshan, South China. Sustainability 2021, 13, 2930. [Google Scholar] [CrossRef]
- Chakraborty, S.; Maity, I.; Dadashpoor, H.; Novotnẏ, J.; Banerji, S. Building in or out? Examining Urban Expansion Patterns and Land Use Efficiency across the Global Sample of 466 Cities with Million+ Inhabitants. Habitat. Int. 2022, 120, 102503. [Google Scholar] [CrossRef]
- Dong, T.; Jiao, L.; Xu, G.; Yang, L.; Liu, J. Towards Sustainability? Analyzing Changing Urban Form Patterns in the United States, Europe, and China. Sci. Total Environ. 2019, 671, 632–643. [Google Scholar] [CrossRef] [PubMed]
- Fan, F.; Fan, W. Understanding Spatial-Temporal Urban Expansion Pattern (1990–2009) Using Impervious Surface Data and Landscape Indexes: A Case Study in Guangzhou (China). JARS 2014, 8, 083609. [Google Scholar] [CrossRef]
- Elvidge, C.D.; Ziskin, D.; Baugh, K.E.; Tuttle, B.T.; Ghosh, T.; Pack, D.W.; Erwin, E.H.; Zhizhin, M. A Fifteen Year Record of Global Natural Gas Flaring Derived from Satellite Data. Energies 2009, 2, 595–622. [Google Scholar] [CrossRef]
- Li, X.; Zhou, Y.; Zhao, M.; Zhao, X. A Harmonized Global Nighttime Light Dataset 1992–2018. Sci. Data 2020, 7, 168. [Google Scholar] [CrossRef]
- Xu, Y.; Chen, S.; Wang, Z.; Liu, B.; Wang, L. Multi-Scale Dynamics and Spatial Consistency of Economy and Population Based on NPP/VIIRS Nighttime Light Data and Population Imagery: A Case Study of the Yangtze River Delta. Remote Sens. 2024, 16, 2806. [Google Scholar] [CrossRef]
- Bagan, H.; Yamagata, Y. Analysis of Urban Growth and Estimating Population Density Using Satellite Images of Nighttime Lights and Land-Use and Population Data. GIScience Remote Sens. 2015, 52, 765–780. [Google Scholar] [CrossRef]
- Gafoor, F.A.; Cho, C.S.; Shehhi, M.R.A. Exploring the Relation between NPP-VIIRS Nighttime Lights and Carbon Footprint, Population Growth, and Energy Consumption in the UAE 2023. arXiv 2023, arXiv:2308.06366. [Google Scholar]
- Tan, M. Urban Growth and Rural Transition in China Based on DMSP/OLS Nighttime Light Data. Sustainability 2015, 7, 8768–8781. [Google Scholar] [CrossRef]
- Zhang, S.; Zheng, H.; Zhou, H.; Shao, Q.; Wu, Q. Sustainable Land Urbanization, Urban Amenities, and Population Urbanization: Evidence from City-Level Data in China. Soc. Sci. Q. 2021, 102, 1686–1698. [Google Scholar] [CrossRef]
- Song, X.; Feng, Q.; Xia, F.; Li, X.; Scheffran, J. Impacts of Changing Urban Land-Use Structure on Sustainable City Growth in China: A Population-Density Dynamics Perspective. Habitat. Int. 2021, 107, 102296. [Google Scholar] [CrossRef]
- Wang, Y.; van Vliet, J.; Debonne, N.; Pu, L.; Verburg, P.H. Settlement Changes after Peak Population: Land System Projections for China until 2050. Landsc. Urban Plan. 2021, 209, 104045. [Google Scholar] [CrossRef]
- Zhao, S.; Liu, Y.; Zhang, R.; Fu, B. China’s Population Spatialization Based on Three Machine Learning Models. J. Clean. Prod. 2020, 256, 120644. [Google Scholar] [CrossRef]
- Wu, B.; Yang, C.; Chen, Z.; Wu, Q.; Yu, S.; Wang, C.; Li, Q.; Wu, J.; Yu, B. The Relationship Between Urban 2-D/3-D Landscape Pattern and Nighttime Light Intensity. IEEE J. Sel. Top. Appl. Earth Obs. Remote Sens. 2022, 15, 478–489. [Google Scholar] [CrossRef]
- Zhuang, H.; Liu, X.; Yan, Y.; Ou, J.; He, J.; Wu, C. Mapping Multi-Temporal Population Distribution in China from 1985 to 2010 Using Landsat Images via Deep Learning. Remote Sens. 2021, 13, 3533. [Google Scholar] [CrossRef]
- Cao, H.; Liu, J.; Fu, C.; Zhang, W.; Wang, G.; Yang, G.; Luo, L. Urban Expansion and Its Impact on the Land Use Pattern in Xishuangbanna since the Reform and Opening up of China. Remote Sens. 2017, 9, 137. [Google Scholar] [CrossRef]
- Li, X.; Zhang, L.; Liang, C. A GIS-Based Buffer Gradient Analysis on Spatiotemporal Dynamics of Urban Expansion in Shanghai and Its Major Satellite Cities. Procedia Environ. Sci. 2010, 2, 1139–1156. [Google Scholar] [CrossRef]
- Yang, Y.; Liu, Y.; Li, Y.; Du, G. Quantifying Spatio-Temporal Patterns of Urban Expansion in Beijing during 1985–2013 with Rural-Urban Development Transformation. Land Use Policy 2018, 74, 220–230. [Google Scholar] [CrossRef]
Figure 1.
Functional zoning and geographical location of Guangdong province.
Figure 1.
Functional zoning and geographical location of Guangdong province.
Figure 2.
Flowchart for consistency analysis in Guangdong province using nighttime light and settlement data.
Figure 2.
Flowchart for consistency analysis in Guangdong province using nighttime light and settlement data.
Figure 3.
Procedure of urban center selection in Guangzhou, capital of Guangdong province. Subplot (a) shows the clip of Guangzhou administrative boundary, (b) and (c) respectively shows the distribution of NTL and artificial land within the clip. Particularly, artificial land pixels in (c) with earlier timestamps are presented in yellow and later presented in red. Location with highest DN intensity and earliest exploitation time is typically the center of a city, which is marked as the green point in (d).
Figure 4.
Range of buffer zone in the north direction, with Shenzhen as an example.
Figure 4.
Range of buffer zone in the north direction, with Shenzhen as an example.
Figure 5.
Sum of pixel DN value in Guangdong from original and processed images through study period. Solid lines represent trend of DN sum from original images and dashed lines represent that from processed images.
Figure 5.
Sum of pixel DN value in Guangdong from original and processed images through study period. Solid lines represent trend of DN sum from original images and dashed lines represent that from processed images.
Figure 6.
Dynamics of settlement expansion in different directions of the Core subzone. In each subplot, the x-axis represents number of concentric rings, y-axis represents quantity of increment. Expansion type can be determined by the number of rings where expansion occurred and expansion time is represented by the color of bin. Same for figures below in this section.
Figure 7.
Dynamics of settlement expansion in different directions of the Belt subzone.
Figure 7.
Dynamics of settlement expansion in different directions of the Belt subzone.
Figure 8.
Dynamics of settlement expansion in different directions of the District subzone.
Figure 8.
Dynamics of settlement expansion in different directions of the District subzone.
Figure 9.
Total growth rate for settlements and population in each prefecture during the study period.
Figure 9.
Total growth rate for settlements and population in each prefecture during the study period.
Figure 10.
Increment of settlement quantity and population count in each temporal stage.
Figure 10.
Increment of settlement quantity and population count in each temporal stage.
Figure 11.
Spatiotemporal alignment between settlements and population at buffer zone scale in the Core subzone.
Figure 11.
Spatiotemporal alignment between settlements and population at buffer zone scale in the Core subzone.
Figure 12.
Spatiotemporal alignment between settlements and population at buffer zone scale in the Belt subzone.
Figure 12.
Spatiotemporal alignment between settlements and population at buffer zone scale in the Belt subzone.
Figure 13.
Spatiotemporal alignment between settlements and population at buffer zone scale in the District subzone.
Figure 13.
Spatiotemporal alignment between settlements and population at buffer zone scale in the District subzone.
Table 1.
Calibration coefficients for DMSP-OLS images. Data in black represents optimized coefficients with better calibration effects, data in blue represents kept coefficients from reference work.
Table 1.
Calibration coefficients for DMSP-OLS images. Data in black represents optimized coefficients with better calibration effects, data in blue represents kept coefficients from reference work.
| Satellite | | | | | |
|---|
| F101992 | 1.6462 | 0.7887 | 0.0018 | 0.9812 | 1.6784 |
| F101993 | −0.6608 | 1.104 | −0.0031 | 0.9953 | 0.793 |
| F101994 | 1.3087 | 0.8922 | −0.0004 | 0.984 | 1.595 |
| F121994 | 1.4318 | 0.6273 | 0.0047 | 0.9478 | 2.9837 |
| F121995 | 0.6495 | 0.7977 | 0.001 | 0.9608 | 2.5888 |
| F121996 | 1.6255 | 0.727 | 0.0027 | 0.9716 | 2.1967 |
| F121997 | 0.4176 | 0.7686 | 0.0028 | 0.969 | 2.179 |
| F121998 | 1.0554 | 0.5449 | 0.0055 | 0.9736 | 2.7661 |
| F121999 | 1.5706 | 0.4731 | 0.0063 | 0.9613 | 3.3543 |
| F141997 | 0.1617 | 1.1521 | −0.0029 | 0.9871 | 1.2277 |
| F141998 | 1.9157 | 0.8932 | −0.0005 | 0.9808 | 1.7504 |
| F141999 | 0.6451 | 0.9543 | −0.0006 | 0.9948 | 0.8545 |
| F142000 | 1.7528 | 0.7779 | 0.0011 | 0.9695 | 2.2903 |
| F142001 | 0.8781 | 0.7903 | 0.0013 | 0.9666 | 2.3549 |
| F142002 | 1.3648 | 0.6628 | 0.0040 | 0.9821 | 2.2809 |
| F142003 | 0.8566 | 0.775 | 0.0012 | 0.9559 | 2.7934 |
| F152000 | 0.4816 | 0.5850 | 0.0051 | 0.9780 | 2.5347 |
| F152001 | 0.5699 | 0.5790 | 0.0058 | 0.9806 | 2.3729 |
| F152002 | 1.1773 | 0.4723 | 0.0070 | 0.9774 | 2.5632 |
| F152004 | 1.3358 | 0.7435 | 0.0032 | 0.9803 | 1.7718 |
| F152005 | 0.1758 | 0.8458 | 0.0016 | 0.9822 | 1.6403 |
| F152006 | 0.4979 | 0.8196 | 0.0022 | 0.9846 | 1.5266 |
| F152007 | 1.6631 | 0.7507 | 0.0027 | 0.9804 | 1.7479 |
| F162004 | 0.9376 | 0.6658 | 0.0042 | 0.9838 | 2.1760 |
| F162005 | 0.1366 | 0.88 | 0.0005 | 0.9802 | 1.7188 |
| F162006 | 0.8544 | 0.6405 | 0.0045 | 0.9334 | 3.3025 |
| F162007 | 1.3989 | 0.4562 | 0.0069 | 0.9664 | 3.1223 |
| F162008 | 1.2588 | 0.5202 | 0.0059 | 0.9686 | 3.0233 |
| F162009 | 1.9049 | 0.6641 | 0.0035 | 0.9571 | 2.7242 |
| F182010 | 2.1357 | 0.1869 | 0.0104 | 0.9628 | 3.2883 |
| F182011 | 2.2331 | 0.3531 | 0.0072 | 0.9228 | 4.7330 |
| F182012 | 2.0651 | 0.2699 | 0.0088 | 0.9524 | 3.7276 |
Table 2.
Transformation coefficients for VIIRS-DNB images.
Table 2.
Transformation coefficients for VIIRS-DNB images.
| Year | | | | | | |
|---|
| 2013 | −1.07 | 58.07 | 4.36 | 0.64 | 0.9423 | 2.7306 |
Table 3.
Correlation coefficients between original DMSP images and two sets of integrated NTL data in each study year.
Table 3.
Correlation coefficients between original DMSP images and two sets of integrated NTL data in each study year.
| Data Source | Indicator | 1995 (F12) | 2000 (F14) | 2000 (F15) | 2005 (F15) | 2005 (F16) | 2010 (F18) |
|---|
Harmonized
global NTL | R2 | 1 | 0.9711 | 0.9744 | 0.9446 | 0.9479 | 0.9844 |
| RMSE | 0 | 2.7896 | 2.9767 | 4.4510 | 4.2501 | 2.7301 |
Our
NTL time series | R2 | 0.9681 | 0.9761 | 0.9451 | 0.9776 | 0.9774 | 0.9039 |
| RMSE | 2.9783 | 2.5367 | 4.3642 | 2.8309 | 2.7984 | 6.7820 |
Table 4.
Correlation coefficients between two sets of NTL dataset.
Table 4.
Correlation coefficients between two sets of NTL dataset.
| Indicator | 2015 | 2019 |
|---|
| R2 | 0.9584 | 0.9308 |
| RMSE | 2.8880 | 4.2858 |
Table 5.
Estimated population count and estimation accuracy at regional scale in each study year. Populations are presented in unit of one million.
Table 5.
Estimated population count and estimation accuracy at regional scale in each study year. Populations are presented in unit of one million.
| | Year | 1995 | 2000 | 2005 | 2010 | 2015 | 2019 |
|---|
| Source | |
|---|
| urban-census | 37.4 | 47.6 | 55.8 | 69.1 | 81.2 | 90.7 |
| urban-estimation | 32.8 | 45.4 | 57.5 | 68.6 | 80.8 | 93.2 |
| Accuracy | 87.7% | 95.38% | 96.95% | 99.28% | 99.51% | 97.24% |
| rural-census | 36.4 | 38.9 | 36.1 | 35.2 | 35.6 | 34.2 |
| rural-estimation | 38.7 | 38.1 | 36.7 | 35.8 | 31.7 | 28.1 |
| Accuracy | 93.68% | 97.94% | 98.34% | 98.3% | 89.04% | 82.16% |
Table 6.
Population aggregation from different sources at provincial scale. Populations are presented in unit of one million. ‘NA’ indicating data unavailability for the corresponding year and ‘2020’ indicating the population count in the nearest available year of 2020.
Table 6.
Population aggregation from different sources at provincial scale. Populations are presented in unit of one million. ‘NA’ indicating data unavailability for the corresponding year and ‘2020’ indicating the population count in the nearest available year of 2020.
| | Year | 1995 | 2000 | 2005 | 2010 | 2015 | 2019 |
|---|
| Data | |
|---|
| Census | 73.8 | 86.5 | 91.9 | 104.4 | 116.8 | 124.9 |
| Separate Mapping Sum | 75.5 | 83.5 | 94.2 | 104.3 | 112.5 | 121.3 |
| Direct Mapping | 78.8 | 86.8 | 96.05 | 104.1 | 110.6 | 116.9 |
| GPW-v4 | NA | 84.55 | 92.63 | 101.74 | 112.02 | 123.66 (2020) |
| GHSL | 65.57 | 86.78 | 96.1 | 104.16 | 110.62 | 116.88 (2020) |
| WorldPop | NA | 73.55 | 88.51 | 88.47 | 97.41 | 105.39 |
| Land Scan | NA | 69.41 | 88.06 | 89.72 | 105.18 | 106.93 |
Table 7.
Coefficients for linear regression between total DN value and sum of population at different scales. Row name under each year represent extents of population spatialization.
Table 7.
Coefficients for linear regression between total DN value and sum of population at different scales. Row name under each year represent extents of population spatialization.
| | | | | |
|---|
| 1995 | | | | |
| Province | −0.7130 | 1.3298 | −0.0542 | 0.0009 |
| Urban | −902.6327 | 71.6581 | −1.8382 | 0.0156 |
| Rural | −0.2138 | 1.0154 | −0.0370 | 0.0011 |
| 2000 | | | | |
| Province | −1.6127 | 1.6356 | −0.0758 | 0.0013 |
| Urban | −764.8120 | 63.9415 | −1.7042 | 0.0150 |
| Rural | −0.4262 | 0.9565 | −0.0290 | 0.0009 |
| 2005 | | | | |
| Province | −2.0530 | 1.8518 | −0.0962 | 0.0016 |
| Urban | −789.2343 | 68.3244 | −1.8744 | 0.0168 |
| Rural | −0.6158 | 1.1000 | −0.0514 | 0.0013 |
| 2010 | | | | |
| Province | −4.5706 | 2.3133 | −0.1228 | 0.0020 |
| Urban | −551.1269 | 50.8325 | −1.4678 | 0.0138 |
| Rural | −1.8341 | 1.2675 | −0.0619 | 0.0013 |
| 2015 | | | | |
| Province | −9.9781 | 3.2537 | −0.1700 | 0.0025 |
| Urban | −305.5835 | 31.0363 | −0.9716 | 0.0098 |
| Rural | −6.0543 | 2.2434 | −0.1337 | 0.0026 |
| 2019 | | | | |
| Province | −13.0996 | 3.6596 | −0.1893 | 0.0027 |
| Urban | −199.5136 | 22.3208 | −0.7493 | 0.0079 |
| Rural | −5.8873 | 1.8782 | −0.1044 | 0.0020 |
| Disclaimer/Publisher’s Note: The statements, opinions and data contained in all publications are solely those of the individual author(s) and contributor(s) and not of MDPI and/or the editor(s). MDPI and/or the editor(s) disclaim responsibility for any injury to people or property resulting from any ideas, methods, instructions or products referred to in the content. |
© 2025 by the authors. Licensee MDPI, Basel, Switzerland. This article is an open access article distributed under the terms and conditions of the Creative Commons Attribution (CC BY) license (https://creativecommons.org/licenses/by/4.0/).


