Abstract
Scientifically and accurately assessing the interaction between changes in human activity intensity and the surrounding ecological environment along the Qinghai–Tibet Railway is of great significance for the optimized construction of the railway and the restoration of the regional ecological environment. Based on different spatial distribution scales and construction phases of the Qinghai–Tibet Railway, this study integrates multi-source remote sensing data to construct a long-term spatiotemporal dataset of human activity intensity in the region. Drawing on analytical methods from production theory, a coupling theoretical framework based on remote sensing ecological models is proposed to quantitatively reveal the coupling relationships between the ecological environment and human activities across varying spatiotemporal scales along the Qinghai–Tibet Railway. The study finds that (1) the spatiotemporal distribution of human activity intensity along the Qinghai–Tibet Railway demonstrates clear patterns, with expansion primarily radiating from transportation corridors and their intersections, and marked spatial heterogeneity across different segments. Overall, human activity intensity increased slowly between 1990 and 2002, followed by a significant rise during the construction and opening of the Golmud–Lhasa section (2001–2007). From 2013 to 2020, the growth rate began to slow. Within a 0–30 km buffer zone centered on railway station locations (with a 15 km radius), the growth rate of human activity intensity generally decreased with increasing distance from the railway. In the 30–60 km buffer zone, this trend tended to stabilize. (2) The coupling process between ecological quality and human activity intensity across different spatiotemporal scales along the railway exhibits considerable spatial and temporal heterogeneity and complexity. The decoupling relationship is dominated by strong and weak decoupling patterns, with strong decoupling being the most prevalent. Weak decoupling is mainly distributed along the sides of the railway. Overall, in most areas along the railway, ecological quality has shown a certain degree of improvement alongside increasing human activity intensity; however, the rate of ecological improvement is generally lower than the rate of increase in human activity intensity. In some areas adjacent to the railway, intensified human activities have led to a decline in ecological quality, though the resulting ecological pressure remains relatively low.
1. Introduction
Human activities have become one of the primary factors influencing global ecosystem changes and have attracted widespread attention [1]. Since the 20th century, the intensity of socioeconomic activities has increased rapidly, leading to significant ecological pressures in various regions. These pressures stem not only from global climate change but also from growing population demands. Long-term human activities drive natural ecosystem degradation, with their impacts extending from individual ecosystems to entire regions. As a result, ecological issues have become increasingly prominent, and regional ecological environmental problems are emerging as critical constraints on sustainable social development [2].
The Qinghai–Tibet Plateau, the highest and largest plateau on Earth, is often referred to as the ‘Third Pole’. With its vast expanse, the plateau’s alpine environment and diverse geomorphology have given rise to rich and varied ecosystems, ranging from cold temperate zones to subalpine regions and grasslands. It is home to numerous rare species such as the Tibetan antelope and snow leopard, making it a globally significant reservoir of biodiversity. Additionally, the Qinghai–Tibet Plateau is the source region of major rivers such as the Yangtze and Yellow Rivers, earning it the title of the ‘Water Tower of Asia’. As such, the plateau plays a crucial role in regional climate regulation, material cycling, and carbon sequestration, and it represents a key area for studying global climate change [3], ecological restoration, and biodiversity conservation [4,5]. However, the Qinghai–Tibet Plateau frequently experiences extreme climatic fluctuations. Although the region’s biota exhibits strong adaptability, its ecosystems are highly sensitive and fragile, with limited resilience to external disturbances. Once the ecological environment is damaged, the recovery process tends to be prolonged and difficult [6,7]. The plateau is thus regarded as both a driver and an amplifier of global climate change. Therefore, ecological protection of the Qinghai–Tibet Plateau is of paramount importance; any environmental degradation in this region may trigger widespread cascading effects, potentially destabilizing ecosystems at both regional and global scales [8].
The Qinghai–Tibet Railway is the most iconic engineering project for the strategic development of the Qinghai–Tibet Plateau. The construction area presents three world-class challenges: extreme cold, oxygen deficiency, permafrost, and ecological fragility. The entire railway is located above 3000 m in altitude, with the highest point reaching 5072 m, making it the highest and longest plateau railway in the world. The railway spans the heart of the Qinghai–Tibet Plateau, connecting Xining in Qinghai Province with Lhasa in the Tibet Autonomous Region. The construction and operation of the Qinghai–Tibet Railway has greatly facilitated transportation and economic development on the plateau [9], holding significant strategic importance in terms of economy and security [10]. It has also improved the region’s infrastructure. While the construction and development of transportation infrastructure is fundamental to regional development, it also has a significant impact on the local ecosystem [11,12,13]. With the completion of the Qinghai–Tibet Railway and increasing human activities, the ecological environment of the Qinghai–Tibet Plateau faces unprecedented challenges. Among these, human activity is a key factor exacerbating the fragility of the ecosystem. The railway construction process involves land reclamation, vegetation changes, and the alteration of natural water flows [14,15,16], all of which may lead to ecosystem degradation [17,18] and a reduction in wildlife habitats [19]. Additionally, the operation of the railway brings about significant human and material flows, which directly or indirectly affect the ecological environment along the railway line. For example, transportation activities along the railway may cause noise pollution, air pollution, wastewater discharge, and the degradation of permafrost areas, thereby impacting the stability of the plateau’s ecosystem [20,21].
At present, related studies primarily focus on key topics such as the relationship between human activities and the ecological environment in ecologically fragile areas [22], as well as the correlation between regional ecological vulnerability and economic development. However, there is a lack of coupling analyses between human activity intensity and changes in ecological environmental quality across multiple spatial and temporal scales [23]. As the main transportation hub for the expansion of human activities in the ecologically fragile, high-altitude Qinghai–Tibet Plateau, the Qinghai–Tibet Railway is located in the most densely distributed road network that spans across the plateau. Since the 1990s, the railway has effectively facilitated economic development and population growth in the region, significantly increasing the intensity of human activities in the Qinghai–Tibet Plateau. In particular, the surrounding areas along the railway have experienced noticeable ecological impacts due to human activities, which are crucial for regulating the relationship between human activities and the ecological environment on the plateau and for promoting the coordinated and sustainable development of the region [24,25,26]. While some studies have analyzed the linear, quantitative relationship between vegetation indices and human activities on the Qinghai–Tibet Plateau or specific administrative units [27,28], comprehensive research on the coupling relationship between overall ecological quality and human activity in the region remains limited [29]. This is particularly true for research conducted at the scale of railway station distributions along the Qinghai–Tibet Railway. There is a lack of studies examining how the relationship between human activities and ecological environments has evolved across different periods of railway construction and operation, the extent to which human activities drive ecological changes, the response of various natural ecological factors, and the degree of influence among different factors [11,30].
This study employs an improved human activity intensity (HAI) methodology to construct a multi-temporal and multi-spatial indicator of human activities along the Qinghai–Tibet Railway, integrating factors such as annual nighttime light data, railway and road networks, livestock density, and land use types. Furthermore, considering the spatial distribution characteristics of the Qinghai–Tibet Railway region and its distinct construction phases, and drawing on decomposition analysis methods rooted in production theory, this study proposes a coupling theoretical framework based on remote sensing-derived ecological models. This framework is used to quantitatively analyze the coupling relationship between the ecological environment and human activities at different spatiotemporal scales along the Qinghai–Tibet Railway. The study aims to reveal the spatiotemporal variation patterns of human activity intensity during different construction stages of the railway and provide a scientific basis for the coordinated development of human socioeconomic activities and the ecological environment in the region.
2. Materials and Method
2.1. Study Area Selection
The Qinghai–Tibet Railway is located in the heart of the Qinghai–Tibet Plateau, stretching from Xining in Qinghai Province in the east to Lhasa in the Tibet Autonomous Region in the south (Figure 1). The railway has a total length of 1956 km and includes 85 stations along the route. The segment from Xining to the Nan Shan Kou in Geermu spans 814 km and became operational in 1984. The section from Geermu Nan Shan Kou to Lhasa is 1142 km long, with 1107 km of new track, and was fully operational in 2006. The double-track construction between Xining and Geermu was completed between 2007 and 2011. The landscape along the railway is unique and varies significantly. In the northern part, the elevation is below 3500 m, with average annual temperatures ranging from −5 to 5 °C and annual precipitation below 50 mm. In the central section, the elevation is above 4000 m, and it exhibits the characteristics of a plateau subarctic climate. The southern region, from Yangbajing to Lhasa, has an average annual temperature of around 5 °C and receives approximately 400 mm of annual precipitation, belonging to a semi-arid agricultural and pastoral area in a river valley. The Qinghai–Tibet Railway serves as the primary transportation hub connecting the Qinghai–Tibet Plateau to other regions, linking the major towns of the plateau. Xining, where one of the railway stations is located, has developed into the largest modern city in the plateau region. The railway has also contributed to the development of important livestock, tourism, and industrial bases along the route. The Qinghai–Tibet Railway runs parallel to the Qinghai–Tibet Highway, with the shortest distance between them being 2 km and the farthest 16 km. Based on these factors and previous studies, the study area is defined as a 30 km radius buffer zone centered on the railway line [31].
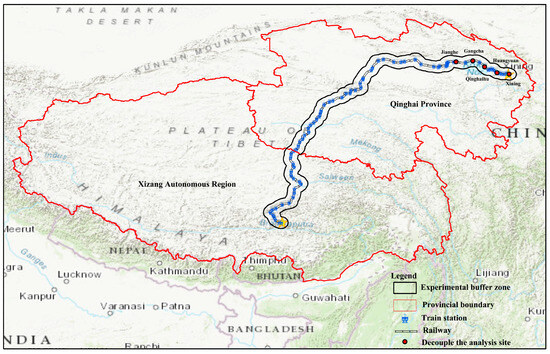
Figure 1.
Basic Geographic Location Map of the Qinghai–Tibet Railway and Study Area.
2.2. Introduction to Data Sources
Landsat Data and Preprocessing
This study is based on Landsat series data, including Landsat 5 (TM), Landsat 7 (ETM+), and Landsat 8 (OLI) Level 2, Collection 2 surface reflectance and Top of Atmosphere (TOA) reflectance products. The spatial resolution of these data is 30 m, with a temporal resolution of 16 days. The study performs radiometric correction on the surface reflectance to obtain the TOA products. During the calculation of the TOA products, the maximum cloud cover percentage for the cloud mask layer is dynamically selected based on the actual cloud cover situation in the study area. In the TOA products calculated in this study, the maximum cloud cover does not exceed 15%. The calculated TOA products are then used to fill in missing regions of the surface reflectance (SR) products, resulting in a composite surface reflectance product with less than 15% cloud cover. Both the data acquisition and calculation processes are implemented using the Google Earth Engine (GEE) cloud platform. In this study, the Remote Sensing Ecological Index (RSEI) used for the synthetic coupling analysis was derived from Landsat data. The specific methods, procedures, and regional applicability of the index refer to previously published studies on ecological quality changes in similar regions [31]. The index was resampled to match the spatial scale of this study and subsequently used for the coupling analysis with human activity intensity.
Population density and land use data are provided by the GEE platform, with population density data sourced from (WorldPop/GP/100 m/pop) and land use data from (MODIS/006/MCD12Q1).
Livestock meat production data is obtained from the National Bureau of Statistics website (http://www.stats.gov.cn/, accessed on 15 July 2021). Livestock density data is provided by the Food and Agriculture Organization (FAO) Global Geospatial Information System website (http://www.fao.org/geonetwork/srv/en/main.home, accessed on 17 July 2021). Nighttime lights data is sourced from the National Oceanic and Atmospheric Administration (NOAA) website and the GEE platform (https://ngdc.noaa.gov/eog/dmsp/downloadV4composites.html, accessed on 2 August 2021). Railway data were obtained from OpenStreetMap and the NASA Socioeconomic Data and Applications Center (SEDAC) website (https://sedac.ciesin.columbia.edu, accessed on 3 March 2021). Other road data were derived from non-open source datasets accumulated during the implementation of related research projects.
Existing human activity data were obtained from the human activity intensity dataset for the Tibetan Plateau region (1990–2015, at five-year intervals), published by the China Science Data Center (http://www.csdata.org/p/407/3/, accessed on 6 August 2021).
2.3. Methods
2.3.1. Sensitivity Assessment of Spatial Scale in the Study Area
Based on the results of vegetation ecological sensitivity assessments within the region, derived from existing relevant research and experiments [31], this study focuses on the Xining and Jianghe Stations along the Qinghai–Tibet Railway. For each station, spatial analysis scales are defined as circular buffers with radii of 5, 10, 15, 20, 25, 30, 40, 50, and 60 km on both sides of the railway line.
2.3.2. Synthesis and Evaluation of Human Activity Intensity Indicators Based on the Human Footprint Method
- a.
- Synthesis of Human Activity Intensity Indicators
Compared with statistical analysis-based methods for evaluating human activity intensity, the Human Footprint Index method can produce higher-quality data and has been increasingly applied in recent studies [32]. This method, proposed in 2002, primarily selects four types of human activity spatial characteristic layers: population density, land use change, power facilities, and regional accessibility. After creating buffers and assigning values for each characteristic, the layers are then overlaid and normalized. This method has been continuously improved in subsequent wide applications based on specific use cases. To construct a high-quality human activity intensity indicator along the Qinghai–Tibet Railway, this study is based on the basic Human Footprint method, considering the natural and social conditions along the Qinghai–Tibet Railway. The study selects population density, nighttime lights, livestock density, land use, railway, and road data along the railway, and synthesizes the Human Activity Intensity Index (HAII) for the period 2001–2020. After standardizing the data based on overlapping years with data published by the Qinghai–Tibet Plateau Data Center, the study further synthesizes the human activity characteristic indicators (HAII) for the period 1990–2020 along the Qinghai–Tibet Railway.
Based on the improved Human Footprint method, six types of spatial data representing human activity are selected. Each data type is normalized to a scale of 0–10 based on its specific characteristics and evaluation methods. A higher score indicates a greater intensity of human activity impact. After normalizing all data to a 0–10 scale, the layers for each year are overlaid, resulting in the Human Activity Intensity Index for each year along the Qinghai–Tibet Railway. Based on the specific conditions along the Qinghai–Tibet Railway, the assignment methods for each factor in the calculation of the human activity intensity indicator are as follows:
- (1)
- Population Density Data
Population density is closely related to human activity in ecosystems [33], with areas of higher population density having a greater impact on ecosystems. The relationship between population density and ecosystems is similar to a logarithmic function. Therefore, a logarithmic function can be used to reassign values to the population density data. The spatial resolution of the raster data is 1 km, and the maximum population density value in the raster unit is 629. The specific calculation equation is as follows:
In the equation, represents the processed density value, where is the original population density value.
- (2)
- Land Use
Land use change is an important factor reflecting the degree of human activity. Different land use types have varying levels of human activity intensity. For example, built-up areas have the highest human activity intensity, followed by croplands. Therefore, built-up land is re-assigned a value of 10, cropland a value of 7, grassland a value of 4, and all other land use types are assigned a value of 0.
- (3)
- Grazing Density
Animal husbandry is an essential industry on the Qinghai–Tibet Plateau, and grazing is one of the major forms of human activity in the region. Certain sections of the Qinghai–Tibet Railway pass through pastoral areas of the plateau. Grazing density can be represented by the sum of cattle and sheep densities. Data from 2001 to 2020 are sourced from the National Ecological Science Data Center (http://www.nesdc.org.cn) (as of 4 August 2021). To obtain more accurate regional data, the livestock production of beef and mutton in Qinghai and Tibet from 2001 to 2020 is recorded. The production rate relative to 2010 is calculated for each year, and the cattle and sheep density layers for different years are computed by multiplying the density layers for beef and mutton with the production rate for each year. Finally, the annual grazing density is obtained through the overlay of cattle and sheep density layers for the same year. Since grazing density also follows a logarithmic distribution, with a maximum grid value of 320,228.12, the grazing density data is re-assigned based on a logarithmic function. The specific calculation equation is as follows:
In the equation, represents the re-assigned grazing density value, and represents the original calculated grazing density value.
- (4)
- Nighttime Lights
Nighttime light values of 0 are retained. For data with DN values greater than 0, the values are divided into 10 equal parts using quantile methods, and the values are assigned sequentially from 1 to 10, from smallest to largest.
- (5)
- Railways
Transportation in the Tibetan Plateau is isolated, and the construction of the Qinghai–Tibet Railway has significantly enhanced the connection between Tibet and the mainland, as well as surrounding areas. This has been crucial for the development of various sectors in the region, especially along the Qinghai–Tibet Railway. However, since the train operates along a fixed railway line, its influence is limited. Therefore, only the area within 500 m of either side of the railway is considered affected, and this area is assigned a value of 8, with other areas assigned a value of 0. Additionally, the construction of the Qinghai–Tibet Railway was completed in stages. The second phase of the railway (the Golmud–Lhasa section) started operation in 2006. In this study, the railway distribution of 2006 is considered the data for 2001–2006, the 2013 distribution is used for 2007–2013, and the 2020 distribution is used for 2014–2020.
- (6)
- Roads
In the Tibetan Plateau, the openness of roads is greater than that of railways, so their impact on the surrounding areas is more significant. When assigning values, areas within 500 m on either side of the road are assigned a value of 10; areas between 500 and 1500 m are assigned a value of 8; and areas between 1500 and 2500 m are assigned a value of 4. Due to missing road data in some years, the 2002 road data is used for the years 2001 and 2002, the 2007 data is used for the years 2003 to 2007, the 2009 data is used for the years 2008 and 2009, the 2012 data is used for the years 2011 and 2012, and the 2014 data is used for the years 2013 and 2014.
- b.
- Human Activity Intensity Index Applicability Evaluation
The newly constructed Human Activity Intensity Index (HAII) in this study is compared with the existing HAII data for three overlapping years. Random points are generated within the region to compute the correlation between the new HAII values and the existing HAII values. The scatter plot of this correlation is shown in Figure 2a. Afterward, the existing dataset is automatically standardized and fitted for correction, using the newly constructed dataset as the reference standard. The scatter plot of the correlation after uniform standardization is shown in Figure 2b. Before standardization, the R2 value for the fit is 0.81, and after standardization, the R2 value increases to 0.87, indicating a high degree of correlation. Therefore, the two datasets can be combined to form a Human Activity Intensity Index for the Qinghai–Tibet Railway from 1990 to 2020.
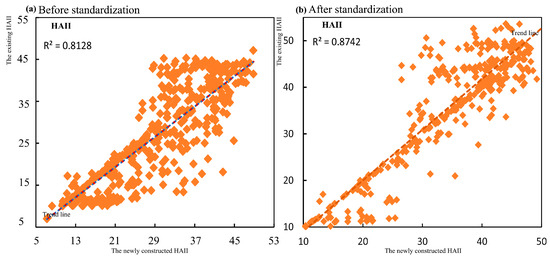
Figure 2.
(a) Pre-standardization correlation of the human activity intensity dataset; (b) The correlation after standardization of the human activity intensity dataset.
2.3.3. Coupling Theoretical Framework Based on Remote Sensing Ecological Model
- (1)
- Decoupling Model
The decoupling theory was first proposed by the Organisation for Economic Co-operation and Development (OECD) as an analytical tool to examine the relationship between economic development and CO2 emissions [34]. The concept of “decoupling” originates from physics and refers to a situation where the relationship between two interconnected physical quantities is weakened or nonexistent [35]. Due to its strong applicability and simplicity in explanation, decoupling has been widely used in many fields, especially in characterizing the relationship between environmental pressure and economic growth [36]. Later, Tapio developed the Decoupling Elasticity Index [37], which represents the elasticity ratio between two variables, describing the elastic changes between the observed variables. The interaction between human activity intensity and the ecological environment is similar to this concept. Therefore, based on the construction of ecological indicators and human activity intensity indicators, this study, drawing on Tapio’s research, builds a decoupling model for the variation in human activity intensity and ecological environment changes along the railway. In this study, the negative change in the Remote Sensing Ecological Index (RSEI) is used to represent environmental pressure. The decoupling formula based on Tapio’s approach is as follows:
The variable represents the decoupling elasticity. The coupling relationship is jointly determined by changes in human activity intensity, the resulting environmental pressure, and the interaction among these three factors. Based on Tapio’s decoupling model [38], coupling, decoupling, and negative decoupling types are defined with basic expressions, as well as eight logical relationships. To reasonably avoid errors from minor changes, the elasticity coefficient is defined as coupling when the elasticity value changes by ±20% around 1.0. Therefore, when the elasticity value is between 0.8 and 1.2, it is considered coupling, and the logical relationships between different levels of coupling are shown in Table 1.

Table 1.
Logical Relationship Table of Coupling Degrees between RSEI and HAII.
- (2)
- Decoupling Method Based on the RSEI Ecological Model
Based on existing research, the ecological quality characteristic index in this study is synthesized from various ecological factor indices using principal component analysis. Based on this, there is a quantitative relationship between and each ecological factor. Therefore, we selected , , , , and imagery from specific time periods within the study area for sampling. Taking the ecological index as the dependent variable and , , , and as independent variables, we conducted a stepwise experimental regression analysis to establish a statistically significant -test-based multiple regression model. This model was then defined as the ecological model describing the relationship between and the individual ecological factors and is expressed in a simplified form as follows:
Drawing on the core idea of the widely applied Production-Theoretical Decomposition Analysis (PDA) method in the environmental field [38], the ecological regression model relationship of is incorporated into the decoupling formula of ecological quality change and human activity intensity. The following equation transformation is derived:
Through the above equation transformation, it can be concluded that the mathematical relationships between , , , , and are consistent. Where , , , and represent the characteristic indicators of , , , and Wet, respectively, and the coupling elasticity coefficients with . To maintain consistency with the negative variation of indicating increased environmental pressure, the negative variation of NDV and Wet is used to represent the negative response factors for the increase in environmental pressure. Therefore, in the coupling process between and , the ecological model relationships between and ecological factors within the corresponding region can simultaneously represent both the directional trend and the degree of influence of each ecological factor in the decoupling process. To better quantify the proportional impact of each ecological factor in the coupling process between and , the coefficients of the ecological factors in the ecological model are further standardized. Based on this, a comprehensive coupling framework combining the ecological model and the decoupling process is established.
3. Results and Analysis
3.1. Spatiotemporal Characteristics of Human Activity Intensity Along the Qinghai–Tibet Railway
The regional statistical characteristics (Figure 3) and spatial distribution patterns (Figure 4) of human activity intensity along different sections of the Qinghai–Tibet Railway in 2020 are shown below. According to the distribution of HAII (Human Activity Intensity Index) values across different sections of the railway (Figure 3), the following observations can be made: The overall distribution of HAII values across the Qinghai–Tibet Railway is relatively dispersed, with a wide range of HAII values across different sections. Specifically, in the Xining–Jianghe section, HAII values primarily fall within the ranges of 30–50 and 10–20, with 10–20 being the dominant range. In the Guanjiao–Golmud section, values are mainly concentrated between 5–10 and 20–30, with the 5–10 range being the most prevalent. In the Nanshankou–Amdo section, values primarily range between 5–10 and 10–20, dominated by the 5–10 range. In the Amdo–Lhasa section, HAII values are generally within the 5–15 and 15–30 intervals, with 5–15 being the primary range. There are significant differences in HAII values across the various sections of the railway. The Xining–Jianghe section exhibits the highest overall human activity intensity. In contrast, the other three sections show relatively lower overall HAII values. Among them, the Amdo–Lhasa section has higher activity intensity than the Guanjiao–Golmud section, while the Nanshankou–Amdo section has the lowest overall intensity of human activities.
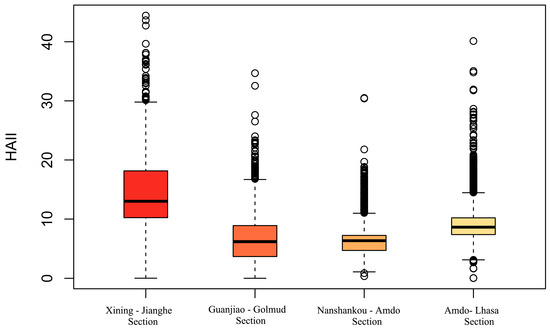
Figure 3.
Spatial Statistical Distribution of Human Activity Intensity along the Qinghai–Tibet Railway in 2020.
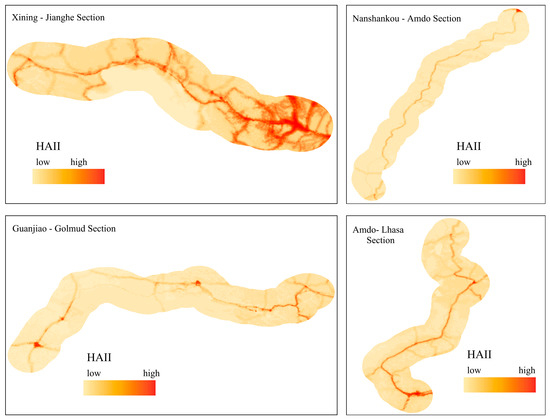
Figure 4.
Spatial Distribution of Human Activity Intensity Along the Qinghai–Tibet Railway in 2020.
From Figure 4, the following observations can be made:
- (1)
- Human activity intensity along the different sections of the Qinghai–Tibet Railway exhibits significant spatial heterogeneity. Within each section, activity intensity generally peaks in proximity to the railway and gradually diminishes with increasing distance, although this pattern varies across sections. In the Xining–Jianghe section, key centers of human activity intensity are located around Xining Station, Huangyuan Station, Qinghai Lake Station, Gangcha Station, and Jianghe Station. Each station shows the highest activity intensity at the center, which then diminishes outward. The intensity and extent of influence decreases progressively from Xining to Jianghe, making this section the most regular and concentrated in terms of human activity intensity.
- (2)
- In the Guanjiao–Golmud section, the overall distribution of human activity intensity is low. The highest intensity is observed along the central railway line, with only Delingha and Golmud stations showing clearly clustered human activity.
- (3)
- The Nanshankou–Amdo section has the smallest spatial variation in human activity intensity among all sections. The activity intensity is fairly consistent between stations, with the railway line being the main axis of high intensity, while the surrounding areas show generally low levels of activity.
- (4)
- In the Amdo–Lhasa section, human activity intensity shows a noticeable trend of expansion along the railway line. However, the overall expansion remains limited. The region has formed two activity clusters centered around Nagqu Station and Lhasa Station, with Lhasa exhibiting the highest intensity and the widest surrounding influence.
In summary, the spatial distribution of human activity intensity along the Qinghai–Tibet Railway exhibits distinct characteristics. It primarily radiates outward from transportation lines and their intersections, showing significant spatial heterogeneity across different segments. Among them, the Xining–Jianghe segment displays the most prominent human activity patterns. Within this segment, areas of concentrated human activity centered around transportation hubs represent typical zones of human activity expansion and development along the railway, demonstrating a clear pattern. In contrast, the other segments exhibit relatively stable human activity intensity overall.
3.2. Temporal Distribution Characteristics of Human Activity Intensity Development Along the Qinghai–Tibet Railway
From 1990 to 2020, the overall intensity of human activity along the Qinghai–Tibet Railway increased significantly. Based on the statistical distribution of HAII values across different sections during various periods (Figure 5), the following observations can be made:
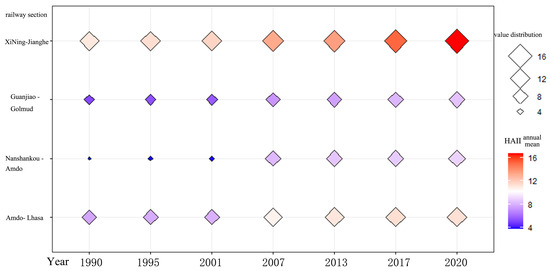
Figure 5.
Statistical distribution of changes in human activity intensity along the Qinghai–Tibet Railway before and after its construction in 2007.
- (1)
- In different periods, the trend and degree of change in human activity intensity varied across railway sections. Between 1990 and 2001, the increase in human activity intensity across all sections was relatively small. The Xining–Jianghe section showed more noticeable growth, while the Nanshankou–Anduo section exhibited minimal change. The Anduo–Lhasa and Guanjiao–Golmud sections showed slight increases.
- (2)
- From 2001 to 2007, human activity intensity increased significantly in all sections, indicating a sharp rise in human activity intensity throughout the entire region along the railway starting in 2007, following the opening of the Golmud–Lhasa railway.
- (3)
- Between 2007 and 2020, the pattern of growth in human activity intensity across sections was positively correlated to the 1990–2001 period. The Xining–Jianghe section showed a significant stepwise increase (2007–2013, 2013–2020), while other sections also experienced increased growth rates.
3.3. Analysis of Spatiotemporal Variation Characteristics of Human Activity Intensity Along the Qinghai–Tibet Railway at Multiple Spatial and Temporal Scales
Taking the railway line and radiating outward from each station as the focal point is a characteristic pattern of the spatial distribution of human activity intensity along different sections of the Qinghai–Tibet Railway. To further quantify its spatiotemporal variation, this study focuses on five station areas—Xining, Huangyuan, Qinghai Lake, Gangcha, and Jiange—where significant changes in human activity intensity are observed along the entire railway. Around each station, we delineate ten concentric zones at increasing radii up to 30 km and use these to quantitatively examine the spatiotemporal characteristics of human activity intensity variation along the Qinghai–Tibet Railway.
3.3.1. Spatiotemporal Multi-Scale Distribution Characteristics of Human Activity Intensity Surrounding Xining Station
As shown in Figure 6, within 60 km of Xining Station, the overall intensity of human activities is relatively high and clearly radiates outward along the transport corridor. Centered on Huangyuan Station, human activity intensity reaches its maximum HAII value within a 2.5 km radius, then declines rapidly with increasing distance from the station, with a steeper rate of decline compared to the area surrounding Xining Station. Around a 15 km radius, the downward trend becomes markedly steeper. Between radii of 15 and 30 km, intensity values remain fairly uniform across years, though the growth trajectories at different spatial scales are strongly consistent over time. Within the 5 km diameter zone, activity intensity rose steadily from 1990 to 2020, with the most rapid increase occurring between 1995 and 2001. However, in the 10–60 km diameter bands, there is a pronounced dip in 2001. From 2001 to 2007, the rate of increase is also muted, and activity levels in the 1990s exceed those in the early 2000s. Between 2007 and 2013, activity intensity rebounds sharply, and growth from 2013 to 2020 outpaces that of the 5 km zone. This pattern suggests that following the opening of the first Qinghai–Tibet Railway segment in 1984, human activity around Xining Station had already begun to rise significantly by the 1990s. During construction of the Golmud–Lhasa section between 2001 and 2007, central activity density around Xining continued to build while its broader catchment saw a clear downturn. After the line’s full opening in 2007, intensity across all scales recovered—indicating that construction of the Golmud–Lhasa segment had a marked impact on human activity in the Xining area.
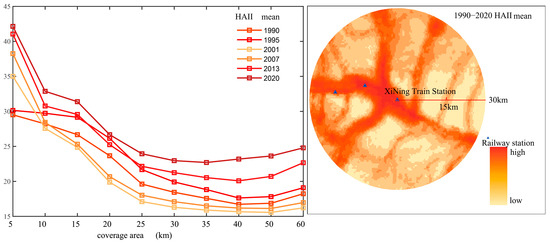
Figure 6.
Spatiotemporal Distribution Characteristics of Human Activity Intensity Surrounding XiNing Station.
3.3.2. Spatiotemporal Multi-Scale Distribution Characteristics of Human Activity Intensity Surrounding Huangyuan Station
As shown in Figure 7, within 60 km of Huangyuan Station, human activity intensity is markedly lower than around Xining Station, and it exhibits clear stratification along the transport corridor. Intensity peaks within a 2.5 km radius of the station, then declines rapidly with increasing distance—at a faster rate than around Xining. Once the diameter reaches 35 km, the rate of decline levels off, and in the 35–60 km zone, intensities remain low (between 12 and 17). Between 1990 and 2020, growth in human activity intensity around Huangyuan is relatively modest at all spatial scales, with high interannual volatility and low stability in activity agglomeration. Within a 10 km diameter, intensity in the 1990s and late 1990s exceeds levels during the 2001–2007 period. In the 15–30 km band, the largest growth occurs between 2007 and 2013, followed by a significant decline from 2013 to 2020. Across the 30–60 km zone, changes in intensity from 1990 to 2020 remain minimal.
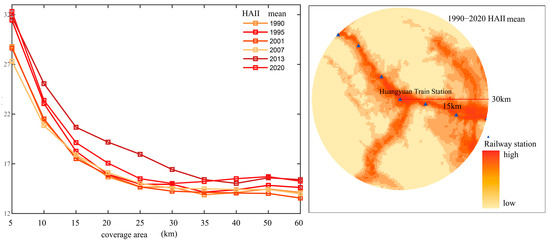
Figure 7.
Spatiotemporal Distribution Characteristics of Human Activity Intensity Surrounding Huangyuan Station.
3.3.3. Spatiotemporal Multi-Scale Distribution Characteristics of Human Activity Intensity Surrounding Qinghai Lake Station
As shown in Figure 8, human activities around Qinghai Lake Station are primarily concentrated on the lakeshore side of the railway. Activity intensity expands more markedly along the rail line axis than perpendicular to it, and overall intensity levels are lower than those around Xining and Huangyuan Stations. Intensity peaks within a 5 km radius of the station, then steadily declines from 5 to 15 km. Between 15 and 30 km, variations in intensity become more pronounced. This pattern reflects differing dynamics between tourism-driven activity around the lake and urban-expansion activity at other stations. Temporal trends from 1990 to 2020 vary strongly by scale. From 1990 to 2001, activity intensity around Qinghai Lake rises substantially; the increase within a 25 km diameter of the station is smaller than that in the 25–60 km band. Between 2007 and 2013, intensity grows modestly within 20 km of the station, while the 20–60 km zone experiences a more pronounced uptick. From 2013 to 2020, all spatial scales around Qinghai Lake Station exhibit significant increases in human activity intensity.
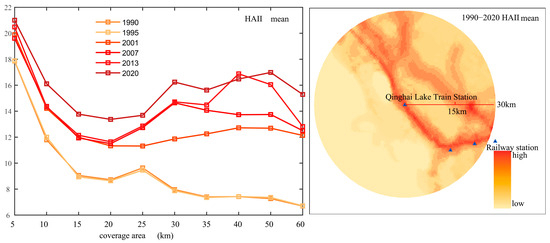
Figure 8.
Spatiotemporal Distribution Characteristics of Human Activity Intensity Surrounding Qinghai Lake Station.
3.3.4. Spatiotemporal Multi-Scale Distribution Characteristics of Human Activity Intensity Surrounding Gangcha Station
Gangcha Station serves as an important connection point from the Qinghai Lake area to the interior of the Qinghai–Tibet Plateau. As shown in Figure 9, the spatial distribution of human activity intensity around Gangcha Station is closely related to that around Qinghai Lake Station, with activities primarily concentrated along the lakeshore side. Human activity intensity varies significantly across different spatial and temporal scales. Within a 5 km radius of Gangcha Station, activity intensity is significantly higher than in other zones and was notably greater during 1990–1995 compared to the period from 2001 to 2020. Between 1995 and 2001, this area experienced a negative trend in activity intensity, which then recovered to a strong positive growth trend from 2007 to 2013. In the 5–15 km radius, activity intensity decreases rapidly with increasing distance but shows a consistent growth trend from 1990 to 2020, with notable increases around 2001 and 2013. Activity intensity in the 15–30 km radius remains stably low, with lower values during the 1990s and a marked increase after 2001, followed by slight growth through 2020.
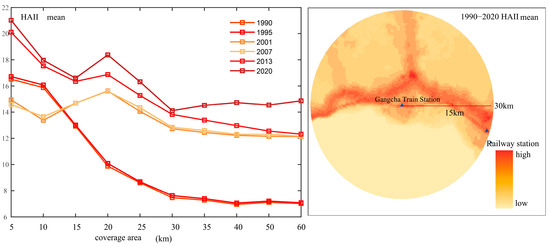
Figure 9.
Spatiotemporal Distribution Characteristics of Human Activity Intensity Surrounding Gangcha Station.
3.3.5. Spatiotemporal Multi-Scale Distribution Characteristics of Human Activity Intensity Surrounding Jianghe Station
The distribution of human activity intensity around Jianghe Station shows a high consistency with most other areas along the Qinghai–Tibet Railway. As illustrated in Figure 10, human activity primarily expands along the railway line, resulting in relatively small differences across spatial scales. Within a 5 km radius of Jianghe Station, activity intensity is comparatively higher, while in other zones the intensity differences are generally minor but exhibit some fluctuation. From 1990 to 1995, human activity intensity around Jianghe Station was relatively low with a slight increasing trend. After 2001, there was a substantial rise in intensity, though the growth rate slowed notably between 2001 and 2013. Between 2013 and 2020, the intensity experienced a marked increase again, reaching its peak overall in 2020.
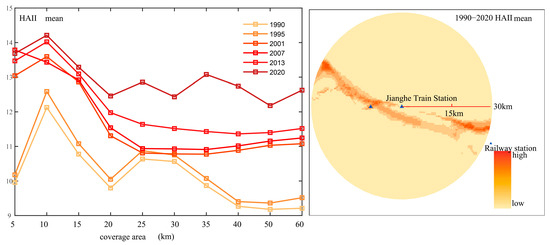
Figure 10.
Spatiotemporal Distribution Characteristics of Human Activity Intensity Surrounding Jianghe Station.
3.4. Analysis of the Decoupling Relationship Between Human Activity Intensity and Ecological Quality Changes in Significant Areas Along the Qinghai–Tibet Railway
To further reveal the interaction between ecological environment changes and human activity variations along the Qinghai–Tibet Railway, this study employs the Tapio improved decoupling model. Focusing on railway station areas with significant spatial distribution features of human activity intensity, the decoupling elasticity coefficient θ between the Remote Sensing Ecological Index (RSEI) and Human Activity Intensity Index (HAII) is calculated pixel-by-pixel at a 5 km spatial scale within a 60 km radius for the period 1990–2020. Based on the decoupling logic types (Table 1), the decoupling categories between human activity intensity and ecological quality are determined. The results for each area are shown in Figure 11, Figure 12, Figure 13, Figure 14 and Figure 15. Figure 11 reveals that in the area surrounding Xining from 1990 to 2020, the coupling relationship between ecological quality and human activity intensity is predominantly characterized by strong decoupling, accounting for over 90% of the area. A small portion of the region exhibits weak decoupling, expansive coupling, and recession decoupling types, with very few pixels showing expansive coupling. Pixels with strong decoupling indicate that ecological quality improved positively while human activity intensity increased concurrently. The coupling elasticity coefficients reveal spatial differences: on the left side of Xining Station, the absolute values of the elasticity coefficients mostly range between 0 and 1, whereas on the right side, most coefficients exceed 1. This indicates that ecological quality improvement rates on the left side are generally lower than the growth rates of human activity intensity, while on the right side, ecological quality improved more rapidly than human activity expanded during the same period. Between 1990 and 2020, urban expansion was significant on the left side of Xining Station, whereas urban growth was relatively limited on the right side due to topographical constraints. This spatial difference strongly correlates with the observed coupling characteristics between ecological quality and human activity intensity. Along densely distributed transport corridors, including railways and other roads, a small number of pixels display weak decoupling: here, human activity intensity increases while ecological quality declines, but the elasticity coefficients remain below 0.8. This suggests that although some railway segments have started to impact upon local ecological quality, the overall environmental pressure remains relatively low. In areas around Xining Station where human activity is relatively limited, a recession decoupling type predominates, characterized by ecological quality improvement accompanied by a decline in human activity intensity. Notably, eight pixels around Xining Station exhibit an expansive negative decoupling type, where ecological quality declined while human activity intensity increased—and the rate of ecological degradation exceeded the growth rate of human activity. This phenomenon is mainly observed in the southeastern region surrounding Xining Station, which exhibits the lowest ecological quality within the area.
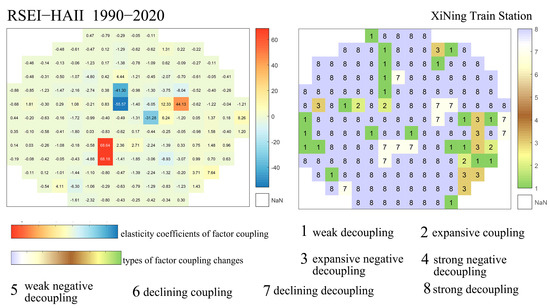
Figure 11.
Coupling Characteristics of Ecological Quality and Human Activity Intensity Changes in the Area Surrounding Xining Station.
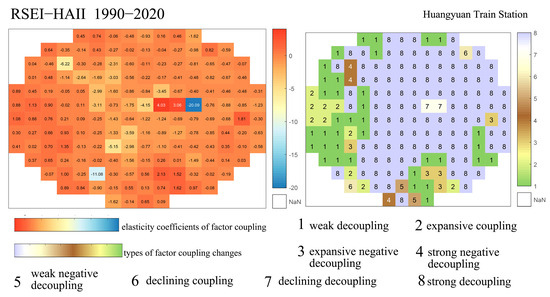
Figure 12.
Coupling Characteristics of Ecological Quality and Human Activity Intensity Changes Surrounding Huangyuan Station.
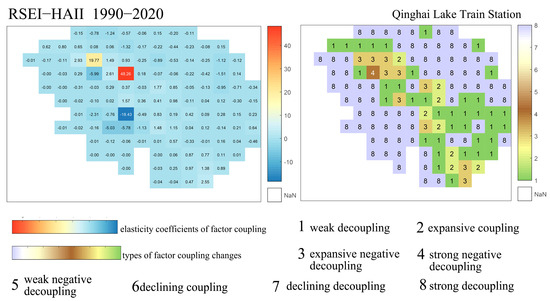
Figure 13.
Coupling Characteristics of Ecological Quality and Human Activity Intensity Changes Surrounding Qinghai Lake Station.
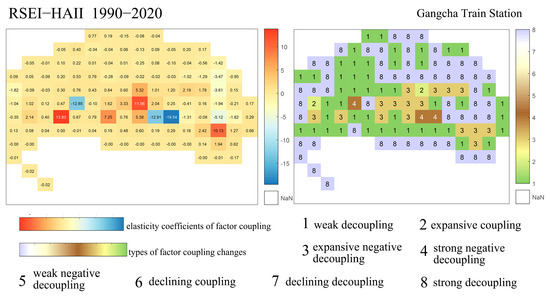
Figure 14.
Coupling Characteristics of Ecological Quality and Human Activity Intensity Changes Surrounding Gangcha Station.
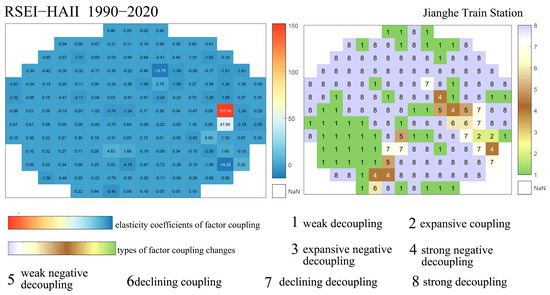
Figure 15.
Coupling Characteristics of Ecological Quality and Human Activity Intensity Changes Surrounding Jianghe Station.
As shown in Figure 12, from 1990 to 2020, the coupling relationship between human activity intensity and ecological quality changes around Huangyuan Station is dominated by strong and weak decoupling types. Weak decoupling primarily occurs in the outer left peripheral area of Huangyuan Station, while strong decoupling is the main distribution type in other areas. In the far-left railway corridor region, a small portion exhibits expansive coupling. The spatial distribution of change types on the left side shows significant variability. Examining the corresponding coupling elasticity coefficients, their absolute values mostly fall between 0 and 1. Overall, this indicates that the rate of ecological quality change around Huangyuan Station during 1990–2020 was lower than the rate of change in human activity intensity. Specifically, in strong decoupling areas, the increase in human activity intensity outpaced environmental improvement. In weak decoupling zones, ecological degradation occurred at a slower rate than the growth of human activity intensity, with relatively limited mutual influence. In the small railway corridor areas exhibiting expansive coupling, increases in human activity intensity strongly correlate with declines in ecological quality, with their mutual influence being roughly balanced. Other coupling types appear only in two or three pixels within this region and are considered temporarily insignificant.
As shown in Figure 13, from 1990 to 2020, the spatial distribution of coupling characteristics between ecological quality and human activity intensity around Qinghai Lake Station is mainly dominated by strong and weak decoupling types. A smaller portion of the area exhibits expansive coupling and expansive negative decoupling, with distinct spatial patterns.
Considering the coupling elasticity coefficients between ecological quality and human activity intensity, the absolute values predominantly fall between 0 and 1, indicating that for most pixels, the rate of ecological quality change is less than that of human activity intensity change. The strong decoupling type mainly appears in areas relatively distant from Qinghai Lake Station, where ecological quality improves alongside increased human activity intensity, but the rate of ecological improvement is slightly weaker. The weak decoupling, expansive coupling, and expansive negative decoupling types are primarily distributed along transportation lines within the region. These three types share the common feature that human activity intensity increases while ecological quality declines, but the degree of their interrelationship differs significantly. Weak decoupling has a coupling elasticity below 0.8, meaning ecological degradation is less severe than the rate of increase in human activity intensity. Expansive coupling has an elasticity coefficient between 0.8 and 1.2, indicating a strong correlation between increased human activity and ecological quality improvement, with changes being roughly balanced and relatively controllable. Expansive negative decoupling shows elasticity values greater than 1.2, where the rate of ecological quality decline significantly exceeds human activity expansion, signaling a marked high environmental pressure and harmful expansion of human activity intensity. The variation in coupling types around Qinghai Lake Station further demonstrates that the decoupling model applied in this study is well-suited for quantitatively exploring the relationship between human activity intensity and ecological quality changes.
As shown in Figure 14, from 1990 to 2020, the spatial distribution characteristics of the coupling relationship between ecological quality and human activity intensity around Gangcha Station, located on the opposite side of Qinghai Lake, show certain similarities to those around Qinghai Lake Station. The coupling types in this area are mainly dominated by strong and weak decoupling. Corresponding coupling elasticity coefficients mostly have absolute values between 0 and 1. A notable difference is observed near the railway lines around Gangcha Station, where weak decoupling predominates, accompanied by an increased occurrence of expansive negative decoupling and a decline in the number of pixels exhibiting expansive coupling. This indicates that the increase in human activity intensity around Gangcha Station exerts greater pressure on the ecological environment compared to the area around Qinghai Lake Station, with a wider distribution of ecological degradation areas.
As shown in Figure 15, the overall human activity intensity and ecological quality in the area surrounding Jianghe Station are relatively low, consistent with the general pattern observed along most parts of the Qinghai–Tibet Railway corridor. The coupling relationship between ecological quality and human activity intensity changes in this region is primarily characterized by strong decoupling, accounting for over 50% of the pixels. Weak decoupling accounts for about 25% of the pixels, mainly distributed to the lower-left side of Jianghe Station. Additionally, eight pixels show recession decoupling, while the remaining pixels exhibit scattered occurrences of other types, which are considered insignificant in terms of change. Analyzing the corresponding coupling elasticity coefficients, most absolute values fall between 0 and 1, indicating that the rate of ecological quality change is generally lower than the rate of change in human activity intensity, reflecting a relatively low correlation between the two. Overall, the area exhibits a pattern where human activity intensity increases while ecological quality continues to improve, albeit with relatively modest change rates. The strength of the coupling relationship is higher on the right side of Jianghe Station compared to the left, although the right-side area shows greater diversity among coupling types.
In summary, during the period from 1990 to 2020, at a uniform spatial scale of 5 km, the coupling characteristics between ecological quality and human activity intensity changes along the Qinghai–Tibet Plateau railway corridor exhibit a certain spatial heterogeneity but are mainly dominated by strong and weak decoupling types, with strong decoupling accounting for the majority. Weak decoupling is primarily distributed along the railway lines. Overall, most areas along the railway corridor experienced ecological quality improvement alongside increased human activity intensity, although the rate of ecological quality change was slower than the increase rate of human activity intensity. In areas close to the railway line, increased human activity intensity has led to ecological quality decline, but the environmental pressure remains relatively low. In regions farther from the railway, some areas showed recession decoupling, where ecological quality improved despite little change in human activity intensity. However, around certain railway stations, a small portion of areas exhibited expansive coupling and expansive negative decoupling, where the rate of increase in human activity intensity was roughly equal to or exceeded the rate of ecological quality decline. The coupling model based on remote sensing ecological quality indicators and human activity intensity demonstrates good applicability in quantitatively exploring the nonlinear interactions between human activity changes and environmental quality variations.
3.5. Analysis of the Coupling Process Between Human Activity Intensity and Significant Ecological Quality Changes Along the Qinghai–Tibet Railway Corridor
To further quantitatively reveal the response characteristics of the ecological environment to changes in human activity intensity, this study uses various remote sensing ecological factor indices (NDVI, LST, Wet, NDBSI) and the composite remote sensing ecological quality index RSEI as the basis. By combining the RSEI regression model constructed in this study with the decoupling model, a decoupling method based on the RSEI ecological model is developed. Based on the previously analyzed spatial distribution characteristics of human activity intensity along the Qinghai–Tibet Railway, this method calculates the coupling elasticity coefficients and coupling relationship degrees between ecological quality characteristics and human activity intensity at different spatial and temporal scales within regions exhibiting significant changes.
At the same time, for each time period, regression models are constructed to quantify the relationships between ecological quality and individual ecological factors at the maximum spatial scale within each region. Using the normalized coefficients of each ecological factor in the regression models, the contribution and response trends of each factor to the decoupling degree between ecological quality and human activity intensity are quantitatively assessed. This approach enables a quantitative characterization of the coupling and change processes between the ecological environment and human activities across multiple spatial and temporal scales along the Qinghai–Tibet Railway corridor.
3.5.1. Characteristics of the Coupling Dynamics Between Human Activity Intensity and Ecological Quality at Multiple Spatiotemporal Scales Around the Xining Area
As shown in Figure 16, there are certain spatiotemporal variations in the coupling degree between ecological quality and human activity intensity around the Xining Station area. The contribution of each ecological factor to ecological quality changes varies across years, with greenness and wetness showing positive responses, while dryness and heat show negative responses. Between 1990 and 1995, the coupling relationship between ecological quality and human activity intensity was predominantly characterized by strong decoupling across all spatial scales. During this period, ecological quality improved alongside the expansion of human activities, indicating a relatively coordinated development of the ecological environment. The contributions of ecological factors to ecological quality were relatively balanced, with proportions as follows: greenness 26%, heat 26%, wetness 20%, and dryness 28%. From 1995 to 2001, the coupling type shifted to expansion coupling within the 0–5 km range, where human activity expansion drove ecological quality decline. In other spatial ranges, the coupling type was strong negative decoupling, indicating a decrease in human activity intensity but simultaneous ecological quality deterioration. Regarding ecological factor responses, the contribution of greenness dropped to 21%, heat increased to 42%, wetness decreased to 10%, and dryness remained relatively stable at 26%. This suggests that during this period, factors other than human activity significantly influenced ecological quality. Between 2001 and 2013, the coupling relationship reverted mainly to strong decoupling, with ecological quality generally improving and showing low correlation with changes in human activity intensity. However, the absolute value of the coupling elasticity coefficient decreased from 2001–2007 to 2007–2013, indicating that the rate of ecological quality change slowed relative to the rate of human activity development. Within this period, the contribution of greenness increased to about 37%, heat decreased to 32%, wetness dropped sharply to 3%, and dryness remained relatively stable. From 2013 to 2020, within the 0–35 km range, the coupling relationship changed to expansion negative decoupling, meaning that human activity expansion strongly drove ecological quality decline, with an elasticity coefficient about four times 1.2, indicating significant environmental pressure. The coupling type in the 35–60 km range remained unchanged. During this period, the contribution of greenness slightly decreased to 33%, heat rose to 43%, wetness stayed low at 4%, and dryness remained relatively high at 19%.
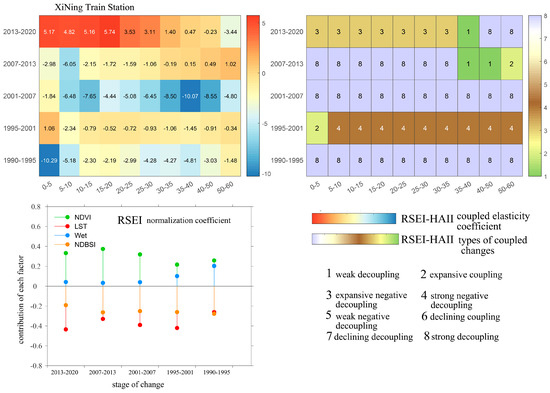
Figure 16.
Coupling Characteristics of Ecological Quality and Human Activity Intensity at Multiple Spatiotemporal Scales around Xining Station Based on the RSEI Ecological Model.
3.5.2. Coupling Characteristics of Human Activity Intensity and Ecological Quality at Multiple Spatiotemporal Scales Around Huangyuan Station
As shown in Figure 17, the coupling characteristics between ecological quality and human activity intensity around Huangyuan Station exhibit strong interannual fluctuations. The contribution trends of each ecological factor are similar to those around Xining Station, but their contribution levels differ significantly. From 1990 to 1995, within the 0–20 km range, the coupling type was expansionary negative decoupling, indicating that human activity expansion strongly drove ecological quality degradation. In the 20–60 km range, strong decoupling was dominant, where human activity intensity increased while ecological quality still showed positive changes. However, based on the coupling elasticity coefficient values, the rate of ecological quality change was slower than that of human activity intensity. During this period, the contributions of ecological factors to ecological quality were relatively high for greenness and heat, accounting for 28% and 29%, respectively, while moisture and dryness contributed less, at 21% and 22%. Between 1995 and 2001, the coupling characteristics fluctuated greatly across spatial scales, mainly showing weak negative decoupling and recession decoupling types. In both types, the reduction in human activity intensity drove ecological quality improvement, with recession decoupling having a stronger driving effect. During this interval, the moisture factor contribution increased to 32%, heat factor contribution dropped to 26%, greenness decreased to 22%, and dryness slightly declined to 20%. From 2001 to 2007, the coupling relationship shifted to predominantly strong decoupling, with simultaneous human activity expansion and ecological quality improvement. The correlation between human activity and ecological quality change was weak. In this period, the greenness factor contribution increased, heat factor contribution decreased, and moisture and dryness contributions slightly declined and increased, respectively. During 2007–2013, the coupling relationship on all spatial scales changed to expansionary negative decoupling, indicating a strong driving force of human activity expansion on ecological quality decline. Among the ecological factors, the contribution of greenness rose to 51%, while heat and dryness factors contributed equally at 20%, and moisture dropped to the lowest at 6%. Between 2013 and 2020, the coupling relationship reverted to recession decoupling and strong decoupling types, indicating that human activity expansion coexisted with ecological quality improvement and that the influence of human activity change was not significant. During this period, contributions from moisture and dryness factors increased, while those of heat and greenness decreased, with the response trends maintaining their directions.
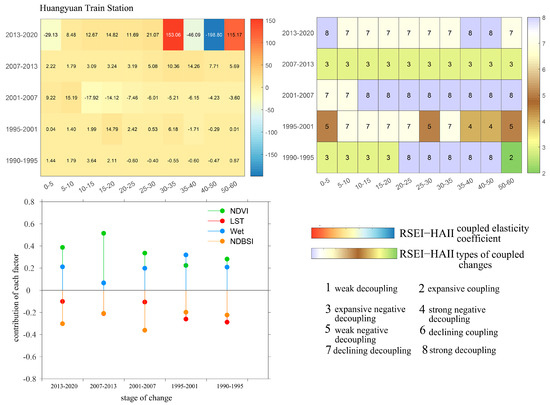
Figure 17.
Coupling characteristics of ecological quality and human activity intensity at different spatial and temporal scales around Huangyuan Station based on the RSEI ecological model.
3.5.3. Coupling Process Characteristics of Human Activity Intensity and Ecological Quality at Multiple Spatial and Temporal Scales in the Area Around Qinghai Lake
According to Figure 18, the coupling characteristics between ecological quality and human activity intensity around Qinghai Lake Station show significant spatial and temporal variations. The contribution of each ecological factor also varies markedly within the region. Among these factors, greenness consistently shows the highest contribution across the years, while the other three factors remain comparatively low. The contribution trends of each factor are consistent with those described previously. From 1990 to 1995, the coupling relationship is mainly characterized by expansive negative decoupling and strong negative decoupling, where the expansion of human activities drives the decline of ecological quality. The corresponding coupling elasticity coefficients indicate that the driving force of expansive negative decoupling is stronger. During this period, the contribution rates of ecological factors are greenness 82%, heat 9%, wetness 3%, and dryness 6%, highlighting the dominant role of greenness in ecological changes in this region. Between 1995 and 2001, within the 0–10 km range, the coupling characteristics remain unchanged, while in the 10–60 km range, the coupling relationship shifts to weak negative decoupling. This indicates a weakening driving force of human activities on ecological quality degradation, with a reduced rate of ecological decline. During this period, the contribution of greenness increases to 90%, while other factors decline. From 2001 to 2013, the coupling relationship predominantly shows strong decoupling, where ecological quality improves alongside expanding human activities, and the correlation between human activities and ecological quality change is relatively low. In this timeframe, the contribution of greenness decreases, while contributions from wetness and heat increase; dryness shows little change. During 2013 to 2020, within the 0–25 km range, the coupling relationship shifts back to expansive negative decoupling, whereas in the 25–60 km range, strong decoupling remains dominant. At 0–25 km, the driving force of human activity expansion on ecological quality decline strengthens, reversing the previous improvement trend. The contribution of greenness continues to decline to 55%, wetness rises to 11%, heat decreases to 7%, and dryness increases to 27%.
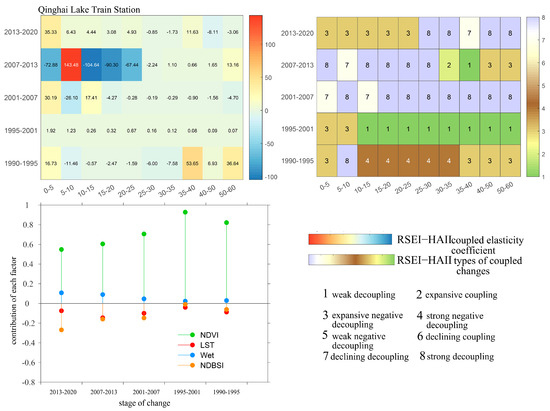
Figure 18.
Coupling characteristics of ecological quality and human activity intensity around Qinghai Lake at different spatial and temporal scales based on the RSEI ecological model.
3.5.4. Coupling Process Characteristics of Human Activity Intensity and Ecological Quality at Multiple Spatial and Temporal Scales Around the Gangcha Area
As shown in Figure 19, the spatiotemporal distribution characteristics of the coupling relationship between ecological quality and human activity intensity around the Gangcha site exhibit certain similarities with those in the Qinghai Lake site area. The contribution degrees of various ecological factors differ significantly across different years, with the heat factor consistently accounting for a relatively high proportion. The contribution trends of all ecological factors remain consistent with the previously described patterns. From 1990 to 1995, the coupling relationship was characterized by an expansionary negative decoupling type, where human activity expansion strongly drove the decline in ecological quality. The contribution rates of the ecological factors during this period were greenness 31%, heat 44%, humidity 15%, and dryness 10%. Between 1995 and 2001, the coupling relationship within the 0–10 km range was mainly strong negative decoupling, with ecological quality continuously declining as human activities expanded. In the 10–60 km range, strong decoupling was dominant, where ecological quality improved alongside human activity expansion; however, the correlation between these factors remained relatively weak in both cases. During this period, the contribution of the heat factor increased dramatically to 95%, while contributions from other factors declined to relatively low levels. From 2001 to 2007, the coupling relationship was mainly dominated by recession decoupling and strong decoupling types. Ecological quality generally showed improvement, with human activity intensity decreasing in recession decoupling zones. The correlation between human activity and ecological quality changes remained low in both coupling types. In this period, the contribution rates were greenness 35%, humidity 6%, heat 36%, and dryness 18%. Between 2007 and 2020, the decoupling types were primarily expansionary negative decoupling and strong decoupling, but the spatial distribution showed contrasting features between 2007–2013 and 2013–2020. During 2007–2013, human activity expansion had a strong driving effect leading to ecological degradation, while from 2013 to 2020, ecological quality tended to improve. The contribution rates during these years shifted as follows: greenness declined to 18%, heat declined to 44%, humidity increased to 15%, and dryness rose to 23%.
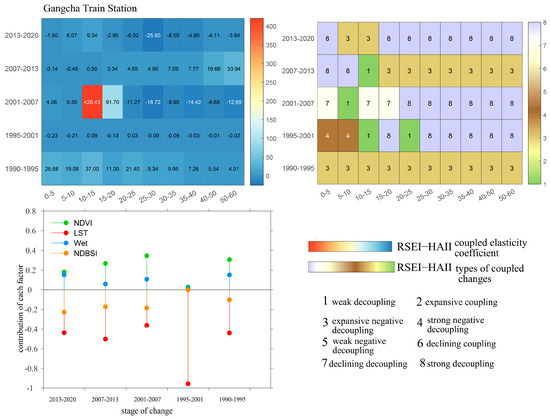
Figure 19.
Spatiotemporal Coupling Characteristics of Ecological Quality and Human Activity Intensity Based on the RSEI Ecological Model Around the Gangcha Area.
3.5.5. Coupling Process Characteristics of Human Activity Intensity and Ecological Quality at Multiple Spatiotemporal Scales Around the Jianghe Area
As shown in Figure 20, the spatial heterogeneity of the coupling relationship between ecological quality and human activity intensity around Jianghe Station is relatively low, with moderate interannual fluctuations. However, the contributions of individual ecological factors vary substantially, and their directional trends remain consistent with those described previously. From 1990 to 2001, the coupling relationship was dominated by strong decoupling, supplemented by weak decoupling. This indicates a low correlation between the expansion of human activities and changes in ecological quality, with ecological quality generally improving. Between 1990 and 1995, the contributions of ecological factors were as follows: greenness 74%, heat 1%, wetness 4%, and dryness 21%. In the period 1995–2001, the contributions of greenness and dryness decreased, while those of wetness and heat increased. Between 2001 and 2007, the coupling relationship shifted to expansionary negative decoupling, indicating a strong driving effect of human activity expansion on ecological quality decline. During this period, the contributions of ecological factors were greenness 31%, wetness 14%, heat 30%, and dryness 25%. From 2007 to 2013, the coupling characteristics resembled those of 1995–2001, showing a relatively strong positive association between human activity and ecological quality. From 2013 to 2020, the pattern was more similar to 2001–2007. In 2013–2020, the contributions of ecological factors were greenness 33%, wetness 17%, heat 24%, and dryness 26%.
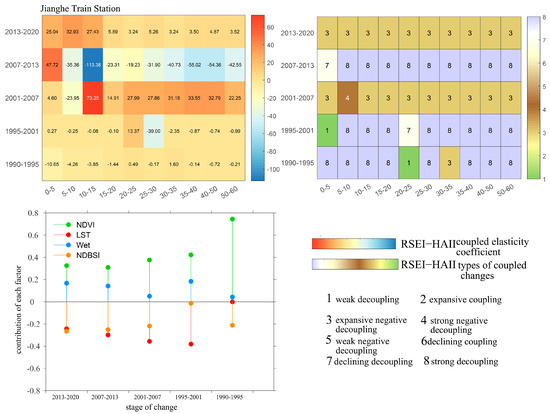
Figure 20.
Coupling characteristics of ecological quality and human activity intensity around Jianghe Station at different spatial and temporal scales based on the RSEI ecological model.
In summary, the coupling relationship between ecological quality and human activity intensity along the Qinghai–Tibet Railway demonstrates marked spatiotemporal heterogeneity and follows a complex evolutionary trajectory. The combined use of the RSEI ecological model and the decoupling model enables a deeper quantitative revelation of these intricate coupling dynamics. The relative contributions of individual ecological factors vary greatly across space and time, although their directional trends remain consistent: increases in greenness and wetness drive ecological quality improvement, whereas increases in heat and dryness drive ecological quality decline. Each ecological factor is highly sensitive to environmental changes, with strong fluctuations and varying directional responses in the same region over different time periods. Thus, relying on a single environmental factor to quantify ecological quality imposes significant limitations. Moreover, decomposing the coupling process by ecological factors reveals that human activity is only one of multiple influences shaping environmental change.
4. Discussion
The impact of human activity disturbances on the fragile ecosystems along the Qinghai–Tibet Railway cannot be overlooked. This study approaches the issue from a coupled human–environment perspective, examining the spatiotemporal distribution of integrated human activity intensity before and after railway construction at multiple spatial scales. We quantitatively reveal the coupling relationships between human activity intensity and ecological quality change across these scales. Unlike previous studies, we argue that a multi-scale analysis of the spatiotemporal distribution of human activity’s cumulative impact–and its decoupling relationship with ecological quality–provides the essential foundation for accurately assessing both the extent of human activity expansion and its effects on ecosystem change along the Qinghai–Tibet Railway.
The findings of this study indicate that human activity intensity along the Qinghai–Tibet Railway exhibits significant spatiotemporal variation across different segments and buffer zones and is closely associated with changes in ecological quality—findings that are consistent with previous research [11]. However, compared with the studies mentioned above, our findings reveal that in the areas along the Qinghai–Tibet Railway, the intensity of human activity is higher within a certain proximity to the railway—the closer to the railway, the greater the human activity intensity. Moreover, the peak in human activity intensity did not occur during the construction phase of the railway but rather increased progressively with the duration of its operation. Additionally, the relationship between human activity intensity and ecological quality change is not a simple linear one in any given region. Instead, multiple complex patterns dominated by strong decoupling are observed. This suggests that, at the current stage, there is already a significant correlation between changes in human activity intensity and ecological quality, which is consistent with the conclusions of most existing studies [33]. However, considering the differences in the strong decoupling patterns across regions, we further found that although ecological quality generally shows an improving trend in most areas where human activity intensity is increasing, the decoupling coefficients are all less than 1. This indicates that the rate of increase in human activity intensity has already surpassed the rate of ecological improvement. Given the ecologically fragile nature of the regions along the Qinghai–Tibet Railway, the unregulated growth of human activities—such as urban development, agriculture, tourism, and grazing—could lead to stagnation or even degradation of local ecological quality, thereby posing a potential threat to regional ecological security. Since the ecological environment exhibits a complex elastic response to both natural and anthropogenic disturbances, more precise and dynamic monitoring and assessment of regional ecological changes are still needed.
To date, there remains no clear consensus regarding the intensity of human activities along the Qinghai–Tibet Railway. Existing datasets, few in number, have been constructed for the entire Tibetan Plateau and are not directly comparable to our index. Although our synthesized human activity intensity–derived from the Human Footprint Index and other composite metrics–cannot be directly equated with those broader datasets, its spatial pattern shows considerable agreement. Moreover, most previous spatiotemporal analyses of human activities and environmental change along the railway have relied on indirect methods–evaluating long-term slope trends of individual vegetation or meteorological indices. There has been virtually no targeted study combining integrated human activity characteristics with multi-factor environmental coupling along the Qinghai–Tibet Railway corridor. In contrast, our study employs a decoupling model built upon established remote-sensing ecological quality frameworks and a multi-indicator human activity index. This approach enhances the continuous monitoring and evaluation of ecosystem changes throughout the railway’s construction and operational phases and provides essential technical support for regional ecological restoration and sustainable development.
In summary, the Qinghai–Tibet Plateau is a quintessentially fragile and underdeveloped ecological region, and studies of the complex impacts on its vulnerable rail corridor ecosystems deserve special attention. Our findings offer a valuable reference for research on the coupling between human disturbances and ecological quality and can inform region-specific ecosystem policies as well as the planning of transportation infrastructure. Numerous large-scale transport projects are underway on the plateau, playing a critical role in China’s high-quality regional development and public welfare. We contend that efficiently characterizing how human activities along rail corridors affect ecological quality will improve the precision of ecological-restoration management for lines such as the Sichuan–Tibet Railway. This also provides actionable insights for the design and implementation of new lines—like the proposed Xinjiang–Tibet Railway—and for the expansion of livelihood-focused infrastructure. Moreover, our approach can serve as a guideline to anticipate and mitigate the potential adverse ecological consequences of transport projects, thereby fostering ecosystem recovery. It is important to note that earlier studies often assumed a linear relationship between human activity and regional ecological change. However, policy should adopt a longer-term perspective and carefully account for the complex, scale-dependent interactions—especially in ecologically sensitive regions such as the Qinghai–Tibet Plateau, where strategic considerations are paramount.
5. Conclusions
Human activities are one of the most important drivers influencing changes in ecological environmental quality on the Qinghai–Tibet Plateau [39]. In this study, we first characterize the spatiotemporal patterns of human activity intensity along the Qinghai–Tibet Railway corridor by synthesizing multiple activity factors into a single index using the Human Footprint methodology. Our goal is to reveal how human activities vary across different spatial and temporal scales along the rail line. Next, drawing on production-theory decomposition methods, we develop a coupled modeling framework based on remote sensing ecological models. By integrating ecological regression relationships among individual environmental factors and overall ecological quality indices, then applying a decoupling analysis, we quantitatively unveil the coupling dynamics between human activity and ecosystem change at multiple spatial scales around each railway station and across different construction stages of the Qinghai–Tibet Railway. The research findings are as follows:
- (1)
- The spatial distribution of human activity intensity along the Qinghai–Tibet Railway is prominent, mainly centered around transportation lines and their intersections, expanding outward to surrounding areas. There is strong spatial heterogeneity among different segments, with the Xining–Jianghe section exhibiting the most regular variation in human activity characteristics. Under different spatial scales aggregated around various railway stations and across different construction and operation phases, human activity intensity shows distinct spatiotemporal variation patterns, with significant differences among station types. Overall, human activity intensity increased only slightly between 1990 and 2002, began to rise significantly from 2001 to 2007, and then the growth rate slowed down during 2013–2020. Within a 0–30 km radius from the railway centerline stations (with a 15 km radius), the growth rate decreases with increasing distance, while the trend stabilizes within the 30–60 km radius.
- (2)
- The coupling process between ecological quality and human activity intensity along the Qinghai–Tibet Railway shows strong spatiotemporal heterogeneity and complex variation across different scales. This study demonstrates that combining the Remote Sensing Ecological Index (RSEI) model with the decoupling model effectively quantifies their nonlinear and complex coupling relationship.
From 1990 to 2020, at a uniform spatial scale of 5 km, the coupling characteristics between ecological quality and human activity intensity along the Qinghai–Tibet Railway exhibited certain spatial heterogeneity. However, the overall coupling was primarily characterized by strong and weak decoupling, with strong decoupling being the dominant type. Weak decoupling was mainly distributed along the sides of the railway line. Overall, in most areas along the railway, ecological quality showed some improvement alongside increasing human activity intensity. However, the rate of ecological quality improvement was generally lower than the rate of increase in human activity intensity. In certain areas in close proximity to the railway, the increase in human activity intensity has resulted in a decline in ecological quality. For these areas, it is recommended that policy regulations be further strengthened—tailored to regional development conditions—particularly regarding urbanization, grazing, and tourism along the railway corridor, in order to protect the fragile local ecosystems. The coupling relationship between ecological quality and human activity intensity varies considerably across different stages of railway construction and exhibits significant differences across spatial and temporal scales. Exploring this coupling relationship in the region provides important scientific insights that can support the implementation of targeted and region-specific ecological protection measures.
Furthermore, the coupling between multiple ecological factors and human activity intensity along the Qinghai–Tibet Railway is highly complex and variable, with distinct patterns emerging across different spatial scales and stages of construction. The greater the change in human activity intensity, the stronger the heterogeneity of coupling types. Ecological factors differ in their sensitivity to changes in human activity intensity: greenness is relatively stable, heat is the most sensitive, and humidity and dryness exhibit a certain degree of negative correlation, with surface dryness being relatively sensitive. The contributions of ecological factors to the coupling process between ecological quality and human activity vary significantly in space and time, but their trend directions remain stable: increases in greenness and humidity correspond to ecological quality improvement, while increases in heat and dryness correspond to ecological quality degradation. Ecological factors show high sensitivity to environmental changes, with strong interannual fluctuations and variable responses within the same region. Through the nonlinear coupling decomposition process between ecological quality and human activities based on various ecological factors, it is further confirmed that human activity is only one of the factors influencing ecological environmental change.
Author Contributions
Conceptualization, F.Z. and Q.H.; methodology, F.Z.; software, F.Z. and Y.L.; validation, H.L. and X.Z.; formal analysis, Y.L.; investigation, F.Z.; resources, F.Z.; data curation, F.Z.; writing—original draft preparation, F.Z.; writing—review and editing, Q.H.; visualization, F.Z. and L.L.; supervision, F.Z.; project administration, Y.L.; funding acquisition, F.Z. All authors have read and agreed to the published version of the manuscript.
Funding
This research was funded by the Shandong Province Natural Science Foundation youth project in China, grant number ZR2023QD161, and the Rizhao Natural Science Youth Foundation, grant number RZ2022ZR52.
Data Availability Statement
Data are contained within the article.
Conflicts of Interest
The authors declare no conflict of interest.
References
- Wang, J.; Wang, K.; Zhang, M.; Zhang, C. Impacts of climate change and human activities on vegetation cover in hilly southern China. Ecol. Eng. 2015, 81, 451–461. [Google Scholar] [CrossRef]
- Dong, G.; He, L.; Liu, H.; Qi, Y.; Li, J. Key factors of ecological environmen t evaluation in eco-system and management. Eniron. Monit. China 2013, 29, 41–45. [Google Scholar]
- Xu, B.; Li, J.; Luo, Z.; Wu, J.; Liu, Y.; Yang, H.; Pei, X. Analyzing the spatiotemporal vegetation dynamics and their responses to climate change along the Ya’an–Linzhi section of the Sichuan–Tibet railway. Remote Sens. 2022, 14, 3584. [Google Scholar] [CrossRef]
- Ma, C.; Li, T.; Liu, P. Gimms ndvi3g+ (1982–2015) response to climate change and engineering activities along the Qinghai–Tibet railway. Ecol. Indic. 2021, 128, 107821. [Google Scholar] [CrossRef]
- Ji, C.; Yang, H.; Pei, X.; Zhang, X.; Chen, L.; Liang, D.; Cao, Y.; Pan, J.; Chen, M. Dynamic integrated ecological assessment along the corridor of the Sichuan–Tibet railway. Land 2024, 13, 857. [Google Scholar] [CrossRef]
- Sun, Y.; Guo, J.; Zhao, L.; Jin, G.; Wang, Y.; Yue, D. Impacts of transport corridor on ecosystem vulnerability in the Qinghai-Tibetan plateau: Insights from the Sino-Nepalese transport corridor. J. Clean. Prod. 2024, 470, 143311. [Google Scholar] [CrossRef]
- Chen, Y.; Zhang, T.; Zhou, X.; Li, J.; Yi, G.; Bie, X.; Hu, J.; Wen, B. Ecological sensitivity and its driving factors in the area along the Sichuan–Tibet railway. Environ. Dev. Sustain. 2024, 26, 20189–20208. [Google Scholar] [CrossRef]
- Liu, F.; Liu, F.-G.; Zhou, Q.; Chen, Q.; Wang, S.-Z.; Guo, R.; Ma, W.-D. Ecological risk and regional differentiation in the Qinghai-Tibet plateau. J. Nat. Resour. 2021, 36, 3232–3246. [Google Scholar] [CrossRef]
- Gao, D.; Li, S. Spatiotemporal impact of railway network in the qinghai-tibet plateau on accessibility and economic linkages during 1984–2030. J. Transp. Geogr. 2022, 100, 103332. [Google Scholar] [CrossRef]
- Gao, X.; Wang, B.; Sun, D. Do railways improve territorial cohesion of the Tibetan plateau? A case study of the Qinghai-Tibet railway. Appl. Geogr. 2022, 144, 102720. [Google Scholar] [CrossRef]
- Zhang, L.; Miao, Y.; Wei, H.; Dai, T. Ecological impacts associated with the Qinghai–Tibet railway and its influencing factors: A comparison study on diversified research units. Int. J. Environ. Res. Public Health 2023, 20, 4154. [Google Scholar] [CrossRef] [PubMed]
- Laurance, W.F.; Clements, G.R.; Sloan, S.; O’Connell, C.S.; Mueller, N.D.; Goosem, M.; Venter, O.; Edwards, D.P.; Phalan, B.; Balmford, A. A global strategy for road building. Nature 2014, 513, 229–232. [Google Scholar] [CrossRef] [PubMed]
- Ibisch, P.L.; Hoffmann, M.T.; Kreft, S.; Pe’er, G.; Kati, V.; Biber-Freudenberger, L.; DellaSala, D.A.; Vale, M.M.; Hobson, P.R.; Selva, N. A global map of roadless areas and their conservation status. Science 2016, 354, 1423–1427. [Google Scholar] [CrossRef] [PubMed]
- Sun, L.; Li, H.; Wang, J.; Chen, Y.; Xiong, N.; Wang, Z.; Wang, J.; Xu, J. Impacts of climate change and human activities on ndvi in the qinghai-tibet plateau. Remote Sens. 2023, 15, 587. [Google Scholar] [CrossRef]
- Wang, S.; Tan, X.; Fan, F. Landscape ecological risk assessment and impact factor analysis of the Qinghai–Tibetan plateau. Remote Sens. 2022, 14, 4726. [Google Scholar] [CrossRef]
- Zhao, W.; Cheng, Y.; Jian, J.; Jiao, J.; Cheng, C.; Li, J.; Chen, T. Water erosion changes on the Qinghai-Tibet plateau and its response to climate variability and human activities during 1982–2015. CATENA 2023, 229, 107207. [Google Scholar] [CrossRef]
- Fu, D.; Bu, B.; Wu, J.; Singh, R.P. Investigation on the carbon sequestration capacity of vegetation along a heavy traffic load expressway. J. Environ. Manag. 2019, 241, 549–557. [Google Scholar] [CrossRef]
- Wang, G.; Gillespie, A.R.; Liang, S.; Mushkin, A.; Wu, Q. Effect of the Qinghai–Tibet railway on vegetation abundance. Int. J. Remote Sens. 2015, 36, 5222–5238. [Google Scholar] [CrossRef]
- Duffett, D.; D’amico, M.; Mulero-Pazmany, M.; González-Suárez, M. Species’ traits as predictors of avoidance towards roads and traffic. Ecol. Indic. 2020, 115, 106402. [Google Scholar] [CrossRef]
- Li, W.; Liu, Y.; Lin, Q.; Wu, X.; Hao, J.; Zhou, Z.; Zhang, X. Identification of ecological security pattern in the Qinghai-Tibet plateau. Ecol. Indic. 2025, 170, 113057. [Google Scholar] [CrossRef]
- Zhang, T.; Yu, W.; Lu, Y.; Chen, L. Identification and correlation analysis of engineering environmental risk factors along the Qinghai–Tibet engineering corridor. Remote Sens. 2022, 14, 908. [Google Scholar] [CrossRef]
- Zhou, D.; Zhang, L.; Huang, L.; Fan, J.; Li, Y.; Zhang, H. Satellite evidence for small biophysical effects of transport infrastructure in the Qinghai-Tibet plateau. J. Clean. Prod. 2023, 416, 138002. [Google Scholar] [CrossRef]
- Feng, Y.; Li, G. Interaction between urbanization and eco-environment in the Tibetan Plateau. J. Geogr. Sci. 2021, 31, 298–324. [Google Scholar] [CrossRef]
- Fan, J.; Wang, H.; Chen, D.; Zhang, W.; Wang, C. Discussion on sustainable urbanization in Tibet. Chin. Geogr. Sci. 2010, 20, 258–268. [Google Scholar] [CrossRef]
- Wei, Y.Q.; Lu, H.Y.; Wang, J.N.; Sun, J.; Wang, X.F. Responses of vegetation zones, in the Qinghai-Tibetan Plateau, to climate change and anthropogenic influences over the last 35 years. Pratacult. Sci. 2019, 36, 1163–1176. [Google Scholar]
- Yang, S.; Zhu, G.; Zhang, L.; Xu, H. Spatiotemporal variations of ecosystem service indicators and the driving factors under climate change in the Qinghai–Tibet highway corridor. Front. Environ. Sci. 2022, 10, 935713. [Google Scholar] [CrossRef]
- Huang, K.; Zhang, Y.; Zhu, J.; Liu, Y.; Zu, J.; Zhang, J. The influences of climate change and human activities on vegetation dynamics in the Qinghai-Tibet plateau. Remote Sens. 2016, 8, 876. [Google Scholar] [CrossRef]
- Luo, L.; Duan, Q.; Wang, L.; Zhao, W.; Zhuang, Y. Increased human pressures on the alpine ecosystem along the Qinghai-Tibet railway. Reg. Environ. Change 2020, 20, 33. [Google Scholar] [CrossRef]
- Wang, X.; Huang, X.; Zhang, X.; Yan, Y.; Zhou, C.; Zhou, J.; Feng, X. Analysis of the spatio-temporal change of social-ecological system coupling: A case study in the Qinghai-Tibet plateau. Glob. Ecol. Conserv. 2022, 33, e01973. [Google Scholar] [CrossRef]
- Miao, Y.; Dai, T.; Yang, X.; Song, J. Landscape fragmentation associated with the qingzang highway and its influencing factors—A comparison study on road sections and buffers. Geogr. Sustain. 2021, 2, 59–67. [Google Scholar] [CrossRef]
- Zou, F.; Hu, Q.; Liu, Y.; Li, H.; Zhang, X.; Liu, Y. Spatiotemporal Changes and Driving Analysis of Ecological Environmental Quality along the Qinghai–Tibet Railway Using Google Earth Engine—A Case Study Covering Xining to Jianghe Stations. Remote Sening 2024, 16, 951. [Google Scholar] [CrossRef]
- Liu, H.; Fan, J.; Zhou, K.; Xu, X.; Zhang, H.; Guo, R.; Chen, S. Assessing the dynamics of human activity intensity and its natural and socioeconomic determinants in Qinghai–Tibet plateau. Geogr. Sustain. 2023, 4, 294–304. [Google Scholar] [CrossRef]
- Liu, H.; Cheng, Y.; Liu, Z.; Li, Q.; Zhang, H.; Wei, W. Conflict or coordination? The spatiotemporal relationship between humans and nature on the Qinghai-Tibet Plateau. Earth’s Future 2023, 11, e2022EF003452. [Google Scholar] [CrossRef]
- Ang, B.W. LMDI decomposition approach: A guide for implementation. Energy Policy 2015, 86, 233–238. [Google Scholar] [CrossRef]
- Sun, J.; Wang, J.; Wang, T.; Zhang, T. Urbanization, economic growth, and environmental pollution: Partial differential analysis based on the spatial durbin model. Manag. Environ. Qual. Int. J. 2019, 30, 483–494. [Google Scholar] [CrossRef]
- Tapio, P. Towards a theory of decoupling: Degrees of decoupling in the eu and the case of road traffic in finland between 1970 and 2001. Transp. Policy 2005, 12, 137–151. [Google Scholar] [CrossRef]
- Chen, J.; Xu, C.; Song, M. Determinants for decoupling economic growth from carbon dioxide emissions in china. Reg. Environ. Change 2020, 20, 1–12. [Google Scholar] [CrossRef]
- Wang, H.; Ang, B.; Zhou, P. Decomposing aggregate CO2 emission changes with heterogeneity: An extended production-theoretical approach. Energy J. 2018, 39, 59–80. [Google Scholar] [CrossRef]
- Allan, R.P.; Arias, P.A.; Berger, S.; Canadell, J.G.; Cassou, C.; Chen, D.; Cherchi, A.; Connors, S.L.; Coppola, E.; Cruz, F.; et al. Intergovernmental panel on climate change (IPCC). Summary for policymakers. In Climate Change 2021: The Physical Science Basis. Contribution of Working Group I to the Sixth Assessment Report of the Intergovernmental Panel on Climate Change; Cambridge University Press: Cambridge, UK, 2023; pp. 3–32. [Google Scholar]
Disclaimer/Publisher’s Note: The statements, opinions and data contained in all publications are solely those of the individual author(s) and contributor(s) and not of MDPI and/or the editor(s). MDPI and/or the editor(s) disclaim responsibility for any injury to people or property resulting from any ideas, methods, instructions or products referred to in the content. |
© 2025 by the authors. Licensee MDPI, Basel, Switzerland. This article is an open access article distributed under the terms and conditions of the Creative Commons Attribution (CC BY) license (https://creativecommons.org/licenses/by/4.0/).