Abstract
Currently, samples are a critical driving force in the application of deep learning. However, the use of samples encounters problems, such as an inconsistent annotation quality, mismatches between images and labels, and a lack of fine-grained labels. Refining sample labels is essential for training a sophisticated model. Refining sample labels through manual verification is labor-intensive, especially for training large models. Additionally, existing label refinement methods based on deep neural networks (DNNs) typically rely on image features to directly predict segmentation results, often overlooking the potential information embedded in existing noisy labels. To address these challenges and shortcomings, this study proposes a novel remote sensing sample label refinement (LR) network, named the identify–update–refine network (IUR-Net). IUR-Net leverages newly acquired remote sensing images and their corresponding noisy labels to automatically identify erroneous regions, update them with more accurate information, and refine the results to improve label quality. A multi-scale, error-aware localization module (Ms-EALM) is designed to capture label–image inconsistencies, enabling the more accurate localization of erroneous label regions. To evaluate the proposed framework, we first constructed and publicly released two benchmark datasets for the label refinement task: WHU-LR and EVLAB-LR. The experimental results on these datasets demonstrate that the labels refined by IUR-Net not only outperform the baseline model in both IoU and F1 scores, but also effectively identify errors in noisy annotations.
1. Introduction
In the rapid development of artificial intelligence technology, data, algorithms, and computational power are recognized as the three cornerstones [1,2]. Especially for large models, the quality of sample data is crucial to the training and performance of models [3,4]. As an important means of acquiring surface information, remote sensing technology provides a vast amount of data for various applications, such as urban planning [5], land cover, and land use classification [6]. Label refinement (LR) is the process of identifying and correcting noisy labels in the task of the semantic segmentation of remote sensing images, thereby improving the quality of training data and model performance [7]. In the field of the semantic segmentation of remote sensing imagery, label noise primarily arises from various sources, including human errors during manual annotation, the inaccuracies of automated labeling tools, and the inherent complexity of remote sensing images that complicates interpretation [8]. Label noise significantly undermines the learning efficiency and generalization capacity of models, leading to poor performance on unseen data and the erroneous classification of geographical features due to model misguidance by noisy labels. By refining labels, the negative impact of noisy samples can be effectively mitigated, enhancing the model’s accuracy in identifying complex land surface features. Label refinement plays a critical role in the following scenarios: natural resource monitoring [9], building change tracking [10], and zero-shot segmentation tasks [11].
The main challenges faced in the study of noisy labels in the semantic segmentation of remote sensing images include the difficulty in obtaining accurately annotated large-scale datasets, which are crucial for the effective training of deep neural networks (DNNs) [12,13]. Relying on non-expert sources for annotation may lead to a high proportion of unreliable labels, with reported label corruption rates ranging from 8% to 38.5% [14,15]. Because DNNs are capable of fitting complex functions, they are particularly susceptible to overfitting noisy labels [16], which weakens their generalization ability. Although traditional regularization techniques [17] help, they do not fully address the overfitting problem caused by noisy labels. Achieving a good generalization ability in the presence of noisy labels remains a significant challenge [18]. This highlights a gap in the research, indicating a need for innovative methods to mitigate the impact of label noise, improve label accuracy, and enhance model robustness in noisy environments. On the other hand, the vast differences in the spatial and spectral characteristics of remote sensing data—influenced by weather conditions [19], seasonal changes [20], and sensor types and settings at the time of acquisition [21]—as well as the high-dimensional nature and the large amount of spectral bands contained in the data [22], pose significant challenges in terms of data annotation’s accuracy and quality. The complexity of the information on the different surface characteristics provided by each spectral band requires that annotation work not only needs precise expertise but also must consider the variable external conditions, which collectively increase the difficulty of obtaining high-quality annotated data.
Exploring robust learning methods for noisy labels highlights the importance of these strategies in optimizing model processing capabilities [23]. Moreover, the complexity of remote sensing data reinforces the critical impact of high-quality annotations on model performance improvement. Figure 1 illustrates the process of refining labels for remote sensing image samples, where noisy labels are refined through an iterative phase incorporating conditional and secondary screening. This process generates high-quality refined labels, with conditions involving either manual correction or automated procedures. Regarding methods based on manual verification, Wang et al. [24] proposed a multi-annotator remote sensing data label refinement method that enhances label accuracy, but this increases the workload of annotators. AQSNet [25], an automated sample selection method, identifies high-quality samples through quality inspection but reduces the number of samples available for training. Robust label refinement architectures, such as HRRNet [26], achieve more accurate labels through feature-level hierarchical refinement. Although feature-level refinement effectively improves target detection performance in complex scenes, it increases model complexity and inference time [27]. To achieve automated boundary refinement, Guo et al. [28] introduced CBR-Net, with its coarse-to-fine boundary refinement technique, which accurately extracts buildings’ footprints from remote sensing images, ensuring entity continuity and boundary precision. In change detection tasks, an efficient weakly supervised label refinement strategy, combining low-resolution and high-resolution training data significantly improves the detection accuracy [29]. The mentioned existing label refinement methods based on DNNs typically rely on image features to directly predict segmentation results, often overlooking the potential information embedded in existing noisy labels. Such methods represent a direct “generation” process rather than an “optimization” process based on existing labels, which may overlook some correct information contained in the original labels.
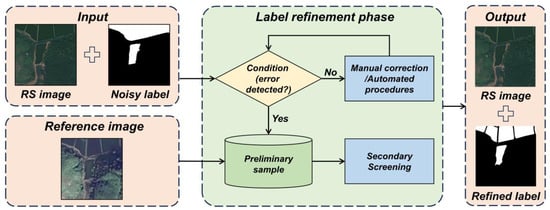
Figure 1.
Remote sensing image sample label refinement process.
To address these challenges, we propose the identify–update–refine network (IUR-Net), a task-specific framework tailored for the label refinement problem in remote sensing semantic segmentation. IUR-Net reformulates the label refinement task into a progressive three-stage framework—identify, update, and refine—to overcome the limitations of direct end-to-end optimization by decoupling high-dimensional complexity into structured, interpretable sub-problems. In the error identification phase, IUR-Net separately extracts features from remote sensing images and noisy labels and concatenates them along with their difference to form a unified feature representation, which is then processed by the multi-scale, error-aware localization module (Ms-EALM) to generate an error probability map. The label updating phase leverages the error probability map to selectively update noisy labels, modifying only regions with high error probabilities while preserving those with low error probabilities. In the label refinement phase, IUR-Net employs a dual-branch refinement module that suppresses fine-grained noise and enhances label precision through residual modeling and denoising-guided modulation. The three main contributions of this study are summarized as follows:
- (1)
- Firstly, we propose a label refinement method for the semantic segmentation of remote sensing images based on IUR-Net. This method integrates newly acquired remote sensing imagery with existing noisy labels to automatically identify, update, and refine erroneous regions within the labels.
- (2)
- Secondly, this study designs a plug-and-play Ms-EALM aimed at capturing inconsistencies between remote sensing images and noisy labels, thereby enabling the more-precise localization of erroneous label regions in multidimensional feature space.
- (3)
- Lastly, we have released two benchmark datasets for the label refinement task, WHU-LR and EVLAB-LR, which are not only suitable for research on learning from noisy samples but also applicable to fields such as the automatic updating of land cover changes, the tracking of urban architectural changes, and the fine-tuning of foundation models.
2. Related Work
This section reviews representative strategies for learning with noisy labels in remote sensing, which can be grouped into three categories: (1) robust architectures and regularization, which improve model resilience to noise; (2) robust loss functions and adjustments, which mitigate noise effects by modifying the learning objective; and (3) sample selection methods, which filter clean samples to enhance label quality. By analyzing these approaches, we highlight a common limitation: they primarily aim to tolerate or filter noise, rather than explicitly correcting it. This motivates our work, which focuses on directly optimizing the labels themselves in a structured manner.
2.1. Based on Robust Architecture and Regularization
To enhance the model’s robustness under label noise, a widely adopted strategy is to design noise-tolerant architectures or incorporate regularization techniques. For instance, Huang [30] et al. introduced an attention-guided label refinement network that improves segmentation accuracy in high-resolution remote sensing scenes. However, its effectiveness drops significantly when faced with large-scale noisy training data. Additionally, expectation-maximization-based frameworks [31] attempt to iteratively estimate label quality but suffer from a high computational cost and vulnerability to local optima. Meanwhile, robust regularization methods reduce overfitting to incorrect labels through explicit or implicit means, with techniques such as weight decay [32], batch normalization [33], dropout [34], and data augmentation [35] widely used to improve robustness against label noise. These methods perform well on data with medium levels of noise, but when used alone, they are insufficient to significantly improve test accuracy on heavily noisy data [36]. The main advantage of this series of techniques is their flexibility, requiring only minor modifications to work in concert with other methods. However, these methods may introduce sensitive model-dependent hyperparameters or require deeper architectures to compensate for their reduced capacity [37].
Despite their diversity, these methods share a fundamental limitation: they passively tolerate label noise but lack mechanisms to explicitly identify and correct mislabeled samples. As a result, all training samples are treated equally, which limits their effectiveness in refining label quality under severe noise conditions [38].
2.2. Based on Robust Loss Functions and Adjustments
Another mainstream strategy focuses on modifying the loss function to reduce the impact of noisy labels during training. Robust loss functions are designed to steer deep neural networks toward approximating the Bayesian optimal classifier, thereby improving their generalization on clean data [39]. In practice, these loss functions often achieve promising results under low-noise settings or in tasks with limited complexity. Moreover, modifying loss functions may increase the training time required for the model to converge [40]. To further enhance robustness, loss adjustment methods adjust the loss value based on the confidence level of the given labels, including loss correction [41], loss reweighting [42], label refurbishment [43], and meta-learning [44], to minimize the negative impact of label noise. These methods have demonstrated effectiveness in mitigating the influence of label noise across various vision tasks. However, their practical performance hinges heavily on prior knowledge of noise distributions and the careful tuning of task-specific parameters. Consequently, while robust loss functions and adjustments can suppress the influence of noise to some extent, they are insufficient in isolation to support fine-grained label refinement or dynamic label correction in highly noisy remote sensing scenarios.
2.3. Based on Sample Selection
Sample selection is a method to pick out truly labeled samples from a noisy training dataset, thereby avoiding erroneous corrections [45]. A typical approach is Multi-Round Learning [46], which performs random partitioning and cross-validation to select clean samples and applies a co-teaching strategy in later training stages to enhance model robustness [47]. However, these methods rely heavily on the accuracy of sample quality estimation and are sensitive to initial noise levels. Poor selection may lead to the exclusion of valuable training data or the retention of corrupted labels. Zhang et al. [25] proposed AQSNet, an Automatic Quality Assessment model that selects high-quality samples through quality inspection, refining sample selection and improving label accuracy in remote sensing data. While this approach improves sample reliability, it inevitably sacrifices data quantity, which hinders the training of large-scale models and reduces their generalization capacity. More importantly, most sample selection methods operate in a pre-processing or offline manner, lacking the ability to dynamically identify and refine noisy labels during model optimization. Therefore, sample selection strategies are often insufficient when precise, pixel-level label refinement is required—particularly in dense prediction tasks, like remote sensing semantic segmentation.
3. Methodology
3.1. Overview
Consider a remote sensing image, , with dimensions , where represents the value of an individual pixel. Correspondingly, we define an initial set of noisy labels, , with each denoting the label associated with pixel . The objective of this study is to generate a refined label set, , from the noisy labels by jointly leveraging both the remote sensing image, , and the existing noisy labels, . Through the learning process, the model optimizes label prediction, thereby generating a more precise set of labels:
Mathematically, the label refinement process aims to minimize the discrepancy between the refined labels, , and the provided high-quality ground truth (GT) labels, , represented by the following objective:
3.2. Identify, Update, and Refine Architecture
While the label refinement task can be formulated as a single optimization problem, direct end-to-end approaches often struggle with the complexity of high-dimensional feature spaces and are prone to convergence to suboptimal solutions. To address this, we propose decomposing the refinement process into three sequential stages: identify (), update (), and refine (). This progressive strategy transforms the original global optimization into a chain of sub-problems, enabling the model to first localize noisy regions, then conditionally correct them, and finally fine-tune structural details. This design not only improves the stability of training but also enhances the accuracy of label refinement in a coarse-to-fine manner. Formally, the unified objective can be expressed as follows:
This is equivalent to solving the following composite optimization problem:
With this formulation, we introduce the IUR-Net architecture, designed to systematically identify, update, and refine noisy labels within the semantic segmentation of remote sensing images. An overview of the network architecture is presented in Figure 2.
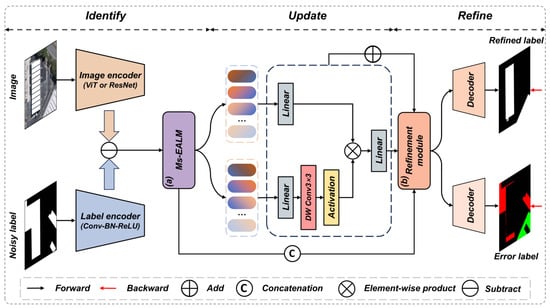
Figure 2.
Detailed architecture of the proposed IUR-Net.
Identify Architecture: The first step in our unified processing framework focuses on identifying mislabeled pixels in the initial set of noisy labels, . By extracting features from both the remote sensing image and the noisy labels using two feature extractors, we utilize popular image segmentation networks, such as UNet, HRNet, and Vision transformer (based on transformer), for their rich spatial and spectral information. Conversely, the noisy labels, containing only binary information, are processed through simple convolution, normalization, activation, and pooling operations. To explicitly capture the semantic inconsistency between the image and label modalities, we compute the difference feature , which highlights potentially spurious and missing regions. To fully exploit complementary information, we further concatenate the image features, label features, and their difference before feeding them into the Ms-EALM for joint reasoning. Accordingly, we incorporate the Ms-EALM to identify label–image inconsistencies and generate an error probability map that further highlights mislabeled regions. Formally, this module can be expressed as follows:
where and represent the extracted features from the image and labels, respectively; represents the nonlinear activation function mapping the final fused features into an error probability map, , that matches the dimensions of . The values in this error probability map have a range of [−1,1], with areas of larger absolute values clearly indicating false-negative and false-positive information in the noisy labels.
Update Architecture: Following the generation of the error probability map by the identify architecture, the purpose of the update architecture is to update a set of improved new labels, . This stage transforms the original global optimization into a localized conditional correction problem, significantly reducing the optimization complexity. This process centrally involves the initial noisy labels, , and the label updating module, , where also receives the error probability map as an input, facilitating the correction of potential errors. Guided by the error probability map, , which reveals the likelihood of each label being incorrectly judged, the updated labels can be calculated using the following formula:
In this formula, the error probability map, , acts as a gating mechanism: when I ≈ 1, labels are updated, and when I ≈ 0, original labels are retained. Here, the updating component focuses on potential error areas in the image, providing new, more accurate labels to update the incorrect ones. This phase offers a more direct and dynamic way to deal with noisy labels compared to traditional robust architecture and regularization methods, reducing the impact of noise through precise adjustments, rather than relying solely on vague noise adaptation layers or regularization techniques.
Refine Architecture: In the step of image label refinement, we initially utilize the identify and update architectures to recognize and preliminarily correct obvious label errors without considering detail issues. A dedicated refinement module is designed to further eliminate fine-grained noise, such as scattered salt-and-pepper artifacts, enabling the more precise correction of subtle label inaccuracies. The architecture of the refinement module is shown in Figure 3. The refinement module includes two branches: the upper branch extracts residual details, , from the update architecture via multi-scale convolutions and softmax fusion; the lower branch fuses features from the update and identify architectures to generate a noise-aware attention map, , which guides the correction in noisy regions. Formally, the final label refinement output is computed as follows:
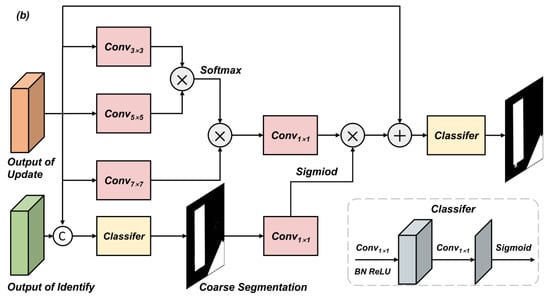
Figure 3.
The architecture of the denoising-guided refinement module.
Here, denotes the final classifier, which consists of a convolutional layer followed by a Sigmoid activation. By combining structural detail recovery and noise-aware modulation, the module ensures enhanced label precision and semantic consistency.
Through the application of the identify architecture, we initially identify errors in the labels. Subsequently, the update architecture further updates these labels. Finally, the refine architecture fine-tunes the label map through the method of residual correction, thereby realizing a gradual optimization of the labels from coarse to fine. By decomposing the overall optimization into sequential identify, update, and refine modules, our approach progressively enhances label quality for accurate semantic segmentation.
3.3. Multi-Scale, Error-Aware Localization Module
The accurate detection of area mapping errors in noisy labels is critical for effective label refinement in the semantic segmentation of remote sensing images. To address this, the Ms-EALM is designed as a dedicated module to detect label–image inconsistencies and localize erroneous label regions. Specifically, the image features, , label features, , and their difference, , are first to be individually fed into a multi-scale processing branch, as illustrated in Figure 4. This design enables the module to perceive semantic inconsistency information across different spatial scales. In particular, we apply multiple convolutions with varying kernel sizes on the input features to capture context at different scales:
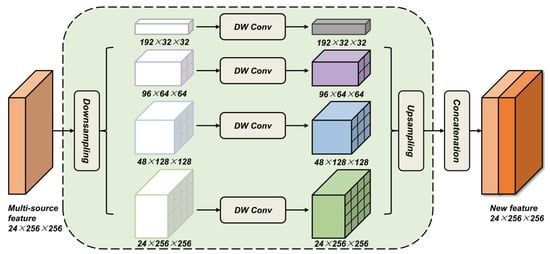
Figure 4.
Multi-source feature processing via multi-scale, depthwise convolutions and fusion.
These multi-scale features are then concatenated:
As illustrated in Figure 5, unlike prior triplet-attention-based [48] designs, our module explicitly computes the difference feature to capture semantic discrepancies between image and label modalities. After multi-scale feature extraction, the three resulting feature maps are further refined through Z-pooling, convolution, and batch normalization. These processed features are then concatenated to form a joint representation, which is passed through additional convolutional layers to generate the final error probability map . Formally, this process is defined as follows:
where indicates false positives (e.g., spurious labels), and marks false negatives (e.g., missing labels).
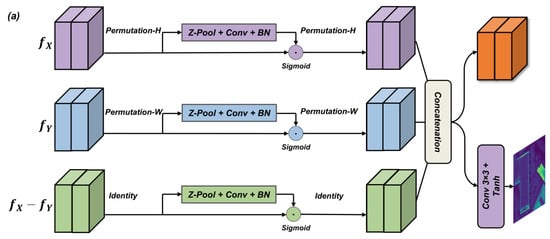
Figure 5.
The architecture of the multi-scale, error-aware localization module (Ms-EALM).
Compared to other attention mechanisms, such as SENet and CBAM, Ms-EALM achieves task-specific superiority by directly optimizing label–image discrepancies, rather than generic feature importance. Its scale-aware design adapts to error granularity, while interpretable outputs guide downstream label correction. This eliminates heuristic thresholds and ensures efficient error localization with a negligible computational overhead.
3.4. Explored Architectures
To validate the performance of the proposed identify–update–refine architecture for the label refinement task in the semantic segmentation of remote sensing images, this study constructed and compared multiple architectures using the same core elements. Overall, our studied architectures focus on the following:
Baseline Architecture: in this scenario, we use noisy labels as the model’s ground truth, where the input is post-event imagery. This process can be represented by the following formula:
Identify Architecture: in this case, the identify architecture is used to generate an error probability map, which is subsequently binarized to obtain the final segmentation result. This process can be represented by the following formula:
where is the Heaviside function, and T is the threshold.
Identify + Refine Architecture: after generating an error probability map using the identify architecture, the refine architecture is applied to further eliminate noise and refine boundaries. This process can be represented by the following formula:
Identify + Update Architecture: After generating an error probability map using the identify architecture, the update architecture is applied to decide whether to retain the initial noisy labels or to update them. This process can be represented by the following formula:
Identify + Update + Refine Architecture: This is the composite architecture proposed in this paper, detailed in Section 3.2.
Identify + Update + Refine × N: Clearly, this architecture involves N iterations based on the foundation proposed in this paper.
3.5. Implementation Details
Label refinement experiments were conducted separately on the WHU-LR and EVLAB-LR datasets. The experiments utilized the PyTorch 1.7.0 and Timm 0.6.12 frameworks, combined with the Adam optimizer, and were conducted on two NVIDIA A6000 graphics cards over 100 rounds of training from scratch, with an initial learning rate set at 1 × 10⁻⁴. The size of the input images was standardized to 512 × 512, with a total batch size set at 16. We fixed the random seed at 42 for all the experiments to ensure consistency across runs. To prevent model overfitting, a unified data augmentation strategy was adopted, including random shift rotation, the random adjustment of hue and saturation, random horizontal and vertical flips, and random 90-degree rotations. For feature extraction, CNNs and transformers were used as the backbone networks, and ImageNet pre-trained weights were employed to enhance the model’s performance. In terms of the loss function design, a combination of cross-entropy loss and Dice loss was used to adapt to the feature distribution of the images.
For the IUR-Net, which consists of the identify, update, and refine sub-modules, the overall loss function was constructed by the weighted sum of the three loss terms. The identify module generates an error probability map, , which is supervised by the ground truth error mask, . We adopt a weighted loss to penalize both false positives and negatives:
where , , and balances the emphasis on false positives vs. false negatives. The update module corrects noisy labels to produce We optimize this stage using a combination of cross-entropy (CE) and Dice losses to handle the class imbalance:
The refine module enhances image precision via residual learning. To align with the update stage, we adopt a combined CE + Dice loss:
where scales the Dice term. The final objective is a weighted sum of the three losses:
The three weighting hyperparameters are determined through a cross-validation process and are finally set as .
4. Experiments and Results
4.1. Dataset
Unlike conventional semantic segmentation task datasets, the label refinement process takes remote sensing images and noisy labels as inputs, with refined labels as outputs. To validate the effectiveness of the new method proposed in this study, we designed the WHU-LR dataset using the Wuhan University Building Change Detection dataset (WHU-CD) and released a new dataset, EVLAB-LR, followed by a series of comprehensive experimental studies. The specific descriptions of the two datasets are as follows:
WHU-LR: The dataset, built on the widely recognized WHU-CD benchmark for change detection, inherits the high-quality standards of this foundational dataset. The input includes the early 2011 labels from WHU-CD as unrefined labels and the late-2016 imagery, with the late-2016 refined labels serving as the output. This dataset is constructed to utilize the differences between pre- and post-change labels, with the model updating the unrefined labels by learning these differences. The study area is located in Christchurch, New Zealand, covering approximately 120,000 buildings with various architectural styles and purposes. All the data are divided into 512 × 512 pixel tiles, with a ground resolution of 0.2 m. The dataset is then split into a training set (1260 tiles) and a test set (690 tiles). Additionally, to increase the change information, the dataset simulates misalignment and building changes in bi-temporal images by randomly moving building masks by 0–5 pixels and randomly adding or removing buildings.
EVLAB-LR: The dataset uses 2021 geographic, national-condition-monitoring vector data as unrefined reference labels, combined with commercial purchase imagery from Guangdong Province in 2022 (resolution of 0.5 m) as the input and partially manually and precisely collected–interpreted samples as refined labels. The dataset aims to automatically update geographic national condition monitoring vector data by modeling learning the differences between before and after the labels. The samples are cut into 512 × 512 pixel tiles, with the entire dataset divided into a training set (80% of the total sample volume) and a test set (20%) to support the training and validation of deep learning models. Figure 6 shows typical to-be-changed ground object elements selected within Guangdong Province and their sampling locations, including water bodies, land reclamation, roads, buildings, and forests. Table 1 presents detailed information, such as the sampling area and sample numbers. The percentage conversion rate shows the proportion of effective data obtained through precise sampling by operational staff in the area.
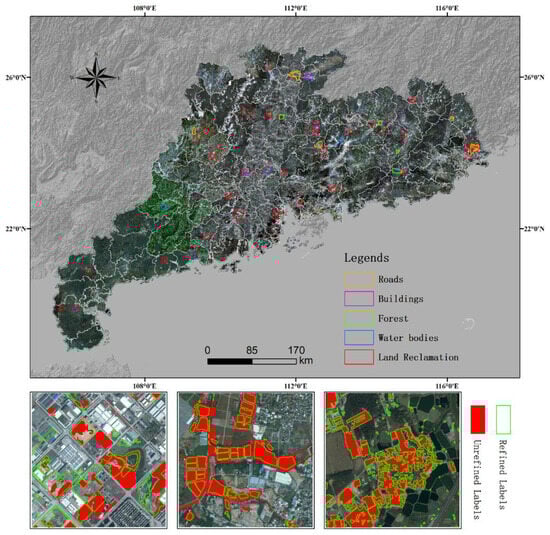
Figure 6.
EVLAB-LR label refinement dataset and sampling locations.

Table 1.
Details of the EVLAB-LR label refinement dataset.
4.2. Label Refinement Results
As shown in Table 2, the comparative analysis conducted on the EVLAB-LR and WHU-LR datasets reveals that label refinement significantly improves the IoU and F1 scores across various land cover types. To ensure a fair comparison, the results of the noisy label model were extracted using the same image feature extraction network as IUR-Net. Particularly in the EVLAB-LR dataset, the IoU for land reclamation increased by 23.37 percentage points through label refinement, rising from an original 49.09% to 72.46%, while the F1 score saw an increase of 18.45 percentage points; the IoU for the road category also grew by 27.33 percentage points. In the WHU-LR dataset, the IoU for the building category jumped from 73.27% to 95.69% after label refinement, an increase of 22.42 percentage points. Notably, compared to models trained directly on noisy labels, IUR-Net demonstrates a remarkable ability to suppress label noise and achieve high-precision predictions.
Table 2.
Quantitative comparison of label refinement results.
In Figure 7 and Figure 8, the label refinement tasks underscore the significant advantages of IUR-Net, particularly in maintaining the integrity of geospatial features across different scales, accurately delineating complex shapes, and precisely extracting instances. For large-scale features, such as clusters of buildings and forested areas, IUR-Net can effectively recognize and preserve their integrity, thereby reducing the common segmentation errors observed in cluttered-label scenarios. In the depiction of complex shapes, IUR-Net demonstrates exceptional boundary capturing capabilities, accurately tracing the real contours of geospatial features, whether amidst the intricate architecture of urban settings or the varied terrains of natural landscapes. Moreover, in tasks involving the extraction of instances from dense or overlapping features, IUR-Net also shows a high-resolution performance, clearly differentiating between tightly packed building groups or adjacent natural features, thereby proving its efficiency and precision in refining remote sensing image labels.
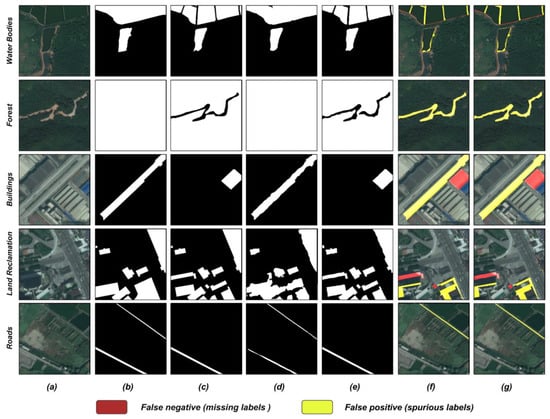
Figure 7.
Qualitative comparison of EVLAB-LR label refinement results. (a) image, (b) noisy label, (c) GT (ground truth), (d) noisy label result, (e) IUR-Net result, (f) GT error label (misclassified regions in the noisy label compared to GT), (g) IUR-Net error label (misclassified regions in the IUR-Net result).
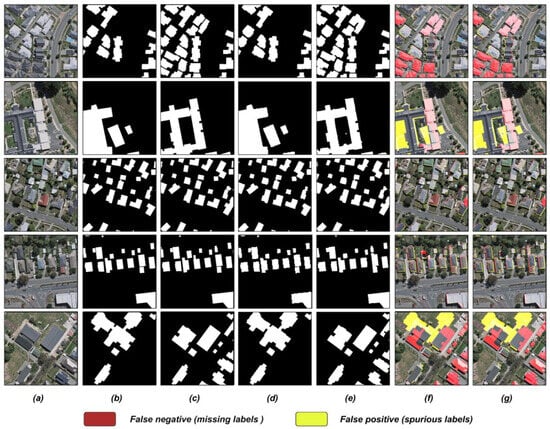
Figure 8.
Qualitative comparison of WHU-LR label refinement results. (a) image, (b) noisy label, (c) GT, (d) noisy label result, (e) IUR-Net result, (f) GT error label, (g) IUR-Net error label.
4.3. Comparison with Recent Methods
We compared six models, with RoG specifically representing those based on robust architecture and regularization techniques, while SEAL exemplifies models grounded in robust loss functions and adjustments. To address sample selection methods, we added O2U-Net to our comparative experiments. Additionally, we included CBR-Net, as it has achieved state-of-the-art results on the WHU dataset, making it a particularly relevant benchmark. Notably, while RoG and SEAL are designed for training with noisy labels, both O2U-Net and CBR-Net rely on ground truth labels during training. As shown in Table 3, the analysis of the baseline models RoG and SEAL on the WHU-LR dataset, which were trained solely with noisy labels, revealed that these models achieved IoUs of 77.93% and 79.01%, respectively. In contrast, the models trained with refined labels, O2U-Net and CBR-Net, showed significant improvements in performance, with IoUs of 93.19% and 93.78%, respectively, confirming the crucial role of refined labels in enhancing performance. Our IUR-Net model, employing an innovative strategy by training with a fusion of noisy labels and image features, particularly when using the convolutional network architecture ResNet-50, achieved an IoU of 95.70%, demonstrating superior performance relative to the transformer architecture ViT-B/16’s 92.89%. This result highlights its advantages when handling small-scale datasets, especially its high sensitivity to the local features of images, which not only boosts accuracy but also enhances generalization capabilities.
Table 3.
Quantitative comparison with recent methods on the WHU-LR dataset.
In the qualitative analysis of label refinement, different models exhibited their respective strengths and weaknesses. As shown in Figure 9, the models trained on noisy labels, such as RoG and SEAL, performed poorly in coherently presenting large instances and also fell short in capturing small instances and delineating complex shapes. In contrast, O2U-Net and CBR-Net, trained with refined labels, achieved improvements in these tasks, particularly excelling in detailing and accurately identifying instances. Our IUR-Net model, integrating features of noisy labels and images, achieved the best results in maintaining the coherence of large instances, capturing small instances, drawing complex shapes, and extracting clear instances. Notably, when adopting the ResNet-50 architecture, IUR-Net demonstrated superiority in all aspects. This emphasizes the importance of selecting the appropriate network architecture for optimizing remote sensing image processing.
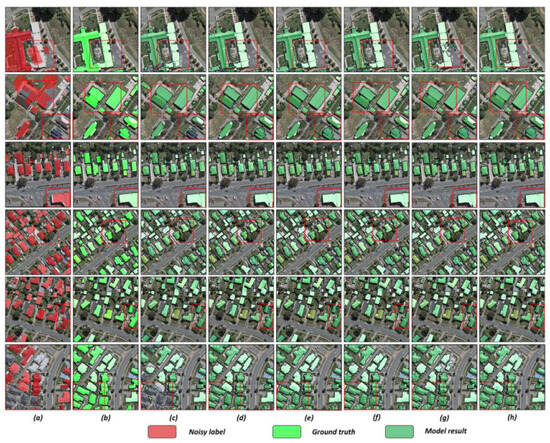
Figure 9.
Qualitative comparison with recent methods. (a) noisy label, (b) GT, (c) RoG, (d) SEAL, (e) O2U-Net, (f) CBR-Net, (g) Ours (ViT-B/16), (h) Ours (ResNet-50).
4.4. Ablation Study
For the ablation study, we used the transformer-based ViT-B/16 model as the baseline backbone. Although ResNet-50 slightly outperformed ViT-B/16 on the WHU-LR dataset, we adopted ViT-B/16 for its scalability and stronger capacity on larger datasets, aligning with our goal to evaluate IUR-Net using a modern, architecture-agnostic transformer backbone. We evaluated different module combinations to observe their contributions: image–label difference (I), erroneous label branch (E), refined label loss (E), and Ms-EALM (M). As Table 4 and Figure 10 illustrate, the ablation study on the EVLAB-LR waterbody dataset confirmed that the “I” and “E” modules significantly improved the core metrics, elevating the IoU from 83.89% to 87.74% and validating their effectiveness in enhancing label refinement. After adding the “R” and “M” modules, the IoU further rose to 90.57%, precision reached 95.80%, and the F1 score improved to 95.05%, highlighting the significant role of these modules in enhancing the model’s ability to recognize positive instances. The “Baseline + M + R + E” configuration’s excellent performance in IoU and F1 scores underscores the key role of the “M” module, especially in capturing label–image inconsistencies at multiple scales and enhancing the localization of erroneous label regions. The combined application of modules in the “Baseline + I + M + R + E” combination achieved the best performance across all the evaluation metrics, with the IoU increasing by 9.49% compared to the baseline. The figure illustrates that the combination significantly reduces false negatives and false positives, providing the clearest and most accurate label refinement results, further confirming that the synergistic effect of the modules can effectively enhance the overall performance of the model.
Table 4.
Results of ablation experiments on different components.
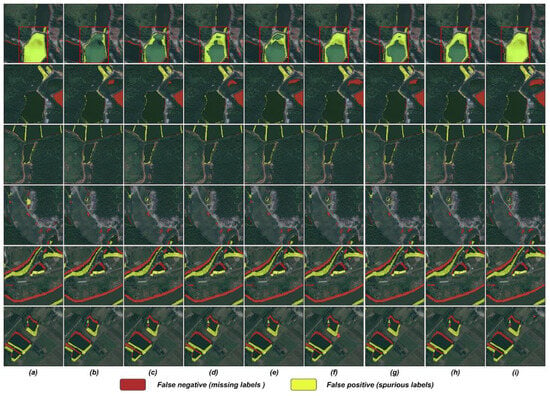
Figure 10.
Visualization results of ablation experiments on different components. (a) GT error label, (b) baseline, (c) +I + E, (d) +R + M, (e) +I + M + E, (f) +I + R + E, (g) +M + R + E, (h) +M + R + I, (i) +I + M + R + E.
4.5. Effectiveness of the Three-Stage Sub-Tasks
Table 5 shows the impact of different architectures on the label refinement capability of the samples in the WHU-LR dataset. As a benchmark, we used the initial noisy labels and found that the architecture proposed in this study could significantly improve these initial noisy labels. Specifically, the identify architecture achieved a 20.54% improvement in the IoU metric and a 12.23% increase in the F1 score, indicating that the error probability map can effectively identify errors and missing information in the initial noisy labels. This focused identification reduces unnecessary modifications to correctly labeled areas, minimizing disruptions and improving efficiency. Based on the identify architecture, the update and refine architectures slightly further improved the performance metrics. The update architecture decides whether to retain the initial noisy labels or update them through a gating mechanism, and its 1.69% increase in the IoU suggests that most labels indeed require updating. This approach ensures that only significantly erroneous regions (e.g., hard errors) are corrected, avoiding excessive adjustments to accurate areas. The refine architecture further processes the segmentation results to eliminate salt-and-pepper noise and refine boundaries, with the slight increase in the IoU indicating that the initial segmentation results have reached a satisfactory level. The visualization in Figure 11 evidences that the identify module precisely locates erroneous areas, while the update and refine modules progressively refine the segmentation from coarse to fine. Despite the performance gains, the task is divided into three stages with only a modest computational overhead, as each stage operates solely on targeted regions guided by the error probability map. This design ensures that the overall inference time remains comparable to a single-stage model.
Table 5.
Results of explored architectures comparison.

Figure 11.
Visualization results of ablation experiments on different components. (a) image, (b) GT, (c) Baseline, (d) Identify, (e) Identify +Refine, (f) Identify + Update, (g) IUR-1iter, (h) IUR-2iter, (i) IUR-3iter, where “IUR-niter” denotes the IUR-Net result after n iterations of the identify–update–refine cycle.
4.6. Effectiveness of the Ms-EALM
As shown in Figure 12, by comparing the heatmaps generated by the Ms-EALM, channel-space attention (scSE) mechanisms, and models without attention mechanisms, we found that the area mapping errors revealed by the Ms-EALM are more concentrated and spatially aligned with actual annotation inconsistencies. This proves its significant advantage in precisely localizing erroneous label regions. Although the channel-space attention mechanism can also identify land cover features, its heatmaps’ precision and concentration in matching mapping errors fall short of the Ms-EALM. This validates the hypothesis that the Ms-EALM is more precise in error-region identification, clearly marking spurious or missing label parts in remote sensing images. Additionally, this module is sensitive to land cover features at various scales, which is crucial for processing remote sensing images containing rich land cover information. Simultaneously, the module integrates related label information while capturing image features, achieving a deeper understanding and correction of land cover, thereby optimizing the capture of details and context.
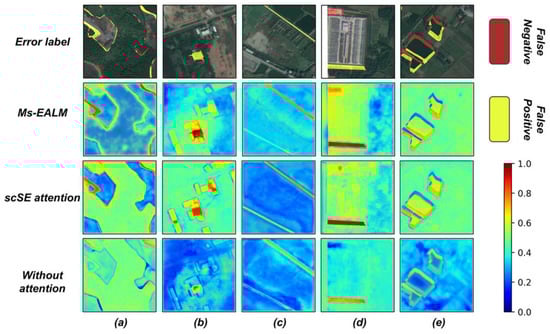
Figure 12.
Feature visualization comparison. (a) forest, (b) buildings, (c) roads, (d) land reclamation, (e) water bodies.
Meanwhile, we conducted a comparative experiment to assess the practical benefits and performance enhancements of the proposed module compared to existing attention mechanisms. The results in Table 6 highlight the superiority of the Ms-EALM over other attention mechanisms, such as CBAM, scSE, and the original EALM. Ms-EALM consistently achieves the highest IoU and F1 scores across various backbones, including ResNet-50 and ViT-B/16, while maintaining a negligible computational overhead. The experimental results demonstrate that while the original EALM provides rich feature representations with a low computational cost, its single-scale processing limits contextual understanding, particularly for tasks with heterogeneous label noise. By incorporating multi-scale feature aggregation, the Ms-EALM overcomes these limitations, adding robustness to handle spatial heterogeneity and large-scale label inconsistencies. This enhancement significantly improves model accuracy without sacrificing efficiency, establishing Ms-EALM as a practical solution for accurate error localization in label refinement tasks.
Table 6.
Quantitative comparison with different modules on the WHU-LR dataset.
5. Discussion
5.1. Analysis of Label Noise Ratio
In the era of large models, the demand for high-quality annotations increases, necessitating accurate, diverse, and comprehensive datasets, which are crucial for training robust and reliable artificial intelligence systems. Although existing research has focused on mitigating data noise issues [49], the exploration of label noise ratios in the remote sensing field and their impact on model performance remains insufficient. Therefore, we conducted a quantitative analysis of the model’s generalization capability under different noise distribution conditions. Assuming ground truth labels are perfectly accurate, we simulated noisy labels with different noise ratios by randomly removing building instances from the WHU-LR dataset proportionally. Subsequently, both our proposed label refinement network and a baseline pseudo-label network were trained, and the model performance under different label noise ratios was evaluated using the IoU metric.
Figure 13 presents the performance evaluation of the Intersection over Union (IoU) of the pseudo-label network and IUR-Net under different noise levels. Observations reveal that the IoU of the pseudo-label network significantly decreases as the noise level increases, especially when the noise level exceeds 50%, with a more notable decline in performance, and at a 90% noise level, the IoU drastically drops to nearly zero. This indicates that networks directly predicting segmentation results from image features are sensitive to noise, particularly under high noise ratios. In contrast, IUR-Net demonstrates remarkable stability, with its IoU almost unchanged across the entire range of noise levels. Particularly in the extreme condition of a 90% noise level, IUR-Net’s IoU remains at 95.26%, showcasing its excellent generalization capability. This underscores the critical role of leveraging noisy labels in achieving reliable segmentation under challenging noise conditions.
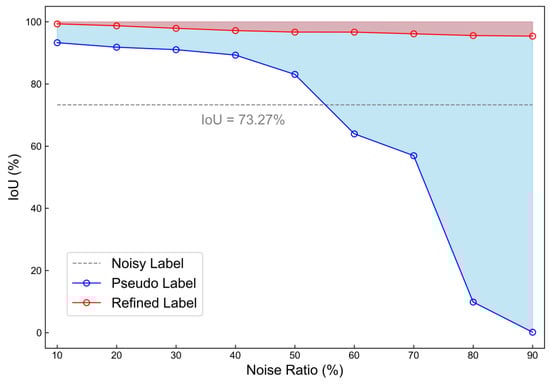
Figure 13.
Comparison of model performance under different noise ratios.
5.2. Applications in Foundation Model Fine-Tuning
Building upon pre-trained vision foundation models, further training on datasets specific to the remote sensing domain can effectively enhance model performance in tasks within this field, while significantly reducing training time and data requirements. This study is based on the vision foundation model SAM, utilizing the ViT-H pre-trained model with approximately 630 million parameters. The fine-tuning dataset was selected from forest samples in the EVLAB-LR, and 100,000 forest samples were refined using IUR-Net. We fine-tuned both the unrefined and refined forest samples and visualized the segmentation results using points as prompt information.
Figure 14 presents the fine-tuning results of the vision foundation model SAM under different sample labels. The qualitative analysis indicated that the refined label model’s segmented areas (in blue) are more coherent and highly consistent with the actual forest cover boundaries. Notably, in Mask 1, the segmentation results almost completely cover the target area, with no evident omissions or misclassifications. In contrast, the segmentation results from the unrefined label model are significantly poorer, with the blue areas displaying a dispersed, dot-like distribution, barely overlapping with the target area. This suggests that the unrefined labels failed to effectively guide the model in learning accurate segmentation features. The quantitative analysis further demonstrated that, across three different granularity levels, the refined labels significantly enhanced the segmentation model’s accuracy, with the IoU values increasing by several orders of magnitude compared to the unrefined labels. Refined labels reduce the training time and data requirements while enhancing domain adaptation by enabling models to focus on accurate learning signals and effectively capturing the unique characteristics of remote sensing data. Therefore, it is evident that refined labels played a crucial role in the model fine-tuning process, effectively improving the model’s segmentation performance.
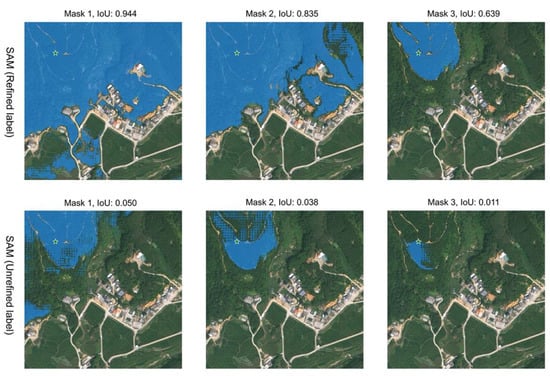
Figure 14.
Comparison of fine-tuning results under different labels using SAM.
6. Conclusions
In this paper, we introduced IUR-Net, a novel framework specifically designed for the label refinement task in remote sensing semantic segmentation. Leveraging newly acquired remote sensing imagery in conjunction with existing noisy labels, IUR-Net guides accurate and robust label refinement through a structured three-stage process of error identification, label updating, and refinement, while simultaneously supporting end-to-end training and iterative optimization. The experimental results demonstrate that IUR-Net surpasses existing methods in label refinement tasks, while also effectively identifying errors in noisy labels. The Ms-EALM effectively captures label–image inconsistencies by integrating noisy labels with image features. This module significantly improves the network’s ability to localize erroneous label regions, thereby enhancing the accuracy and reliability of the label refinement process. These experimental results verify the effectiveness of IUR-Net in handling noisy labels and demonstrate its significant advantages in improving the performance of semantic segmentation on remote sensing images. This study relies on explicit noise priors for label refinement, but there is a risk of overfitting refined labels with DNNs when numerous confusing categories exist in the data. Future work should focus on developing more robust encoder architectures to further refine labels, thereby enhancing the model’s adaptability and recognition ability for complex data distributions.
Author Contributions
Conceptualization, Y.X. and X.H.; Writing—original draft, Y.X.; Acquisition of data, Y.X., X.G., L.L. and A.L.; Methodology, Y.X.; Data analysis, Y.X. and X.H.; Discussion, Y.X., A.L. and L.L. All authors have read and agreed to the published version of the manuscript.
Funding
This work was funded by the Fundamental Research Funds for the Central Universities, China (Grant No. 2042022dx0001); the Special Fund of Hubei Luojia Laboratory, under grant 220100028; the Technology Innovation Center for Collaborative Applications of Natural Resources Data in GBA, MNR (No. 2024NRDK03); and the Key Research and Development Program of Hubei Province (No. 2023BAB173).
Data Availability Statement
Two label refinement datasets (WHU-LR and EVLAB-LR) are available at https://github.com/WHUXyb/IUR-Net (accessed on 19 June 2025).
Acknowledgments
We would like to thank the anonymous reviewers and the editors for their insightful comments and helpful suggestions.
Conflicts of Interest
The authors declare no conflicts of interest.
References
- Zhang, B.; Zhu, J.; Su, H. Toward the Third Generation Artificial Intelligence. Sci. China Inf. Sci. 2023, 66, 121101. [Google Scholar] [CrossRef]
- Zhao, T.; Wang, S.; Ouyang, C.; Chen, M.; Liu, C.; Zhang, J.; Yu, L.; Wang, F.; Xie, Y.; Li, J.; et al. Artificial Intelligence for Geoscience: Progress, Challenges, and Perspectives. Innovation 2024, 5, 100691. [Google Scholar] [CrossRef] [PubMed]
- Osco, L.P.; Wu, Q.; De Lemos, E.L.; Gonçalves, W.N.; Ramos, A.P.M.; Li, J.; Marcato, J. The Segment Anything Model (SAM) for Remote Sensing Applications: From Zero to One Shot. Int. J. Appl. Earth Obs. Geoinf. 2023, 124, 103540. [Google Scholar] [CrossRef]
- Yuan, Q.; Shen, H.; Li, T.; Li, Z.; Li, S.; Jiang, Y.; Xu, H.; Tan, W.; Yang, Q.; Wang, J.; et al. Deep Learning in Environmental Remote Sensing: Achievements and Challenges. Remote Sens. Environ. 2020, 241, 111716. [Google Scholar] [CrossRef]
- Wuit Yee Kyaw, H.; Chatzidimitriou, A.; Hellwig, J.; Bühler, M.; Hawlik, J.; Herrmann, M. Multifactorial Evaluation of Spatial Suitability and Economic Viability of Light Green Bridges Using Remote Sensing Data and Spatial Urban Planning Criteria. Remote Sens. 2023, 15, 753. [Google Scholar] [CrossRef]
- Naushad, R.; Kaur, T.; Ghaderpour, E. Deep Transfer Learning for Land Use and Land Cover Classification: A Comparative Study. Sensors 2021, 21, 8083. [Google Scholar] [CrossRef]
- Song, H.; Kim, M.; Park, D.; Shin, Y.; Lee, J.-G. Learning from Noisy Labels with Deep Neural Networks: A Survey 2022. IEEE Trans. Neural Netw. Learn. Syst. 2023, 34, 8135–8153. [Google Scholar] [CrossRef]
- Albert, P.; Ortego, D.; Arazo, E.; O’Connor, N.E.; McGuinness, K. Addressing Out-of-Distribution Label Noise in Webly-Labelled Data. In Proceedings of the 2022 IEEE/CVF Winter Conference on Applications of Computer Vision (WACV), Waikoloa, HI, USA, 3–8 January 2022; pp. 392–401. [Google Scholar]
- Boori, M.S.; Choudhary, K.; Paringer, R.; Kupriyanov, A. Spatiotemporal Ecological Vulnerability Analysis with Statistical Correlation Based on Satellite Remote Sensing in Samara, Russia. J. Environ. Manag. 2021, 285, 112138. [Google Scholar] [CrossRef]
- Zorzi, S.; Bittner, K.; Fraundorfer, F. Map-Repair: Deep Cadastre Maps Alignment and Temporal Inconsistencies Fix in Satellite Images. In Proceedings of the IGARSS 2020—2020 IEEE International Geoscience and Remote Sensing Symposium, Waikoloa, HI, USA, 26 September–2 October 2020; pp. 1829–1832. [Google Scholar]
- Kirillov, A.; Mintun, E.; Ravi, N.; Mao, H.; Rolland, C.; Gustafson, L.; Xiao, T.; Whitehead, S.; Berg, A.C.; Lo, W.-Y.; et al. Segment Anything. In Proceedings of the 2023 IEEE/CVF International Conference on Computer Vision (ICCV), Paris, France, 1–6 October 2023; pp. 3992–4003. [Google Scholar]
- Xiong, Y.; Zhou, Y.; Wang, F.; Wang, S.; Wang, Z.; Ji, J.; Wang, J.; Zou, W.; You, D.; Qin, G. A Novel Intelligent Method Based on the Gaussian Heatmap Sampling Technique and Convolutional Neural Network for Landslide Susceptibility Mapping. Remote Sens. 2022, 14, 2866. [Google Scholar] [CrossRef]
- Zhou, W.; Yue, Y.; Fang, M.; Qian, X.; Yang, R.; Yu, L. BCINet: Bilateral Cross-Modal Interaction Network for Indoor Scene Understanding in RGB-D Images. Inf. Fusion 2023, 94, 32–42. [Google Scholar] [CrossRef]
- Xiao, T.; Xia, T.; Yang, Y.; Huang, C.; Wang, X. Learning from Massive Noisy Labeled Data for Image Classification. In Proceedings of the 2015 IEEE Conference on Computer Vision and Pattern Recognition (CVPR), Boston, MA, USA, 7–12 June 2015; pp. 2691–2699. [Google Scholar]
- Song, H.; Kim, M.; Lee, J.-G. SELFIE: Refurbishing Unclean Samples for Robust Deep Learning. In Proceedings of the 36th International Conference on Machine Learning, Long Beach, CA, USA, 9–15 June 2019; pp. 5907–5915. [Google Scholar]
- Hao, X.; Liu, L.; Yang, R.; Yin, L.; Zhang, L.; Li, X. A Review of Data Augmentation Methods of Remote Sensing Image Target Recognition. Remote Sens. 2023, 15, 827. [Google Scholar] [CrossRef]
- Nusrat, I.; Jang, S.-B. A Comparison of Regularization Techniques in Deep Neural Networks. Symmetry 2018, 10, 648. [Google Scholar] [CrossRef]
- Karimi, D.; Dou, H.; Warfield, S.K.; Gholipour, A. Deep Learning with Noisy Labels: Exploring Techniques and Remedies in Medical Image Analysis. Med. Image Anal. 2020, 65, 101759. [Google Scholar] [CrossRef] [PubMed]
- Venter, Z.S.; Brousse, O.; Esau, I.; Meier, F. Hyperlocal Mapping of Urban Air Temperature Using Remote Sensing and Crowdsourced Weather Data. Remote Sens. Environ. 2020, 242, 111791. [Google Scholar] [CrossRef]
- Manas, O.; Lacoste, A.; Giro-i-Nieto, X.; Vazquez, D.; Rodriguez, P. Seasonal Contrast: Unsupervised Pre-Training from Uncurated Remote Sensing Data. In Proceedings of the 2021 IEEE/CVF International Conference on Computer Vision (ICCV), Montreal, QC, Canada, 11–17 October 2021; pp. 9394–9403. [Google Scholar]
- Moselhi, O.; Bardareh, H.; Zhu, Z. Automated Data Acquisition in Construction with Remote Sensing Technologies. Appl. Sci. 2020, 10, 2846. [Google Scholar] [CrossRef]
- Duan, P.; Kang, X.; Ghamisi, P. Hyperspectral Remote Sensing Benchmark Database for Oil Spill Detection with an Isolation Forest-Guided Unsupervised Detector. IEEE Trans. Geosci. Remote Sens. 2023, 61, 1–11. [Google Scholar] [CrossRef]
- Wu, C.-E.; Tian, Y.; Yu, H.; Wang, H.; Morgado, P.; Hu, Y.H.; Yang, L. Why Is Prompt Tuning for Vision-Language Models Robust to Noisy Labels? In Proceedings of the 2023 IEEE/CVF International Conference on Computer Vision (ICCV), Paris, France, 1–6 October 2023; pp. 15442–15451. [Google Scholar]
- Wang, X.; Chen, L.; Ban, T.; Lyu, D.; Guan, Y.; Wu, X.; Zhou, X.; Chen, H. Accurate Label Refinement from Multiannotator of Remote Sensing Data. IEEE Trans. Geosci. Remote Sens. 2023, 61, 4700413. [Google Scholar] [CrossRef]
- Zhang, Z.; Zhang, Q.; Hu, X.; Zhang, M.; Zhu, D. On the Automatic Quality Assessment of Annotated Sample Data for Object Extraction from Remote Sensing Imagery. ISPRS J. Photogramm. Remote Sens. 2023, 201, 153–173. [Google Scholar] [CrossRef]
- Cheng, S.; Li, B.; Sun, L.; Chen, Y. HRRNet: Hierarchical Refinement Residual Network for Semantic Segmentation of Remote Sensing Images. Remote Sens. 2023, 15, 1244. [Google Scholar] [CrossRef]
- Zhou, Y.; Wang, S.; Ren, H.; Hu, J.; Zou, L.; Wang, X. Multi-Level Feature-Refinement Anchor-Free Framework with Consistent Label-Assignment Mechanism for Ship Detection in SAR Imagery. Remote Sens. 2024, 16, 975. [Google Scholar] [CrossRef]
- Guo, H.; Du, B.; Zhang, L.; Su, X. A Coarse-to-Fine Boundary Refinement Network for Building Footprint Extraction from Remote Sensing Imagery. ISPRS J. Photogramm. Remote Sens. 2022, 183, 240–252. [Google Scholar] [CrossRef]
- Zheng, Z.; Liu, Y.; Tian, S.; Wang, J.; Ma, A.; Zhong, Y. Weakly Supervised Semantic Change Detection via Label Refinement Framework. In Proceedings of the 2021 IEEE International Geoscience and Remote Sensing Symposium IGARSS, Brussels, Belgium, 11–16 July 2021; pp. 2066–2069. [Google Scholar]
- Huang, J.; Zhang, X.; Sun, Y.; Xin, Q. Attention-Guided Label Refinement Network for Semantic Segmentation of Very High Resolution Aerial Orthoimages. IEEE J. Sel. Top. Appl. Earth Obs. Remote Sens. 2021, 14, 4490–4503. [Google Scholar] [CrossRef]
- Chen, J.; Zhang, R.; Xu, J.; Hu, C.; Mao, Y. A Neural Expectation-Maximization Framework for Noisy Multi-Label Text Classification. IEEE Trans. Knowl. Data Eng. 2023, 35, 10992–11003. [Google Scholar] [CrossRef]
- Krogh, A.; Hertz, J.A. A Simple Weight Decay Can Improve Generalization. In Proceedings of the Neural Information Processing Systems (NIPS 1991), San Francisco, CA, USA, 2–5 December 1991; 1992; pp. 950–957. [Google Scholar]
- Ioffe, S.; Szegedy, C. Batch Normalization: Accelerating Deep Network Training by Reducing Internal Covariate Shift. In Proceedings of the International Conference on Machine Learning, Lille, France, 11–16 July 2015; pp. 448–456. [Google Scholar]
- Srivastava, N.; Hinton, G.; Krizhevsky, A.; Sutskever, I.; Salakhutdinov, R. Dropout: A Simple Way to Prevent Neural Networks from Overfitting. J. Mach. Learn. Res. 2014, 15, 1929–1958. [Google Scholar]
- Xiong, Y.; Zhou, Y.; Wang, F.; Wang, S.; Wang, J.; Ji, J.; Wang, Z. Landslide Susceptibility Mapping Using Ant Colony Optimization Strategy and Deep Belief Network in Jiuzhaigou Region. IEEE J. Sel. Top. Appl. Earth Obs. Remote Sens. 2021, 14, 11042–11057. [Google Scholar] [CrossRef]
- Xu, J.; Quek, T.Q.S.; Chong, K.F.E. Training Classifiers That Are Universally Robust to All Label Noise Levels. In Proceedings of the 2021 International Joint Conference on Neural Networks (IJCNN), Shenzhen, China, 18–22 July 2021; pp. 1–8. [Google Scholar]
- Jiang, H.; Gao, M.; Hu, Y.; Ren, Q.; Xie, Z.; Liu, J. Label-Noise-Tolerant Medical Image Classification via Self-Attention and Self-Supervised Learning. arXiv 2023, arXiv:2306.09718. [Google Scholar]
- Yao, Y.; Liu, T.; Han, B.; Gong, M.; Deng, J.; Niu, G.; Sugiyama, M. Dual T: Reducing Estimation Error for Transition Matrix in Label-Noise Learning. Adv. Neural Inf. Process. Syst. 2020, 33, 7260–7271. [Google Scholar]
- Feng, L.; Shu, S.; Lin, Z.; Lv, F.; Li, L.; An, B. Can Cross Entropy Loss Be Robust to Label Noise? In Proceedings of the Twenty-Ninth International Joint Conference on Artificial Intelligence, Yokohama, Japan, 11–17 July 2020; pp. 2206–2212. [Google Scholar]
- Zhou, W.; Dong, S.; Lei, J.; Yu, L. MTANet: Multitask-Aware Network with Hierarchical Multimodal Fusion for RGB-T Urban Scene Understanding. IEEE Trans. Intell. Veh. 2023, 8, 48–58. [Google Scholar] [CrossRef]
- Arazo, E.; Ortego, D.; Albert, P.; O’Connor, N.E.; McGuinness, K. Unsupervised Label Noise Modeling and Loss Correction. In Proceedings of the International Conference on Machine Learning, ICML, Long Beach, CA, USA, 9–15 June 2019; pp. 312–321. [Google Scholar]
- Zhang, H.; Xing, X.; Liu, L. DualGraph: A Graph-Based Method for Reasoning about Label Noise. In Proceedings of the 2021 IEEE/CVF Conference on Computer Vision and Pattern Recognition (CVPR), Nashville, TN, USA, 20–25 June 2021; pp. 9649–9658. [Google Scholar]
- Chen, P.; Ye, J.; Chen, G.; Zhao, J.; Heng, P.-A. Beyond Class-Conditional Assumption: A Primary Attempt to Combat Instance-Dependent Label Noise. AAAI 2021, 35, 11442–11450. [Google Scholar] [CrossRef]
- Wang, Z.; Hu, G.; Hu, Q. Training Noise-Robust Deep Neural Networks via Meta-Learning. In Proceedings of the 2020 IEEE/CVF Conference on Computer Vision and Pattern Recognition (CVPR), Boston, MA, USA, 16–18 June 2020; pp. 4523–4532. [Google Scholar]
- Shi, X.; Guo, Z.; Li, K.; Liang, Y.; Zhu, X. Self-Paced Resistance Learning against Overfitting on Noisy Labels. Pattern Recognit. 2023, 134, 109080. [Google Scholar] [CrossRef]
- Jeong, H.; Chung, H.W. Rethinking Self-Distillation: Label Averaging and Enhanced Soft Label Refinement with Partial Labels. arXiv 2024, arXiv:2402.10482. [Google Scholar]
- Gidaris, S.; Komodakis, N. Detect, Replace, Refine: Deep Structured Prediction for Pixel Wise Labeling. In Proceedings of the 2017 IEEE Conference on Computer Vision and Pattern Recognition (CVPR), Honolulu, HI, USA, 21–26 July 2017; pp. 7187–7196. [Google Scholar]
- Misra, D.; Nalamada, T.; Arasanipalai, A.U.; Hou, Q. Rotate to Attend: Convolutional Triplet Attention Module. In Proceedings of the 2021 IEEE Winter Conference on Applications of Computer Vision (WACV), Waikoloa, HI, USA, 3–8 January 2021; pp. 3138–3147. [Google Scholar]
- Klingner, M.; Bar, A.; Fingscheidt, T. Improved Noise and Attack Robustness for Semantic Segmentation by Using Multi-Task Training with Self-Supervised Depth Estimation. In Proceedings of the 2020 IEEE/CVF Conference on Computer Vision and Pattern Recognition Workshops (CVPRW), Seattle, WA, USA, 14–19 June 2020; pp. 1299–1309. [Google Scholar]
Disclaimer/Publisher’s Note: The statements, opinions and data contained in all publications are solely those of the individual author(s) and contributor(s) and not of MDPI and/or the editor(s). MDPI and/or the editor(s) disclaim responsibility for any injury to people or property resulting from any ideas, methods, instructions or products referred to in the content. |
© 2025 by the authors. Licensee MDPI, Basel, Switzerland. This article is an open access article distributed under the terms and conditions of the Creative Commons Attribution (CC BY) license (https://creativecommons.org/licenses/by/4.0/).