Article

Estimation of Crude Protein Content in Revegetated Alpine Grassland Using Hyperspectral Data

1
State Key Laboratory of Herbage Improvement and Grassland Agro-Ecosystems, College of Ecology, Lanzhou University, Lanzhou 730000, China
2
College of Grassland Science and Technology, Sichuan Agricultural University, Chengdu 611130, China
3
Department of Disturbance Ecology and Vegetation Dynamics, BAYCEER, University of Bayreuth, 95448 Bayreuth, Germany
4
Desert Animal Adaptations and Husbandry, Wyler Department of Dryland Agriculture, Blaustein Institutes for Desert Research, Ben-Gurion University of the Negev, Beer Sheva 8410500, Israel
*
Author to whom correspondence should be addressed.
Remote Sens. 2025, 17(13), 2114; https://doi.org/10.3390/rs17132114
Submission received: 28 April 2025 / Revised: 11 June 2025 / Accepted: 13 June 2025 / Published: 20 June 2025

Abstract

Remote sensing plays an important role in understanding the degradation and restoration processes of alpine grasslands. However, the extreme climatic conditions of the region pose difficulties in collecting field spectral data on which remote sensing is based. Thus, in-depth knowledge of the spectral characteristics of alpine grasslands and an accurate assessment of their restoration status are still lacking. In this study, we collected the canopy hyperspectral data of plant communities in the growing season from severely degraded grasslands and actively restored grasslands of different ages in 13 counties of the “Three-River Headwaters Region” and determined the absorption characteristics in the red-light region as well as the trends of red-light parameters. We generated a model for estimating the crude protein content of plant communities in different grasslands based on the screened spectral characteristic covariates. Our results revealed that (1) the raw reflectance parameters of the near-infrared band spectra can distinguish alpine Kobresia meadow from extremely degraded and actively restored grasslands; (2) the wavelength value red-edge position (REP), corresponding to the highest point of the first derivative (FD) spectral reflectance (680–750 nm), can identify the extremely degraded grassland invaded by Artemisia frigida; and (3) the red valley reflectance (Rrw) parameter of the continuum removal (CR) spectral curve (550–750 nm) can discriminate among actively restored grasslands of different ages. In comparison with the Kobresia meadow, the predictive model for the actively restored grassland was more accurate, reaching an accuracy of over 60%. In conclusion, the predictive modeling of forage crude protein content for actively restored grasslands is beneficial for grassland management and sustainable development policies.

Graphical Abstract

1. Introduction

The advancement of satellite remote sensing monitoring technology has led to its extensive use in assessing grassland degradation in mountainous regions across the globe [1]. Such is the case in studies of the degraded grasslands on the Tibetan Plateau in China where remote sensing monitoring has received considerable attention. However, there are constraints that can affect the accuracy of remote sensing monitoring in this region. Firstly, the extreme climatic conditions, including low temperature, low oxygen content, and the very low number of inhabitants, present challenges for extensive field studies on the Tibetan Plateau. The rainy and hot seasons of the pasture growing season in the region occur concomitantly, and there are very few sunny and cloudless days that meet the requirements for acquiring spectral data [2]. As a result, there is a lack of hyperspectral data that have been calibrated and standardized in the field in the Tibetan Plateau region. Consequently, there is a need for a systematic method of field spectral measurement on the Tibetan Plateau to complement and optimize remote sensing model parameters.
Natural pasture is the main source of feed for grazing livestock in grassland pastoral areas in China and plays an important role in the ecosystem of grassland pastoral areas. Determining pasture quality is crucial, and not only for monitoring pasture health. It also directly affects the nutritional status and growth and development of the livestock [3]. Crude protein (CP) content has long been recognized as the main biochemical indicator of the nutritional value of pasture [4] and plays a key role in assessing the adequacy of pasture nutrition to sustain livestock and wildlife population numbers. Greater CP content is associated directly with higher forage digestibility and nutrient yield, making it an important indicator for assessing rangeland carrying capacity and degradation. In addition, various processing techniques have been developed to improve data quality and accuracy [5], and by analyzing raw spectral reflectance and first-order derivative spectral reflectance, sensitive bands associated with nitrogen, phosphorus, and potassium in pastures can be identified more effectively [6].
Normalized vegetation index (NDVI) remote sensing is the main method being used to assess the status of grassland [7,8]. However, this large-scale evaluation index is inadequate for capturing the fine details of grassland degradation. Remote sensing reflects vegetation cover, productivity, and grass production, but is unable to identify the vegetation changes that occur in this type of degraded grassland. This is because vegetation coverage or biomass may actually increase during certain phases of degradation, particularly when companion species or toxic herbs supplant dominant species. To illustrate this point, in the severely degraded grassland of the Three-River Headwaters region in Qinghai, the proliferation of poisonous weeds has led to the displacement of the dominant plant communities, including Gramineae and Cyperaceae. This has resulted in an increase in the aboveground biomass and vegetation cover, which has not only remained stable but has even expanded. Hyperspectral remote sensing, using spectral data, can effectively identify community-poisoning weeds and estimate the community area, cover, and other characteristic indices.
In the present study, we investigated the spectral response characteristics of the plant community in degraded grassland on the Tibetan Plateau. The spectral response patterns in different grassland degradation stages were influenced primarily by variations in plant community composition, vegetation cover, and soil background [9]. Liu et al. examined the spectral characteristics of typical dominant species in alpine meadows, alpine grasslands, and alpine scrub in the source region of the Yarlung Zangbo. It emerged that Kobresia littledale, Stipa purpurea, and Potentilla fruticosa exhibited notable differences in spectral characteristics, primarily due to variations in the red edges of the plants or their chlorophyll absorption characteristics [10]. Most studies attempt to determine vegetation coverage or aboveground biomass from spectral reflectance, spectral indices, or spectral unmixing analysis. However, the underlying assumption in these studies, that is, that vegetation reduction or biomass loss invariably accompanies intensifying degradation, may not always hold true. Under certain conditions, vegetation coverage or biomass may exhibit counterintuitive increases during specific degradation phases, particularly when companion species or toxic herbaceous plants supplant dominant species [11,12]. The observed correlation between vegetation coverage and degradation status can also be confounded by local site-specific variables, such as nutrient or water availability [12]. Consequently, the relationship between grassland degradation and remotely sensed vegetation metrics requires further systematic validation. Furthermore, the majority of field studies have concentrated on the use of spectral data collection to classify grass types and specific species in grassland ecosystems [11,13,14]. However, changes in the spectral characteristics of plant communities during restoration and the corresponding hyperspectral data have not been explored in detail. To fill this gap, we examined potential applications of spectral techniques in monitoring ecosystem restoration dynamics.
The Tibetan Plateau, known as the Third Pole, is the highest plateau in the world at an average elevation of over 4000 m above sea level. The region, also known as the “Three-River Headwaters” is the source of the Yangtze, Salween, and Mekong Rivers [15,16]. Beyond its hydrological significance, the Tibetan Plateau harbors unique high-altitude biodiversity hotspots, supporting endemic and endangered species adapted to extreme conditions. However, this fragile ecosystem exhibits exceptional vulnerability to climate change. For example, the plateau has warmed at a rate nearly four times faster than the global average over the past three decades [17], triggering accelerated permafrost thaw, altered precipitation regimes, and a heightened frequency of extreme weather events.
The socioeconomic fabric is tied tightly to the grasslands, serving as the foundation for traditional grass-fed animal husbandry practiced by local pastoral communities. These grassland resources are not merely economic assets but are central to cultural identity and food security. However, intersecting pressures, including rising pastoral populations, increased livestock densities driven by improved living standards, and the compounding effects of climate change, have precipitated widespread grassland degradation through chronic overgrazing. This degradation manifests as reduced vegetation cover, soil erosion, biodiversity loss, and invasion by unpalatable or toxic plant species, directly threatening ecosystem resilience and pastoral livelihoods.
Remote sensing offers unparalleled potential for monitoring these vast and inaccessible landscapes. Extreme environmental conditions (hypoxia, low temperature, complex topography) hinder comprehensive field validation; persistent cloud cover during the critical growing season limits optical data acquisition; and a critical shortage of region-specific, ground-truthed spectral libraries hinders model calibration. Crucially, while a priori knowledge confirms that there is widespread degradation, the hyperspectral signatures differentiating degradation stages and quantifying restoration success remain inadequately characterized.
The “Three-River Headwaters” region is primarily used for extensive animal husbandry, with grassland resources extremely important for the livelihood of the local herders. In recent years, the growth of the population in pastoral areas and the improvement in herders’ living standards have led to the overgrazing of the grasslands. To facilitate the use of remote sensing applications on the Tibetan Plateau and with a priori knowledge of grassland degradation, we undertook a detailed analysis of the hyperspectral characteristics of vegetation communities in grasslands that have undergone considerable degradation, as well as communities in grasslands that have been actively restored. We collected canopy hyperspectral data of plant communities in the growing season from typical Kobresia grassland, extremely degraded grasslands, and actively restored grasslands of different ages in 13 counties of the Three-River Headwaters region. We characterized and parameterized the canopy spectra of these communities and examined the absorption characteristics in the red-light region and the trends in the red-light parameters. Based on the spectral parameters screened, we established a model for estimating the crude protein and nutrient productivity of the plant communities in different grasslands. The aims of the present study were to (1) elucidate the changing rule of spectral features in actively restored alpine grassland of different ages (2, 3, 6, 7, and 14 years) and (2) model the hyperspectral estimation of nutrient productivity in different grasslands. The findings can (1) provide a foundation for the use of hyperspectral remote sensing in the restoration of degraded grasslands and the monitoring of vegetation growth and (2) serve as a valuable reference database for the ground verification of satellite digital data, which could be important for assessing the effectiveness of the restoration of degraded alpine grassland.

2. Materials and Methods

2.1. Study Area

The study site was situated in the “Three-River Headwaters” region of Qinghai Province (31°39′–36°12′N, 89°45′–102°23′E), Tibetan Plateau, China. We collected 210 forage samples of plant canopy spectral data from 26 plots in 13 counties: Guinan (GN), Henan (HN), Zeku (ZK), Maqin (MQ), Banma (BM), Gande (GD), Dari (DR), Jiuzhi (JZ), Mado (MD), Yushu (YS), Jinduo (CD), Nangqian (NQ), and Qumalai (QML) (Table 1; Figure 1). These 13 counties had typical native alpine grassland, extremely degraded grassland, and actively restored grassland, which provided a robust foundation for the remote sensing-based monitoring of alpine grasslands.

2.2. Data Collection

The spectral measurements were performed between July and September 2019, the period of peak vegetation growth. Hyperspectral data were collected from the canopy of the plant communities after all debris was removed from the canopy (REF). The spectra of dominant plant species in various degraded plots were determined. The canopy spectral reflectance of each plant was measured at least 10 times, and the average value was used as spectral reflectance for that plant. A portable ground spectrometer (ASD FieldSpec4, Boulder, CO, USA) with a de-spectralized wavelength range of 350–2500 nm was used to perform measurements on dry, windless, sunny days (10:00 a.m. to 3:00 p.m.) to reduce the bias between different textured surfaces. Prior to each measurement, calibration was made against a standard white panel to reduce errors, induced by fluctuations in environmental conditions. Subsequently, all aboveground plants in the sample plots were harvested and transported to the laboratory for the determination of crude protein content.
In the collection of spectral data for individual dominant plant species, it was essential to minimize or avoid the influence of the soil background. Therefore, small patches of grassland with nearly 100% cover of an individual species were selected. The height of the ground spectrometer probe was adjusted to ensure the field-of-view angle fell entirely within the boundaries of the small patch. To reduce the noise level, each spectrum was based on an average of 10 readings, and a white reference plate was used to obtain the total incident radiant flux for each measurement. The spectral reflectance was calculated as the ratio of the sample spectrum to the white plate spectrum of the reference plate. The spectral data between 1350 and 1400 nm and between 1800 and 2020 nm were discarded due to the low signal-to-noise ratio resulting from severe water absorption outside the atmospheric window. Specific data collection and sampling point distribution are presented in Figure 2.

2.3. Statistics and Analysis

The smoothing and filtering of spectral data are effective for noise reduction and improving the signal-to-noise ratio without altering the signal’s shape or width [19]. The method of Gao et al. (2016) [5] was followed to produce a smooth spectrum, while the raw data were filtered by the Savitzky–Golay convolutional smoothing filter using Origin (2021). Based on prior knowledge, we optimized the filtering parameters, selecting a moving window width of 11 and a polynomial order of 5 [20]. After completion of the smoothing using the Savitzky–Golay filter, the continuum removal and first derivative spectra were obtained through the de-enveloping processing. The spectral feature was extracted by the parametric method which was employed when analyzing the canopy spectral data characteristics of different vegetation types. This involved the extraction of specific spectral features, which avoids the redundancy of information caused by using the values of reflectance of all bands.
The parametric method entails the parameterization of spectral absorption features or the reflectance of raw peak features [21]. The spectral features in this study encompassed red absorption features, including absorption position (AP), absorption depth (AD), and red-edge parameters (red-edge position (REP) and red-edge amplitude (AMP)). The following definitions are provided for the related concepts: (1) amplitude of red edge/nm−1 (AMP)—the red-edge covers the range of 680–760 nm, and Dλr represents the maximum value of the first derivative spectrum within this range; (2) red-edge position (REP)—the wavelength corresponding to the highest point of the first derivative (FD) spectral reflectance (680–750 nm); (3) absorption position (AP)—the wavelength corresponding to the lowest point of the spectral reflectance (550–750 nm) of the de-envelope (CR); and (4) absorption depth (AD)—the wavelength range of red light is 650–690 nm, and the absorption depth, also known as red valley reflectance (Rrw), represents the minimum spectral reflectance within this range. The specific data collection and processing are illustrated in Figure 3.
To eliminate the interference caused by the soil background, we employed the 1st derivative module, accessible via the Plot Function menu in the spectral display window of the ENVI 4.8 software. The first-order differential curves of the raw spectra were calculated, highlighting the ‘green-peak’ and ‘red-edge’ characteristics of vegetation, thereby eliminating the interference caused by the bare ground. The mathematical formula for the first-order differentiation equation is as follows:
ρ′(λi) = (ρ(λi + 1) − ρ(λi − 1))/(λi + 1 − λi − 1)
where λi is the i-band wavelength, ρ(λi) is the i-band reflectance, and ρ′(λi) is the i-band first-order derivative spectral value.

3. Results

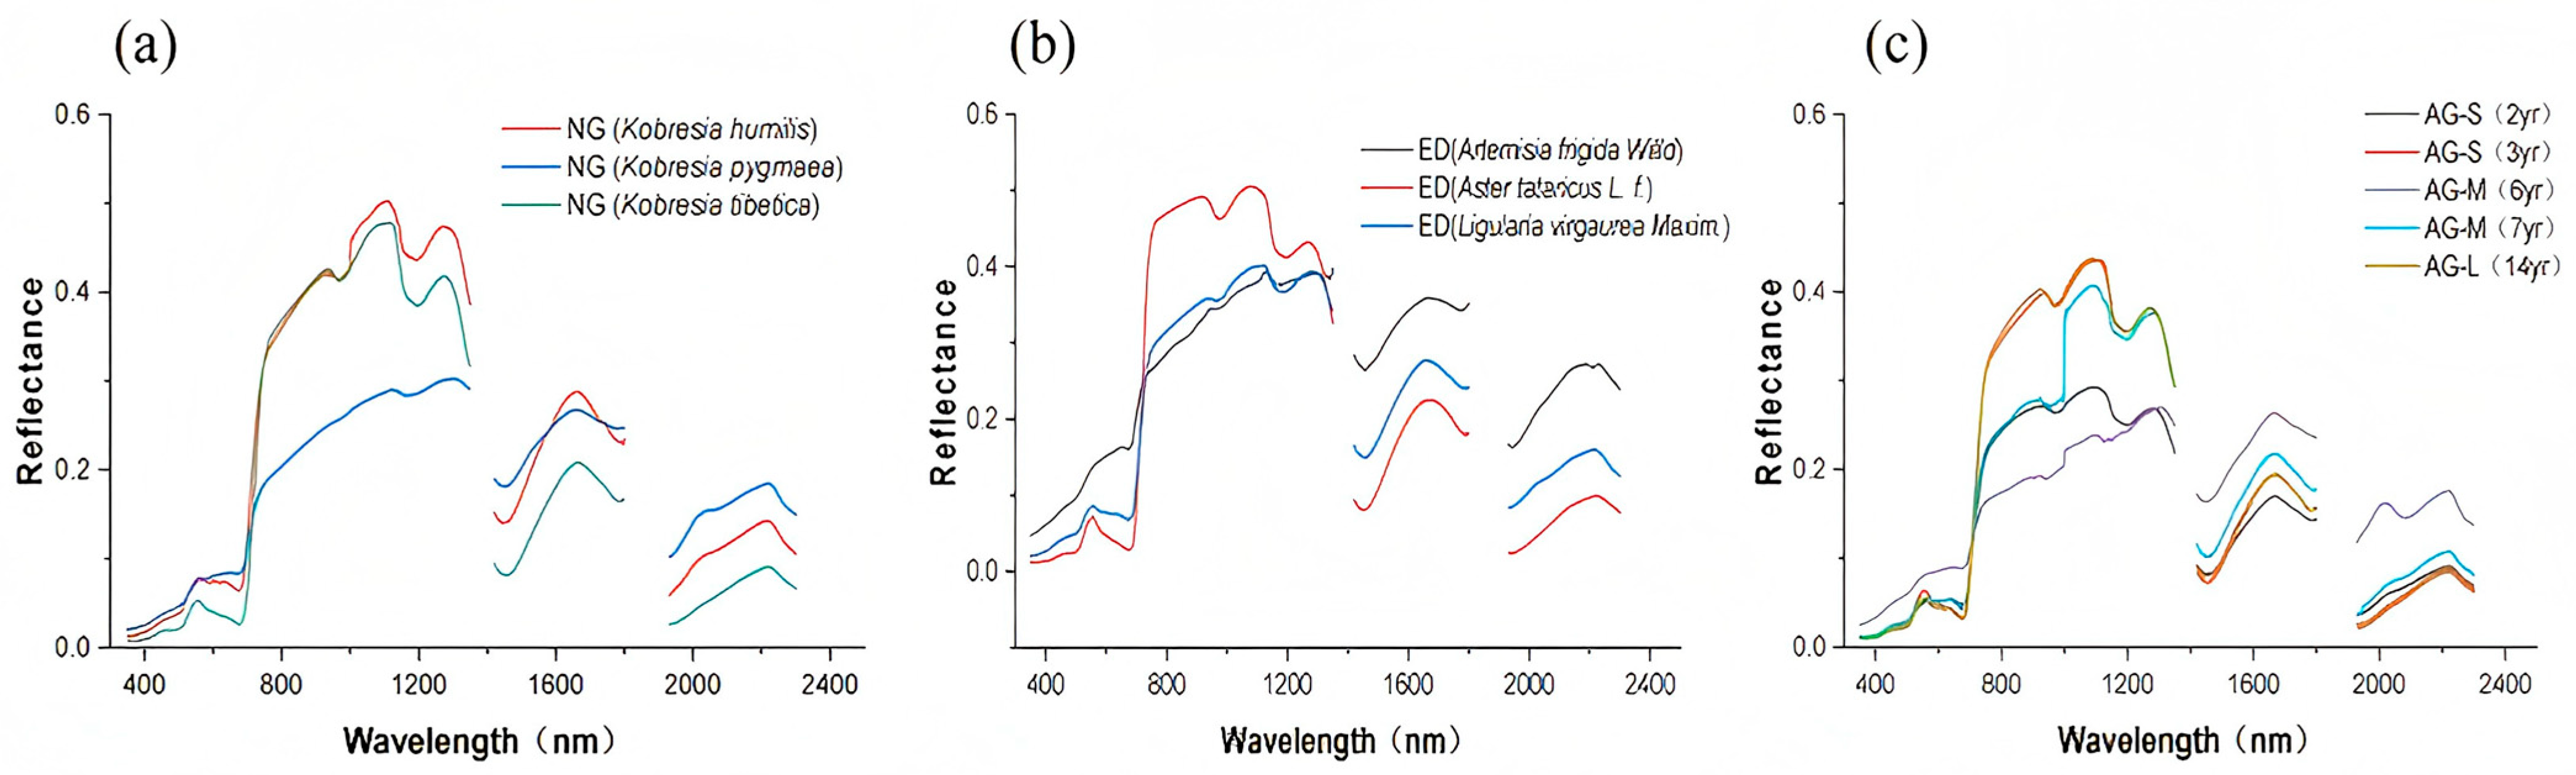
3.1. Spectral Reflectance of Vegetation in Kobresia Meadows, Extremely Degraded Grassland and Actively Restored Grasslands of Different Years

We obtained three typical dominant grassland plants of Kobresia meadows and attempted to identify them by their fine spectroscopic features. Kobresia pygmaea and K. humilis have similar morphologies, are difficult to distinguish, and are often mistaken for one another in the field, so we attempted to identify them by their fine spectral features. The raw spectral reflectance curves of the three Kobresia meadows generally displayed similar patterns (Figure 4a), with one obvious reflectance peak in the green-light band, and two obvious absorption peaks in the red and blue light bands. The spectral curves of the three Kobresia meadows exhibited some differences among them, with the reflectance in the green-light wavelength band of the K. pygmaea meadow > K. humilis meadow > K. tibetica meadow. The reflectance of these three meadows differed significantly in the near-infrared band, most notably in the alpine meadow, where the reflectance was the lowest and dropped substantially, and then continued to be the highest in the 2000 nm wavelength (Figure 4a).
In the grass spectral curves of the three extremely degraded grasslands, with the poisonous weed invaders Artemisia frigida, Aster tataricus and Ligularia virgaurea, the spectral reflectance of L. virgaurea always remained in the middle position, while the values of A. frigida and A. tataricus were inconsistent (Figure 4b). From the wavelength of 1400 nm onwards, the spectral reflectance eigenvalues of the three weeds were stable, with A. frigida > A. tataricus > L. virgaurea. Spectral profiles of grasslands, actively restored in the short, medium and long term, exhibited the least difference at the green-light reflectance peak (557 nm), especially between short- and long-term restoration (Figure 4c).

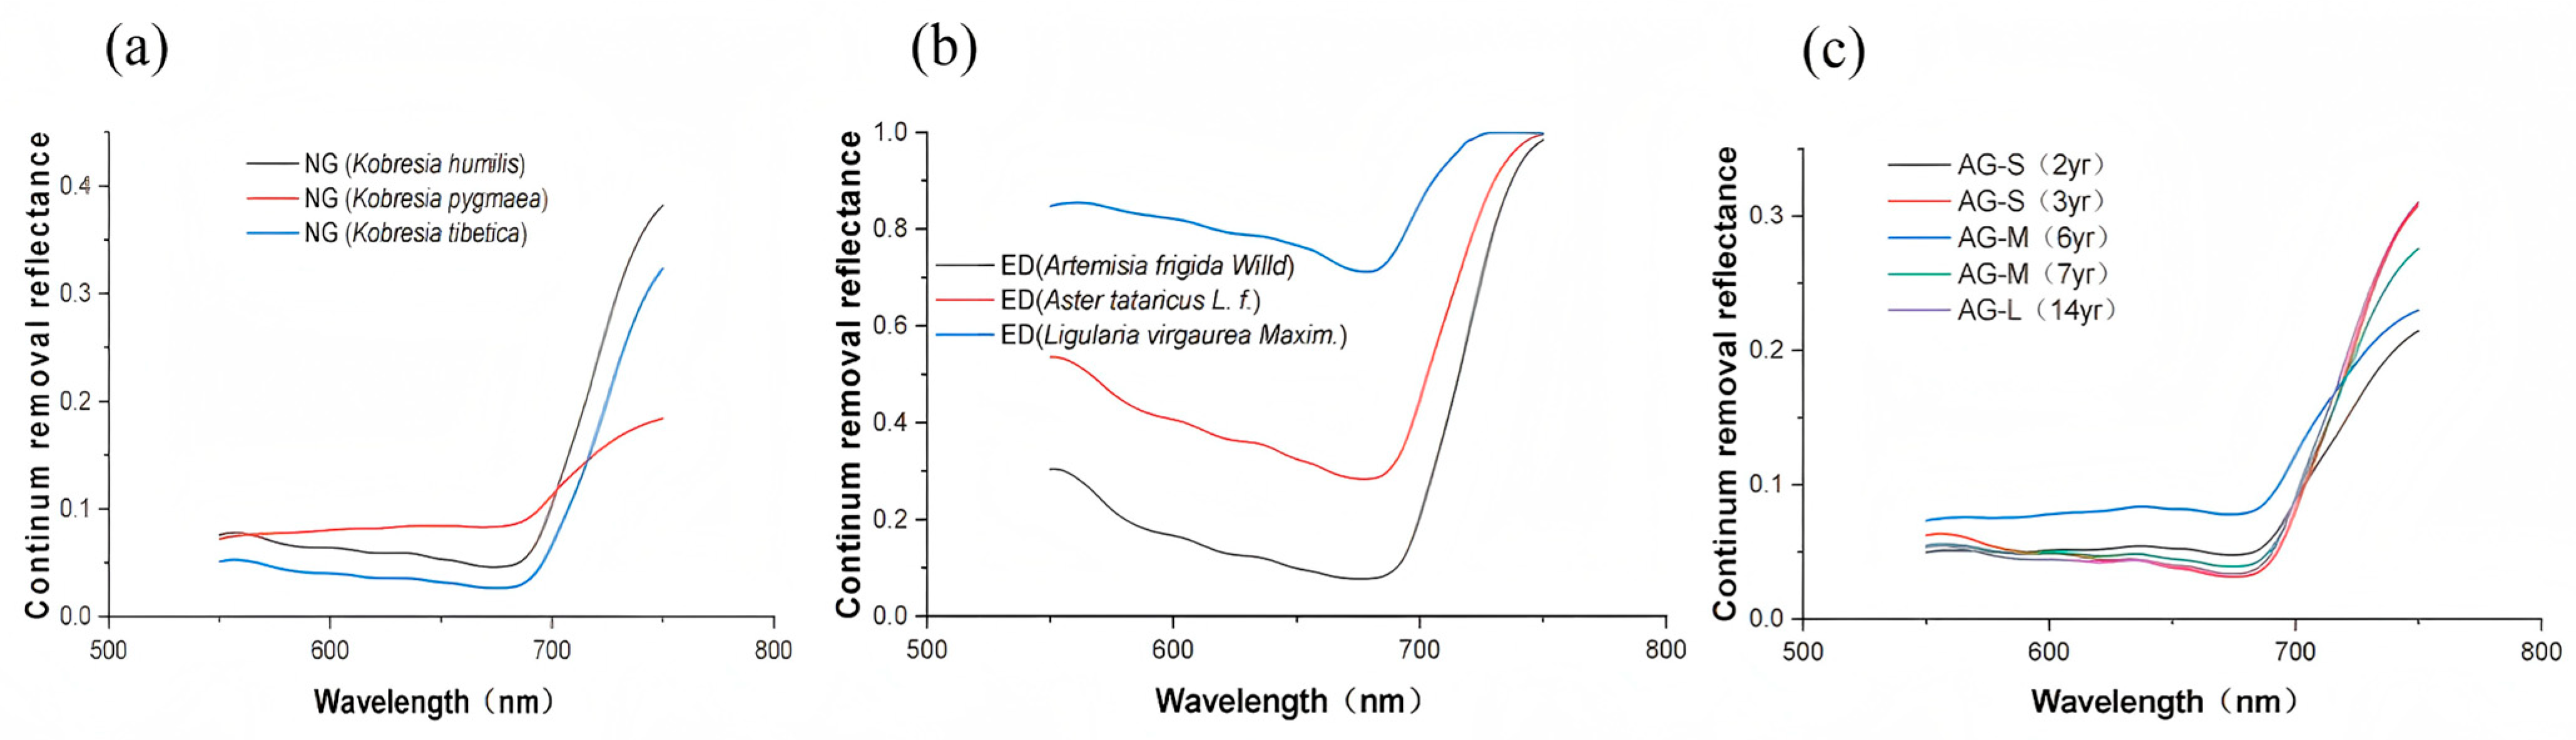
3.2. Continuum Removal Spectra of Kobresia Meadows and Extremely Degraded Grassland and Actively Restored Grassland at Different Years

The spectral reflectance of vegetation in the 550–750 nm red-light region of the three Kobresia meadows, the three extremely degraded grasslands, and actively restored grasslands of different ages with removal of the continuum are presented in Figure 5. In general, the absorption depth and width of the red-light region from the Kobresia meadow were wider and deeper than that from the extremely degraded grassland. The absorption width of alpine Kobresia meadows was narrow and shallow (Figure 5a); in terms of the absorption width in the red-light band, the magnitude of change in the Ligularia virgaurea invasion of extremely degraded grassland was small, whereas the absorption width of A. tataricus and A. frigida from extremely degraded grasslands varied (Figure 5b). After 14 years of active restoration, the absorption depth and width in the red-light region gradually became deeper and wider than those in the Kobresia meadow (Figure 5c), which indicated that the grassland was in a healthy state after active restoration.

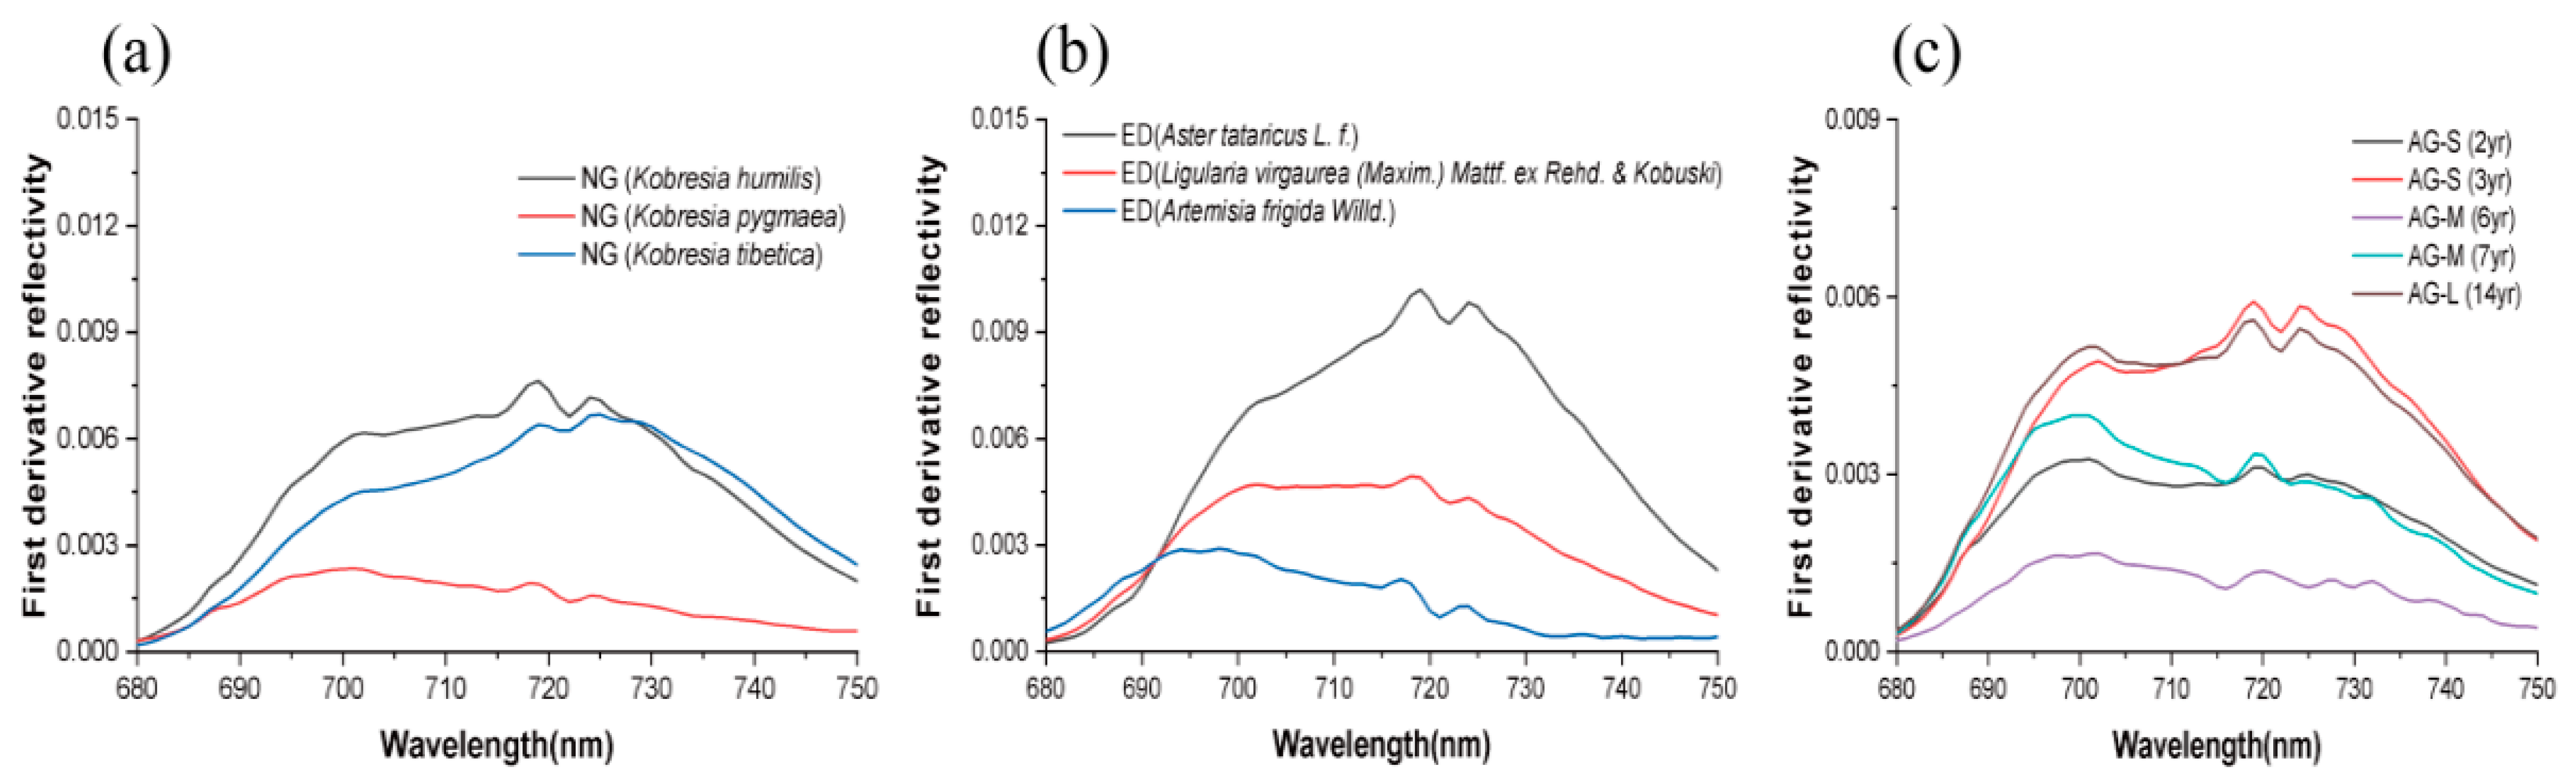
3.3. First Derivative Spectra of Kobresia Meadows, Extremely Degraded Grassland and Actively Restored Grassland at Different Years

The first derivative reflectance values of several grasses in the red wavelength region (680–750 nm) displayed a quadratic curve pattern, with an increase and then decrease with increasing wavelength. The position of red-edge remained near 720 nm in the Kobresia meadow, and in extremely degraded and actively restored grasslands, while several grasses had weak troughs at the 720–725 nm wavelengths (Figure 6). Therefore, compared with the FD, the CR spectra enhanced the red-edge absorption features of degraded and actively restored grasses.

3.4. Spectral Absorption and Red-Edge Shifts

Of the three Kobresia meadows, the K. pygmaea meadow had the smallest red-edge position and red-edge width (701 nm and 0.0024, respectively), and the red-edge position of extremely degraded meadows shifted towards the direction of short-wave expression compared to the Kobresia meadows. The red-edge position and red-edge amplitude of actively restored grassland of different ages did not display consistent patterns. Among the extremely degraded meadows, A. frigida meadows had the smallest red-edge position and red-edge amplitude (698 nm and 0.2645, respectively; Figure 7a,b).
Regarding red-light absorption characteristics, the AP of the extremely degraded grassland did not change but the AD decreased and then increased with an increase in years of restoration (Figure 7c,d). Therefore, we applied the characteristics of AD to identify actively restored meadows at different stages. The red-light absorption of the Kobresia meadows decreased and then increased, with K. pygmaea meadows having the smallest AD and AP (550 nm and 0.9280, respectively). In comparing the size of the red-edge position in the extremely degraded meadows, L. virgaurea > A. tataricus > A. frigida, clearly moving towards the short-wave band, and the variation in AP spans the range of 353 nm–1444 nm (Figure 7c,d).

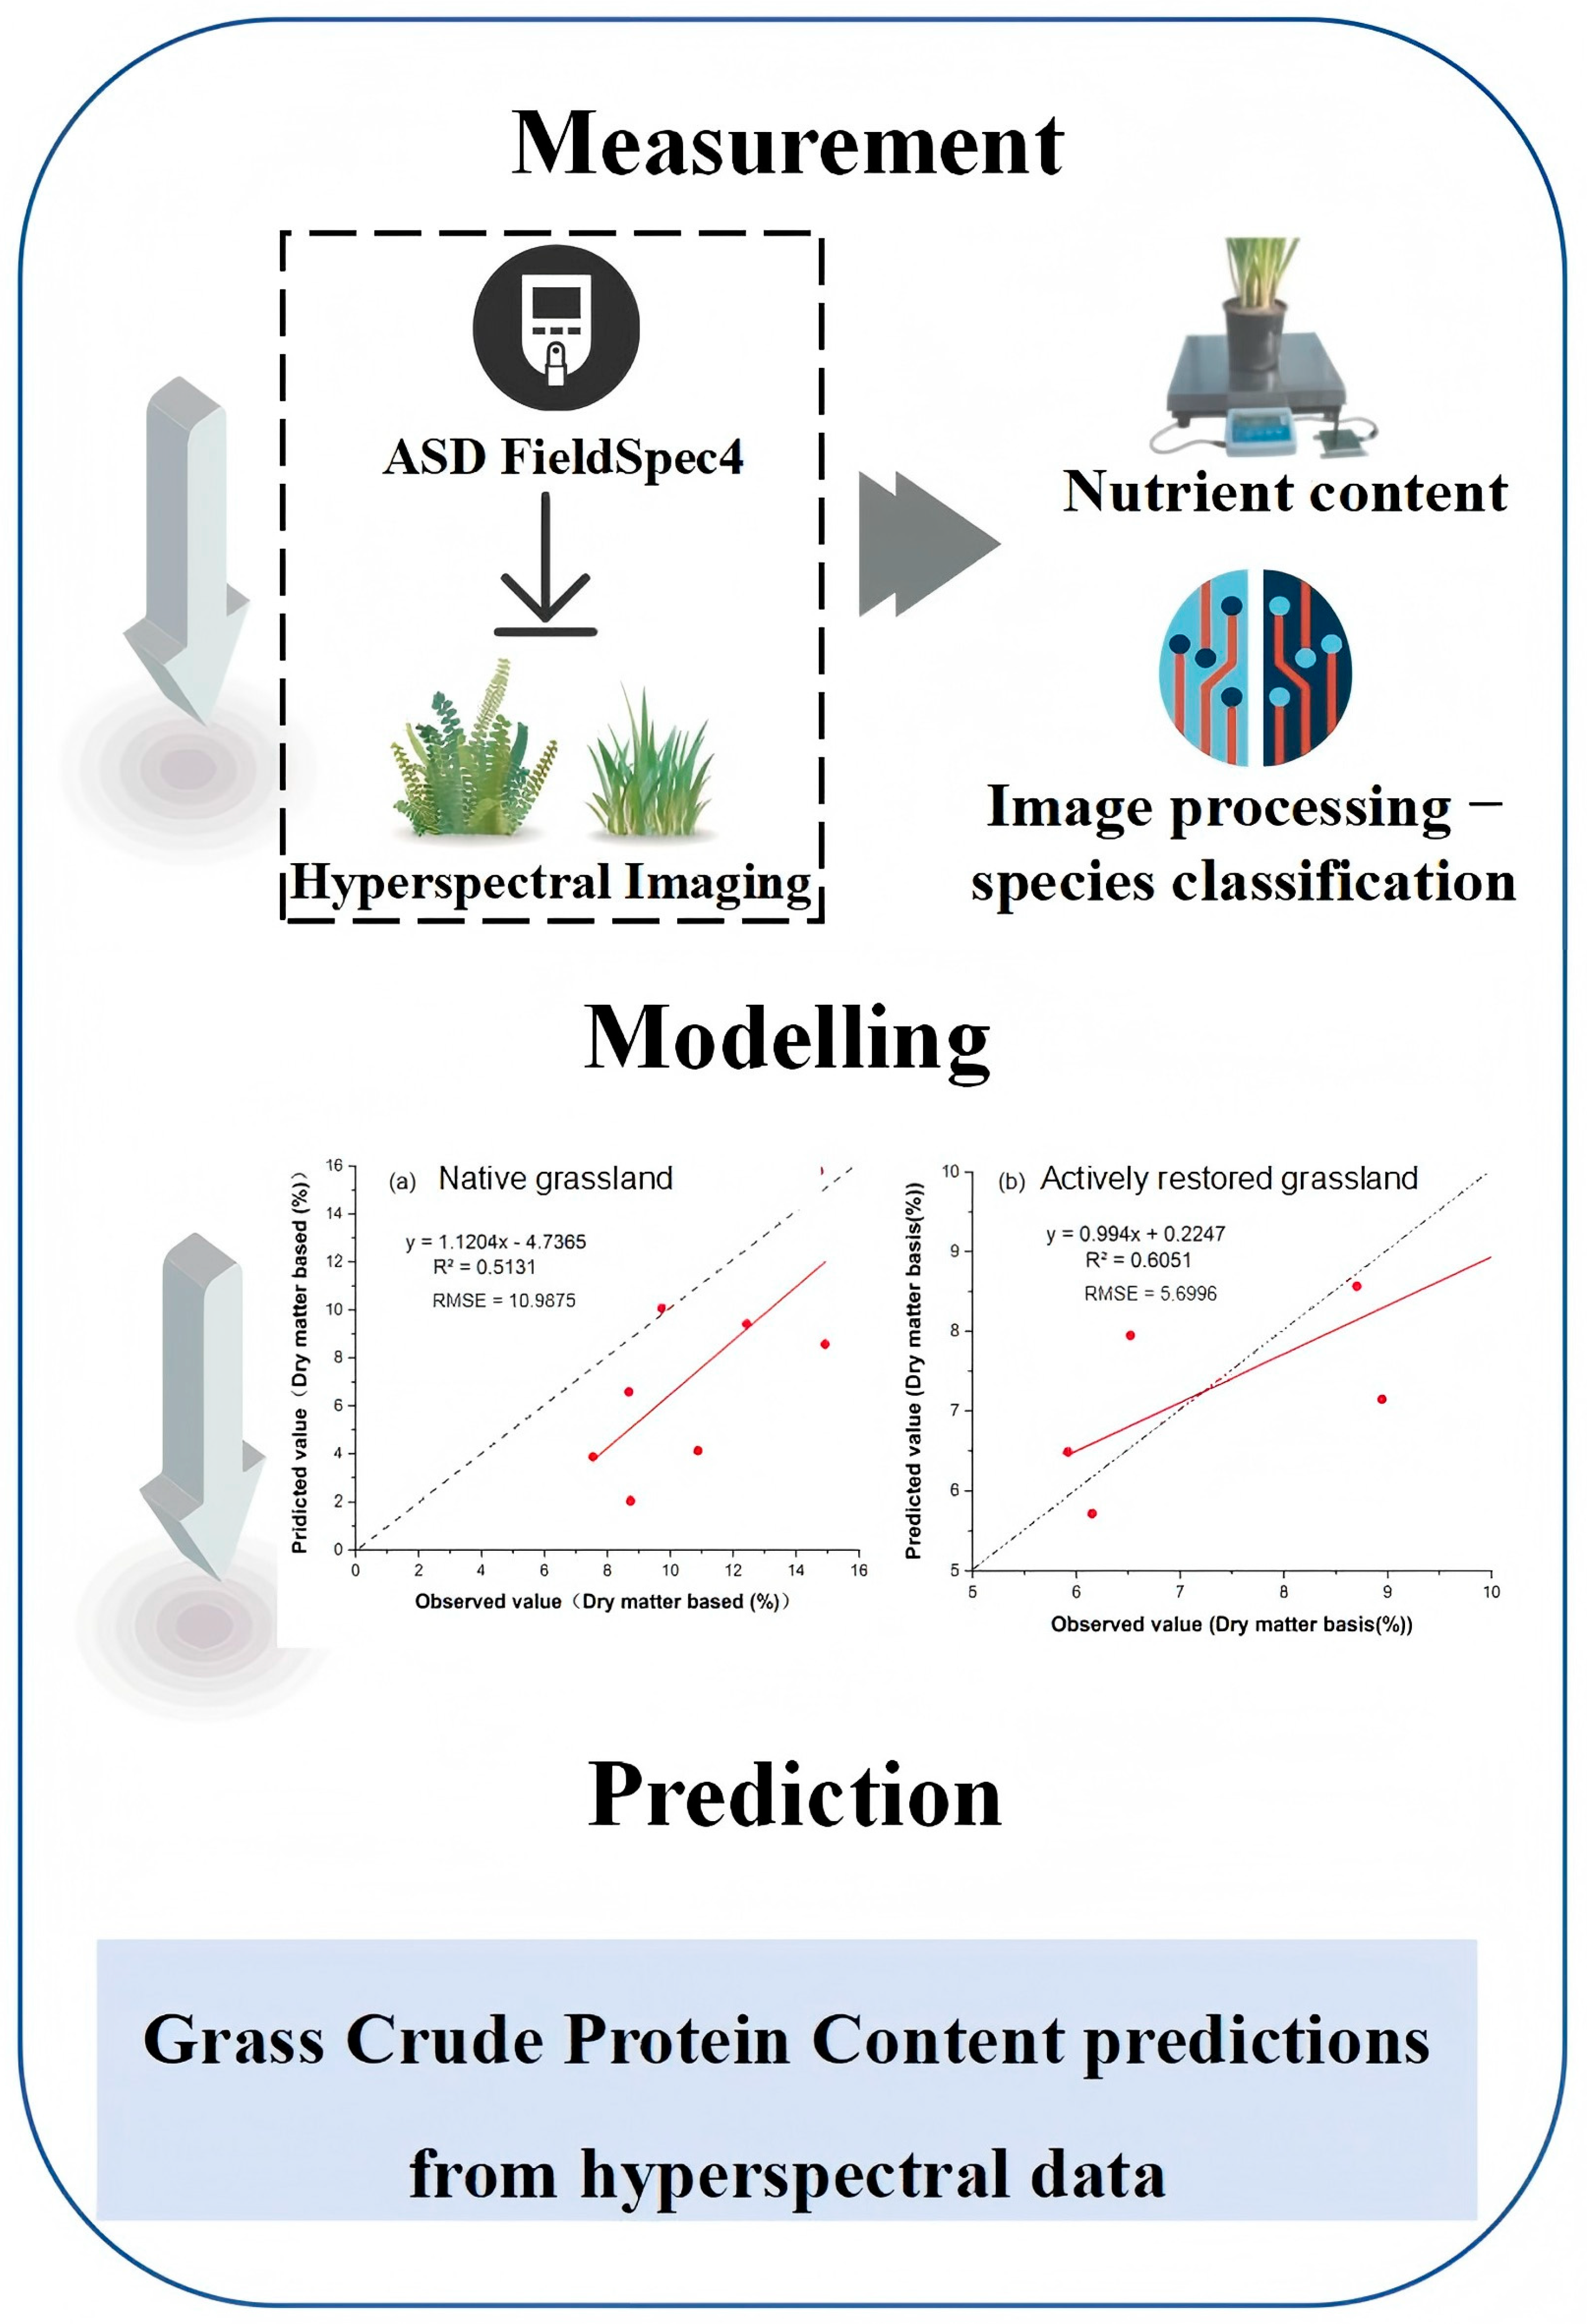
3.5. Hyperspectral Estimation of Grass Crude Protein Content

3.5.1. Modeling for Hyperspectral Estimation of Crude Protein and Nutrient Productivity of Pasture Grasses

The crude protein contents in Kobresia meadow, extremely degraded grasslands, and actively restored grasslands are presented in Table 2. The highest correlation coefficient between the original spectral reflectance and crude protein content was seen at a wavelength of 1265 nm, indicating the existence of a significant negative correlation (p < 0.05), whereas the highest correlation coefficients between the first derivative of reflectance and crude protein content of actively restored grassland were seen at the wavelengths of 1682 nm and 2206 nm (Figure 8). The spectral position variables were employed primarily in the selection of hyperspectral feature coefficients. As the characteristic band, the selected wavelength range was where the absolute value of the correlation coefficient between the crude protein content of grass vegetation and the reflectance of the original and first-order differential spectra of the vegetation canopy was > 0.5. The spectral parameters of alpine meadows and actively restored grasslands are presented in Table 3.
The estimation model was generated by using the spectral coefficients related to the protein of grassland vegetation as independent variables and the measured crude protein content of the 12 plots as dependent variables. The regression analysis used the SPSS 26.0 software, and an F-test tested the significance (p < 0.05) (Table 4). Based on the F-test and its fitting coefficient R2, an estimation model was constructed between protein nutrient content and hyperspectral feature coefficients of vegetation canopy for different grasslands (Table 4). In preliminary screening, four models were significant (p < 0.01) for actively restored grassland, while three models were significant (p < 0.01) for alpine meadow.

3.5.2. Evaluation of the Accuracy of the Crude Protein Nutrient Productivity Estimation Model and Validation of the Results of the Best Estimation Model

The data from 52 sample plots in 14 grasslands were used to assess the accuracy of the preliminary screening estimation models (Table 5). The regression coefficient (R2) for the four prediction models estimating crude protein content in actively restored grasslands averaged 0.613, with a range from 0.605 to 0.630, which was similar to the average value of 0.635 of the fitted equations, indicating that the models were satisfactory. The R2 of the three prediction models estimating crude protein content in the three alpine meadows averaged 0.492, with a range of 0.481 to 0.513, which was considerably lower than the average 0.723 of the fitted equations, indicating that the models were not satisfactory. In the model, Y = 13.72 − 3077x, the highest R2, 0.513, was observed with R1265 as the independent variable. Therefore, this was selected as the optimal estimation model for alpine meadow crude protein content. Among the four alternative models for estimating crude protein content in actively restored grassland, the model Y = 14.368×e2414x with R1682 as the independent variable had the highest R2, 0.608, and the lowest RMSE and relative error (1.022% and 7.50%, respectively).
The optimal estimation of pasture crude protein content in alpine meadows predicted 51.3% of the actual crude protein changes in pasture, with a root mean square error value of 10.99 (Figure 9a), whereas 60% of changes were predicted in actively restored grassland (Figure 9b). This indicates that the model has the potential for application and development when compared with the estimation model of alpine meadows. Given the variability in dominant species across areas, the characteristic spectral bands of alpine meadow vegetation often exhibit differences. The accuracy of predictive models is therefore, highly dependent on extensive field-measured data and is subject to temporal, spatial, vegetation-type, and growing season variations [22]. This dependence limits the reliability and general applicability of hyperspectral remote sensing for estimating forage crude protein content.

4. Discussion

4.1. Spectral Characterization of Plant Communities

With the widespread implementation of ecological restoration measures on the Tibetan Plateau, large areas of actively restored grasslands have been established. These managed ecosystems are now an important part of the region’s landscape. The spectral reflectance characteristics of both natural alpine meadows and actively restored grasslands are greatly influenced by biophysical and biochemical factors. The main determinants include vegetation canopy structure (e.g., leaf area index, canopy height and density), foliar biochemical properties, and bare soil or litter cover and spectral characteristics [23]. In the visible spectral (400–700 nm) range, vegetation reflectance has substantial sensitivity to photosynthetic pigments. The red region (680–750 nm), which includes the critical red-edge transition, is particularly sensitive. The strong absorption minimum of chlorophyll in the red band (around 680 nm) and the subsequent sharp rise in reflectance (red edge, 700–750 nm) are directly influenced by chlorophyll density and, more importantly, by nitrogen-rich compounds such as proteins essential for photosynthesis [24]. The alpine meadows had the lowest reflectance in the near-infrared band, which could be attributed to the strong scattering between multiple leaf layers of K. pyqaea due to the short culms in dense clumps [10]. Tong et al. [25] reported that the spectral reflectance curves of Kobresia meadows were relatively similar, and exhibited greater variability in the 720–1300 nm wavelength range. The significant ‘green peaks’ and ‘red valleys’ of the meadows are in line with the spectral characteristics of all green photosynthetic plants, which can be explained by their high ground cover and chlorophyll content. This interpretation is supported strongly by the very high average vegetation cover (>90%) measured in the Kobresia meadows in the present study.
The difference in spectral reflectance of restored grassland of different ages was most noticeable in the slope of the red edge, especially in short-term- and long-term-restored grasslands. Robert et al. (1993) [26] reported that the absorption characteristics of non-green plants at 2100 nm were related mainly to the content of lignin and crude fiber. In the present study, A. tataricus and L. virgaurea grasslands did not have absorption valleys at 2100 nm, and only A. frigida grassland and actively restored grassland planted for 6 years displayed weak absorption valleys. In the growing season, Kobresia meadow plants had fewer dead leaf sheaths and, thus, fewer distinct absorption features. L. virgaurea and A. tataricus had absorption features in the characteristic band of cellulose absorption at 2100 nm due to their relatively large number of branches and leaves, especially L. virgaurea, which has large tufts of green leaves. A. frigida has corky stems, with bipinnately divided leaves covered with short grayish-white hairs, relatively low chlorophyll content and high stem crude fiber content and, thus, displayed a more pronounced ‘cellulose’ absorption valley (Figure 4b). Red-orange light in the 600–680 nm range characterizes the ‘red valley’ of absorption of chlorophyll and other pigments [9]. In the present study, A. tataricus and L. virgaurea grasslands displayed ‘red valley’ characteristics (Figure 4b). In this band, the vegetation undergoes photosynthesis, biomass formation, flowering and photoperiodic processes at a maximum rate [21]. Furthermore, soil background is an important factor influencing the spectral reflectance of vegetation. The soil spectral reflectance was lower than that of plants in the near-infrared band, with the lowest reflectance in extremely degraded grassland, which had very low cover.

4.2. Nutrient Index Inversion

The nutritional assessment of forages is mainly based on crude protein (CP) content, which is a major determinant of forage quality and livestock nutrient intake [27]. Our results are in line with established remote sensing principles, demonstrating that specific spectral regions, that is, green-light band, red-edge band, and near-infrared reflectance spectra, play a key role in spectral inversion of plant protein content [28]. Qi et al. [29] employed a multivariate linear regression to model the original spectral reflectance of tussock grass, and identified 360 nm, 375 nm, 678 nm, 768 nm, 1407 nm, and 1890 nm as the sensitive bands for the inversion of crude protein. Importantly, plant spectral features are not determined only biochemically, as they also represent a combination of intrinsic physiological traits (e.g., leaf structure, canopy structure, phenological period) and environmental variables (e.g., soil background reflectance, atmospheric conditions, water stress) [30]. This value of 5.70 indicates that the pasture crude protein content predictive model generated in this study for actively restored grassland has better potential for application and development than the model developed for alpine meadow. The efficacy of the near-infrared (NIR) region is confirmed by the large body of literature and by the high inversion accuracy in our model. NIR reflectance is particularly advantageous because it is affected mainly by internal scattering from the chloroplast mesosphere and is less susceptible to changes in the external environmental background (e.g., soil exposure, litter cover, shading) than visible wavelengths [31]. The deployment of the NIR band with high inversion accuracy in this study substantiates the assertion that this approach can effectively mitigate the impact of the environmental background on the inversion of pasture crude protein content.
While this study advances the spectral characterization and nutrient inversion of Tibetan Plateau grasslands, several limitations must be noted. Firstly, the spectral analysis relied exclusively on passive optical sensors (e.g., field spectroradiometers), which are inherently susceptible to atmospheric interference. Variations in water vapor, aerosols, and illumination conditions can introduce substantial noise and bias into reflectance measurements, particularly in the critical shortwave infrared (SWIR) regions where key biochemical absorptions occur. To overcome this constraint and enhance structural understanding, future investigations should integrate active remote sensing technologies, such as LiDAR (light detection and ranging) or terrestrial laser scanning. Secondly, the ground sampling campaign faced inherent spatial and temporal constraints. Sampling sites, while representative, could not fully include the extensive spatial heterogeneity of vegetation composition, soil properties, and degradation states across the vast plateau. Furthermore, data collection was limited to key phenological stages, potentially missing critical temporal variations in spectral signatures and nutrient dynamics throughout the entire growing season or across inter-annual climate fluctuations. Additionally, the inversion model focused exclusively on crude protein. Subsequent studies should incorporate supplementary nutritional indicators (e.g., lignin, cellulose, phosphorus) to develop holistic assessments of forage nutritional quality. Methodologically, machine learning algorithms (e.g., random forests, neural networks) have the potential for enhancing predictive accuracy by addressing spectral non-linearity and covariance more effectively than traditional multivariate regression.

5. Conclusions

The spectral reflectance slope differentiation at the red-edge inflection point was most pronounced in actively restored grasslands, in particular in those with shorter and longer restoration periods. Furthermore, the red-light absorption feature exhibited a progressive broadening and deepening trend from the Kobresia meadow to the severely degraded grassland. The model’s predictive accuracy for pasture crude protein in alpine meadows accounted for 51.3% of the actual protein variance, whereas the model for artificially restored grasslands had a 60% accuracy rate. This suggests that the pasture crude protein content predictive model generated for actively restored grasslands had better applicability and development potential than the alpine meadow model. The establishment of a hyperspectral library for alpine meadow vegetation is crucial for meadow resource assessment and large-scale satellite remote sensing-based classification and grading. The characterization of spectral signatures across natural grassland, severely degraded grassland, and actively restored grassland, coupled with the development of a crude protein content predictive model can facilitate the optimization of grazing management strategies based on grassland protein content levels. This approach can be beneficial for grassland management and in the development of sustainable development policies aimed at regulating the balance between grazing pressure and grassland productivity, maintaining nutrient cycling and mitigating environmental nutrient emissions.

Author Contributions

Conceptualization, Y.B.; methodology, Y.B.; software, Y.B.; validation, W.L., M.S. and Z.S.; formal analysis, Y.B.; investigation, H.Z.; resources, Z.S.; data curation, Y.B.; writing—original draft preparation, Y.B.; writing—review and editing, S.Z., J.W., H.Z., B.L., M.H., L.Q., W.L., M.S., A.A.D. and Z.S.; visualization, Y.B.; supervision, Z.S.; project administration, Z.S.; funding acquisition, Y.B. All authors have read and agreed to the published version of the manuscript.

Funding

This work was supported by the National Natural Science Foundation of China (32201382; U21A20183), the National Natural Science Foundation of Sichuan Province, China (2023NSFSC0196), the Open Project of State Key Laboratory of Plateau Ecology and Agriculture, Qinghai Unversity (2024-KF-07). Sichuan High-Caliber Talent Introduction Program (Haiju Plan) 2025HJRC0054.

Data Availability Statement

The original contributions presented in the study are included in the article, further inquiries can be directed to the corresponding author.

Conflicts of Interest

The authors declare no conflicts of interest.

References

  1. Ye, Q.H.; Zhu, L.P.; Zheng, H.X.; Naruse, R.; Zhang, X.; Kang, S. Glacier and lake variations in the Yamzhog Yumco basin, southern Tibetan Plateau, from 1980 to 2000 using remote-sensing and GIS technologies. J. Glaciol. 2007, 53, 673–676. [Google Scholar] [CrossRef]
  2. Liu, B.; Shen, W.S.; Lin, N.F.; Li, R.; Yue, Y. Deriving vegetation fraction information for the alpine grassland on the Tibetan Plateau using in situ spectral data. J. Appl. Remote Sens. 2014, 8, 083635. [Google Scholar] [CrossRef]
  3. Qi, H.M.; Chen, A.; Yang, X.C.; Xing, X. Estimation of crude protein content in natural pasture grass using unmanned aerial vehicle hyperspectral data. Comput. Electron. Agric. 2025, 229, 109714. [Google Scholar] [CrossRef]
  4. Zha, J.; Wu, Y. Estimation of Pennisetum alopecuroides crude protein content in the Jiangsu Dafeng David’s Deer Reserve using hyperspectral remote sensing technology. Pratacultural Sci. 2021, 38, 1910–1917. (In Chinese) [Google Scholar]
  5. Yin, L.J.; Shen, Q. Error analysis on determination of crude protein in herbage by the automatic Kjeldahl apparatus and related countermeasures. Grass-Feed. Livest. 2020, 26, 16–21. (In Chinese) [Google Scholar]
  6. Gao, J.L.; Hou, Y.C.; Bai, Y.F.; Meng, B.; Yang, S.-X.; Hu, Y.; Feng, Q.-S.; Cui, X.; Liang, T. Methods for estimating nitrogen, phosphorus, and potassium content based on hyperspectral data from alpine meadows in Guinan and Maqin Counties, Qinghai Province. J. Grass Ind. 2016, 25, 9–21. (In Chinese) [Google Scholar]
  7. Pickup, G.; Bastin, G.N.; Chewings, V.H. Remote-sensing-based condition assessment for non-equilibrium rangelands under large-scale commercial grazing. Ecol. Appl. 1994, 4, 497–517. [Google Scholar] [CrossRef]
  8. Gao, Q.Z.; Wan, Y.F.; Xu, H.M.; Li, Y.; Jiangcun, W.-Z.; Borjigidai, A. Alpine grassland degradation index and its response to recent climate variability in northern Tibet, China. Quat. Int. 2010, 226, 143–150. [Google Scholar] [CrossRef]
  9. Liu, B.; You, G.; Li, R.; Shen, W.; Yue, Y.; Lin, N. Spectral characteristics of alpine grassland and their changes responding to grassland degradation on the Tibetan Plateau. Environ. Earth Sci. 2015, 74, 2115–2123. [Google Scholar] [CrossRef]
  10. Liu, B.; Shen, W.S.; Li, R.; Yang, Z.; Lin, N.-F. Spectral characteristics of alpine grassland during degradation process in the source region of Yarlung Zangbo. Spectrosc. Spectr. Anal. 2013, 33, 1598–1602. [Google Scholar]
  11. Wang, G.X.; Li, Y.S.; Wang, Y.B. Land Surface Processes and Environmental Changes in River Headwater Regions of Qinghai-Tibet Plateau; Science Press: Beijing, China, 2010; pp. 80–110. [Google Scholar]
  12. Wang, H.J.; Fan, W.J.; Cui, Y.K.; Zhou, L.; Yan, B.Y.; Wu, D.H.; Xu, X.R. Hyperspectral remote sensing monitoring of grassland degradation. Spectrosc. Spectr. Anal. 2010, 30, 2734–2738. [Google Scholar]
  13. Lehnert, L.W.; Meyer, H.; Meyer, N.; Reudenbach, C.; Bendix, J. A hyperspectral indicator system for rangeland degradation on the Tibetan Plateau: A case study towards spaceborne monitoring. Ecol. Indic. 2014, 39, 54–64. [Google Scholar] [CrossRef]
  14. Gao, Q.; Li, Y.; Wan, Y.; Lin, E.; Xiong, W.; Jiangcun, W.; Wang, B.; Li, W. Grassland degradation in Northern Tibet based on remote sensing data. J. Geogr. Sci. 2006, 16, 165–173. [Google Scholar] [CrossRef]
  15. Foggin, J.M. Depopulating the Tibetan grasslands: National policies and perspectives for the future of Tibetan herders in Qinghai Province, China. Mt. Res. Dev. 2008, 28, 26–31. [Google Scholar] [CrossRef]
  16. Harris, R.B. Rangeland degradation on the Qinghai-Tibetan Plateau: A review of the evidence of its magnitude and causes. J. Arid. Environ. 2010, 74, 1–12. [Google Scholar] [CrossRef]
  17. Bai, Y.F.; Guo, C.C.; Degen, A.A.; Ahmad, A.A.; Wang, W.; Zhang, T.; Li, W.; Ma, L.; Huang, M.; Zeng, H.; et al. Climate warming benefits alpine vegetation growth in Three-River Headwater Region, China. Sci. Total Environ. 2020, 742, 140574. [Google Scholar] [CrossRef]
  18. Wu, Y.; Wu, B.; Ma, Y.; Wang, M.; Feng, Q.; He, Z. Rapid Discrimination of Organic and Non-Organic Leafy Vegetables (Water Spinach, Amaranth, Lettuce, and Pakchoi) Using VIS-NIR Spectroscopy, Selective Wavelengths, and Linear Discriminant Analysis. Appl. Sci. 2023, 13, 11830. [Google Scholar] [CrossRef]
  19. Chu, X.L.; Yuan, H.F.; Lu, W.Z. Progress and application of spectral data pretreatment and wavelength selection methods in NIR analytical technique. Prog. Chem. 2004, 16, 528–542. [Google Scholar]
  20. Erasmi, S.; Dobers, E.S. Potential and limitations of spectral reflectance measurements for the estimation of the site-specific variability in crops. Proc. SPIE 2004, 5232, 42–51. [Google Scholar]
  21. Li, J.L. Remote Sensing Monitoring of Grassland Degradation; Science Press: Beijing, China, 2012; pp. 102–154. (In Chinese) [Google Scholar]
  22. Ma, L.Y.; Cui, X.; Feng, Q.S.; Lang, T.G. Dynamic changes of grassland vegetation coverage from 2001 to 2011 in Gannan Prefecture. Acta Prataculturae Sin. 2014, 23, 1–9. [Google Scholar]
  23. Sims, D.A.; Gamon, J.A. Relationships between leaf pigment content and spectral reflectance across a wide range of species, leaf structures and developmental stages. Remote Sens. Environ. 2002, 81, 337–354. [Google Scholar] [CrossRef]
  24. Gitelson, A.A.; Gritz, Y.; Merzlyak, M.N. Relationships between leaf chlorophyll content and spectral reflectance and algorithms for non-destructive chlorophyll assessment in higher plant leaves. J. Plant Physiol. 2003, 160, 271–282. [Google Scholar] [CrossRef] [PubMed]
  25. Tong, Q.X.; Zhang, B.; Zheng, L.F. Hyperspectral Remote Sensing; Higher Education Press: Beijing, China, 2008; pp. 5–30. (In Chinese) [Google Scholar]
  26. Robert, D.A.; Smith, M.O.; Adams, J.B. Green vegetation, nonphotosynthetic vegetation, and soil in AVIRIS data. Remote Sens. Environ. 1993, 44, 255–269. [Google Scholar] [CrossRef]
  27. Zhang, A.W.; Yan, W.Y.; Guo, C.F. Inversion model of pasture crude protein content based on hyperspectral image. Trans. Chin. Soc. Agric. Eng. 2018, 34, 188–194. [Google Scholar]
  28. Wang, X.; Liu, S.J.; Zhang, X.W.; Hao, L.; Zhao, Y.; Wang, W. Alpine grassland nutrition dynamic monitoring using HJ-1A/1B data. Remote Sens. Land Resour. 2013, 25, 183–188. [Google Scholar]
  29. Qi, Q. Research on the inversion method of tussock nutrient composition based on hyperspectral data. Geospat. Inf. 2017, 15, 90–93. [Google Scholar]
  30. Ji, T. Spectral Characteristics Analysis and Nutrition Index Inversion of Alpine Grassland with Different Degradation Levels in Eastern Qilian Mountains; Gansu Agricultural University: Lanzhou, China, 2021. [Google Scholar]
  31. Zhang, F.L.; Wan, Y.Q. The research of method about plant biochemical concentration determination with hyperspectral data. J. Geo-Inf. Sci. 2010, 3, 71–75. [Google Scholar]
Figure 1. Spatial distribution of research sample plots. Green dots represent undegraded alpine grassland; black triangles represent extremely degraded grassland; blue dots of different sizes represent actively restored grassland of different ages.
Remotesensing 17 02114 g001
Figure 2. Distribution of data collection and sampling points ((a) modified from Wu et al., 2023 [18]; (b) spatial pattern of sampling sites according to TERN AusPlots method).
Remotesensing 17 02114 g002
Figure 3. Measurements and analyses.
Remotesensing 17 02114 g003
Figure 4. Raw spectral reflectance curves of three typical Kobresia meadows (a), three extremely degraded grasslands (b), and actively restored grasslands of different ages (c).
Remotesensing 17 02114 g004
Figure 5. Vegetation spectra of three typical Kobresia meadows (a), three extremely degraded grasslands (b), and three actively restored grasslands of different ages (c) with continuum removal (CR).
Remotesensing 17 02114 g005
Figure 6. First derivative spectra of three typical Kobresia meadows (a), three extremely degraded grasslands (b), and actively restored grasslands of different ages (c).
Remotesensing 17 02114 g006
Figure 7. Changes in spectral signature covariates REP, AMP, AP, and AD in extremely degraded grassland and actively restored grasslands with different ages. (a): Red-edge position; (b): amplitude of red edge; (c): absorption position; (d): absorption depth.
Remotesensing 17 02114 g007
Figure 8. Correlation coefficients (r) of spectral information and forage crude protein content in alpine meadows and actively restored grasslands: (a) correlation between original spectral reflectance and crude protein nutrients in alpine meadows; (b) correlation between first derivatives of spectral reflectance and crude protein content in actively restored grasslands.
Remotesensing 17 02114 g008
Figure 9. Correlation between optimal predictive model and measured value of crude protein content in grassland vegetation: (a) estimation effect of native grassland; (b) estimation effect of actively restored grassland.
Remotesensing 17 02114 g009
Table 1. Geographic location and dominant plant species of sample sites.
Sample Plot Longitude (E°)Latitude (N°)Elevation (m)Coverage (%)Number of SpeciesDominant Species
NGMD-NG98.21834.6494210905Kobresia tibetica
QML-NG95.76334.1444180619Kobresia pygmaea
NQ-NG96.14532.39640849812Kobresia pygmaea
JZ-NG100.60733.792383610018Kobresia humilis
BM-NG100.69932.94635309512Potentilla saundersiana
YS-NG97.081 32.818 38699113Kobresia humilis
MQ-NG100.498 34.345 3970907Aster yunnanensis, Bistorta vivipara
HN-NG101.781 34.686 36299912Kobresia tibetica., Potentilla saundersiana.
EDCD-ED97.41833.32342339611Artemisia frigida Willd., Elsholtzia densa Benth.
YS-ED97.09132.8283884959Aster yunnanensis, Aconitum pendulum
QML-ED95.90534.1034400587Ligularia virgaurea (Maxim.) Mattf, Morina kokonorica K. S. Hao
NQ-ED96.05932.33544007212Artemisia frigida Willd, Potentilla discolor Bunge
JZ-ED100.69333.2423821789Artemisia frigida Willd, Ligularia virgaurea (Maxim.) Mattf
MD-ED98.21834.6494210515Ligularia virgaurea (Maxim.) Mattf, Potentilla discolor Bunge
MQ-ED99.95934.4953835907Aster yunnanensis, Elsholtzia densa Benth
AGHN-AG101.51734.45536589213Elymus dahuricus
DR-AG99.79133.7133982843Elymus dahuricus
ZK-AG100.83534.97337609914Elymus dahuricus
YS-AG96.16033.03443306113Elymus dahuricus
CD-AG97.41833.3214248709Poa annua L.
MQ-AG99.29734.9743980807Ligularia virgaurea (Maxim.) Mattf., Pedicularis kansuensis Maxim
MD-AG98.32534.5564190633Artemisia frigida Willd, Bistorta vivipara
QML-AG95.75834.1494190773Poa annua L.
GN-AG100.76335.4713610988Elymus dahuricus
GD-AG100.05634.1764190959Elymus dahuricus
NQ-AG96.12032.30343205211Poa annua L.
Note: Sample plot numbers are indicated by county name and grassland type. NG; native alpine grassland; ED; extremely degraded grassland; AG; actively restored grassland.
Table 2. Crude protein content (CP%) of typical pasture grasses in sample plots in the study area. Means with different superscript letters differ from each other (p < 0.05).
Sample Plot IDNGEDAG
MD5.638.446.38
MQ13.213.56.56
CD9.8815.96.19
HN9.758.386.44
ZD19.08.198.63
YS10.18.317.94
QML8.445.813.56
NQ5.9412.66.25
JZ13.914.812.2
BM16.314.06.94
Mean11.2 a11.0 a7.13 b
Variation coefficient (%)36.8%30.4%29.5%
Typical sample
plot photographs
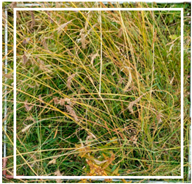
Remotesensing 17 02114 i001Remotesensing 17 02114 i002Remotesensing 17 02114 i003
Table 3. The hyperspectral covariates of the crude protein estimation model.
Characteristic ParameterParameter Description
Spectral positionR 1265 (NG)Original spectral reflectance value at 1265 nm
R’ 1682 (AG)First differentiation of spectral reflectance at 1682 nm
R’ 2206 (AG)First differentiation of spectral reflectance at 2206 nm
Table 4. Model construction for estimation of crude protein content.
Spectral ParameterRegression EquationsR2Fp-Value
R’1682 (AG)Y = 17,747X + 12.550.67120.3990.001
Y = 4.372 − 0.001/X0.50410.1620.010
Y = e2.655+2414x0.68421.6930.001
Y = 14.368e2413.850x0.68421.6930.001
R1265 (NG)Y = 13.716 − 30,772X0.77233.8770.000
Y = e2.602−3091x0.75831.3960.000
Y = 13.487e−3091x0.75831.3960.000
Table 5. Evaluation of accuracy of estimation results of crude protein estimation model.
Spectral
Parameter
Regression
Equations
R2RMSE (%)Relative Error (%)Estimate R2
R’1682 (AG)Y = 17,747x + 12.550.6711.027713.80.608
Y = 4.372 − 0.001/x0.5041.152716.90.630
Y = e2.655 + 2414x0.6842.542211.40.605
Y = 14.368 × e2414x0.6841.02197.500.608
R1265 (NG)Y = 13.716 − 30,772x0.7724.473236.20.513
Y = e2.602 − 3091x0.7584.025932.00.481
Y = 13.487e − 3091x0.7584.027032.00.481
Disclaimer/Publisher’s Note: The statements, opinions and data contained in all publications are solely those of the individual author(s) and contributor(s) and not of MDPI and/or the editor(s). MDPI and/or the editor(s) disclaim responsibility for any injury to people or property resulting from any ideas, methods, instructions or products referred to in the content.

