In this section, we perform comprehensive experiments on three publicly available remote sensing target detection benchmark datasets: DIOR [
14], DOTAv1.0 [
19], and RSOD [
20]. These experiments demonstrate the superiority of the YOLO-SBA introduced in this paper and the efficacy of the three modules: Multi-Branch Attention Feature Fusion Module (MBAFF), Gated Multi-scale Attention Pyramid (GMAP), and Asymmetric Dynamic Downsampling (ADDown).
Section 4.1 presents the three datasets widly used in remote sensing object detection;
Section 4.2 outlines the evaluation criteria used for experimental validation; in
Section 4.3, we elaborate on the experimental equipment information and parameter settings; in
Section 4.4, we compare our approach with state-of-the-art target detection algorithms used in remote sensing, demonstrating that the YOLO-SBA algorithm presented in this study is at the forefront of research; in
Section 4.5, we performed ablation studies to validate the efficacy of the proposed modules; and in
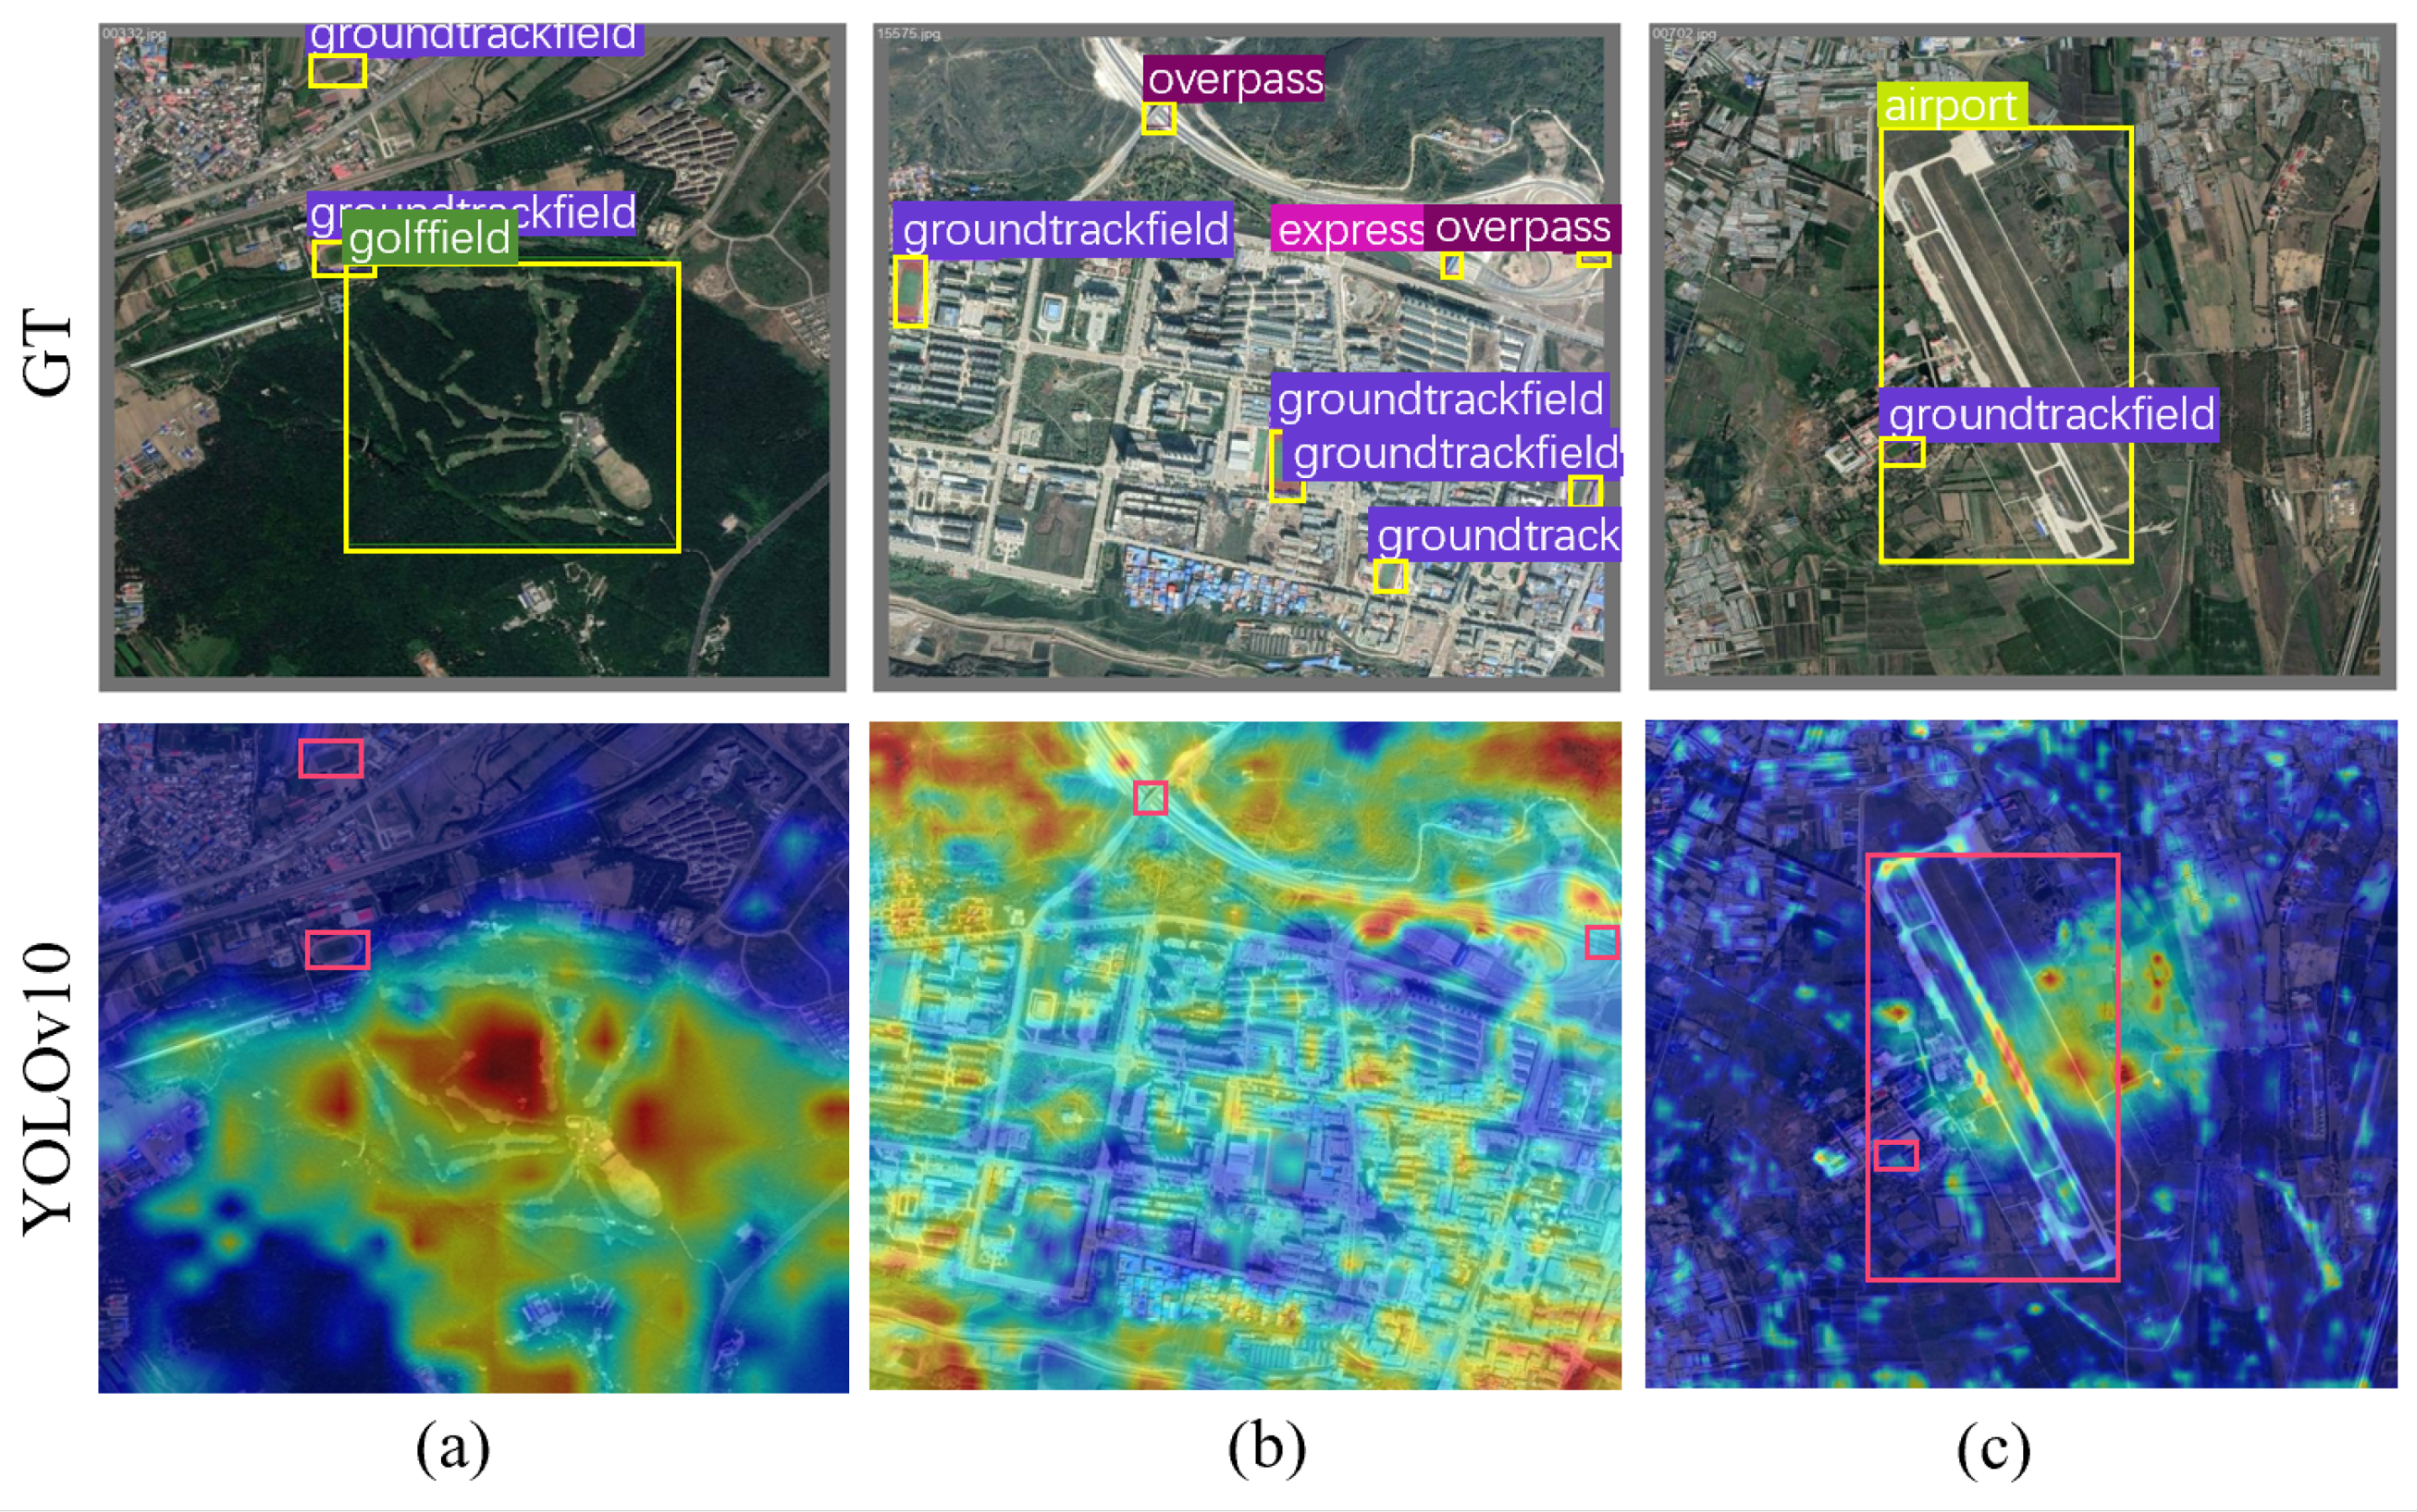
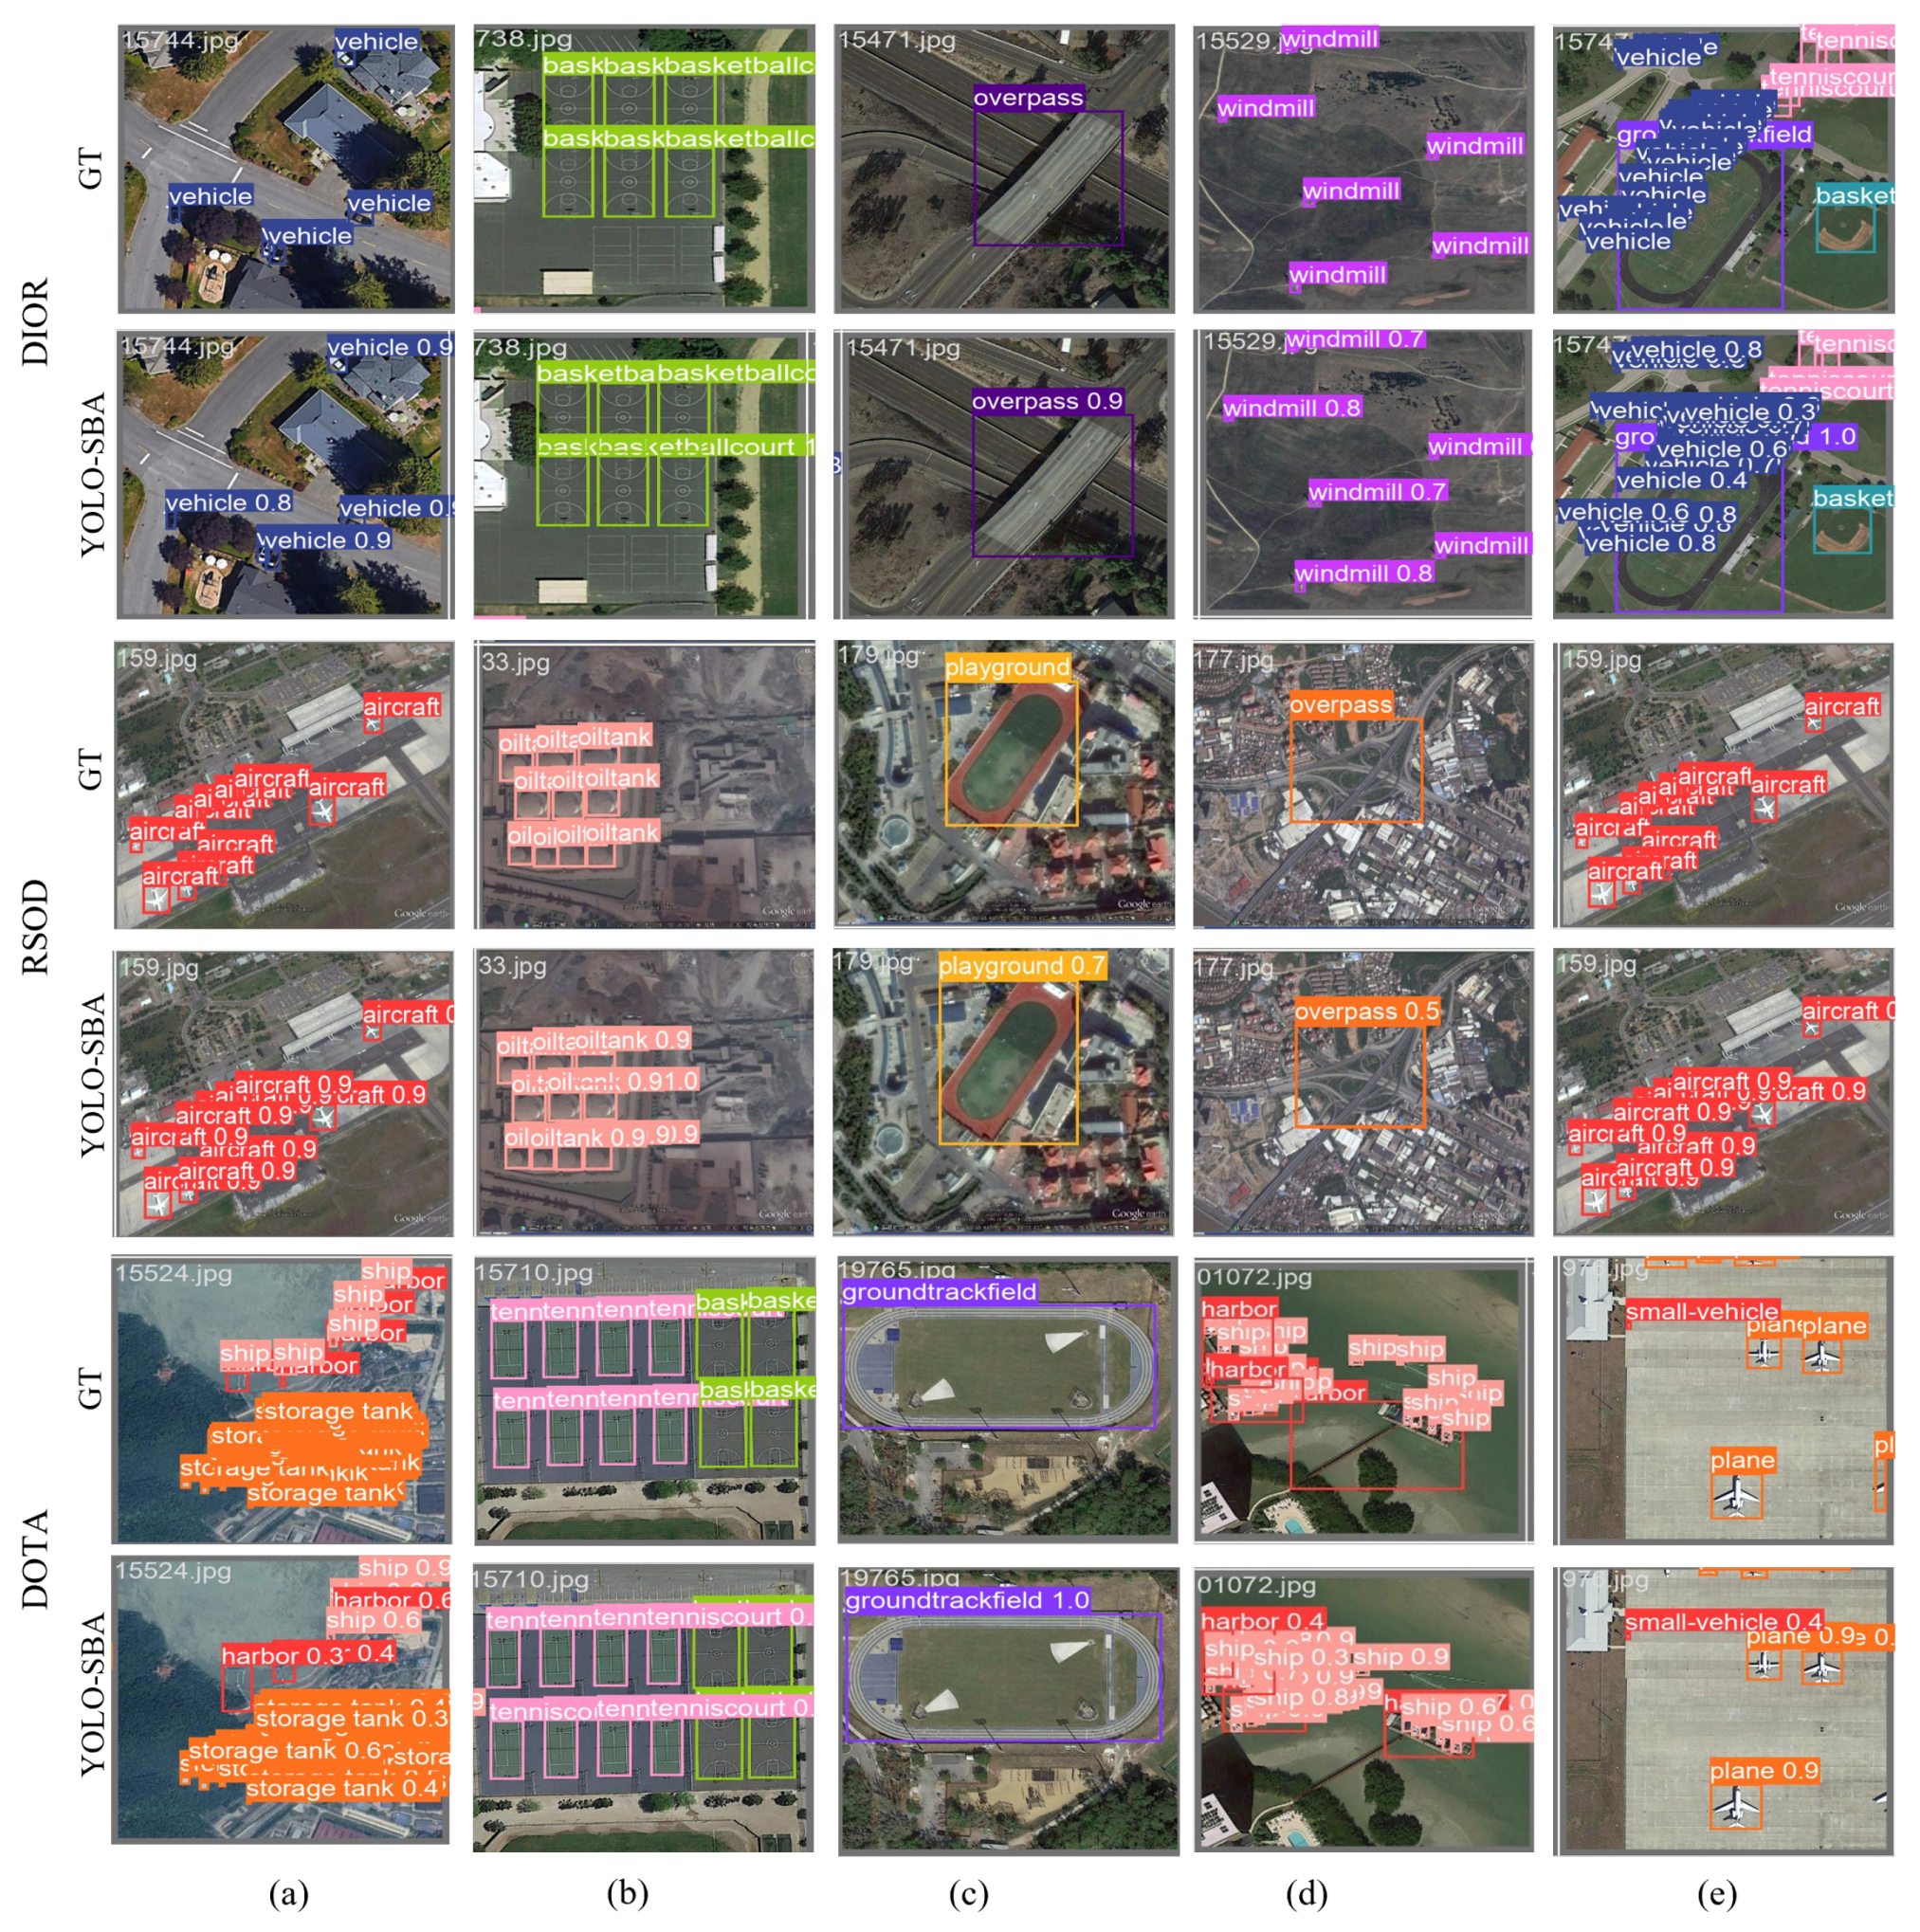
Section 4.6, we visually analyze the superiority of the algorithm and its detection capability on remote sensing images.
4.1. Datasets
This study performs experiments on three prominent remote sensing object detection datasets: DIOR [
14], DOTAv1.0 [
19], and RSOD [
20].
DIOR [14] datasets. The DIOR [
14] dataset, released by China’s Northwestern Polytechnical University in 2020, serves as a comprehensive benchmark for object detection in optical remote sensing images. It comprises 23,463 images with an 800 × 800 pixel resolution, spanning 20 categories including airplane (AL), airport (AT), baseball field (BF), basketball court (BC), bridge (B), chimney (C), dam (D), expressway service area (ESA), expressway toll station (ETS), harbor (HB), golf course (GC), ground track field (GTF), overpass (O), ship (S), stadium (SD), storage tank (ST), tennis court (TC), train station (TS), vehicle (V), and windmill (WM). The dataset includes 190,288 annotated horizontal bounding box instances across various spatial resolutions (0.5 to 30 m), encompassing urban, rural, mountainous, and coastal scenes. With its diverse categories and numerous small targets, DIOR is widely employed for assessing target detection algorithm performance.
DOTAv1.0 [19] datasets. The DOTAv1.0 [
19] dataset, released by Wuhan University in 2018, serves as a benchmark for target detection in aerial images. It includes 2806 remote sensing images with a resolution of 4000 × 4000 pixels (some varying from 800 × 800 to 20,000 × 20,000 pixels). The dataset includes 15 common target categories: Plane (PL), Baseball Diamond (BD), Bridge (BR), Ground Track Field (GTF), Small Vehicle (SV), Large Vehicle (LV), Ship (S), Tennis Court (TC), Basketball Court (BC), Storage Tank (ST), Soccer-ball Field (SBF), Roundabout (R), Harbor (HB), Swimming Pool (SP), and Helicopter (HC). It contains a total of 188,282 annotated bounding boxes. In this paper, the DOTA [
19] dataset is processed by cropping and stitching to ensure that the image resolution does not exceed 1024 × 1024. Then, 21,046 images are randomly selected from the processed dataset for experiments.
RSOD [20] datasets. The RSOD [
20] (Remote Sensing Object Detection) dataset, released by Wuhan University in 2015, functions as an open benchmark for target detection in remote sensing imagery. It includes four primary target categories: aircraft (446 images with 4993 annotations), oil tanks (165 images with 1586 annotations), playgrounds (189 images with 191 annotations), and overpasses (176 images with 180 annotations). The dataset contains a total of 976 images and 19,950 annotated instances, each with bounding box coordinates and category labels. The images have an 800 × 800 pixel resolution and depict various scenes including urban areas, suburban regions, and transportation hubs. The target sizes vary considerably, from small oil tanks around 10 pixels to large airport facilities spanning several hundred pixels.
4.4. Comparison with State-of-the-Art Algorithms
In this part, we evaluate our approach against traditional target detection methods and cutting-edge algorithms across three datasets.
Comparison on DIOR [14] dataset. On the DIOR [
14] dataset, we evaluated our approach against 18 sophisticated algorithms, as detailed in
Table 1. The YOLO-SBA algorithm introduced in this paper achieved an mAP of 89.8% on the DIOR [
14] dataset, marking a 16.6% improvement over the current leading AGMF-Net [
38] algorithm. Among the 20 categories in the DIOR [
14] dataset, we achieved the best detection accuracy in all 20 categories, respectively: 97.5% (Airplane, AL), 93.3% (Airport, AT), 96.5% (Baseball, BF), 92.1% (Basketball Court, BC), 71.2% (Bridge, B), 89.9% (Chimney, C), 85.6% (Dam, D), 96.9% (Expressway Track Field, ESA), 91.8% (Expressway Toll Station, ETS), 90% (Golf Course, GC), 93.2% (Ground Track Field, GTF), 77.9% (Harbor, HB), 76.7% (Overpass, O), 95.6% (Ship, S), 97.5% (Stadium, SD), 93.1% (Storage Tank, ST), 97.2% (Tennis Court, TC), 82.3% (Train Station, TS), 81.8% (Vehicle, V), and 96.8% (Windmill, WM).
Comparison on DOTA [19] dataset. We evaluated our approach against 18 cutting-edge algorithms on the DOTA [
19] dataset, as detailed in
Table 2. The YOLO-SBA algorithm presented in this paper achieved a mean Average Precision (mAP) of 76.14% on the DOTA [
19] dataset, demonstrating a 0.81% improvement over the current leading FSoD-Net [
43] algorithm. Among the 15 categories in the DOTA [
19] dataset, we achieved the best detection accuracy in 4 categories, respectively: 86.8% (Harbor, HB), 88.7% (Large Vehicle, LV), 65.1% (Soccer-ball field, SBF), and 95.6% (Tennis Court, TC).
Table 1.
Comparison with state-of-the-art algorithms on the DIOR [
14] dataset. The metric is mAP(%), and the bold values denote the top performance, while blue values signify the second-best results.
Table 1.
Comparison with state-of-the-art algorithms on the DIOR [
14] dataset. The metric is mAP(%), and the bold values denote the top performance, while blue values signify the second-best results.
| Method | mAP | AL | AT | BF | BC | B | C | D | ESA | ETS | GC | GTF | HB | O | S | SD | ST | TC | TS | V | WM |
|---|
| YOLT [44] | 60.3 | 64.7 | 69.0 | 32.8 | 87.8 | 32.3 | 71.5 | 45.8 | 54.9 | 55.8 | 65.6 | 66.3 | 49.9 | 49.9 | 87.7 | 30.3 | 73.3 | 82.0 | 29.9 | 52.4 | 74.0 |
| Faster-RCNN [45] | 53.6 | 51.4 | 61.6 | 62.2 | 80.7 | 27.0 | 74.2 | 37.3 | 53.4 | 45.1 | 69.6 | 61.8 | 43.7 | 49.0 | 56.1 | 41.8 | 39.6 | 73.9 | 44.7 | 34.0 | 65.3 |
| Cascade R-CNN [46] | 67.4 | 81.2 | 81.4 | 90.1 | 81.1 | 46.9 | 81.5 | 68.1 | 84.2 | 65.3 | 74.5 | 81.6 | 37.8 | 60.4 | 68.9 | 88.8 | 60.5 | 81.0 | 57.5 | 47.7 | 80.7 |
| HSF-Net [47] | 54.9 | 51.0 | 62.1 | 60.2 | 80.7 | 27.4 | 72.8 | 43.8 | 52.1 | 45.2 | 67.5 | 58.7 | 34.0 | 48.9 | 70.8 | 45.5 | 53.5 | 72.9 | 46.8 | 37.4 | 67.0 |
| SSD [42] | 60.9 | 92.9 | 48.3 | 77.9 | 77.2 | 35.7 | 66.6 | 46.5 | 47.9 | 58.5 | 37.3 | 53.7 | 47.9 | 39.9 | 59.6 | 77.5 | 80.8 | 88.3 | 55.6 | 38.8 | 86.7 |
| YOLOv3 [5] | 59.9 | 67.5 | 54.7 | 65.8 | 86.8 | 34.2 | 73.5 | 34.3 | 55.7 | 49.6 | 67.3 | 68.9 | 54.3 | 51.7 | 86.8 | 40.3 | 67.8 | 83.9 | 32.3 | 49.1 | 73.6 |
| YOLOv4 [7] | 65.9 | 78.3 | 69.7 | 69.6 | 88.3 | 38.7 | 76.9 | 48.6 | 57.6 | 57.9 | 74.1 | 70.6 | 52.8 | 56.8 | 89.4 | 50.4 | 77.5 | 83.3 | 46.0 | 55.7 | 75.9 |
| RFB-Net [48] | 62.6 | 93.8 | 48.3 | 80.2 | 77.7 | 40.7 | 67.5 | 47.4 | 48.5 | 70.0 | 37.3 | 54.9 | 48.2 | 43.1 | 66.1 | 78.0 | 80.0 | 89.1 | 55.6 | 40.4 | 88.3 |
| RetinaNet [49] | 65.2 | 63.4 | 47.8 | 83.3 | 78.4 | 48.2 | 67.9 | 49.4 | 53.2 | 73.6 | 66.3 | 59.1 | 47.6 | 45.7 | 72.0 | 82.4 | 80.7 | 90.1 | 55.0 | 47.7 | 92.9 |
| CenterNet [50] | 61.6 | 64.0 | 66.3 | 65.7 | 86.3 | 34.8 | 73.1 | 41.1 | 60.8 | 54.2 | 73.0 | 66.0 | 45.3 | 53.3 | 81.3 | 53.5 | 63.7 | 80.9 | 44.1 | 46.3 | 78.8 |
| EfficientDet D0 [51] | 59.9 | 91.9 | 47.3 | 79.2 | 76.0 | 36.0 | 66.5 | 46.8 | 65.6 | 47.5 | 37.0 | 53.3 | 45.8 | 39.8 | 54.9 | 77.2 | 76.3 | 87.3 | 54.4 | 31.9 | 85.1 |
| EfficientDet D2 [51] | 61.5 | 72.5 | 66.2 | 64.3 | 87.0 | 33.2 | 74.0 | 43.1 | 71.8 | 54.3 | 55.6 | 52.7 | 37.4 | 47.0 | 86.1 | 66.8 | 70.9 | 81.1 | 50.2 | 43.3 | 73.0 |
| EfficientDet D4 [51] | 66.1 | 86.5 | 57.4 | 75.7 | 85.2 | 33.5 | 75.4 | 65.6 | 80.1 | 67.4 | 58.3 | 71.4 | 35.6 | 50.6 | 78.8 | 90.3 | 61.8 | 82.9 | 54.6 | 30.0 | 81.5 |
| S3FD [52] | 54.7 | 71.7 | 46.3 | 72.7 | 75.5 | 31.0 | 71.9 | 47.9 | 51.7 | 49.6 | 67.2 | 70.9 | 23.0 | 45.1 | 44.3 | 61.3 | 43.9 | 80.0 | 30.0 | 34.3 | 74.8 |
| M2Det [53] | 57.6 | 63.3 | 67.6 | 71.1 | 80.2 | 32.1 | 72.5 | 58.0 | 62.3 | 52.5 | 69.8 | 63.5 | 41.3 | 52.0 | 35.9 | 66.3 | 35.9 | 72.2 | 52.4 | 25.0 | 78.3 |
| FSoD-Net [43] | 71.8 | 88.9 | 66.9 | 86.8 | 90.2 | 45.5 | 79.6 | 48.2 | 86.9 | 75.5 | 67.0 | 77.3 | 53.6 | 59.7 | 78.3 | 69.9 | 75.0 | 91.4 | 52.3 | 52.0 | 90.6 |
| TMAPNet [33] | 72.9 | 92.2 | 77.7 | 75.0 | 91.3 | 47.1 | 78.6 | 53.6 | 67.1 | 66.2 | 78.5 | 76.3 | 64.9 | 61.4 | 90.5 | 72.2 | 75.4 | 90.7 | 62.1 | 55.2 | 83.2 |
| AGMF-Net [38] | 73.2 | 90.9 | 72.8 | 79.3 | 89.7 | 44.7 | 81.4 | 59.3 | 66.0 | 62.7 | 73.8 | 79.2 | 65.0 | 61.7 | 91.7 | 78.6 | 75.8 | 90.7 | 60.0 | 58.0 | 83.1 |
| YOLO-SBA (ours) | 89.8 | 97.5 | 93.3 | 96.5 | 92.1 | 71.2 | 89.9 | 85.6 | 96.9 | 91.8 | 90.0 | 93.2 | 77.9 | 76.7 | 95.6 | 97.5 | 93.1 | 97.2 | 82.3 | 81.8 | 96.8 |
Table 2.
Comparison with state-of-the-art algorithms on the DOTA [
19] dataset. The metric is mAP(%), and the bold values denote the top performance, while blue values signify the second-best results.
Table 2.
Comparison with state-of-the-art algorithms on the DOTA [
19] dataset. The metric is mAP(%), and the bold values denote the top performance, while blue values signify the second-best results.
| Method | mAP | BD | BC | B | GTF | HB | H | LV | P | R | S | SV | SBF | ST | SP | TC |
|---|
| YOLT [44] | 61.44 | 60.5 | 70.93 | 22.09 | 37.54 | 56.58 | 22.16 | 70.48 | 87.20 | 57.62 | 84.43 | 70.75 | 52.70 | 78.96 | 55.76 | 93.94 |
| Faster-RCNN [45] | 56.13 | 63.70 | 50.10 | 29.60 | 54.86 | 65.71 | 48.37 | 62.59 | 76.15 | 40.91 | 67.7 | 28.59 | 55.84 | 67.33 | 43.64 | 86.89 |
| HSF-Net [47] | 62.36 | 69.88 | 69.40 | 37.70 | 57.98 | 66.84 | 41.78 | 64.24 | 79.96 | 52.81 | 71.84 | 66.76 | 47.47 | 61.79 | 59.15 | 87.87 |
| SSD [42] | 50.19 | 32.83 | 39.40 | 23.02 | 38.82 | 65.21 | 22.16 | 62.84 | 85.37 | 34.83 | 52.31 | 33.44 | 52.29 | 67.33 | 55.73 | 87.30 |
| YOLOv3 [5] | 65.67 | 68.78 | 66.82 | 45.93 | 51.92 | 74.03 | 56.68 | 60.67 | 93.91 | 45.01 | 85.56 | 50.12 | 52.45 | 83.47 | 55.85 | 93.88 |
| YOLOv4 [7] | 67.97 | 72.82 | 60.04 | 70.00 | 72.27 | 64.53 | 60.21 | 67.39 | 77.09 | 79.29 | 78.97 | 49.76 | 61.45 | 60.96 | 60.97 | 83.81 |
| RFB-Net [48] | 64.03 | 49.76 | 63.83 | 35.74 | 36.35 | 63.21 | 20.53 | 77.53 | 87.75 | 67.93 | 90.05 | 78.00 | 33.57 | 89.54 | 72.78 | 93.84 |
| RetinaNet [49] | 63.27 | 68.17 | 62.33 | 65.96 | 76.22 | 65.96 | 48.50 | 62.78 | 72.99 | 80.90 | 68.59 | 25.51 | 57.78 | 51.31 | 57.81 | 84.20 |
| CenterNet [50] | 73.94 | 78.56 | 66.11 | 45.39 | 53.39 | 78.86 | 66.82 | 80.24 | 97.37 | 69.02 | 90.30 | 62.16 | 64.86 | 85.75 | 75.63 | 94.58 |
| EfficientDet D0 [51] | 61.96 | 64.63 | 64.63 | 44.22 | 72.25 | 51.14 | 55.05 | 52.39 | 93.09 | 42.74 | 81.57 | 38.87 | 52.12 | 78.27 | 44.54 | 92.18 |
| EfficientDet D2 [51] | 68.61 | 73.60 | 60.51 | 72.14 | 74.62 | 64.57 | 60.50 | 67.38 | 77.37 | 80.28 | 78.64 | 50.46 | 61.82 | 61.59 | 62.11 | 83.58 |
| EfficientDet D4 [51] | 70.72 | 72.23 | 64.01 | 73.26 | 73.23 | 65.35 | 62.02 | 63.15 | 93.27 | 79.94 | 85.61 | 59.70 | 40.92 | 75.94 | 59.56 | 92.66 |
| S3FD [52] | 30.22 | 30.60 | 36.43 | 23.71 | 25.12 | 33.91 | 9.11 | 26.92 | 36.33 | 16.51 | 27.01 | 25.11 | 28.52 | 27.20 | 26.23 | 81.01 |
| M2Det [53] | 34.48 | 59.34 | 43.91 | 27.42 | 40.63 | 35.22 | 18.21 | 26.91 | 36.13 | 49.84 | 18.11 | 9.11 | 35.32 | 27.33 | 17.31 | 72.70 |
| ICN [54] | 68.16 | 74.30 | 79.06 | 47.70 | 70.32 | 67.02 | 50.23 | 67.82 | 81.36 | 62.90 | 69.98 | 64.89 | 53.64 | 78.2 | 64.17 | 90.76 |
| Rol Transformer [55] | 69.56 | 78.52 | 77.27 | 43.44 | 75.92 | 62.83 | 47.67 | 73.68 | 88.64 | 53.54 | 83.59 | 68.81 | 58.39 | 81.46 | 58.93 | 90.74 |
| Rotated-YOLOX [56] | 66.32 | 65.17 | 76.58 | 45.24 | 54.97 | 56.03 | 44.88 | 72.71 | 88.78 | 57.88 | 79.60 | 72.97 | 41.36 | 82.23 | 65.23 | 90.87 |
| FSoD-Net [43] | 75.33 | 71.13 | 78.93 | 51.34 | 57.46 | 71.34 | 64.86 | 82.15 | 93.11 | 70.64 | 92.39 | 78.18 | 53.32 | 93.48 | 78.69 | 92.87 |
| YOLO-SBA (ours) | 76.14 | 75.40 | 68.50 | 52.40 | 67.80 | 86.80 | 66.40 | 88.70 | 95.90 | 65.40 | 90.80 | 74.40 | 65.10 | 83.00 | 65.90 | 95.60 |
Comparison on RSOD [20] dataset. On the RSOD [
20] dataset, we evaluated our method against eight sophisticated algorithms, as detailed in
Table 3. The YOLO-SBA algorithm introduced in this study achieved an mAP of 94.7% on the RSOD [
20] dataset, representing a 0.4% improvement over the current leading AGMF-Net [
38] algorithm. In the RSOD [
20] dataset, across its 4 categories, we obtained the top detection accuracy of 97.56% for the Aircraft class.
4.5. Ablation Study
To demonstrate the efficacy of the YOLO-SBA algorithm introduced in this paper, as well as the MBAFF module, GMAP module, and ADDown module, this section showcases three ablation experiments performed on the DIOR [
14], DOTA [
19], and RSOD [
20] datasets. The results are presented in
Table 4,
Table 5,
Table 6,
Table 7,
Table 8 and
Table 9. Specifically,
Table 4,
Table 5 and
Table 6 present the comparison of the YOLO-SBA or modules with the baseline in terms of mAP and detection accuracy for each category on each dataset.
Table 7,
Table 8 and
Table 9 display the APs, APm, and APl values for each dataset, comparing the proposed algorithm or modules with the baseline. These comparisons offer a more precise evaluation of the individual impacts of the modules and the overall effectiveness of the algorithm.
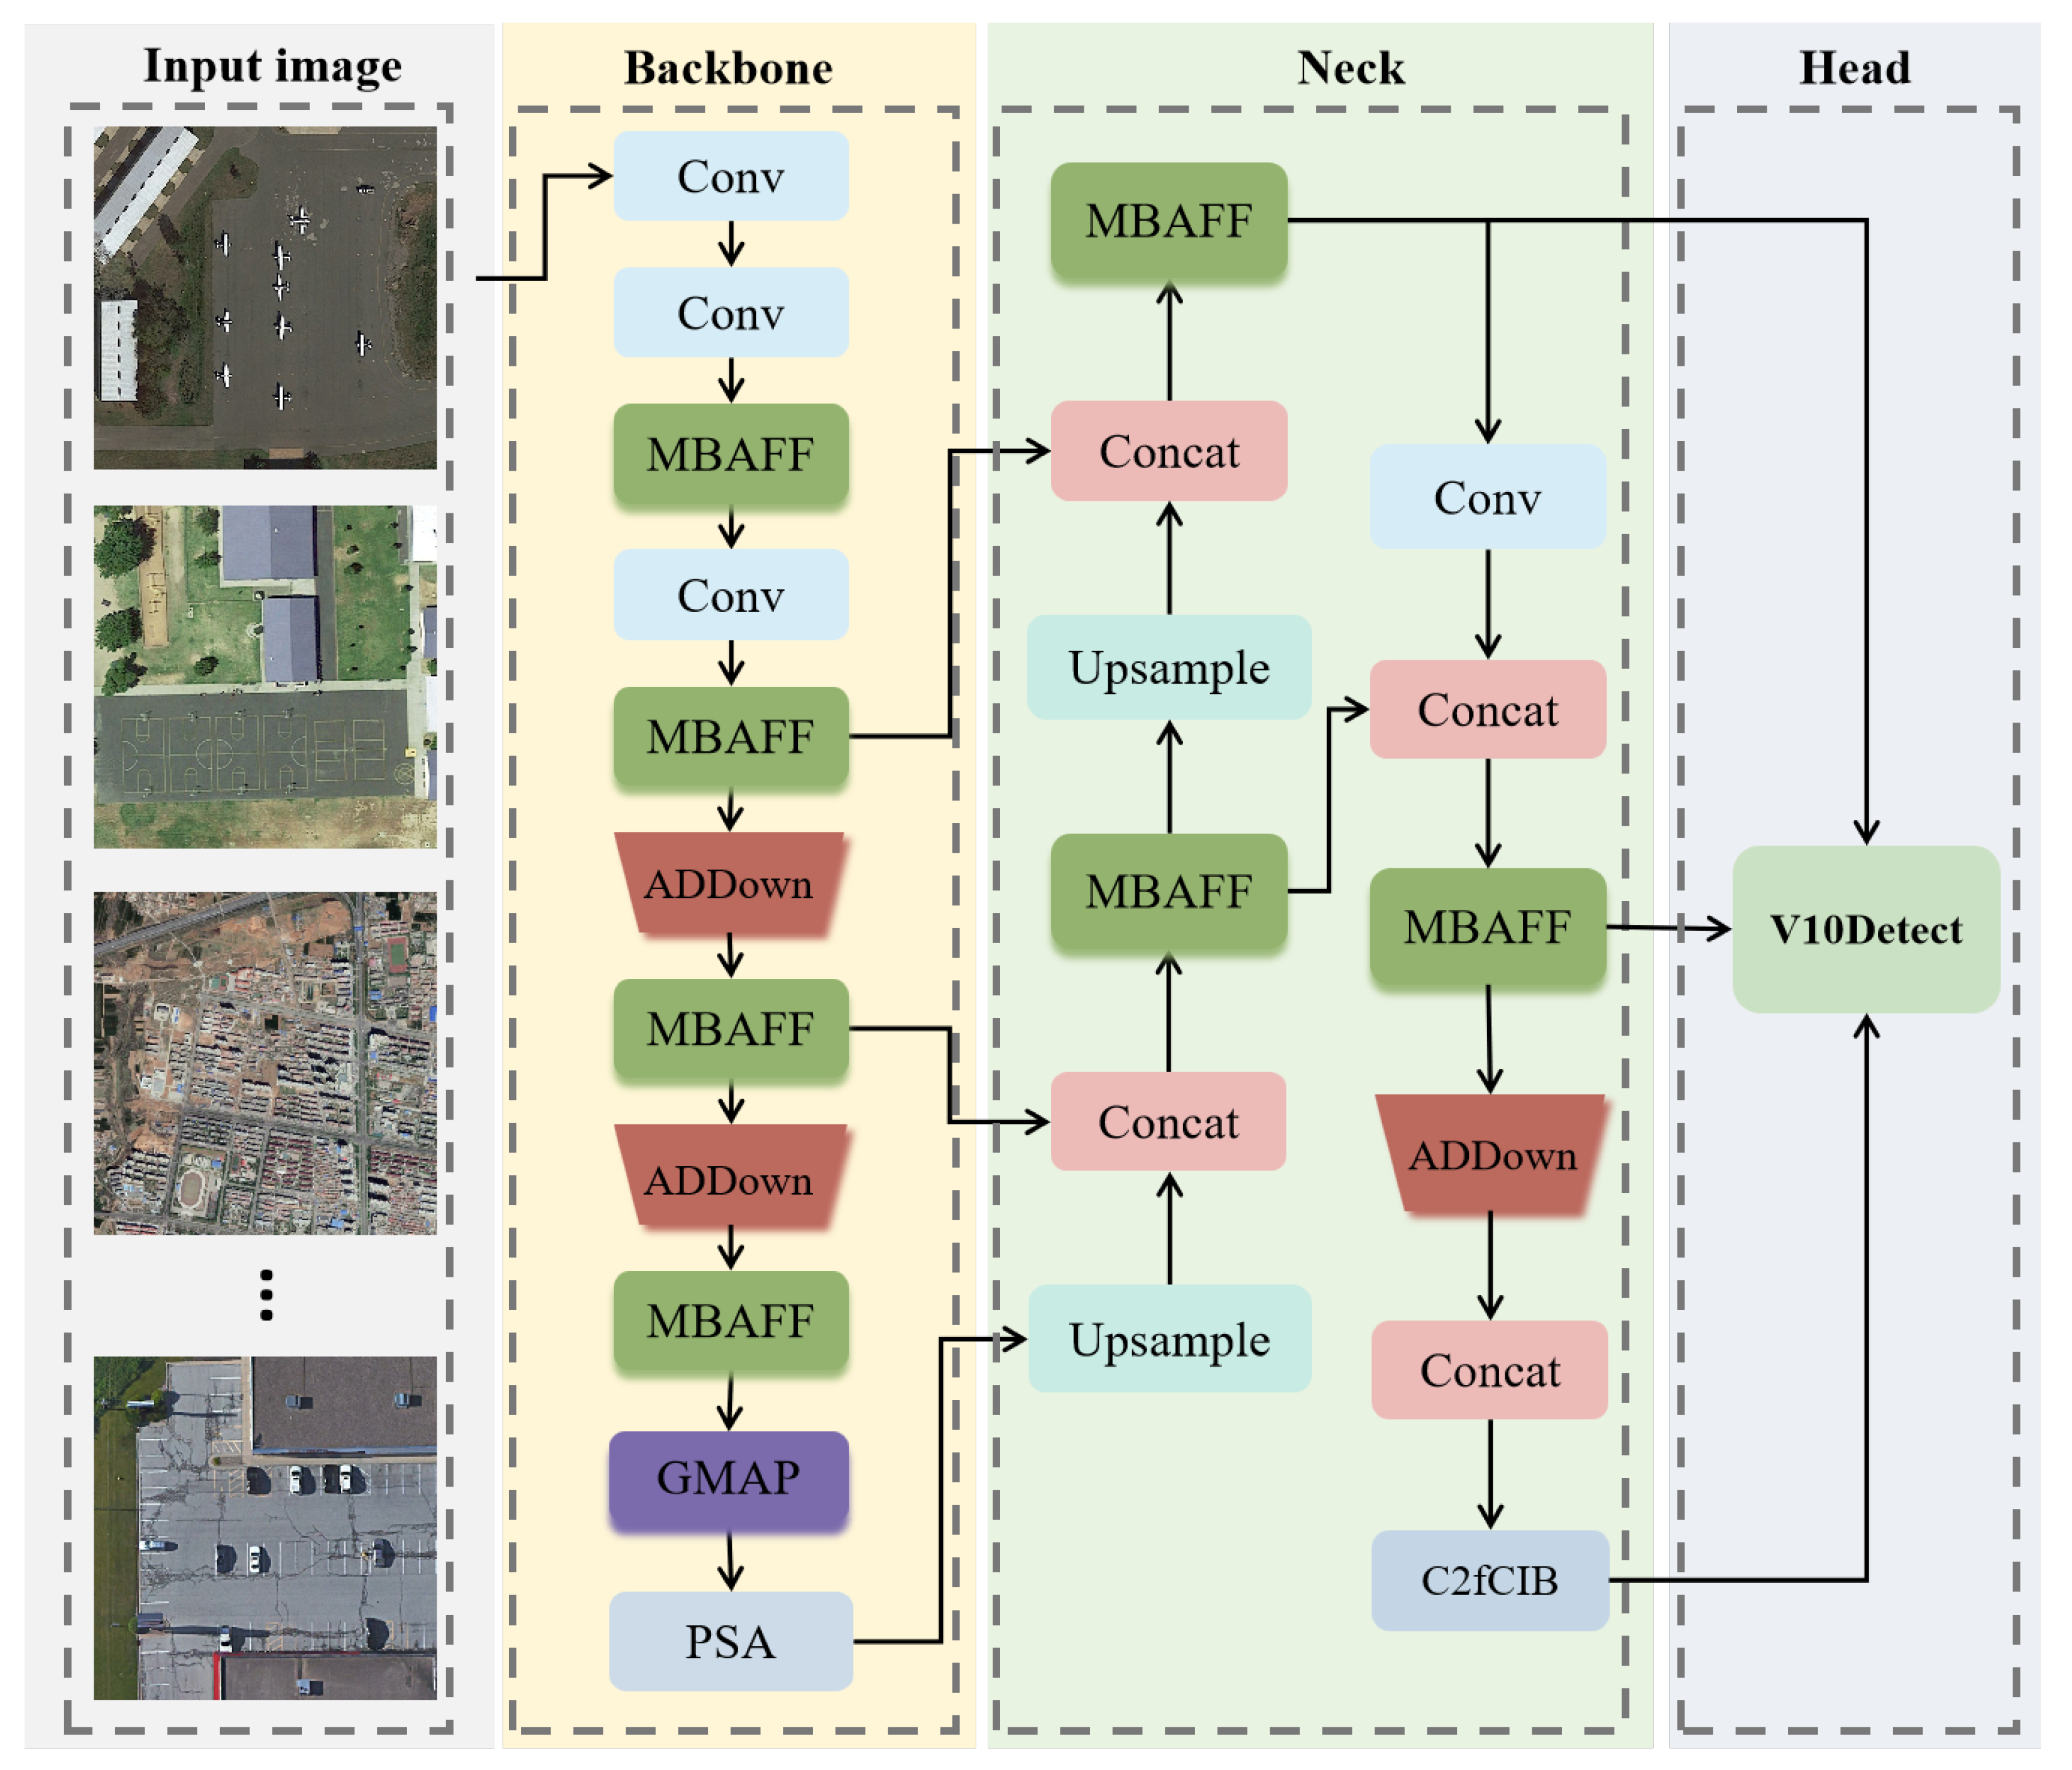
Baseline: The baseline for this section is YOLOv10 [
6], which extracts features from remote sensing images using an enhanced version of CSPNet [
62]. Subsequently, it employs SPPF and PSA for feature integration and augmentation. Ultimately, the refined feature maps are fed into the detection head to complete the object detection task. The baseline achieves mAP values of 85.9%, 72.00%, and 88.6% on the DIOR [
14], DOTA [
19], and RSOD [
20] datasets, respectively.
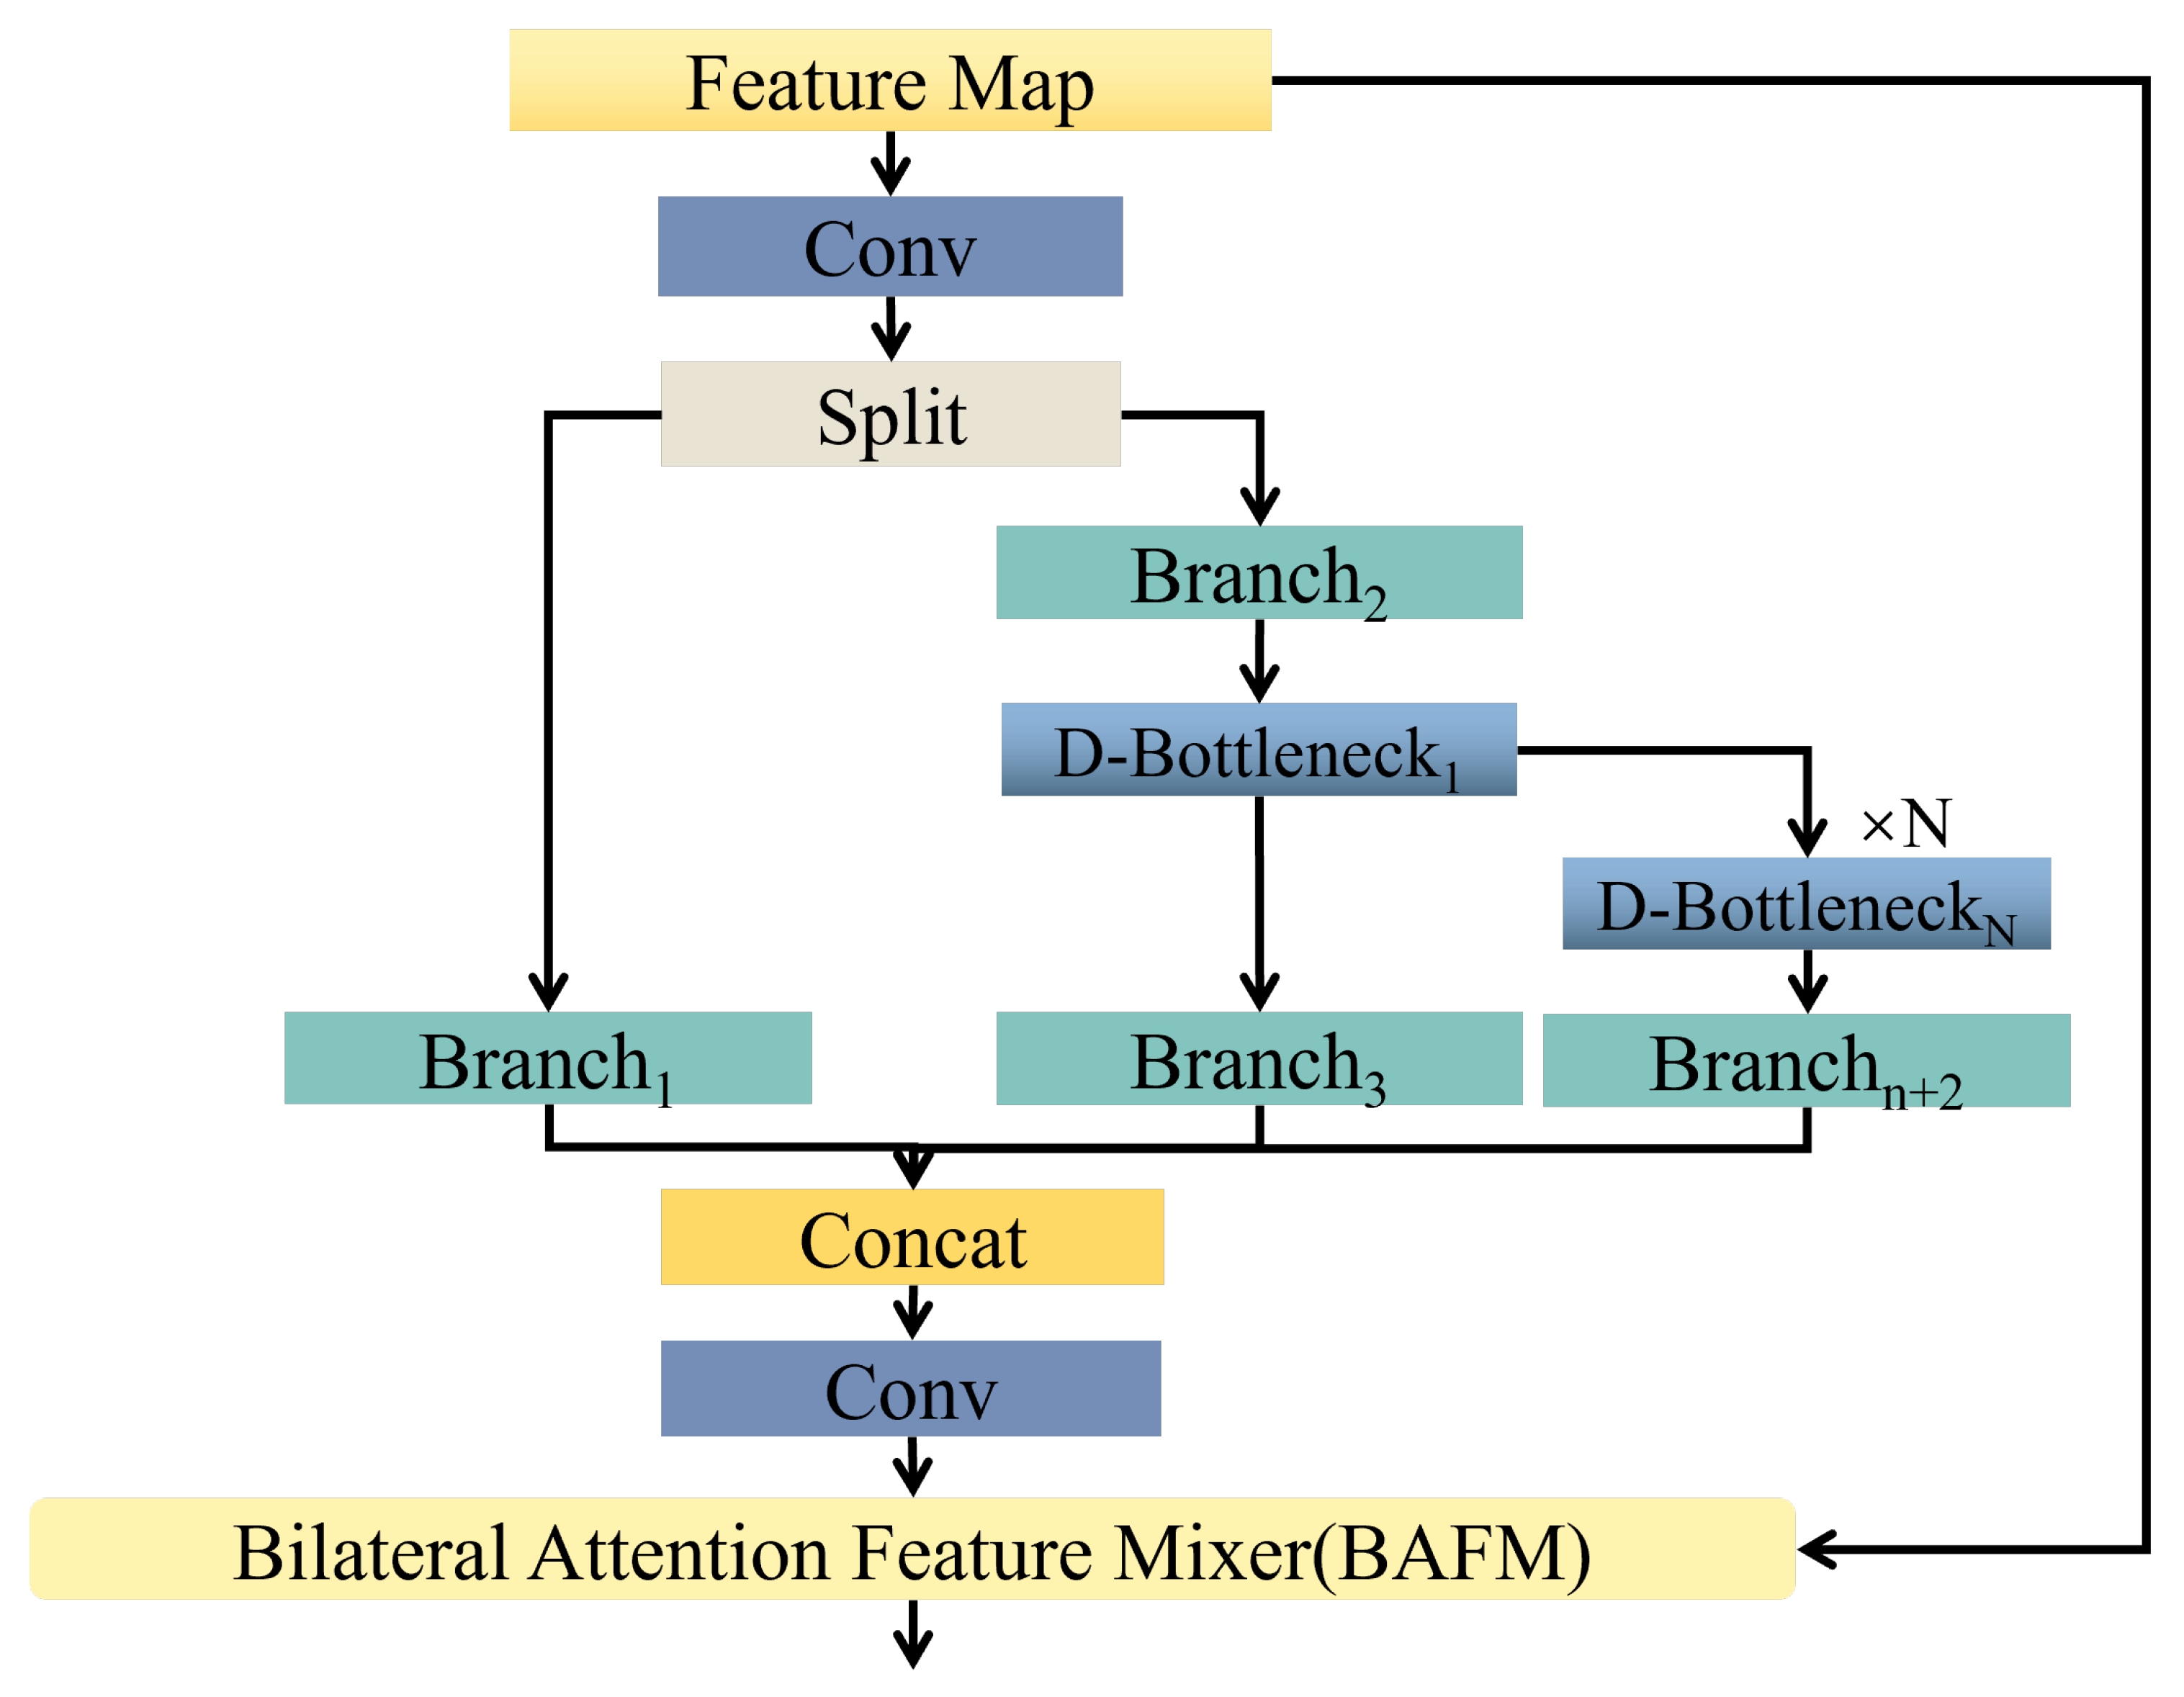
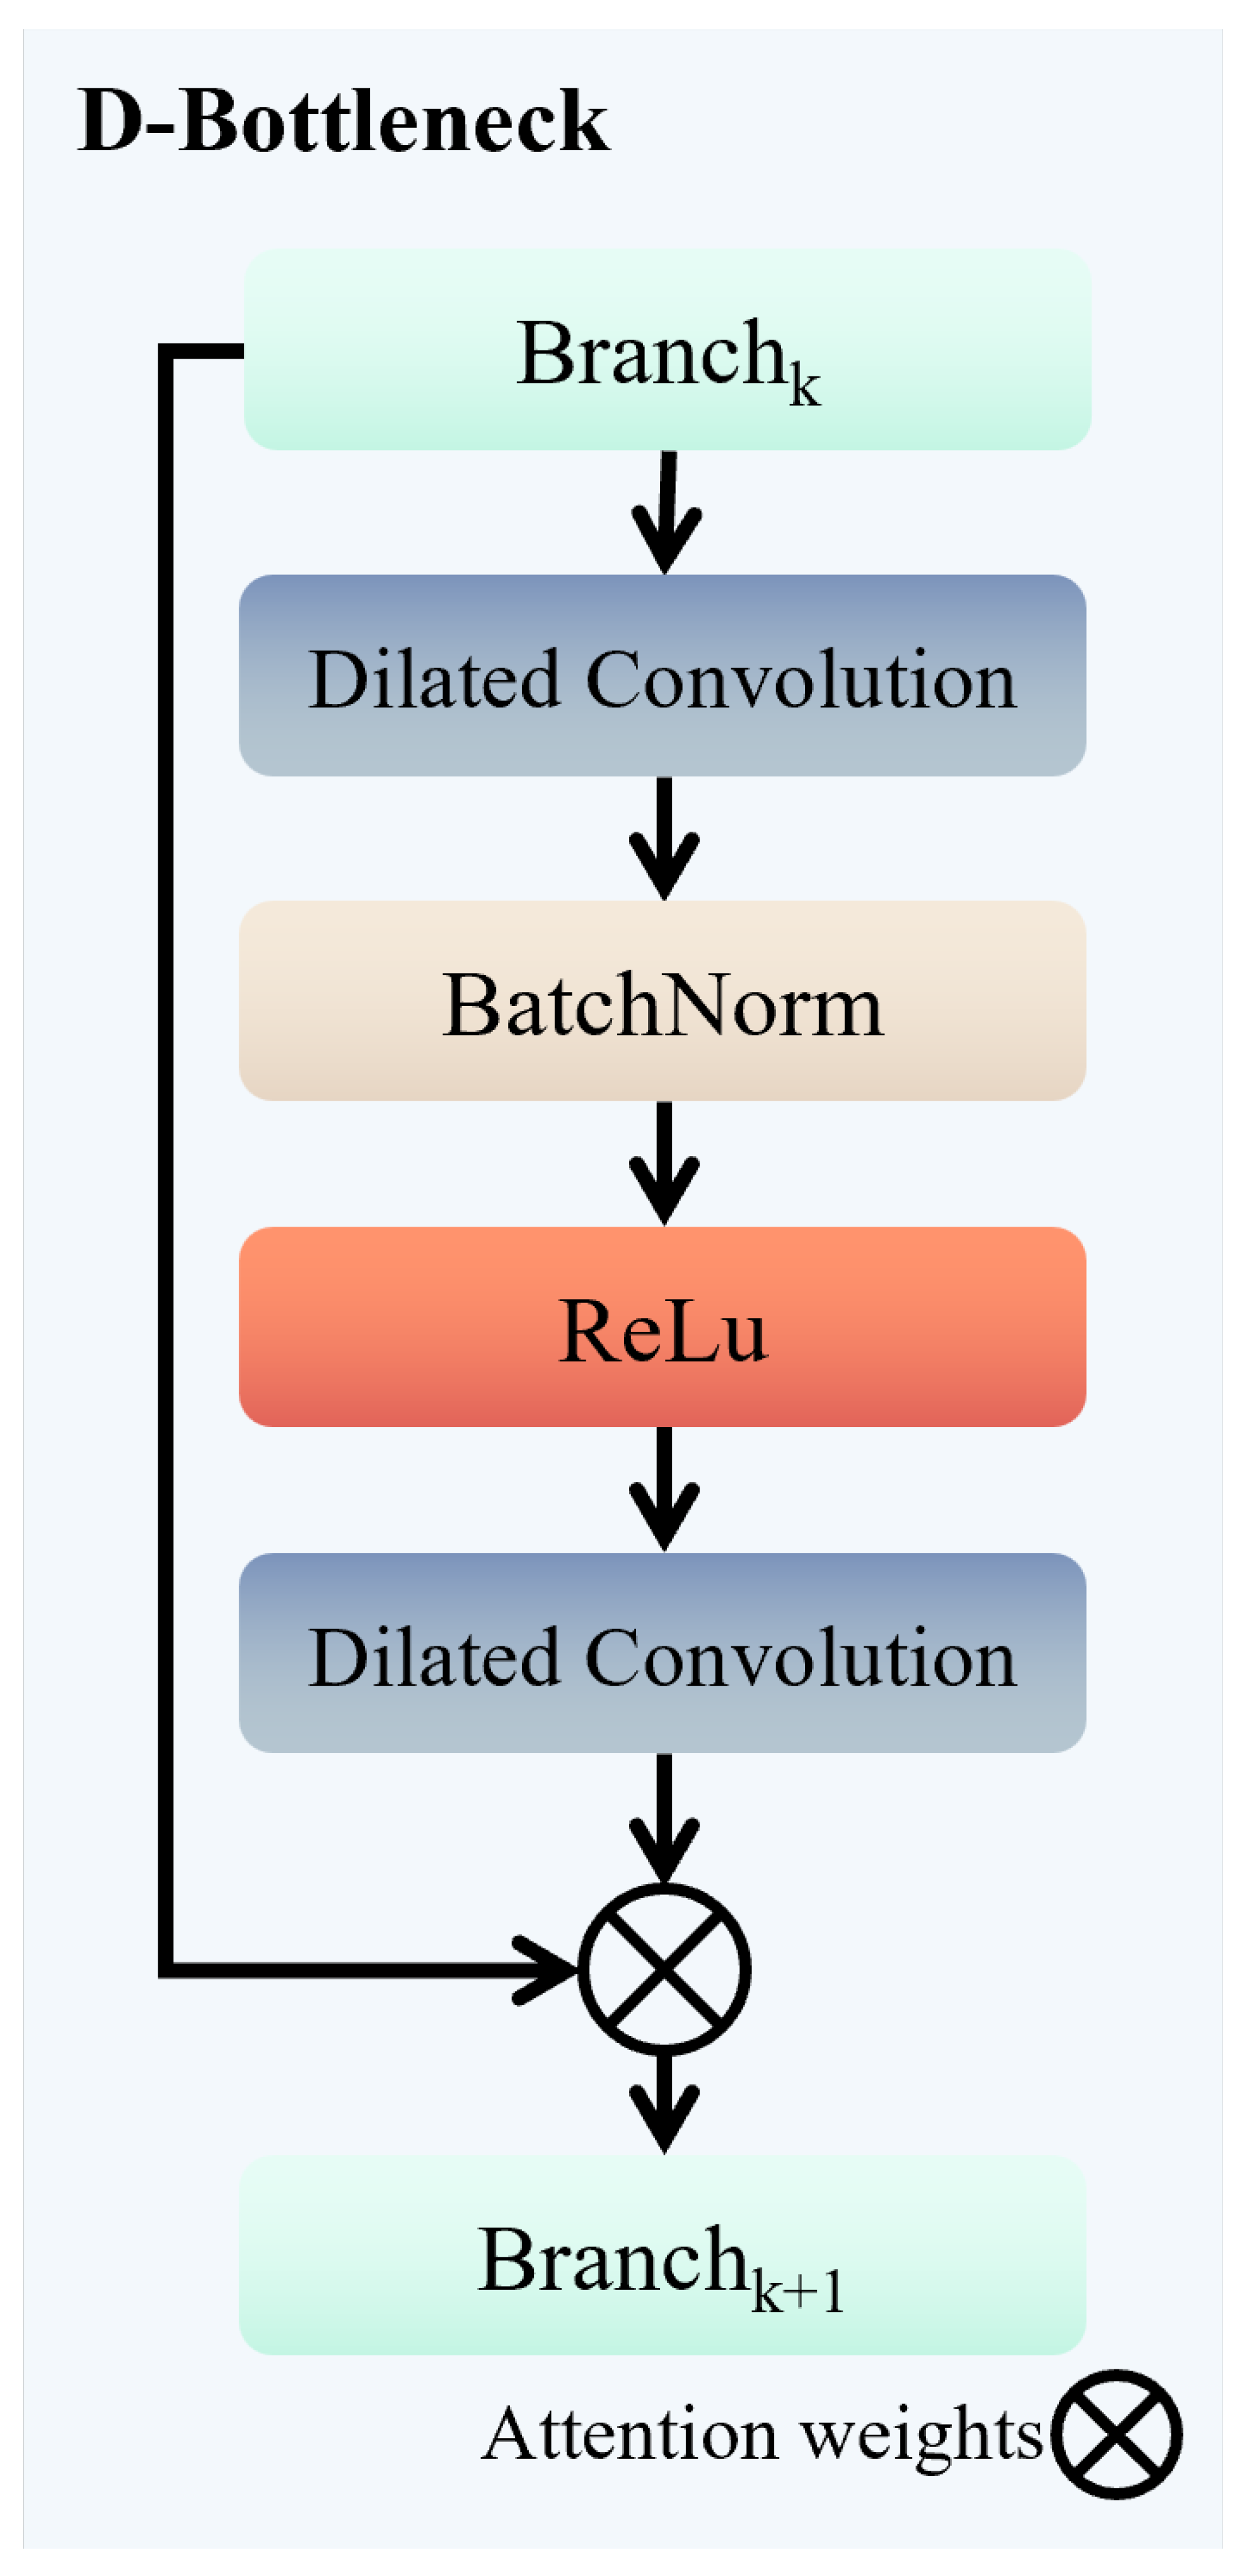
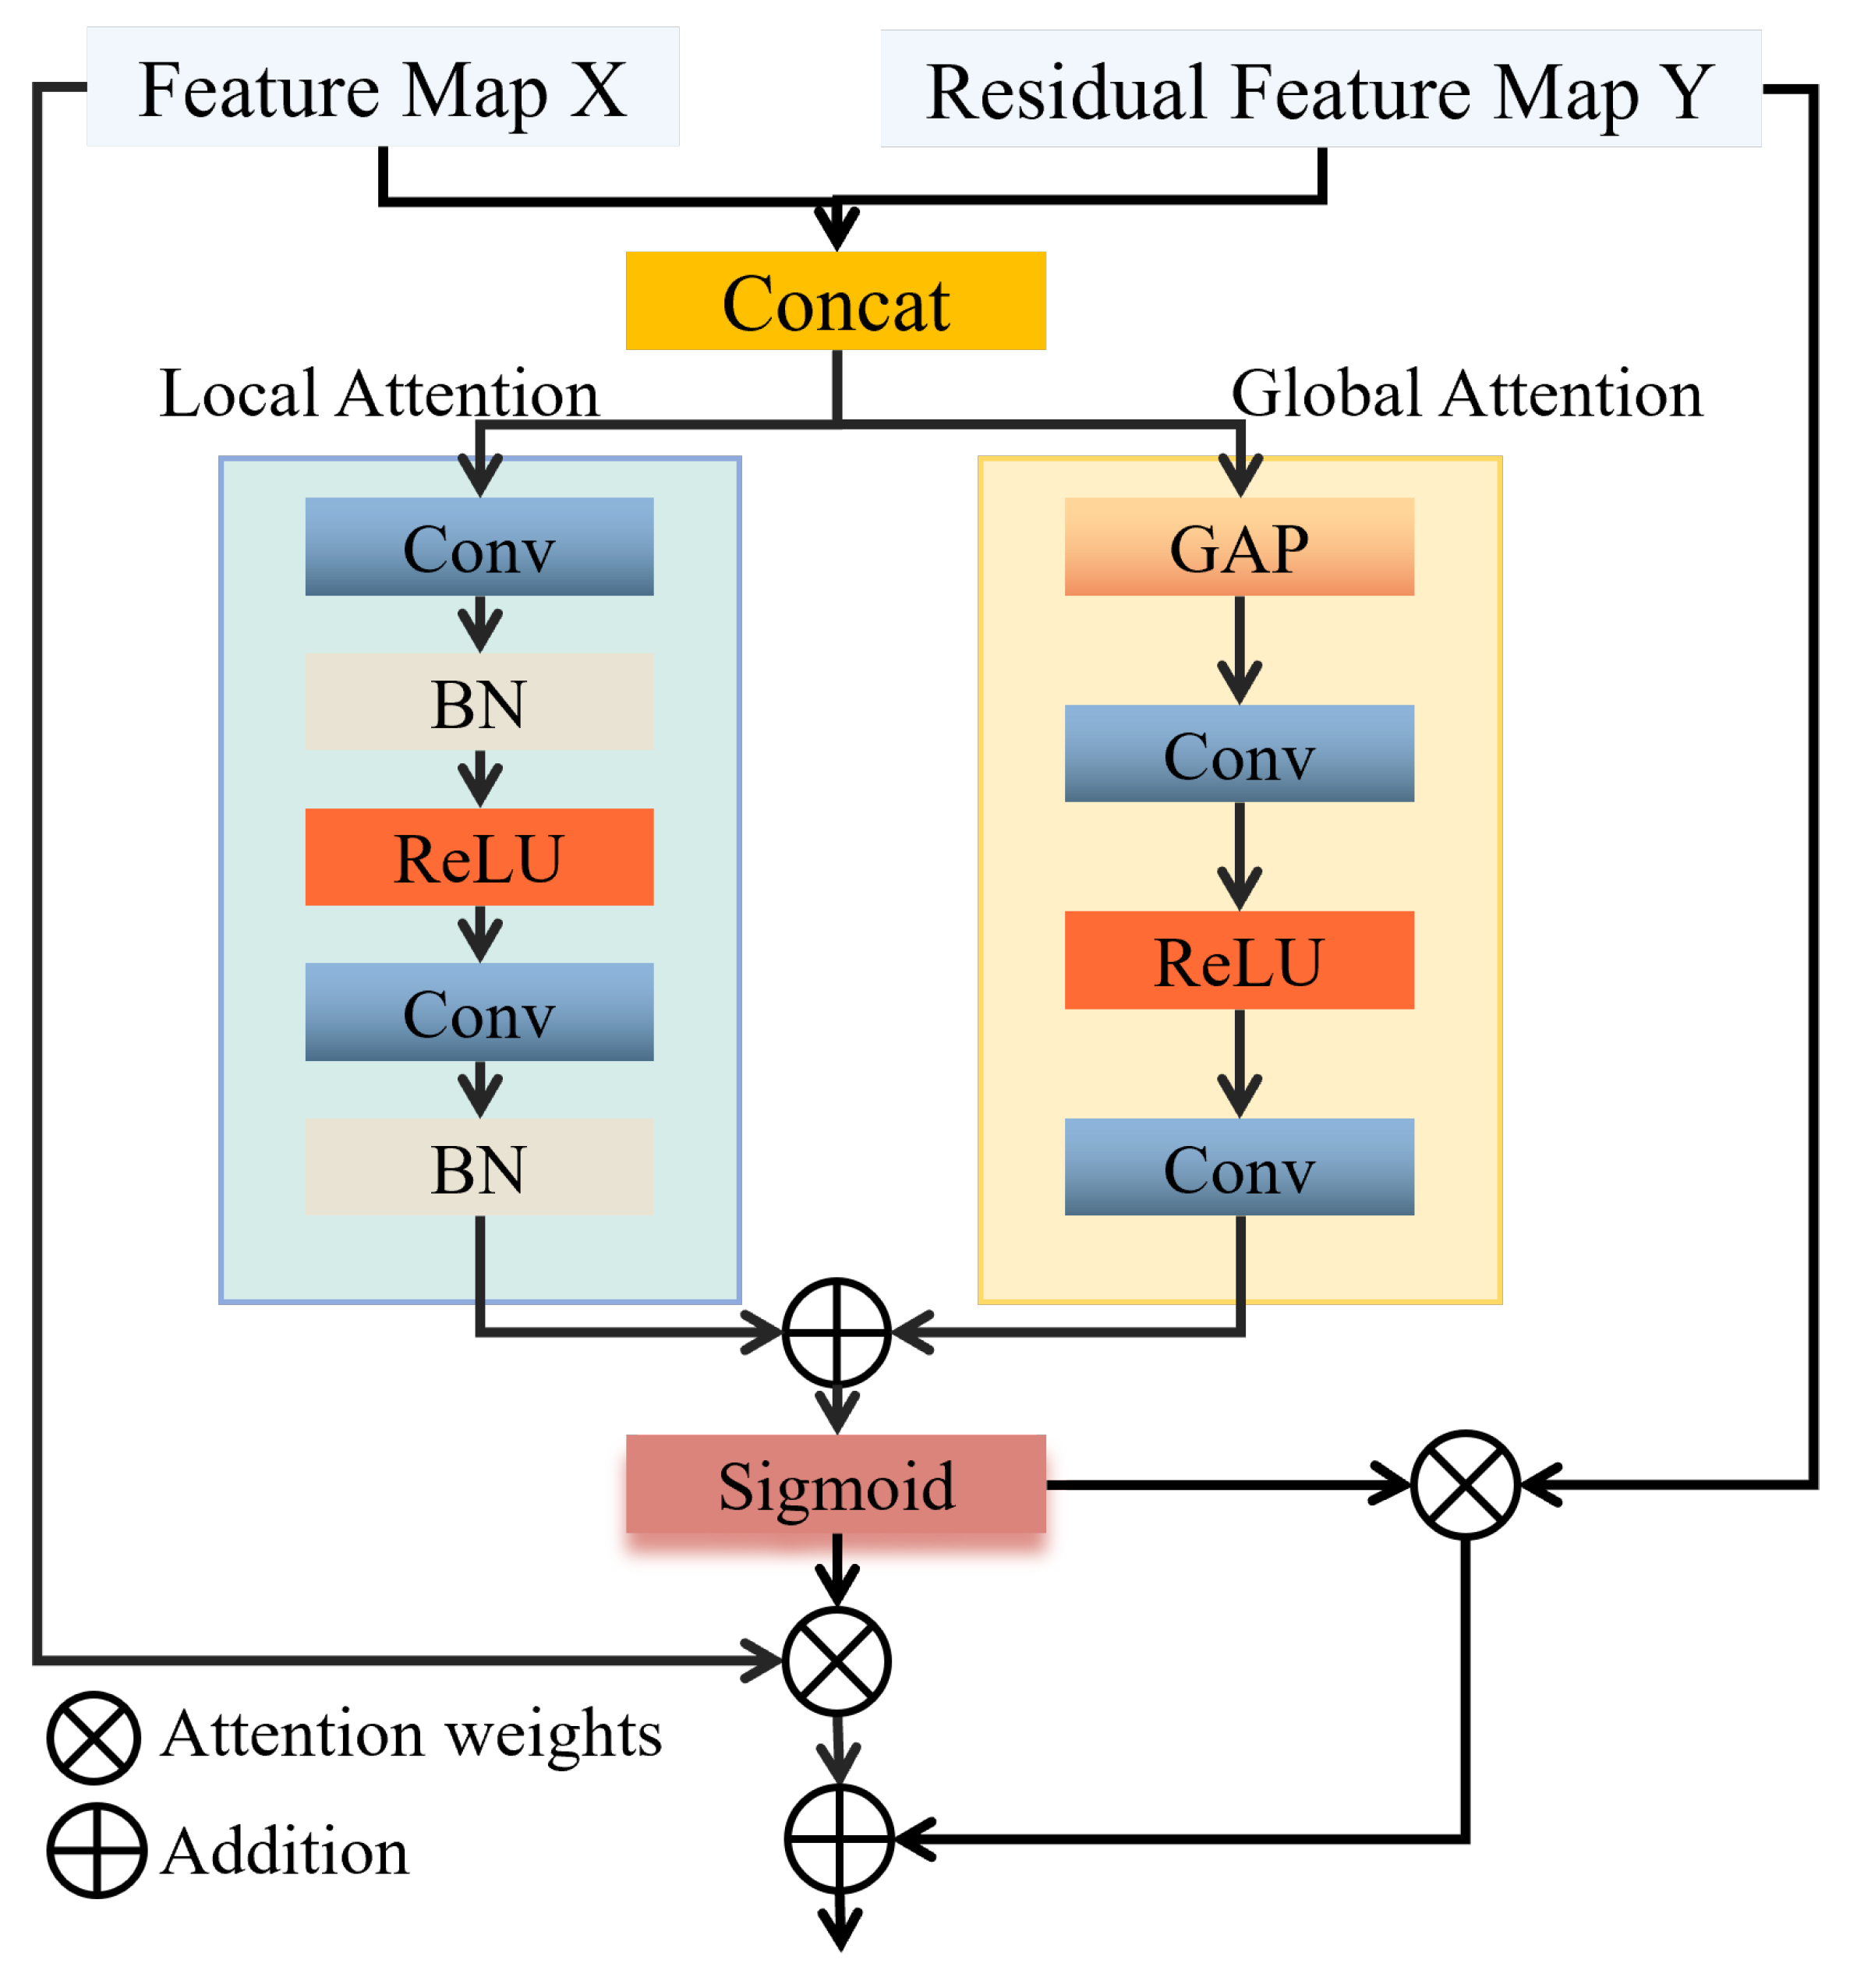
MBAFF: The MBAFF module captures local details and global semantic information through a multi-branch structure with differentiated receptive fields. It also implements adaptive feature enhancement through a dual-channel attention mechanism, strengthening the feature response of targets with multi-scale variations. As shown in
Table 4,
Table 5 and
Table 6, after adding the MBAFF module, the model’s mAP value increased by 2.5%, 3.0%, and 4.7% on the DIOR [
14], DOTA [
19], and RSOD [
20] datasets, respectively. In the evaluation of single-category target detection, the single-category AP value on the DIOR [
14] dataset increased by 0.35–7.17%, as shown in
Table 4, fully demonstrating the module’s capability to handle target detection at different scales. From
Table 4,
Table 5,
Table 6,
Table 7,
Table 8 and
Table 9, we can see that after adding the MBAFF module, both APl and mAP values showed significant improvements, with APl and mAP increasing by 2.5–4.7% on the three datasets. On the RSOD [
20] dataset, the AP value for the overpass category increased by 16.20%.
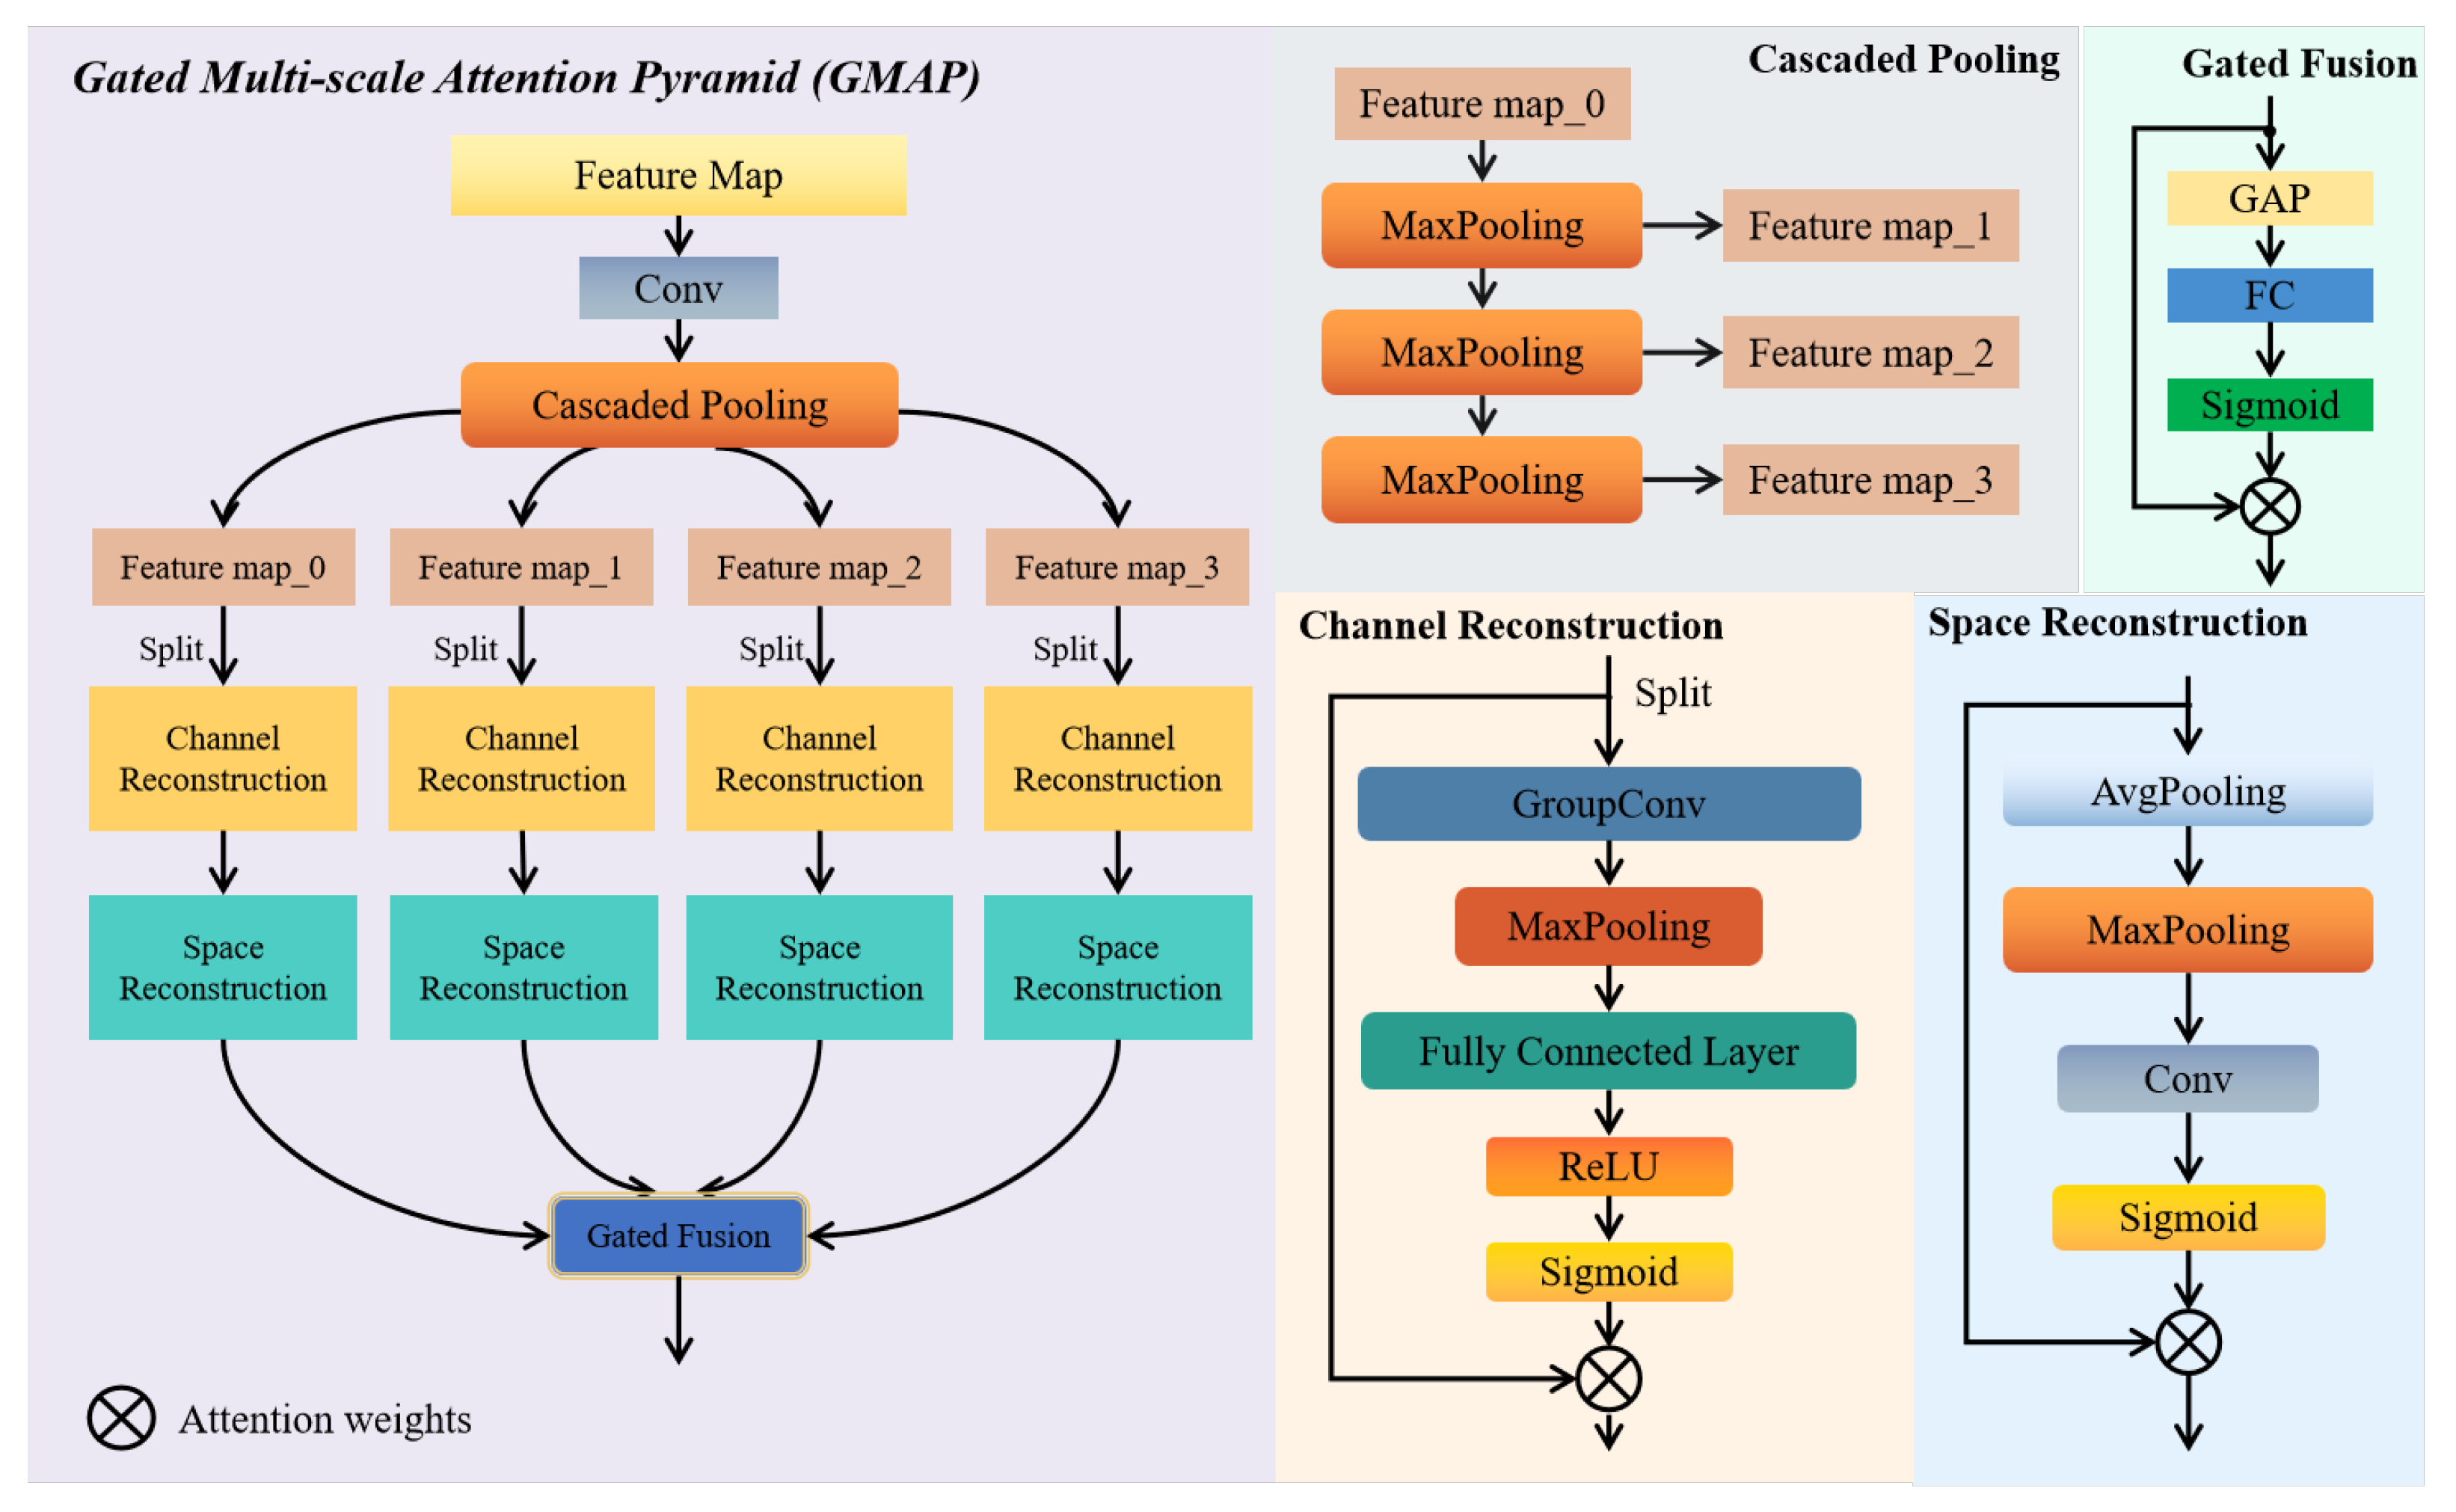
GMAP: The GMAP module integrates multi-scale feature extraction with a gating fusion mechanism. It extracts multi-scale representations through a cascaded pooling structure, utilizes a dual-channel reconstruction mechanism to finely suppress background noise interference, and adaptively modulates the fusion weights of different scale features using a gating fusion mechanism. This amplifies the prominence of target features and more effectively reduces the noise interference from complex backgrounds. As shown in
Table 4,
Table 5,
Table 6,
Table 7,
Table 8 and
Table 9, after adding the GMAP module to the baseline, the AP values for target detection in various categories improved significantly. On the DIOR [
14] dataset, the AP values for bridge (B), dam (D), expressway toll station (ETS), overpass (O), storage tank (ST), train station (TS), and vehicle (V) categories increased by 7.01%, 4%, 6.31%, 5.17%, 3.29%, 6.3%, and 7.17%, respectively. As shown in
Table 7,
Table 8 and
Table 9, after adding the GMAP module, the mAP values on the three datasets improved, with significant increases in APs and APm values. The APs value on the DIOR [
14] dataset increased by 4.7%, while on the RSOD [
20] and DOTA [
19] datasets, the APs increased by 0.8%, demonstrating the effective suppression of complex background influence and the improvement in detecting small targets.
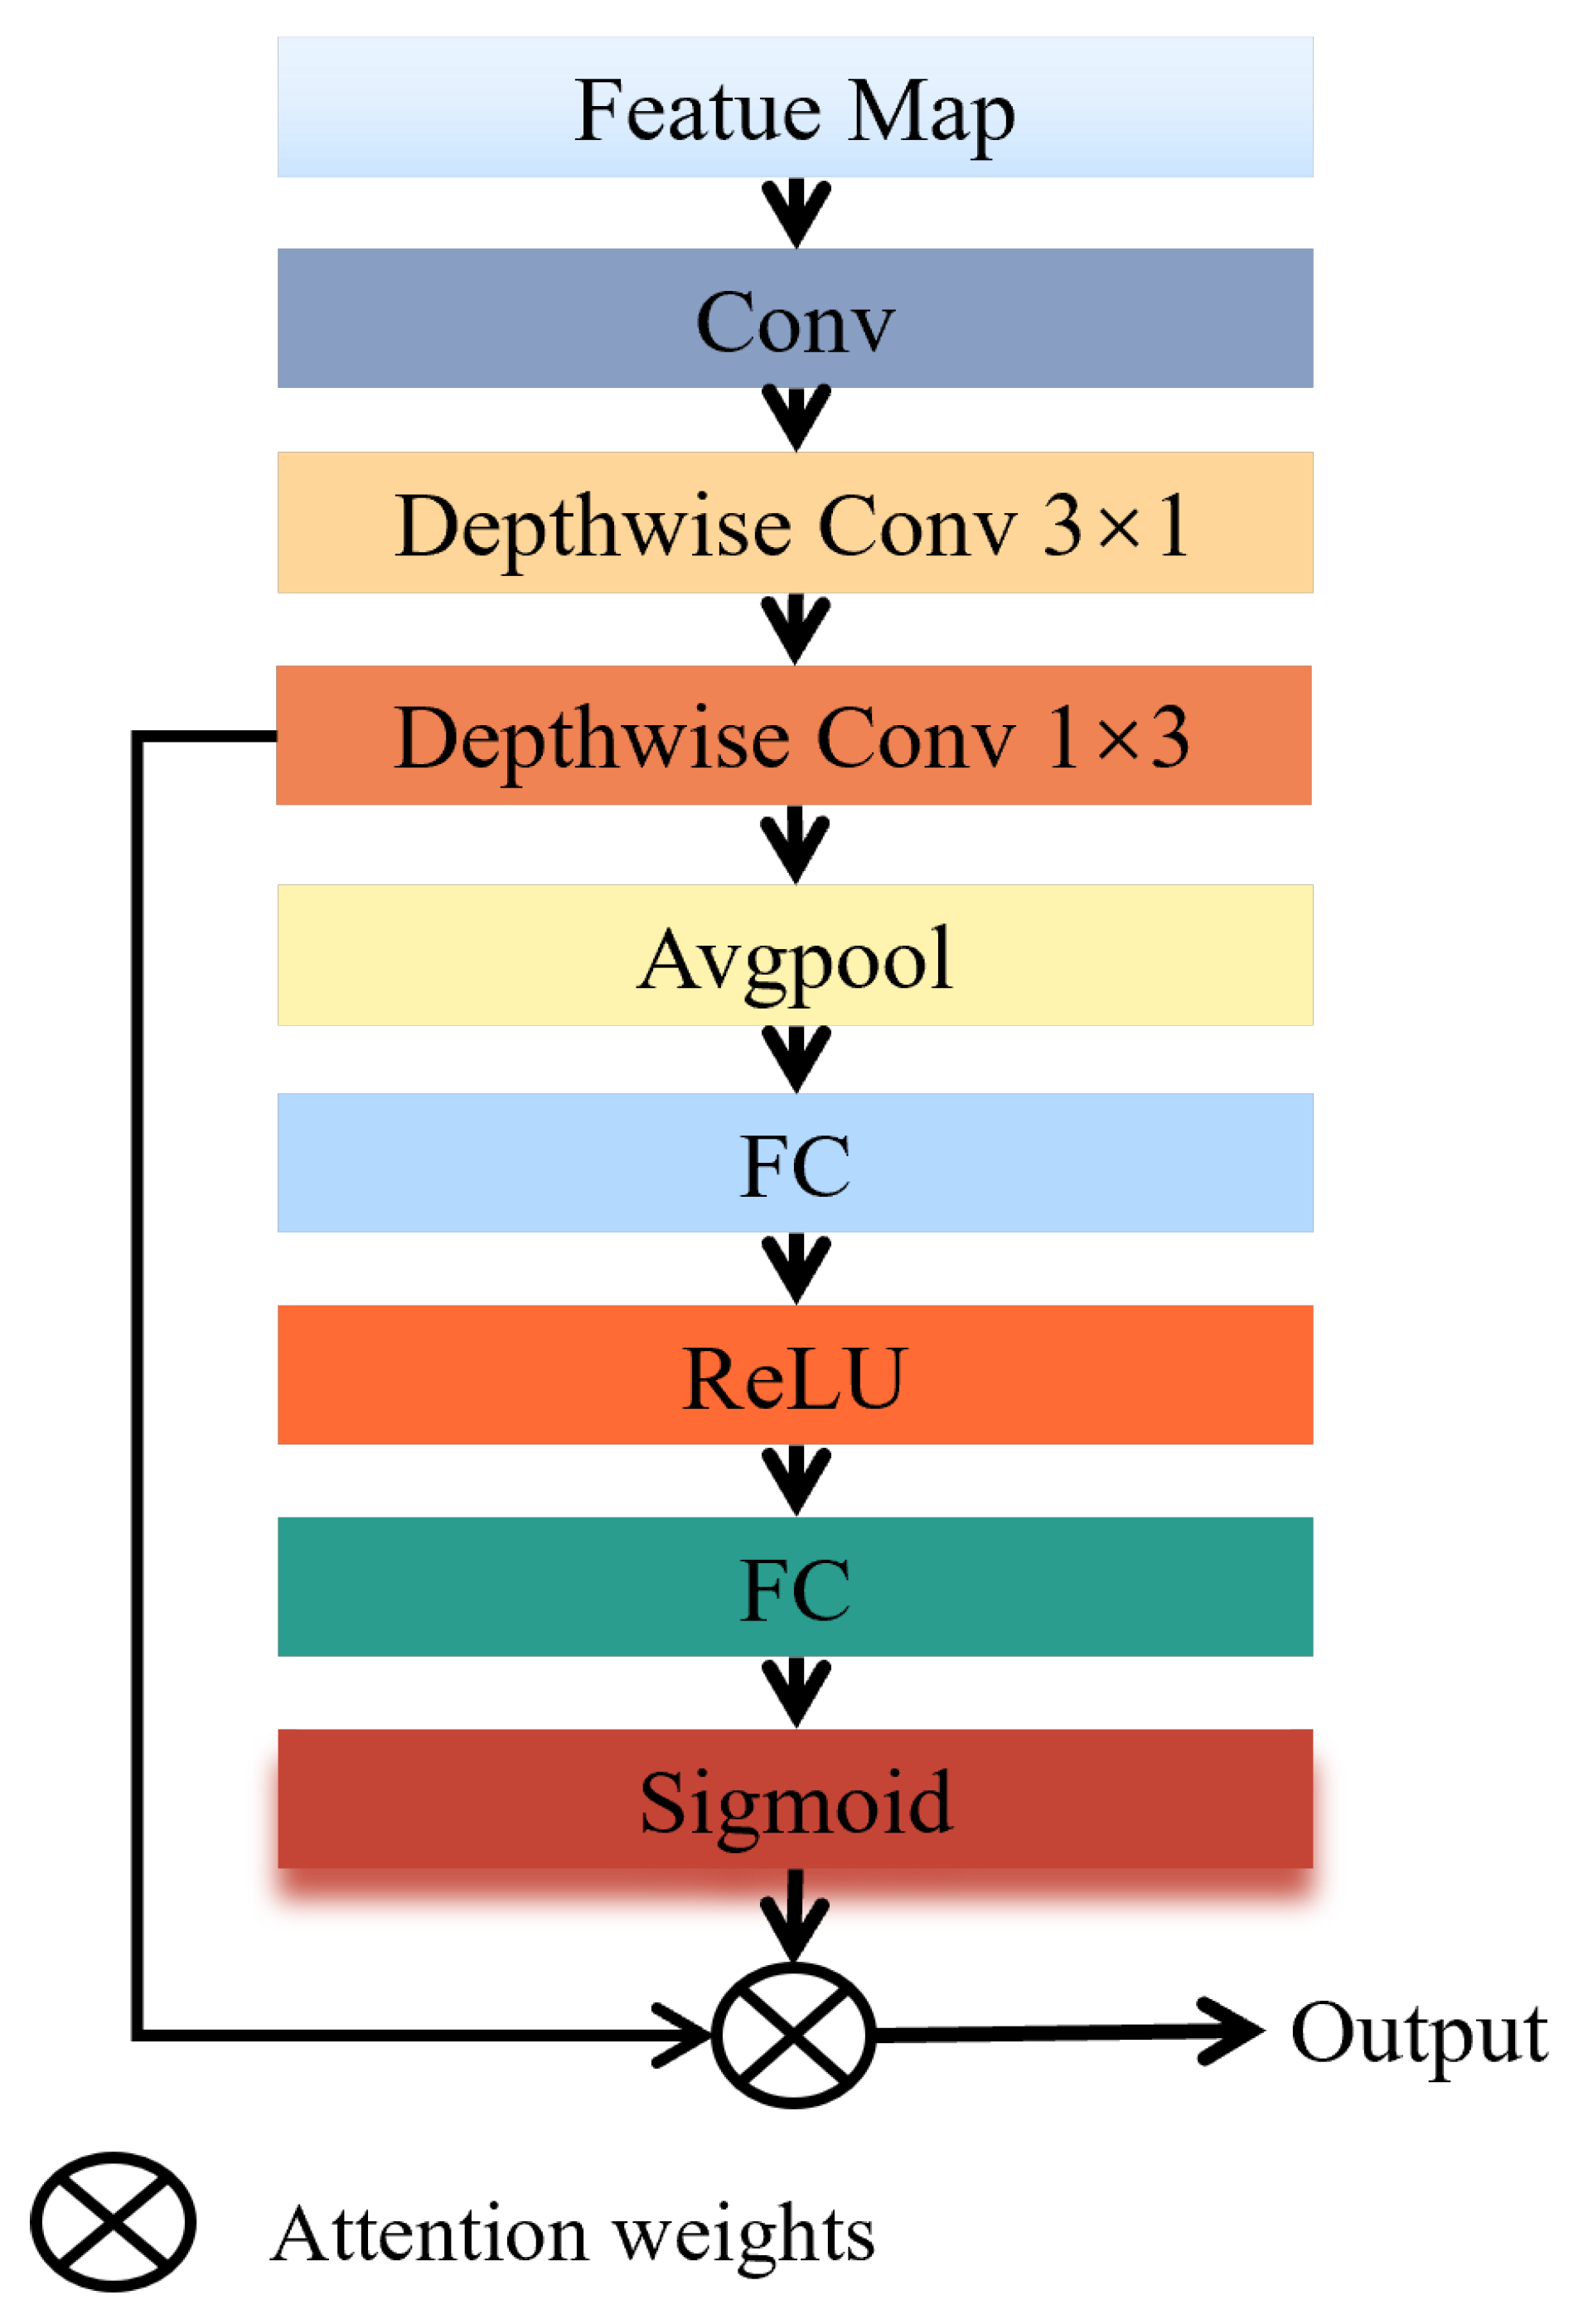
ADDown: Integrating asymmetric decompositional depthwise separable convolution downsampling with a dynamic channel attention mechanism for feature calibration effectively retains more key information and enhances the model’s robustness. As shown in
Table 7,
Table 8 and
Table 9, after adding the ADDown module to the baseline, the mAP values on the DIOR [
14], DOTA [
19], and RSOD [
20] datasets increased by 1.0%, 1.31%, and 0.8%, respectively. On the RSOD [
20] dataset, APm increased by 1.1%. On the DIOR [
14] dataset, APs increased by 4.9% and APm by 2.5%. On the DOTA [
19] dataset, APs improved by 0.9%, showcasing its prowess in detecting medium and small targets and highlighting the module’s ability to preserve crucial detail information.
YOLO-SBA: As shown in
Table 4,
Table 5,
Table 6,
Table 7,
Table 8 and
Table 9, after integrating the three modules into the baseline, the YOLO-SBA achieved significant improvements in mAP. On the DIOR [
14], DOTA [
19], and RSOD [
20] datasets, the mAP values increased by 3.9%, 4.14%, and 6.1%, respectively, compared to the baseline. The single-category detection AP values for targets increased by 0.19–29.94%. This indicates that the synergistic utilization of the three modules can lead to improved performance, thereby validating the effectiveness of the algorithm introduced in this study.
To analyze the single module and the interaction between modules in more detail, this paper conducted ablation experiments on the RSOD [
20] dataset for the three module combinations: MBAFF+GMAP, MBAFF+ADDown, and GMAP+ADDown, as shown in
Table 10.
MBAFF+GMAP. Combining
Table 6 and
Table 10, the key roles of each module become clearer. After combining the baseline with MBAFF+GMAP, the accuracy is significantly improved, but compared to using only MBAFF or GMAP, the accuracy on aircraft and oil tank decreases, and the mAP also decreases. This is because after densely inserting MBAFF in the backbone, the model’s perception of multi-scale information in the input image is enhanced, and then it is input into GMAP for redundant background information suppression. However, during the network transmission process, such as in the downsampling stage, there is no guidance for key information. Ordinary downsampling operations may weaken the transmission of target information. The perceived detail information is weakened after the original downsampling operation and is directly input into GMAP for redundancy suppression. It is easy to mistake the detail target information in the multi-scale information as noise, leading to a decrease in mAP compared to using only MBAFF.
MBAFF+ADDown. After combining the baseline with MBAFF+ADDown, the network performance is improved, but it is not as good as the result of using only MBAFF. The reason is that after densely inserting MBAFF into the backbone, the network’s perception of multi-scale information is enhanced, and with the effective information transmission of ADDown, the model learns a lot of image information, including redundant background information. Since there is no processing of redundant background information at the end of the backbone, the unfiltered complex information interferes with the detection effect. At this point, effective downsampling information transmission is not conducive to the model’s judgment of targets, so the performance is worse than using only MBAFF.
GMAP+ADDown. After combining the baseline with GMAP+ADDown, the model performance is significantly improved compared to using only GMAP or ADDown. This is because after adding GMAP+ADDown, the model’s perception capability remains unchanged, capturing the same amount of image information. However, through GMAP+ADDown, the model’s information transmission and filtering capabilities are both enhanced, so the model performance is improved after adding GMAP+ADDown.
As shown in
Table 11, we evaluated the parameter quantity, computational complexity, and inference time of the modules and algorithms proposed in this paper. The results show that compared to the baseline, the proposed YOLO-SBA does not significantly increase the model complexity and computational load. Although the inference speed is slightly slower, the detection performance is significantly improved. Moreover, the inference speed remains in the milliseconds range, meeting the requirements for real-time detection. greenThis indicates that in practical application scenarios, such as autonomous driving, security surveillance, and human-computer interaction, YOLO-SBA can quickly respond and provide accurate detection results, ensuring the efficient operation and timely decision-making of the system.
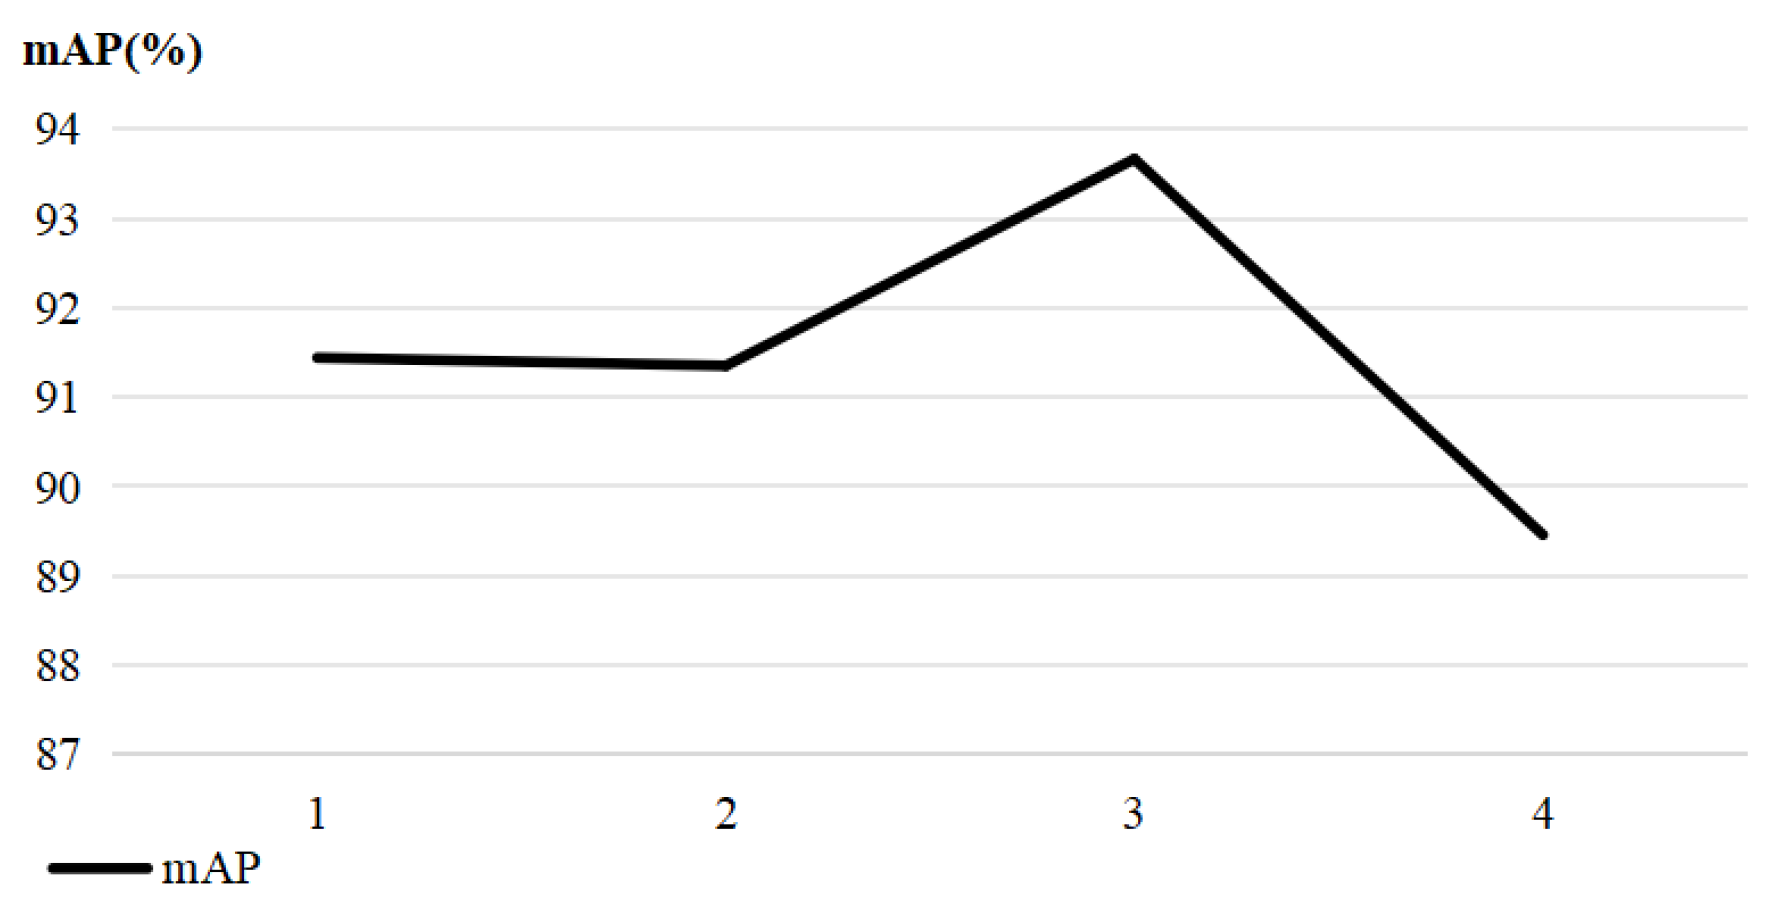
To illustrate the basis for the value of the expansion rate
d in the MBAFF module proposed in this paper, as shown in
Figure 9, we conducted ablation experiments on the RSOD [
20] dataset. We chose different expansion rates for the MBAFF module to determine the best option. The experimental results clearly show that when the expansion rate
, the model achieves the best performance. Therefore, the expansion rate used in this paper is 4.


 ,
, 